Embed Size (px)
Citation preview
BACHELOR THESIS Spring 2013
Business Administration
Green food development in China -focus on the east
Authors
Shuang Wang
Linjing Xiang
Fei Xing
Scientific supervisor
Christer Nilsson
Language supervisor
Pernilla Carlsson
Examiner
Christer Nilsson

Executive Summary
The purpose of the dissertation is to research
how to promote green food consumption in
eastern China.
The research draws attention to certain main
factors affecting green food consumption
which are income and education levels and
ages. According to the questionnaire and
data analysis, we find income levels and
price of green food do not have great
influence on green food consumption, while
ages and education levels have.
Based on the results, there are perspectives
to promote green food consumption. For
consumers, the direct way is to increase their
awareness of environmental protection and
food health. For producers, they should
ensure quality of food with diversity. For
governments, it is important to strengthen
supervision of producers and support
consumers’ buying behavior.
It is recommended:
1) That consumers could get information
from TV programs, radios and so on.
Advertising aims at attracting target
consumers.
2) That public organizations should
cooperate with producers in holding some
public benefit activities.
3) That governments monitor producers to
explain the production process.
Terms of reference
statement of
problem/topic
Key findings
summarized
Problem solution
summarized
Recommendations
summarized

Abstract
Purpose/aim The aim of our dissertation is to increase consumers’ buying awareness of green
food and promote green food consumption in eastern China.
Approach We collect data through a questionnaire and present hypotheses through reading
related scientific articles. The data analysis includes description of samples and statistical tests
in the form of cross tabulations, chi squares and frequency tables.
Findings The questionnaire researches consumers’ income and education levels, ages and
price of green food, etc. We find ages and education levels have a significant influence on
frequency of buying green food, while income levels and price have no strong influence.
Originality/value An original idea is to research the current green food market, and based on
it to increase the consumers’ buying awareness and promote green food consumption. Further,
the empirical data is collected from different cities in the east where there is a higher demand
of green food. The study has value for the debate concerning the group of people who are
older and have lower education levels as our great target consumers. The result of income
levels and price means consumers are more lay attention to green food quality.
Key words: Consumers’ income and education levels, ages, green food consumption,
promotion.

Acknowledgment
Kristianstad, June 2013
With this dissertation we complete our studies at Kristianstad University. We are very grateful
to Christer Nilsson for guiding us and giving us feedback during the whole process. Thanks
Pernilla Carlsson for helping us with English language and Pierre Carbonnier for helping us
with SPSS. Thanks “Alex” Jian Wang for help and support.
Finally, thanks our team members for helping and discussing with each other. Thank you. Wang Shuang (Belinda) Xiang Linjing (Layna) Xing Fei (Fred)
Table of Contents Ch. 01 Introduction…………………………………………………………………………...1 1.1 Problem……………………………………………………………………………….1 1.2 Purpose……………………………………………………………………………......2 1.3 Limitation……………………………………………………………………………..2 1.4 Outline……………………………………………………………………………...…2 Ch. 02 Background…………………………………………………………………………....3 Ch. 03 Literature Review…………………………………………………………………….4 3.1 Agriculture in China………………………………....………………………………..4 3.2 Green food…………………………………………………………………………….5 3.3 Factors which affect green food consumption………………………………………..5
3.3.1 Introduction………………...……………………………………………5 3.3.2 Income levels……………...……………………………………………..6 3.3.3 Education levels…….......……………………………………………….6
3.4 Promotion……………………....…………………………………………………..…6 Ch. 04 Empirics…………………………………………………………………………….…8 4.1 Empiric methods……....……………………………………………………………...8
4.1.1 Research design…….......…………………………………....……….……8 4.1.2 Research strategy………….......………………………………………...8
4.2 Data collection………………………………………………………………………..8 4.3 Empiric findings……………………………………………………………………9 4.4 Hypothesis…………………………………………………………………………10
4.4.1 Hypothesis 1……………………………………………………………...10 4.4.2 Hypothesis 2…………………………………………………………….12 4.4.3 Hypothesis 3…………………………………………………………….14
Ch. 05 Results………………………………………………………………………………..16 5.1 Results of hypothesis………………………………………………………………..16 5.2 Results of other questions…………………………………………………………...19 Ch. 06 Analysis……………………………………………………………………………....22 6.1 Introduction………………………………………………………………………….22 6.2 Analysis of results………………………………………………………………...22 Ch. 07 Discussion…………………………………………………………………………….25 Ch. 08 Conclusion…………………………………………………………………………...27 8.1 Reliability....................................................................................................................27 8.2 Validity........................................................................................................................28 8.3 Future study.................................................................................................................28
References……………………………………………………………………………………29 Appendices…………………………………………………………………………………...31 Appendix 1: Questionnaire in English……………………………………………………..31 Appendix 2: Questionnaire in Chinese……………………………………………………..34

List of Tables Table 4.1 Chi square (Income levels and frequency)…………………………………………10
Table 4.2 Chi square (Education levels and frequency)………………………………………12
Table 4.3 Chi square (Ages and frequency)…………………………………………………..14
Table 5.1 Cross tabulation (Income levels and frequency)……………………………….......16
Table 5.2 Cross tabulation (Education levels and frequency)………………………………...17
Table 5.3 Cross tabulation (Ages and frequency)…………………………………………….18
Table 5.4 Question 6………………………………………………………………………….19
Table 5.5 Question 8………………………………………………………………………….19
Table 5.6 Question 11………………………………………………………………………....20
Table 5.7 Question 12………………………………………………………………………...20
Table 5.8 Question 15………………………………………………………………………...21
Table 5.9 Question 17………………………………………………………………………...21
Table 6.1 Question 10………………………………………………………………………...22
Table 6.2 Mean value (Income levels and frequency)……………………………………......23
Table 6.3 Mean value (Education levels and frequency)……………………………………..23
Table 6.4 Mean value (Ages and frequency)…………………………………………………24

1
Ch. 01 Introduction _________________________________________________________________________________________________________________
In this chapter, we present Chinese food problems and the objectives of green food, compare
Chinese eastern and western areas, as well describe purpose, limitation and outline of this
dissertation. _________________________________________________________________________________________________________________
China is a large agricultural country and with the modern processing, the demand for quality,
uniform farm products in high volumes generated retailing and may transform agricultural
production in China (Gale, et al., 2002). There is a large change on food consumption in the
Chinese economy. Before consumers bought basic food but today they are more concerned
with food safety (Wang, et al., 2007). The innovation of green food is remarkable for food
production and marketing (Paull, 2008b). According to China Green Food Development
Centre (CGFDC) (2010), green food is a “fundamental concept and objectives are to enhance
food quality and safety, to promote consumer's health, and to protect agricultural bio-
environment for sustainable development”. Nevertheless, increasing green food consumption
is not an easy task since it also depends on consumers’ buying behavior.
Although green food exists in China, the concept it is new to the Chinese (Rezai, et al., 2011).
It is often argued that an increasingly number of Chinese are interested in green food
nowadays. Consumers may have consumption intention to buy green food but do not do it.
The reason is they cannot ensure if the food is safe (Zhu, et al., 2012). Under this condition,
the government plays a key role to encourage and support consumers to purchase green food.
Actually, there is a specific department called China Green Food Association which is
supported by the Chinese government to manage, investigate, educate, produce, stock and
deliver, retail, supervise and consult green food production process.
We divide China into two parts, the east and the west. The east is richer than the west, like
Beijing, Shanghai, Jiangsu, etc. Because the west is a vast territory with a scarce population
and it is currently in the stage of satisfying the basic needs, most consumers are not able to
consume green food.
1.1 Problem
Our problem is how to promote green food consumption in the east. We will argue that there
are certain main factors of consumers’ buying behavior, like income and education levels and
ages which affect green food consumption.

2
1.2 Purpose
The purpose is to investigate the consumers’ awareness of green food based on their income
and education levels and ages. On the basis of that, we will design unique methods and
solutions on how to promote green food consumption in the east.
1.3 Limitation
Our limitation is although we have reviewed some research in the field of green food
consumption, there are still some professional methods to research deeply in this field.
Another limitation is we just investigate consumers rather than producers. Further, the study is
limited to the factors of consumers’ buying behavior of green food.
1.4 Outline
There are eight chapters in this dissertation. Chapter 1 is the introduction of presenting
reasons why we choose this topic, problem, purpose and limitations. Chapter 2 is the
background of green food development and the consumption situation in the east. Chapter 3
includes relevant information from scientific papers about our topic and come up with related
hypotheses in the third chapter. Chapter 4 we transform the collected information to data
analysis through the questionnaire and prove the hypotheses with chi square tests. Chapter 5
is the results of questionnaire presented and different kinds of tables. Chapter 6 we describe
the questions from our questionnaire. Chapter 7 is to give solutions to discuss and solve green
food promotion. Chapter 8 we present the framework of the whole dissertation and give
suggestions for future studies.
3
Ch. 02 Background _________________________________________________________________________________________________________________
In this chapter, we deal with Chinese food categories, green food history and consumption in
the east. _________________________________________________________________________________________________________________
Nowadays, consumers have ability to choose various price levels of food, while they cannot
be sure to know if it is safe (Bai, et al., 2007). Food safety now is the fundamental problem
and consumers’ requirements make them consider different categories of food. According to
Paull (2008b), there are three food categories in China that carry certification. Commonly,
green food and hazard-free food are Chinese standards; organic food is an international
standard (Paull, 2008b). Owing to consumers prefer to purchase higher quality of food while
organic food is very limited with expensive prices, therefore, there is a potential market for
green food at the current stage. Green food can date from 1990. In that year, China’s Ministry
of Agriculture (MOA) created the green food program which is described as “one of the most
successful eco-labeling programs in the world” (Paull, 2008a, p.48). The CGFDC which is
supported by MOA, develops and maintains the standard, and is responsible for certifications,
coordinates and inspections (Paull, 2008b).
In eastern China, there is strong income growth, rapid urbanization and urban crowding which
are diversifying Chinese diet and creating demands for high-value and specialty food products
(Gale et al., 2002). It is argued here that consumers in the east are willing to buy green food
and even greater price fluctuations are reported for green food than normal food, because they
think it is safer (Paull, 2008b).
In our opinion, consumers are not enough awareness of buying green food. The best and the
most direct method to promote green food consumption is to increase consumers’ weak
awareness. We adopt a questionnaire with statistics to analyze data and to make suggestions
on how to improve green food consumption.

4
Ch. 03 Literature Review _________________________________________________________________________________________________________________
In this chapter we will situate our argument in the literature on relevant topics for the purpose
of this dissertation and finally we put forward hypotheses. The literature review deals with
Chinese agriculture, definition of green food, factors affecting green food consumption and
promotion. _________________________________________________________________________________________________________________
After presenting the problem of our dissertation, we introduce the background of the topic,
extend this information following from related scientific articles.
3.1 Agriculture in China
Since 1995 China has passed the period of food shortages and come to a new era of keeping
self-sufficient. More and more people are not worried about lack of food (Bian, 2013). In
2008, Chinese agriculture occupied about 122 million hectares. Organic food, green food and
hazard-free food totally account for 28%, constituting 3%, 8% and 17%, respectively. The
other food is 72% collectively. Out of the 34.18 million hectares of eco-food production,
organic food accounts for 9.1%, green food 29.3% and hazard-free food represents 61.6%.
(Paull, 2008b).
At the same time, Chinese farms reflect China’s food safety issues. China has one of the
world’s highest rates of chemical fertilizer users. Farmers rely on overuse which causes food
safety problems (Calvin, et al., 2006). Some would argue that food safety and environmental
issues are related to food growing, process and production. Thus, green food consumption can
be helpful not only to environmental protection but also to benefit consumers’ health.
Organic food
Green food
Hazard-freefood
Organic food
Green food
Hazard-freefood
other food
Figure 2: Three styles of China eco-labeling food, by hectares (Data source: Paull, 2008b).
Figure 1: Distribution of Organic, Green, Hazard-Free food relative to the total (122m ha) supply of cultivated land in China. (Roundedto nearest whole number %); (Data sources: Paull, 2008b).
5
3.2 Green food
As Wu, et al. (2011, p. 520) argue the definition of green food is “it is the kind of food
nurtured under conditions without pollution, with organic fertilizer, and excluding poisonous
pesticides with high residues”. There are different kinds of green food, for example,
vegetables, meats, fruits and so on.
According to Paull (2008b), green food appears to be more popular and easily accepted by
Chinese consumers through good market spread, clear labels and better distribution. The data
show green food growth from 1997 to 2007 has been substantial: green food hectares
expanded from 2.14 million hectares to 10 million hectares, green food output grew from 6.3
to 72 million tons and the numbers of green food enterprises have risen from 544 to 5315.
“There are two grades of green food: grade A (allowing use of certain amount of chemical
materials) and grade AA (all chemicals are prohibited to be used in the production process)”.
Therefore, Chinese green food AA is equivalent to organic food (Paull, 2008b; Ying, et al.,
2006).
According to Hu, (2011), the regulation of green food producing places is strict and monitored
by Chinese Agriculture Department. For instance, they should be far away from factories,
avoid residential areas, be in an ecological environment and have water resources.
Heilongjiang, Fujian and Jiangsu Provinces etc. are outstanding in producing green food (Hu,
2011).
3.3 Factors which affect green food consumption
3.3.1 Introduction
It is a complex process to research consumers’ buying behavior. This concept refers to “the
study of psychological, social and physical actions when people buy, use and dispose products,
services, ideas and practices” (Luu, et al., 2012, p. 29). Consumers’ buying behavior is also
based on backgrounds, such as their ages, education levels, incomes, knowledge, information
and exposure to advertisements, etc. All these factors influence consumers’ decisions more or
less and provide them with a positive attitude to choose green food (Rezai, et al., 2011). Our
dissertation mainly considers personal individual conditions: income levels, education levels
and ages.

6
3.3.2 Income levels
Consumers pay attention to higher food quality with increasing income, such as the growth of
the middle class in China (Zhu, et al., 2012). Our arguments build on the work of Gale, et al.
(2002) who claim that income growth is likely to boost food demand considerably in China.
According to Rezai, et al. (2011), because the price of green food is 10 to 50% higher than the
normal food, middle and high income consumers are likely to afford to buy it (Rezai, et al.,
2011). The argument in this dissertation draws on the differences between income levels and
frequency of buying green food in the east. The east has most of the developed provinces,
consumers’ income levels mostly is higher than in other parts of China.
H0: There will be no difference between frequencies of buying green food
and income levels.
H1: There will be differences between frequencies of buying green food and
income levels.
3.3.3 Education levels
Consumers with higher education are more likely tend to buy green food. This is due to the
fact that they are more aware of the advantages of the health aspects as well as the fact that
there is little or no use of chemicals. Simultaneously, it means there is not enough
environmental and green consumption education of the public in China (Zhu, et al., 2012;
Rezai, et al., 2011). The argument in this dissertation draws on the differences between
education levels and frequency of buying green food in the east.
H0: There will be no difference between frequencies of buying green food
and education levels.
H1: There will be differences between frequencies of buying green food and
education levels.
3.4 Promotion
In order to promote consumers’ buying green food intention, it is necessary to do promotion
activities. Others have argued high purchasing convenience tends to more likely bring green
food consumption (Zhu, et al., 2012). Certainly, a good green food selling channel is an
important reason for green food consumption. A previous study shows that 30% of consumers

7
cannot translate their green food consumption intention into real purchases due to purchasing
inconvenience (Young et al., 2010). Zhu, et al. (2012) argue that food producers need to seek
more convenient channels for consumers to buy green food. Meanwhile, governmental
agencies need to provide policy supports to facilitate the creation of such selling channels. We
also mainly study advertising which aims at attracting target consumers to either think about
or react to the product. As a method of achieving advertisement goals, the content plays a vital
role in the process of commercial communication (Kotler et al., 2005).
Besides the above hypotheses, an additional hypothesis is:
H0: There will be no difference between frequencies of buying green food
and ages.
H1: There will be differences between frequencies of buying green food and
ages.

8
Ch. 04 Empirics _________________________________________________________________________________________________________________
This part contains the dissertation’s empirical methods. It includes the statistic of our
hypotheses and provides related tables. _________________________________________________________________________________________________________________
We come up with hypotheses in previous chapter and collect information transform to data
through chi square tests.
4.1 Empiric methods
4.1.1 Research design
According to Saunders et al. (2009), most often, the research purpose use three research
methods, exploratory studies, descriptive studies and explanatory studies. Exploratory study
is a valuable means of understanding a problem, like searching for literature. Descriptive
study concentrates on representing an accurate profile of persons, events or situations. It is
necessary to have a clear frame on which you collect data. The emphasis of explanatory study
is on studying a condition of problem and explaining the relationships between variables
(Saunders et al., 2009).
In our dissertation, we focus on explanatory study. The objective of our data collection and
statistics test are to find relationships between different variables on consumers’ buying
behavior and green food consumption.
4.1.2 Research strategy
There are five different research strategies that can be used for a study. These are experiment,
survey, case study, action research and ethnography (Berkeley, 2004). For our dissertation, we
use a survey strategy with a self-completion questionnaire to consumers. We focus on the
relationship between variables and show relationships through statistical tests on quantitative
data. Two research methods are combined in this dissertation: quantitative and qualitative. But
we mainly use quantitative since the qualitative is used to explain and support our analysis.
4.2 Data collection
According to Saunders et al. (2009), there are two different types of data, primary data and
secondary data. Primary data is conducted and collected specifically for the research project.
Secondary data is used for a research project based on originally collected from other ways

9
(Saunders, et al., 2009). Both two types of data we use in this dissertation.
The primary data we collect through the questionnaire. We designed a questionnaire to pretest
on six consumers with different backgrounds in terms of ages, education levels and family
income levels. Those respondents reviewed our questionnaire to provide comments whether
each question is easily understood and what are plus or minus. Based on their comments, we
did minor modifications, e.g. respondents were confused about the income if it is individual
or family. We developed open and closed questions, such as, multi-choices, five-point scale
measurement (1 is never, 5 is always) and one open question.
The secondary data we collected from several Chinese official websites to learn more about
government departments’ measures of green food. Certainly, we read articles which are
related to the topic of consumers’ buying behavior, food promotion etc. What is more, we also
use books to help us to write about empirics.
4.3 Empiric findings
Through the method of Argesti & Finlay (2009), we suppose 40% in eastern China buy green
food. We want to construct a 95% confidence interval with a margin of error that is equal to
10%.
Statistic test: Z n)1(
= M
1.962 *(0.6*0.4) = 0.12*n → n=92
When confidence interval equals to 95%, Z equals to 1.96. (Argesti & Finlay, 2009)
According to the calculation, the required sample size is 92.
We choose to send out our questionnaire through internet chat tools and some public websites
since we could not contact Chinese consumers directly. On one hand, some people who have
online shops help us give the questionnaire link to random customers. On the other hand,
some of them print questionnaire copies to ask people who they met randomly in street,
workplaces and communities, etc. We have collected 94 answers, among them there were 3
respondents who did not give clear answers about where they lived in China, but it did not
much affect our data analysis. All the answers reflect 8 provinces and 2 municipalities, such
as Beijing, Shanghai, Zhejiang and Jiangsu, etc. Among 94 respondents, 53 are female and 41

10
are male with different income and education levels and ages.
4.4 Hypothesis
Based on the literature review we come up with three hypotheses and use the chi square tests
to investigate all three hypotheses. We set significance level at 5%, if the statistics we
calculate is below it, that we can conclude there will be differences between variables.
4.4.1 Hypothesis 1
Table 4.1 summarizes the frequency of buying green food with income levels. It also shows in
italics the number of subjects who might be expected to have scored in each of the BDI
categories when H0 is true.
Table 4.1. In 2013 the amount of consumers buying green food at different income
levels.
Frequency of buying Green food
A B C D E ∑
1 0 6 10 8 1 25
2 0 5 12 10 1 28
3 0 4 4 7 0 15
4 0 3 5 18 0 26
Income
levels
∑ 0 18 31 43 2 94
Codes: 1= ≤ 4000 RMB, 2= 4001-7000 RMB, 3= 7001-9999 RMB, 4=≥ 10000 RMB A=Never, B= Occasionally, C=Half, D= Frequently, E=Always
Because a few expected values are less than 5, we get an adjusted table list below. Frequency of buying Green food
A + B + C D + E ∑
1 16 13.03 9 11.97 25
2 17 14.60 11 13.40 28
3+4 16 21.37 25 19.63 41
Income
levels
∑ 49 45 94
i. Null hypothesis.
H0: There will be no difference between frequencies of buying green food
and income levels.
H1: There will be differences between frequencies of buying green food and
income levels.

11
ii. Statistic test.
∑ (fo-fe)2
χ2 = ————
fe
iii. Significance level. 5%
iv. Sampling distribution.
∑ (fo-fe) 2 (16-13.03)2 (25-19.63)2
χ2 = ———— = ————+…+ ————— = 0.676 +...+1.47 = 5.059
fe 13.03 19.63
df=(2-1)*(3-1)=2
v. Rejection region.
5% Rejection region
5.059 5.99 χ2
(Data source: Argesti & Finlay, 2009)
5.059 < 5.99→ P-value 〉5% → Accept H0
vi. Decision.
When significance level is 5%, we cannot prove there will be differences
between frequency of buying green food and income levels.

12
4.4.2 Hypothesis 2
Table 4.2 summarizes the frequency of buying green food with education levels. It also shows
in italics the number of subjects who might be expected to have scored in each of the BDI
categories when H0 is true.
Table 4.2. In 2013 the amount of consumers buying green food at different education
levels.
Frequency of buying Green food
A B C D E ∑
1 0 7 4 2 0 13
2 0 2 5 2 1 10
3 0 7 23 38 1 69
4 0 0 0 2 0 2
Education
levels
∑ 0 16 32 44 2 94
Codes: 1= ≤ Middle school 2= High school 3= College / University 4= ≥ Master A=Never, B= Occasionally, C=Half, D= Frequently, E=Always
Because a few expected values are less than 5, we get an adjusted table list below.
Frequency of buying Green food
A + B + C D+ E ∑
1+2 18 11.74 5 11.26 23
3+4 30 36.26 41 34.74 71
Education
levels
∑ 48 46 94
i. Null hypothesis.
H0: There will be no difference between frequencies of buying green food
and education levels.
H1: There will be differences between frequencies of buying green food and
education levels.
ii. Statistic test.
∑ (fo-fe) 2
χ2 = ————
fe
ii. Significance level. 5%

13
iii. Sampling distribution.
∑ (fo-fe) 2 (18-11.74)2 (41 -34.74)2 χ2 = ———— = ———— +…+ ———— = 3.34 + ...+1.128= 9.029
fe 11.74 34.74
df =(2-1)*(2-1)=1
iv. Rejection region.
5%
Rejection region
3.84 9.03 χ2
(Data source: Argesti & Finlay, 2009)
3.84 < 9.03 → P-value <5% → Reject H0
v. Decision.
When significance level is 5%, there will be differences between frequencies
of buying green food and education levels.

14
4.4.3 Hypothesis 3
Table 4.3 summarizes the frequency of buying green food with ages. It also shows in italics
the number of subjects who might be expected to have scored in each of the BDI categories
when H0 is true. Table 4.3. In 2013 the amount of consumers buying green food at different ages.
Frequency of buying Green food
A B C D E ∑
1 0 2 11 23 0 36
2 0 5 12 15 1 33
3 0 5 5 5 1 16
4 0 5 3 1 0 9
Ages
∑ 0 17 31 44 2 94
Codes: 1= ≤ 24 2= 25-40 3= 41-60 4= ≥ 61 A=Never, B= Occasionally, C=Half, D= Frequently, E=Always
Because a few expected values are less than 5, we get an adjusted table below.
Frequency of buying Green food
A+B+C D+E ∑
1+2 30 35.23 39 33.77 69
3+4 18 12.77 7 12.23 25 Ages
∑ 48 46 94
i. Null hypothesis.
H0: There will be no difference between frequencies of buying green food
and ages.
H1: There will be differences between frequencies of buying green food and
ages.
ii. Statistic test.
∑ (fo-fe)2
χ2 = ————
fe

15
iii. Significance level. 5%
iv. Sampling distribution.
∑ (fo-fe)2 (30-35.23)2 (7 -12.23)2
χ2 = ———— = ———— +…+ ———— = 0.776+…+2.237=5.965 fe 35.23 12.23
df=(2-1)*(2-1)=1
v. Rejection region.
5%
Rejection region
3.84 5.965 χ2
(Data source: Argesti & Finlay, 2009)
3.84 < 5.965 → P-value <5% → Reject H0
vi. Decision.
When significance level is 5%, there will be differences between frequencies
of buying green food and ages.

16
Ch. 05 Results _________________________________________________________________________________________________________________
In this chapter we depict the results of the questionnaire with statistical tests, cross
tabulations and frequency tables. _________________________________________________________________________________________________________________
According to answers of questionnaire collected, we use SPSS make different tables to
display results.
5.1 Results of hypothesis
Table 5.1. Percentages on family income levels and frequency of buying green food. Frequency
Occasionally Half Frequently Always Total
Count 6 10 8 1 25 less than
4000 RMB % within
income level 24,0% 40,0% 32,0% 4,0% 100,0%
Count 5 12 10 1 28 4001-7000
RMB % within
income level 17,9% 42,8% 35,7% 3,6% 100,0%
Count 4 4 7 0 15 7001-9999
RMB % within
income level 26,7% 26,7% 46,6% 0,0% 100,0%
Count 3 5 18 0 26
Income levels
(per month)
more than
10000
RMB
% within
income level 11,6% 19,2% 69,2% 0,0% 100,0%
Count 18 31 43 2 94
Total % within
income level 19,1% 33,0% 45,8% 2,1% 100,0%
We analyze statistics on income levels and the frequency of buying green food through cross
tabulation. Table 5.1 shows different degrees of buying green food with different income
levels. We divide the two sections about frequency of buying green food into levels. One is
negative and the other is positive. Negative includes three levels, never, occasionally and half,
positive includes frequently and always.
Table 5.1 shows the 25 out of 94 respondents whose family incomes are less than 4000 RMB
where 64 percent are negative and 36 percent are positive. 28 out of 94 respondents’ family
incomes are between 4001-7000 RMB, 60.7 percent is negative and 39.3 percent is positive.

17
In addition, 15 out of 94 respondents’ family incomes are between 7001-9999 RMB. At this
level, negative occupy 53.5 percent and positive is 46.6 percent. With the 26 out of 94
respondents’ whose family incomes are more than 10000 RMB, 30.8 percent are negative and
69.2 percent are positive, respectively.
Table5.2. Percentages on education levels and frequency of buying green food.
Frequency
Occasionally Half Frequently Always Total
Count 7 4 2 0 13 Middle school
lower % within
education level 53,8% 30,8% 15,4% 0,0% 100,0%
Count 2 5 2 1 10
High school % within
education level 20,0% 50,0% 20,0% 10,0% 100,0%
Count 7 23 38 1 69 Bachelor
degree % within
education level 10,1% 33,4% 55,1% 1,4% 100,0%
Count 0 0 2 0 2
Education
levels
Master higher % within
education level 0,0% 0,0% 100,0% 0,0% 100,0%
Count 16 32 44 2 94
Total % within
education level 17,0% 34,1% 46,8% 2,1% 100,0%
We analyze the statistics on education levels and the frequency of buying green food through
cross tabulation. Table 5.2 shows different degrees of buying green food with different
education levels. We also divide the two sections about frequency of buying green food with
these statistics. One is negative and the other is positive. Negative includes never,
occasionally and half, positive includes frequently and always.
Table 5.2 shows the 13 out of 94 respondents at the education levels lower than middle school
tested our questionnaire. 84.6 percent reflects negative and 15.4 percent are positive. The 10
out of 94 respondents who have high school education levels account for 70 percent negative
and 30 percent positive. In contrast, the 69 out of 94 respondents who have bachelor degrees
56.5 percent are positive. The 2 out of 94 respondents who have master degrees or higher both
reflect a positive attitude to buying green food.

18
Table 5.3. Percentages on ages and frequency of buying green food.
Frequency
Occasionally Half Frequently Always Total
Count 2 11 23 0 36
24 younger % within age 5,6% 30,6% 63,8% 0,0% 100,0%
Count 5 12 15 1 33
25-40 % within age 15,2% 36,4% 45,4% 3,0% 100,0%
Count 5 5 5 1 16
41-60 % within age 31,25% 31,25% 31,25% 6,25% 100,0%
Count 5 3 1 0 9
Ages
61 older % within age 55,6% 33,3% 11,1% 0,0% 100,0%
Count 17 31 44 2 94
Total % within age 18,1% 33,0% 46,8% 2,1% 100,0%
We analyze statistics on ages and the frequency of buying green food through cross tabulation.
Table 5.3 shows different degrees of buying green food with different ages. We still divide the
two sections about frequency of buying green food into levels. One is negative and the other
is positive. Negative includes three levels, never, occasionally and half, positive includes
frequently and always.
Table 5.3 shows respondents who are younger than 24 make up 36 out of 94. 63.8 percent of
the respondents are positive, 36.2 are negative. However, among the 33 out of 94 respondents
who are between 25-40 years old 51.6 percent have a negative attitude and 48.4 percent have
a positive. Among the 16 out of 94 respondents who are between 41-60 years old 62.5 percent
are negative, and 37.5 percent positive. Among the 9 out of 94 respondents are older than 61,
there are 88.9 percent respondents who are negative and 11.1 percent who are positive.

19
5.2 Results of other questions
Food quality
Table 5.4. Percentage of consumers considering food quality.
Frequency Percent Valid Percent Cumulative
Percent
Occasionally 8 8,5 8,5 8,5
Half 15 16,0 16,0 24,5
Frequently 28 29,8 29,8 54,3
Always 43 45,7 45,7 100,0
Valid
Total 94 100,0 100,0
Table 5.4 shows that 43 out of 94 respondents think they always consider food quality when
they buy food. 29.8 percent, 16 percent and 8.5 percent of respondents will frequently, half
and occasionally consider food quality when they buy food, respectively.
Knowledge of green food
Tables 5.5. Percentages of consumers knowing green food.
Frequency Percent Valid Percent Cumulative
Percent
Not at all 5 5,3 5,3 5,3
A little 31 33,0 33,0 38,3
Much 50 53,2 53,2 91,5
Quite much 6 6,4 6,4 97,9
Very much 2 2,1 2,1 100,0
Valid
Total 94 100,0 100,0
Table 5.5 shows a phenomenon happening in China that some consumers buy green food even
if they do not know what it is. We designed a question “How much do you know about green
food”, only 2 respondents answer they know green food very much and 6 respondents quite
much. Respondents who make up 53.2 percent know much and 33 percent know a little of
green food. There are also 5 out of 94 respondents who do not understand green food at all.

20
Where consumers prefer to buy green food
Table 5.6. Percentages of the places where consumers prefer to buy green food.
Frequency Percent Valid Percent Cumulative
Percent
Super market 51 54.3 54.3 54.3
Exclusive store 13 13.8 13.8 68.1
Farmers’ market 26 27.7 27.7 95.8
Online store 1 1.0 1.0 96.8
Others 3 3.2 3.2 100,0
Valid
Total 94 100,0 100,0
It is easy for us to understand which place needs to concentrate on promotion. Table 5.6
shows the majority of respondents are more likely to purchase green food in the supermarket,
the percent is 54.3. 26 out of 94 respondents choose to buy green food in farmers’ markets.
There are a few respondents who prefer to buy green food in exclusive stores and online
stores. The percent is 13.8 and 1.0, respectively. Moreover, three respondents suggest buying
green food from farm producers directly.
Whether convenient to buy green food for consumers
Table 5.7. Percentages of whether it is convenient to buy green food.
Frequency Percent Valid Percent Cumulative
Percent
Not at all 5 5,3 5,3 5,3
A little convenient 39 41,5 41,5 46,8
Convenient 38 40,4 40,4 87,2
Quite convenient 6 6,4 6,4 93,6
Very convenient 6 6,4 6,4 100,0
Valid
Total 94 100,0 100,0
Table 5.7 shows that 5 out of 94 respondents think it is not convenient for them to buy green
food at all when they answered question “Do you think it is convenient to buy green food for
consumers”. However, 6 of 94 respondents think it is very convenient for them to buy green
food. Most respondents consider it is a little convenient to buy green food.
21
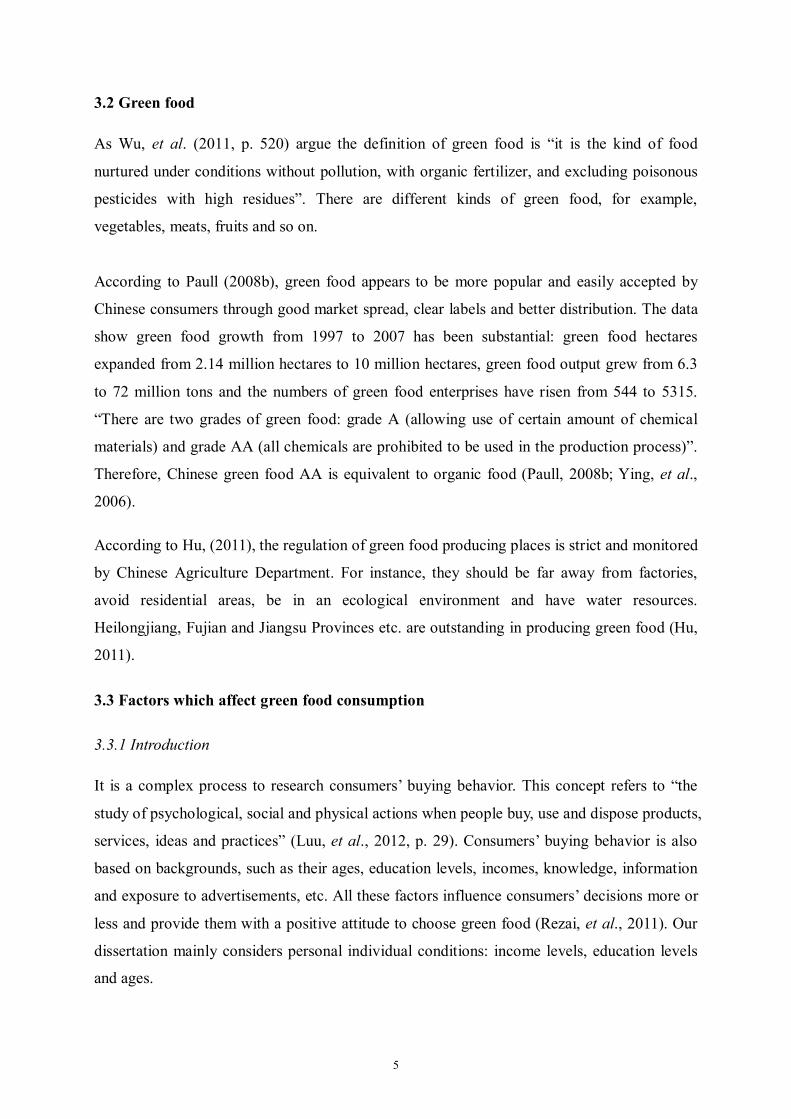
Whether consumers pay attention to promotion
Table 5.8. Percentages of whether consumers pay attention to green food promotion.
Frequency Percent Valid Percent Cumulative
Percent
Never 9 9,6 9,6 9,6
Occasionally 34 36,2 36,2 45,7
Half 45 47,9 47,9 93,6
Frequently 5 5,3 5,3 98,9
Always 1 1,1 1,1 100,0
Valid
Total 94 100,0 100,0
We want to know how much people care about green food promotion. Table 5.8 shows 45 out
of 94 respondents pay half attention to promotion of green food and only 1 out of 94
respondents always focus on it. The rest of them pay less attention to promotion of green food.
Current price of green food
Table 5.9. Percentages of consumers considering current prices of green food.
Frequency Percent Valid Percent Cumulative Percent
Low 4 4,3 4,3 4,3
Normal 45 47,9 47,9 52,1
High 42 44,7 44,7 96,8
Very high 3 3,2 3,2 100,0
Valid
Total 94 100,0 100,0
One important issue is the price of green food. Table 5.9 shows none of respondents think it is
very low in buying green food, 4 out of 94 respondents think it is not high compared with 3
out of 94 respondents who think it is very high. 45 out of 94 respondents believe they could
afford green food price but 42 respondents think the price is high.

22
Ch. 06 Analysis _________________________________________________________________________________________________________________
In this chapter, based on the empirical statistics, we combine three factors with other related
tables to get target consumers. _________________________________________________________________________________________________________________
We get primary results of hypotheses above, and then we describe and make deeper analysis
of other questions from the questionnaire.
6.1 Introduction
We collect a sample size that big enough for us to analyze the results of the questionnaire
statistically. The method of analysis is explanatory to emphasize and transform information to
data, test three factors and explain the relationship between green food consumption and the
relevant factors. We analyze hypotheses results with chi square tests in the empiric chapter
and mean values listed below to decide the promotion of green food consumption. We use
SPSS software to calculate mean values and the standard deviation of each factor. Different
mean values mean that the respondents regard the element as very important or not important.
The statistical significance is used to evaluate the difference of opinions between the green
food consumption and effective factors. We design a 1 to 5 scale to test the frequency of
buying green food, 1 is never, 2 is occasionally, 3 is half, 4 is frequently and 5 is always.
6.2 Analysis of results
Factors of green food price, quality and taste
Table 6.1. Question 10 in questionnaire. Never A little Much Quite much Very much Mean
Price of green
food 1(1.06%) 14(14.89%) 46(48.94%) 20(21.28%) 13(13.83%) 3.32
Quality of green
food 2(2.13%) 5(5.32%) 25(26.6%) 29(30.85%) 33(35.11%) 3.91
Taste of green
food 1(1.06%) 9(9.57%) 31(32.98%) 30(31.91%) 23(24.47%) 3.69
The question is “When you purchase green food, to what degree do you care about the factors
below”. The results of the table 6.1 reveal 13.83, 35.11 and 24.47 percent of the respondents
consider price, quality and taste of green food very much, respectively.

23
Mean value of income levels
Table 6.2. The mean values of family income levels and frequency of buying green food.
Family income levels Mean Std. Deviation Std. Error of Mean Less than 4000 RMB 3,24 ,831 ,166
4001-7000 RMB 3,25 ,799 ,151
7001-9999 RMB 3,29 ,825 ,221
More than 10000 RMB 3,52 ,753 ,145
Total 3,33 ,795 ,082
Hypothesis 1 has been tested in table 4.1.
We assume income levels have a relationship with the frequency of buying green food directly.
According to the result of the chi square test, there are no direct differences between family
income levels and frequency of buying green food. Actually, in our opinion, income plays a
significant role when consumers purchase green food. Table 6.2 shows the mean values of all
the family income levels are similar. All of mean values are between 3 (3= half) and 4
(4=frequently). From this, we can show various family income levels do not have strong
effects on the behavior of buying green food. It means family income levels do not affect
green food consumption directly. Combined with Table 6.1 and Table 5.9, respondents
consider price is not a key element and they can afford to buy at current price of green food.
Mean value of education levels
Table 6.3. The mean values of education levels and frequency of buying green food.
Education levels Mean Std. Deviation Std. Error of Mean
Middle school lower 2,62 ,768 ,213
High school 3,30 ,949 ,300
Bachelor degree 3,45 ,718 ,086
Master higher 4,00 ,000 ,000
Total 3,33 ,795 ,082
Hypothesis 2 has been tested in table 4.2 which is how education levels affect green food
consumption.
According to the result of the chi square test Table 6.3 shows the lower education levels the
less green food consumption. At master or higher level, the mean value is 4 (4=frequently), it
means they have a positive attitude to buying green food. In contrast, the lowest mean value
2.62 (2=occasionally, 3= half) is from middle school level respondents. So we focus on

24
promotion to consumers who have lower education.
Mean value of ages
Table 6.4. The mean value of ages and frequency of buying green food.
Ages Mean Std. Deviation Std. Error of Mean 24 younger 3,58 ,599 ,097
25-40 3,35 ,798 ,143
41-60 3,12 ,957 ,239
61 older 2,56 ,726 ,242
Total 3,33 ,795 ,082
Hypothesis 3 has been tested in table 4.3 which is how ages affect green food consumption.
According to the result of the chi square test Table 6.4 shows the older the respondents the
less likely to buy green food. All of the mean value of frequency of buying green food is less
than 4 (4=frequently) that means every age level has a negative attitude to buying green food.
Especially for respondents who are older than 61 the mean value is 2.56 (2=occasionally, 3=
half), which means the buying power of green food for elders is much lower. So we focus on
consumers who are older as our target.

25
Ch. 07 Discussion _________________________________________________________________________________________________________________
In this chapter, we present various solutions to the problem of this dissertation and connect
with the real situation in the east: government, producers and consumers. _________________________________________________________________________________________________________________
According to the results and analysis from previous chapters, we find education levels and
ages affect frequency of buying green food. Such results show elders and lower education
level respondents are not willing to buy green food. Because of Chinese history, the current
elders’ education levels are lower generally. The fundamental and direct reason we think is
most consumers do not have enough information about green food buying awareness. Based
on that, we suggest the government department need to consolidate their environmental
awareness. One of questions in our questionnaire is “Where you can get information about
green food”. 57.45 percent and 48.94 percent of the respondents get information from
newspapers or TV and friends or relations, respectively. We suggest China Green Food
Association could spread green food information to consumers’ workplaces and communities
through public service and green advertisements which support environmental protection and
healthier diets. In addition, public organizations could cooperate with producers to organize
some public benefit activities and lectures to involve elders as well present free green food
samples for them to try.
The results indicate income levels and price do not have big influence of frequency of buying
green food. Compared with that, consumers are more concerned with taste and quality. From
respondents’ answers to the open question, they hope green food development would more
concentrate on its quality because there are some fakes in the market. Zhu, et al. (2012)
claimed Chinese consumers are willing to pay 5–10% more for green food if the quality and
taste of green food are guaranteed. In order to enhance green food market sustainable, the
government is like an invisible hand to make the market stable. Our advice is Green Food
Association need to strengthen supervision of green food, e.g. this organization should
increase the frequency of checking product samples regularly. Meanwhile, they also need to
monitor producers to explain the production process clearly and transparently to the public.
In table 5.6, more than half of the respondents buy green food in the supermarkets. Only 13
out of 94 respondents buy in the exclusive stores. In our opinion, sellers should open more
original chain stores in bigger cities, it could form integrate management and selling, increase
consumers’ trust and confidence of green food. In order to sell green food more professionally,

26
producers could also train some professional sellers to ensure they understand green food very
well. Similarly, supermarkets are still the biggest place where consumers prefer to buy green
food. Producers can supply the products to supermarkets to ensure consumers demand.
Besides, they could as well develop new channels to contact consumers, like supply directly
to some schools, restaurants, hotels, hospitals, etc. From our questionnaire feedback, other
kinds of food like organic food affect green food consumption. Our advice is increase the
distinction of green food from other kinds of food. For example, producers can design some
special package to deepen consumers’ impression. Consumers more tend to buy green food if
they see its’ logo (Wei & Zeng, 2007). It is important to make the logo clearer.

27
Ch. 08 Conclusion _________________________________________________________________________________________________________________
In the final part, we will conclude our research. First, we summarize the dissertation and then
is the future research about development of green food consumption. _________________________________________________________________________________________________________________
China has become industrial country, but at the same time environmental pollution has
become very serious and lead to a lot of food safety problems. Therefore, Chinese people start
to focus on high quality food. The need to improve consumption of green food is a goal that
many Chinese food companies pursue. The main purpose of our dissertation is to investigate
the consumers’ buying behavior of green food. We chose three key factors which affect green
food consumption which are income and education levels and ages. At first we tried to
conduct an extensive literature review which primarily focused on the basic concepts about
Chinese green food to learn more about the subject. Then, we investigated consumers’ buying
behavior in eastern China and there is already a lot of research in this field. We chose to base
our dissertation on the models established by Zhu, et al. (2012), Gale, et al. (2002), Luu, et
al.( 2012), Rezai, et al. (2011) etc. these all illustrated the subject in different ways.
Through promotion we also want to let more and more people understand what real green
food is and improve the consumption of green food. Based on our findings, it is important for
elders and lower education level consumers to increase their knowledge about green food. We
find out government, producers and consumers, these three elements, are related together.
Sanders (2006) claim green food development has benefited from government encouragement,
advice and technical support. Government policies affect producers and consumers’ buying
behavior and they change the relationship between demands and supply (Sanders, 2006).
8.1 Reliability
In this dissertation, we use reliability and validity to measure our research method. Reliability
refers to different occasions or different researchers getting similar results with the research
method (Saunders et al., 2009). We try to avoid four threats to reliability which are subject or
participant error, subject or participant bias, observer error and observer bias. We create one
factor from different aspects in order to avoid observer bias. In addition, before we hand out
our questionnaire, we conduct a pretest which helps us to find mistakes for respondents.
Secondly, we design an open question to get respondents point of views of green food
accordingly.

28
8.2 Validity
The other measurement ‘validity’ deals with if the results actually exist and it explains
whether it intends to measure data collection method in practice (Saunders et al., 2009). There
are six threats to validity: history, testing, instrumentation, mortality, maturation and
ambiguity. In our research, we believe we have enough secondary data and relevant
information included. Further, the questionnaire we designed to suit for the purpose we aimed
at. However, due to the time and source restriction, we need to collect a large amount of
samples in the future. Because we study in Sweden, we could not be close to Chinese
consumers, producers and get the first material reflected by Chinese green food market.
8.3 Future study
For future study it is necessary to interview producers to get their views about green food
development and how government subsidies can be benefit them. Investigating of wider
perspective of competition from other kinds of food than what we describe briefly in this
dissertation. What is more, it is interesting to have an investigation about green food
development in western China.

29
References
Argesti, A. & Finlay, B. (2009), Statistical Methods for the Social Science, 4th Ed,
New Jersey: Pearson Prentice Hall.
Bai, L., Ma, C.L., Gong, S.L. & Yang, Y.S. (2007), “Food safety assurance systems
in China”, Food Control, Vol. 18, Iss. 5, pp. 480-484.
Berkeley, T.A. (2004), Research Skills for Management Studies, 1st Ed, London:
Routledge.
Bian, Y.M. (2013), “The challenges for food safety in China”, Online available at:
http://chinaperspectives.revues.org/819. Accessed at 13: 42, 11 April 2013.
Calvin, L., Gale, F., Hu, D.H. & Lohmar, B. (2006), “Food safety improvements
underway in China”, Amber Waves, Vol. 4, Iss. 5, pp. 16-21.
China Green Food Development Centre (2010), Online available at:
http://www.greenfood.org.cn/sites/GREENFOOD/. Accessed at 17: 34, 26
January 2013.
Gale, F., Tuan, F., Lohmar, B., Hsu, H.H. & Gilmour, B. (2002), “China's food and
agriculture: Issues for the 21st century”, Agriculture Information Bulletin, Iss.
775, pp. 68.
Hu, J. L. (2011), “The choice of green food raw material production bases”, Online
available at:
http://www.farmers.org.cn/Article/ShowArticle.asp?ArticleID=99259. Accessed
at 16:14, 15 May 2013.
Kotler, P., Wong, V., Saunders, J. & Armstrong, G. (2005), Principles of Marketing,
13th Ed, Harlow: Pearson.
Luu, T.T., Nguyen, T.T.P., Luu, T.B.N. & Luu, H.M. (2012), “Powdered milk
consumers’ buying behavior”, International Journal of Business and
Management, Vol. 8, Iss. 2, pp. 29-37.
Paull, J. (2008a), “Green food in China”, Online available at:
http://orgprints.org/14720/1/14720.pdf. Accessed at 19: 30, 11 April 2013.
Paull, J. (2008b), “The greening of China’s food - green food, organic food, and
eco-labeling”, Online available at: http://orgprints.org/13563/. Accessed at 19:
52, 11 April 2013.

30
Rezai, G., Teng, P.K., Mohamed, Z. & Shamsudin, M.N. (2011), “Consumers’
awareness and consumption intention towards green foods”, African Journal of
Business Management, Vol. 6, Iss. 12, pp. 4496-4503.
Sanders, R. (2006), “A market road to sustainable agriculture? Ecological agriculture,
green food and organic agriculture in China”, Development and Change, Vol. 37,
Iss.1, pp. 201-206.
Saunders, M., Lewis, P. & Thornhill, A. (2009), Research methods for business
students, 5th Ed, England: Prentice Hall.
Wang, Z.G., Mao, Y.N. & Gale, F. (2007), “Chinese consumers demand for food
safety attributes in milk products”, Food Policy, Vol. 33, Iss. 1, pp. 27-36.
Wei , X. & Zeng, Y.C. (2006), “Consumer’s attitudes and willingness-to-pay for green
food in Beijing”, Online available at: http://orgprints.org/18169/1/18169.pdf.
Accessed at 17:33, 29 May 2013.
Wu, L.H., Xu, L.L. & Gao, J. (2011), “The acceptability of certified traceable food
among Chinese consumers”, British Food Journal, Vol. 113, Iss. 4, pp. 519-534.
Ying, B., Xia, N., Tong, W.T., Hu, L.Q., Du, P., Lu, L.Y. & Yan, J.H. (2006), Chinese
Food Industry and Market Report, Lund: Lund University.
Young, W., Hwang, K., McDonald, S. & Oates, C. J. (2010), “Sustainable
consumption: green consumer behavior when purchasing products”, Sustainable
Development, Vol. 18, Iss.1, pp. 20-31.
Zhu, Q.H., Li, Y., Geng, Y. & Qi, Y. (2012), “Green food consumption intention,
behaviors and influencing factors among Chinese consumers”, Food Quality and
Preference, Vol. 28, Iss. 1, pp. 279-286.

31
Appendices
Appendix 1: Questionnaire in English Questionnaire of factors affect green food consumption in eastern area of China
Thank you very much for helping us accomplish the below survey! We are doing a survey
about how to promote green food consumption in eastern China to complete our
dissertation. Please answer the following questions individually. Choose the ranking
according to your perception of the truthfulness of the statements. The whole questionnaire
includes two sections. Your suggestions will be appreciated!
SectionⅠ
We need some basic information about you, circle the letter.
1. Gender: A. Male B. Female
2. Your age: A. ≤24 B. 25-40 C. 41-60 D. ≥61
3. Your education level: A. Below middle school B. High school
C. College / University D. Above master
4. Which city do you live in China? ______________.
5. What is your monthly family income?
A. ≤ 4000 RMB B. 4001-7000 RMB C. 7001-9999 RMB D.≥10000 RMB
Section Ⅱ
6. When you purchase food, to what extent do you think of the quality?
Never Occasionally Half Frequently Always
□ □ □ □ □ 7. Consider your family income, which kind of food would you like to buy?
Never A little Much Quite much Very much
Normal food □ □ □ □ □
Green food □ □ □ □ □
Organic food □ □ □ □ □ 8. How much do you know about green food?
Not at all A little Much Quite much Very much
□ □ □ □ □

32
9. To what extent do you buy green food?
Never Occasionally Half Frequently Always
□ □ □ □ □ 10. When you purchase green food, to what degree do you care about the factors below?
Not at all A little much Much Quite much Very much
Price □ □ □ □ □
Quality □ □ □ □ □
Taste □ □ □ □ □ 11. Where do you prefer to purchase green food?
A. Supermarket B. Exclusive store C. Farmer’s market/Open fair
D. Online store E. Others_______
12. Do you think it is convenient to buy green food for consumers?
Not at all A little Convenient Quite convenient Very convenient
□ □ □ □ □ 13. Do you know where you can get information about green food?
A. TV B. Newspaper C. Radio D. Friends/Relatives E. Others___________
14. How much of your monthly family income are you willing to spend on green food?
A. ≤ 5% B. 6% -- 10% C. 11% -- 15% D. ≥ 16%
15. When you purchase green food, do you often pay attention to promotion?
Never Occasionally Half Frequently Always
□ □ □ □ □
16. What do you think about quality, taste and selling service of Chinese green food?
Very bad Bad Normal Good Very good
Quality □ □ □ □ □
Taste □ □ □ □ □
Selling service □ □ □ □ □

33
17. To what degree do you think about prices of Chinese green food?
Very low Low Normal High Very high
□ □ □ □ □ 18. What is your opinion about green food future development in China? (A brief
description)
__________________________________________________________________
If you have some questions or help for our research, please contact us freely!
Email: Belinda: [email protected] Layna: [email protected] Fred: [email protected]
Thanks!
2013-04-21
34
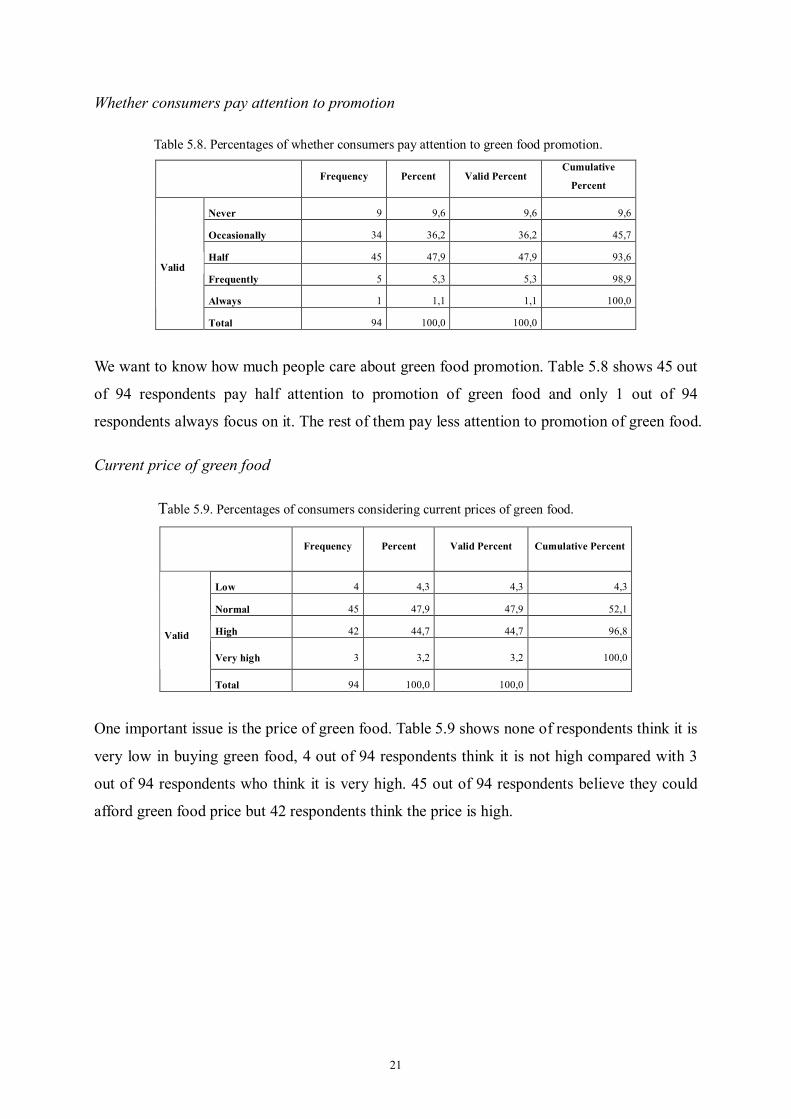
Appendix 2: Questionnaire in Chinese 关于中国东部地区绿色食品消费的影响因素调查
首先非常感谢您参与我们的调查。我们正在搜集关于如何提高中国东部地区绿色食
品消费的调查来协助我们毕业论文的完成。我们希望了解一下您对绿色食品消费的
观点和哪些因素会影响您选择绿色食品。整个调查问卷分为一,二两部分。 第一部分:
首先我们想对您的一些基本个人信息进行了解。
1、您的性别: A:男 B:女
2、您的年龄: A:≤24 B:25-40 C:41-60 D:≥61
3、您目前的文化水平:A:初中以下 B:高中 C:大学 D:研究生以上
4、您居住在中国哪个城市:___________
5、您家庭目前的月收入是?(人民币)
A:≤4000 B:4001-7000 C:7001-9999 D:≥ 10000
第二部分 6、当您购买食品时,您会考虑食品的质量问题吗? 从不考虑 很少 偶尔 经常 必须考虑 □ □ □ □ □ 7、如果考虑到您的家庭收入情况,您更倾向于购买以下哪种食品? 从来不买 很少买 偶尔买 经常买 每天买 无污染食品 □ □ □ □ □ 绿色食品 □ □ □ □ □ 有机食品 □ □ □ □ □ 8、您对绿色食品了解多少?
完全不了解 很少了解 了解 很了解 非常了解 □ □ □ □ □
9、您会经常购买绿色食品吗?
从来不 很少 偶尔 经常 每天 □ □ □ □ □ 10、当您购买绿色食品时,以下三种因素影响了您的购买吗? 从来不 很少 一般 很多 有着决定性的影响
绿色食品的价格 □ □ □ □ □ 绿色食品的质量 □ □ □ □ □ 绿色食品的味道 □ □ □ □ □

35
11、您更喜欢在哪些地方购买绿色食品? A:超市 B:绿色食品专卖店 C:菜市场 D:网购 E:其他_______ 12、您认为您目前购买绿色食品方便吗? 非常不方便 不方便 方便 很方便 非常方便 □ □ □ □ □ 13、您是通过哪些渠道获得绿色食品的信息?(可多选) A:电视广告 B:新闻报纸 C:收音机 D:朋友或亲戚 E:其他:_______ 14、绿色食品的花费大概占您家庭月收入总量的多少?
A:≤5% B:6%-10% C:11%-15% D:≥16% 15、您会经常关注一些绿色食品的促销吗? 从不 很少 偶尔 经常 总是 □ □ □ □ □ 16、您认为目前中国绿色食品的质量,味道和销售服务处于什么样的程度? 非常糟糕 糟糕 一般 好 非常好 质量 □ □ □ □ □ 味道 □ □ □ □ □ 销售服务 □ □ □ □ □
17、您认为目前中国绿色食品的价格状况? 非常便宜 便宜 一般 贵 非常贵 □ □ □ □ □ 18、对于中国绿色食品的今后发展您有那些建议?(简单的描述)
最后如果有什么疑问或需要我们的调查报告,请联系我们。 Email: [email protected] [email protected] [email protected] 再次表示感谢!!
二零一三年四月二十一号