Embed Size (px)
Citation preview
Degree Project in Marine Geology 30 hp
Bachelor Thesis
Stockholm 2019
Department of Geological SciencesStockholm UniversitySE-106 91 Stockholm
Eocene-Oligocene foraminifera stable isotope stratigraphies in the North Atlantic and Indian
Oceans: Rockall Plateau, New Jersey Slopeand the Mascarene Plateau
Nika Nordanstorm

Abstract The initiation of the North Component Water (NCW) formation and export, the predecessor of the Atlantic Meridional Overturning Circulation (AMOC), and its important part of the global Meridional Overturning Circulation (MOC), is widely accepted to roughly coincide with the first glaciation of Antarctica at the Eocene-Oligocene Transition (EOT) at 34 million years ago, however the exact timing is uncertain. It is possible that the NCW formation initiated prior to the Antarctic glaciation, and could also be one of the causes for it. Contemporary tectonic rearrangements such as the closure of gateways between the Arctic, Nordic Seas and North Atlantic decreasing the inflow of freshwater, or the tectonic subsidence of the Greenland-Scotland Ridge, that permitted deep water mass exchange and increased surface salinity in the subarctic oceans, may have changed the global oceanic conditions and favoured deep water formation conditions in the North Atlantic. Low resolution benthic foraminifer carbon and oxygen stable isotope (δ18O and δ13C) records from two sites in the North Atlantic (Site 553 and Site 612), and one in the Indian Ocean (Site 707) were produced in order to analyze each isotopic stratigraphy and add information about the deep water conditions, circulation and Atlantic-Indian ocean connectivity during the EOT. The results from three different species (Hanzawaia ammophila, Cibicidoides spp., and Oridorsalis umbonatus) were age estimated and compared to an Atlantic Ocean isotopic data collection from Coxall et al. (2018). Site 553 did not yield a continuous record throughout the EOT, however the results yield a distinct low δ13C VPDB signature (∼0–0.5 ‰) up to 44 Ma, and indicates poor ventilated, stagnated deep waters in the North East Atlantic. This is coherent with the suggested characteristics of the Nordic Seas prior to the initiation of deep water formation. Site 612 and 707 do record the transition at varying resolution; the two-step transition, an EOT signature, is present at Site 707, however Site 612 lacks the resolution to be certain. Both sites record at least one negative δ13C excursion before decreasing values, that may be a first sign of the NCW export, after which the mixing of the Atlantic water masses was likely to be established, and a resemblant oceanic current pathway to what we can observe today.
II
Contents
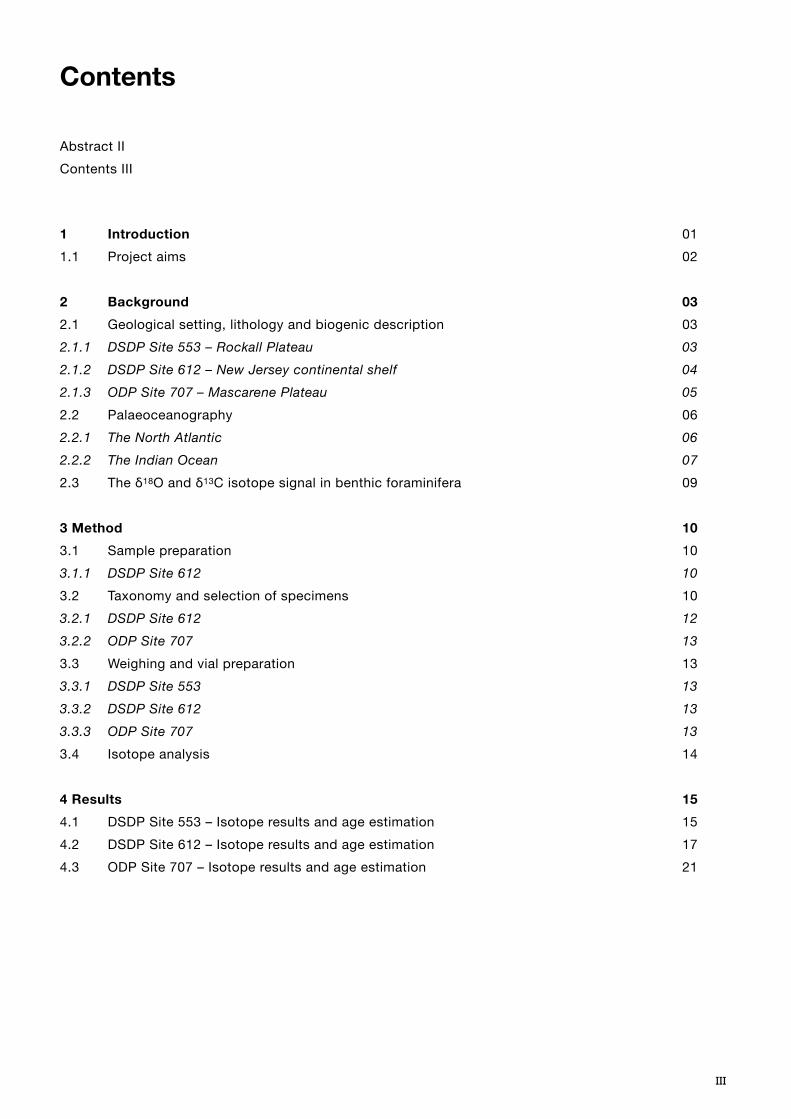
Abstract IIContents III
1 Introduction 011.1 Project aims 02
2 Background 03 2.1 Geological setting, lithology and biogenic description 032.1.1 DSDP Site 553 – Rockall Plateau 03 2.1.2 DSDP Site 612 – New Jersey continental shelf 04 2.1.3 ODP Site 707 – Mascarene Plateau 05 2.2 Palaeoceanography 062.2.1 The North Atlantic 06 2.2.2 The Indian Ocean 07 2.3 The δ18O and δ13C isotope signal in benthic foraminifera 09
3 Method 10 3.1 Sample preparation 103.1.1 DSDP Site 612 10 3.2 Taxonomy and selection of specimens 103.2.1 DSDP Site 612 12 3.2.2 ODP Site 707 13 3.3 Weighing and vial preparation 133.3.1 DSDP Site 553 13 3.3.2 DSDP Site 612 13 3.3.3 ODP Site 707 13 3.4 Isotope analysis 14
4 Results 15 4.1 DSDP Site 553 – Isotope results and age estimation 154.2 DSDP Site 612 – Isotope results and age estimation 174.3 ODP Site 707 – Isotope results and age estimation 21
III
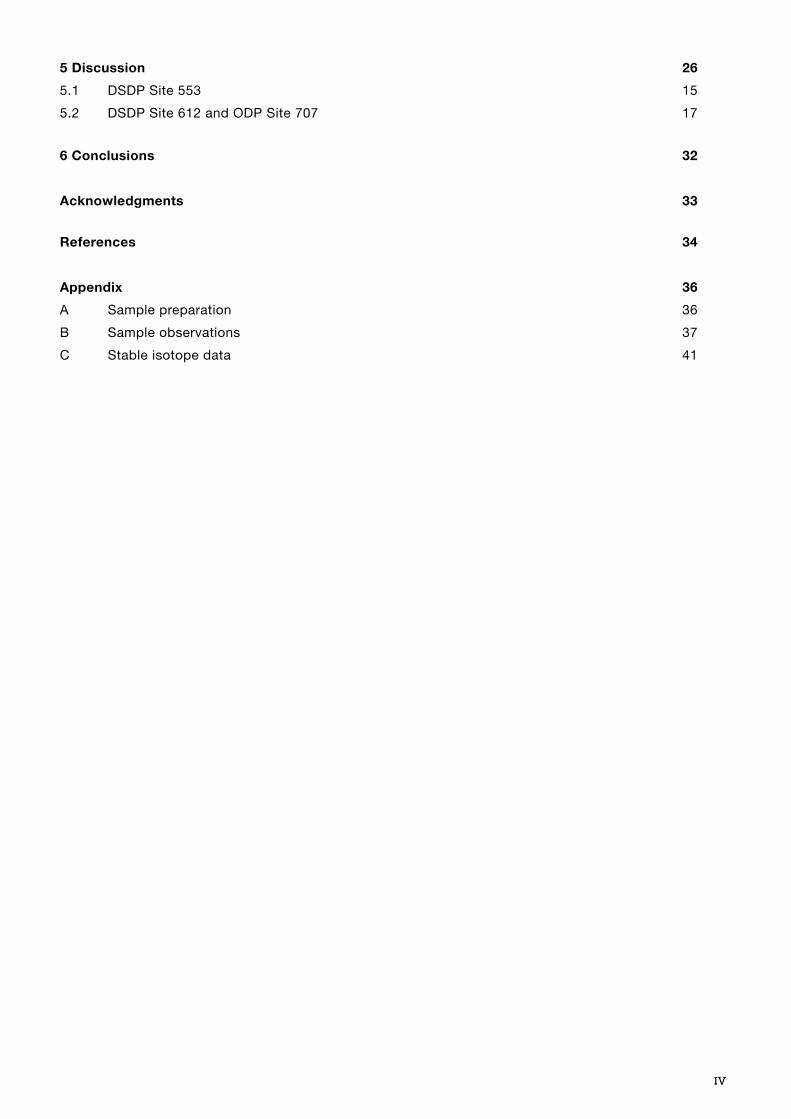
5 Discussion 26 5.1 DSDP Site 553 155.2 DSDP Site 612 and ODP Site 707 17
6 Conclusions 32
Acknowledgments 33
References 34
Appendix 36 A Sample preparation 36B Sample observations 37C Stable isotope data 41
IV
1 INTRODUCTION
The onset of the Atlantic Meridional Overturning Circulation (AMOC) may have coincided with the transition from a greenhouse to icehouse climate at the Eocene-Oligocene transition (EOT), and the glaciation of Antarctica, approximately 34 Ma. Contemporary tectonic rearrangements took place, such as the opening of the Drake Passage (DP) and Tasman Seaway (TS) followed by the initiation of the Antarctic Circumpolar Current (ACC), the deepening of the Greenland-Scotland Ridge, the closing of the West Siberian Seaway and the Arctic-Atlantic Seaway, and the constriction of the Tethys and Central American seaways, and the importance of each for the initiation of the proto-AMOC has been, and is, subject for ongoing research (e.g. Abelson & Erez, 2017; Cramer et al., 2009; Zang et al., 2011). It was also a time of declining atmospheric CO2, orbital forcing and a sharp lowering (>1km) of the oceanic Carbon Compensation Depth (CCD) (Coxall et al., 2005; Coxall & Wilson, 2011), with their respective possible implications on the oceanic conditions. Although the evidence of the transition is continuously growing, the sequence of events and the possible feedbacks are not yet fully understood. The AMOC is presently driven by the temperature and salinity differences at high latitudes in the Northern Hemisphere where most deep water sinks, and the upwelling in the Southern Ocean caused by strong winds and tidal mixing, driven by the ACC (Ferreira et al., 2018). The respective importance of these at the EOT is debated, however recent research, recognising the existence of a shallow proto-ACC at the time, emphasises the importance of the initiation of deep water formation in the North Atlantic. It has been defined as the trigger of the interhemispheric circulation, and that this may have been an
important cause of the Cenozoic global cooling (Abelson & Erez, 2017; Coxall et al., 2018). Recent climate modelling research is aiming to establish prevailing atmospheric and oceanic conditions specifically in the middle-late Eocene, prior to the EOT (Hutchinson et al., 2018; Baatsen et al., 2018; Goldner et al., 2014; Kennedy et al., 2015), but any widely accepted consensus has not yet been reached. At 38 Ma, both Baatsen et al., (2018) and Hutchinson et al. (2018) climate modelling found bipolar sinking in the North Pacific and Southern Ocean, whilst the North Atlantic showed too low salinity to permit sinking. Further, the Hutchinson et al. (2018) model showed an increase in salinity when CO2 levels decreased, but still not enough to initiate deep water formation, due to the connection to the very fresh Arctic Ocean. The Goldner et al. (2014) modelling results emphasises the importance of the Antarctica ice sheet formation to alter ocean circulation, and that the opening of Southern Ocean gateways, the DP and the TS, had little or no impact. They suggest that the ice sheet increased northward transport of both Antarctic intermediate and bottom water, reorganised the ocean pathways, and established the conditions for deep water formation. As the climate models improve, it is critical to collect local data and multiple proxies for comparison, and hence, be able to identify the level of accuracy of the model or possible needs of adjustments. The regional oceanic characteristics (tem-perature, nutrient content, salinity and global ice volume) can be revealed by analysing the δ18O and δ13C isotope content of benthic and planktic foraminifera (microfossil residing on the ocean floor, and floating higher up in the water column, respectively), and recent research indicates important water mass changes in the Northern Seas prior to the Antarctic glaciation (Coxall et al., 2018).
1
Extensive compilations of benthic δ18O data show a gradual increase since the middle Eocene (Cramer et al., 2009) with a rapid stepped increase of 1.5‰ Vienna PeeDee Belemnite (VPDB) at the EOT (Coxall et al., 2005), a sign of decreasing ocean surface temperature and increasing global ice volume. The increase occurred in two steps, of which the cooling of the ocean is believed to be the main influencer at the first excursion, succeeded by the increase of global ice volume (Katz et al., 2008; Coxall et al., 2005). The δ13C isotope signature provide a measure of carbon transfer between the ocean, atmosphere, and sediments. The differences between records reflect nutrient and density contrasts within the ocean and more generally, the homogeneity of the interior ocean (Cramer et al., 2009). Modern North Atlantic Deep Water (NADW) has a high δ13C benthic signature, being ‘young’ and nutrient poor, and it has possibly erroneously been assumed that the initial NCW would have the same characteristics. Coxall et al. (2018) has presented recent foraminifer isotope results from the South Labrador Sea (SLS) recording a novel difference in water mass characteristics, that has been interpreted as the initiation of North Component Water (NCW). The recorded δ18O and δ13C signature before ∼35.8 Ma is lower (1–3‰ VPDB, and 0.5–1‰ VPDB respectively) than the results of all the southerly Atlantic sites analysed in the study. These values then gradually increase and become more similar to the signature of the Southerly sites, and they suggest that this is an indication of a change from a warmer, less saline, nutrient-rich and poorly ventilated water mass, to a ‘younger’, colder, nutrient-poor water mass, with higher salinity, similar to the NADW forming today. They observed a δ13C negative excursion propagated from north to south, at northerly and mid Atlantic sites and suggest that this may be the sign of a first
NCW export, with a then different δ13C signature. This would mean, that the initiation of NCW export, and a proto-AMOC preceded the Antarctic glaciation by 1 Ma.
1.1 Project aims
This study aims to add data of the water mass characteristics in the North Atlantic and Indian Ocean, by producing low resolution benthic foraminifer δ18O and δ13C stratigraphies covering the EOT at three sites, two in the North Atlantic (DSDP Site 553 and DSDP Site 612) and one in the Indian Ocean (ODP Site 707). The resulting δ18O and δ13C records will be analysed and age estimated in order to: (1) Determine whether Site 553 in the North Eastern
Atlantic, yields a sufficiently continuous isotopic record of the EOT.
(2) Determine if the characteristic two-step isotopic shift of the EOT is present at each site.
(3) Understand the deep water conditions, ocean stratification and deep water ‘age’ at these sites, during the EOT, in relation to global patterns.
2
2 BACKGROUND
2.1 Geological setting and lithology description
2.1.1 DSDP Site 553 – Rockall Plateau
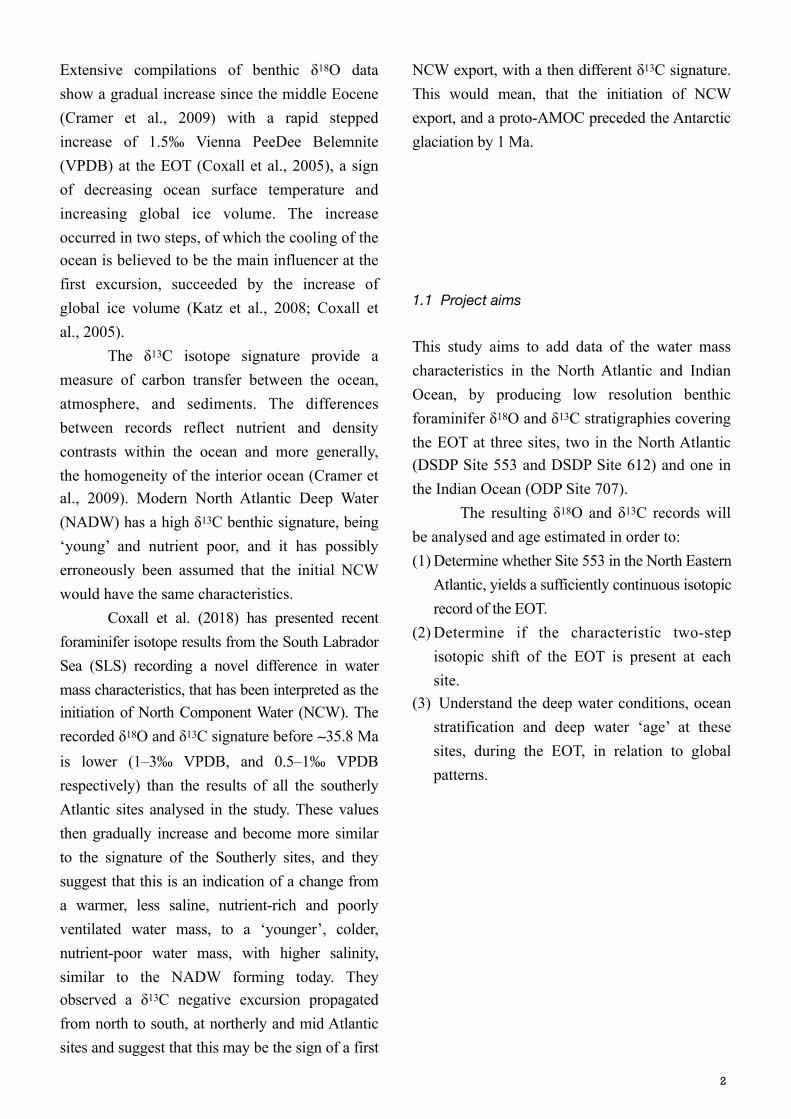
Deep Sea Drilling Project (DSDP) Site 553 is located at 56°02.56’N, 23°13.88’W, on the Rockall Plateau in the north eastern Atlantic Ocean (Fig. 1 & 2), south of Iceland and at least 300 km west of the closest (Scottish) island. It is a microcontinent, with continental rocks, that was isolated as rifting and seafloor spreading opened the Atlantic Ocean (Roberts et al., 1981). The depth of deposition has ranged from lagoonal, or estuarine to inner shelf environment, and the sediment deposition, proceeding since 52 m.y., has been influenced by bottom currents caused by the onset of Norwegian Sea water outflow, at the EOT (Roberts, 1975), that are traceable by a reflector on the seismic profile (Roberts et al. 1981). According to the appearance of specific species of benthic foraminifera it is estimated that Site 553 was at epibathyal depths,
greater than 700 m, during the late Eocene and deeper than 1500 m in the Oligocene (Roberts et al., 1981). The Eocene-Oligocene interval can be found within of a thinner section of 1.75 m, containing several hiatuses that correspond to an estimated 30 m.y., between the middle Eocene and the early Miocene (Roberts et al., 1981). On top of middle Eocene sediments, lies 0.75 m of
3
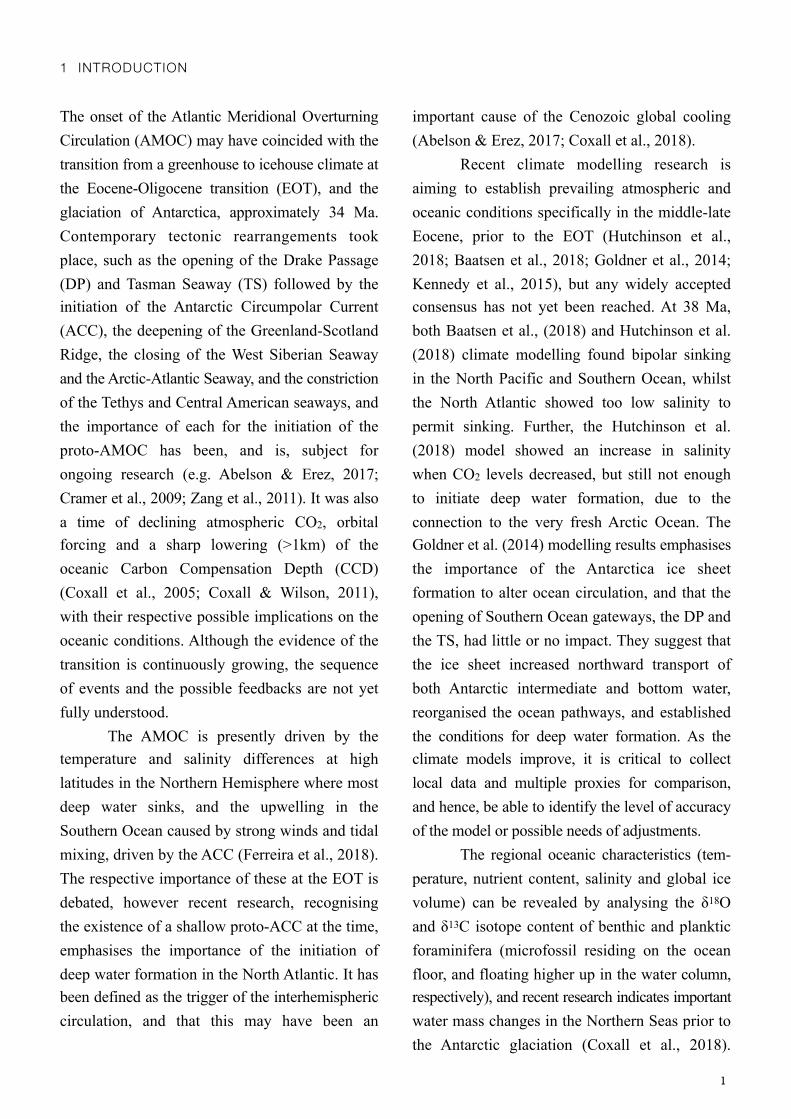
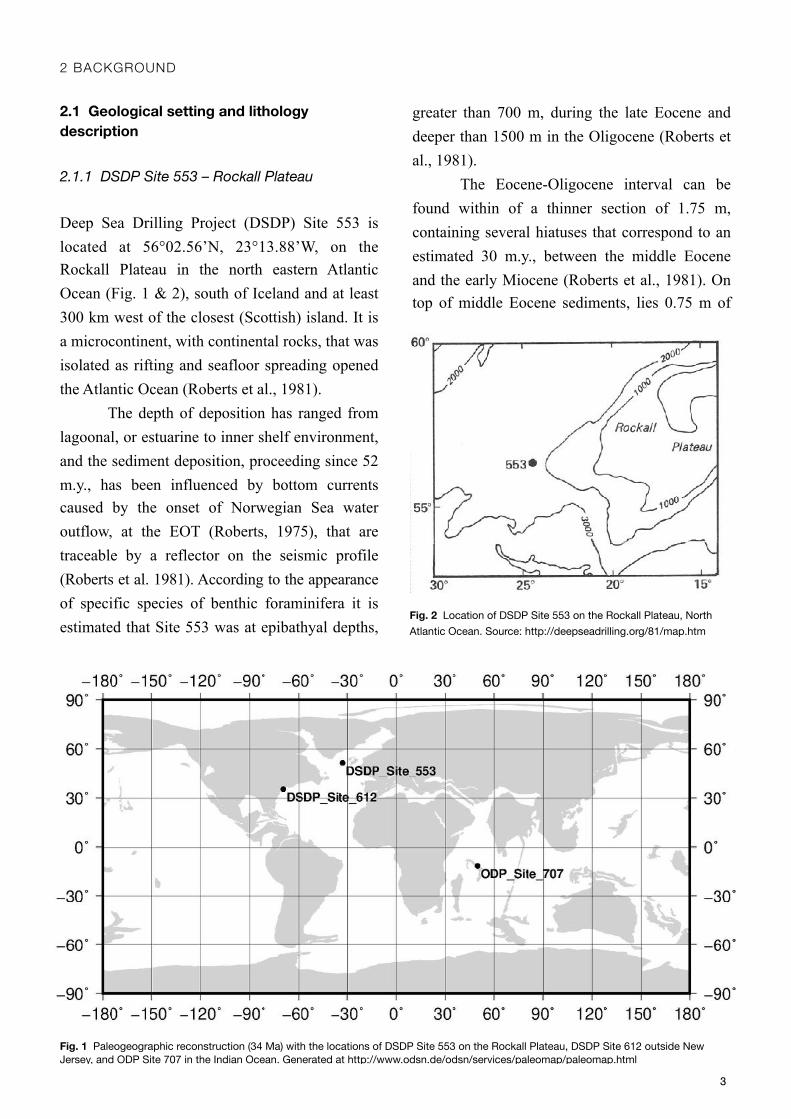
Fig. 1 Paleogeographic reconstruction (34 Ma) with the locations of DSDP Site 553 on the Rockall Plateau, DSDP Site 612 outside New Jersey, and ODP Site 707 in the Indian Ocean. Generated at http://www.odsn.de/odsn/services/paleomap/paleomap.html
Fig. 2 Location of DSDP Site 553 on the Rockall Plateau, North Atlantic Ocean. Source: http://deepseadrilling.org/81/map.htm

nannofossil foraminiferal chalk from the late Oligocene, with increasing content of scattered palagonitised ash going downhole (Roberts et al. 1981). This scattering suggests increased current flow that has reworked the Eocene sediments, and the fish remains and manganese nodules at the base of this sequence, indicate a longer period of slow or non-deposition and/or erosion (Roberts et al., 1981). The Eocene sediments contain volcanic tuff beds and nannofossil foraminiferal chalk, with several unconformities, indicated by bioturbation and mixing, producing transitional sediment types (Roberts et al., 1981). There are signs of a higher energy environment, such as slumps, micro-faults, and sedimentary dykes (Roberts et al., 1981). Despite the indicated hiatuses and sequence disturbances, the Rockhall Site 553 was still investigated as there was not yet any existing isotope record retrieved from this location.
2.1.2 DSDP Site 612 – New Jersey continental slope
DSDP Site 612 is located at 38°49.21' N, 72°46.43’W, in the centre of the continental slope of New Jersey, United States, in 1404 m water depth (Fig. 1 & 3). The sediments are 2 km thick at maximum, and deposited throughout the Cenozoic (Poag et al., 1983). The upper Eocene deposits are incomplete or missing due to major erosion during the Eocene-Oligocene transition (Poag et al., 1983). The lower Eocene strata consists of approximately 50% carbonates, altered silica sediments, and 10–30% radiolarian diatomaceous nannofossil greenish ooze and chalk, with 10–20% of foraminifers and sponge spicules (Poag et al., 1983). The cause of the greenish tone of the deposits, also clearly visible in the sample
preparation, is a pervasive bioturbation (Poag et al., 1983). The Oligocene was characterised by a siliciclastic depositional regime, and quartz and glauconite are present throughout in smaller percentages (Poag et al., 1983). There are approximately 33 m of upper Eocene sediments, 4.5 m of undifferentiated Eocene-Oligocene sediments, and a probable hiatus, on top of which 1 m of lower Oligocene sediments lie, possibly representing only 100,000 years but difficult to estimate due to the thinness of the section (Poag et al., 1983). The hiatus is marked by previously mentioned bioturbation, between Core 612-17 and 612-16 (Appendix B, Table 1), and the estimation of the duration is 0.5 m.y. (Poag et al., 1983). Supporting this assumption is the apparent simultaneous disappearance of Hantkenina spp. (an important planktic foraminifera biomarker indicating the EOT globally) and Discoaster spp., of which the latter clearly precedes at other investigated sites (Poag et al., 1983). Poag et al. (1983) estimated the deposition rate to approximately 30 m/m.y., however they expressed a considerable uncertainty due to the mentioned hiatuses, and it could have been as high as 45 m/m.y., or as low as 15 m/m.y, from the Upper Eocene to lowermost Oligocene. The preservation throughout the section overall is good, and both planktonic and benthic species are abundant (Poag et al. 1983).
4
Fig. 3 Location of DSDP Site 612 outside New Jersey, United States. Source: http://deepseadrilling.org/95/map.htm
The deposition during the Eocene and Oligocene was accumulated in an upper slope palaeo environment (Poag et al., 1983), at bathyal depths of ∼1,000 m (Bown et al., 1994).
2.1.3 ODP Site 707 – Mascarene Plateau
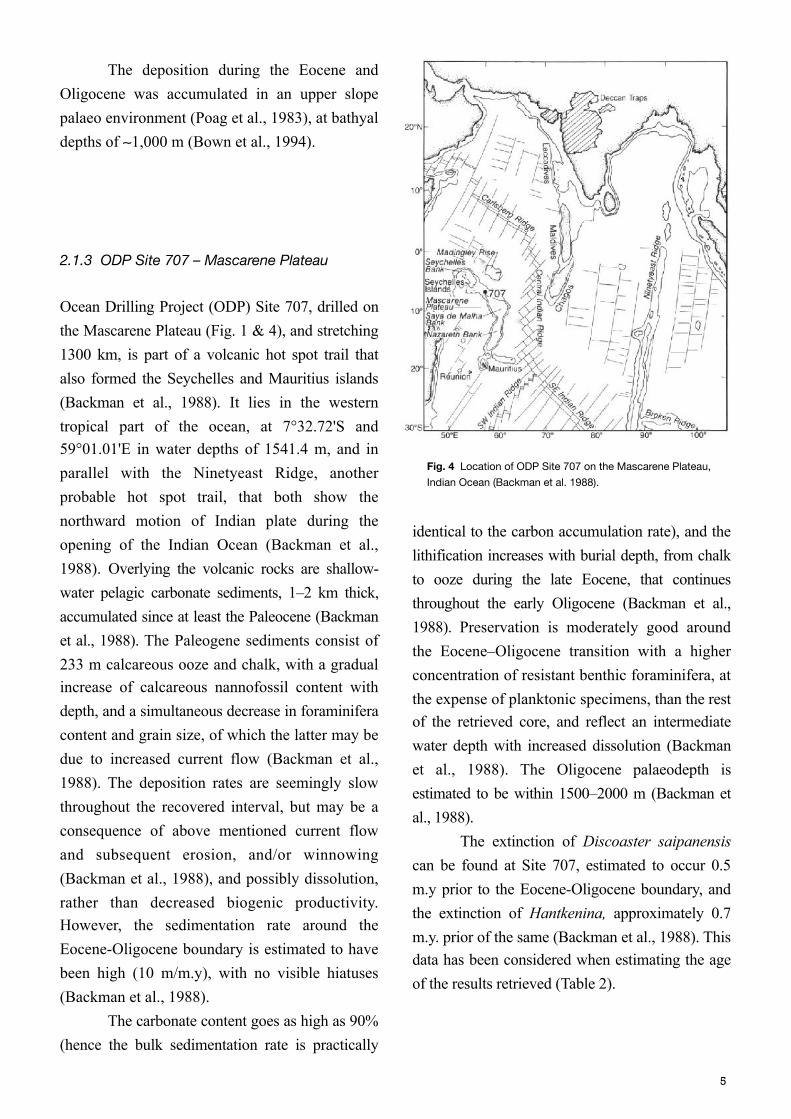
Ocean Drilling Project (ODP) Site 707, drilled on the Mascarene Plateau (Fig. 1 & 4), and stretching 1300 km, is part of a volcanic hot spot trail that also formed the Seychelles and Mauritius islands (Backman et al., 1988). It lies in the western tropical part of the ocean, at 7°32.72'S and 59°01.01'E in water depths of 1541.4 m, and in parallel with the Ninetyeast Ridge, another probable hot spot trail, that both show the northward motion of Indian plate during the opening of the Indian Ocean (Backman et al., 1988). Overlying the volcanic rocks are shallow-water pelagic carbonate sediments, 1–2 km thick, accumulated since at least the Paleocene (Backman et al., 1988). The Paleogene sediments consist of 233 m calcareous ooze and chalk, with a gradual increase of calcareous nannofossil content with depth, and a simultaneous decrease in foraminifera content and grain size, of which the latter may be due to increased current flow (Backman et al., 1988). The deposition rates are seemingly slow throughout the recovered interval, but may be a consequence of above mentioned current flow and subsequent erosion, and/or winnowing (Backman et al., 1988), and possibly dissolution, rather than decreased biogenic productivity. However, the sedimentation rate around the Eocene-Oligocene boundary is estimated to have been high (10 m/m.y), with no visible hiatuses (Backman et al., 1988). The carbonate content goes as high as 90% (hence the bulk sedimentation rate is practically
identical to the carbon accumulation rate), and the lithification increases with burial depth, from chalk to ooze during the late Eocene, that continues throughout the early Oligocene (Backman et al., 1988). Preservation is moderately good around the Eocene–Oligocene transition with a higher concentration of resistant benthic foraminifera, at the expense of planktonic specimens, than the rest of the retrieved core, and reflect an intermediate water depth with increased dissolution (Backman et al., 1988). The Oligocene palaeodepth is estimated to be within 1500–2000 m (Backman et al., 1988). The extinction of Discoaster saipanensis can be found at Site 707, estimated to occur 0.5 m.y prior to the Eocene-Oligocene boundary, and the extinction of Hantkenina, approximately 0.7 m.y. prior of the same (Backman et al., 1988). This data has been considered when estimating the age of the results retrieved (Table 2).
Fig. 4 Location of ODP Site 707 on the Mascarene Plateau, Indian Ocean (Backman et al. 1988).
5
2.2 Palaeoceanography
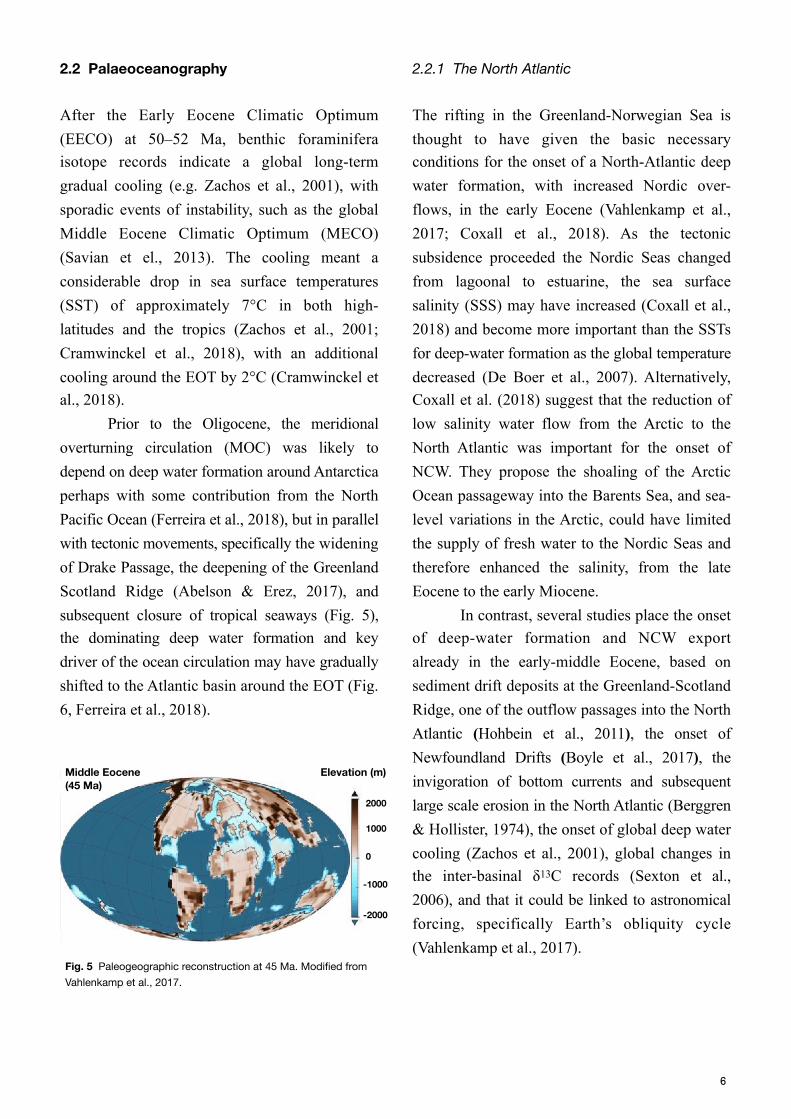
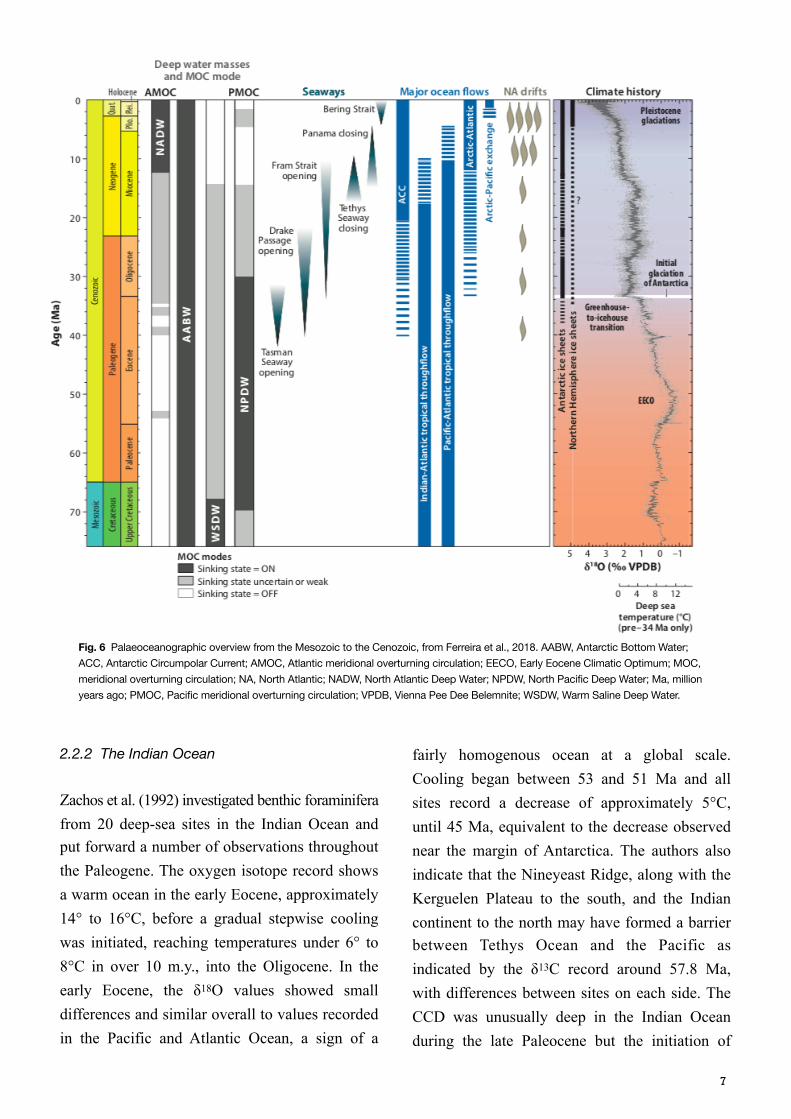
After the Early Eocene Climatic Optimum (EECO) at 50–52 Ma, benthic foraminifera isotope records indicate a global long-term gradual cooling (e.g. Zachos et al., 2001), with sporadic events of instability, such as the global Middle Eocene Climatic Optimum (MECO) (Savian et el., 2013). The cooling meant a considerable drop in sea surface temperatures (SST) of approximately 7°C in both high-latitudes and the tropics (Zachos et al., 2001; Cramwinckel et al., 2018), with an additional cooling around the EOT by 2°C (Cramwinckel et al., 2018). Prior to the Oligocene, the meridional overturning circulation (MOC) was likely to depend on deep water formation around Antarctica perhaps with some contribution from the North Pacific Ocean (Ferreira et al., 2018), but in parallel with tectonic movements, specifically the widening of Drake Passage, the deepening of the Greenland Scotland Ridge (Abelson & Erez, 2017), and subsequent closure of tropical seaways (Fig. 5), the dominating deep water formation and key driver of the ocean circulation may have gradually shifted to the Atlantic basin around the EOT (Fig. 6, Ferreira et al., 2018).
2.2.1 The North Atlantic
The rifting in the Greenland-Norwegian Sea is thought to have given the basic necessary conditions for the onset of a North-Atlantic deep water formation, with increased Nordic over-flows, in the early Eocene (Vahlenkamp et al., 2017; Coxall et al., 2018). As the tectonic subsidence proceeded the Nordic Seas changed from lagoonal to estuarine, the sea surface salinity (SSS) may have increased (Coxall et al., 2018) and become more important than the SSTs for deep-water formation as the global temperature decreased (De Boer et al., 2007). Alternatively, Coxall et al. (2018) suggest that the reduction of low salinity water flow from the Arctic to the North Atlantic was important for the onset of NCW. They propose the shoaling of the Arctic Ocean passageway into the Barents Sea, and sea-level variations in the Arctic, could have limited the supply of fresh water to the Nordic Seas and therefore enhanced the salinity, from the late Eocene to the early Miocene. In contrast, several studies place the onset of deep-water formation and NCW export already in the early-middle Eocene, based on sediment drift deposits at the Greenland-Scotland Ridge, one of the outflow passages into the North Atlantic (Hohbein et al., 2011), the onset of Newfoundland Drifts (Boyle et al., 2017), the invigoration of bottom currents and subsequent large scale erosion in the North Atlantic (Berggren & Hollister, 1974), the onset of global deep water cooling (Zachos et al., 2001), global changes in the inter-basinal δ13C records (Sexton et al., 2006), and that it could be linked to astronomical forcing, specifically Earth’s obliquity cycle (Vahlenkamp et al., 2017).
6
Fig. 5 Paleogeographic reconstruction at 45 Ma. Modified from Vahlenkamp et al., 2017.
Elevation (m)Middle Eocene (45 Ma)
2000
1000
0
-1000
-2000
2.2.2 The Indian Ocean
Zachos et al. (1992) investigated benthic foraminifera from 20 deep-sea sites in the Indian Ocean and put forward a number of observations throughout the Paleogene. The oxygen isotope record shows a warm ocean in the early Eocene, approximately 14° to 16°C, before a gradual stepwise cooling was initiated, reaching temperatures under 6° to 8°C in over 10 m.y., into the Oligocene. In the early Eocene, the δ18O values showed small differences and similar overall to values recorded in the Pacific and Atlantic Ocean, a sign of a
fairly homogenous ocean at a global scale. Cooling began between 53 and 51 Ma and all sites record a decrease of approximately 5°C, until 45 Ma, equivalent to the decrease observed near the margin of Antarctica. The authors also indicate that the Nineyeast Ridge, along with the Kerguelen Plateau to the south, and the Indian continent to the north may have formed a barrier between Tethys Ocean and the Pacific as indicated by the δ13C record around 57.8 Ma, with differences between sites on each side. The CCD was unusually deep in the Indian Ocean during the late Paleocene but the initiation of
7
Fig. 6 Palaeoceanographic overview from the Mesozoic to the Cenozoic, from Ferreira et al., 2018. AABW, Antarctic Bottom Water; ACC, Antarctic Circumpolar Current; AMOC, Atlantic meridional overturning circulation; EECO, Early Eocene Climatic Optimum; MOC, meridional overturning circulation; NA, North Atlantic; NADW, North Atlantic Deep Water; NPDW, North Pacific Deep Water; Ma, million years ago; PMOC, Pacific meridional overturning circulation; VPDB, Vienna Pee Dee Belemnite; WSDW, Warm Saline Deep Water.

carbonate accumulation was delayed approximately 2 m.y. at the eastern side of the ridge, an indication of a more corrosive depositional environment and may be because of the supply of aged water from the Pacific (Zachos et al., 1992). Stepping further into the Eocene, both the carbon and oxygen isotope record indicates that Indian Ocean waters were older than those of the Antarctic, but the same age or younger than those of the central Pacific, meaning the mayor supply of deep water came from the Southern Ocean. Zachos et al. (1992), further observed that around 45 to 42 Ma, the values at the high latitude southern sites, and low latitude northern sites diverge, and suggest the existence of two water masses at intermediate depths from different sources. At the high latitude sites, south of 35°S the δ18O values continued to increase, while the low latitude sites stabilised. This event coincides with evidence of increased cooling in all basins, the decrease of biodiversity and the disappearances of calcareous nannofossil, and the authors interpreted this change in water mass characteristics as a consequence of the widening of the seaway between Antarctica and Australia, causing an accelerated cooling of polar surface waters. These water masses, referred to as Antarctic Intermediate water (AAIW) by the authors, reached the low latitude Indian Ocean, which then came to share water mass characteristics with the Southern Ocean, while the low latitude sites had water masses coming from a low latitude location, exhibiting a much warmer and saline character. The contemporary Tethys Sea contained extensive shallow water platforms suitable for the production of warm high salinity waters and is a plausible source candidate for the low latitude water mass, passing through the northern Indian Ocean and also exported also to the Atlantic sector of the Southern Ocean (Kennett & Stott, 1990). It is referred to as the Tethyan-Indian Saline Water (TISW) by Zachos
et al. (1992), or as the Warm Saline Deep Water (WSDW) by Ferreira et al., (2018) (Fig. 6). Zachos et al. (1992) further state that the two water masses seem to have covaried in similar patterns throughout the Oligocene, apart from two brief intervals at 38 Ma and 36 Ma, when the TISW may have extended to the southern ocean. The two records are offset when the early Oligocene ice-volume event (Oi-1) took place at approximately 33.6 Ma. Although the δ13C record shows a fairly homogenous basin for most of the Eocene and Oligocene (also compared to other basins), a peak increase of δ13C occurred simultaneously to the Early Oligocene ice-volume event (Oi-1), together with a 2° to 3° cooling, in the high latitude Southern Ocean sites, that may reflect an increase of nutrient depleted AAIW production, that could have reinforced the thermal segregation of inter-mediate waters (Zachos et al., 1992).
2.3 The δ18O and δ13C isotope signal in benthic foraminifera
The δ18O and δ13C isotopes in foraminifera give information of palaeo-oceanic conditions, such as temperature, nutrient content, salinity, and global ice volume (e.g. Coxall et al., 2018). Foraminifera uses oxygen and carbon from their environment as they form and incorporate CaCO3 into their shells, and hence, record the prevailing isotopic values of these in the ocean. Increasing global ice volume concentrates the lighter δ16O in the cryosphere and leaves the heavier δ18O in the oceans, as there is a mass preference towards the lighter isotope throughout the hydrological cycle. This fractionation increases the δ18O ratio, and makes climatic differences traceable. However, the δ18O also contains a temperature component during the calcification,
8

that needs an independent proxy of either temperature or global ice volume, to be quantified (Lear et al., 2008) or the record may not be properly assessed or interpreted. The oceanic δ13C isotope value provides an indication of the carbon exchange between ocean, biosphere, atmosphere, and sediments. It is also a useful measurement for revealing differences and movements between water masses (Zachos et al., 1992), analysing nutrient content and density contrasts (Zachos et al., 1992; Cramer et al., 2009) as some species of benthic foraminifera accurately record the δ13C content of the ambient dissolved inorganic carbon (Zachos et al., 1992). A water mass with a high δ13C signature normally indicate that it is recently formed, and has not had the time to accumulate δ12C from the benthic decomposition of organic material (Kroopnick, 1985). This accumulation reflects the time elapsed since the water mass was last exposed to the surface (Ferreira et al., 2018), at what point the carbon will be exchanged with the atmosphere, and the ‘counting’ resets. However, this method has its limitations as the signal is heavily affected by the local rain rate and transport of organic carbon from surface to deep waters, and it is amplified (or diminished) with a higher (lower) primary productivity (Zachos et al., 1992). The productivity in its turn, depends on the ambient nutrient content, caused by surface upwelling and general flow patterns of the deep-ocean circulation (Backman et al., 1988). Another influential factor is the mixing of water masses that may confuse or suppress the carbon imprinted water mass signal, which then would not reflect its true ‘age’ (Zachos et al., 1992). The mixing may also occur vertically, when a weak thermocline enhances the mixing between the euphotic zone and deep-waters (Backman et al., 1988).
A factor that do not cause variations of the results, but may be reason for the lack of any result is the carbonate compensation depth (CCD) at the time. All deep water masses are undersaturated with respect to calcium carbonate and foraminifera will be subject to dissolution, with increasing risk in corrosive waters (Backman et al., 1988). The CCD is also a function of ocean circulation, and the supply of organic material (from surface productivity) that oxidises at intermediate depths (Backman et al., 1988). The rate of calcium carbonate accumulation depends on the variations of calcite saturation in the water column that averaged, balances the total global carbon budget (Backman et al., 1988). Although many factors may affect the δ13C isotope record, pulses or trends can reveal climatic changes both on a regional and global scale, and occasionally small-scale patterns where enough data exists (Zachos et al., 1992), with an approximate time reference in terms of the rapidness and duration of the event.
9
3 METHOD
3.1 Sample preparation
3.1.1 DSDP Site 612
From DSDP Site 612, 22 samples were freeze-dried and weighed, (Appendix A, Table 1) swiftly to avoid any air moisture to be absorbed by the clay particles. A minor piece of the sample was left in the bag and resealed for future reference. Each sample was poured into a labelled Erlenmeyer flask, soaked in deionised water, and sealed with parafilm. To disaggregate the sediment and clay particles from the foraminifera, the flasks were set on a shaker table at 150 RPM, and left shaking over night. Each flask was sonicated in a VWR ultrasonic cleaner for 5-10 seconds twice before emptied over a 63 µm meshed sieve, using a squeeze bottle with deionised water to avoid any residue left in the flask. Then the sample was wet-sieved with pressured deionised water until all clay was gone. The sieves were checked in microscope to confirm a successful removal and
set to dry in the oven at 49.5°C for over 48 hours. When dry, the samples were weighed (Appendix A, Table 1), first the sieve with the sample, and then again the sieve once it was cleaned. The cleaning involved sonication for 10 seconds twice, a rinse with deionised water in between, and finalised by blowing with a compressed air gun. The sieves were checked in microscope to confirm that no fragment remained. The samples were collected in vials and labelled. Additionally, another 12 samples from Site 612, prepared at a different location, were checked and analysed in this study.
3.2 Taxonomy and selection of specimens
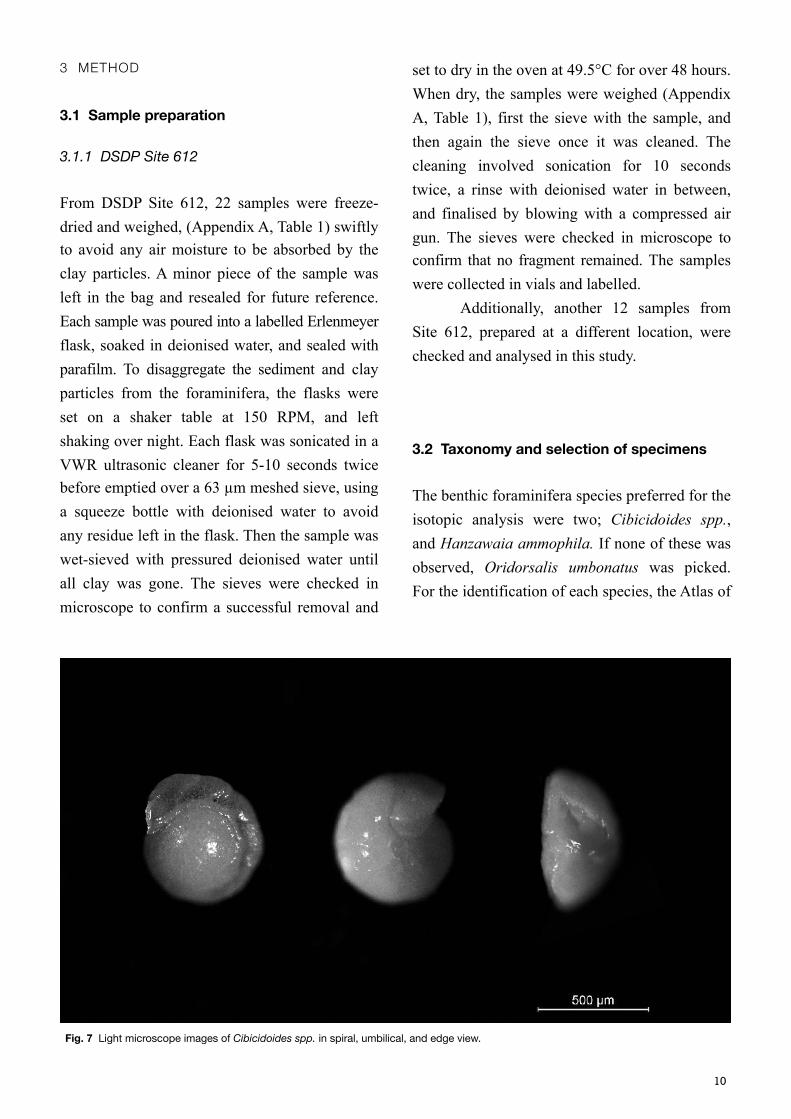
The benthic foraminifera species preferred for the isotopic analysis were two; Cibicidoides spp., and Hanzawaia ammophila. If none of these was observed, Oridorsalis umbonatus was picked. For the identification of each species, the Atlas of
Fig. 7 Light microscope images of Cibicidoides spp. in spiral, umbilical, and edge view.
10
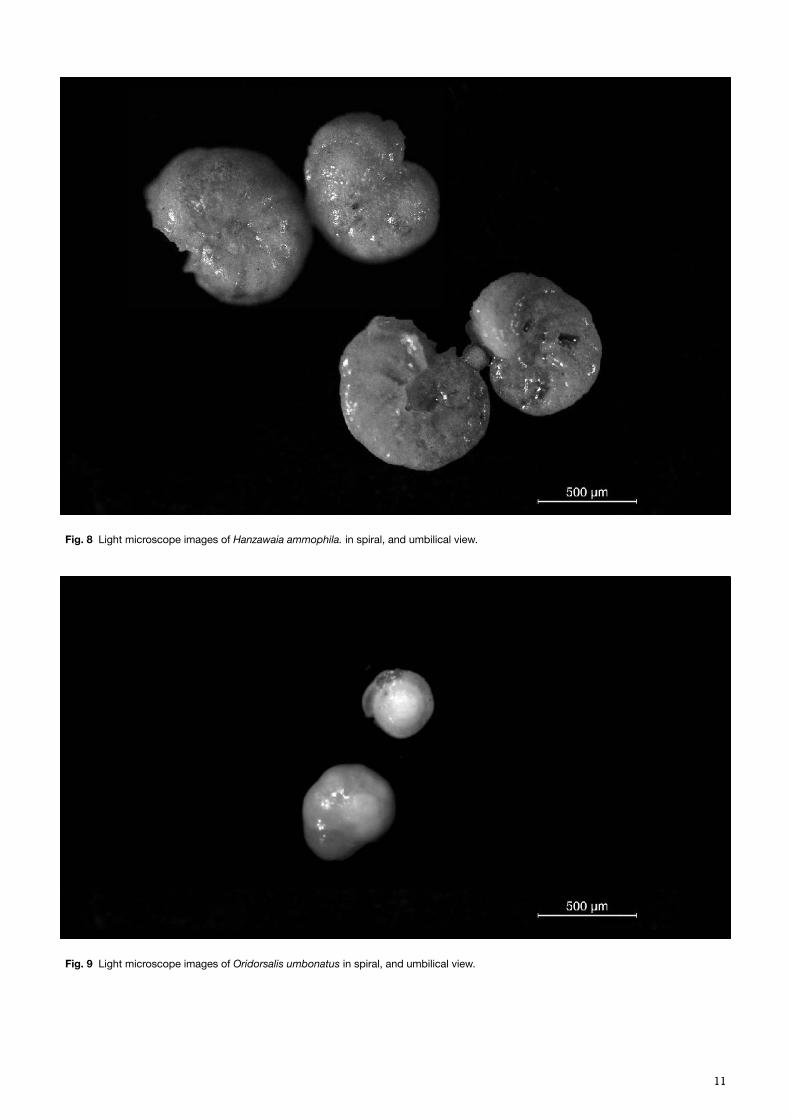
Fig. 8 Light microscope images of Hanzawaia ammophila. in spiral, and umbilical view.
Fig. 9 Light microscope images of Oridorsalis umbonatus in spiral, and umbilical view.
11
Benthic Foraminifera (Holbourn et al., 2013) was used as taxonomic framework. Cibicidoides spp. is a compressed trocho-spire that is planoconvex in cross-section, with a flattened spiral view and a convex umbilical view (Holbourn et al., 2013, Fig. 7). Its chambers gradually increase in size (Holbourn et al., 2013) and make smaller indents into the rounded shape. It it characterised by its beaky aperture, and porous texture that is more coarsely perforated on the spiral side, than the umbilical side (Holbourn et al., 2013). Hanzawaia ammophila is a small trocho-spire, also planoconvex (Holbourn et al., 2013, Fig. 8), with a less accentuated flattened spiral side and not as convex umbilical view as the Cibicidoides spp. species. It has approximately fifteen chambers that increase in size and are separated by strongly curved and voluminous ligaments (Holbourn et al., 2013). It is finely perforated on both sides with an aperture bordered by a lip that extends on the spiral side (Holbourn et al., 2013). It is a species with few resemblances with other species, that makes it easier to distinguish. Oridorsalis umbonatus resembles Cibi-cidoides spp., but has a characteristic pentagonal shape in spiral view. It forms a lenticular, low trochospire, with convex spiral and umbilical side, the latter slightly less so (Holbourn et al., 2013). It has five to six chambers that gradually increase in size (Holbourn et al., 2013), and the chamber ligaments make a large angle with the body. It is so finely perforated that it is hard to appreciate, and gives a smooth and shiny appearance, even when undergone dissolution (Fig. 9). All samples were observed through a binocular microscope with reflected light, using a picking tray and a thin paintbrush. The size of the sieves used for the microscopic selection of species were; 355, 250 and 150 µm. The aim was
to obtain enough specimens to reach the required sample weight, between 0.20 and 0.25 mg. If this was not possible, the laboratory were able to apply a method of correction to weights below this range, but with a minimum of 0.07 mg to obtain reliable results.
3.2.1 DSDP Site 612
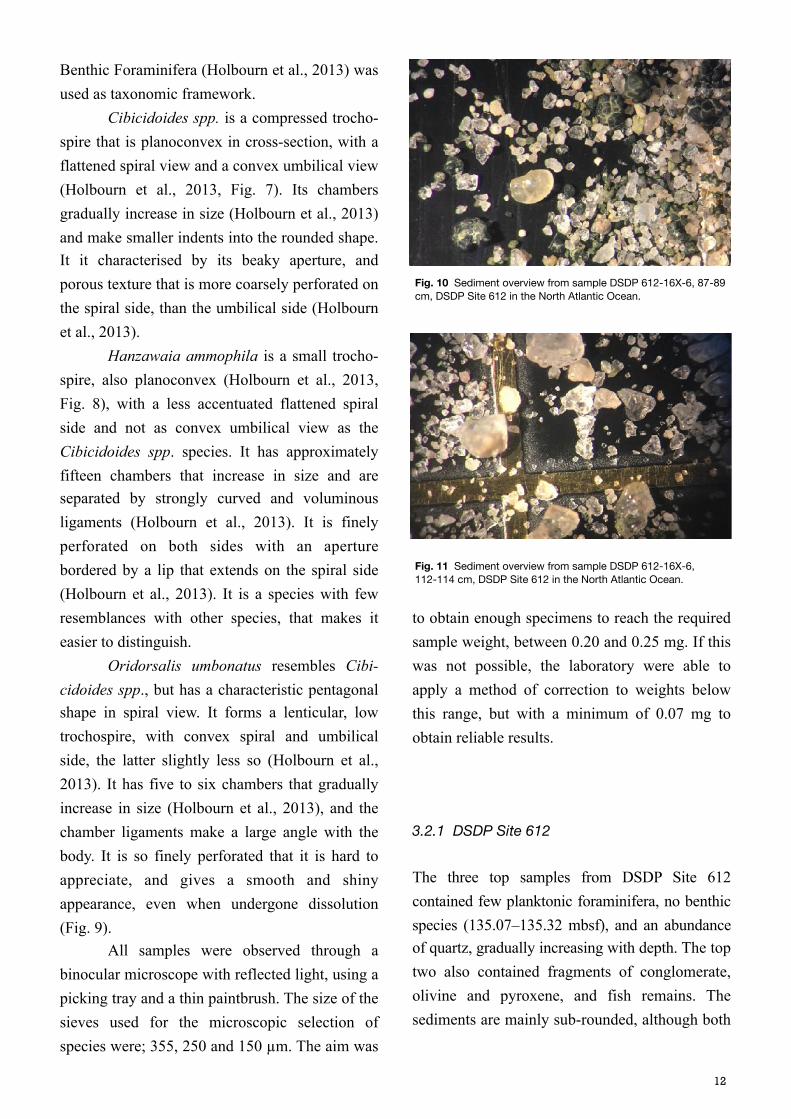
The three top samples from DSDP Site 612 contained few planktonic foraminifera, no benthic species (135.07–135.32 mbsf), and an abundance of quartz, gradually increasing with depth. The top two also contained fragments of conglomerate, olivine and pyroxene, and fish remains. The sediments are mainly sub-rounded, although both
Fig. 10 Sediment overview from sample DSDP 612-16X-6, 87-89 cm, DSDP Site 612 in the North Atlantic Ocean.
Fig. 11 Sediment overview from sample DSDP 612-16X-6, 112-114 cm, DSDP Site 612 in the North Atlantic Ocean.
12

angular and rounded fragments were observed, and poorly sorted (Fig. 10 & 11). Sediments and fish remains continued to be present throughout the analysed interval, with overall moderate to strong dissolution and breakage (Appendix B, Table 1). The abundance of relevant species was poor overall, and Cibicidoides spp. was often more present than Hanzawaia ammophila., however in a few samples the larger fractions contained more Hanzawaia ammophila., and Cibicidoides spp. dominated the finer fraction. An unknown species, with Cibicidoides spp. resemblances was abundant in the majority of samples, possibly Neoeponides hillebrandti or Osangularia velascoensis (Holbourn et al., 2013), which was not picked, as it was not relevant for the isotopic analysis.
3.2.2 ODP Site 707
The samples obtained from ODP Site 707, had a considerably higher foraminifera ratio, less fragmentation and dissolution and a homogenous pearl white colour (Appendix B, Table 2). The difference in climatic habitat was clearly visible. There was an abundance of radiolaria overall in, and below, the fine fraction. When dissolution and/or breakage had occurred it was mainly moderate, and an almost continuous record of Cibicidoides spp. was possible to retrieve for isotopic analysis.
3.3 Weighing and vial preparation
3.3.1 DSDP Site 553
The specimens obtained from DSDP Site 553, were picked from preselected boxes containing
only benthic foraminifera. The three different species were picked according to availability in the sample, Cibicidoides spp., Hanzawaia ammophila, and Oridorsalis umbontaus (Appendix C, Table 1). Some samples with weight slightly below the lowest permitted (>0.07 mg) were still analysed, and the total number of samples was 17, from 231,7 to 244,4 mbsf, approximately every 2 centimetres with the exception of 242,9 mbsf where no benthic foraminifera was found, and the gap between samples is 3 cm (Appendix C, Table 1). The specimens were picked and placed in silver cups, and weighed using the micro-scale Sartorius MC5, before placed in glass vials with caps, and numbered accordingly.
3.3.2 DSDP Site 612
Of the 34 samples checked, 26 had enough specimens of relevant species to obtain the mass required for the analysis (Appendix C, Table 2). The samples were weighed using a Microbalance XM 1000P Sartorius micro-scale, placed in vials and labelled.
3.3.3 ODP Site 707
Of the 29 samples checked, 28 contained enough specimens of relevant species to obtain the mass required for the analysis (Appendix C, Table 3). The samples were weighed using a Microbalance XM 1000P Sartorius micro-scale, placed in vials and labelled.
13
3.4 Isotope analysis
In preparation for the isotope analysis, the samples were oven-dried at 50°C to evaporate all H2O overnight. A small drop of acid was then placed on the lateral wall of the vial. The vial was filled with helium (100ml/min for 10 min) to flush out atmospheric gases and sealed. The vial was placed in horizontal so that the foraminifera was mixed with the acid and dissolved in the gases. Standard gases were also prepared for analysis as references and used to calibrate the results. The gases were pulled into and separated by Gasbench II that is connected to the mass spectrometer MAT253 (Thermo) for isotope analysis. Measurements are recorded as a isotopic mass sum of 12C, 13C, 16O, 18O, with a correction for 17O as follows; - 44; 12C, 16O, 16O - 45; 13C, 16O, 16O - 46; 12C, 18O, 16O The instrument gives the isotopic carbon result with an error margin of 0,06%, and 0,15% for the oxygen.
14

4 RESULTS
4.1 DSDP Site 553 – Isotope results and age estimation
The results from the northernmost DSDP Site 553 came from a total of 8 depth points with isotopic data from the three earlier mentioned selected species (Cibicidoides spp., Hanzawaia ammophila, and Oridorsalis umbonatus) at incomplete sequences (Fig. 12). Cibicidoides spp. were found at the shallowest (231.70 mbsf), up until the second deepest (244.40 mbsf), and gave δ18O isotopic results ranging from –0.34 to 1.58‰ VPDB, with an increasing trend with the decrease of depth/age, and a negative excursion at 233.30 mbsf, estimated to be the first value dated after the EOT. Cibicidoides grimsdalei was obtained only from 235.02 mbsf, and gave the highest isotopic oxygen value from this site, 2.35‰ VPDB, with a pre-EOT estimated age. Oridorsalis umbonatus lack two depth points at 238.4 and 239.9 mbsf, but follows the same increasing trend as Cibicidoides spp., with values ranging from –0.42 to 1.81‰ VPDB, and the same excursion after the EOT boundary. The values were adjusted to Cibicidoides spp. (O. umb. δ18O–0.28; Coxall et al., 2018), with results ranging from –0.70 to 1.53‰ VPDB, and following the same trend. Hanzawaia ammophila was only found at the three most shallow depths and marked an opposite trend of decreasing values with decreasing depth/age, from 1.52 to 0.70‰ VPDB, after the EOT. The data were adjusted to Cibicidoides spp. with the following formula; (H. ammophila δ18O–0.16)/0.62 from Katz et al., 2003, obtaining values ranging from 0.87 to 2.19‰ VPDB, and following the same opposite trend. All three species recorded a decrease in δ18O from 233.20 to 231.70 mbsf.
The carbon isotopic values for Cibi-cidoides spp. does not vary much but is low throughout the interval, ranging from –0.04 to 0.51‰ VPDB with gradual steps. The shallowest depth records the largest difference with a decrease of 0.55‰ VPDB. Also for the carbon isotopic value, Cibicidoides grimsdalei records the highest value of all species, with 0.84‰ VPDB, before the EOT. Oridorsalis umbonatus and adjusted values record an increasing trend before the EOT with a negative excursion at the EOT and increasing values after, with only negative values ranging from –0.95 to –0.04‰ VPDB, and adjusted values (O. umbonatus δ13C + 1.4; Coxall et al., 2018) from 0.45 to 1.36‰ VPDB. The shallow depth values for Hanzawaia ammophila after the EOT, marks a minor variation of 0.48‰ VPDB for both recorded and adjusted values (H. ammophila δ13C + 0.08; Katz et al., 2003), with values ranging from 0.25 to 0.73‰ VPDB, and 0.33 to 0.81‰ VPDB respectively. An age estimation was made based on the biostratigraphic data for calcareous nannofossils from the DSDP Initial Report (Roberts et al., 1981), that gave three different age groups for the 8 depths with obtained results. There are two hiatus causing extensive age gaps between 235.02 and 236.90 mbsf, and 239.9 and 241.4 mbsf, estimated to 15 and 3 Ma (the younger and older age gap respectively), but that could be as long as 20 Ma and 10 Ma. The ages between the hiatuses were established taking the average age of each given time interval, using the GTS12 periodic age translations, and calculating the ages above and below based on the sedimentation rate given by the same report (ranging from 6,20 to 8 m/m.y.; Roberts et al., 1981)(Table 1).
15

230,00
232,00
234,00
236,00
238,00
240,00
242,00
244,00
246,00-1,50-0,500,501,502,503,50
Dep
th (m
bsf)
δ18O (‰)Cibicidoides spp.Cibicidoides grimsdaleiOridorsalis umbonatusOridorsalis umbonatus adj. Cibicidoides spp.Hanzawaia ammophilaHanzawaia ammophila adj. Cibicidoides spp.
Late
ear
lyE
ocen
eLa
te O
ligoc
ene
Upp
er m
iddl
e E
ocen
e
Pal
eo w
ater
dep
th >
150
0 m
Pal
eo w
ater
dep
th >
700
m
230,00
232,00
234,00
236,00
238,00
240,00
242,00
244,00
246,00-2,50-1,50-0,500,501,502,50
Dep
th (m
bsf)
δ13C (‰)Cibicidoides spp.Cibicidoides grimsdaleiOridorsalis umbonatusOridorsalis umbonatus adj. Cibicidoides spp.Hanzawaia ammophilaHanzawaia ammophila adj. Cibicidoides spp.
Late
ear
lyE
ocen
eLa
te O
ligoc
ene
Upp
er m
iddl
e E
ocen
e
Pal
eo w
ater
dep
th >
150
0 m
Pal
eo w
ater
dep
th >
700
m
Fig. 12 δ18O results obtained from DSDP Site 553 plotted against depth and estimated age. The estimated hiatuses with square shaped lines, and the time gaps with coloured blocks.
Fig. 13 δ13C results obtained from DSDP Site 553 plotted against depth and estimated age. The estimated hiatuses with square shaped lines, and the time gaps with coloured blocks.
16
25,00
30,00
35,00
40,00
45,00
50,00-1,50-0,500,501,502,503,50
Age
(Ma)
δ18O (‰)Cibicidoides spp.Cibicidoides grimsdaleiOridorsalis umbonatusOridorsalis umbonatus adj. Cibicidoides spp.Hanzawaia ammophilaHanzawaia ammophila adj. Cibicidoides spp.
> 15
00 m
Late
ear
lyE
ocen
eLa
te O
ligoc
ene
Upp
er m
iddl
e E
ocen
e
Pal
eo w
ater
dep
th >
700
m
25,00
30,00
35,00
40,00
45,00
50,00-2,50-1,50-0,500,501,502,50
Age
(Ma)
δ13C (‰)Cibicidoides spp.Cibicidoides grimsdaleiOridorsalis umbonatusOridorsalis umbonatus adj. Cibicidoides spp.Hanzawaia ammophilaHanzawaia ammophila adj. Cibicidoides spp.
> 15
00 m
Late
ear
lyE
ocen
eLa
te O
ligoc
ene
Upp
er m
iddl
e E
ocen
e
Pal
eo w
ater
dep
th >
700
m
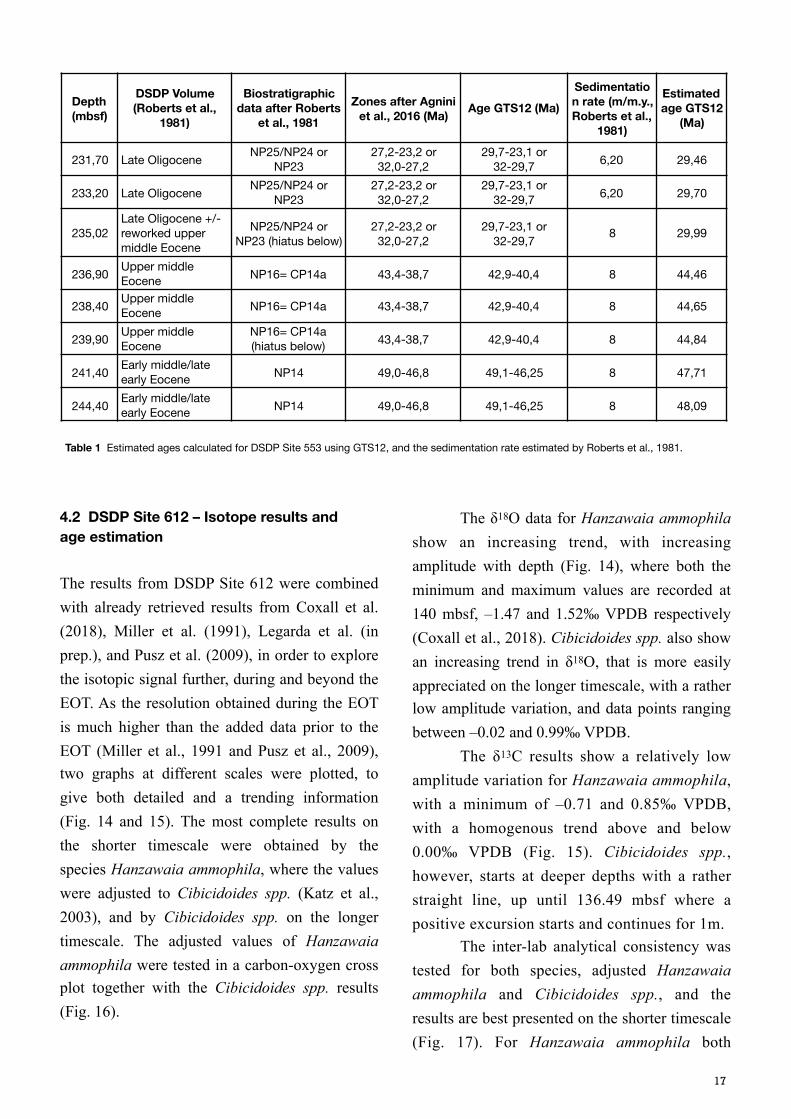
4.2 DSDP Site 612 – Isotope results and age estimation
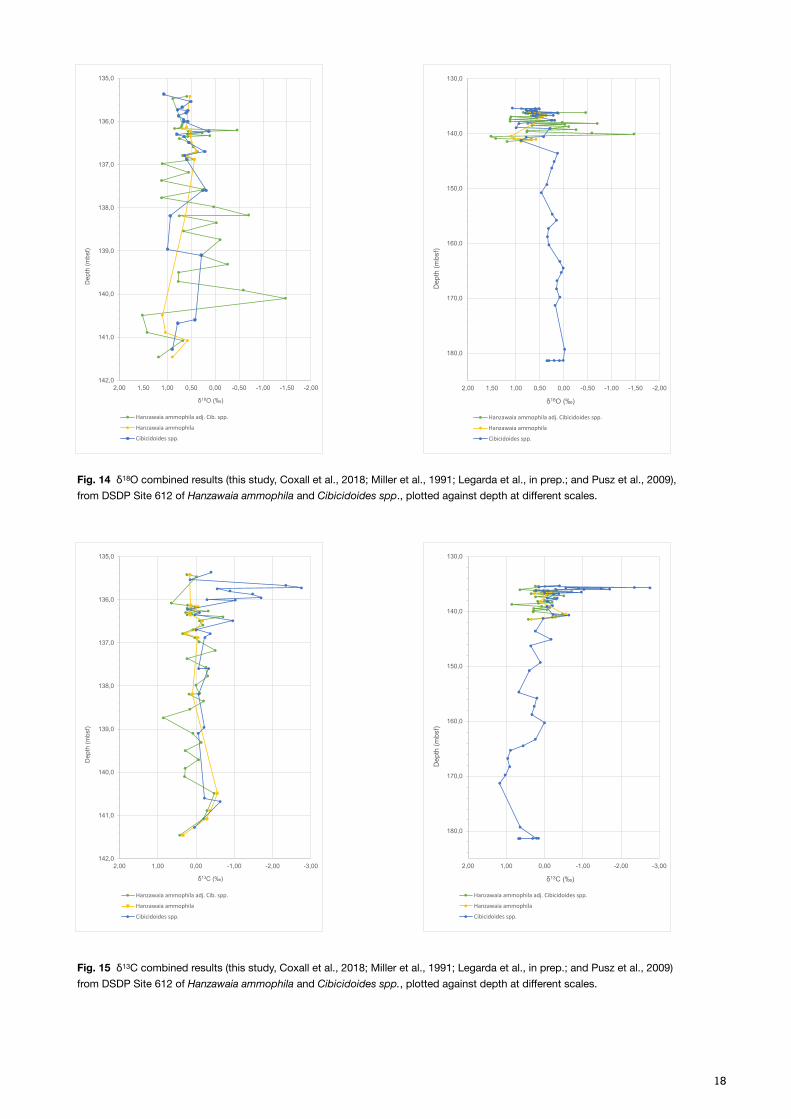
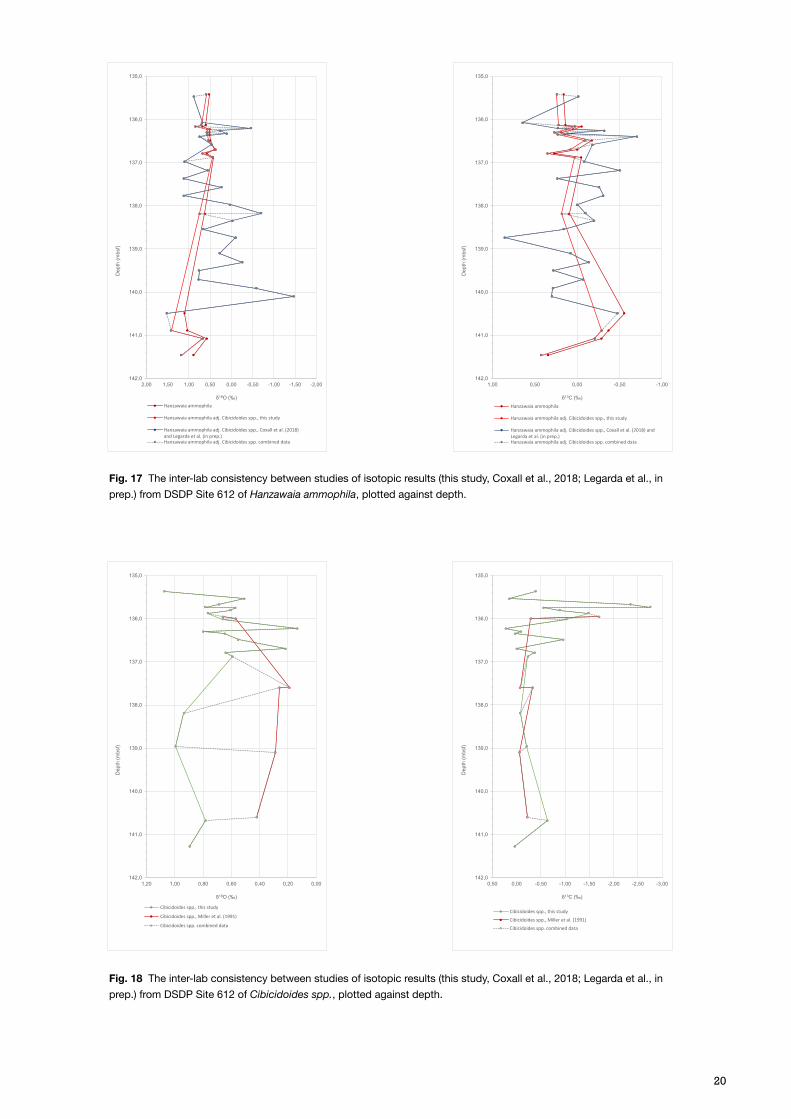
The results from DSDP Site 612 were combined with already retrieved results from Coxall et al. (2018), Miller et al. (1991), Legarda et al. (in prep.), and Pusz et al. (2009), in order to explore the isotopic signal further, during and beyond the EOT. As the resolution obtained during the EOT is much higher than the added data prior to the EOT (Miller et al., 1991 and Pusz et al., 2009), two graphs at different scales were plotted, to give both detailed and a trending information (Fig. 14 and 15). The most complete results on the shorter timescale were obtained by the species Hanzawaia ammophila, where the values were adjusted to Cibicidoides spp. (Katz et al., 2003), and by Cibicidoides spp. on the longer timescale. The adjusted values of Hanzawaia ammophila were tested in a carbon-oxygen cross plot together with the Cibicidoides spp. results (Fig. 16).
The δ18O data for Hanzawaia ammophila show an increasing trend, with increasing amplitude with depth (Fig. 14), where both the minimum and maximum values are recorded at 140 mbsf, –1.47 and 1.52‰ VPDB respectively (Coxall et al., 2018). Cibicidoides spp. also show an increasing trend in δ18O, that is more easily appreciated on the longer timescale, with a rather low amplitude variation, and data points ranging between –0.02 and 0.99‰ VPDB. The δ13C results show a relatively low amplitude variation for Hanzawaia ammophila, with a minimum of –0.71 and 0.85‰ VPDB, with a homogenous trend above and below 0.00‰ VPDB (Fig. 15). Cibicidoides spp., however, starts at deeper depths with a rather straight line, up until 136.49 mbsf where a positive excursion starts and continues for 1m. The inter-lab analytical consistency was tested for both species, adjusted Hanzawaia ammophila and Cibicidoides spp., and the results are best presented on the shorter timescale (Fig. 17). For Hanzawaia ammophila both
17
Table 1 Estimated ages calculated for DSDP Site 553 using GTS12, and the sedimentation rate estimated by Roberts et al., 1981.
Depth (mbsf)
DSDP Volume (Roberts et al.,
1981)
Biostratigraphic data after Roberts
et al., 1981Zones after Agnini
et al., 2016 (Ma) Age GTS12 (Ma)Sedimentation rate (m/m.y., Roberts et al.,
1981)
Estimated age GTS12
(Ma)
231,70 Late Oligocene NP25/NP24 or NP23
27,2-23,2 or 32,0-27,2
29,7-23,1 or 32-29,7 6,20 29,46
233,20 Late Oligocene NP25/NP24 or NP23
27,2-23,2 or 32,0-27,2
29,7-23,1 or 32-29,7 6,20 29,70
235,02Late Oligocene +/-reworked upper middle Eocene
NP25/NP24 or NP23 (hiatus below)
27,2-23,2 or 32,0-27,2
29,7-23,1 or 32-29,7 8 29,99
236,90 Upper middle Eocene NP16= CP14a 43,4-38,7 42,9-40,4 8 44,46
238,40 Upper middle Eocene NP16= CP14a 43,4-38,7 42,9-40,4 8 44,65
239,90 Upper middle Eocene
NP16= CP14a (hiatus below) 43,4-38,7 42,9-40,4 8 44,84
241,40 Early middle/late early Eocene NP14 49,0-46,8 49,1-46,25 8 47,71
244,40 Early middle/late early Eocene NP14 49,0-46,8 49,1-46,25 8 48,09
130,0
140,0
150,0
160,0
170,0
180,0
-2,00-1,50-1,00-0,500,000,501,001,502,00
Dep
th (m
bsf)
δ18O (‰)
Hanzawaia ammophila adj. Cibicidoides spp.
Hanzawaia ammophila
Cibicidoides spp.
135,0
136,0
137,0
138,0
139,0
140,0
141,0
142,0-2,00-1,50-1,00-0,500,000,501,001,502,00
Dep
th (m
bsf)
δ18O (‰)
Hanzawaia ammophila adj. Cib. spp.
Hanzawaia ammophila
Cibicidoides spp.
130,0
140,0
150,0
160,0
170,0
180,0
-3,00-2,00-1,000,001,002,00
Dep
th (m
bsf)
δ13C (‰)
Hanzawaia ammophila adj. Cibicidoides spp.
Hanzawaia ammophila
Cibicidoides spp.
135,0
136,0
137,0
138,0
139,0
140,0
141,0
142,0-3,00-2,00-1,000,001,002,00
Dep
th (m
bsf)
δ13C (‰)
Hanzawaia ammophila adj. Cib. spp.
Hanzawaia ammophila
Cibicidoides spp.
Fig. 14 δ18O combined results (this study, Coxall et al., 2018; Miller et al., 1991; Legarda et al., in prep.; and Pusz et al., 2009), from DSDP Site 612 of Hanzawaia ammophila and Cibicidoides spp., plotted against depth at different scales.
Fig. 15 δ13C combined results (this study, Coxall et al., 2018; Miller et al., 1991; Legarda et al., in prep.; and Pusz et al., 2009) from DSDP Site 612 of Hanzawaia ammophila and Cibicidoides spp., plotted against depth at different scales.
18

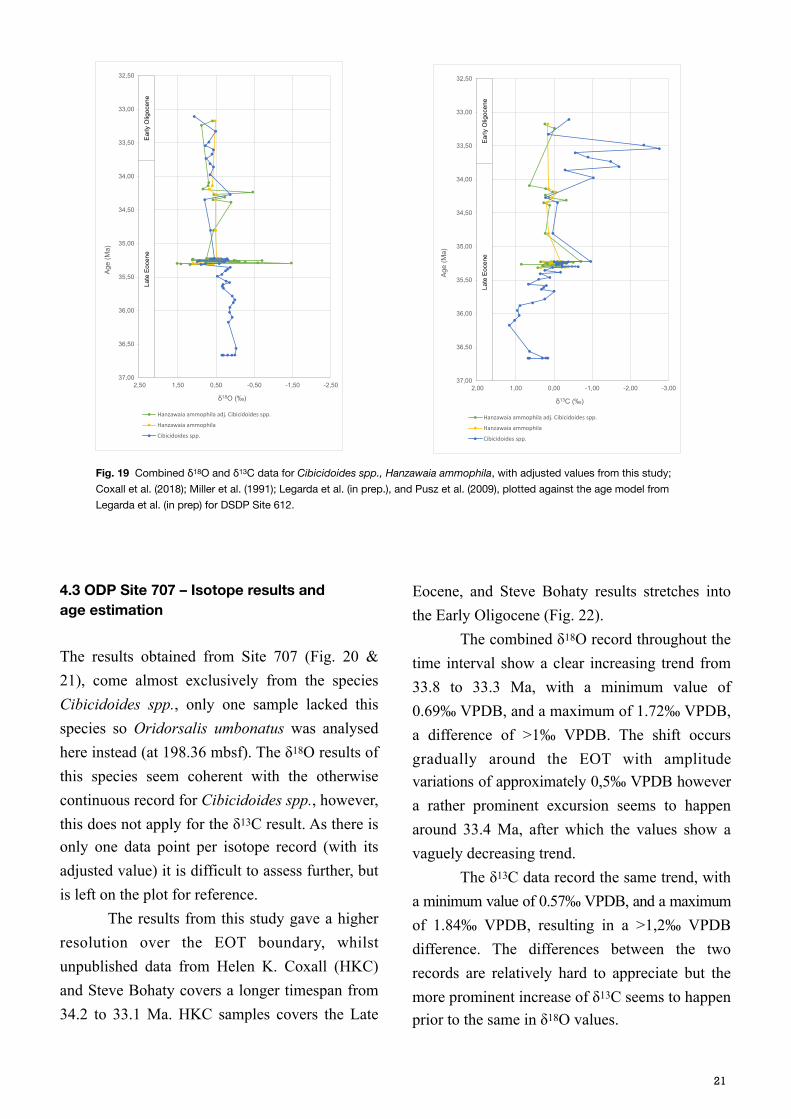
oxygen and carbon isotopic results seem to relate and follow the same trend. For Cibicidoides spp. the δ13C results seem coherent, but not the δ18O data (Fig. 18). Both curves record a final increase, but up until then they are widely separated by >1‰ VPDB of difference. This could be explained with the lack of resolution at these depths in the record, however the consistent difference is striking. A higher resolution analysis would be required to answer to this concern and validate the data credibility. The age model for Site 612 from Legarda et al. (in prep.), based on the Geological Time Scale 2012 (Vandenberghe et al., 2012), was used to plot all the combined data from this and other previously mentioned studies, against age (Ma) (Fig. 19). The δ18O record for Hanzawaia ammophila adjusted values has a large amplitude variation between 35.5 and 35 Ma, after which it seems to level out (although the resolution is also poorer) until 34.25 Ma where a negative excursion is recorded. After this the resolution turns even poorer and it is difficult to properly assess any isotopic trend, but it seems to head towards more positive values (Fig. 19). Cibicidoides spp., δ18O values show a gradually increasing trend from late Eocene to Early Oligocene, with a positive excursion, but with lower amplitude around the same time as Hanzawaia ammophila adjusted values, at 34.3 Ma. The δ13C record for both species records a relatively high amplitude variation around 35.25 Ma that ends in a positive excursion at approximately 32.2 Ma, after which both records return to values slightly above and below 0,0‰ VPDB. The δ13C results for Hanzawaia ammophila record a negative excursion of 0.64‰ VPDB, coming from values above 0.0‰ VPDB at 34.1 Ma, and then return to values close to 0.0‰ VPDB, but with very low resolution. For Cibicidoides spp., however the trend is the opposite, several data points
showing a longer excursion, from 34.2 to 33.5 Ma, after which it possibly stabilises, although higher resolution is needed to make a convinced statement. These age referenced data points are lacking in the Hanzawaia ammophila δ13C record so it is not possible with the obtained data to say whether both species would have recorded the same negative excursion throughout this time interval at Site 612.
Fig. 16 The adjusted values of Hanzawaia ammophila are compared to the Cibicidoides spp. results from DSDP Site 612, in a carbon-oxygen cross-plot.
-3,00
-2,50
-2,00
-1,50
-1,00
-0,50
0,00
0,50
1,00
0,000,200,400,600,801,001,201,401,60
δ13 C
(‰)
δ18O (‰)
Hanzawaia ammophila adj. Cibicidoides spp.Cibicidoides spp.
19
20
135,0
136,0
137,0
138,0
139,0
140,0
141,0
142,0-3,00-2,50-2,00-1,50-1,00-0,500,000,50
Dep
th (m
bsf)
δ13C (‰)
Cibicidoides spp., this study
Cibicidoides spp., Miller et al. (1991)
Cibicidoides spp. combined data
135,0
136,0
137,0
138,0
139,0
140,0
141,0
142,00,000,200,400,600,801,001,20
Dep
th (m
bsf)
δ18O (‰)
Cibicidoides spp., this study
Cibicidoides spp., Miller et al. (1991)
Cibicidoides spp. combined data
135,0
136,0
137,0
138,0
139,0
140,0
141,0
142,0-1,00-0,500,000,501,00
Dep
th (m
bsf)
δ13C (‰)Hanzawaia ammophila
Hanzawaia ammophila adj. Cibicidoides spp., this study
Hanzawaia ammophila adj. Cibicidoides spp., Coxall et al. (2018) andLegarda et al. (in prep.)Hanzawaia ammophila adj. Cibicidoides spp. combined data
135,0
136,0
137,0
138,0
139,0
140,0
141,0
142,0-2,00-1,50-1,00-0,500,000,501,001,502,00
Dep
th (m
bsf)
δ18O (‰)Hanzawaia ammophila
Hanzawaia ammophila adj. Cibicidoides spp., this study
Hanzawaia ammophila adj. Cibicidoides spp., Coxall et al. (2018)and Legarda et al. (in prep.)Hanzawaia ammophila adj. Cibicidoides spp. combined data
Fig. 17 The inter-lab consistency between studies of isotopic results (this study, Coxall et al., 2018; Legarda et al., in prep.) from DSDP Site 612 of Hanzawaia ammophila, plotted against depth.
Fig. 18 The inter-lab consistency between studies of isotopic results (this study, Coxall et al., 2018; Legarda et al., in prep.) from DSDP Site 612 of Cibicidoides spp., plotted against depth.
4.3 ODP Site 707 – Isotope results and age estimation
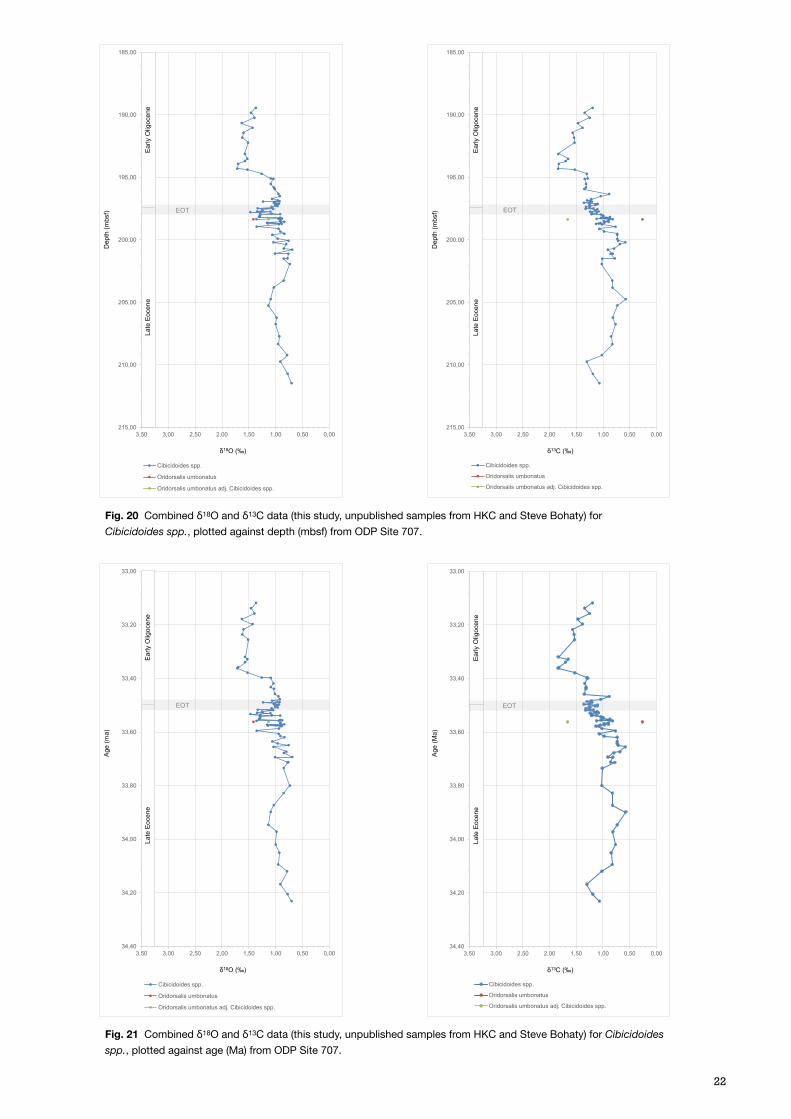
The results obtained from Site 707 (Fig. 20 & 21), come almost exclusively from the species Cibicidoides spp., only one sample lacked this species so Oridorsalis umbonatus was analysed here instead (at 198.36 mbsf). The δ18O results of this species seem coherent with the otherwise continuous record for Cibicidoides spp., however, this does not apply for the δ13C result. As there is only one data point per isotope record (with its adjusted value) it is difficult to assess further, but is left on the plot for reference. The results from this study gave a higher resolution over the EOT boundary, whilst unpublished data from Helen K. Coxall (HKC) and Steve Bohaty covers a longer timespan from 34.2 to 33.1 Ma. HKC samples covers the Late
Eocene, and Steve Bohaty results stretches into the Early Oligocene (Fig. 22). The combined δ18O record throughout the time interval show a clear increasing trend from 33.8 to 33.3 Ma, with a minimum value of 0.69‰ VPDB, and a maximum of 1.72‰ VPDB, a difference of >1‰ VPDB. The shift occurs gradually around the EOT with amplitude variations of approximately 0,5‰ VPDB however a rather prominent excursion seems to happen around 33.4 Ma, after which the values show a vaguely decreasing trend. The δ13C data record the same trend, with a minimum value of 0.57‰ VPDB, and a maximum of 1.84‰ VPDB, resulting in a >1,2‰ VPDB difference. The differences between the two records are relatively hard to appreciate but the more prominent increase of δ13C seems to happen prior to the same in δ18O values.
21
32,50
33,00
33,50
34,00
34,50
35,00
35,50
36,00
36,50
37,00-2,50-1,50-0,500,501,502,50
Age
(Ma)
δ18O (‰)
Hanzawaia ammophila adj. Cibicidoides spp.
Hanzawaia ammophila
Cibicidoides spp.
Late
Eoc
ene
Ear
ly O
ligoc
ene
32,50
33,00
33,50
34,00
34,50
35,00
35,50
36,00
36,50
37,00-3,00-2,00-1,000,001,002,00
Age
(Ma)
δ13C (‰)
Hanzawaia ammophila adj. Cibicidoides spp.
Hanzawaia ammophila
Cibicidoides spp.
Late
Eoc
ene
Ear
ly O
ligoc
ene
Fig. 19 Combined δ18O and δ13C data for Cibicidoides spp., Hanzawaia ammophila, with adjusted values from this study; Coxall et al. (2018); Miller et al. (1991); Legarda et al. (in prep.), and Pusz et al. (2009), plotted against the age model from Legarda et al. (in prep) for DSDP Site 612.
33,00
33,20
33,40
33,60
33,80
34,00
34,20
34,400,000,501,001,502,002,503,003,50
Age
(Ma)
δ13C (‰)
Cibicidoides spp.
Oridorsalis umbonatus
Oridorsalis umbonatus adj. Cibicidoides spp.
Early
Olig
ocen
eLa
te E
ocen
e
EOT
185,00
190,00
195,00
200,00
205,00
210,00
215,000,000,501,001,502,002,503,003,50
Dep
th (m
bsf)
δ13C (‰)
Cibicidoides spp.
Oridorsalis umbonatus
Oridorsalis umbonatus adj. Cibicidoides spp.
Early
Olig
ocen
eLa
te E
ocen
e
EOT
185,00
190,00
195,00
200,00
205,00
210,00
215,000,000,501,001,502,002,503,003,50
Dep
th (m
bsf)
δ18O (‰)
Cibicidoides spp.
Oridorsalis umbonatus
Oridorsalis umbonatus adj. Cibicidoides spp.
Early
Olig
ocen
eLa
te E
ocen
e
EOT
22
Fig. 20 Combined δ18O and δ13C data (this study, unpublished samples from HKC and Steve Bohaty) for Cibicidoides spp., plotted against depth (mbsf) from ODP Site 707.
Fig. 21 Combined δ18O and δ13C data (this study, unpublished samples from HKC and Steve Bohaty) for Cibicidoides spp., plotted against age (Ma) from ODP Site 707.
33,00
33,20
33,40
33,60
33,80
34,00
34,20
34,400,000,501,001,502,002,503,003,50
Age
(ma)
δ18O (‰)
Cibicidoides spp.
Oridorsalis umbonatus
Oridorsalis umbonatus adj. Cibicidoides spp.
Early
Olig
ocen
eLa
te E
ocen
e
EOT
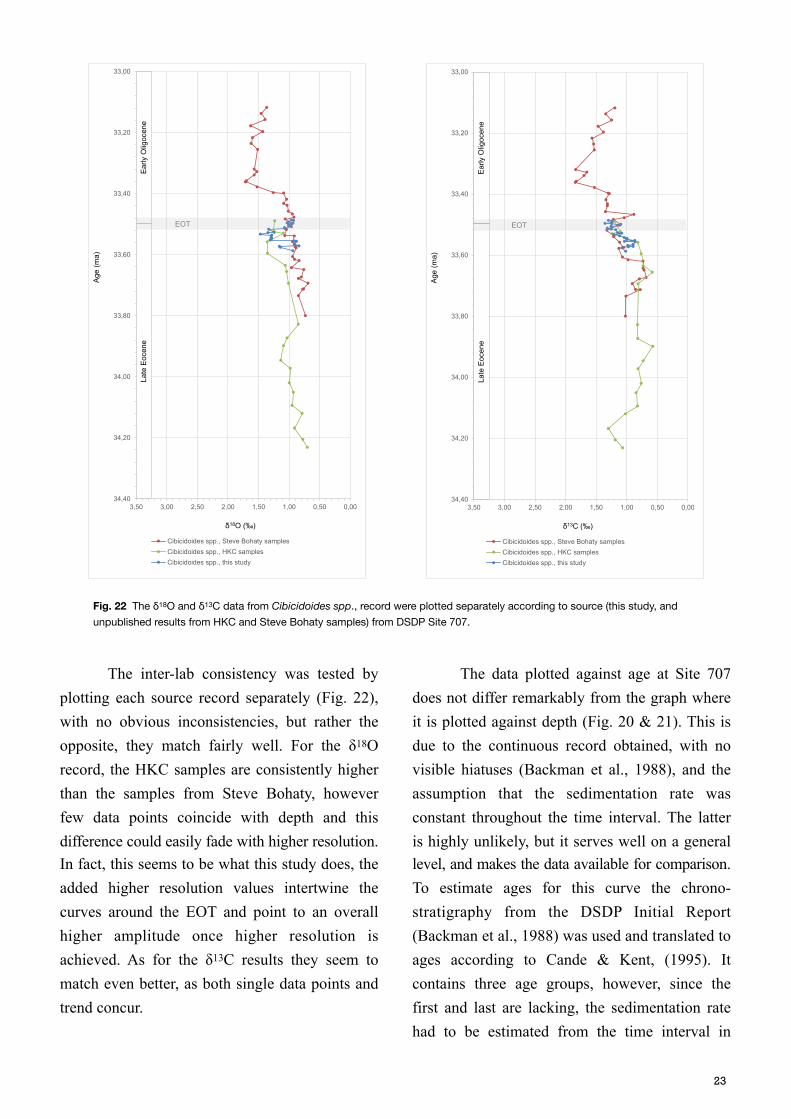
The inter-lab consistency was tested by plotting each source record separately (Fig. 22), with no obvious inconsistencies, but rather the opposite, they match fairly well. For the δ18O record, the HKC samples are consistently higher than the samples from Steve Bohaty, however few data points coincide with depth and this difference could easily fade with higher resolution. In fact, this seems to be what this study does, the added higher resolution values intertwine the curves around the EOT and point to an overall higher amplitude once higher resolution is achieved. As for the δ13C results they seem to match even better, as both single data points and trend concur.
The data plotted against age at Site 707 does not differ remarkably from the graph where it is plotted against depth (Fig. 20 & 21). This is due to the continuous record obtained, with no visible hiatuses (Backman et al., 1988), and the assumption that the sedimentation rate was constant throughout the time interval. The latter is highly unlikely, but it serves well on a general level, and makes the data available for comparison. To estimate ages for this curve the chrono-stratigraphy from the DSDP Initial Report (Backman et al., 1988) was used and translated to ages according to Cande & Kent, (1995). It contains three age groups, however, since the first and last are lacking, the sedimentation rate had to be estimated from the time interval in
23
33,00
33,20
33,40
33,60
33,80
34,00
34,20
34,400,000,501,001,502,002,503,003,50
Age
(ma)
δ13C (‰)
Cibicidoides spp., Steve Bohaty samplesCibicidoides spp., HKC samplesCibicidoides spp., this study
Early
Olig
ocen
eLa
te E
ocen
e
EOT
33,00
33,20
33,40
33,60
33,80
34,00
34,20
34,400,000,501,001,502,002,503,003,50
Age
(ma)
δ18O (‰)
Cibicidoides spp., Steve Bohaty samplesCibicidoides spp., HKC samplesCibicidoides spp., this study
Early
Olig
ocen
eLa
te E
ocen
e
EOT
Fig. 22 The δ18O and δ13C data from Cibicidoides spp., record were plotted separately according to source (this study, and unpublished results from HKC and Steve Bohaty samples) from DSDP Site 707.
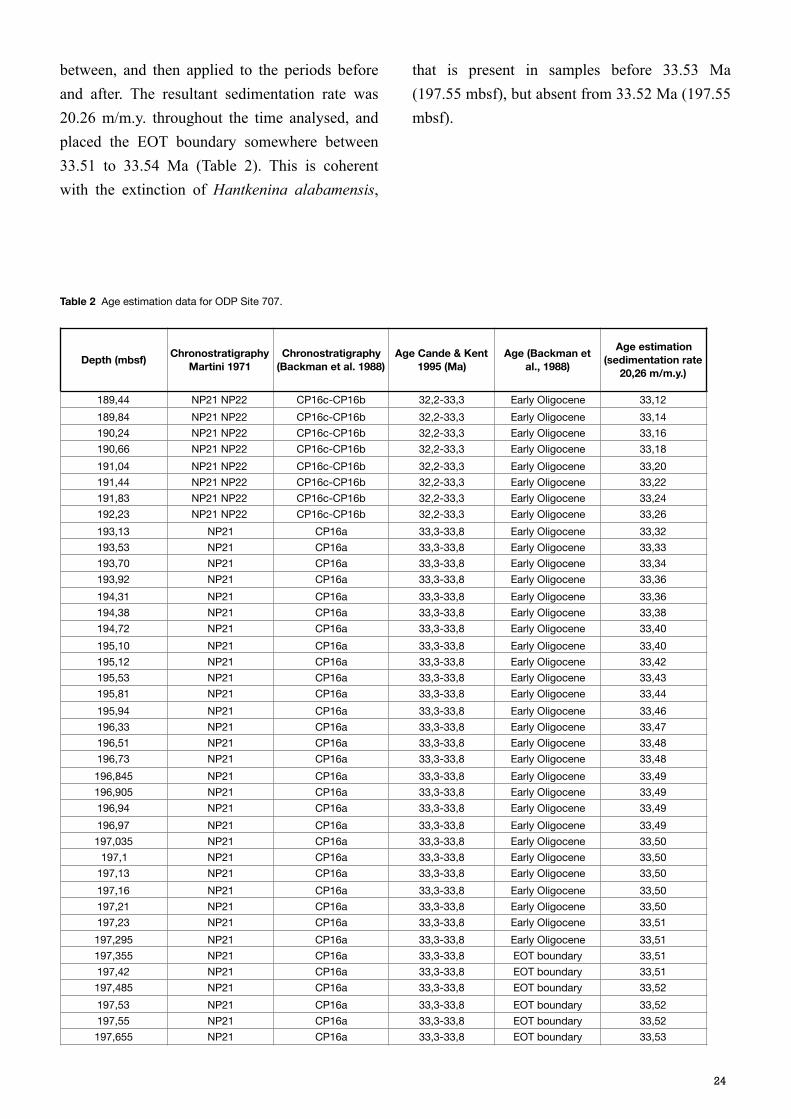
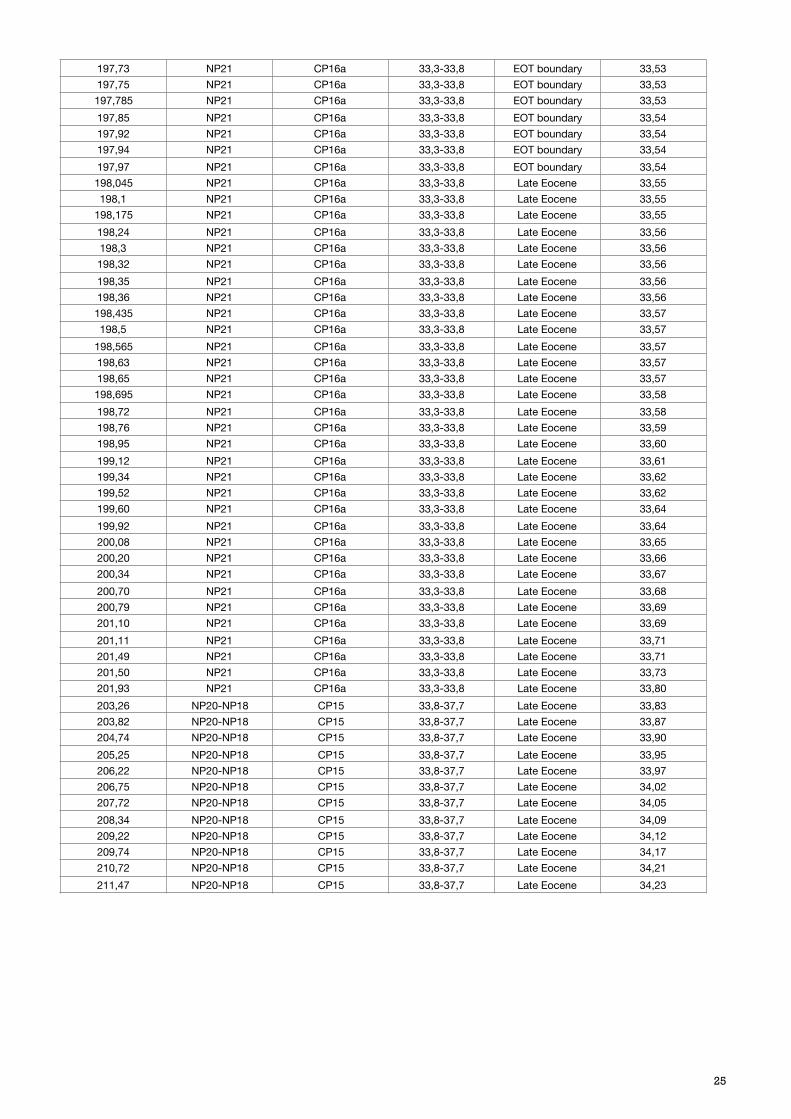
between, and then applied to the periods before and after. The resultant sedimentation rate was 20.26 m/m.y. throughout the time analysed, and placed the EOT boundary somewhere between 33.51 to 33.54 Ma (Table 2). This is coherent with the extinction of Hantkenina alabamensis,
that is present in samples before 33.53 Ma (197.55 mbsf), but absent from 33.52 Ma (197.55 mbsf).
Table 2 Age estimation data for ODP Site 707.
Depth (mbsf) Chronostratigraphy Martini 1971
Chronostratigraphy (Backman et al. 1988)
Age Cande & Kent 1995 (Ma)
Age (Backman et al., 1988)
Age estimation (sedimentation rate
20,26 m/m.y.)
189,44 NP21 NP22 CP16c-CP16b 32,2-33,3 Early Oligocene 33,12189,84 NP21 NP22 CP16c-CP16b 32,2-33,3 Early Oligocene 33,14190,24 NP21 NP22 CP16c-CP16b 32,2-33,3 Early Oligocene 33,16190,66 NP21 NP22 CP16c-CP16b 32,2-33,3 Early Oligocene 33,18191,04 NP21 NP22 CP16c-CP16b 32,2-33,3 Early Oligocene 33,20191,44 NP21 NP22 CP16c-CP16b 32,2-33,3 Early Oligocene 33,22191,83 NP21 NP22 CP16c-CP16b 32,2-33,3 Early Oligocene 33,24192,23 NP21 NP22 CP16c-CP16b 32,2-33,3 Early Oligocene 33,26193,13 NP21 CP16a 33,3-33,8 Early Oligocene 33,32193,53 NP21 CP16a 33,3-33,8 Early Oligocene 33,33193,70 NP21 CP16a 33,3-33,8 Early Oligocene 33,34193,92 NP21 CP16a 33,3-33,8 Early Oligocene 33,36194,31 NP21 CP16a 33,3-33,8 Early Oligocene 33,36194,38 NP21 CP16a 33,3-33,8 Early Oligocene 33,38194,72 NP21 CP16a 33,3-33,8 Early Oligocene 33,40195,10 NP21 CP16a 33,3-33,8 Early Oligocene 33,40195,12 NP21 CP16a 33,3-33,8 Early Oligocene 33,42195,53 NP21 CP16a 33,3-33,8 Early Oligocene 33,43195,81 NP21 CP16a 33,3-33,8 Early Oligocene 33,44195,94 NP21 CP16a 33,3-33,8 Early Oligocene 33,46196,33 NP21 CP16a 33,3-33,8 Early Oligocene 33,47196,51 NP21 CP16a 33,3-33,8 Early Oligocene 33,48196,73 NP21 CP16a 33,3-33,8 Early Oligocene 33,48196,845 NP21 CP16a 33,3-33,8 Early Oligocene 33,49196,905 NP21 CP16a 33,3-33,8 Early Oligocene 33,49196,94 NP21 CP16a 33,3-33,8 Early Oligocene 33,49196,97 NP21 CP16a 33,3-33,8 Early Oligocene 33,49197,035 NP21 CP16a 33,3-33,8 Early Oligocene 33,50
197,1 NP21 CP16a 33,3-33,8 Early Oligocene 33,50197,13 NP21 CP16a 33,3-33,8 Early Oligocene 33,50197,16 NP21 CP16a 33,3-33,8 Early Oligocene 33,50197,21 NP21 CP16a 33,3-33,8 Early Oligocene 33,50197,23 NP21 CP16a 33,3-33,8 Early Oligocene 33,51197,295 NP21 CP16a 33,3-33,8 Early Oligocene 33,51197,355 NP21 CP16a 33,3-33,8 EOT boundary 33,51197,42 NP21 CP16a 33,3-33,8 EOT boundary 33,51197,485 NP21 CP16a 33,3-33,8 EOT boundary 33,52197,53 NP21 CP16a 33,3-33,8 EOT boundary 33,52197,55 NP21 CP16a 33,3-33,8 EOT boundary 33,52197,655 NP21 CP16a 33,3-33,8 EOT boundary 33,53
24
197,73 NP21 CP16a 33,3-33,8 EOT boundary 33,53197,75 NP21 CP16a 33,3-33,8 EOT boundary 33,53197,785 NP21 CP16a 33,3-33,8 EOT boundary 33,53197,85 NP21 CP16a 33,3-33,8 EOT boundary 33,54197,92 NP21 CP16a 33,3-33,8 EOT boundary 33,54197,94 NP21 CP16a 33,3-33,8 EOT boundary 33,54197,97 NP21 CP16a 33,3-33,8 EOT boundary 33,54198,045 NP21 CP16a 33,3-33,8 Late Eocene 33,55198,1 NP21 CP16a 33,3-33,8 Late Eocene 33,55
198,175 NP21 CP16a 33,3-33,8 Late Eocene 33,55198,24 NP21 CP16a 33,3-33,8 Late Eocene 33,56198,3 NP21 CP16a 33,3-33,8 Late Eocene 33,56198,32 NP21 CP16a 33,3-33,8 Late Eocene 33,56198,35 NP21 CP16a 33,3-33,8 Late Eocene 33,56198,36 NP21 CP16a 33,3-33,8 Late Eocene 33,56198,435 NP21 CP16a 33,3-33,8 Late Eocene 33,57198,5 NP21 CP16a 33,3-33,8 Late Eocene 33,57
198,565 NP21 CP16a 33,3-33,8 Late Eocene 33,57198,63 NP21 CP16a 33,3-33,8 Late Eocene 33,57198,65 NP21 CP16a 33,3-33,8 Late Eocene 33,57198,695 NP21 CP16a 33,3-33,8 Late Eocene 33,58198,72 NP21 CP16a 33,3-33,8 Late Eocene 33,58198,76 NP21 CP16a 33,3-33,8 Late Eocene 33,59198,95 NP21 CP16a 33,3-33,8 Late Eocene 33,60199,12 NP21 CP16a 33,3-33,8 Late Eocene 33,61199,34 NP21 CP16a 33,3-33,8 Late Eocene 33,62199,52 NP21 CP16a 33,3-33,8 Late Eocene 33,62199,60 NP21 CP16a 33,3-33,8 Late Eocene 33,64199,92 NP21 CP16a 33,3-33,8 Late Eocene 33,64200,08 NP21 CP16a 33,3-33,8 Late Eocene 33,65200,20 NP21 CP16a 33,3-33,8 Late Eocene 33,66200,34 NP21 CP16a 33,3-33,8 Late Eocene 33,67200,70 NP21 CP16a 33,3-33,8 Late Eocene 33,68200,79 NP21 CP16a 33,3-33,8 Late Eocene 33,69201,10 NP21 CP16a 33,3-33,8 Late Eocene 33,69201,11 NP21 CP16a 33,3-33,8 Late Eocene 33,71201,49 NP21 CP16a 33,3-33,8 Late Eocene 33,71201,50 NP21 CP16a 33,3-33,8 Late Eocene 33,73201,93 NP21 CP16a 33,3-33,8 Late Eocene 33,80203,26 NP20-NP18 CP15 33,8-37,7 Late Eocene 33,83203,82 NP20-NP18 CP15 33,8-37,7 Late Eocene 33,87204,74 NP20-NP18 CP15 33,8-37,7 Late Eocene 33,90205,25 NP20-NP18 CP15 33,8-37,7 Late Eocene 33,95206,22 NP20-NP18 CP15 33,8-37,7 Late Eocene 33,97206,75 NP20-NP18 CP15 33,8-37,7 Late Eocene 34,02207,72 NP20-NP18 CP15 33,8-37,7 Late Eocene 34,05208,34 NP20-NP18 CP15 33,8-37,7 Late Eocene 34,09209,22 NP20-NP18 CP15 33,8-37,7 Late Eocene 34,12209,74 NP20-NP18 CP15 33,8-37,7 Late Eocene 34,17210,72 NP20-NP18 CP15 33,8-37,7 Late Eocene 34,21211,47 NP20-NP18 CP15 33,8-37,7 Late Eocene 34,23
25

5 DISCUSSION
5.1 DSDP Site 553
DSDP Site 553 provided few data points at depths estimated to range over a large timespan, which is clearly visible once put into the context of all obtained results (Fig. 23). Due to the long hiatuses, this is a low resolution record, and as the actual transition into the Oligocene is completely lacking the data does not weigh heavy is this study, that aims to establish the oceanic conditions at this specific time. Coxall et al. (2018) have analysed both the δ18O and δ13C signature for multiple Atlantic sites, together with other proxies (fish debris and Mg/Ca ratio), to trace the initiation of NCW, its leakage into the subarctic oceans, and the subsequent export to the North Atlantic. In their study, there is a prominent difference between Site 647 in the South Labrador Sea (SLS) and all other more southerly sites, as it initially records a much lower δ13C signal, which gradually increases and end of the record, and become similar to the modern NADW signature. This has been interpreted as a sign of an isolated water mass that changed temperature and salinity characteristics, enough to start convection, just south of the GSR. As the circulation pattern was established, it enabled mixing, and the previously stagnated water mass at this site adopted a more similar isotopic signature to the rest of the Atlantic ocean (Fig. 24). Site 553 records low δ13C values prior to the Oligocene (∼0–0.5‰ VDPB), coherent with the results from Site 647 in the Labrador Sea (Coxall et al., 2018), and indicates nutrient-rich and poorly ventilated waters up to at least 44 Ma. It implies that there was little or no water mass movement at this location and that any kind of global circulation pattern would have been initiated later. It also connects the North East
Atlantic with the Labrador Sea, indicating a large homogeneous water mass in the North Atlantic prior to the EOT. Further, Site 553 does seem to record the global increase in δ18O and δ13C values after the transition to the cooler climate of the Oligocene. The higher δ13C values may also be a sign of increased mixing. To take into consideration, is the palaeo depth of this site (700–1500 m), that may not have been deep enough to record the deep water characteristics, especially throughout the Eocene when it was likely to be shallower (>700 m). Site 553 serves best as additional data to better resolution records than providing a coherent reliable isotopic signal throughout the Eocene-Oligocene, and does not contain the characteristic and globally present two-step isotopic shift, that marks the EOT.
26

Fig. 23 Combined δ18O and δ13C from all analysed sites; DSDP 553, DSDP 612 and ODP 707, plotted against age (Ma).
27
27
32
37
42
47
-2,50-1,50-0,500,501,502,503,50
Age
(Ma)
δ18O (‰)Site 553 Cibicidoides spp.Site 553 Cibicidoides grimsdaleiSite 553 Oridorsalis umbonatusSite 553 Oridorsalis umbonatus adj. CibicidoidesSite 553 Hanzawaia ammophilaSite 553 Hanzawaia ammophila adj. CibicidoidesSite 612 Cibicidoides spp.Site 612 Hanzawaia ammophilaSite 612 Hanzawaia ammophila adj. CibicidoidesSite 707 Cibicidoides spp.Site 707 Oridorsalis umbonatusSite 707 Oridorsalis umbonatus adj. Cibicidoides
Late
Eoc
ene
Ear
ly O
ligoc
ene
EOT
27
32
37
42
47
-3,50-2,50-1,50-0,500,501,502,50
Age
(Ma)
δ13C (‰)
Site 553 Cibicidoides spp.Site 553 Cibicidoides grimsdaleiSite 553 Oridorsalis umbonatusSite 553 Oridorsalis umbonatus adj. CibicidoidesSite 553 Hanzawaia ammophilaSite 553 Hanzawaia ammophila adj. CibicidoidesSite 612 Cibicidoides spp.Site 612 Hanzawaia ammophilaSite 612 Hanzawaia ammophila adj. CibicidoidesSite 707 Cibicidoides spp.Site 707 Oridorsalis umbonatusSite 707 Oridorsalis umbonatus adj. Cibicidoides
Late
Eoc
ene
Ear
ly O
ligoc
ene
EOT
5.2 DSDP Site 612 and ODP Site 707
The additional isotope data from Hanzawaia ammophila for DSDP Site 612 from this study falls within the amplitude of the already existing record, and does not provide any new excursions, but rather ‘stabilises' it by making the recorded excursions somewhat gradual (Fig. 17), and therefore supports the trend of the existing data. As for the δ18O signature of the species Cibicidoides spp., the additional data adds amplitude to the existing record from Miller et al. (1991), the most shallow depths excluded (Fig. 18). This could be an inter-lab consistency error as previously mentioned, however, since the δ13C does not exhibit the same difference, it is perhaps more likely that this record was indeed less stable than it appeared, and that an even higher resolution would record the higher amplitude and help to reinforce this statement.
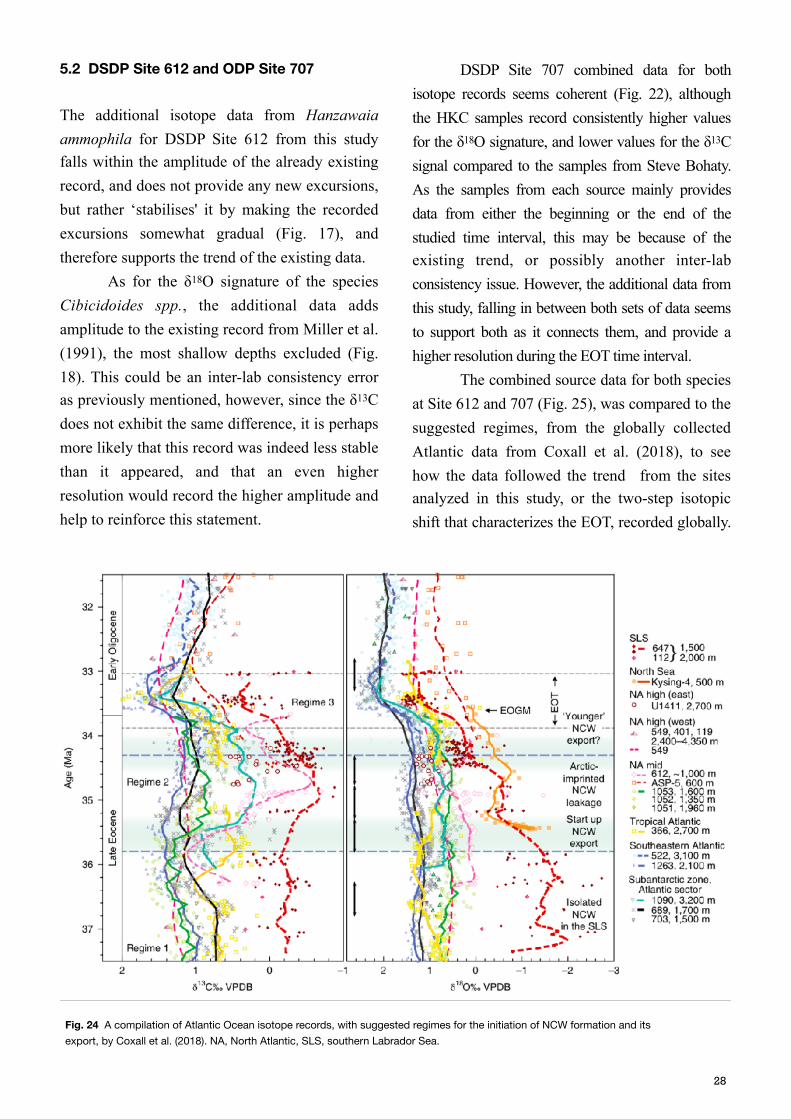
DSDP Site 707 combined data for both isotope records seems coherent (Fig. 22), although the HKC samples record consistently higher values for the δ18O signature, and lower values for the δ13C signal compared to the samples from Steve Bohaty. As the samples from each source mainly provides data from either the beginning or the end of the studied time interval, this may be because of the existing trend, or possibly another inter-lab consistency issue. However, the additional data from this study, falling in between both sets of data seems to support both as it connects them, and provide a higher resolution during the EOT time interval. The combined source data for both species at Site 612 and 707 (Fig. 25), was compared to the suggested regimes, from the globally collected Atlantic data from Coxall et al. (2018), to see how the data followed the trend from the sites analyzed in this study, or the two-step isotopic shift that characterizes the EOT, recorded globally.
28
Fig. 24 A compilation of Atlantic Ocean isotope records, with suggested regimes for the initiation of NCW formation and its export, by Coxall et al. (2018). NA, North Atlantic, SLS, southern Labrador Sea.
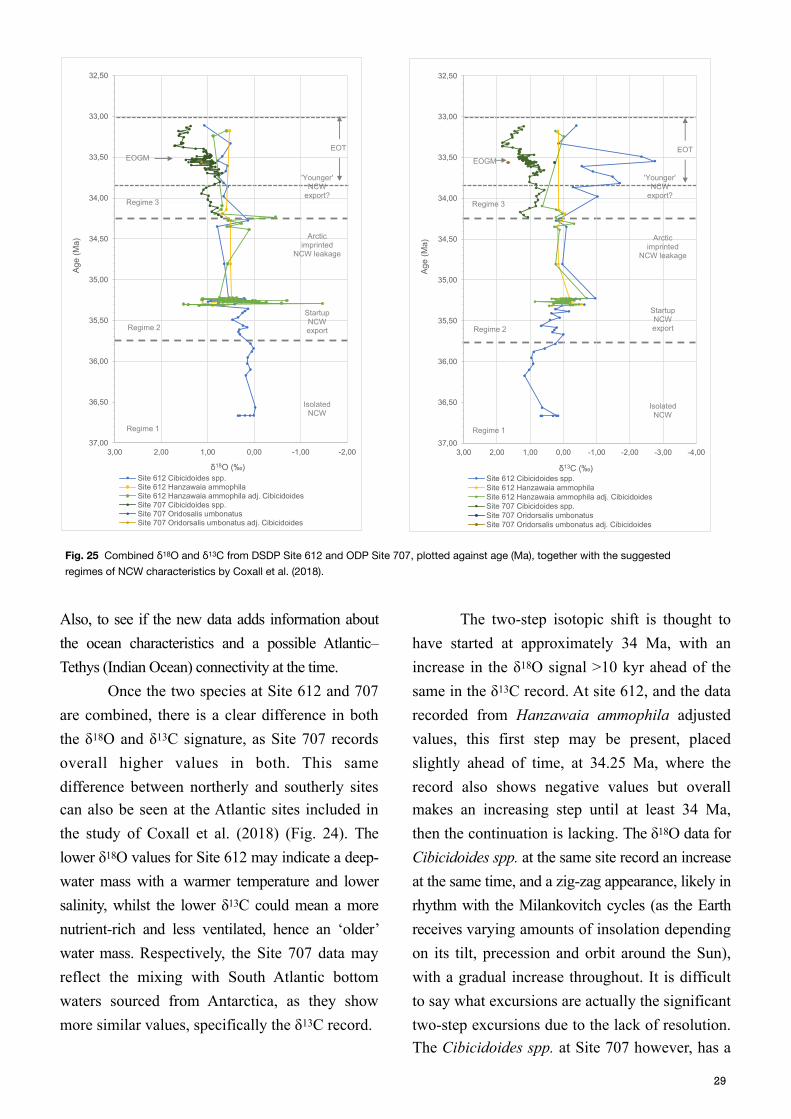
Also, to see if the new data adds information about the ocean characteristics and a possible Atlantic–Tethys (Indian Ocean) connectivity at the time. Once the two species at Site 612 and 707 are combined, there is a clear difference in both the δ18O and δ13C signature, as Site 707 records overall higher values in both. This same difference between northerly and southerly sites can also be seen at the Atlantic sites included in the study of Coxall et al. (2018) (Fig. 24). The lower δ18O values for Site 612 may indicate a deep-water mass with a warmer temperature and lower salinity, whilst the lower δ13C could mean a more nutrient-rich and less ventilated, hence an ‘older’ water mass. Respectively, the Site 707 data may reflect the mixing with South Atlantic bottom waters sourced from Antarctica, as they show more similar values, specifically the δ13C record.
The two-step isotopic shift is thought to have started at approximately 34 Ma, with an increase in the δ18O signal >10 kyr ahead of the same in the δ13C record. At site 612, and the data recorded from Hanzawaia ammophila adjusted values, this first step may be present, placed slightly ahead of time, at 34.25 Ma, where the record also shows negative values but overall makes an increasing step until at least 34 Ma, then the continuation is lacking. The δ18O data for Cibicidoides spp. at the same site record an increase at the same time, and a zig-zag appearance, likely in rhythm with the Milankovitch cycles (as the Earth receives varying amounts of insolation depending on its tilt, precession and orbit around the Sun), with a gradual increase throughout. It is difficult to say what excursions are actually the significant two-step excursions due to the lack of resolution. The Cibicidoides spp. at Site 707 however, has a
Fig. 25 Combined δ18O and δ13C from DSDP Site 612 and ODP Site 707, plotted against age (Ma), together with the suggested regimes of NCW characteristics by Coxall et al. (2018).
32,50
33,00
33,50
34,00
34,50
35,00
35,50
36,00
36,50
37,00-4,00-3,00-2,00-1,000,001,002,003,00
Age
(Ma)
δ13C (‰)Site 612 Cibicidoides spp.Site 612 Hanzawaia ammophilaSite 612 Hanzawaia ammophila adj. CibicidoidesSite 707 Cibicidoides spp.Site 707 Oridorsalis umbonatusSite 707 Oridorsalis umbonatus adj. Cibicidoides
EOTEOGM
Regime 1
Regime 2
Isolated NCW
StartupNCW export
Arctic imprinted
NCW leakage
'Younger'NCW
export?Regime 3
32,50
33,00
33,50
34,00
34,50
35,00
35,50
36,00
36,50
37,00-2,00-1,000,001,002,003,00
Age
(Ma)
δ18O (‰)Site 612 Cibicidoides spp.Site 612 Hanzawaia ammophilaSite 612 Hanzawaia ammophila adj. CibicidoidesSite 707 Cibicidoides spp.Site 707 Oridosalis umbonatusSite 707 Oridorsalis umbonatus adj. Cibicidoides
EOTEOGM
Regime 1
Regime 2
Isolated NCW
StartupNCW export
Arctic imprinted
NCW leakage
Regime 3
'Younger'NCW
export?
29
denser record throughout the transition and a two-step increase can be noted here. The first excursion starts at the same time as for Site 612, approximately 34.25 Ma (however this is also the first data point, so it could theoretically have started earlier), recording an 0.5 ‰ VPDB increase, after which a smaller decrease occurs around 34 Ma. This could be a sign of the Oi-1 event, when δ18O values increased >1‰ VPDB globally (Coxall et al., 2018). The second excursion is larger on this record, ∼1‰ VPDB, and occurs between 33.8 and 33.3 Ma. It has a similar length and the magnitude as the known signature of the Eocene Oligocene Glacial Maximum (EOGM). Coxall et al. (2018) also included data from Site 612 in their study, and noted that the recorded δ13C signal, with a negative excursion around 34.8 Ma at site 647 in the SLS, seemed to follow at this site. They suggested that this is an indication of the signal propagating from the north. The new results of this study, together with obtained δ13C data at Site 612 from Hanzawaia ammophila records two negative excursions of δ13C, the first at approximately 35.2 Ma, and the second at 34.3 Ma entering regime 3, both coinciding with the Cibicidoides spp. record, after which the δ13C signal increases >1‰ VPDB, and seemingly stabilizes (although this is hard to confirm with few data points at the end of this record). The second excursion is very prominently recorded by Cibicidoides spp. with a magnitude of ∼3‰ VPDB, and a duration of approximately 1 Ma. On this longer time perspective, and as the record for the same species at Site 707 starts at the beginning of this excursion, similarities can be appreciated with the overall negative trend over this period. It can also be seen at the other middle North Atlantic sites analysed by Coxall et al. (2018), corresponding to their decrease after an earlier peak, at approximately 34.6 Ma. Throughout this 1 Ma excursion, the
Hanzawaia ammophila record is almost completely lacking data and it seems necessary to improve the resolution of this record to be certain of the ocean characteristics at Site 612, and also understand whether these two excursion are actually one larger excursion. Nevertheless, it may well be a sign of the beginning of NCW export, and the supply of a ‘younger’, nutrient-rich water mass with a lower δ13C signature, as the deep water formation in the North Atlantic was initiated. This added carbon into the ocean circulation has been suggested to cause a short-lived pulse of CO2 increase into the Earth systems, as other proxies have showed a temporal reversal in the decreasing atmospheric CO2, between 34 and 35 Ma, by Coxall et al. (2018). The similarities between the records during ‘regime 3’, at Site 612 and Site 707 could be an indication of connectivity between the North Atlantic and the Indian Ocean. Prior to this, data from Site 707 is missing and cannot be compared, however, palaeogeographic recon-structions indicate that a Nordic Sea and Indian Ocean connection was limited during the middle to late Eocene (Akhmetiev et al., 2009, Kharin et al., 2010).
30

5.3 Palaeoceanographic interpretation
The low δ18O and δ13C results recorded at Site 553 in the Eocene supports recent modelling research, where the deep water formation is concentrated to the North Pacific and Southern Ocean (Baatsen et al., 2018; Hutchinson et al., 2018) during the Eocene, and the North Atlantic basin is filled with a warmer, stagnated, poorly ventilated water mass. Further, the almost consistent difference in higher recorded δ18O and δ13C values (∼0.5‰ and >1‰ VPDB respectively) at the southerly Indian Ocean Site 707 compared to Site 612 in the North Atlantic, indicates a colder and ‘younger’ Antarctica sourced deep water mass, and supports these studies further. However, as Site 612 and Site 707 record the same trend during ‘regime 3’ (starting at 34.25 Ma), with increasingly similar δ18O values, and also a simultaneous δ13C excursion, this could well be an indication of a North Atlantic–Indian Ocean connectivity prior to the Oi-1 event, and hence, do not support the modelling result of Goldner et al. (2014), that found the formation of the Antarctic ice sheet necessary for ocean pathway reorganisation, and the initiation of North Atlantic deep water formation.
31
6 CONCLUSIONS
The results obtained from DSDP 553, DSDP 612 and ODP 707 in this study have led to following conclusions. Site 553 does not yield a sufficient resolution record throughout the Eocene-Oligocene transition to add information about the ocean characteristics in the Nordic Sea during this time, however records a consistently low δ13C signature prior to the transition, coherent with the results from Site 647 analysed by Coxall et al. (2018), and suggests stagnated and poorly ventilated bottom waters in the East North Atlantic up to at least 44 Ma. The new data for Site 612 and 707 have supported the existing data and increased the resolution of both records, with results from Cibicidoides spp. at site 707 and Hanzawaia ammophila adjusted values at Site 612. It has also added a new record for Cibicidoides spp. at Site 612, which can be used to resolve the ocean characteristics at this location in future studies. Both species record similar results until the early Oligocene where the Cibicidoides spp. data continues, and the data for Hanzawaia ammophila adjusted values are lacking. The characteristic two-step isotopic shift is noted at Site 707, but it is not obvious at Site 612. Due to hiatuses and lack of analysed species the record lacks resolution, and this may be the reason for not visualising it clearly. The difference in resolution also makes the comparison between overall values difficult, but a consistently higher signature is recorded in the Indian Ocean, indicating a lower water mass temperature or the proximity to Antarctic ice accumulation. The palaeodepth at Site 707 is estimated to be 500–1000 m deeper, which also could be reflected on the temperature. Site 707 records overall higher values in both the δ18O and δ13C signature than Site 612,
and may indicate a warmer, ‘older’ and more nutrient-rich deep water mass at Site 612, and ‘younger’ and colder Antarctic bottom water sourced water mass at Site 707. Both Site 612 and 707 record at least one δ13C excursion, coinciding with the data analysed in Coxall et al. (2018) of multiple Atlantic sites. Hanzawaia ammophila at Site 612 records the first excursion prior to the one at Site 707 which may be a sign of NCW export. The second excursion is marked by the Cibicidoides spp. record and is not at all present in the Hanzawaia ammophila record, probably due to a lack of resolution. This second excursion may well be connected to the first, and coincides with the more gradual excursion at Site 707, and other northern or mid Atlantic sites analysed by Coxall et al. (2018). Possibly, a higher resolution record for Hanzawaia ammophila would show that the excursion had a longer duration. This would mean that Site 612 simultaneously follows the same trend as the other Atlantic sites from Coxall et al. (2018), indicating a global circulation pattern. Hence, the similarities between both Cibicidoides spp., records at Site 612 and Site 707 could be an indication of connectivity during ‘regime 3’, when supposedly the export of NCW had been established.
32
ACKNOWLEDGEMENTS
I would like to thank my two supervisors, Dr. Helen Coxall and PhD student Alba Legarda-Lisarri, for the guidance and inspiration throughout this project. From IGV, I would also like to thank Heike Siegmund (laboratory engineer) for the help in preparing and providing isotopic results, and Carina Johansson (research engineer), for the access and introduction to the laboratory work place. A special thank you goes out to Dr Rosa Domenech Arnal at the University of Barcelona, who have not only provided the necessary equipment to fulfil the microscopic studies, but also a special work place in her own office to do so. Not to mention, for reaching out to relevant people in order to solve any issues or added necessities that emerged along the way. The completion of the laboratory work would not have been possible without Maria Luisa Arboleya Cimadevilla (Head of the Geotectonic department at UAB), Patrizia Ziveri (research professor and scientific director at ICTA, UAB), and Michael Grelaud (PhD researcher at ICTA, UAB), who provided me with the access to specific weighing equipment at the ICTA, UAB. Last but not least, a sincere thank you to Jorijntje Henderiks for providing the samples for DSDP Site 612 and ODP Site 707, and Steve Bohaty for sharing his unpublished data for ODP Site 707. This research used samples and data provided by the International Ocean Discovery Program (IODP).
33
REFERENCES
Abelson, M., J. Erez (2017), The onset of modern-like Atlantic meridional overturning circulation at the Eocene- Oligocene transition: Evidence, causes, and possible implication for global cooling, Geochem. Geophys. Geosyst., 18, doi: 10.1002/2017GC006826.
Akhmetiev, M. A. & V. N. Beniamovski (2009), Paleogene floral assemblages around epicontinental seas and straits in Northern Central Eurasia: proxies for climatic and paleogeographic evolution. Geol. Acta 7, 297–309.
Backman, J., R. A. Duncan, A. H. Mcdonald (1988), Proceedings of the Ocean Drilling Program, Site 707, Initial Reports, Vol. 115, College Station, TX, 233–399.
Berggren, W.A., Hollister, C.D., 1974. Paleogeography, paleobiogeography and the history of circulation in the Atlantic Ocean. In: Hay, W.W. (Ed.), Studies in Paleo- Oceanography. In: SEPM Special Publication, vol. 20, pp. 126–186.
Bickert T. & Henrich R. (2011), Cenozoic Climate Records, Developments in Sedimentology, Volume 63, ISSN 0070-4571, DOI: 10.1016/S0070-4571(11)63012-4
Bown, Thomas & Rose, Kenneth & Simons, E.L. & Wing, Scott. (1994), Distribution and stratigraphic correlation of Upper Paleocene and Lower Eocene fossil mammal and plant localities of the Fort Union, Willwood, and Tatman Formations, southern Bighorn Basin, Wyoming, United States Geological Survey Professional Paper, 1540.
Boyle, P.R., Romans, B.W., Tucholke, B.E., Norris, R.D., Swift, S.A., Sexton, P.F., 2017. Cenozoic North Atlantic deep circulation history recorded in contourite drifts, offshore Newfoundland, Canada. Mar. Geol. 385, 185–203.
Coxall, H. K., C. E. Huck, M. Huber, C. H. Lear, A. Legarda-Lisarri, M. O’Regan, K. K. Sliwinska, T. van de Flierdt, A. M. de Boer, J. C. Zachos & J. Backman (2018), Export of nutrient rich Northern Component Water preceded early Oligocene Antarctic glaciation, Nature Geoscience, vol. 11, 190–196, doi: 10.1038/s41561-018-0069-9.
Coxall, H. K. & P. A. Wilson, (2011), Early Oligocene glaciation and productivity in the eastern equatorial Pacific: Insights into global carbon cycling, Paleoceanography, Vol. 26, PA2221, doi: 10.1029/2010PA002021.
Coxall, H. K., P. A. Wilson, H. Palike, C. H. Lear, & J. Backman (2005), Rapid stepwise onset of Antarctic glaciation and deeper calcite compensation in the Pacific Ocean, Nature, 433, 53–57, doi: 10.1038/nature03135.
Cramer, B. S., J. R. Toggweiler, J. D. Wright, M. E. Katz, & K. G. Miller (2009), Ocean overturning since the late Cretaceous: Inferences from a new benthic foraminiferal isotope compilation, Paleoceanography, 24, PA4216, doi: 10.1029/2008PA001683.
Cramwinckel M. J., M. Huber, I. J. Kocken, C. Agnini, P. K. Bijl, S. M. Bohaty, J. Frieling, A. Goldner, F. J. Hilgen, E. L. Kip, F. Peterse, R. van der Ploeg, U. Röhl, S. Schouten,6 & A. Sluijs (2018), Synchronous tropical and polar temperature evolution in the Eocene, Nature 559, p. 382–386, doi: 10.1038/s41586-018-0272-2
De Boer, A., Sigman, D., Toggweiler, J., Russell, J., 2007. Effect of global ocean temperature change on deep ocean ventilation. Paleoceanography 22.
Ferreira D., P. Cessi, H. K. Coxall, A. de Boer, H. A. Dijkstra, S. S. Drijfhout, T. Eldevik, N. Harnik, J. F. McManus, D. P. Marshall, J. Nilsson, F. Roquet, T. Schneider, R. C. Wills (2018), Atlantic-Pacific Asymmetry in Deep Water Formation, Annu. Rev. Earth Planet. Sci., 46, 327– 352, doi: 10.1146/annurev-earth-082517-010045.
Hohbein, M.W., Sexton, P.F., Cartwright, J.A., 2012. Onset of North Atlantic deep water production coincident with inception of the Cenozoic global cooling trend. Geology 40, 255–258.
Holbourn A., A. S. Henderson, N. MacLeod, (2013), Atlas of Benthic Foraminifera, First Edition, Natural History Museum, Blackwell Publishing Ltd.
Hutchinson D. K., A. M. de Boer, H. K. Coxall, R. Caballero, J. Nilsson (2018), Climate sensitivity and meridional overturning circulation in the late Eocene using GFDL CM2.1, Climate of the Past, 14, 789–810, doi: 10.5194/cp-14-789-2018.
Kharin, G. S. & N. P. Lukashina (2010), Paleogeography of the Norwegian–Greenland and northwestern European Sea basins in the Paleogene. Oceanology 50, 226–239.
Katz, M. E., K. G. Miller, J. D. Wright, B. S. Wade, J. V. Browning, B. S. Cramer, and Y. Rosenthal (2008), Stepwise transition from the Eocene greenhouse to the Oligocene icehouse, Nat. Geosci., 1, 329–334, doi:10.1038/ngeo179.
Kennett J. P. and L. D. Stott (1990), Proteus and Proto-Oceanus, Paleogene Oceans as revealed from Antarctic stable isotopic results; ODP Leg 113, in Proc. ODP, Init. Septs., 113, edited by J. P. Kennett, and P. F. Barker et al., 865–880.
Kroopnick P., The distribution of 13C of TCO2 in the world oceans, Deep Sea Res., 32, 57–84, 1985.
34
Lear C. H., T. R. Bailey, P. N. Pearson, H. K. Coxall, Y. Rosenthal (2008), Cooling and ice growth across the Eocene-Oligocene transition, Geology, 36; no. 3; p. 251–254; doi: 10.1130/G24584A.1
Poag, C. W., A. B. Watts, M. Cousin, D. Goldberg, M. B. Hart, K. G. Miller, G. S. Mountain, Y. Nakamura, A. Plamer, P. A. Schiffelbein, B. C. Schreiber, M. Tarafa, J. E. Thein, P. C. Valentine (1983), 612 Initial Reports, DSDP, 95: Washington (U.S. Govt. Printing Office), 31–153.
Roberts, D. G., (1975), Marine geology of the Rockall Plateau and trough, Phil. Trans. Roy. Soc. London (Ser A), 278: 447–509.
Roberts, D. G., D. Schnitker, J. Backman, J. G. Baldauf, A. Desprairies, R. Homrighausen, P. Huddlestun, A. J. Kaltenback, J. B. Keene, K. A. o: Krumsiek, A. C. Morton, J. Westberg-Smith, H. B. Zimmerman, (1981), 553 Initial Reports, DSDP, 81: Washington (U.S. Govt. Printing Office), 31–233.
Savian J. F., L. Jovane, S. M. Bohaty, P. Wilson (2013), Middle Eocene to early Oligocene magnetostratigraphy of ODP Hole 711A (Leg 115), western equatorial Indian Ocean, Magnetic Methods and the Timing of Geological Processes, Geological Society, London, Special Publications, v.373, doi: 10.1144/SP373.16.
Sexton, P.F., Wilson, P.A., Norris, R.D., 2006a. Testing the Cenozoic multisite composite δ18O and δ13C curves: new monospecific Eocene records from a single locality, Demerara Rise (Ocean Drilling program Leg 207). Paleoceanography 21.
Zachos J., M. Pagani, L. Sloan, E. Thomas, K. Billups (2001), Trends, Rhythms, and Aberrations in Global Climate 65 Ma to Present, Science, vol. 292, pp. 686–693, doi: 10.1126/science.1059412.
Zang, Z., K. H. Nisancioglu, F. Flatøy, M. Bentsen, I. Bethke, & H. Wang (2011), Tropical Seaways played a more important role than high latitude seaways in Cenozoic cooling, Climate of the Past, 7, 801–813, doi: 10.5194/ cp-7-801-2011.
Vahlenkamp M., I. Niezgodzki, D. De Vleeschouwer, T. Bickert, D. Harper, S. Kirtland Turner, G. Lohmann, P. Sexton, J. Zachos, H. Pälike (2017), Astronomically paced changes in deep-water circulation in the western North Atlantic during the middle Eocene, Earth and Planetary Science Letters 484, pp.329–340, doi: 10.1016/j.epsl.2017.12.016.
Vandenberghe N., F.J. Hilgen, R.P. Speijer, with contributions by J. G. Ogg, F. M. Gradstein and O. Hammer on the magnetochronology, biochronology and the time scale, and by C. J. Hollis and J. J. Hooker on the biostratigraphy (2012), The Geologic Time Scale 2012, Elsevier B.V. Doi: 10.1016/B978-0-444-59425-9.00028-7
Wright N., D. H. Scher, M. Seton, C. E. Huck, B. Duggan (2018), No Change in Southern Ocean Circulation in the Indian Ocean From the Eocene Through Late Oligocene, Paleoceanography and Paleoclimatology, 33, doi: 10.1002/2017PA003238.
35
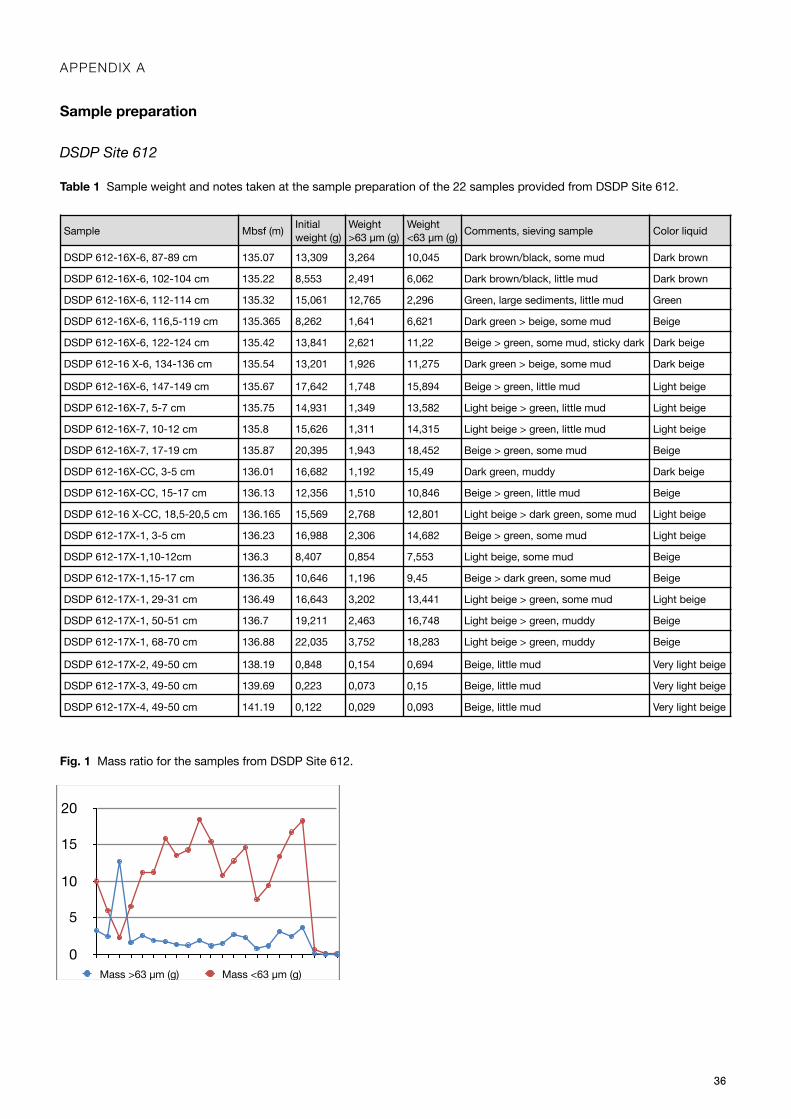
APPENDIX A
Sample preparation
DSDP Site 612
Table 1 Sample weight and notes taken at the sample preparation of the 22 samples provided from DSDP Site 612.
Fig. 1 Mass ratio for the samples from DSDP Site 612.
Sample Mbsf (m) Initial weight (g)
Weight >63 µm (g)
Weight <63 µm (g) Comments, sieving sample Color liquid
DSDP 612-16X-6, 87-89 cm 135.07 13,309 3,264 10,045 Dark brown/black, some mud Dark brown
DSDP 612-16X-6, 102-104 cm 135.22 8,553 2,491 6,062 Dark brown/black, little mud Dark brown
DSDP 612-16X-6, 112-114 cm 135.32 15,061 12,765 2,296 Green, large sediments, little mud Green
DSDP 612-16X-6, 116,5-119 cm 135.365 8,262 1,641 6,621 Dark green > beige, some mud Beige
DSDP 612-16X-6, 122-124 cm 135.42 13,841 2,621 11,22 Beige > green, some mud, sticky dark Dark beige
DSDP 612-16 X-6, 134-136 cm 135.54 13,201 1,926 11,275 Dark green > beige, some mud Dark beige
DSDP 612-16X-6, 147-149 cm 135.67 17,642 1,748 15,894 Beige > green, little mud Light beige
DSDP 612-16X-7, 5-7 cm 135.75 14,931 1,349 13,582 Light beige > green, little mud Light beige
DSDP 612-16X-7, 10-12 cm 135.8 15,626 1,311 14,315 Light beige > green, little mud Light beige
DSDP 612-16X-7, 17-19 cm 135.87 20,395 1,943 18,452 Beige > green, some mud Beige
DSDP 612-16X-CC, 3-5 cm 136.01 16,682 1,192 15,49 Dark green, muddy Dark beige
DSDP 612-16X-CC, 15-17 cm 136.13 12,356 1,510 10,846 Beige > green, little mud Beige
DSDP 612-16 X-CC, 18,5-20,5 cm 136.165 15,569 2,768 12,801 Light beige > dark green, some mud Light beige
DSDP 612-17X-1, 3-5 cm 136.23 16,988 2,306 14,682 Beige > green, some mud Light beige
DSDP 612-17X-1,10-12cm 136.3 8,407 0,854 7,553 Light beige, some mud Beige
DSDP 612-17X-1,15-17 cm 136.35 10,646 1,196 9,45 Beige > dark green, some mud Beige
DSDP 612-17X-1, 29-31 cm 136.49 16,643 3,202 13,441 Light beige > green, some mud Light beige
DSDP 612-17X-1, 50-51 cm 136.7 19,211 2,463 16,748 Light beige > green, muddy Beige
DSDP 612-17X-1, 68-70 cm 136.88 22,035 3,752 18,283 Light beige > green, muddy Beige
DSDP 612-17X-2, 49-50 cm 138.19 0,848 0,154 0,694 Beige, little mud Very light beige
DSDP 612-17X-3, 49-50 cm 139.69 0,223 0,073 0,15 Beige, little mud Very light beige
DSDP 612-17X-4, 49-50 cm 141.19 0,122 0,029 0,093 Beige, little mud Very light beige
0
5
10
15
20
Mass >63 µm (g) Mass <63 µm (g)
36
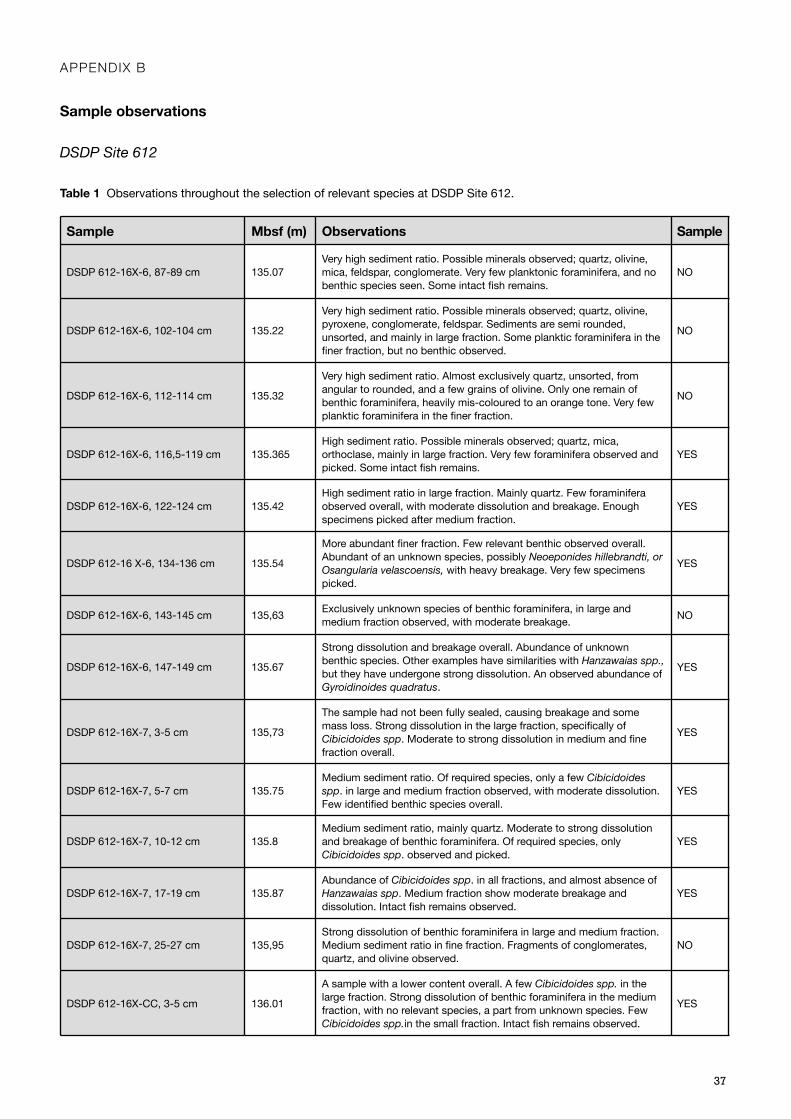
APPENDIX B
Sample observations
DSDP Site 612
Table 1 Observations throughout the selection of relevant species at DSDP Site 612.
Sample Mbsf (m) Observations Sample
DSDP 612-16X-6, 87-89 cm 135.07Very high sediment ratio. Possible minerals observed; quartz, olivine, mica, feldspar, conglomerate. Very few planktonic foraminifera, and no benthic species seen. Some intact fish remains.
NO
DSDP 612-16X-6, 102-104 cm 135.22
Very high sediment ratio. Possible minerals observed; quartz, olivine, pyroxene, conglomerate, feldspar. Sediments are semi rounded, unsorted, and mainly in large fraction. Some planktic foraminifera in the finer fraction, but no benthic observed.
NO
DSDP 612-16X-6, 112-114 cm 135.32
Very high sediment ratio. Almost exclusively quartz, unsorted, from angular to rounded, and a few grains of olivine. Only one remain of benthic foraminifera, heavily mis-coloured to an orange tone. Very few planktic foraminifera in the finer fraction.
NO
DSDP 612-16X-6, 116,5-119 cm 135.365High sediment ratio. Possible minerals observed; quartz, mica, orthoclase, mainly in large fraction. Very few foraminifera observed and picked. Some intact fish remains.
YES
DSDP 612-16X-6, 122-124 cm 135.42High sediment ratio in large fraction. Mainly quartz. Few foraminifera observed overall, with moderate dissolution and breakage. Enough specimens picked after medium fraction.
YES
DSDP 612-16 X-6, 134-136 cm 135.54
More abundant finer fraction. Few relevant benthic observed overall. Abundant of an unknown species, possibly Neoeponides hillebrandti, or Osangularia velascoensis, with heavy breakage. Very few specimens picked.
YES
DSDP 612-16X-6, 143-145 cm 135,63 Exclusively unknown species of benthic foraminifera, in large and medium fraction observed, with moderate breakage. NO
DSDP 612-16X-6, 147-149 cm 135.67
Strong dissolution and breakage overall. Abundance of unknown benthic species. Other examples have similarities with Hanzawaias spp., but they have undergone strong dissolution. An observed abundance of Gyroidinoides quadratus.
YES
DSDP 612-16X-7, 3-5 cm 135,73
The sample had not been fully sealed, causing breakage and some mass loss. Strong dissolution in the large fraction, specifically of Cibicidoides spp. Moderate to strong dissolution in medium and fine fraction overall.
YES
DSDP 612-16X-7, 5-7 cm 135.75Medium sediment ratio. Of required species, only a few Cibicidoides spp. in large and medium fraction observed, with moderate dissolution. Few identified benthic species overall.
YES
DSDP 612-16X-7, 10-12 cm 135.8Medium sediment ratio, mainly quartz. Moderate to strong dissolution and breakage of benthic foraminifera. Of required species, only Cibicidoides spp. observed and picked.
YES
DSDP 612-16X-7, 17-19 cm 135.87Abundance of Cibicidoides spp. in all fractions, and almost absence of Hanzawaias spp. Medium fraction show moderate breakage and dissolution. Intact fish remains observed.
YES
DSDP 612-16X-7, 25-27 cm 135,95Strong dissolution of benthic foraminifera in large and medium fraction. Medium sediment ratio in fine fraction. Fragments of conglomerates, quartz, and olivine observed.
NO
DSDP 612-16X-CC, 3-5 cm 136.01
A sample with a lower content overall. A few Cibicidoides spp. in the large fraction. Strong dissolution of benthic foraminifera in the medium fraction, with no relevant species, a part from unknown species. Few Cibicidoides spp.in the small fraction. Intact fish remains observed.
YES
37
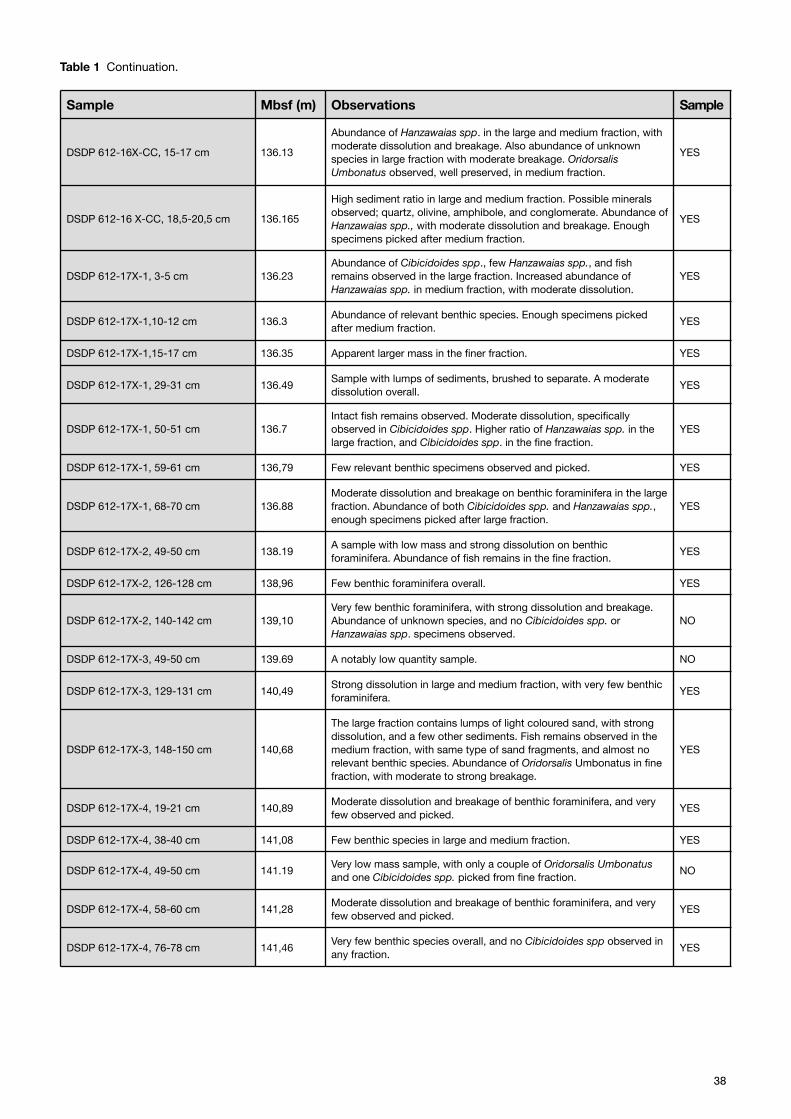
Table 1 Continuation.
Sample Mbsf (m) Observations Sample
DSDP 612-16X-CC, 15-17 cm 136.13
Abundance of Hanzawaias spp. in the large and medium fraction, with moderate dissolution and breakage. Also abundance of unknown species in large fraction with moderate breakage. Oridorsalis Umbonatus observed, well preserved, in medium fraction.
YES
DSDP 612-16 X-CC, 18,5-20,5 cm 136.165
High sediment ratio in large and medium fraction. Possible minerals observed; quartz, olivine, amphibole, and conglomerate. Abundance of Hanzawaias spp., with moderate dissolution and breakage. Enough specimens picked after medium fraction.
YES
DSDP 612-17X-1, 3-5 cm 136.23Abundance of Cibicidoides spp., few Hanzawaias spp., and fish remains observed in the large fraction. Increased abundance of Hanzawaias spp. in medium fraction, with moderate dissolution.
YES
DSDP 612-17X-1,10-12 cm 136.3 Abundance of relevant benthic species. Enough specimens picked after medium fraction. YES
DSDP 612-17X-1,15-17 cm 136.35 Apparent larger mass in the finer fraction. YES
DSDP 612-17X-1, 29-31 cm 136.49 Sample with lumps of sediments, brushed to separate. A moderate dissolution overall. YES
DSDP 612-17X-1, 50-51 cm 136.7Intact fish remains observed. Moderate dissolution, specifically observed in Cibicidoides spp. Higher ratio of Hanzawaias spp. in the large fraction, and Cibicidoides spp. in the fine fraction.
YES
DSDP 612-17X-1, 59-61 cm 136,79 Few relevant benthic specimens observed and picked. YES
DSDP 612-17X-1, 68-70 cm 136.88Moderate dissolution and breakage on benthic foraminifera in the large fraction. Abundance of both Cibicidoides spp. and Hanzawaias spp., enough specimens picked after large fraction.
YES
DSDP 612-17X-2, 49-50 cm 138.19 A sample with low mass and strong dissolution on benthic foraminifera. Abundance of fish remains in the fine fraction. YES
DSDP 612-17X-2, 126-128 cm 138,96 Few benthic foraminifera overall. YES
DSDP 612-17X-2, 140-142 cm 139,10Very few benthic foraminifera, with strong dissolution and breakage. Abundance of unknown species, and no Cibicidoides spp. or Hanzawaias spp. specimens observed.
NO
DSDP 612-17X-3, 49-50 cm 139.69 A notably low quantity sample. NO
DSDP 612-17X-3, 129-131 cm 140,49 Strong dissolution in large and medium fraction, with very few benthic foraminifera. YES
DSDP 612-17X-3, 148-150 cm 140,68
The large fraction contains lumps of light coloured sand, with strong dissolution, and a few other sediments. Fish remains observed in the medium fraction, with same type of sand fragments, and almost no relevant benthic species. Abundance of Oridorsalis Umbonatus in fine fraction, with moderate to strong breakage.
YES
DSDP 612-17X-4, 19-21 cm 140,89 Moderate dissolution and breakage of benthic foraminifera, and very few observed and picked. YES
DSDP 612-17X-4, 38-40 cm 141,08 Few benthic species in large and medium fraction. YES
DSDP 612-17X-4, 49-50 cm 141.19 Very low mass sample, with only a couple of Oridorsalis Umbonatus and one Cibicidoides spp. picked from fine fraction. NO
DSDP 612-17X-4, 58-60 cm 141,28 Moderate dissolution and breakage of benthic foraminifera, and very few observed and picked. YES
DSDP 612-17X-4, 76-78 cm 141,46 Very few benthic species overall, and no Cibicidoides spp observed in any fraction. YES
38
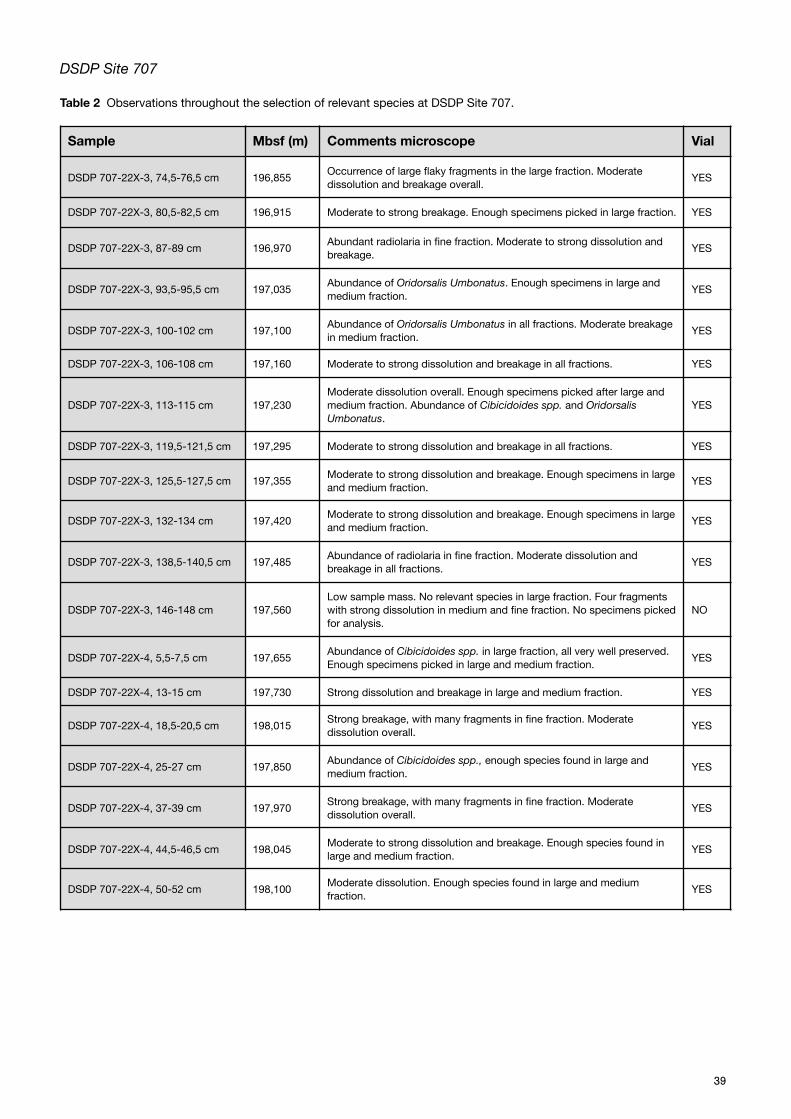
DSDP Site 707
Table 2 Observations throughout the selection of relevant species at DSDP Site 707.
Sample Mbsf (m) Comments microscope Vial
DSDP 707-22X-3, 74,5-76,5 cm 196,855 Occurrence of large flaky fragments in the large fraction. Moderate dissolution and breakage overall. YES
DSDP 707-22X-3, 80,5-82,5 cm 196,915 Moderate to strong breakage. Enough specimens picked in large fraction. YES
DSDP 707-22X-3, 87-89 cm 196,970 Abundant radiolaria in fine fraction. Moderate to strong dissolution and breakage. YES
DSDP 707-22X-3, 93,5-95,5 cm 197,035 Abundance of Oridorsalis Umbonatus. Enough specimens in large and medium fraction. YES
DSDP 707-22X-3, 100-102 cm 197,100 Abundance of Oridorsalis Umbonatus in all fractions. Moderate breakage in medium fraction. YES
DSDP 707-22X-3, 106-108 cm 197,160 Moderate to strong dissolution and breakage in all fractions. YES
DSDP 707-22X-3, 113-115 cm 197,230Moderate dissolution overall. Enough specimens picked after large and medium fraction. Abundance of Cibicidoides spp. and Oridorsalis Umbonatus.
YES
DSDP 707-22X-3, 119,5-121,5 cm 197,295 Moderate to strong dissolution and breakage in all fractions. YES
DSDP 707-22X-3, 125,5-127,5 cm 197,355 Moderate to strong dissolution and breakage. Enough specimens in large and medium fraction. YES
DSDP 707-22X-3, 132-134 cm 197,420 Moderate to strong dissolution and breakage. Enough specimens in large and medium fraction. YES
DSDP 707-22X-3, 138,5-140,5 cm 197,485 Abundance of radiolaria in fine fraction. Moderate dissolution and breakage in all fractions. YES
DSDP 707-22X-3, 146-148 cm 197,560Low sample mass. No relevant species in large fraction. Four fragments with strong dissolution in medium and fine fraction. No specimens picked for analysis.
NO
DSDP 707-22X-4, 5,5-7,5 cm 197,655 Abundance of Cibicidoides spp. in large fraction, all very well preserved. Enough specimens picked in large and medium fraction. YES
DSDP 707-22X-4, 13-15 cm 197,730 Strong dissolution and breakage in large and medium fraction. YES
DSDP 707-22X-4, 18,5-20,5 cm 198,015 Strong breakage, with many fragments in fine fraction. Moderate dissolution overall. YES
DSDP 707-22X-4, 25-27 cm 197,850 Abundance of Cibicidoides spp., enough species found in large and medium fraction. YES
DSDP 707-22X-4, 37-39 cm 197,970 Strong breakage, with many fragments in fine fraction. Moderate dissolution overall. YES
DSDP 707-22X-4, 44,5-46,5 cm 198,045 Moderate to strong dissolution and breakage. Enough species found in large and medium fraction. YES
DSDP 707-22X-4, 50-52 cm 198,100 Moderate dissolution. Enough species found in large and medium fraction. YES
39
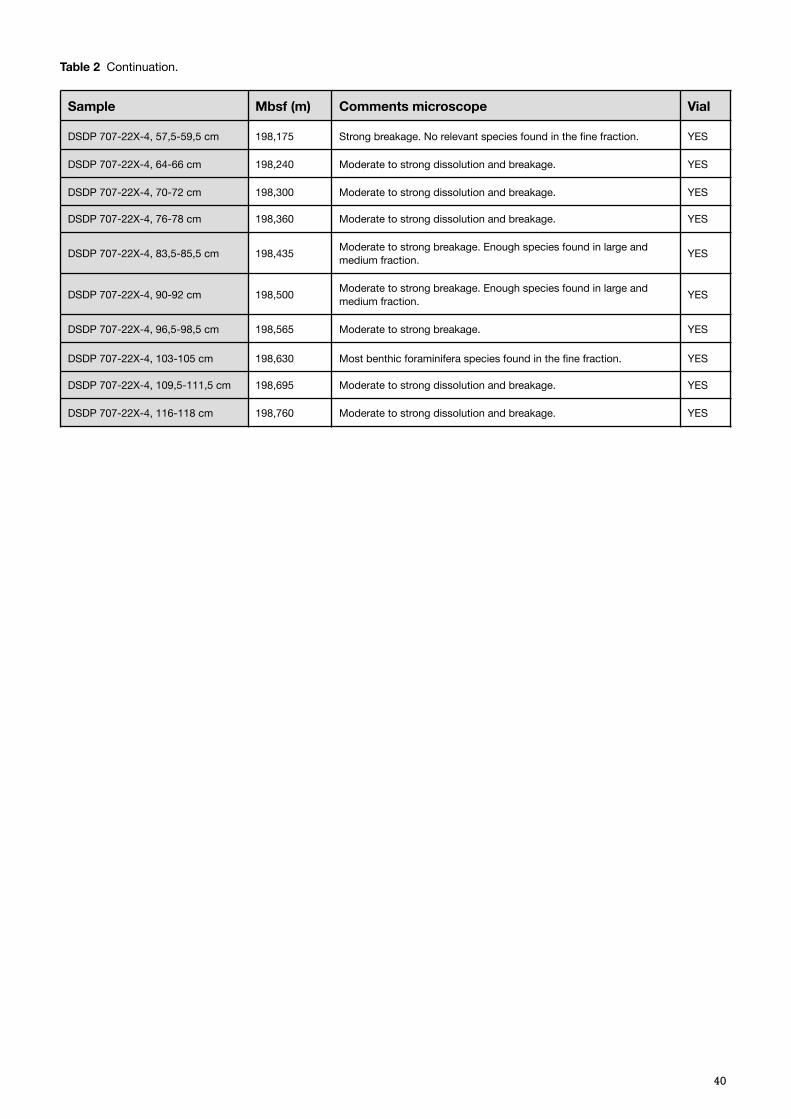
Table 2 Continuation.
Sample Mbsf (m) Comments microscope Vial
DSDP 707-22X-4, 57,5-59,5 cm 198,175 Strong breakage. No relevant species found in the fine fraction. YES
DSDP 707-22X-4, 64-66 cm 198,240 Moderate to strong dissolution and breakage. YES
DSDP 707-22X-4, 70-72 cm 198,300 Moderate to strong dissolution and breakage. YES
DSDP 707-22X-4, 76-78 cm 198,360 Moderate to strong dissolution and breakage. YES
DSDP 707-22X-4, 83,5-85,5 cm 198,435 Moderate to strong breakage. Enough species found in large and medium fraction. YES
DSDP 707-22X-4, 90-92 cm 198,500 Moderate to strong breakage. Enough species found in large and medium fraction. YES
DSDP 707-22X-4, 96,5-98,5 cm 198,565 Moderate to strong breakage. YES
DSDP 707-22X-4, 103-105 cm 198,630 Most benthic foraminifera species found in the fine fraction. YES
DSDP 707-22X-4, 109,5-111,5 cm 198,695 Moderate to strong dissolution and breakage. YES
DSDP 707-22X-4, 116-118 cm 198,760 Moderate to strong dissolution and breakage. YES
40
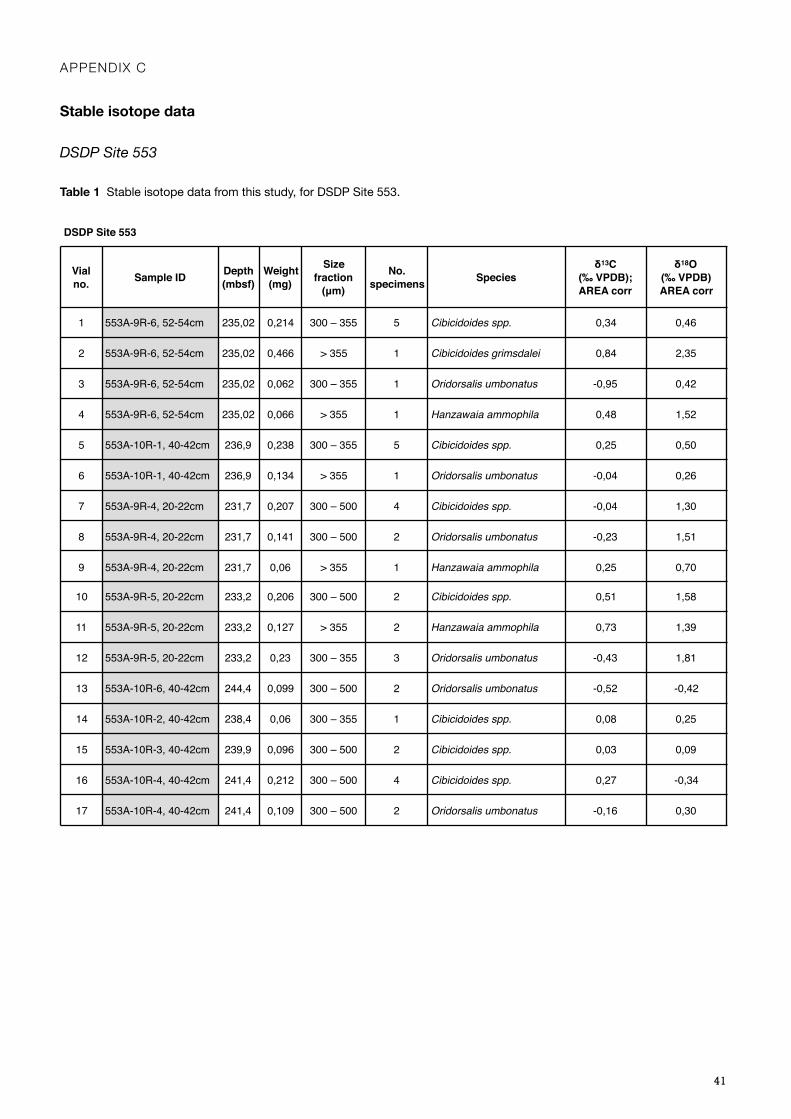
APPENDIX C
Stable isotope data
DSDP Site 553
Table 1 Stable isotope data from this study, for DSDP Site 553.
DSDP Site 553
Vial no. Sample ID Depth
(mbsf)Weight (mg)
Size fraction
(μm)
No. specimens Species
δ13C (‰ VPDB); AREA corr
δ18O (‰ VPDB) AREA corr
1 553A-9R-6, 52-54cm 235,02 0,214 300 – 355 5 Cibicidoides spp. 0,34 0,46
2 553A-9R-6, 52-54cm 235,02 0,466 > 355 1 Cibicidoides grimsdalei 0,84 2,35
3 553A-9R-6, 52-54cm 235,02 0,062 300 – 355 1 Oridorsalis umbonatus -0,95 0,42
4 553A-9R-6, 52-54cm 235,02 0,066 > 355 1 Hanzawaia ammophila 0,48 1,52
5 553A-10R-1, 40-42cm 236,9 0,238 300 – 355 5 Cibicidoides spp. 0,25 0,50
6 553A-10R-1, 40-42cm 236,9 0,134 > 355 1 Oridorsalis umbonatus -0,04 0,26
7 553A-9R-4, 20-22cm 231,7 0,207 300 – 500 4 Cibicidoides spp. -0,04 1,30
8 553A-9R-4, 20-22cm 231,7 0,141 300 – 500 2 Oridorsalis umbonatus -0,23 1,51
9 553A-9R-4, 20-22cm 231,7 0,06 > 355 1 Hanzawaia ammophila 0,25 0,70
10 553A-9R-5, 20-22cm 233,2 0,206 300 – 500 2 Cibicidoides spp. 0,51 1,58
11 553A-9R-5, 20-22cm 233,2 0,127 > 355 2 Hanzawaia ammophila 0,73 1,39
12 553A-9R-5, 20-22cm 233,2 0,23 300 – 355 3 Oridorsalis umbonatus -0,43 1,81
13 553A-10R-6, 40-42cm 244,4 0,099 300 – 500 2 Oridorsalis umbonatus -0,52 -0,42
14 553A-10R-2, 40-42cm 238,4 0,06 300 – 355 1 Cibicidoides spp. 0,08 0,25
15 553A-10R-3, 40-42cm 239,9 0,096 300 – 500 2 Cibicidoides spp. 0,03 0,09
16 553A-10R-4, 40-42cm 241,4 0,212 300 – 500 4 Cibicidoides spp. 0,27 -0,34
17 553A-10R-4, 40-42cm 241,4 0,109 300 – 500 2 Oridorsalis umbonatus -0,16 0,30
41
DSDP Site 612
Table 2 Stable isotope data from this study, for DSDP Site 612.
DSDP Site 612
Vial no. Sample ID Depth
(mbsf)Weight
(mg)Size fraction
(μm)No.
specimens Species d13C, ‰; AREA corr
d18O, ‰; AREA corr
1 612-16X-6, 116,5-119 cm 135.365 0,163 500 – 150 3 Cibicidoides spp. -0,39 1,07
2 612-16X-6, 122-124 cm 135.42 0,466 500 – 150 3 Hanzawaia ammophila 0,16 0,53
3 612-16X-6, 134-136 cm 135.54 0,247 > 355 1 Cibicidoides spp. 0,15 0,51
4 612-16X-6, 147-149 cm 135.67 0,246 > 355 3 Cibicidoides spp. -2,35 0,69
5 612-16X-7, 3-5 cm 135,73 0,135 500 – 150 7 Cibicidoides spp. -2,76 0,78
6 612-16X-7, 5-7 cm 135.75 0,223 > 355 2 Cibicidoides spp. -0,55 0,57
7 612-16X-7, 10-12 cm 135.8 0,161 500 – 150 3 Cibicidoides spp. -0,89 0,61
8 612-16X-7, 17-19 cm 135.87 0,246 > 355 4 Cibicidoides spp. -1,48 0,77
9 612-16X-CC, 3-5 cm 136.01 0,213 500 – 150 11 Cibicidoides spp. -1,03 0,66
10 612-16X-CC, 15-17 cm 136.13 0,243 > 355 5 Hanzawaia ammophila 0,14 0,60
11 612-16X-CC, 18,5-20,5 cm 136.165 0,235 > 355 4 Hanzawaia ammophila -0,05 0,68
12 612-17X-1, 3-5 cm 136.23 0,220 > 355 3 Cibicidoides spp. 0,22 0,13
13 612-17X-1, 3-5 cm 136.23 0,222 500 – 150 8 Hanzawaia ammophila 0,05 0,51
14 612-17X-1, 10-12 cm 136.3 0,250 500 – 250 4 Cibicidoides spp. -0,09 0,80
15 612-17X-1, 10-12 cm 136.3 0,157 500 – 250 3 Hanzawaia ammophila 0,19 0,52
16 612-17X-1, 15-17 cm 136.35 0,249 500 – 250 3 Cibicidoides spp. 0,03 0,65
17 612-17X-1, 15-17 cm 136.35 0,155 500 – 250 4 Hanzawaia ammophila 0,15 0,51
18 612-17X-1, 29-31 cm 136.49 0,228 > 355 2 Cibicidoides spp. -0,96 0,55
19 612-17X-1, 29-31 cm 136.49 0,239 > 355 4 Hanzawaia ammophila -0,17 0,50
20 612-17X-1, 50-51 cm 136.7 0,235 > 355 3 Cibicidoides spp. -0,00 0,22
21 612-17X-1, 50-51 cm 136.7 0,248 > 355 3 Hanzawaia ammophila 0,00 0,39
22 612-17X-1, 59-61 cm 136,79 0,163 500 – 150 6 Cibicidoides spp. -0,37 0,64
23 612-17X-1, 68-70 cm 136.88 0,234 > 355 4 Cibicidoides spp. -0,23 0,59
24 612-17X-1, 68-70 cm 136.88 0,237 > 355 3 Hanzawaia ammophila -0,05 0,43
25 612-17X-2, 49-50 cm 138.19 0,096 > 355 1 Cibicidoides spp. -0,07 0,94
26 612-17X-2, 49-50 cm 138.19 0,101 355 – 250 3 Hanzawaia ammophila 0,10 0,62
27 612-17X-2, 126-128 cm 138,96 0,071 500 – 150 3 Cibicidoides spp. -0,21 0,99
28 612-17X-3, 129-131 cm 140,49 0,049 355 – 250 2 Hanzawaia ammophila -0,56 1,10
29 612-17X-3, 148-150 cm 140,68 0,153 500 – 150 2 Cibicidoides spp. -0,63 0,78
30 612-17X-4, 19-21 cm 140,89 0,067 500 – 250 2 Hanzawaia ammophila -0,37 1,04
31 612-17X-4, 38-40 cm 141,08 0,107 500 – 150 5 Hanzawaia ammophila -0,29 0,58
32 612-17X-4, 58-60 cm 141,28 0,106 500 – 150 3 Cibicidoides spp. 0,04 0,89
33 612-17X-4, 76-78 cm 141,46 0,082 355 – 250 2 Hanzawaia ammophila 0,34 0,89
34 612-17X-1, 59-61 cm 136,79 0,145 500 – 150 4 Hanzawaia ammophila 0,27 0,58
42

Table 3 Stable isotope data from other sources for DSDP Site 612.
DSDP Site 612
Source Depth (mbsf) Cibicidoides spp. d13C, ‰; AREA corr
Cibicidoides spp. d18O, ‰; AREA corr
Hanzawaia ammophila adj. Cib.
spp. d13C, ‰
Hanzawaia ammophila adj.
Cib. spp. d18O, ‰Coxall et al., 2018 135,47 -0,01 0,88Miller et al., 1991 135,96 -1,70 0,66Miller et al., 1991 136,00 -0,29 0,57Legarda et al., in prep. 136,08 0,64 0,69Coxall et al., 2018 136,20 0,23 -0,46Coxall et al., 2018 136,27 -0,32 0,27Legarda et al., in prep. 136,33 0,11 0,11Coxall et al., 2018 136,40 -0,71 0,75Coxall et al., 2018 136,59 -0,18 0,46Coxall et al., 2018 136,98 -0,08 1,10Coxall et al., 2018 137,18 -0,50 0,56Coxall et al., 2018 137,37 0,23 1,12Coxall et al., 2018 137,57 -0,26 0,23Miller et al., 1991 137,60 -0,07 0,19Miller et al., 1991 137,60 -0,33 0,26Coxall et al., 2018 137,77 -0,31 1,12Coxall et al., 2018 137,98 0,00 0,03Coxall et al., 2018 138,17 -0,10 -0,70Coxall et al., 2018 138,35 -0,20 -0,03Coxall et al., 2018 138,54 0,16 0,66Coxall et al., 2018 138,74 0,85 -0,10Coxall et al., 2018 139,10 0,08 0,28Miller et al., 1991 139,10 -0,06 0,29Coxall et al., 2018 139,31 -0,14 -0,26Coxall et al., 2018 139,50 0,28 0,76Coxall et al., 2018 139,71 -0,07 0,77Coxall et al., 2018 139,91 0,29 -0,59Coxall et al., 2018 140,10 0,30 -1,47Coxall et al., 2018 140,49 0,08 -0,26Miller et al., 1991 140,60 -0,22 0,42Miller et al., 1991 143,60 0,24 0,13Miller et al., 1991 145,10 -0,17 0,20Miller et al., 1991 146,30 0,36 0,25Miller et al., 1991 149,30 0,11 0,35Miller et al., 1991 150,80 0,40 0,47Miller et al., 1991 154,70 0,67 0,24Miller et al., 1991 155,80 0,20 0,15Miller et al., 1991 157,30 0,27 0,32Miller et al., 1991 158,80 0,33 0,34Miller et al., 1991 160,30 0,00 0,31Miller et al., 1991 163,30 0,24 0,08Miller et al., 1991 164,50 0,56 0,01Miller et al., 1991 165,30 0,89 0,05Miller et al., 1991 166,80 0,96 0,14Miller et al., 1991 168,30 0,91 0,15Miller et al., 1991 169,80 1,03 0,08Miller et al., 1991 171,30 1,17 0,18Miller et al., 1991 179,30 0,64 -0,02Pusz et al., 2009 181,33 0,21 0,01Pusz et al., 2009 181,34 0,16 0,20Pusz et al., 2009 181,36 0,31 0,09Pusz et al., 2009 181,37 0,64 0,31Pusz et al., 2009 181,38 0,68 0,35
43
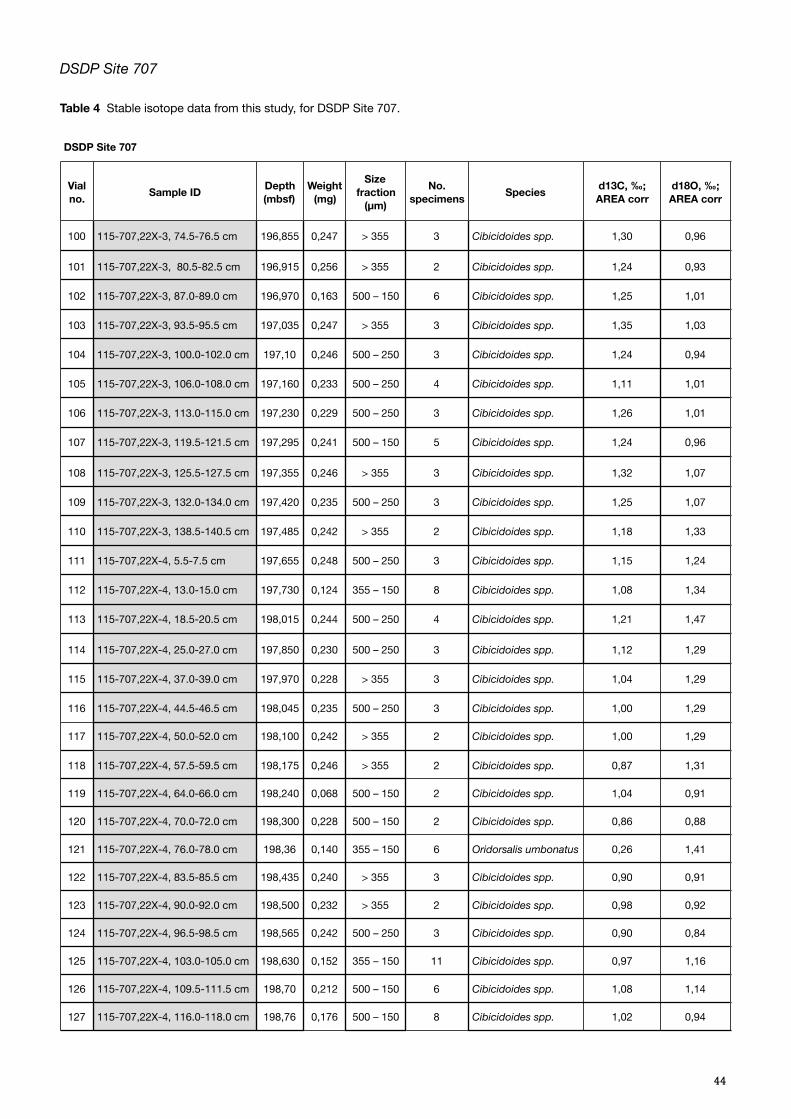
DSDP Site 707
Table 4 Stable isotope data from this study, for DSDP Site 707.
DSDP Site 707
Vial no. Sample ID Depth
(mbsf)Weight
(mg)
Size fraction
(μm)
No. specimens Species d13C, ‰;
AREA corrd18O, ‰; AREA corr
100 115-707,22X-3, 74.5-76.5 cm 196,855 0,247 > 355 3 Cibicidoides spp. 1,30 0,96
101 115-707,22X-3, 80.5-82.5 cm 196,915 0,256 > 355 2 Cibicidoides spp. 1,24 0,93
102 115-707,22X-3, 87.0-89.0 cm 196,970 0,163 500 – 150 6 Cibicidoides spp. 1,25 1,01
103 115-707,22X-3, 93.5-95.5 cm 197,035 0,247 > 355 3 Cibicidoides spp. 1,35 1,03
104 115-707,22X-3, 100.0-102.0 cm 197,10 0,246 500 – 250 3 Cibicidoides spp. 1,24 0,94
105 115-707,22X-3, 106.0-108.0 cm 197,160 0,233 500 – 250 4 Cibicidoides spp. 1,11 1,01
106 115-707,22X-3, 113.0-115.0 cm 197,230 0,229 500 – 250 3 Cibicidoides spp. 1,26 1,01
107 115-707,22X-3, 119.5-121.5 cm 197,295 0,241 500 – 150 5 Cibicidoides spp. 1,24 0,96
108 115-707,22X-3, 125.5-127.5 cm 197,355 0,246 > 355 3 Cibicidoides spp. 1,32 1,07
109 115-707,22X-3, 132.0-134.0 cm 197,420 0,235 500 – 250 3 Cibicidoides spp. 1,25 1,07
110 115-707,22X-3, 138.5-140.5 cm 197,485 0,242 > 355 2 Cibicidoides spp. 1,18 1,33
111 115-707,22X-4, 5.5-7.5 cm 197,655 0,248 500 – 250 3 Cibicidoides spp. 1,15 1,24
112 115-707,22X-4, 13.0-15.0 cm 197,730 0,124 355 – 150 8 Cibicidoides spp. 1,08 1,34
113 115-707,22X-4, 18.5-20.5 cm 198,015 0,244 500 – 250 4 Cibicidoides spp. 1,21 1,47
114 115-707,22X-4, 25.0-27.0 cm 197,850 0,230 500 – 250 3 Cibicidoides spp. 1,12 1,29
115 115-707,22X-4, 37.0-39.0 cm 197,970 0,228 > 355 3 Cibicidoides spp. 1,04 1,29
116 115-707,22X-4, 44.5-46.5 cm 198,045 0,235 500 – 250 3 Cibicidoides spp. 1,00 1,29
117 115-707,22X-4, 50.0-52.0 cm 198,100 0,242 > 355 2 Cibicidoides spp. 1,00 1,29
118 115-707,22X-4, 57.5-59.5 cm 198,175 0,246 > 355 2 Cibicidoides spp. 0,87 1,31
119 115-707,22X-4, 64.0-66.0 cm 198,240 0,068 500 – 150 2 Cibicidoides spp. 1,04 0,91
120 115-707,22X-4, 70.0-72.0 cm 198,300 0,228 500 – 150 2 Cibicidoides spp. 0,86 0,88
121 115-707,22X-4, 76.0-78.0 cm 198,36 0,140 355 – 150 6 Oridorsalis umbonatus 0,26 1,41
122 115-707,22X-4, 83.5-85.5 cm 198,435 0,240 > 355 3 Cibicidoides spp. 0,90 0,91
123 115-707,22X-4, 90.0-92.0 cm 198,500 0,232 > 355 2 Cibicidoides spp. 0,98 0,92
124 115-707,22X-4, 96.5-98.5 cm 198,565 0,242 500 – 250 3 Cibicidoides spp. 0,90 0,84
125 115-707,22X-4, 103.0-105.0 cm 198,630 0,152 355 – 150 11 Cibicidoides spp. 0,97 1,16
126 115-707,22X-4, 109.5-111.5 cm 198,70 0,212 500 – 150 6 Cibicidoides spp. 1,08 1,14
127 115-707,22X-4, 116.0-118.0 cm 198,76 0,176 500 – 150 8 Cibicidoides spp. 1,02 0,94
44
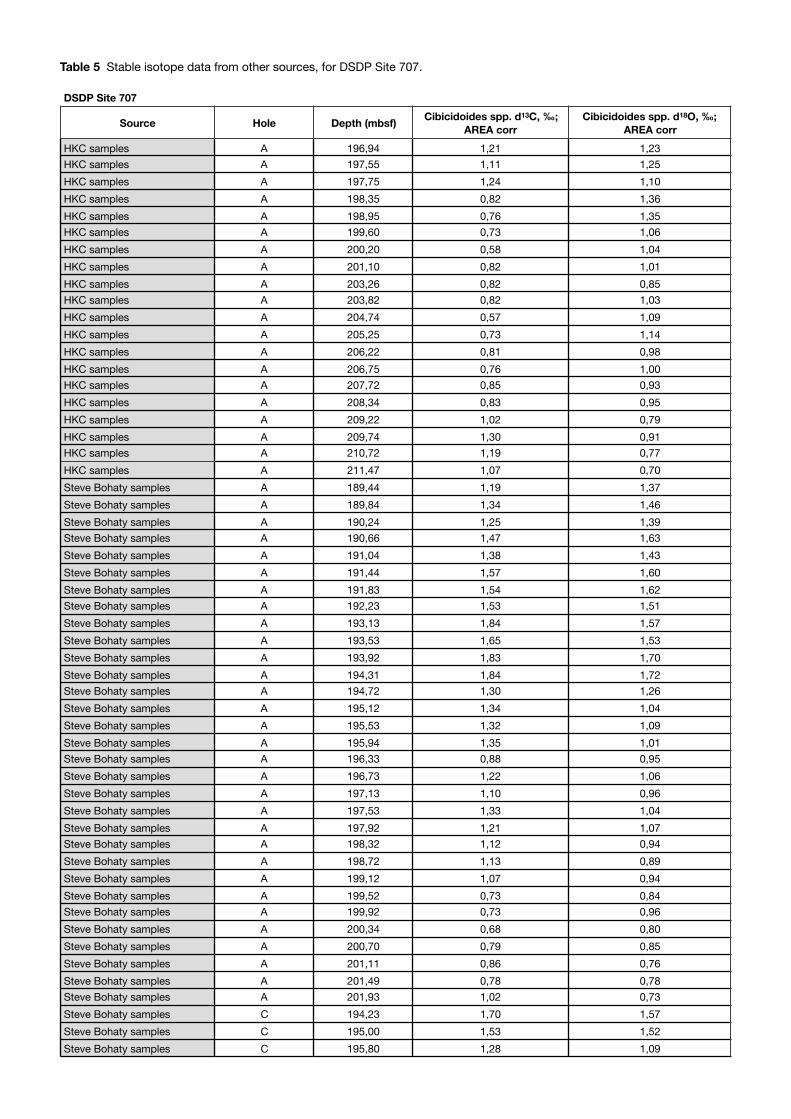
Table 5 Stable isotope data from other sources, for DSDP Site 707.
DSDP Site 707
Source Hole Depth (mbsf) Cibicidoides spp. d13C, ‰; AREA corr
Cibicidoides spp. d18O, ‰; AREA corr
HKC samples A 196,94 1,21 1,23HKC samples A 197,55 1,11 1,25HKC samples A 197,75 1,24 1,10HKC samples A 198,35 0,82 1,36HKC samples A 198,95 0,76 1,35HKC samples A 199,60 0,73 1,06HKC samples A 200,20 0,58 1,04HKC samples A 201,10 0,82 1,01HKC samples A 203,26 0,82 0,85HKC samples A 203,82 0,82 1,03HKC samples A 204,74 0,57 1,09HKC samples A 205,25 0,73 1,14HKC samples A 206,22 0,81 0,98HKC samples A 206,75 0,76 1,00HKC samples A 207,72 0,85 0,93HKC samples A 208,34 0,83 0,95HKC samples A 209,22 1,02 0,79HKC samples A 209,74 1,30 0,91HKC samples A 210,72 1,19 0,77HKC samples A 211,47 1,07 0,70Steve Bohaty samples A 189,44 1,19 1,37Steve Bohaty samples A 189,84 1,34 1,46Steve Bohaty samples A 190,24 1,25 1,39Steve Bohaty samples A 190,66 1,47 1,63Steve Bohaty samples A 191,04 1,38 1,43Steve Bohaty samples A 191,44 1,57 1,60Steve Bohaty samples A 191,83 1,54 1,62Steve Bohaty samples A 192,23 1,53 1,51Steve Bohaty samples A 193,13 1,84 1,57Steve Bohaty samples A 193,53 1,65 1,53Steve Bohaty samples A 193,92 1,83 1,70Steve Bohaty samples A 194,31 1,84 1,72Steve Bohaty samples A 194,72 1,30 1,26Steve Bohaty samples A 195,12 1,34 1,04Steve Bohaty samples A 195,53 1,32 1,09Steve Bohaty samples A 195,94 1,35 1,01Steve Bohaty samples A 196,33 0,88 0,95Steve Bohaty samples A 196,73 1,22 1,06Steve Bohaty samples A 197,13 1,10 0,96Steve Bohaty samples A 197,53 1,33 1,04Steve Bohaty samples A 197,92 1,21 1,07Steve Bohaty samples A 198,32 1,12 0,94Steve Bohaty samples A 198,72 1,13 0,89Steve Bohaty samples A 199,12 1,07 0,94Steve Bohaty samples A 199,52 0,73 0,84Steve Bohaty samples A 199,92 0,73 0,96Steve Bohaty samples A 200,34 0,68 0,80Steve Bohaty samples A 200,70 0,79 0,85Steve Bohaty samples A 201,11 0,86 0,76Steve Bohaty samples A 201,49 0,78 0,78Steve Bohaty samples A 201,93 1,02 0,73Steve Bohaty samples C 194,23 1,70 1,57Steve Bohaty samples C 195,00 1,53 1,52Steve Bohaty samples C 195,80 1,28 1,09

Steve Bohaty samples C 196,60 1,32 1,03Steve Bohaty samples C 197,39 1,04 0,92Steve Bohaty samples C 198,18 1,15 0,98Steve Bohaty samples C 199,00 1,21 0,91Steve Bohaty samples C 199,80 1,05 0,90Steve Bohaty samples C 200,57 0,98 0,91Steve Bohaty samples C 201,40 0,72 0,76Steve Bohaty samples C 202,20 0,91 0,69Steve Bohaty samples C 203,00 1,01 0,85