Embed Size (px)
Citation preview

ARTICLE IN PRESS
0020-7489/$ - se
doi:10.1016/j.ijn
�CorrespondE-mail addr
International Journal of Nursing Studies 45 (2008) 24–34
www.elsevier.com/locate/ijnurstu
Back or neck-pain-related disability of nursing staff inhospitals, nursing homes and home care in seven countries—
results from the European NEXT-Study
Michael Simona,�, Peter Tackenberga, Albert Nienhausb,Madeleine Estryn-Beharc, Paul Maurice Conwayd, H.-M. Hasselhorne
aDepartment of Safety Engineering, Section of Occupational Safety & Ergonomics, University of Wuppertal, GermanybBerufsgenossenschaft fur Gesundheitsdienst und Wohlfahrtspflege (BGW), Germany
cAssistance Publique—Hopitaux de Paris, FrancedDepartment of Occupational Health, University of Milan, Italy
eDepartment of Safety Engineering, Section of Occupational Health, University of Wuppertal, Germany
Received 19 April 2006; received in revised form 13 November 2006; accepted 14 November 2006
Abstract
Background: Musculoskeletal disorders are a widespread affliction in the nursing profession. Back or neck-pain-related
disability of nursing staff is mainly attributed to physical and psychosocial risk factors.
Objectives: To investigate which—and to what extent—physical and psychosocial risk factors are associated with neck/
back-pain-related disability in nursing, and to assess the role of the type of health care institution (hospitals, nursing
homes and home care institutions) within different countries in this problem.
Design: Cross-sectional secondary analysis of multinational data of nurses and auxiliary staff in hospitals (n ¼ 16,770),
nursing homes (n ¼ 2140) and home care institutions (n ¼ 2606) in seven countries from the European NEXT-Study.
Methods: Multinomial logistic regression analysis with raw models for each factor and mutually adjusted with all
analysed variables.
Results: Analysis of the pooled data revealed effort-reward imbalance as the predominant risk factor for disability in
all settings (odds ratios for high disability by effort-reward ratio: hospital 5.05 [4.30–5.93]; nursing home 6.52
[4.04–10.52] and home care 6.4 [3.83–10.70] [after mutual adjustment of psychosocial and physical risk factors]). In
contrast, physical exposure to lifting and bending showed only limited associations with odds ratios below 1.6; the
availability and use of lifting aids was—after mutual adjustment—not or only marginally associated with disability.
These findings were basically confirmed in separate analyses for all seven countries and types of institutions.
Conclusions: The findings show a pronounced association between psychosocial factors and back or neck-pain-related
disability. Further research should consider psychosocial factors and should take the setting where nurses work into
account.
r 2006 Elsevier Ltd. All rights reserved.
Keywords: Nursing staff; Hospital; Nursing homes; Home care; Back pain; Neck pain; Disability; Effort reward imbalance; Stress;
International comparison; Belgium; Germany; France; Italy; The Netherlands; Poland; Slovakia
e front matter r 2006 Elsevier Ltd. All rights reserved.
urstu.2006.11.003
ing author. Tel.:+49202 4393321.
ess: [email protected] (M. Simon).
ARTICLE IN PRESSM. Simon et al. / International Journal of Nursing Studies 45 (2008) 24–34 25
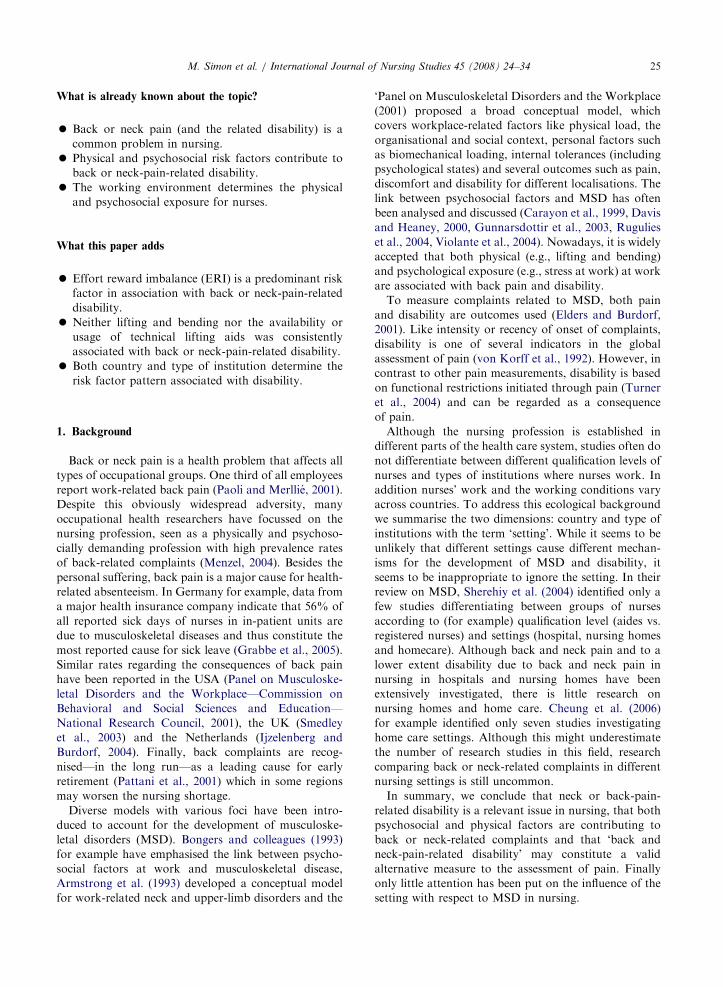
What is already known about the topic?
�
Back or neck pain (and the related disability) is acommon problem in nursing.
�
Physical and psychosocial risk factors contribute toback or neck-pain-related disability.
�
The working environment determines the physicaland psychosocial exposure for nurses.
What this paper adds
�
Effort reward imbalance (ERI) is a predominant riskfactor in association with back or neck-pain-related
disability.
�
Neither lifting and bending nor the availability orusage of technical lifting aids was consistently
associated with back or neck-pain-related disability.
�
Both country and type of institution determine therisk factor pattern associated with disability.
1. Background
Back or neck pain is a health problem that affects all
types of occupational groups. One third of all employees
report work-related back pain (Paoli and Merllie, 2001).
Despite this obviously widespread adversity, many
occupational health researchers have focussed on the
nursing profession, seen as a physically and psychoso-
cially demanding profession with high prevalence rates
of back-related complaints (Menzel, 2004). Besides the
personal suffering, back pain is a major cause for health-
related absenteeism. In Germany for example, data from
a major health insurance company indicate that 56% of
all reported sick days of nurses in in-patient units are
due to musculoskeletal diseases and thus constitute the
most reported cause for sick leave (Grabbe et al., 2005).
Similar rates regarding the consequences of back pain
have been reported in the USA (Panel on Musculoske-
letal Disorders and the Workplace—Commission on
Behavioral and Social Sciences and Education—
National Research Council, 2001), the UK (Smedley
et al., 2003) and the Netherlands (Ijzelenberg and
Burdorf, 2004). Finally, back complaints are recog-
nised—in the long run—as a leading cause for early
retirement (Pattani et al., 2001) which in some regions
may worsen the nursing shortage.
Diverse models with various foci have been intro-
duced to account for the development of musculoske-
letal disorders (MSD). Bongers and colleagues (1993)
for example have emphasised the link between psycho-
social factors at work and musculoskeletal disease,
Armstrong et al. (1993) developed a conceptual model
for work-related neck and upper-limb disorders and the
‘Panel on Musculoskeletal Disorders and the Workplace
(2001) proposed a broad conceptual model, which
covers workplace-related factors like physical load, the
organisational and social context, personal factors such
as biomechanical loading, internal tolerances (including
psychological states) and several outcomes such as pain,
discomfort and disability for different localisations. The
link between psychosocial factors and MSD has often
been analysed and discussed (Carayon et al., 1999, Davis
and Heaney, 2000, Gunnarsdottir et al., 2003, Rugulies
et al., 2004, Violante et al., 2004). Nowadays, it is widely
accepted that both physical (e.g., lifting and bending)
and psychological exposure (e.g., stress at work) at work
are associated with back pain and disability.
To measure complaints related to MSD, both pain
and disability are outcomes used (Elders and Burdorf,
2001). Like intensity or recency of onset of complaints,
disability is one of several indicators in the global
assessment of pain (von Korff et al., 1992). However, in
contrast to other pain measurements, disability is based
on functional restrictions initiated through pain (Turner
et al., 2004) and can be regarded as a consequence
of pain.
Although the nursing profession is established in
different parts of the health care system, studies often do
not differentiate between different qualification levels of
nurses and types of institutions where nurses work. In
addition nurses’ work and the working conditions vary
across countries. To address this ecological background
we summarise the two dimensions: country and type of
institutions with the term ‘setting’. While it seems to be
unlikely that different settings cause different mechan-
isms for the development of MSD and disability, it
seems to be inappropriate to ignore the setting. In their
review on MSD, Sherehiy et al. (2004) identified only a
few studies differentiating between groups of nurses
according to (for example) qualification level (aides vs.
registered nurses) and settings (hospital, nursing homes
and homecare). Although back and neck pain and to a
lower extent disability due to back and neck pain in
nursing in hospitals and nursing homes have been
extensively investigated, there is little research on
nursing homes and home care. Cheung et al. (2006)
for example identified only seven studies investigating
home care settings. Although this might underestimate
the number of research studies in this field, research
comparing back or neck-related complaints in different
nursing settings is still uncommon.
In summary, we conclude that neck or back-pain-
related disability is a relevant issue in nursing, that both
psychosocial and physical factors are contributing to
back or neck-related complaints and that ‘back and
neck-pain-related disability’ may constitute a valid
alternative measure to the assessment of pain. Finally
only little attention has been put on the influence of the
setting with respect to MSD in nursing.

ARTICLE IN PRESSM. Simon et al. / International Journal of Nursing Studies 45 (2008) 24–3426
2. Objectives
The data that were analysed stem from the European
NEXT-Study and allows:
(a)
Tab
Sam
Cou
Belg
Ger
Fran
Italy
Net
Pola
Slov
the investigation of which—and to what extent—
physical and psychosocial risk factors are associated
with neck/back-pain-related disability in nursing,
and
(b)
the assessment of the role of the type of healthcare institution (hospitals, nursing homes and home
care institutions) overall and in the countries
investigated.
3. Data
The ‘Nurses’ early exit study’ (NEXT) is a European
research project investigating premature departure from
the nursing profession (for general information: http://
www.next-study.net). More than 56,000 health care
workers from 11 countries have participated in cross-
sectional and prospective questionnaire assessments.
Separately for each country, quota samples were drawn
that were intended to cover the main working areas
(hospitals, nursing homes, and home care) and the
national geographical distribution of nurses. More
information on the aims, design, and performance of
the NEXT-Study can be found in Hasselhorn et al.
(2003, 2005). Ethical approval was given by the ethical
committee of the University of Wuppertal (Germany).
In this paper, data from the basic questionnaire
assessment 2002/2003 was used. The analysis was limited
to data from seven participating European countries
(Belgium, Germany, France, Italy, the Netherlands,
Poland, Slovakia) and to nursing aides with at least one
year of training as well as registered nurses (meeting the
educational requirements of the Sectoral Directive of the
European Union). Of 30,617 respondents a total of
le 1
ple by country
ntry Basic questionnaires Response rate
Sent out Received
ium 7049 4257 60.4
many 6484 3565 55.0
ce 13,017 5376 41.3
7447 5645 75.8
herlands 9309 4024 43.2
nd 7091 4354 61.4
akia 6382 3396 53.2
56,779 30,617 53.9
21,516 participants with valid responses to all items were
selected and used in the analysis. Following the study
objectives, sub samples for hospitals (n ¼ 16,770),
nursing homes (n ¼ 2140) and home care institutions
(n ¼ 2606) were created (Table 1).
4. Methods
For all scales used in the analysis and described below
satisfactory psychometric properties have been found
(Kummerling et al., 2003).
4.1. Outcome measurement
Disability was measured using a four-item-scale
developed by von Korff et al. (1992) covering both
neck and/or low back pain in relation to days being
‘disabled’ in the past six months and interference with
daily activities, social activities and the ability to work.
In NEXT, the scales for disability due to neck/shoulder
and due to low back pain were merged, (e.g., ‘how much
has neck or low back pain interfered with your daily
activities’). The calculated disability score ranged from 0
to 6, which then was classified into 0 ‘no disability’, 1 to
3 ‘moderate disability’ and 4 to 6 ‘high disability’. This
trichotomisation was used as outcome variable, with ‘no
disability’ cases as reference groups.
4.2. Physical factors
Physical risk factors were assessed with two measures:
the ‘lifting and bending’ score (L&B) and the availability
and usage of technical lifting aids. L&B consists of an 8-
item scale developed by the NEXT-Study Group cover-
ing the frequency of characteristic physically demanding
tasks of nursing work, in particular patient-handling
activities such as getting patients to bed, and positioning
and lifting of patients (Kummerling et al., 2003). The
scores of each item were weighed and a sum score
(%) Analyzed sample
Hospital Nursing homes Home care
1819 208 1253
2181 346 256
3043 397 45
3478 124 285
2338 673 573
2520 138 161
1391 254 33
16,770 2140 2606

ARTICLE IN PRESSM. Simon et al. / International Journal of Nursing Studies 45 (2008) 24–34 27
ranging from 0 to 100 was set. For the regression
analysis L&B was categorised into tertiles separately
according to type of institution. The lowest tertile ‘low
physical exposure’ constitutes the reference category in
the logistic regression analysis. Also for analysis on
country level, the tertile ranges defined for the total
sample were used.
Availability and usage of technical lifting aids was
assessed by a filter question resulting in three possible
categories: ‘lifting aids not available’, ‘lifting aids
available but not used’ and, finally ‘lifting aids available
and used’ (reference category).
4.3. Psychosocial factors
As indicators for psychosocial risk factors the following
three concepts were used: ‘quantitative demands’, ‘influ-
ence at work’ and the ‘effort-reward imbalance ratio’ (ERI
ratio). Quantitative demands indicating work intensity
were measured using a five-item scale based on the
Copenhagen Psychosocial Questionnaire (COPSOQ, Kris-
tensen et al., 2005) and supplemented by a nursing specific
item. The scale was trichotomised (separately by type of
institution) with the lowest tertile as reference group. The
four-item scale ‘influence at work’ indicating control over
one’s working environment derives from the Swedish
version of the Demand-Control questionnaire (Theorell et
al., 1988) and was adopted by the NEXT-Study Group in
an adjusted form (Kummerling et al., 2003). Following
trichotomisation (again by type of institution) the highest
tertile constitutes the reference group indicating highest
influence at work. The ERI ratio measure constitutes the
core of the effort-reward imbalance model developed by
Siegrist (Siegrist, 1996). It is based on the postulate that
‘digression from reciprocity in transaction results in a
stressful experience’. Applied to the workplace, this would
mean that there should be a balance between what the
employee gives (‘effort’) and what he or she receives
(‘reward’). Here, reward not only includes financial reward
but also esteem and career opportunities. The short
version of the ERI questionnaire was used (Siegrist et
al., 2004). The relation between the individual’s effort and
reward scores is calculated as the ERI ratio, theoretically
ranging from .2 to 5. Trichotomisation (by type of
institution) resulted in three tertiles with the lowest
indicating a fortunate ERI ratio (reference category),
which means a balance between efforts and reward (low
stress), and the highest with a high imbalance between
efforts and perceived rewards at the workplace (high
stress). Again, analysis on country level was performed on
the basis of the tertile ranges defined for the total sample.
4.4. Individual factors
Several reviews (Lagerstrom et al., 1998, Menzel,
2004, Sherehiy et al., 2004) have shown that qualifica-
tion level and therewith associated different exposure
and tasks are associated with the risk for spine
complaints. Consequently, the distinction between
nurses and auxiliary staff was used as separate
risk factor, with registered nurses as the reference
category.
4.5. Statistical methods
For estimation of risk factors of back-pain-related
disability, multinomial logistic regressions were per-
formed. Multinomial regression is used when the
outcome is polytomous and delivers the odds of
exposure among those belonging to a specific category
of the multicategorial outcome. In our study, the
moderate disability (1–3) and the severe disability
group (4–6) were compared with the odds of expo-
sure among those belonging to the reference group,
the non-disability group. For each type of institution
two models were computed. Model (a) consists of
each of the assumed risk factors (e.g., lifting and
bending) and a fixed set of control variables: gender,
age and country. This adjustment was chosen to prevent
effects from the unequal distribution of gender and age
in the different institution types and to adjust for
national features potentially influencing the data from
the different countries. Model (b) combined all risk
factors and control variables and delivered mutually
adjusted odds ratios. In addition, separate analysis by
country and type of institution were performed. For
reasons of comprehensibility, we reported only the
associations between exposure and the high disability
category, and this was only done for model B (mutual
adjustment and adjustment for age; we did not adjust for
gender, because too many empty cells emerged due to
few male nurses). All statistical tests were conducted
using SPSS version 11 (SPSS Inc., 2005).
5. Results
5.1. Descriptive analysis
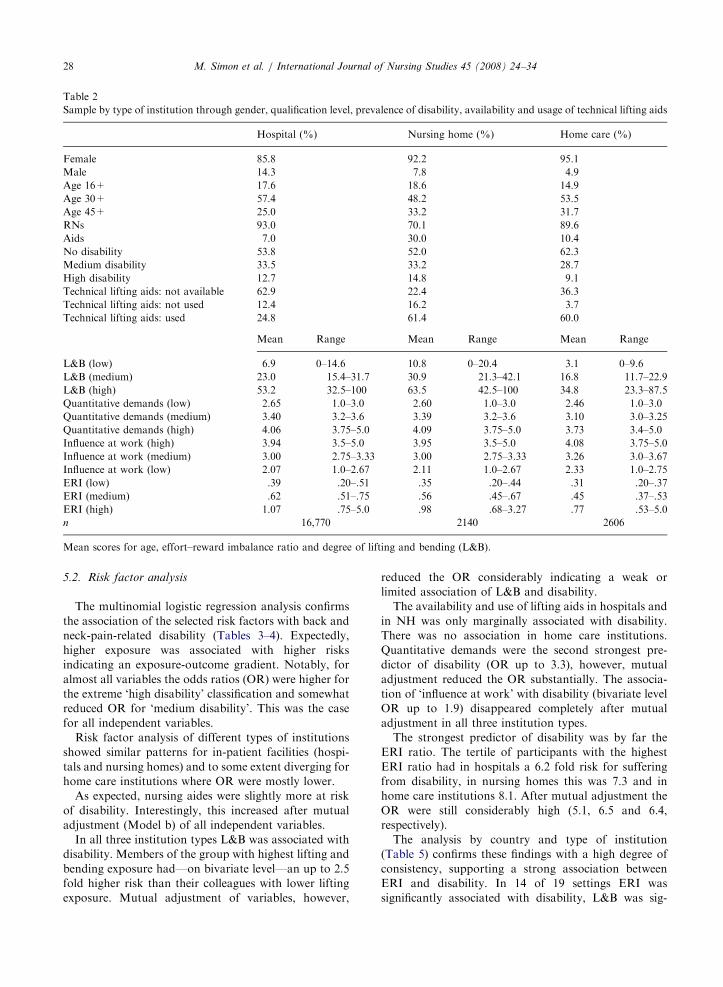
Descriptive analysis (Table 2) indicates that the
proportion of nursing staff without disability is highest
in home care (62.3%) and somewhat lower in hospitals
(53.8%) and nursing homes (52.0%, NH). As expected
NH had the highest rate of respondents with high
exposure to L&B (63.5%). Respondents in hospitals
reported the lowest availability of lifting aids (in 62.9%
not available) and the highest mean ERI ratio indicating
a higher adverse imbalance between effort and rewards
at work. In home care institutions the conditions
assessed were least adverse in comparison to both in-
patient settings.
ARTICLE IN PRESS
Table 2
Sample by type of institution through gender, qualification level, prevalence of disability, availability and usage of technical lifting aids
Hospital (%) Nursing home (%) Home care (%)
Female 85.8 92.2 95.1
Male 14.3 7.8 4.9
Age 16+ 17.6 18.6 14.9
Age 30+ 57.4 48.2 53.5
Age 45+ 25.0 33.2 31.7
RNs 93.0 70.1 89.6
Aids 7.0 30.0 10.4
No disability 53.8 52.0 62.3
Medium disability 33.5 33.2 28.7
High disability 12.7 14.8 9.1
Technical lifting aids: not available 62.9 22.4 36.3
Technical lifting aids: not used 12.4 16.2 3.7
Technical lifting aids: used 24.8 61.4 60.0
Mean Range Mean Range Mean Range
L&B (low) 6.9 0–14.6 10.8 0–20.4 3.1 0–9.6
L&B (medium) 23.0 15.4–31.7 30.9 21.3–42.1 16.8 11.7–22.9
L&B (high) 53.2 32.5–100 63.5 42.5–100 34.8 23.3–87.5
Quantitative demands (low) 2.65 1.0–3.0 2.60 1.0–3.0 2.46 1.0–3.0
Quantitative demands (medium) 3.40 3.2–3.6 3.39 3.2–3.6 3.10 3.0–3.25
Quantitative demands (high) 4.06 3.75–5.0 4.09 3.75–5.0 3.73 3.4–5.0
Influence at work (high) 3.94 3.5–5.0 3.95 3.5–5.0 4.08 3.75–5.0
Influence at work (medium) 3.00 2.75–3.33 3.00 2.75–3.33 3.26 3.0–3.67
Influence at work (low) 2.07 1.0–2.67 2.11 1.0–2.67 2.33 1.0–2.75
ERI (low) .39 .20–.51 .35 .20–.44 .31 .20–.37
ERI (medium) .62 .51–.75 .56 .45–.67 .45 .37–.53
ERI (high) 1.07 .75–5.0 .98 .68–3.27 .77 .53–5.0
n 16,770 2140 2606
Mean scores for age, effort–reward imbalance ratio and degree of lifting and bending (L&B).
M. Simon et al. / International Journal of Nursing Studies 45 (2008) 24–3428
5.2. Risk factor analysis
The multinomial logistic regression analysis confirms
the association of the selected risk factors with back and
neck-pain-related disability (Tables 3–4). Expectedly,
higher exposure was associated with higher risks
indicating an exposure-outcome gradient. Notably, for
almost all variables the odds ratios (OR) were higher for
the extreme ‘high disability’ classification and somewhat
reduced OR for ‘medium disability’. This was the case
for all independent variables.
Risk factor analysis of different types of institutions
showed similar patterns for in-patient facilities (hospi-
tals and nursing homes) and to some extent diverging for
home care institutions where OR were mostly lower.
As expected, nursing aides were slightly more at risk
of disability. Interestingly, this increased after mutual
adjustment (Model b) of all independent variables.
In all three institution types L&B was associated with
disability. Members of the group with highest lifting and
bending exposure had—on bivariate level—an up to 2.5
fold higher risk than their colleagues with lower lifting
exposure. Mutual adjustment of variables, however,
reduced the OR considerably indicating a weak or
limited association of L&B and disability.
The availability and use of lifting aids in hospitals and
in NH was only marginally associated with disability.
There was no association in home care institutions.
Quantitative demands were the second strongest pre-
dictor of disability (OR up to 3.3), however, mutual
adjustment reduced the OR substantially. The associa-
tion of ‘influence at work’ with disability (bivariate level
OR up to 1.9) disappeared completely after mutual
adjustment in all three institution types.
The strongest predictor of disability was by far the
ERI ratio. The tertile of participants with the highest
ERI ratio had in hospitals a 6.2 fold risk for suffering
from disability, in nursing homes this was 7.3 and in
home care institutions 8.1. After mutual adjustment the
OR were still considerably high (5.1, 6.5 and 6.4,
respectively).
The analysis by country and type of institution
(Table 5) confirms these findings with a high degree of
consistency, supporting a strong association between
ERI and disability. In 14 of 19 settings ERI was
significantly associated with disability, L&B was sig-

ARTICLE IN PRESS
Table 4
Risk factors for disability: multivariate odds mutually adjusted including age, gender & country
Model B Hospitals Nursing homes Home care
Medium disability High disability Medium disability High disability Medium disability High disability
OR 95% CI OR 95% CI OR 95% CI OR 95% CI OR 95% CI OR 95% CI
Qualification — — — — — — — — — — — —
Qualification (aids) 1.29** (1.10–1.50) 1.98** (1.61–2.43) 1.37* (1.07–1.77) 2.02** (1.43–2.83) 1.08 (0.75–1.55) 1.49 (0.92–2.44)
L&B (low) — — — — — — — — — — — —
L&B (medium) 1.12* (1.02–1.22) 1.12 (0.98–1.27) 1.41* (1.08–1.84) 1.20 (0.83–1.73) 1.31 (0.99–1.72) 1.15 (0.74–1.76)
L&B (high) 1.17** (1.07–1.28) 1.35** (1.19–1.54) 1.07 (0.82–1.38) 1.59** (1.10–2.30) 1.23 (0.91–1.66) 1.21 (0.77–1.92)
Lifting aids (available+used) — — — — — — — — — — — —
Lifting aids (no) 1.05 (0.96–1.15) 1.21** (1.06–1.39) 0.97 (0.72–1.32) 1.48 (1.00–2.18) 1.09 (0.87–1.38) 0.87 (0.60–1.25)
Lifting aids (not used) 1.18* (1.04–1.33) 1.20 (1.00–1.44) 1.01 (0.75–1.37) 1.19 (0.81–1.75) 0.95 (0.60–1.52) 0.47 (0.20–1.10)
Quantitative demands (low) — — — — — — — — — — — —
Quantitative demands (med) 0.98 (0.90–1.07) 1.07 (0.93–1.22) 1.08 (0.81–1.46) 1.34 (0.93–1.95) 0.95 (0.74–1.23) 1.24 (0.80–1.92)
Quantitative demands (high) 1.17** (1.05–1.29) 1.52** (1.31–1.76) 1.02 (0.79–1.31) 1.12 (0.74–1.70) 1.09 (0.85–1.39) 1.85** (1.24–2.78)
Influence at work (high) — — — — — — — — — — — —
Influence at work (med) 0.99 (0.91–1.08) 0.91 (0.80–1.03) 1.14 (0.87–1.49) 1.03 (0.73–1.46) 1.07 (0.85–1.34) 0.93 (0.64–1.34)
Influence at work (low) 1.02 (0.93–1.11) 0.95 (0.83–1.08) 1.04 (0.81–1.33) 1.04 (0.72–1.50) 1.24 (0.96–1.59) 0.86 (0.58–1.28)
ERI (low) — — — — — — — — — — — —
ERI (med) 1.79** (1.63–1.97) 1.97* (1.69–2.31) 1.52** (2.05–3.91) 1.77** (1.13–2.78) 1.68** (1.32–2.15) 3.08** (1.87–5.05)
ERI (high) 2.83** (2.55–3.15) 5.05** (4.30–5.93) 2.83** (1.17–1.99) 6.52** (4.04–10.52) 2.91** (2.23–3.80) 6.40** (3.83–10.70)
*po0.05, **po0.01.
Table 3
Risk factors for disability: bivariate odds adjusted for age, gender & country
Model A Hospitals Nursing homes Home care
Medium disability High disability Medium disability High disability Medium disability High disability
OR 95% CI OR 95% CI OR 95% CI OR 95% CI OR 95% CI OR 95% CI
Qualification — — — — — — — — — — — —
Qualification (aids) 1.98** (1.61–2.43) 1.85** (1.52–2.25) 1.34 (1.05–1.72) 1.82** (1.32–2.50) 0.97 (0.68–1.37) 1.22 (0.77–1.90)
L&B (low) — — — — — — — — — — — —
L&B (medium) 1.12 (0.98–1.27) 1.40** (1.24–1.59) 1.23 (0.96–1.56) 1.58** (1.12–2.24) 1.36* (1.04–1.77) 1.36 (0.91–2.05)
L&B (high) 1.35** (1.19–1.54) 2.06** (1.83–2.33) 1.79* (1.39–2.29) 2.44** (1.73–3.44) 1.41* (1.06–1.87) 1.69* (1.10–2.60)
Lifting aids (available+used) — — — — — — — — — — — —
Lifting aids (no) 1.21** (1.06–1.39) 1.15* (1.01–1.31) 0.91 (0.67–1.21) 1.33 (0.92–1.92) 1.09 (0.87–1.36) 0.84 (0.59–1.18)
Lifting aids (not used) 1.20 (1.00–1.44) 1.29** (1.08–1.54) 1.07 (0.80–1.43) 1.28 (0.89–1.84) 1.14 (0.72–1.79) 0.58 (0.25–1.34)
Quantitative demands (low) — — — — — — — — — — — —
Quantitative demands (med) 1.07 (0.93–1.22) 1.59** (1.40–1.81) 1.33* (1.05–1.69) 2.11** (1.50–2.96) 1.18 (0.93–1.51) 1.66* (1.09–2.52)
Quantitative demands (high) 1.52** (1.31–1.76) 3.08** (2.71–3.49) 1.84** (1.42–2.36) 2.64** (1.85–3.78) 1.74** (1.40–2.16) 3.24** (2.27–4.63)
Influence at work (high) — — — — — — — — — — — —
Influence at work (med) 0.91 (0.80–1.03) 1.14* (1.01–1.29) 1.26 (1.00–1.59) 1.44* (1.04–1.99) 1.23 (0.99–1.53) 1.22 (0.86–1.73)
Influence at work (low) 0.95 (0.83–1.08) 1.55** (1.38–1.75) 1.60** (1.25–2.05) 1.91** (1.38–2.66) 1.64** (1.30–2.06) 1.49* (1.04–2.14)
ERI (low) — — — — — — — — — — — —
ERI (med) 1.97* (1.69–2.31) 2.14** (1.84–2.49) 1.63** (2.40–4.26) 1.93** (1.24–2.98) 1.74** (1.37–2.20) 3.49** (2.14–5.67)
ERI (high) 5.05** (4.30–5.93) 6.20** (5.36–7.16) 3.20** (1.27–2.10) 7.25** (4.69–11.20) 3.19** (2.50–4.06) 8.07** (5.00–13.04)
*po0.05, **po0.01.
M. Simon et al. / International Journal of Nursing Studies 45 (2008) 24–34 29
nificant in 7, quantitative demands in 6 and technical
lifting aids in five settings (all findings in the expected
direction).
6. Discussion
This study showed a pronounced relationship between
psychosocial factors and back or neck-pain-related
disability, which was higher than the association with
physical factors. Furthermore this analysis showed that
this finding was consistent across all types of institutions
and qualification levels in all countries, in both crude
and adjusted models.
This result raises mainly three questions regarding the
first study objective, the investigation of the association
of physical and psychosocial risk factors to neck/back-
pain-related disability: Are the results in line with

ARTICLE IN PRESSM. Simon et al. / International Journal of Nursing Studies 45 (2008) 24–3430
previous research? Is disability more susceptible to
psychosocial risk factors? And, finally, what are possible
explanations for the weak association found between
physical load and disability?
The association between psychosocial factors and
MSD in general is still controversial. Different authors
found no or weak relations between back pain or
disability and psychosocial variables in both reviews
(Davis and Heaney, 2000) and in primarily empirical
papers (Hoogendoorn et al., 2002), whereas others
found support for such an interrelation (Crook et al.,
2002, van den Heuvel et al., 2004). The strong
association of ERI-ratio and back-pain-related disability
found in our investigation supports the role of
psychosocial factors in association with back or neck-
pain-related disability. It is in line with two other
investigations (van Vegchel et al., 2005) which linked
musculoskeletal outcomes with the ERI-model, and our
results are consistent with previous evidence of a
significant association between psychosocial factors
and both acute (often pain) and chronic states (dis-
ability) (Linton, 2000). Nevertheless it should be kept in
mind, that this analysis is based on a cross-sectional
survey and is therefore not qualified for drawing any
causal inferences.
Regarding the unexpected weak association of L&B
and disability, we have to point out, that measurements
used in this secondary analysis were primarily focussed
on the aims of the NEXT-Study, which are different
from those of this analysis. We used combined ‘back
and neck-pain-related disability’ as outcome, a mea-
sure that is less common than the direct assessment
of pain and furthermore not specific regarding the
location of the pain (low back, neck, upper limb, etc.).
This lack of precision may have an impact on the
association with the investigated factors, mainly leading
to an underestimation of risk. The L&B scale might
have shown a higher association with back related
disability compared to neck-related disability. We
cannot exclude a stronger association in the assess-
ment of low back disability only. Another reason
may be the following: According to Turner et al.
(2004) disability is especially related to more severe
states of pain. Maybe physical exposure is more
associated with less severe neck and low back outcomes
and, in contrast, the role of psychosocial factors might
increase with the severity of pain and therefore the more
chronic states of disability. This supports the more
pronounced association of disability with ERI in
contrast to L&B.
The dominant role of ERI and the major reduction of
quantitative demands and influence at work in the
mutually adjusted model (b) could be partly attributed
to the theoretical background of the variables. Both
quantitative demands and influence at work on the one
hand and effort-reward imbalance on the other hand
stems from stress models and may in parts explain the
same phenomena. However correlation of ERI and
quantitative demands (.49) and influence at work (.27)
rule out multicollinearity as an explanation.
The rather weak association of physical factors (L&B
and availability and usage of lifting aids) raises the
question about validity of the instruments we used. The
L&B score consists of eight items, which assessed the
amount of relevant physical tasks like getting patients to
bed, transferring and clothing patients, but also
miscellaneous tasks such as making beds, pushing
trolleys, etc. Content validity was repeatedly assessed
by experts, scores for skewness and kurtosis were
satisfactorily ranging between �.07 and 1.28 in all ten
participating countries and the internal consistency of
the scale was high (alpha values ranging from .79 to .91
[Kummerling et al., 2003]). The range of our L&B scale
is from 0 to 100. A mean score of 50 already indicates
very high physical loads. Our data, however, indicate
that only after a measure of 60 a steep increase of
disability occurs, but such a high physical load was rare
in our nursing sample (only about 10% of all
participants). We do not question that even a ‘normal’
physical load may lead to spine complaints, but we
speculate that other influential factors (such as psycho-
social work load and other health-related conditions)
may hide this effect making it very difficult or even
impossible to measure. Only extreme physical exposure
leaves space for an association between physical
exposure and measurements of spine complaints.
Regarding the second aim of the study, our results
precisely document the heterogeneous nature of nurses’
work across the different settings (types of institutions,
countries). Higher exposure to L&B in nursing homes, a
pronounced effort-reward imbalance in hospitals, and
lower exposures in both domains in home care institu-
tions are consistent with common expectations for these
types of organisations.
The results from this and another analysis (Simon et
al., 2005) implicate that the type of institution (and the
national background) mainly define the psychosocial
and physical demands of nurses. Therefore differences
regarding the institutional type should be considered as
an important ecological variable.
7. Conclusion
The strong relation of psychosocial factors (especially
effort and reward) and disability adds these to a list of
factors that should be addressed by preventive measures
for back or neck-pain-related disability. This supports
the call for multifactor interventions (Hignett, 2003) and
highlights the need for research on interventions cover-
ing the contribution of both psychosocial and physical
factors.

ARTIC
LEIN
PRES
S
Table 5
Risk factors for high disability by type of institutions and country: multivariate odds mutually adjusted including age
Belgium Germany France Italy Netherlands Poland Slovakia
Hospital (n ¼ 1819) Hospital (n ¼ 2181) Hospital (n ¼ 3043) Hospital (n ¼ 3478) Hospital (n ¼ 2338) Hospital (n ¼ 2520) Hospital (n ¼ 1391)
Odds (95% CI) Odds (95% CI) Odds (95% CI) Odds (95% CI) Odds (95% CI) Odds (95% CI) Odds (95% CI)
Qualification
Qualification (aids) 2.16 (1.32–3.55)** 1.13 (0.46–2.79) 1.97 (1.53–2.54)** 1.02 (1.01–1.04)** 4.27 (1.69–10.79)** (Only RN in sample) (Only RN in sample)
L&B (low)
L&B (medium) 1.24 (0.76–2.03) 1.37 (0.98–1.93) 1.20 (0.89–1.61) 0.95 (0.73–1.23) 0.67 (0.36–1.25) 1.09 (0.79–1.51) 1.40 (0.96–2.05)
L&B (high) 1.59 (1.00–2.52)* 1.48 (1.04–2.11)* 1.05 (0.79–1.41) 0.93 (0.72–1.20) 1.05 (0.58–1.87) 1.56 (1.14–2.15)* 2.34 (1.58–3.47)**
Lifting Aids (available+used)
Lifting aids (n/a) 1.11 (0.75–1.64) 1.25 (0.91–1.73) 1.14 (0.88–1.49) 1.41 (1.07–1.85)* 0.77 (0.46–1.28) 2.02 (1.11–3.69)* 0.9 (0.33–3.00)
Lifting aids (not used) 1.13 (0.73–1.74) 0.93 (0.62–1.40) 1.55 (1.08–2.21)* 1.38 (0.94–2.04) 0.84 (0.42–1.68) 1.91 (0.70–5.25) 1.53 (0.07–31.66)
Quantitative demands (low)
Quantitative demands (med) 0.83 (0.53–1.31) 1.19 (0.81–1.75) 0.85 (0.63–1.13) 1.35 (1.02–1.79)* 1.19 (0.70–2.04) 1.15 (0.79–1.69) 1.05 (0.70–1.58)
Quantitative demands (high) 1.31 (0.81–2.12) 1.95 (1.32–2.89)** 0.98 (0.70–1.39) 1.80 (1.34–2.43)** 0.76 (0.34–1.68) 1.72 (1.17–2.53)* 1.74 (1.13–2.69)**
Influence at work (high)
Influence at work (med) 0.96 (0.63–1.47) 0.71 (0.52–0.97) 1.14 (0.86–1.52) 0.93 (0.70–1.22) 0.55 (0.32–0.96)* 0.96 (0.69–1.35) 0.89 (0.58–1.36)
Influence at work (low) 0.90 (0.58–1.41) 0.97 (0.71–1.33) 1.25 (0.93–1.69) 1.08 (0.84–1.41) 0.87 (0.49–1.54) 0.75 (0.53–1.04) 0.79 (0.53–1.19)
ERI (low)
ERI (med) 2.81 (1.72–4.57)** 2.10 (1.15–3.82)* 1.97 (1.43–2.72)** 1.56 (1.12–2.17)* 3.29 (1.93–5.63)** 2.08 (1.33–3.24)** 1.93 (1.25–2.97)**
ERI (high) 5.65 (3.32–9.62)** 6.85 (3.75–12.50)** 5.62 (3.94–8.00)** 4.07 (2.94–5.63)** 7.76 (3.21–18.73)** 5.72 (3.75–8.74)** 3.09 (2.01–4.76)**
Nursing homes (n ¼ 208) Nursing homes (n ¼ 345) Nursing homes (n ¼ 397) Nursing homes (n ¼ 124) Nursing homes (n ¼ 673) Nursing homes (n ¼ 138) Nursing homes (n ¼ 254)
Qualification (aids) 2.27 (0.86–6.01) 1.54 (0.74–3.21) 1.92 (0.87–4.25) (only RN in Sample) 2.65 (1.07–6.56)* (only RN in Sample) 3.85 (1.58–9.37)**
L&B (low)
L&B (medium) 0.49 (0.12–2.00) 1.59 (0.64–3.92) 0.86 (0.36–2.07) 1.63 (0.38–6.96) 1.73 (0.56–5.39) 0.76 (0.15––3.93) 1.13 (0.46–2.75)
L&B (high) 1.71 (0.58–5.05) 0.95 (0.39–2.33) 3.04 (1.30–7.13)* 0.38 (0.06–2.57) 1.37 (0.37–4.98) 7.84 (1.53–40.09)* 1.37 (0.58–3.23)
Lifting aids (available+used)
Lifting aids (n/a) 2.43 (0.32–18.20) 1.45 (0.57–3.73) 2.95 (1.38–6.30)* 0.60 (0.13–2.85) 1.17 (0.14–10.11) 12.91 (1.12–148.19)* 0.97 (0.44–2.13)
M.
Sim
on
eta
l./
Intern
atio
na
lJ
ou
rna
lo
fN
ursin
gS
tud
ies4
5(
20
08
)2
4–
34
31

ARTIC
LEIN
PRES
STable 5 (continued )
Belgium Germany France Italy Netherlands Poland Slovakia
Hospital (n ¼ 1819) Hospital (n ¼ 2181) Hospital (n ¼ 3043) Hospital (n ¼ 3478) Hospital (n ¼ 2338) Hospital (n ¼ 2520) Hospital (n ¼ 1391)
Odds (95% CI) Odds (95% CI) Odds (95% CI) Odds (95% CI) Odds (95% CI) Odds (95% CI) Odds (95% CI)
Lifting aids (not used) 0.95 (0.31–2.91) 1.04 (0.53–2.06) 1.24 (0.59–2.61) 0.81 (0.17–3.76) 4.00 (0.77–20.74) 27.02 (0.71–1027.99) 0.75 (0.04–13.99)
Quantitative demands (low)
Quantitative demands (med) 1.99 (0.43–9.20) 4.29 (1.39–13.26)* 0.67 (0.28–1.60) 1.68 (0.41–6.86) 1.67 (0.62–4.48) 0.83 (0.19–3.76) 1.64 (0.71–3.78)
Quantitative demands (high) 0.80 (0.17–3.83) 3.51 (1.12–11.03)* 0.48 (0.19–1.18) 1.48 (0.31–7.06) 0.50 (0.09–2.86) 1.15 (0.18–7.34) 1.21 (0.42–3.53)
Influence at work (high)
Influence at work (med) 1.43 (0.43–4.70) 1.15 (0.53–2.52) 0.72 (0.32–1.58) 1.10 (0.27–4.56) 1.95 (0.69–5.52) 0.99– (0.22–4.50) 0.74 (0.30–1.82)
Influence at work (low) 0.80 (0.23–2.71) 1.54 (0.70–3.37) 0.86 (0.37–2.00) 0.61 (0.11–3.40) 1.39 (0.39–4.98) 1.06 (0.20–5.52) 1.38 (0.55–3.45)
ERI (low)
ERI (med) 15.71 (3.23–76.46)** 3.16 (0.36–27.9) 1.43 (0.51–3.97) 0.83 (0.06–11.63) 1.88 (0.75–4.71) – 1.64 (0.65–4.17)
ERI (high) 3.54 (0.81–15.48) 17.45 (2.02–150.46)* 5.92 (2.01–17.42)** 9.42 (0.91–97.53) 2.32 (0.44–12.32) 2.1E+09 (3.1E+08–1.2E+10)** 3.30 (1.17–9.31)*
Home care (n ¼ 1253) Home care (n ¼ 256) Home care (n ¼ 43) Home care (n ¼ 285) Home care (n ¼ 572) Home care (n ¼ 161) Home care (n ¼ 33)
Qualification (aids) 0.66 (0.08–5.19) 3.66 (1.43–9.34)* n/a (Only RN in sample) 1.05 (0.43–2.60) (To view cases) n/a
L&B (low)
L&B (medium) 2.06 (0.69–6.11) 3.33 (1.05–10.56)* n/a 0.58 (0.14–2.41) 0.69 (0.27–1.73) (To view cases) n/a
L&B (high) 1.93 (0.65–5.69) 5.65 (1.81–17.60)** n/a 0.73 (0.13–4.19) 0.15 (0.02–1.32) (To view cases) n/a
Lifting aids (available+used)
Lifting aids (n/a) 1.17 (0.67–2.01) 0.43 (0.19– 0.99) n/a 0.45 (0.15–1.36) 1.29 (0.50–3.33) (to view cases)
Lifting aids (not used) 0.23 (0.03–1.76) 0.79 (0.21–2.93) n/a 0.22 (0.02–2.27) n/a (to view cases) n/a
Quantitative demands (low)
Quantitative demands (med) 1.00 (0.44–2.26) 1.09 (0.33–3.57) n/a 1.27 (0.30–5.30) 1.33 (0.49–3.61) 1.39 (0.28–6.92) n/a
Quantitative demands (high) 1.86 (0.89–3.90) 1.87 (0.66–5.33) n/a 1.91 (0.71–5.14) 3.07 (1.10–8.58)* 1.44 (0.24–8.85) n/a
Influence at work (high)
Influence at work (med) 1.13 (0.65–1.94) 0.63 (0.20–1.99) n/a 0.45 (0.15–1.38) 0.84 (0.28–2.51) 0.32 (0.05–1.99) n/a
Influence at work (low) 0.76 (0.39–1.50) 0.49 (0.18–1.40) n/a 0.63 (0.22–1.82) 1.59 (0.52–4.87) 0.18 (0.02–1.82) n/a
ERI (low)
ERI (med) 3.54 (1.69– 7.43)** 1.14(0.12–10.94) n/a 0.38 (0.08–1.76) 3.71 (1.37–10.02)* 2.13 (0.17–27.31) n/a
ERI (high) 3.76 (1.70–8.34)** 7.75(0.87–68.75) n/a 3.67 (1.11–12.16)* 10.74 (3.57–32.33)** 6.89 (0.73–64.75) n/a
*po0.05,**po0.01.
M.
Sim
on
eta
l./
Intern
atio
na
lJ
ou
rna
lo
fN
ursin
gS
tud
ies4
5(
20
08
)2
4–
34
32
ARTICLE IN PRESSM. Simon et al. / International Journal of Nursing Studies 45 (2008) 24–34 33
Acknowledgements
NEXT was funded by the European Commission
within the 5th framework programme (EU-project no.:
QLK6-CT-2001-00475). This secondary analysis was
funded by the Berufsgenossenschaft fur Gesundheits-
dienst und Wohlfahrtspflege, BGW (Germany).
References
Armstrong, T.J., Buckle, P., Fine, L.J., Hagberg, M., Jonsson,
B., Kilbom, A., Kuorinka, I.A., Silverstein, B.A., Sjogaard,
G., Viikari-Juntura, E.R., 1993. A conceptual model for
work-related neck and upper-limb musculoskeletal disor-
ders. Scandinavian Journal of Work Environment & Health
19 (2), 73–84.
Bongers, P.M., de Winter, C.R., Kompier, M.A., Hildebrandt,
V.H., 1993. Psychosocial factors at work and musculoske-
letal disease. Scandinavian Journal of Work Environment &
Health 19 (5), 297–312.
Carayon, P., Smith, M.J., Haims, M.C., 1999. Work organiza-
tion, job stress, and work-related musculoskeletal disorders.
Human Factors 41 (4), 644–663.
Cheung, K., Gillen, M., Faucett, J., N., K., 2006. The
Prevalence of and Risk Factors for Back Pain Among
Home Care Nursing Personnel in Hong Kong. American
Journal of Industrial Medicine 49 (1), 14–22.
Crook, J., Milner, R., Schultz, I.Z., Stringer, B., 2002.
Determinants of occupational disability following a low
back injury: a critical review of the literature. Journal of
Occupational Rehabilitation 12 (4), 277–295.
Davis, K.G., Heaney, C.A., 2000. The relationship between
psychosocial work characteristics and low back pain:
underlying methodological issues. Clinical Biomechanics
15 (6), 289–406.
Elders, L.A.M., Burdorf, A., 2001. Interrelations of risk factors
and low back pain in scaffolders. Occupational and
Environmental Medicine 58 (9), 597–603.
Grabbe, Y., Nolting, H.-D., Loos, S., 2005. DAK-BGW
Gesundheitsreport 2005—Stationare Krankenpflege 2005.
BGW, DAK, Hamburg.
Gunnarsdottir, H.K., Rafnsdottir, G.L., Helgadottir, B.,
Tomasson, K., 2003. Psychosocial risk factors for muscu-
loskeletal symptoms among women working in geriatric
care. American Journal of Industrial Medicine 44 (6),
679–684.
Hasselhorn, H.-M., Tackenberg, P., Muller, B.H., 2003.
Working Conditions and Intent to Leave the Profession
Among Nursing Staff in Europe. National Institute for
Working Life, Stockholm.
Hasselhorn, H.-M., Muller, B.H., Tackenberg, P., 2005. NEXT
Scientific Report July 2005. http://www.next.uni-wupper-
tal.de/download/NEXTscientificreportjuly2005.pdf, Wup-
pertal. [last access: 2006-11-13]
Hignett, S., 2003. Intervention strategies to reduce musculos-
keletal injuries associated with handling patients: a
systematic review. Occupational and Environmental Med-
icine 60(9), E6. nicht im Text
Hoogendoorn, W.E., Bongers, P.M., de Vet, H.C., Ariens,
G.A., van Mechelen, W., Bouter, L.M., 2002. High physical
work load and low job satisfaction increase the risk of
sickness absence due to low back pain: results of a
prospective cohort study. Occupational and Environmental
Medicine 59 (5), 323–328.
Ijzelenberg, W., Burdorf, A., 2004. Patterns of care for low
back pain in a working population. Spine 29 (12),
1362–1368.
Kristensen, T.S., Hannerz, H., Hogh, A., Borg, V., 2005. The
Copenhagen Psychosocial Questionnaire: a tool for the
assessment and improvement of the psychosocial work
environment. Scandinavian Journal of Work Environment
& Health 31 (6), 438–449.
Kummerling, A., Hasselhorn, H.-M., Tackenberg, P., 2003.
Psychometric properties of the scales used in the NEXT-
Study. In: Hasselhorn, H.-M., Tackenberg, P., Muller, B.H.
(Eds.), Working Conditions and Intent to Leave the
Profession Among Nursing Staff in Europe. National
Institute for Working Life and authors, Stockholm, pp.
237–257.
Lagerstrom, M., Hansson, T., Hagberg, M., 1998. Work-
related low-back problems in nursing. Scandinavian Journal
of Work Environment & Health 24 (6), 449–464.
Linton, S., 2000. Psychological risk factors for neck and back
pain. In: Nachemson, A.L., Jonsson, E. (Eds.), Neck and
Back Pain: The Scientific Evidence of Causes, Diagnosis,
and Treatment. Lippincott Williams & Wilkins, Philadel-
phia, pp. 57–78.
Menzel, N.N., 2004. Back pain prevalence in nursing personnel:
measurement issues. AAOHN Journal 52 (2), 54–65.
Panel on Musculoskeletal Disorders and the Workplace—
Commission on Behavioral and Social Sciences and Educa-
tion—National Research Council, 2001. Musculoskeletal
Disorders and the Workplace: Low Back and Upper
Extremities. National Academy Press, Washington, DC.
Paoli, P., Merllie, D., 2001. Third European Survey on
Working Conditions 2000. European Foundation for the
Improvement of Living and Working Conditions, Dublin.
Pattani, S., Constantinovici, N., Williams, S., 2001. Who retires
early from the NHS because of ill health and what does it
cost? A national cross sectional study. British Medical
Journal 322 (7280), 208–209.
Rugulies, R., Braff, J., Frank, J.W., Aust, B., Gillen, M., Yen,
I.H., Bhatia, R., Ames, G., Gordon, D.R., Janowitz, I.,
Oman, D., Jacobs, B.P., Blanc, P., 2004. The psycho-
social work environment and musculoskeletal disorders:
design of a comprehensive interviewer-administered ques-
tionnaire. American Journal of Industrial Medicine 45 (5),
428–439.
Sherehiy, B., Karwowski, W., Marek, T., 2004. Relationship
between risk factors and musculoskeletal disorders in the
nursing profession: a systematic review. Occupational
Ergonomics 4, 241–279.
Siegrist, J., 1996. Adverse health effects of high-effort/low-
reward conditions. Journal of Occupational Health Psy-
chology 1 (1), 27–41.
Siegrist, J., Starke, D., Chandola, T., Godin, I., Marmot, M.,
Niedhammer, I., Peter, R., 2004. The measurement of
effort-reward imbalance at work: European comparisons.
Social Science & Medicine 58 (8), 1483–1499.

ARTICLE IN PRESSM. Simon et al. / International Journal of Nursing Studies 45 (2008) 24–3434
Simon, M., Hasselhorn, H.-M., Kummerling, A., 2005.
Physical exposure to lifting and bending tasks among
nurses in Europe. In: NEXT Scientific Report July 2005.
http://www.next.uni-wuppertal.de/download/NEXTscienti-
ficreportjuly2005.pdf, Wuppertal. [last access: 2006-11-13]
Smedley, J., Trevelyan, F., Inskip, H., Buckle, P., Cooper, C.,
Coggon, D., 2003. Impact of ergonomic intervention on
back pain among nurses. Scandinavian Journal of Work
Environment & Health 29 (2), 117–123.
SPSS Inc., 2005. SPSS 11.04 for Macintosh. Chicago.
Theorell, T., Perski, A., Akerstedt, T., Sigala, F.,
Ahlberg-Hulten, G., Svensson, J., Eneroth, P.,
1988. Changes in job strain in relation to changes
in physiological state. A longitudinal study. Scan-
dinavian Journal of Work Environment & Health 14 (3),
189–196.
Turner, J.A., Franklin, G., Heagerty, P.J., Wu, R., Egan, K.,
Fulton-Kehoe, D., Gluck, J.V., Wickizer, T.M., 2004. The
association between pain and disability. Pain 112 (3),
307–314.
van den Heuvel, S.G., Ariens, G.A.M., Boshuizen, H.C.,
Hoogendoom, W.E., Bongers, P.M., 2004. Prognostic
factors related to recurrent low-back pain and sickness
absence. Scandinavian Journal of Work Environment &
Health 30 (6), 459–467.
van Vegchel, N., de Jonge, J., Bosma, H., Schaufeli, W., 2005.
Reviewing the effort-reward imbalance model: drawing up
the balance of 45 empirical studies. Social Science &
Medicine 60 (5), 1117–1131.
Violante, F.S., Fiori, M., Fiorentini, C., Risi, A., Garagnani,
G., Bonfiglioli, R., Mattioli, S., 2004. Associations of
psychosocial and individual factors with three different
categories of back disorder among nursing staff. Journal of
Occupational Health 46 (2), 100–108.
von Korff, M., Ormel, J., Keefe, F.J., Dworkin, S.F., 1992.
Grading the severity of chronic pain. Pain 50 (2), 133–149.