Embed Size (px)
Citation preview
Back to Basics (plus a little extra)
on Geotechnical Engineering:
Ground Compaction
Alan Parrock • 1971 - First exposed to soil mechanics at university
• 1973 – Natal Roads Department
• 1976 – Professional engineer
• 1976 – NITRR of the CSIR
• 1978 – BKS now Aecom
• 1982 – First exposed to rock mechanics
• 1993 – Founded ARQ
• 2007 – Fellow of SAICE
• 2010 – Geotechnical Division Gold Medal
• 2011 – Keynote address 15 ARC in Maputo
• 2013 – Keynote address Geo Africa Ghana
• 2015 - Convenor SABS TC98 SC006 responsible for drafting the new SA geotechnical design code and reliability based design approach

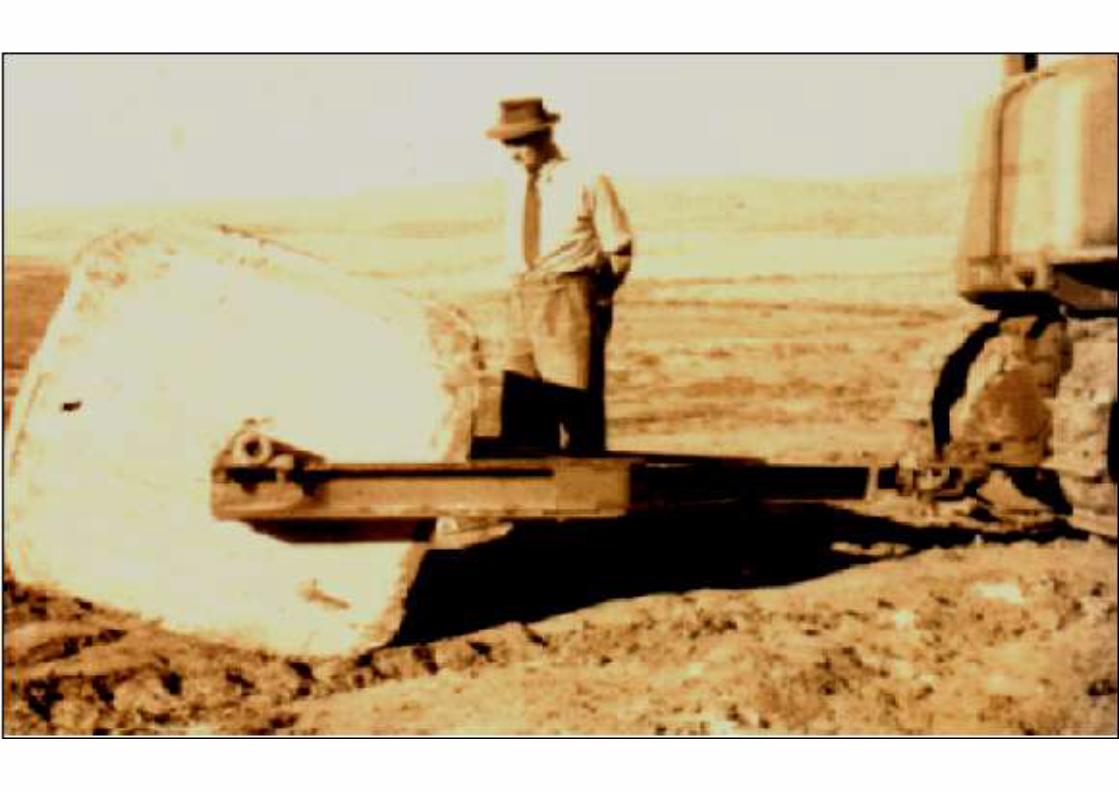
COMPACTION – in the beginning – TMH1-1979
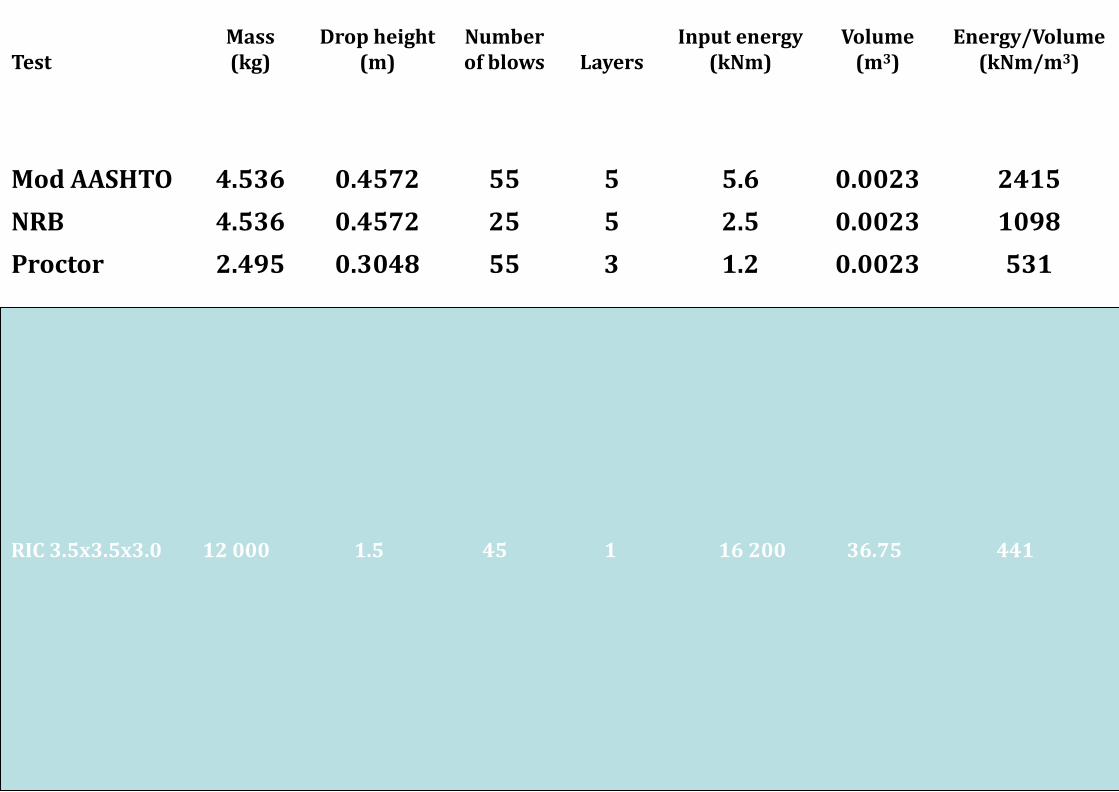
Test Mass (kg)
Drop height (m)
Number of blows Layers
Input energy (kNm)
Volume (m3)
Energy/Volume (kNm/m3)
Mod AASHTO 4.536 0.4572 55 5 5.6 0.0023 2415
NRB 4.536 0.4572 25 5 2.5 0.0023 1098
Proctor 2.495 0.3048 55 3 1.2 0.0023 531
Impact roller
Five sided 4927.5 0.158 20 1 152.8 1.1610* 132
Three sided 6167.5 0.215 20 1 260.2 1.1610* 224
Ram compaction*
7*7*5 11500 18.5 20 1 41741.6 245.0000 170
5*5*5 11500 18.5 20 1 41741.6 125.0000 334
5*5*4 11500 18.5 20 1 41741.6 100.0000 417
Vibratory compaction
Bomag 212 20356.8 0.0017 300 1 101.8 0.3150** 323
* = 1m depth ** = 0.15m depth, 10 passes, 3.6m/sec and 30 vibrations/second
RIC 3.5x3.5x3.0 12 000 1.5 45 1 16 200 36.75 441 RIC 3.5x3.5x3.0 12 000 1.5 45 1 16 200 36.75 441
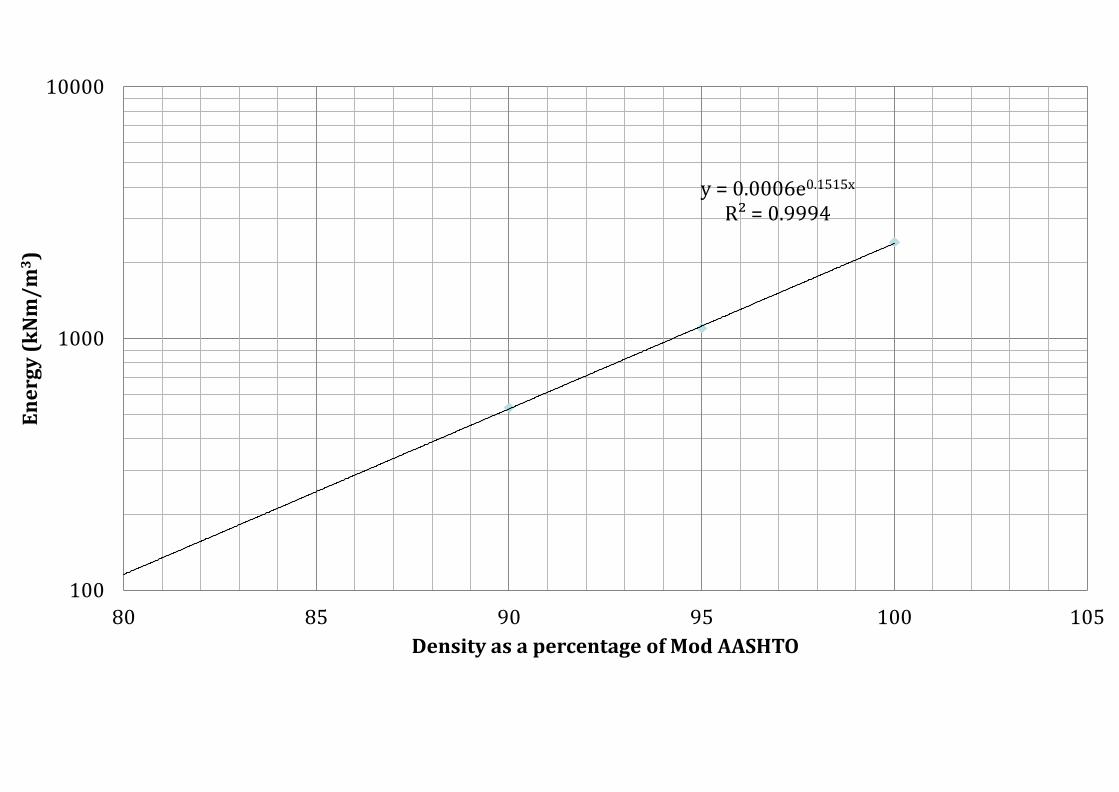
y = 0.0006e0.1515x R² = 0.9994
100
1000
10000
80 85 90 95 100 105
En
erg
y (
kN
m/
m3)
Density as a percentage of Mod AASHTO
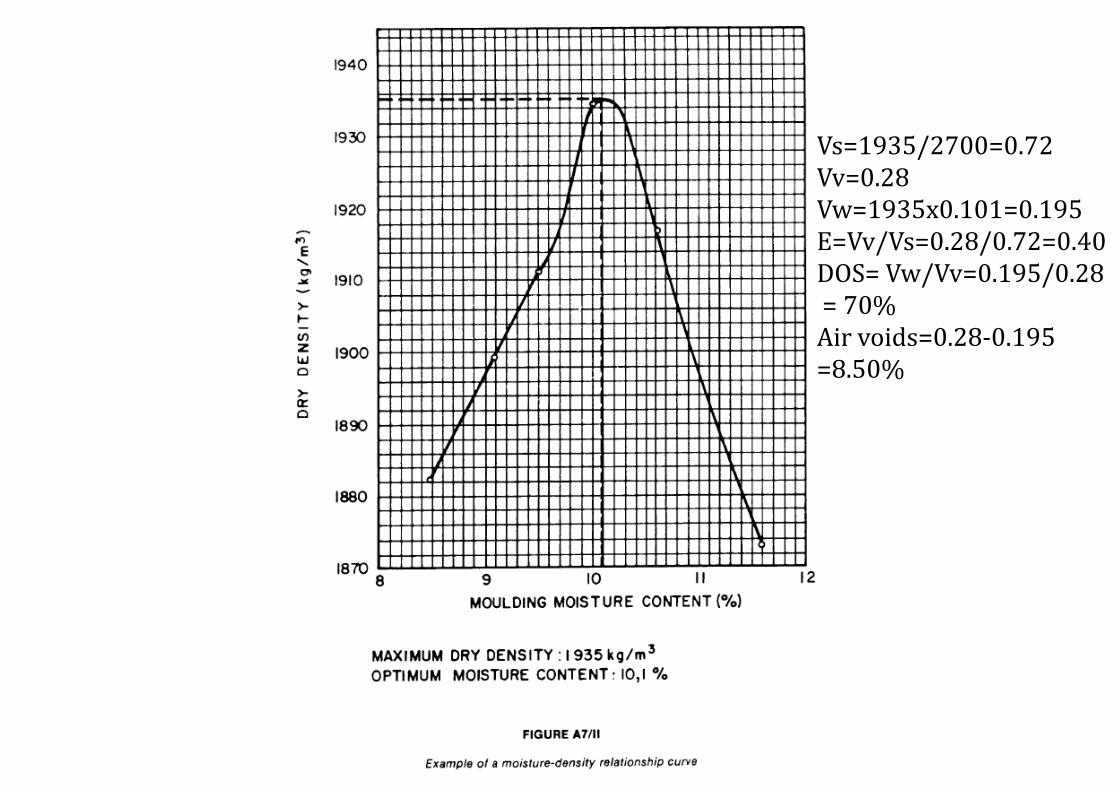
Vs=1935/2700=0.72 Vv=0.28 Vw=1935x0.101=0.195 E=Vv/Vs=0.28/0.72=0.40 DOS= Vw/Vv=0.195/0.28 = 70% Air voids=0.28-0.195 =8.50%

CBR
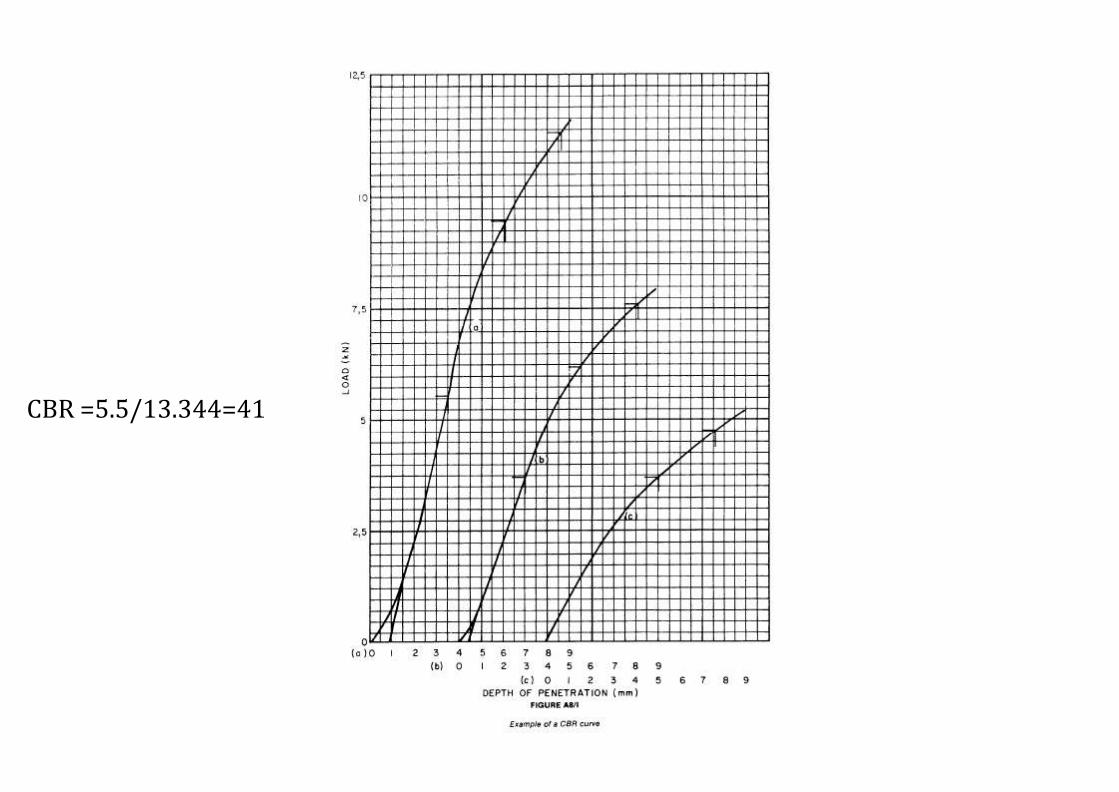
CBR =5.5/13.344=41

Stiffness – plate load test
E=πσr(1-ν2)/2δ
Bearing capacity for derivation of shear strength
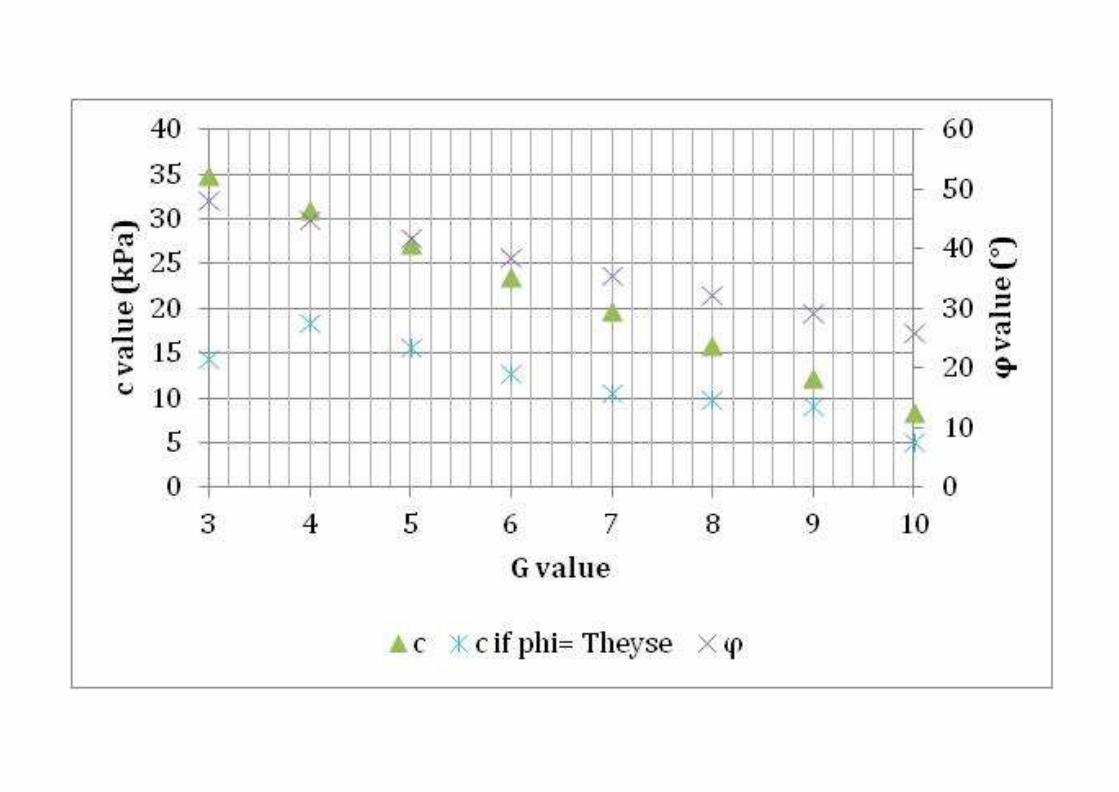
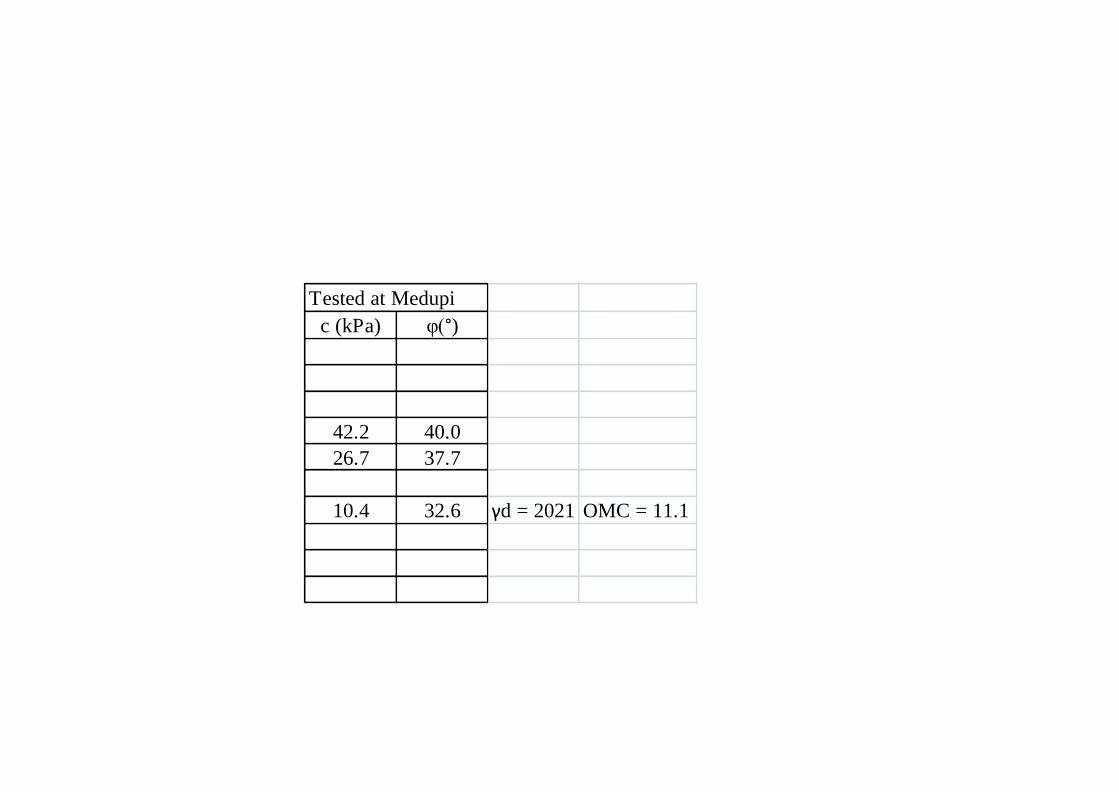
Tested at Medupi
c (kPa) φ(°)
42.2 40.0
26.7 37.7
10.4 32.6 γd = 2021 OMC = 11.1

Now some theory
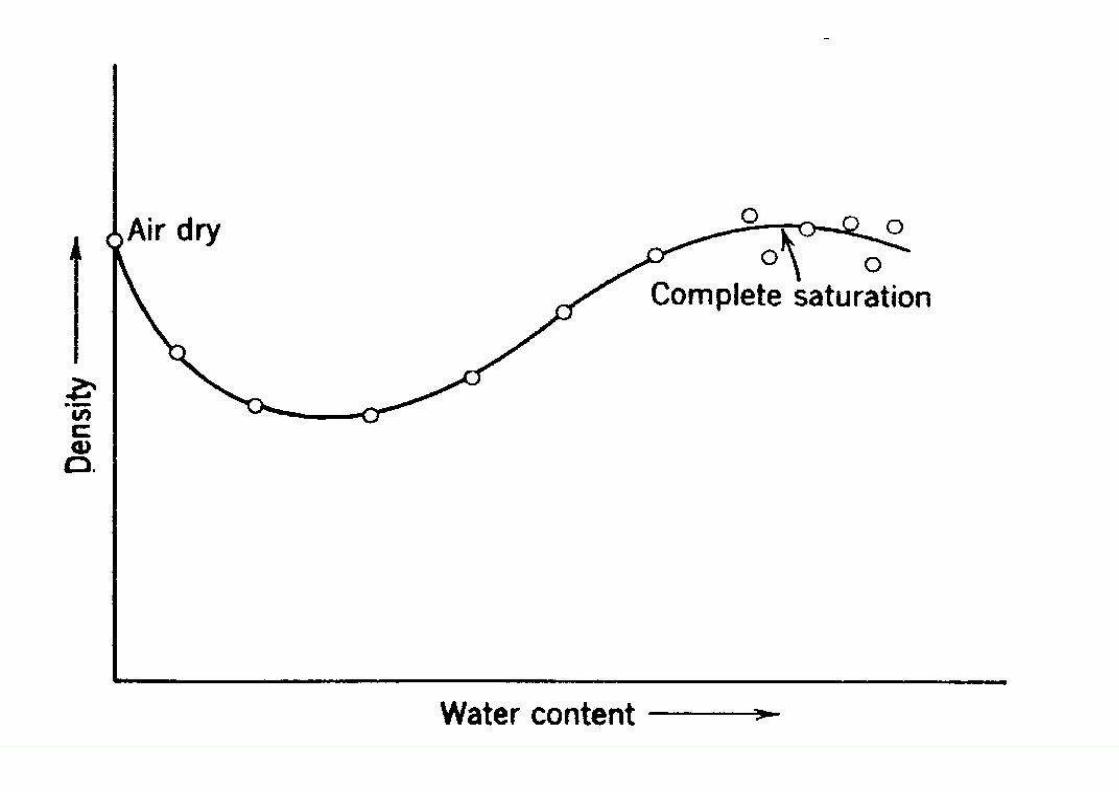
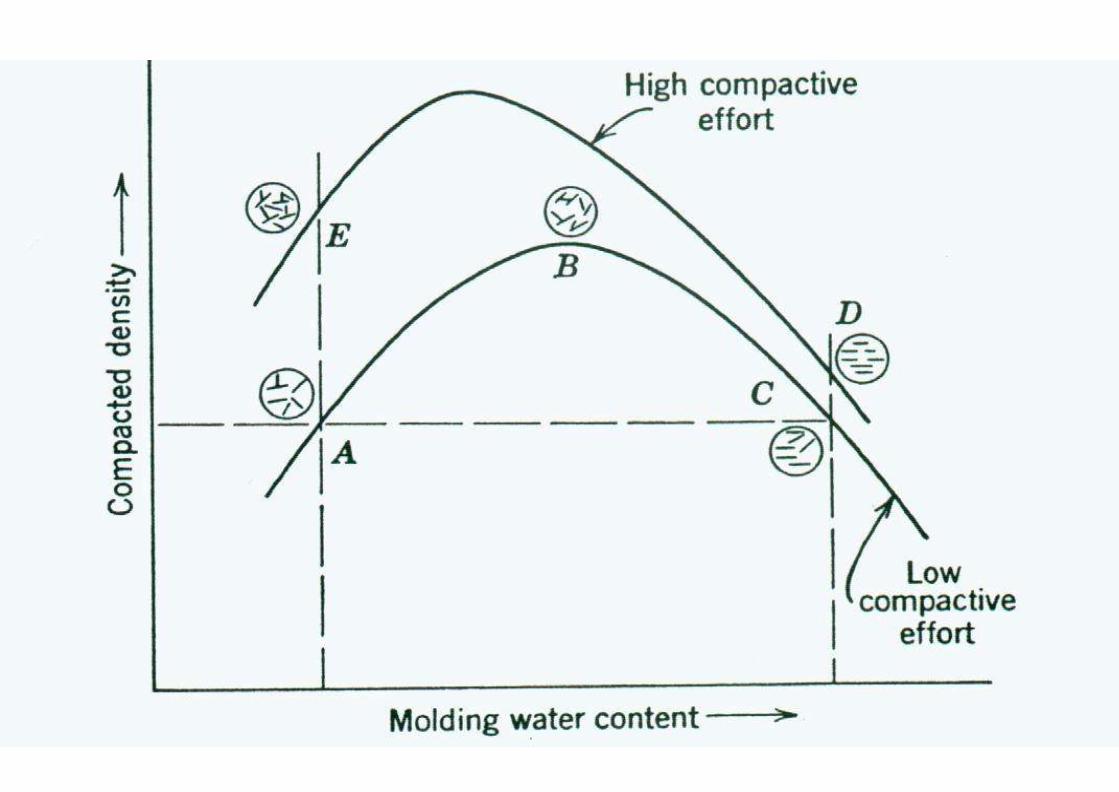
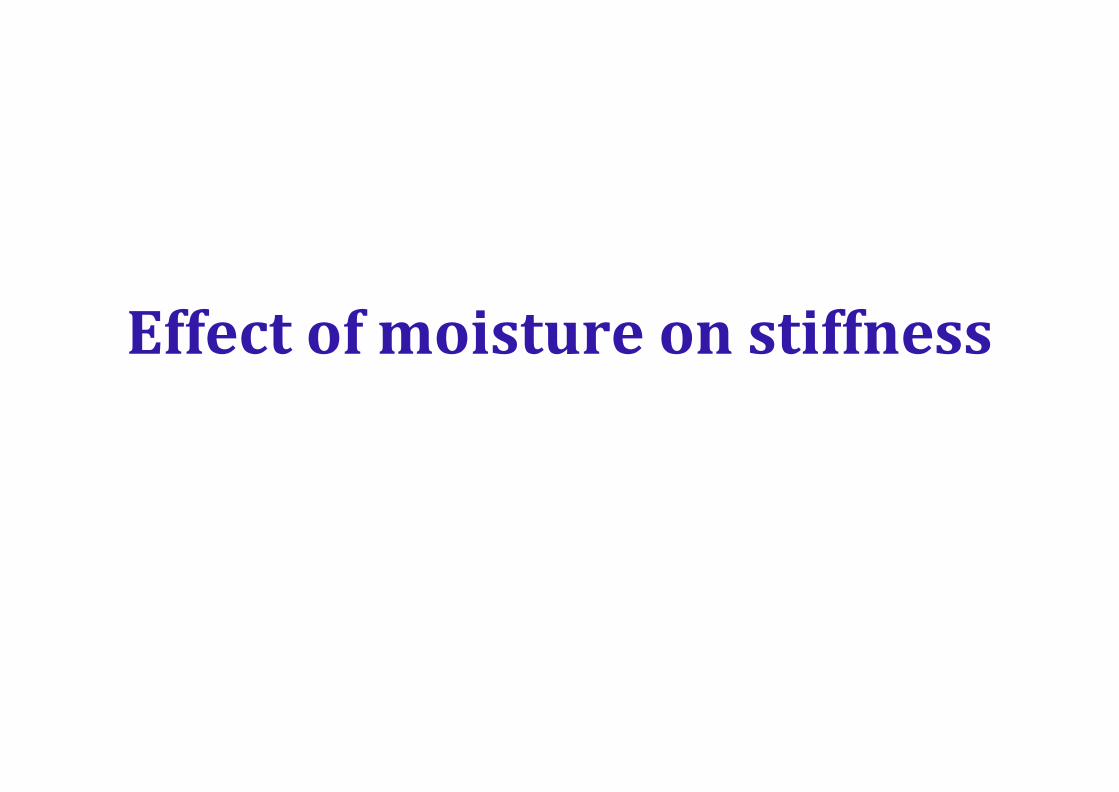
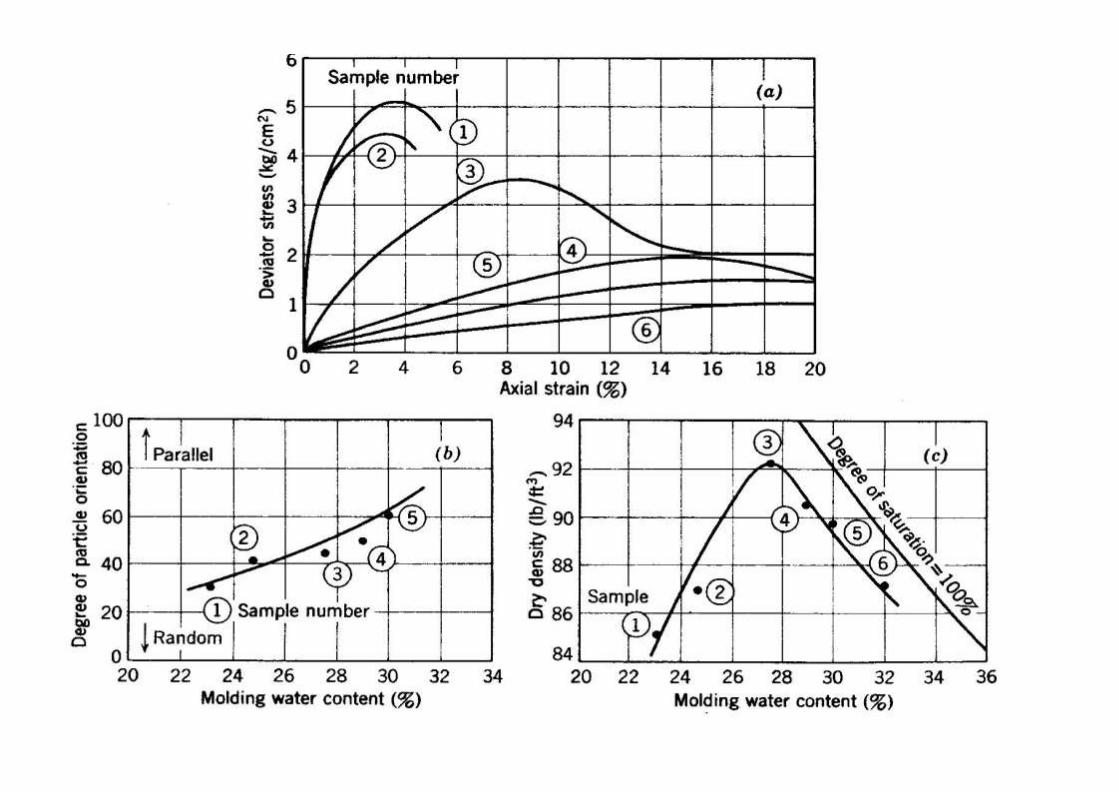
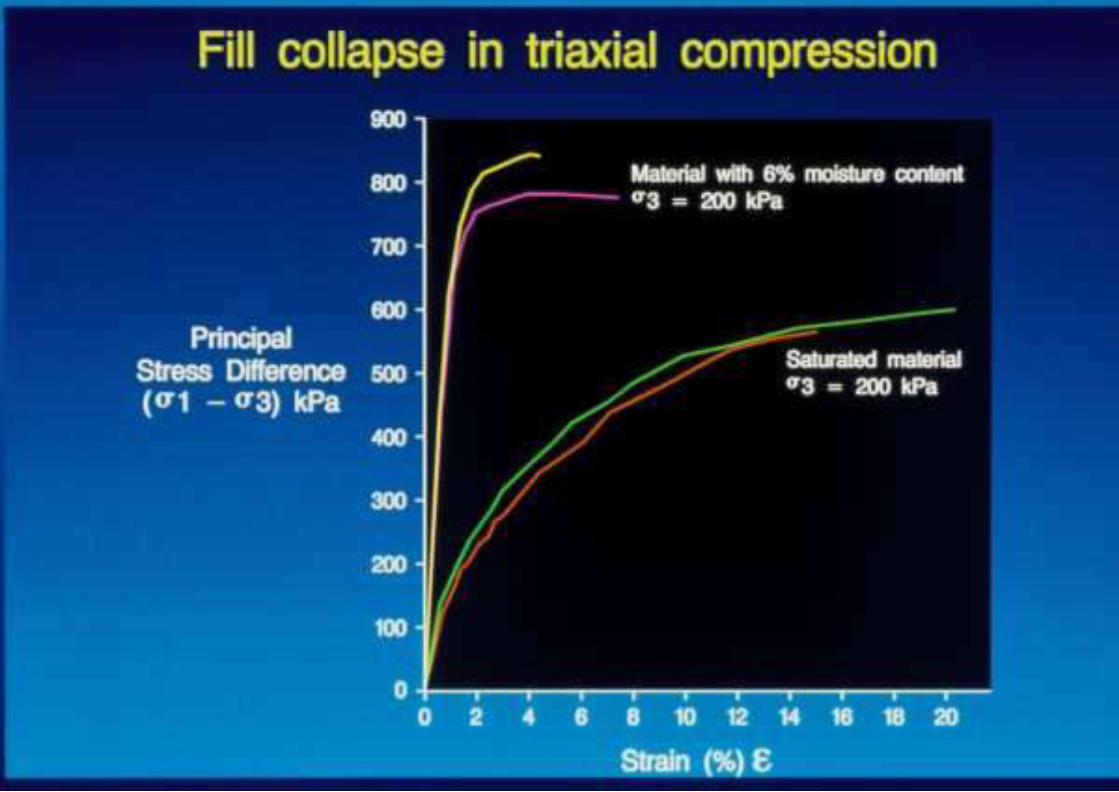
Effect of moisture on stiffness
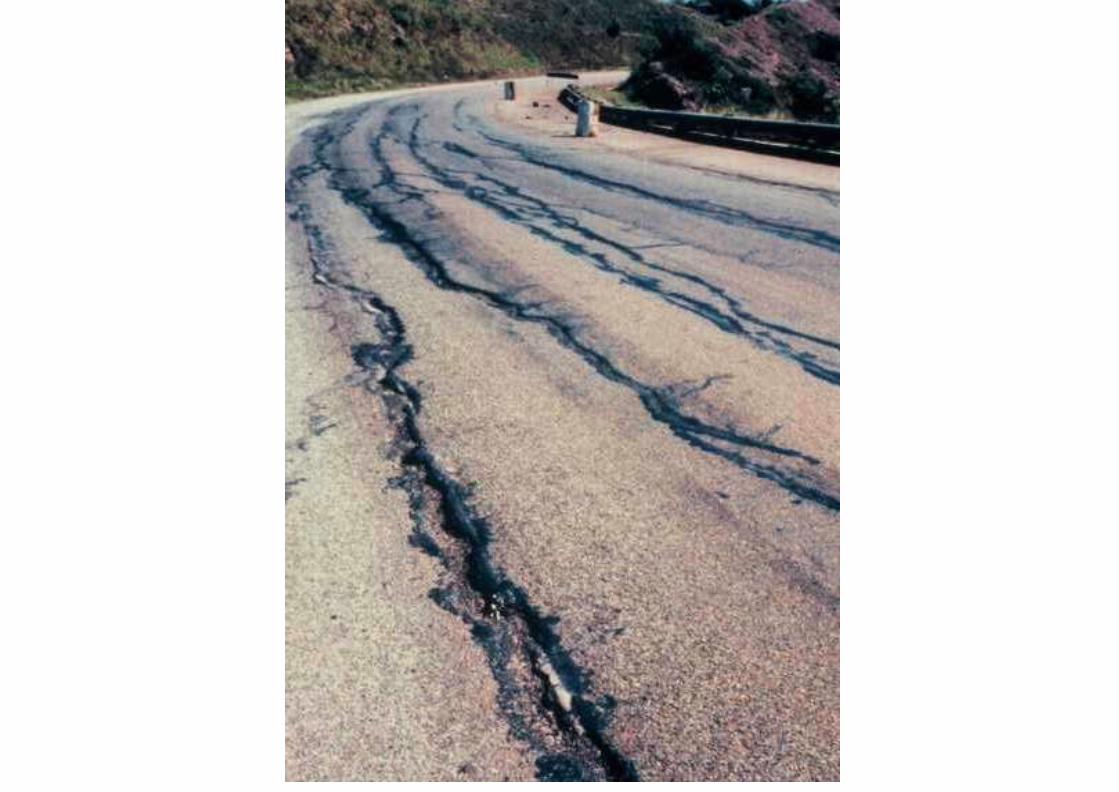
Effect of moisture on stiffness-practical considerations
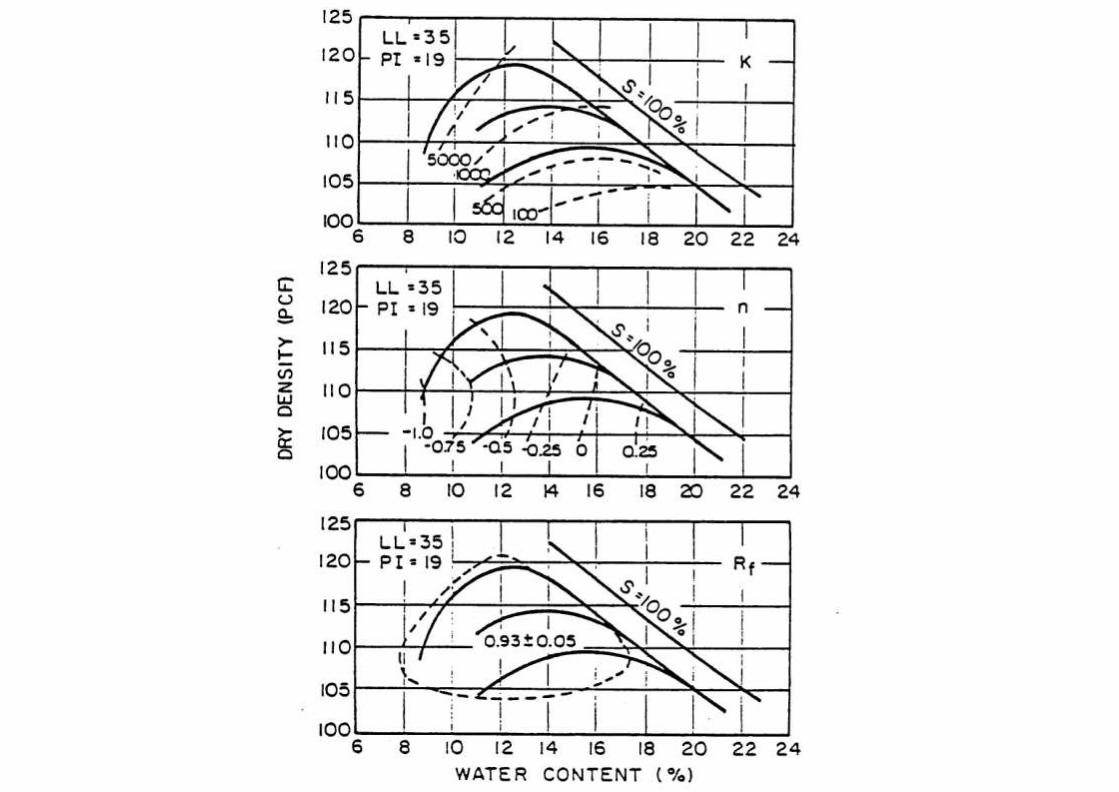
Effects on hyperbolic parameters


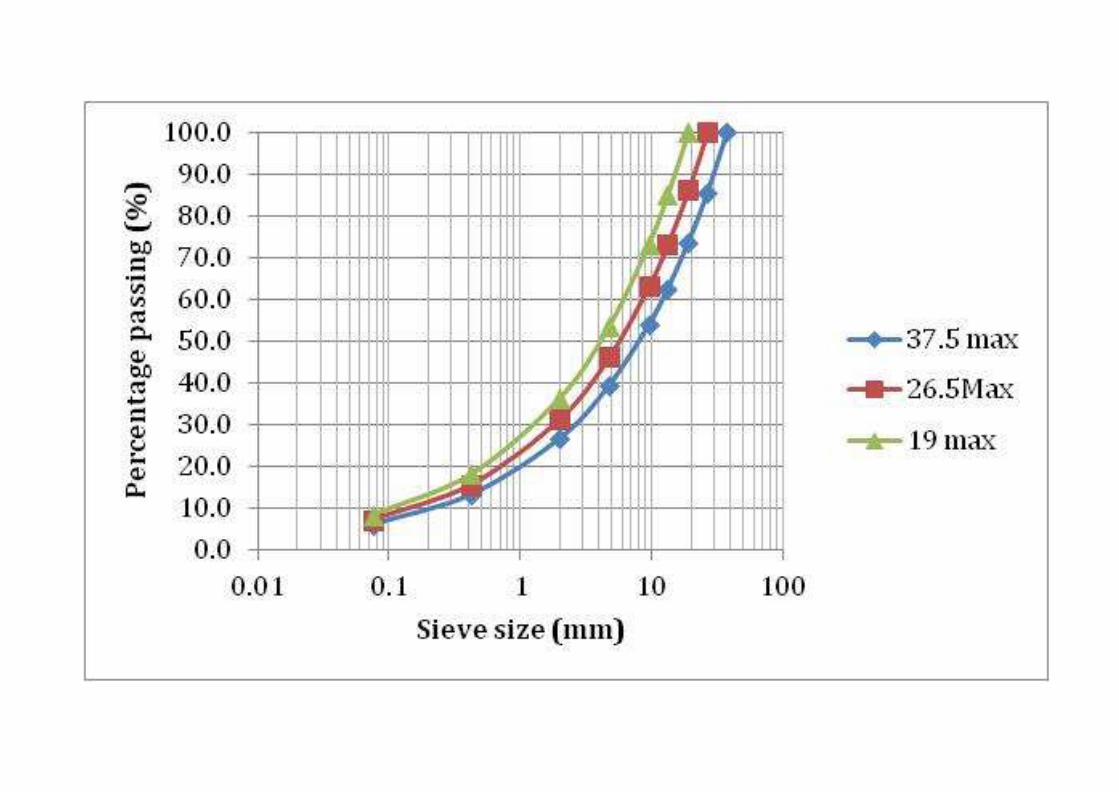
So how do we know if materials are going to compact easily
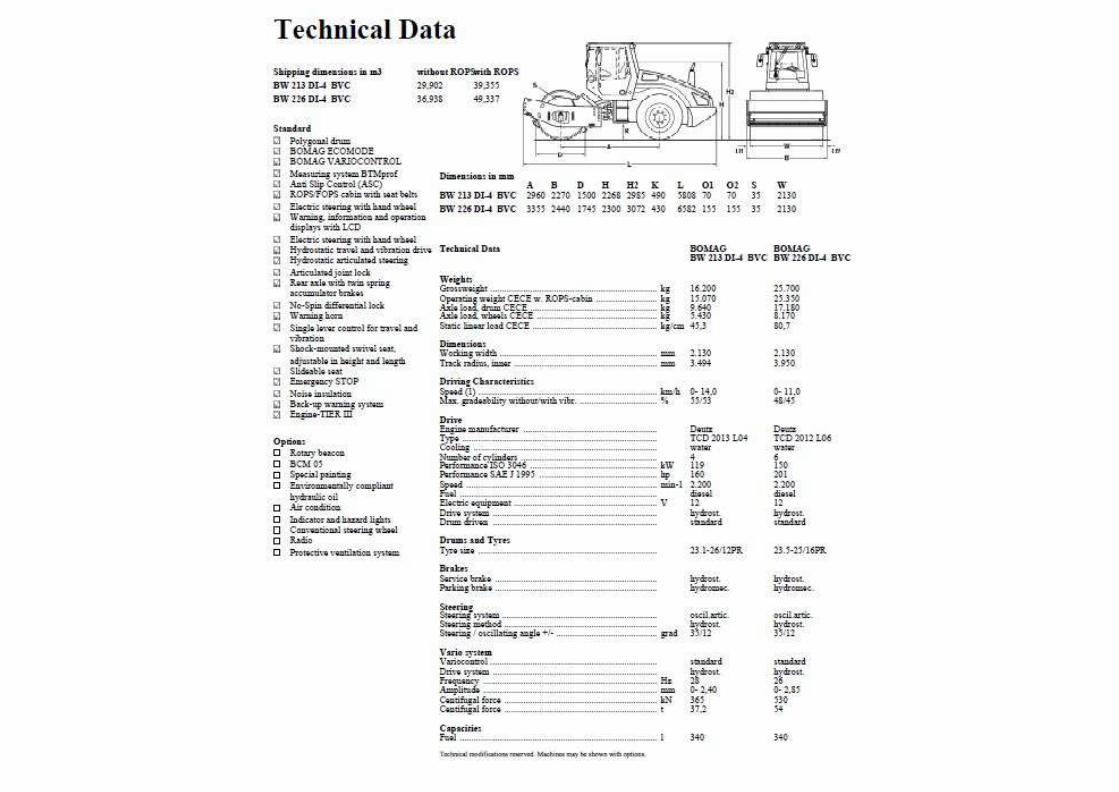
Attributes of field rollers and stiffness achieved after
compaction
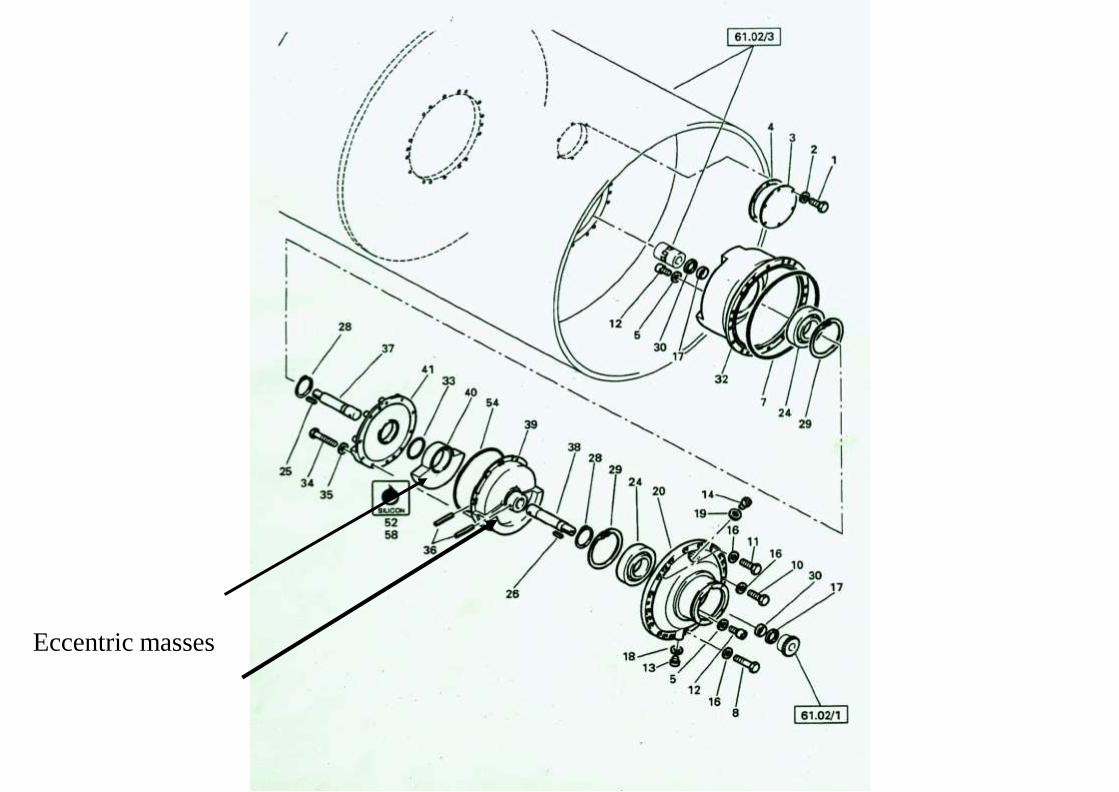
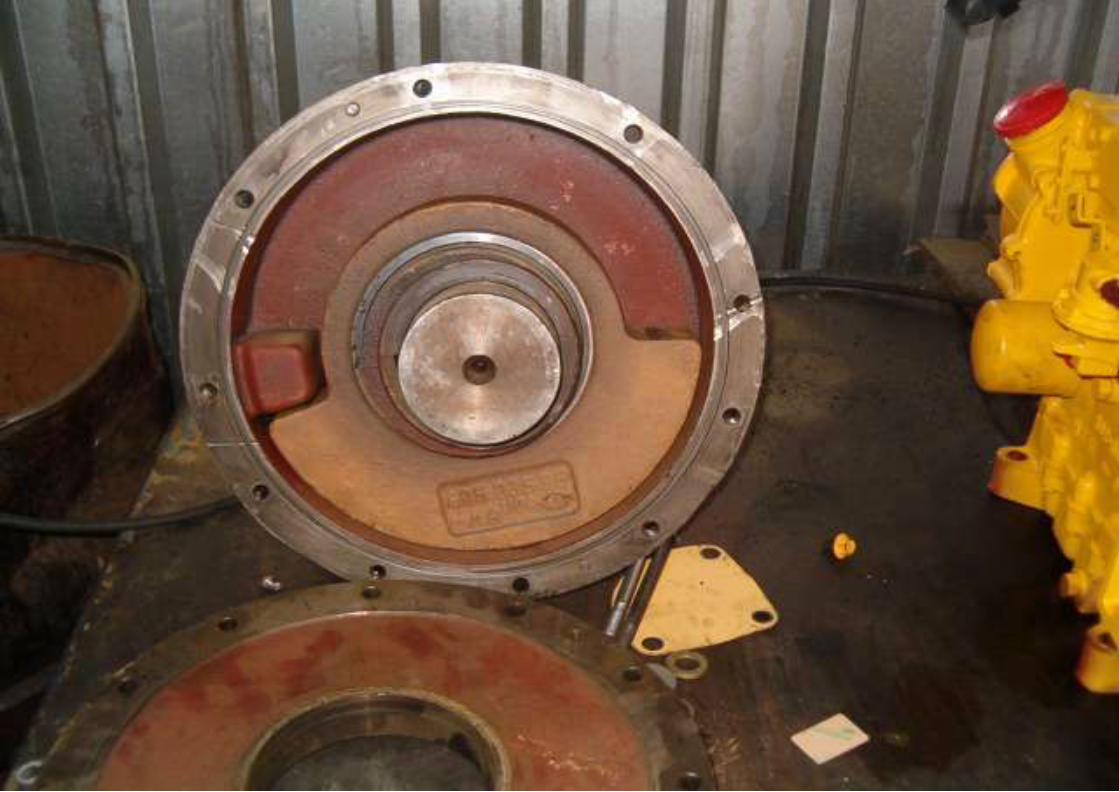
Eccentric masses
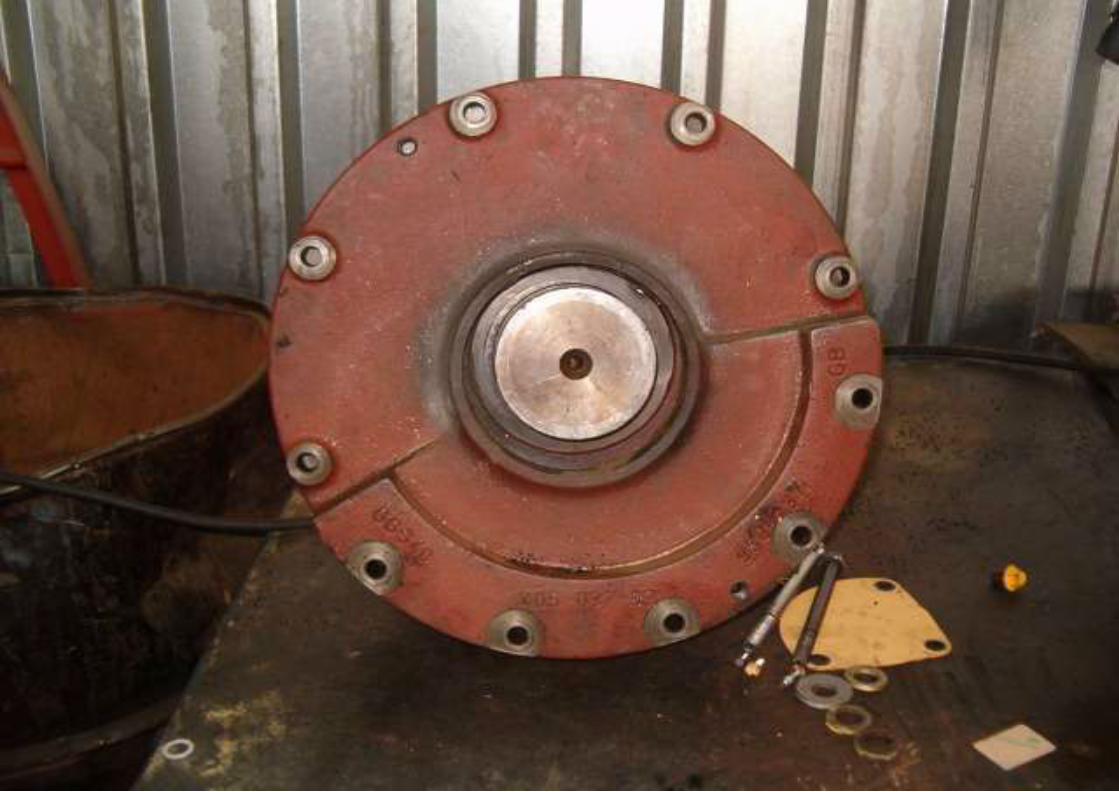


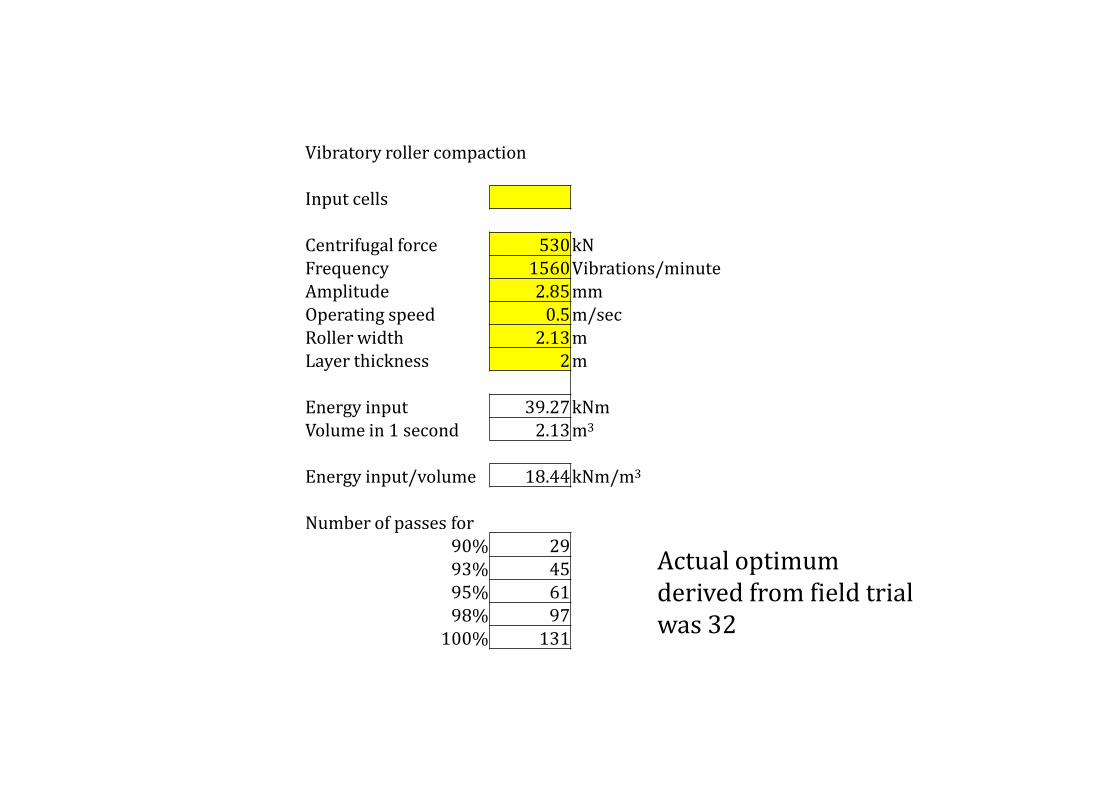
Vibratory roller compaction
Input cells
Centrifugal force 530 kN Frequency 1560 Vibrations/minute Amplitude 2.85 mm Operating speed 0.5 m/sec Roller width 2.13 m Layer thickness 2 m
Energy input 39.27 kNm Volume in 1 second 2.13 m3
Energy input/volume 18.44 kNm/m3
Number of passes for 90% 29 93% 45 95% 61 98% 97
100% 131
Actual optimum derived from field trial was 32
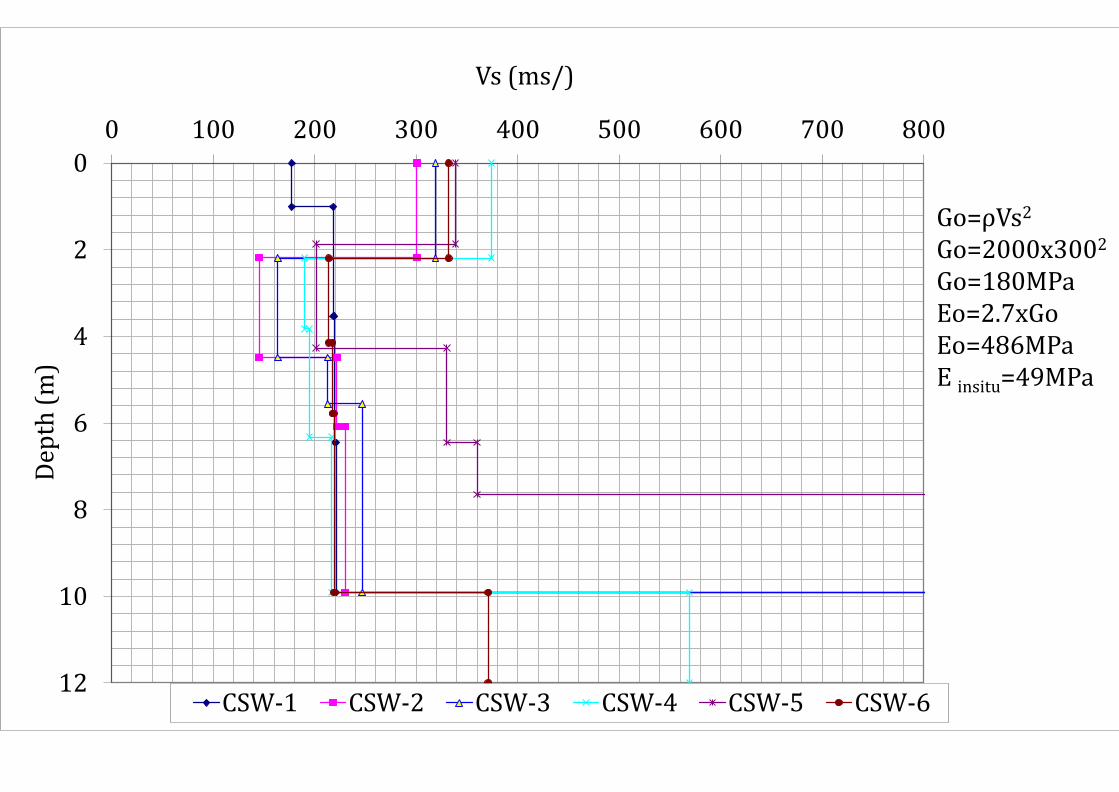
0
2
4
6
8
10
12
0 100 200 300 400 500 600 700 800
Dep
th (
m)
Vs (ms/)
CSW-1 CSW-2 CSW-3 CSW-4 CSW-5 CSW-6
Go=ρVs2
Go=2000x3002
Go=180MPa Eo=2.7xGo Eo=486MPa E insitu=49MPa
Vibration Compaction
• Vibration compaction
• Vibration replacement


Impact compaction DC, RIC and Impact rolling

Comparison
DC RIC
Mass (tonne) 12.5 9-12
Drop Height (m) 15-18 1-1.5
Energy (kJ/blow) 1764-2116 88-176
Momentum (tm/s) 214-234 40-65
Blow Rate (blows/min) <1 40-60
Compaction Depth (m) 6-8 3-4
PropertyCompaction Method
RIC
• Speed
• Safety
• Mobility
• Portability
Applications of RIC
• Foundation support
• Stone columns
• Floor slab strengthening
• Liquefaction mitigation
• Waste stabilisation
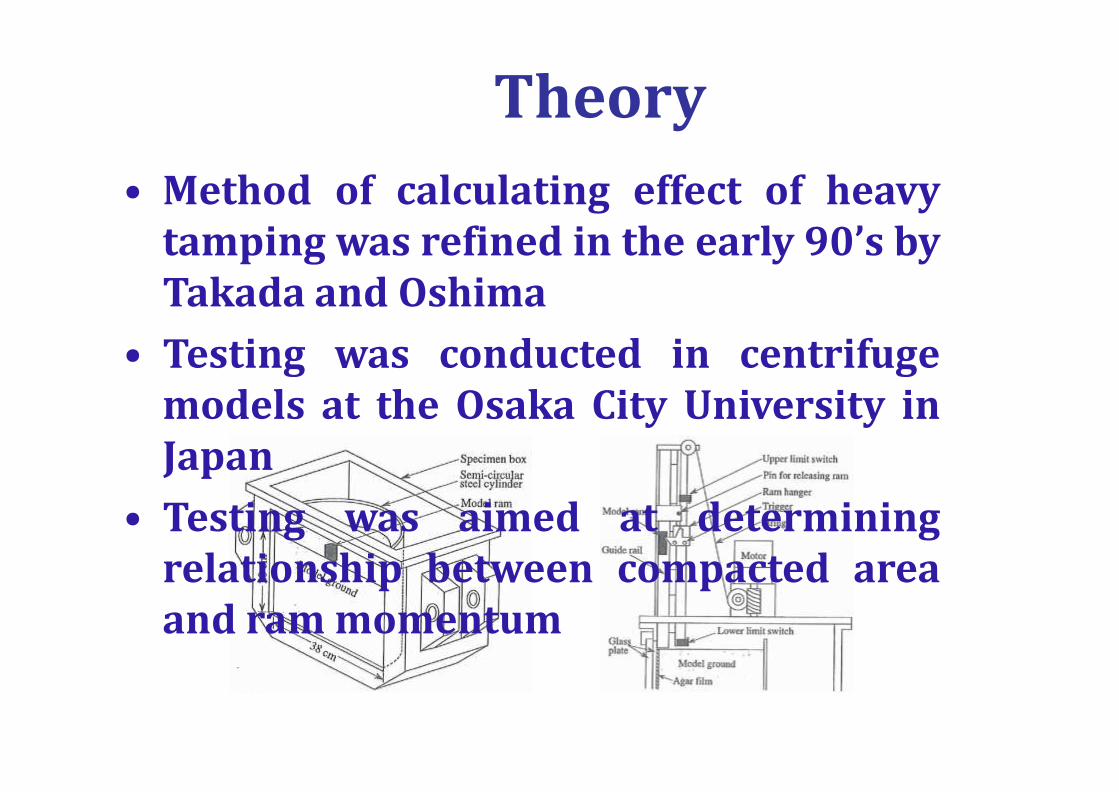
Theory
• Method of calculating effect of heavy tamping was refined in the early 90’s by Takada and Oshima
• Testing was conducted in centrifuge models at the Osaka City University in Japan
• Testing was aimed at determining relationship between compacted area and ram momentum
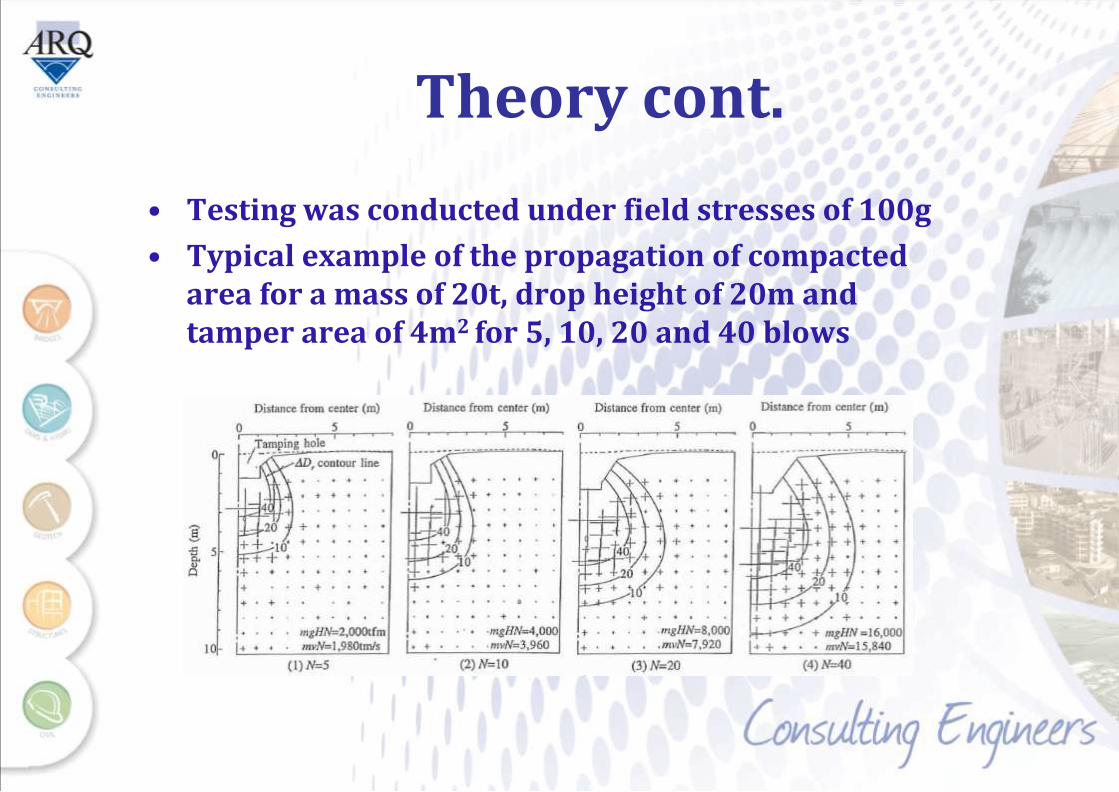
Theory cont.
• Testing was conducted under field stresses of 100g
• Typical example of the propagation of compacted area for a mass of 20t, drop height of 20m and tamper area of 4m2 for 5, 10, 20 and 40 blows
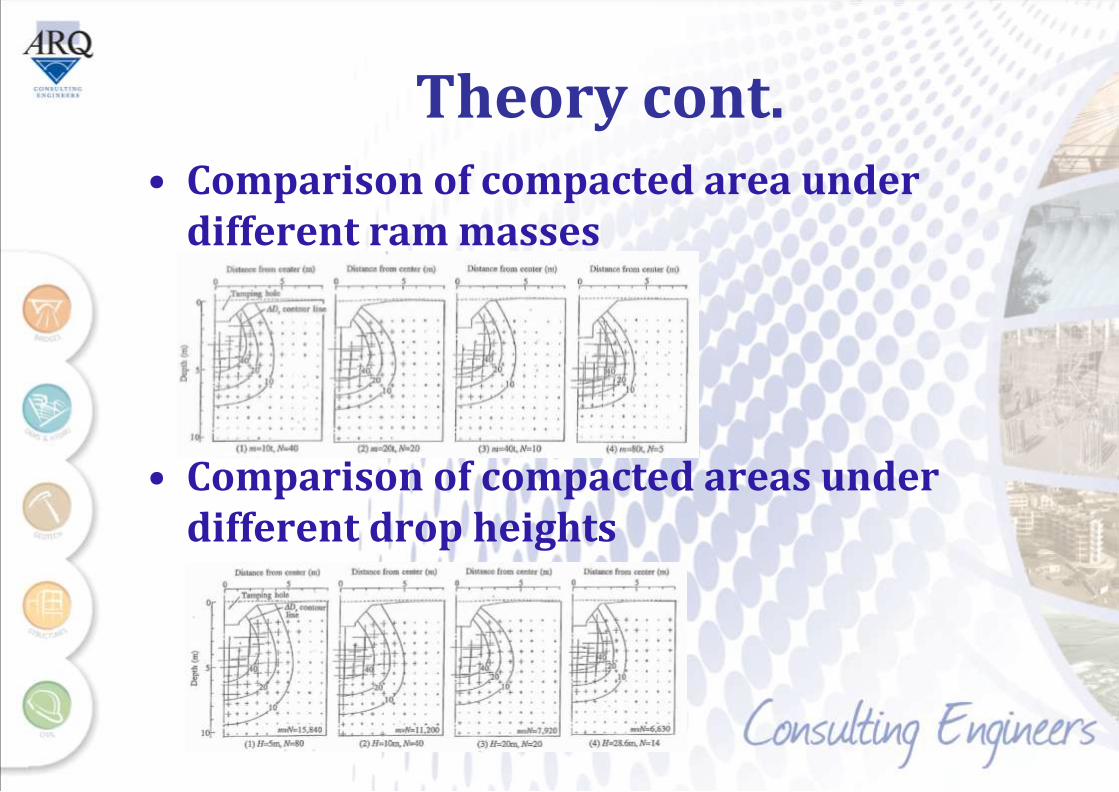
Theory cont. • Comparison of compacted area under
different ram masses
• Comparison of compacted areas under different drop heights

Theory cont.
• Comparison of compacted area under different masses and drop heights
Theory cont.
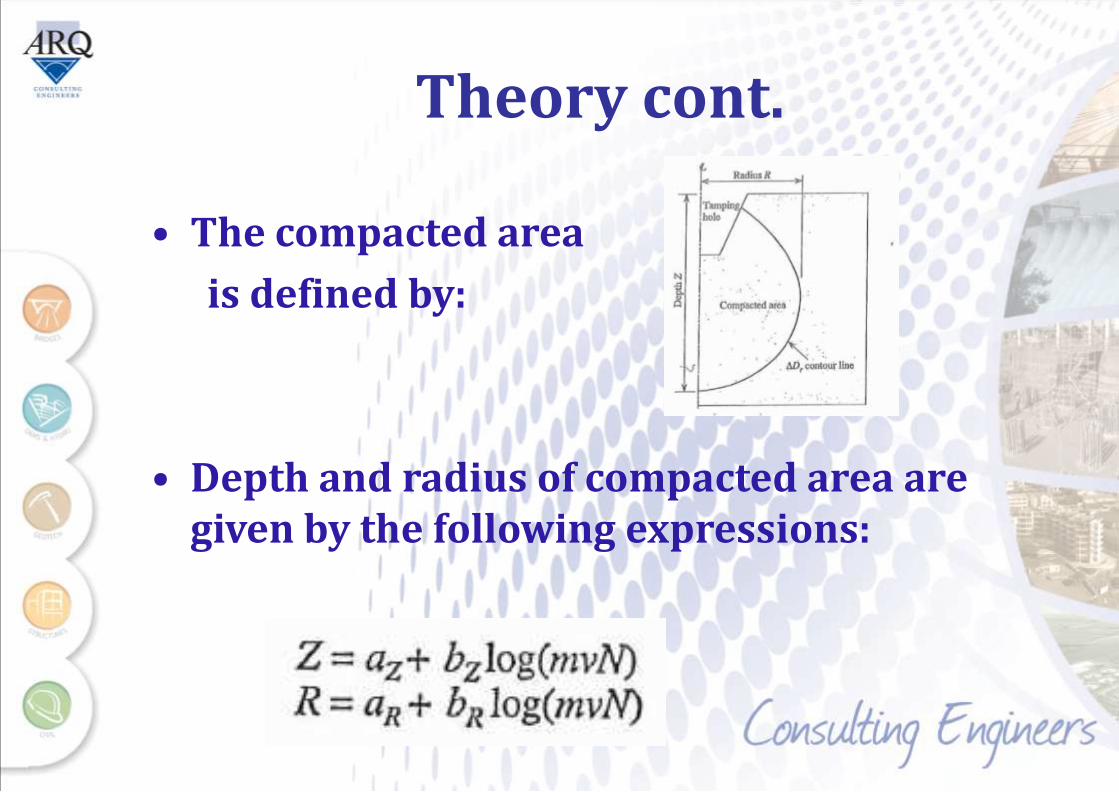
• The compacted area
is defined by:
• Depth and radius of compacted area are given by the following expressions:
Theory Cont.
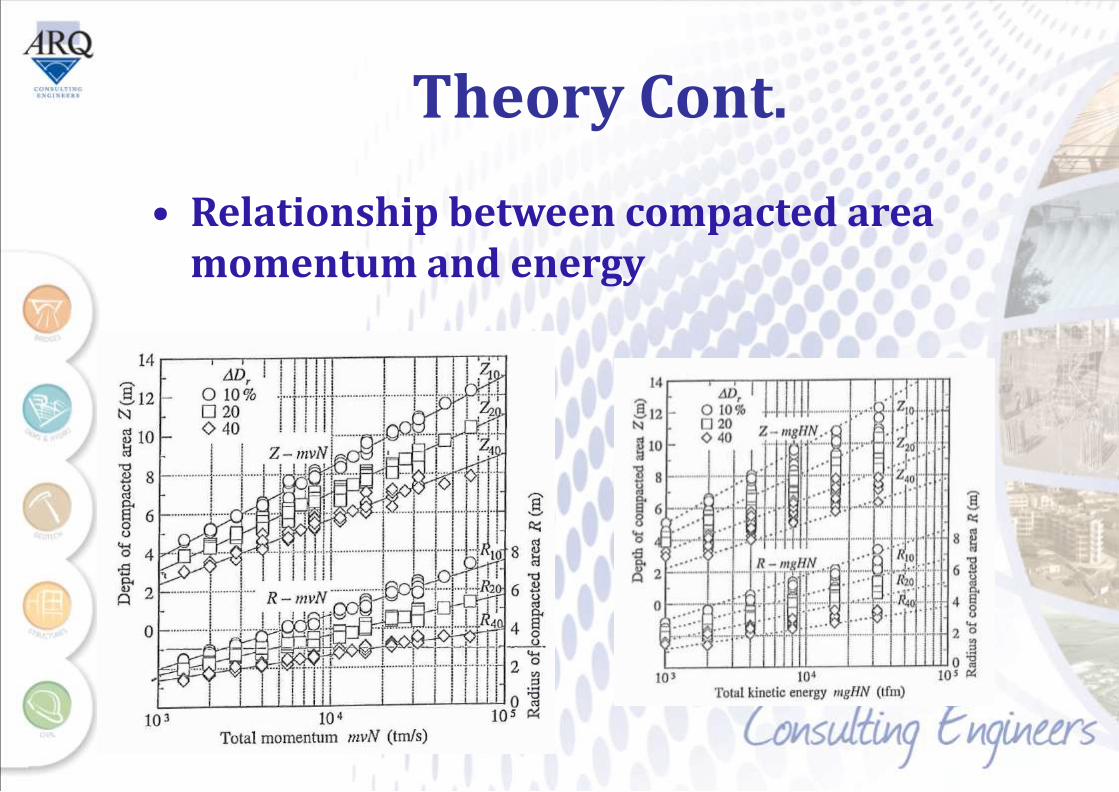
• Relationship between compacted area momentum and energy
Theory Cont.
• Findings of the analyses:
– Compacted area is governed better by ram momentum rather than ram kinetic energy,
– Depth and radius of the compacted area are in proportion to logarithm of total ram momentum.
(mvN) b + a = Z ZZ log
(mvN) b + a = R RR log
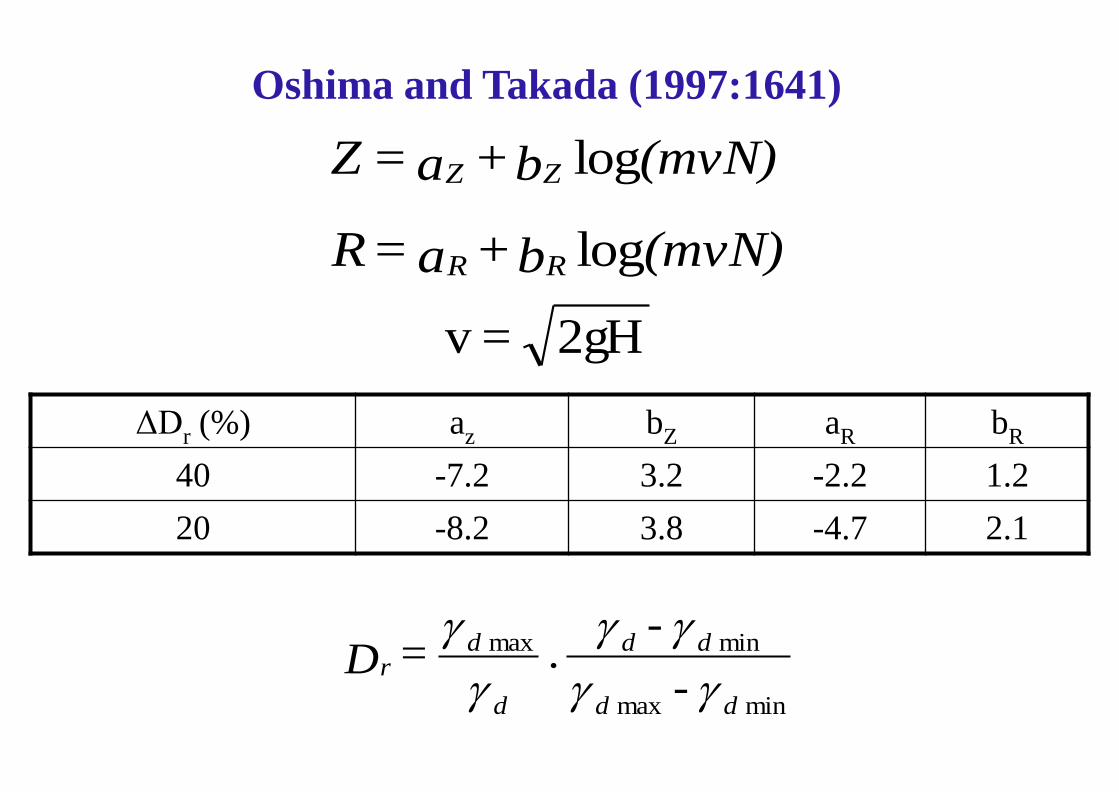
Oshima and Takada (1997:1641)
2gH = v
ΔDr (%) az bZ aR bR
40 -7.2 3.2 -2.2 1.2
20 -8.2 3.8 -4.7 2.1
minmax
minmax
d d
dd
d
dr
-
- . = D
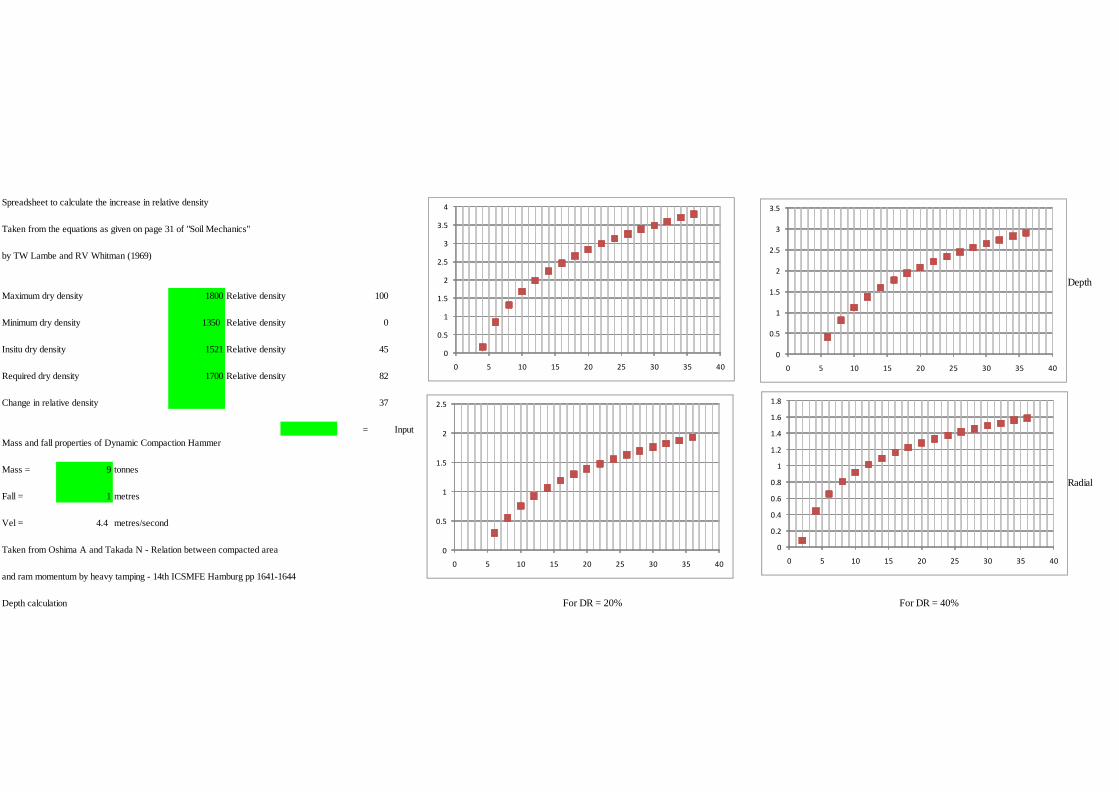
Spreadsheet to calculate the increase in relative density
Taken from the equations as given on page 31 of "Soil Mechanics"
by TW Lambe and RV Whitman (1969)
Depth
Maximum dry density 1800 Relative density 100
Minimum dry density 1350 Relative density 0
Insitu dry density 1521 Relative density 45
Required dry density 1700 Relative density 82
Change in relative density 37
= Input
Mass and fall properties of Dynamic Compaction Hammer
Mass = 9 tonnes
Radial
Fall = 1 metres
Vel = 4.4 metres/second
Taken from Oshima A and Takada N - Relation between compacted area
and ram momentum by heavy tamping - 14th ICSMFE Hamburg pp 1641-1644
Depth calculation For DR = 20% For DR = 40%
0
0.5
1
1.5
2
2.5
3
3.5
0 5 10 15 20 25 30 35 40
0
0.5
1
1.5
2
2.5
3
3.5
4
0 5 10 15 20 25 30 35 40
0
0.2
0.4
0.6
0.8
1
1.2
1.4
1.6
1.8
0 5 10 15 20 25 30 35 400
0.5
1
1.5
2
2.5
0 5 10 15 20 25 30 35 40

Let us look at some numbers …..
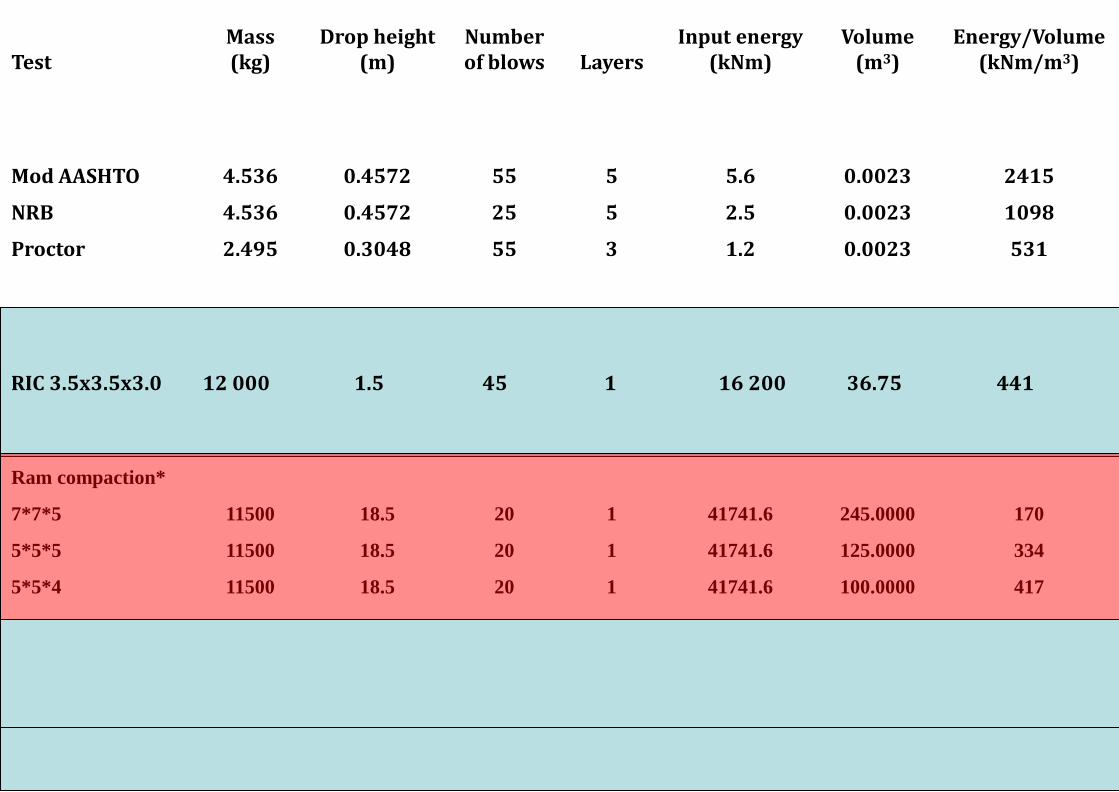
Test Mass (kg)
Drop height (m)
Number of blows Layers
Input energy (kNm)
Volume (m3)
Energy/Volume (kNm/m3)
Mod AASHTO 4.536 0.4572 55 5 5.6 0.0023 2415
NRB 4.536 0.4572 25 5 2.5 0.0023 1098
Proctor 2.495 0.3048 55 3 1.2 0.0023 531
Impact roller
Five sided 4927.5 0.158 20 1 152.8 1.1610* 132
Three sided 6167.5 0.215 20 1 260.2 1.1610* 224
Ram compaction*
7*7*5 11500 18.5 20 1 41741.6 245.0000 170
5*5*5 11500 18.5 20 1 41741.6 125.0000 334
5*5*4 11500 18.5 20 1 41741.6 100.0000 417
Vibratory compaction
Bomag 212 20356.8 0.0017 300 1 101.8 0.3150** 323
* = 1m depth ** = 0.15m depth, 10 passes, 3.6m/sec and 30 vibrations/second
RIC 3.5x3.5x3.0 12 000 1.5 45 1 16 200 36.75 441
Impact rolling
• Speed
• Safety
• Mobility ?
• Portability ?
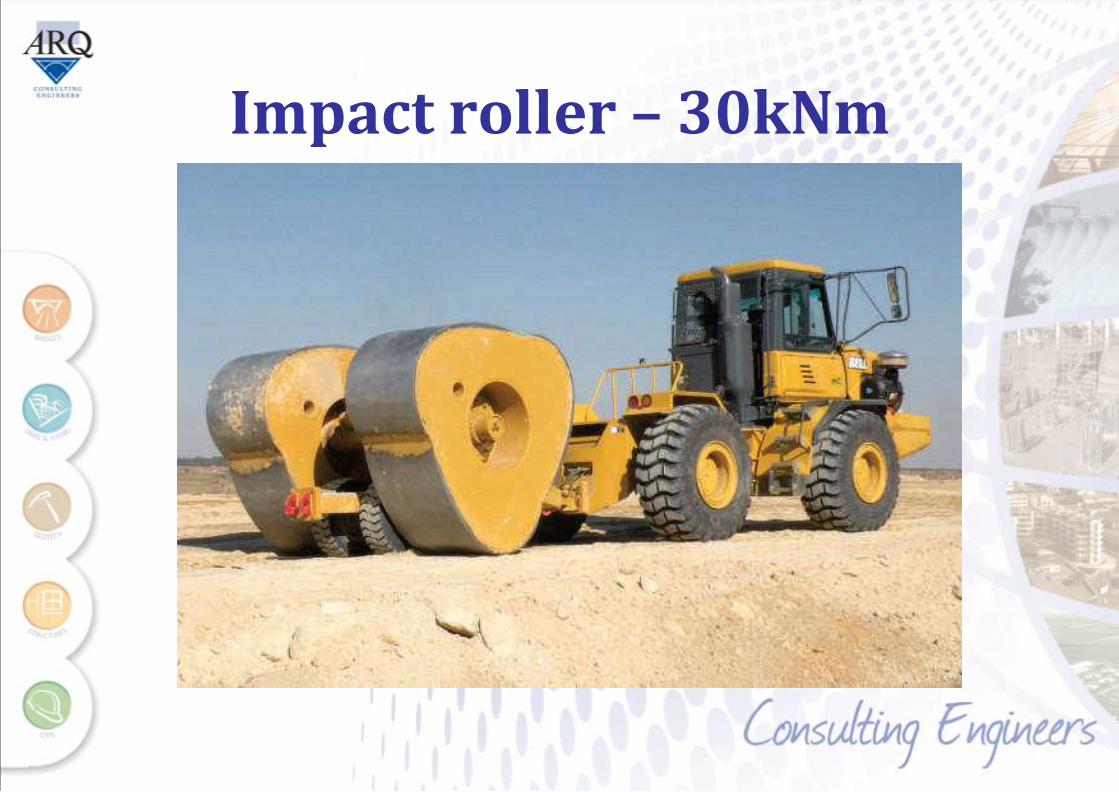
Impact roller – 30kNm
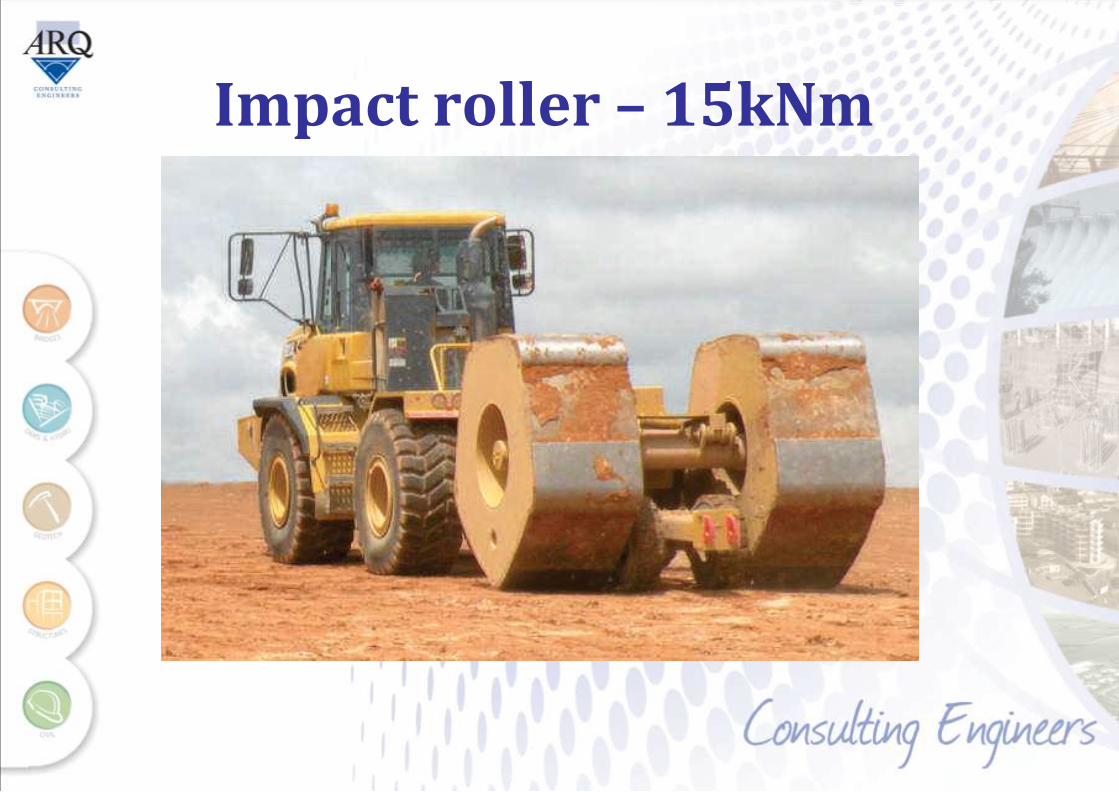
Impact roller – 15kNm

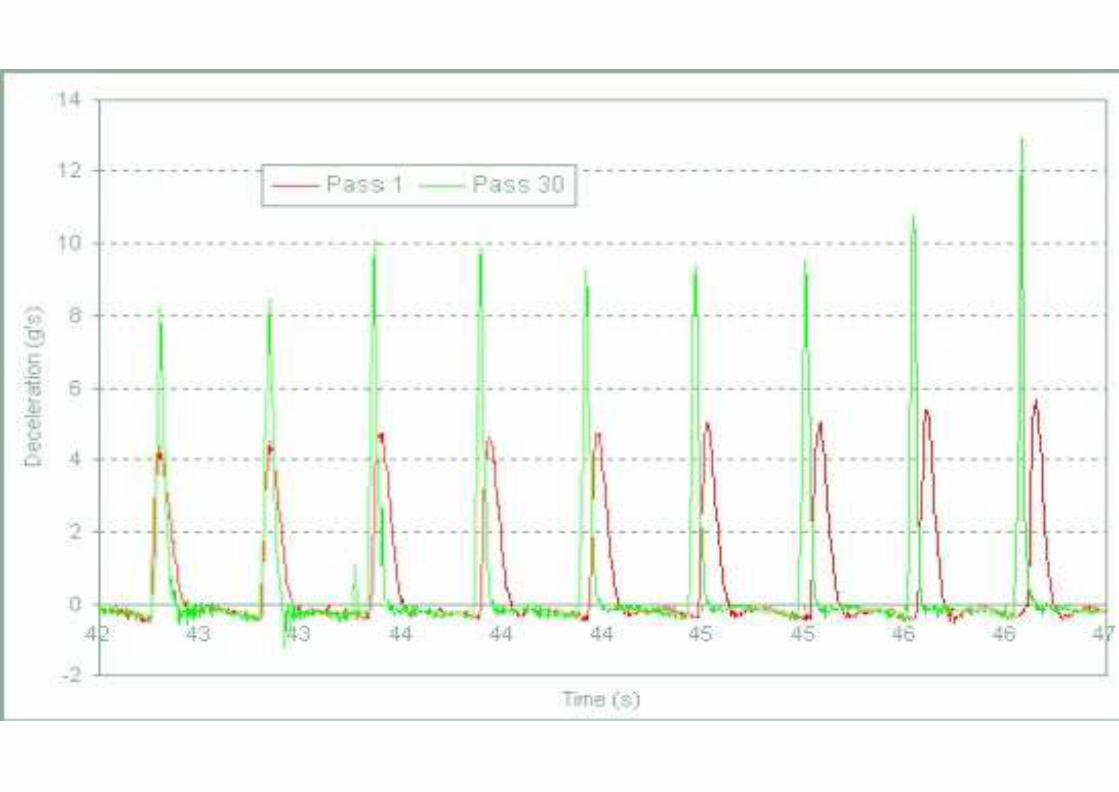
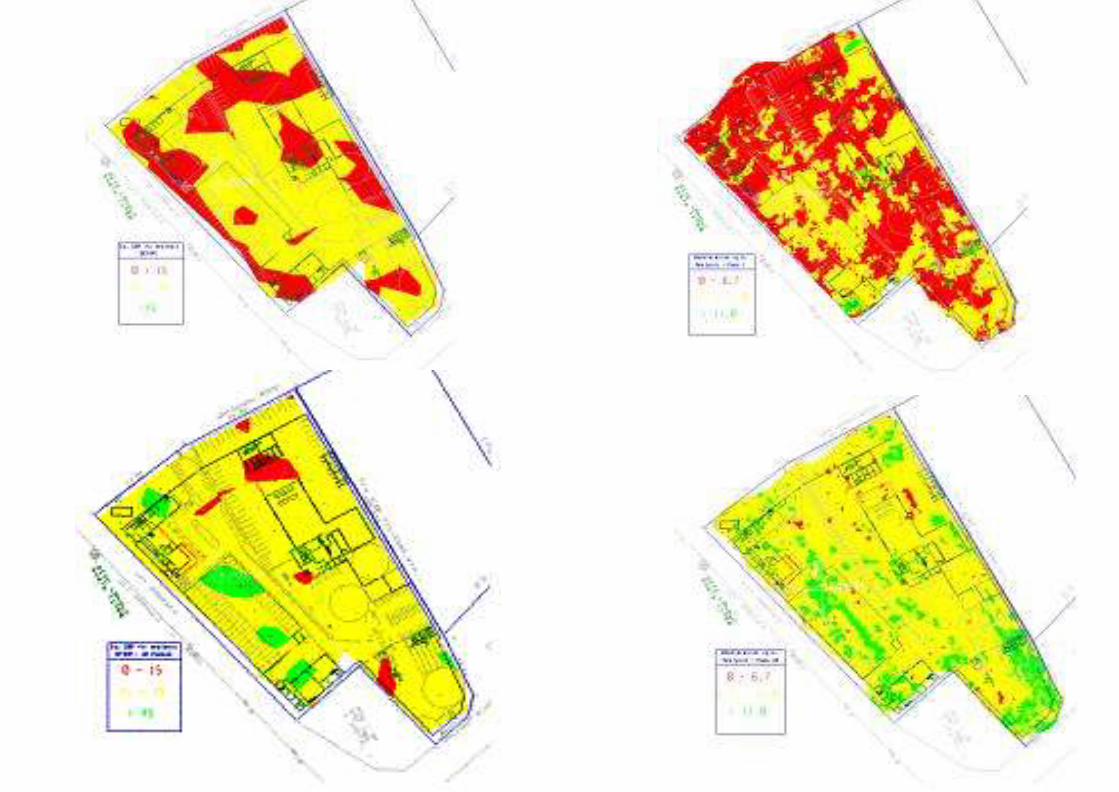
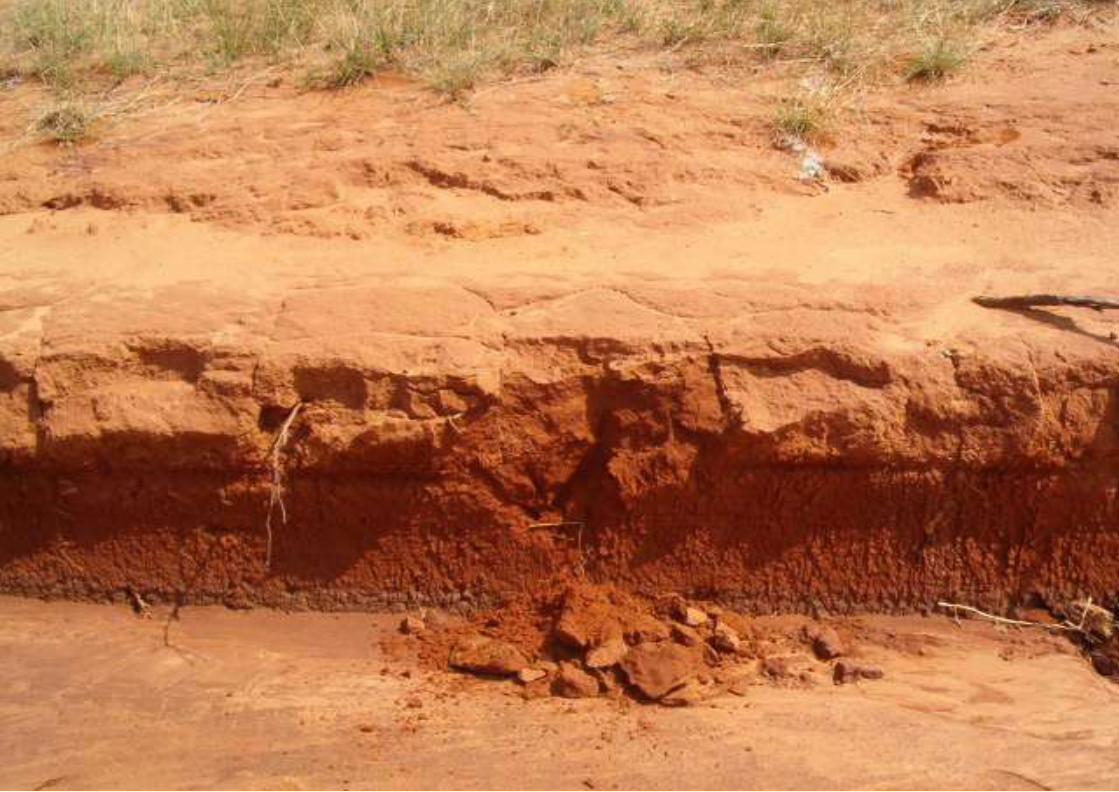

Impact rolling -theory
• Theory suggests depth of compaction is some 1.3m after 30 passes,
• Tests conducted indicate this is very dependent on material being compacted.
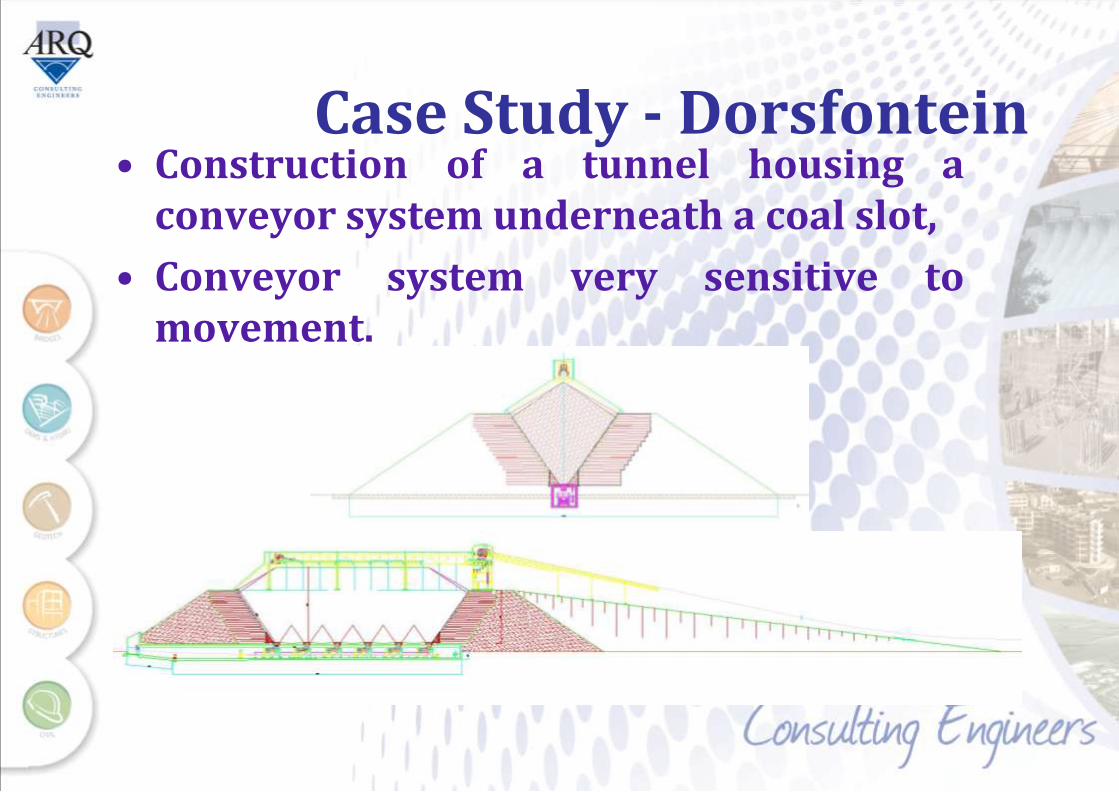
Case Study - Dorsfontein • Construction of a tunnel housing a
conveyor system underneath a coal slot,
• Conveyor system very sensitive to movement.

Dorsfontein
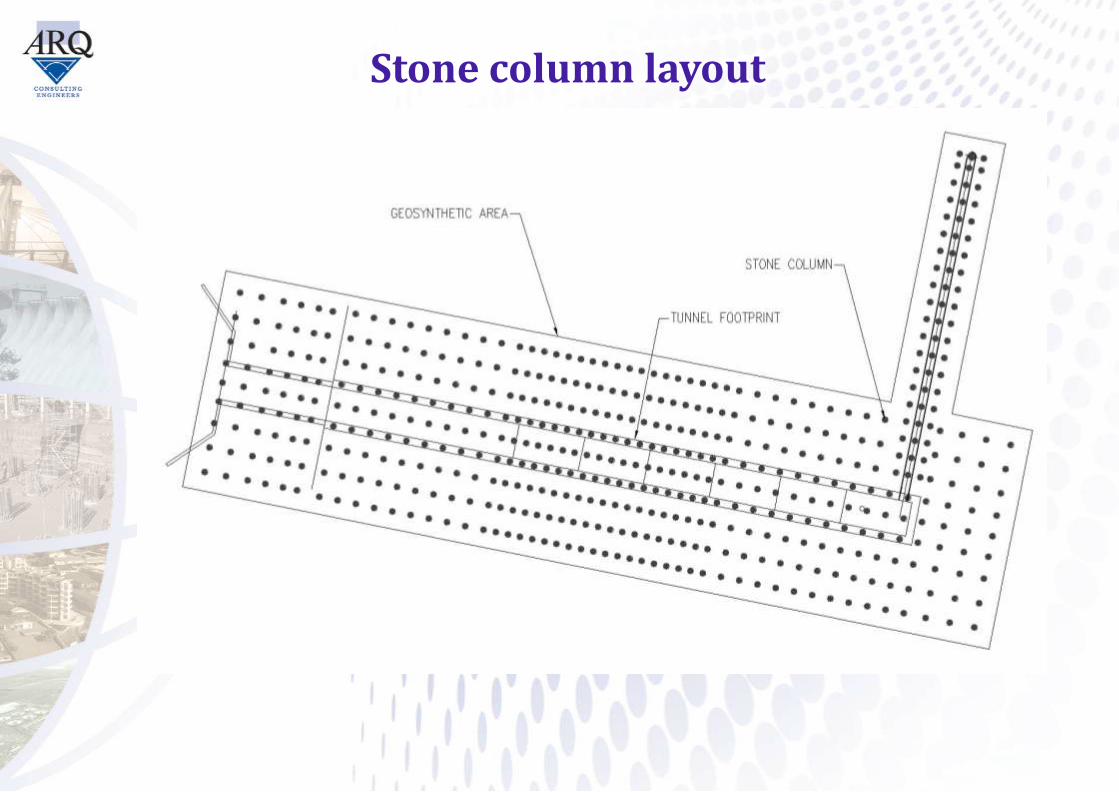
Stone column layout
• Options
– Remove about 5m of weak material and replace with G6 quality material compacted to 93% Mod AASHTO density
– Installing stone columns which greatly reduces costs
• Design parameters
– E value determined by Continuous Surface Wave (CSW) tests
– Material strength parameter determined from shearbox and triaxial tests
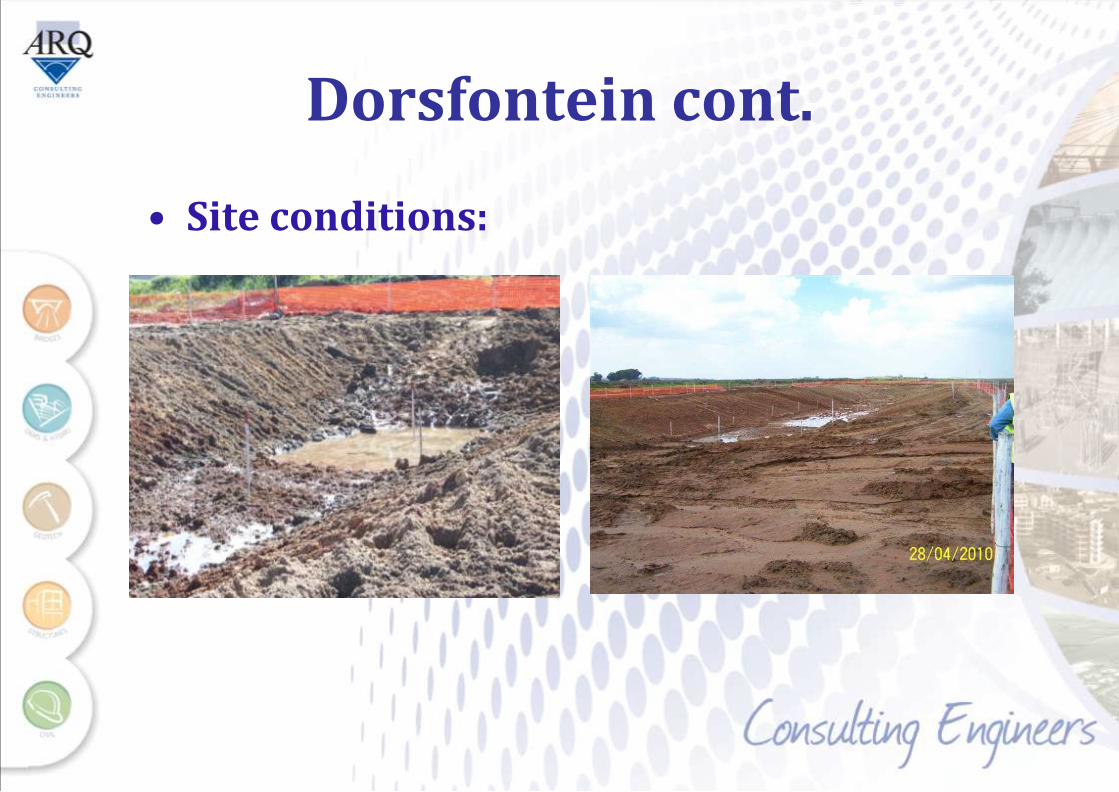
Dorsfontein cont.
• Site conditions:
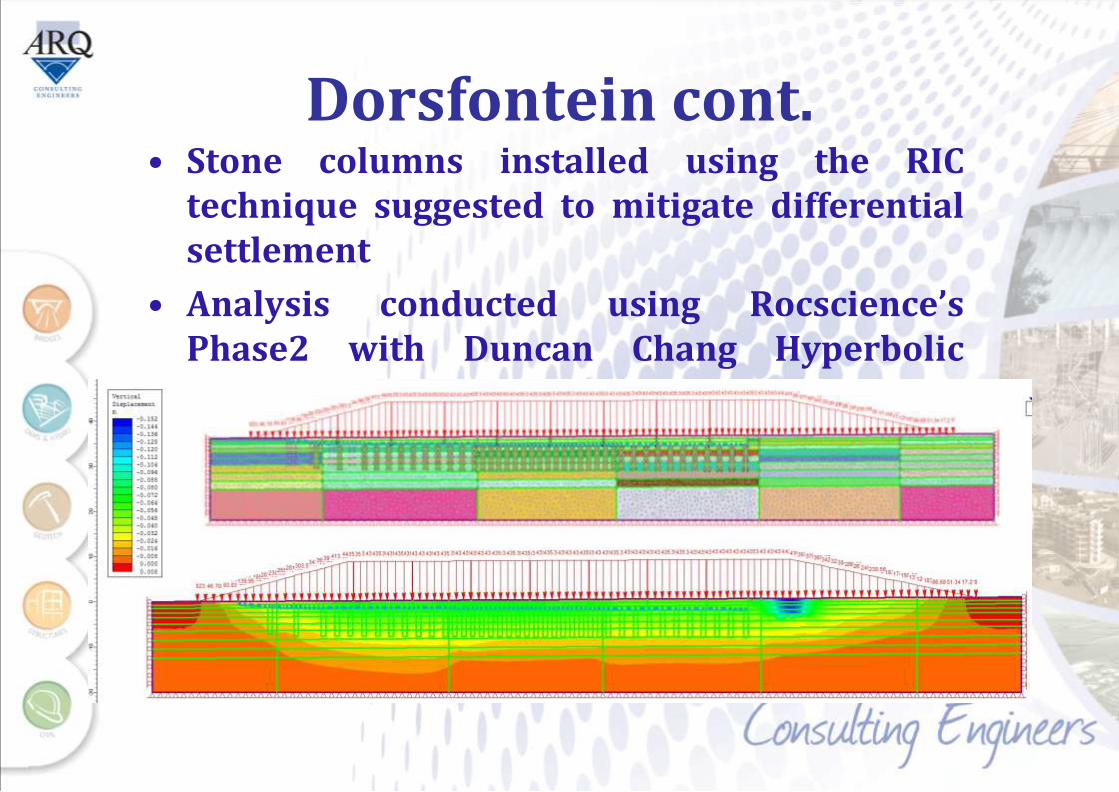
Dorsfontein cont. • Stone columns installed using the RIC
technique suggested to mitigate differential settlement
• Analysis conducted using Rocscience’s Phase2 with Duncan Chang Hyperbolic material properties
Dorsfontein cont.
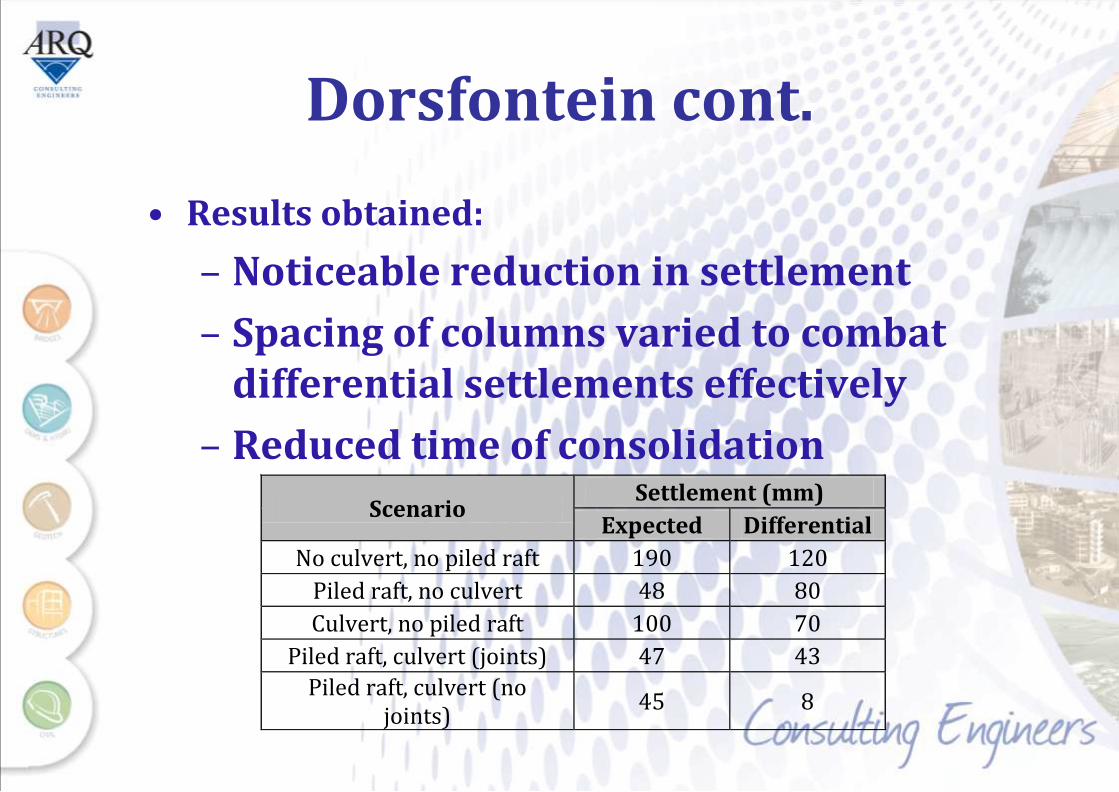
• Results obtained:
– Noticeable reduction in settlement
– Spacing of columns varied to combat differential settlements effectively
– Reduced time of consolidation
Scenario Settlement (mm)
Expected Differential
No culvert, no piled raft 190 120
Piled raft, no culvert 48 80
Culvert, no piled raft 100 70
Piled raft, culvert (joints) 47 43
Piled raft, culvert (no joints)
45 8
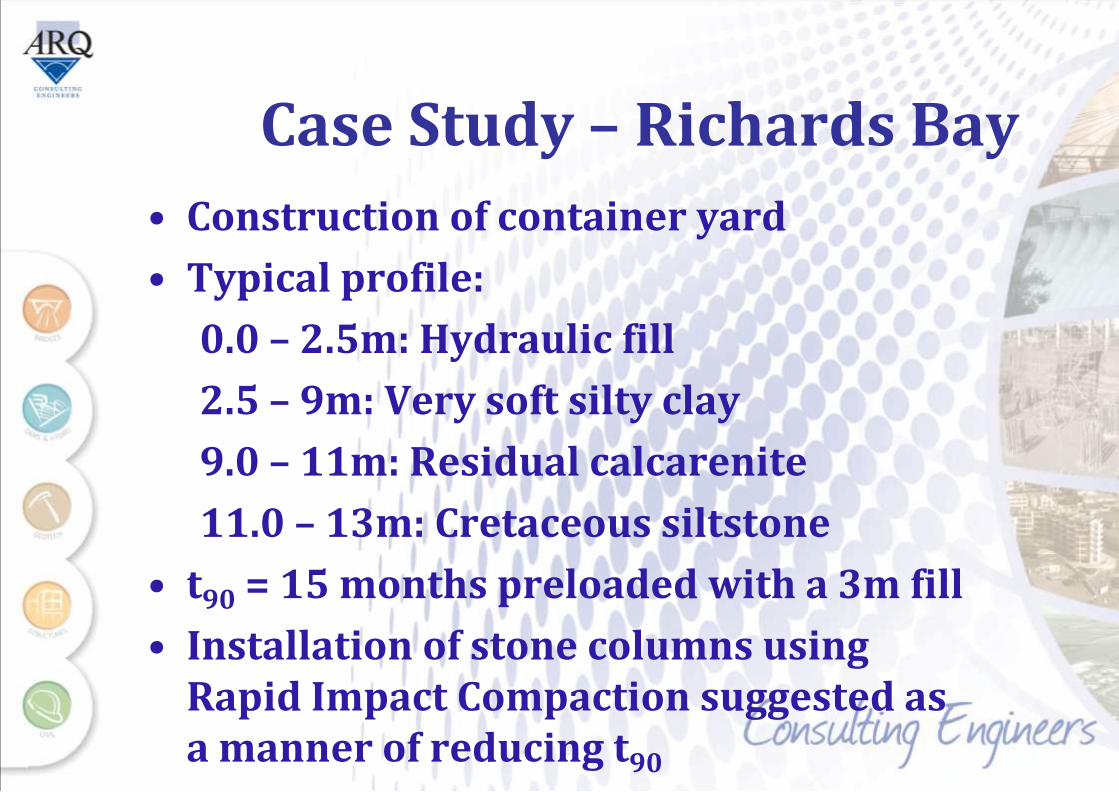
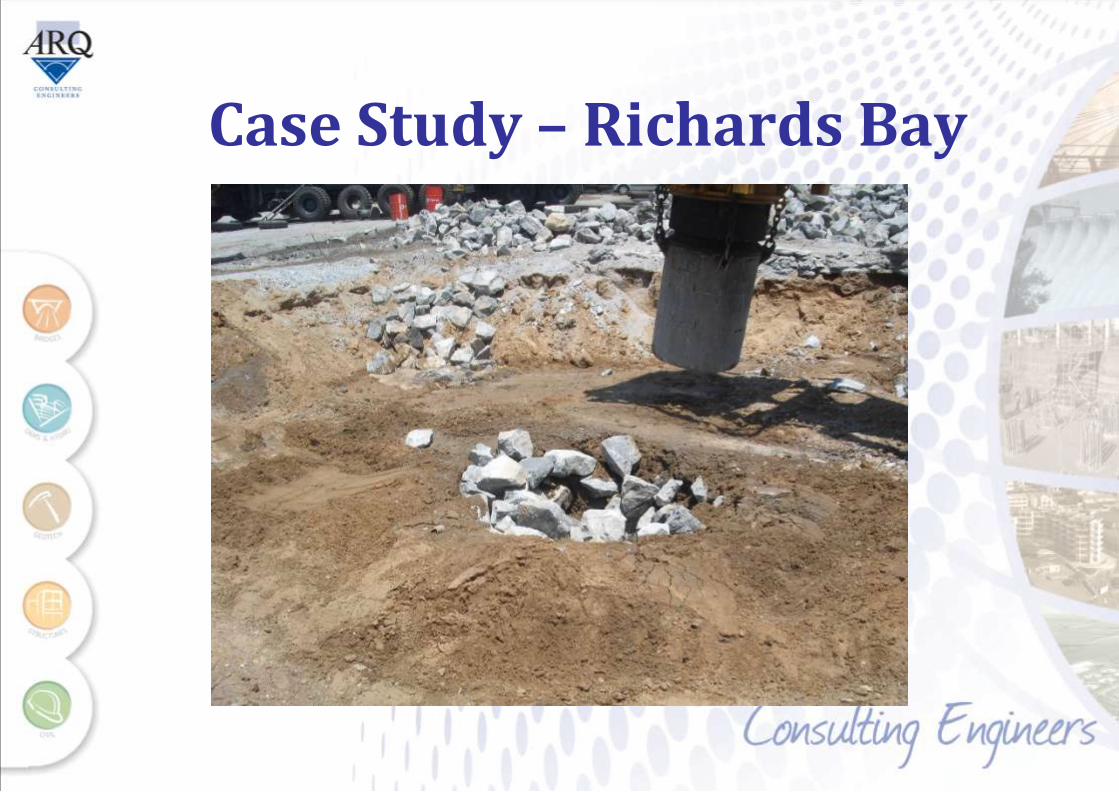
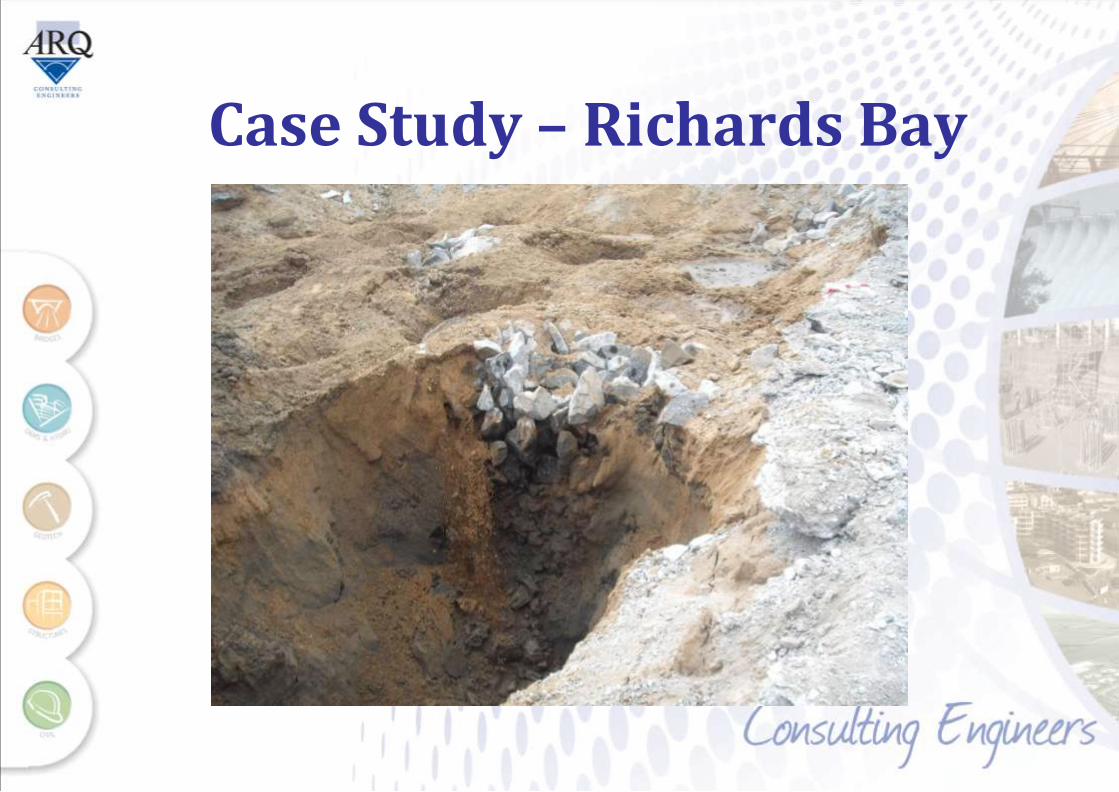
Case Study – Richards Bay
• Construction of container yard
• Typical profile:
0.0 – 2.5m: Hydraulic fill
2.5 – 9m: Very soft silty clay
9.0 – 11m: Residual calcarenite
11.0 – 13m: Cretaceous siltstone
• t90 = 15 months preloaded with a 3m fill
• Installation of stone columns using Rapid Impact Compaction suggested as a manner of reducing t90
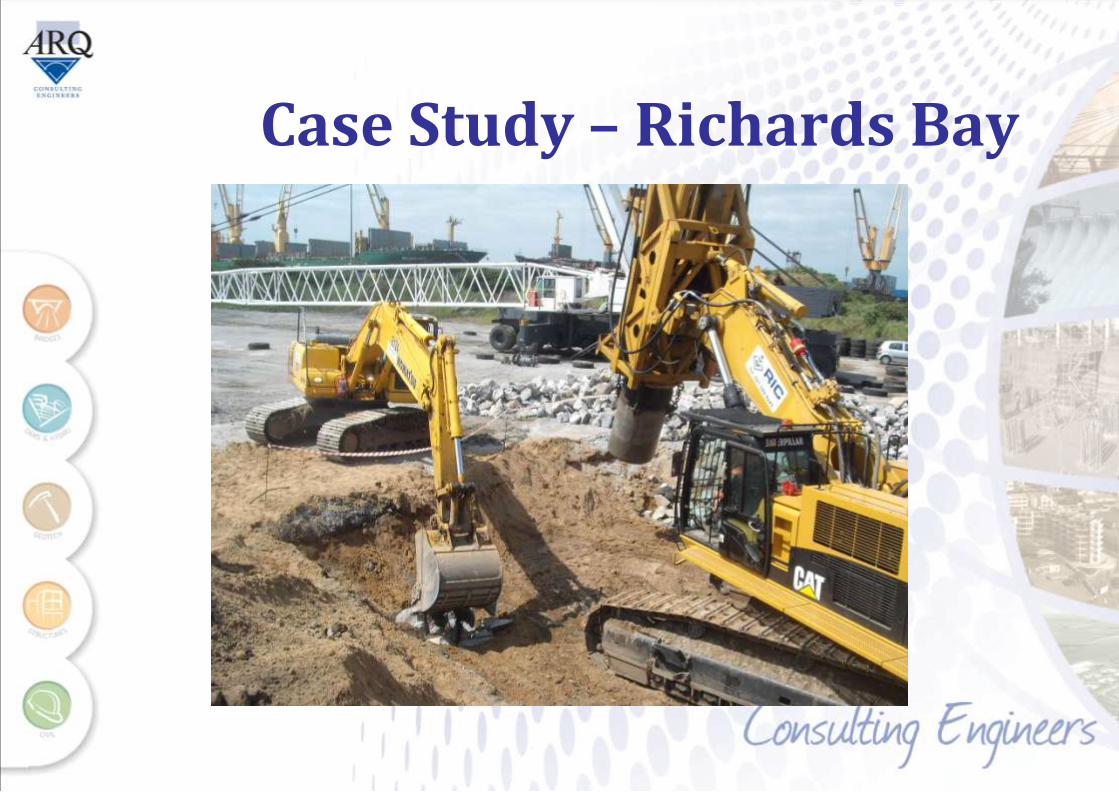
Case Study – Richards Bay
Case Study – Richards Bay
Case Study – Richards Bay

Richards Bay Cont.
• Four trials were conducted in test area: – Two trials with compaction of in situ material with a
1.5m diameter foot only
– One trial with a stone column spacing of 7.5m with one in the middle
– One trial with a stone column spacing of 5m with one in the middle
• Testing was conducted before/after compaction and installation of stone columns
• Testing conducted included:
– Continuous Surface Wave (CSW) tests and
– Dynamic Probe Super Heavy (DPSH) tests
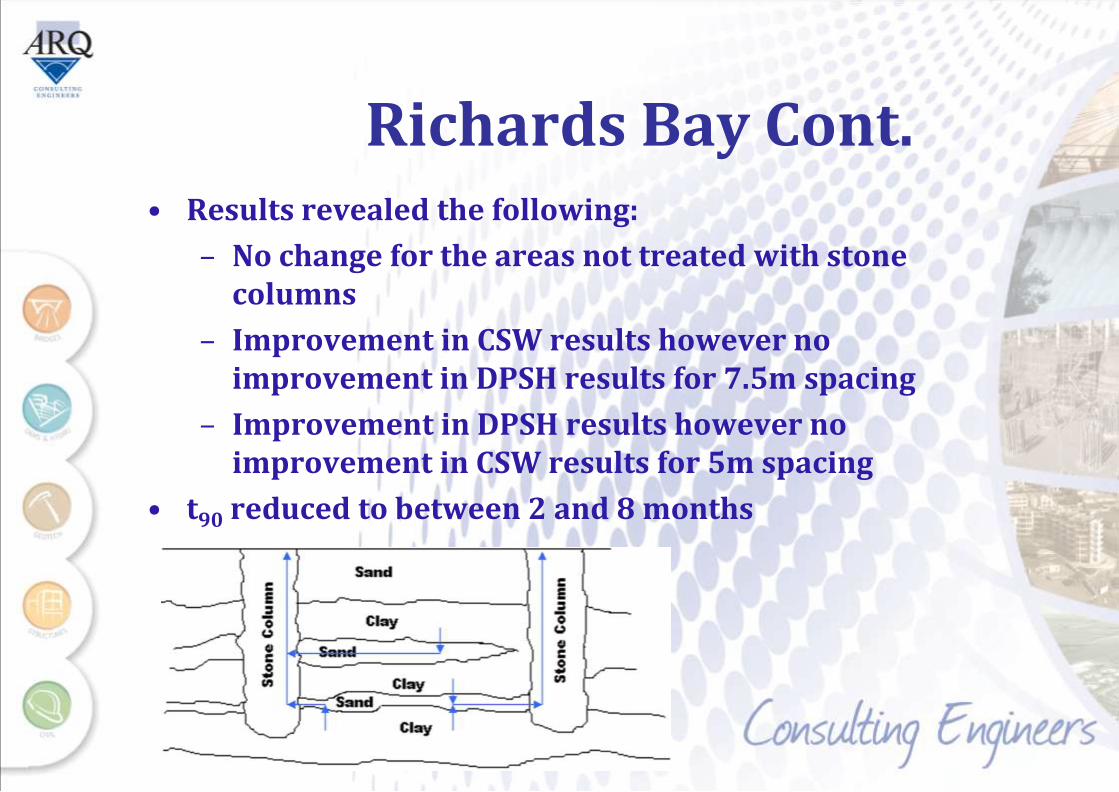
Richards Bay Cont. • Results revealed the following:
– No change for the areas not treated with stone columns
– Improvement in CSW results however no improvement in DPSH results for 7.5m spacing
– Improvement in DPSH results however no improvement in CSW results for 5m spacing
• t90 reduced to between 2 and 8 months

Case Study – Midfield Terminal
• Comprised construction of a 6–8m fill over site
• The site was divided into three zones:

Midfield Terminal cont. • Material properties:
Area CBR @ 90% E (MPa)
Ferricrete 12 6
Swampy - <2
Seepage 1-2 2
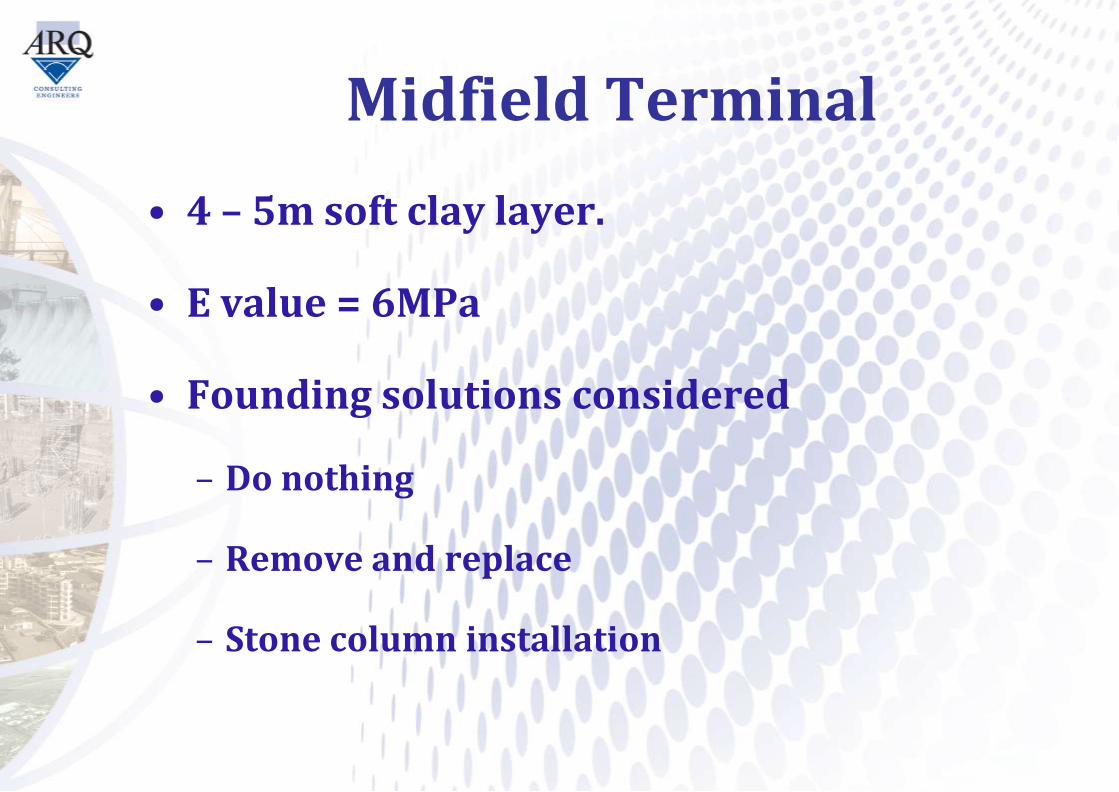
Midfield Terminal
• 4 – 5m soft clay layer.
• E value = 6MPa
• Founding solutions considered – Do nothing
– Remove and replace
– Stone column installation

• Columns increase in-situ stiffness thus reducing settlements from 400mm to 200mm
• Stone columns provide reduced drainage path length
Midfield Terminal Cont.
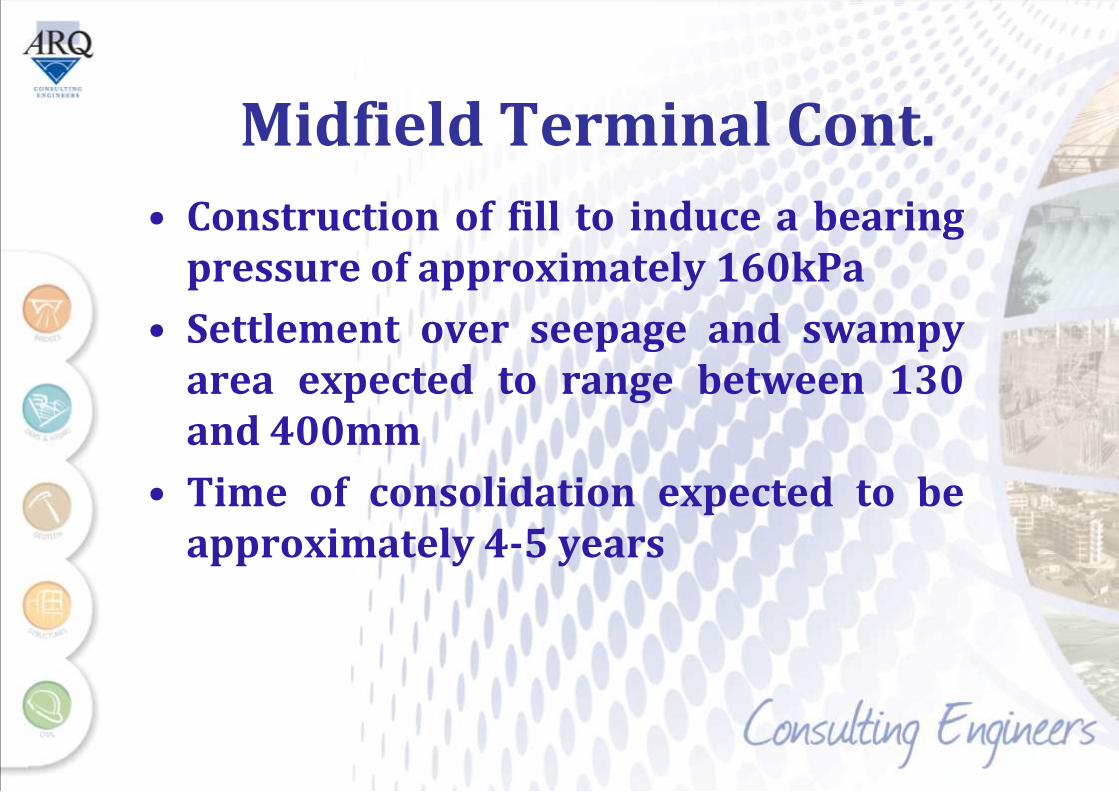
• Construction of fill to induce a bearing pressure of approximately 160kPa
• Settlement over seepage and swampy area expected to range between 130 and 400mm
• Time of consolidation expected to be approximately 4-5 years
Midfield Terminal Cont.
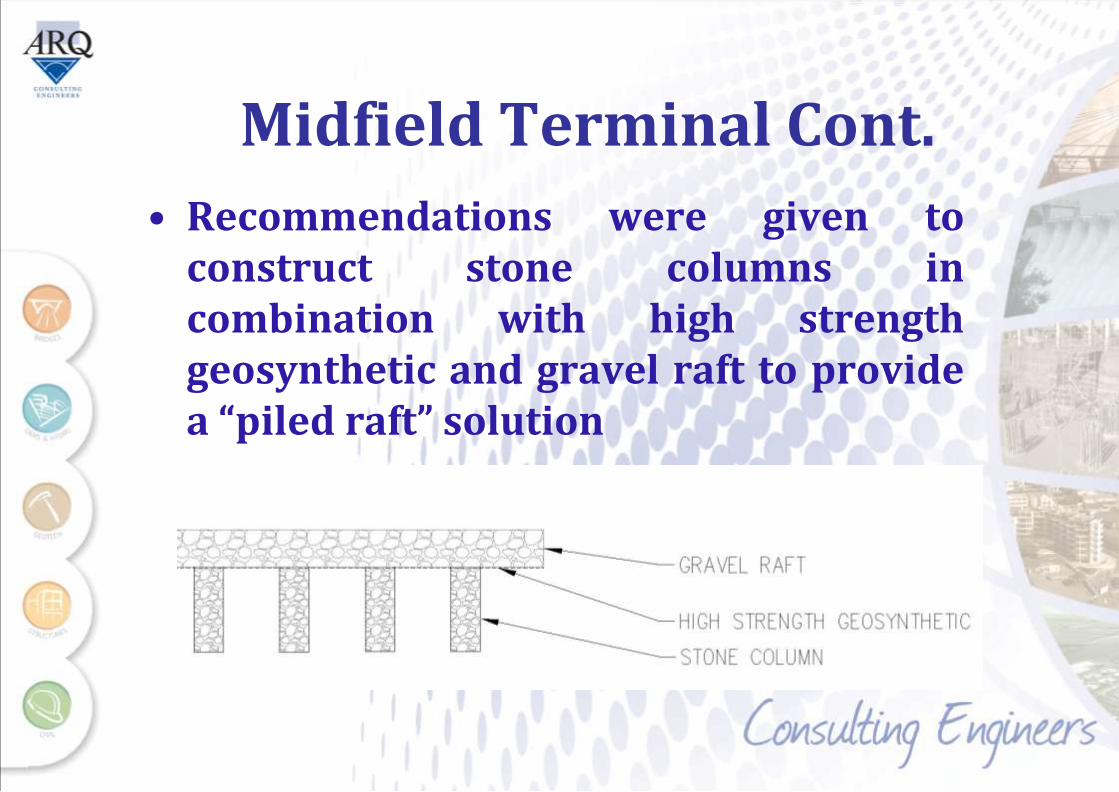
• Recommendations were given to construct stone columns in combination with high strength geosynthetic and gravel raft to provide a “piled raft” solution
Midfield Terminal Cont.
• “Piled Raft” constructed using combination of RIC and DC
• DC used in the soft swampy area
• RIC used in the stiffer seepage area
• DC stone columns installed using 10-15 blows
• RIC stone columns installed using 8 passes with 20-35 blows per pass
Midfield Terminal cont.

Midfield Terminal Cont.
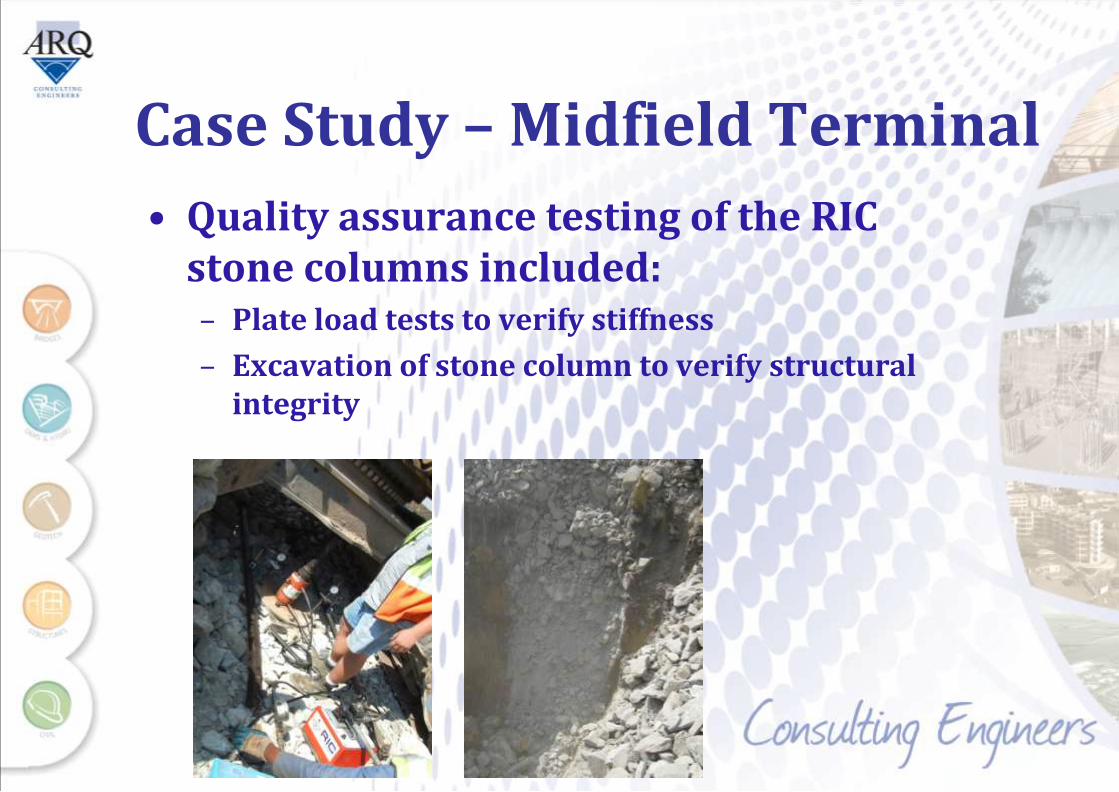
Case Study – Midfield Terminal
• Quality assurance testing of the RIC stone columns included: – Plate load tests to verify stiffness
– Excavation of stone column to verify structural integrity

Midfield Terminal Cont. • Results obtained
– Stone columns exhibited an elastic modulus of approximately 50 – 60MPa
– Material around stone columns increased in stiffness from 6MPa to approximately 14MPa
– Settlements would be reduced to between 100 and 200mm
– Time of consolidation reduced from 4-5 years to just 7 months
– Construction time expected to be 8 months therefore settlements will be built out during construction
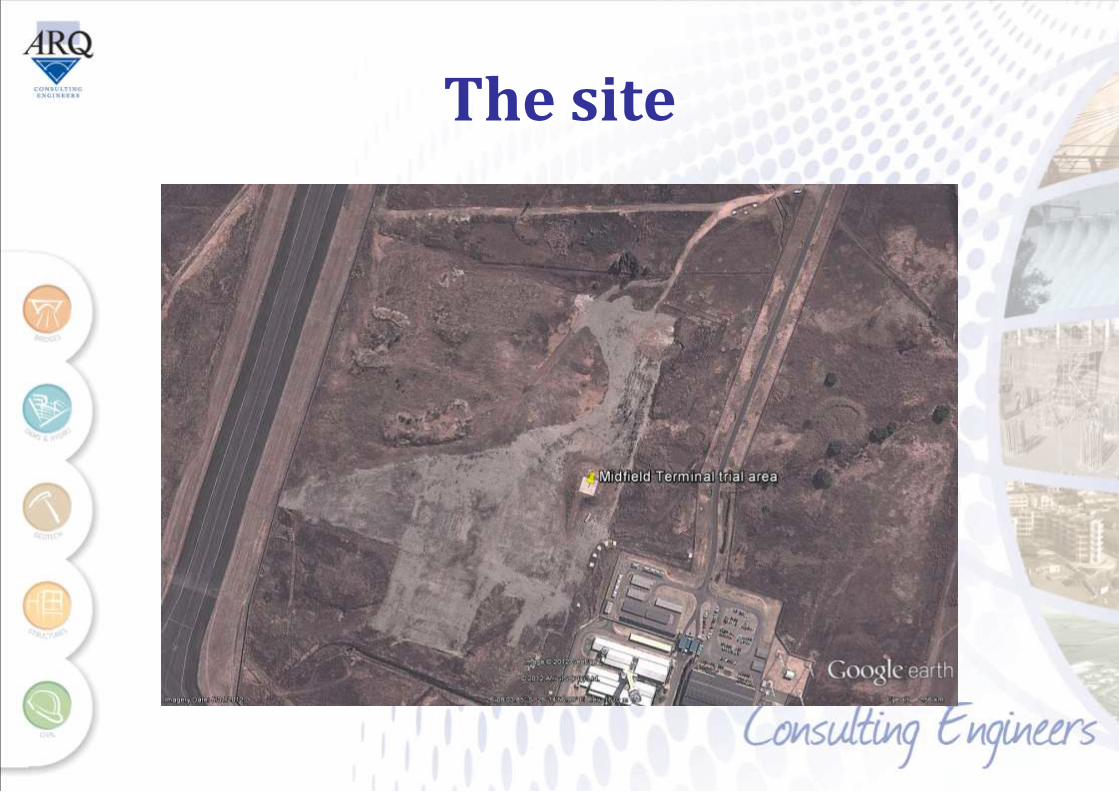
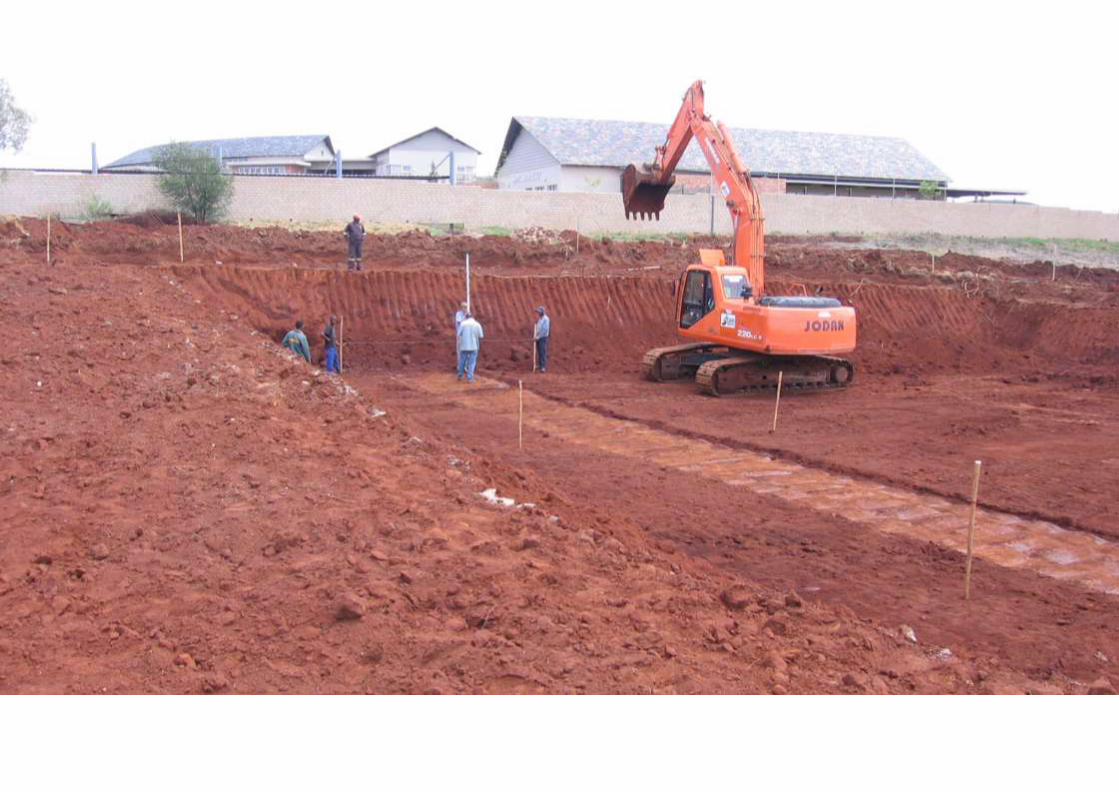
The site
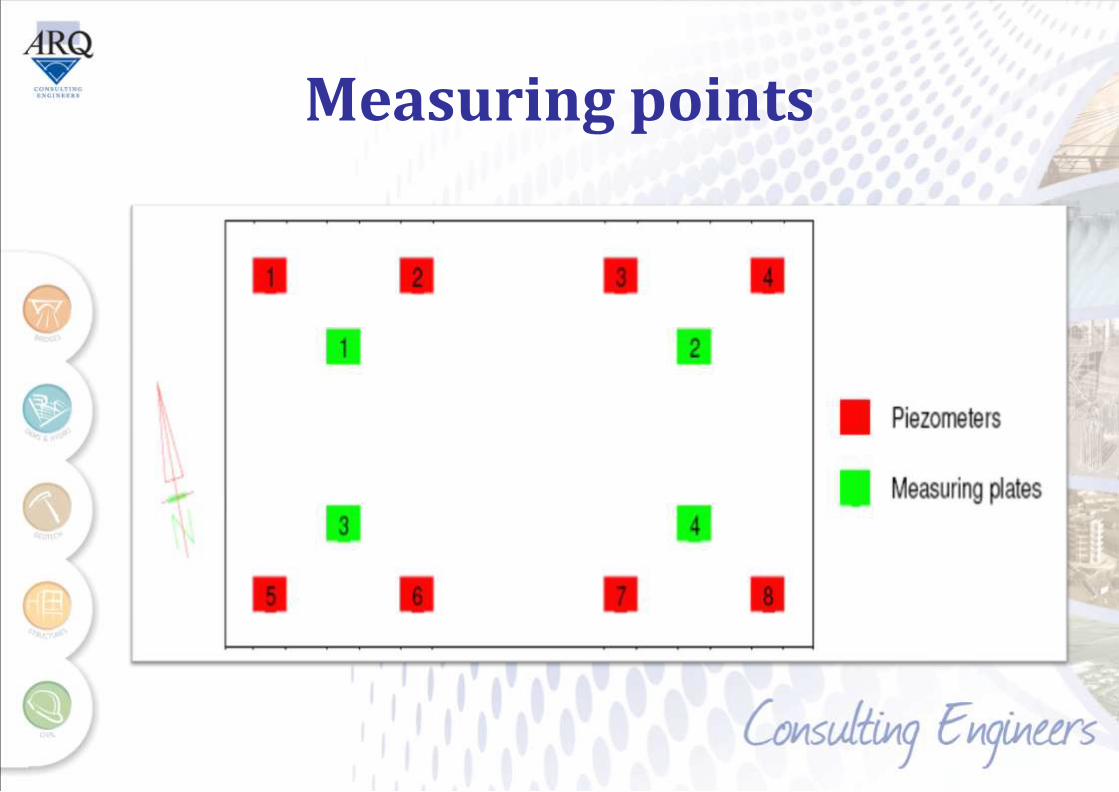
Measuring points

Measured settlement
-120
-100
-80
-60
-40
-20
0
20
Sett
lem
ent
(mm
)
Time (Date)
Settlement vs. Time
Plate 1 Plate 2
Plate 3 Plate 4
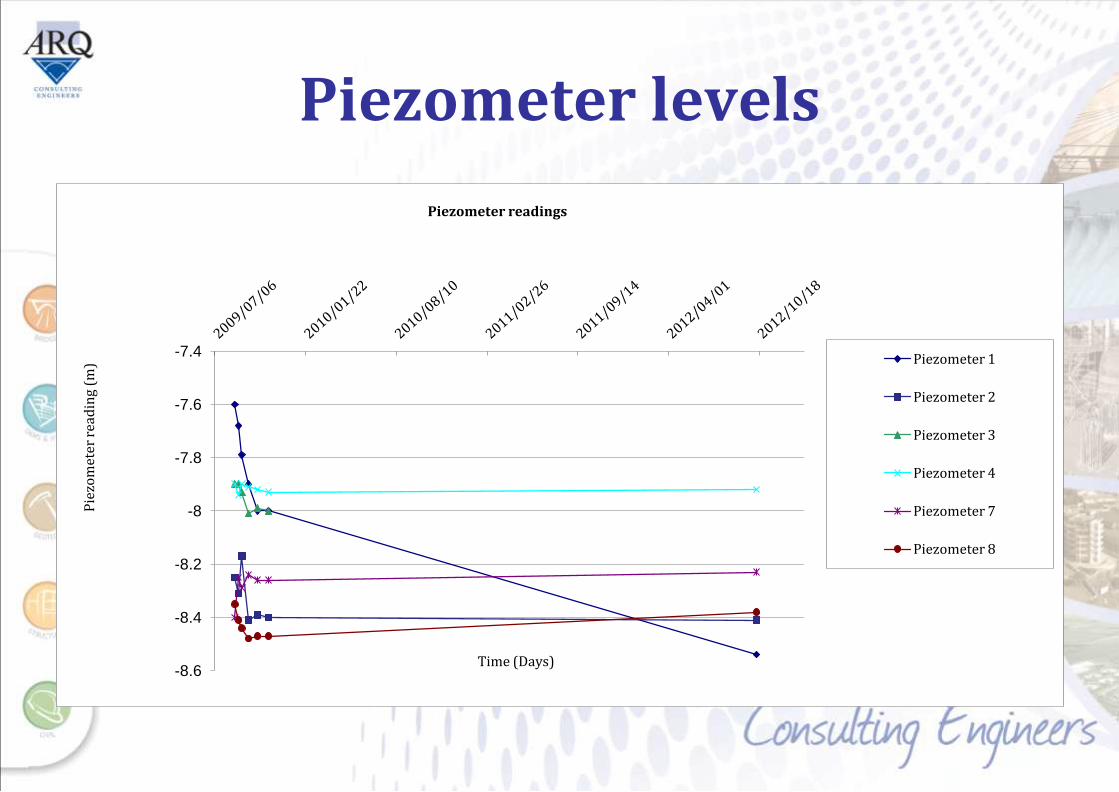
Piezometer levels
-8.6
-8.4
-8.2
-8
-7.8
-7.6
-7.4
Pie
zom
eter
rea
din
g (m
)
Time (Days)
Piezometer readings
Piezometer 1
Piezometer 2
Piezometer 3
Piezometer 4
Piezometer 7
Piezometer 8
Midstream Hospital
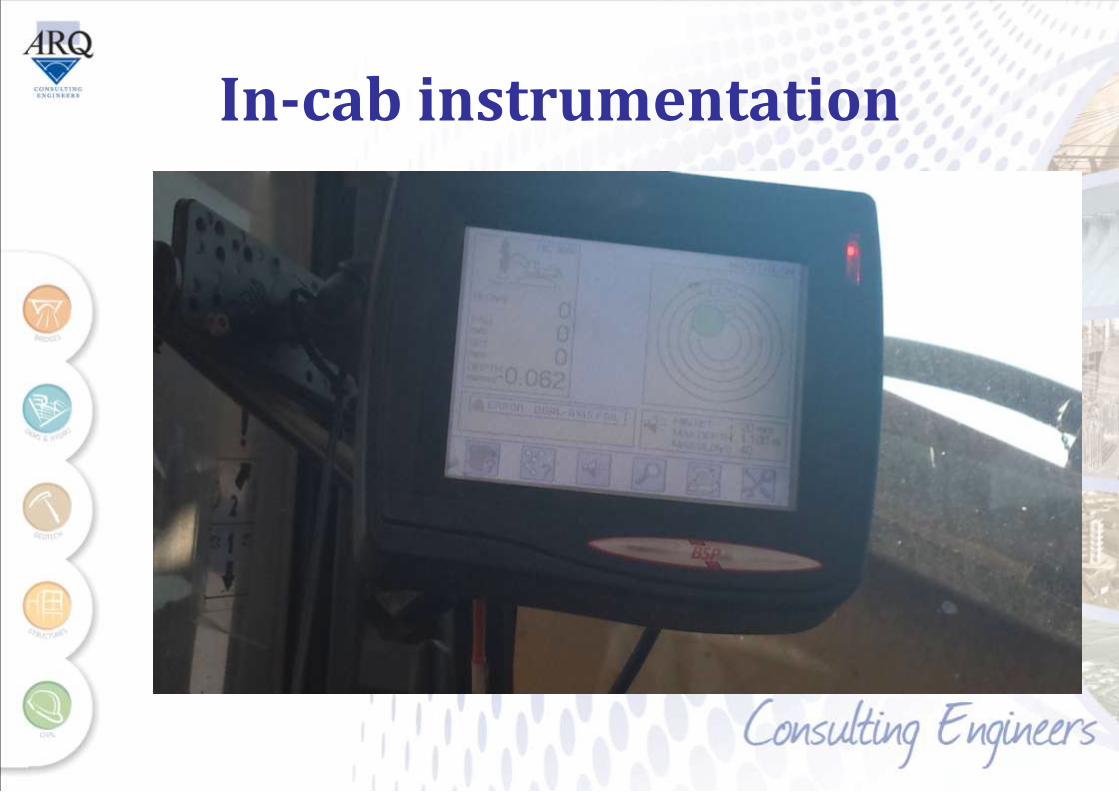
In-cab instrumentation
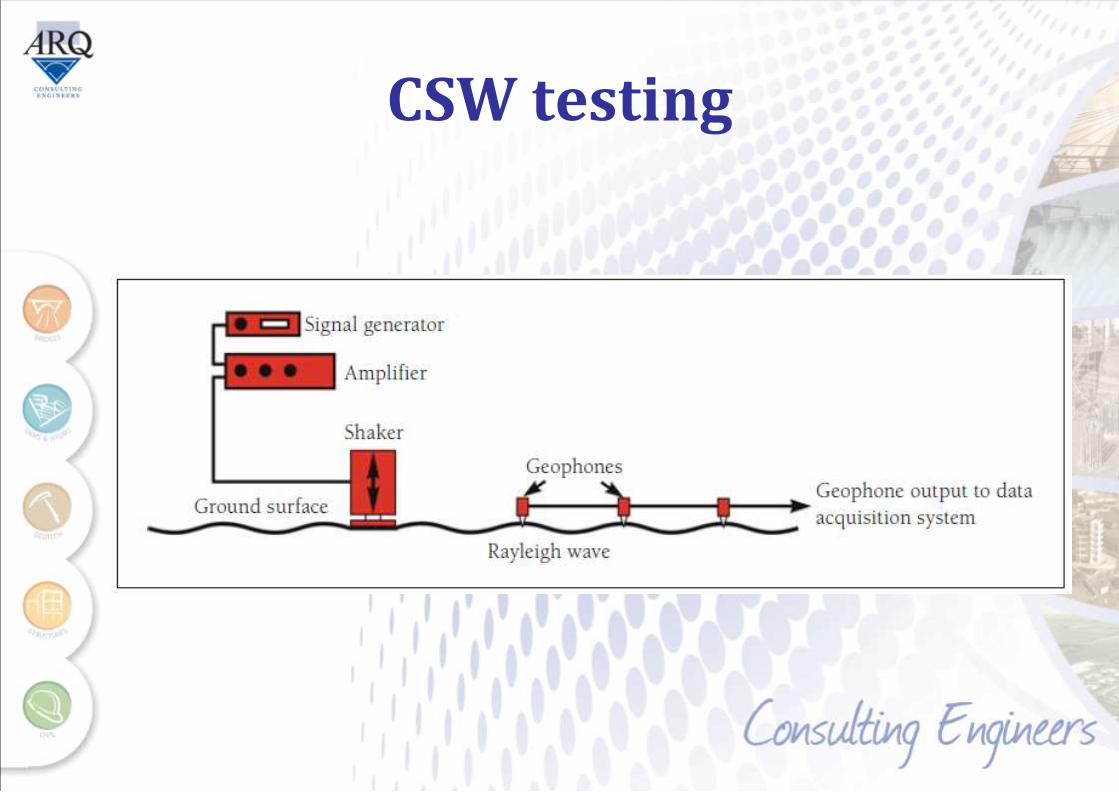
CSW testing
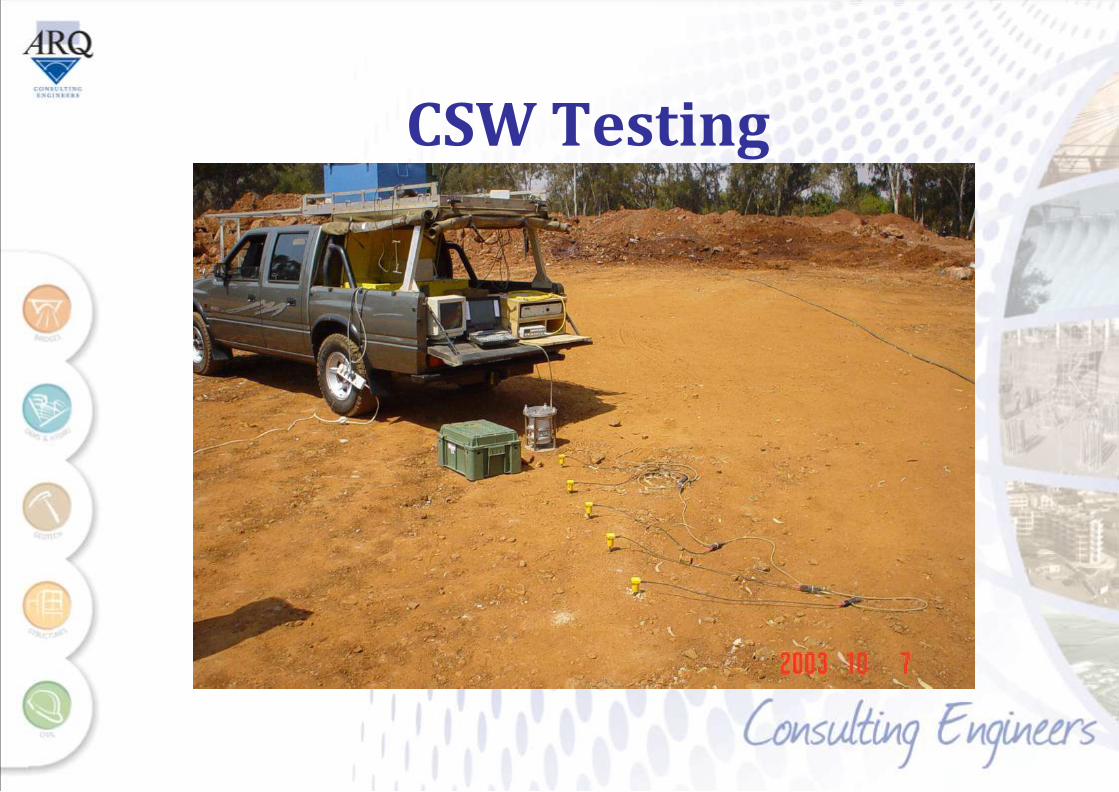
CSW Testing

CSW in the Alps-John Rigby Jones
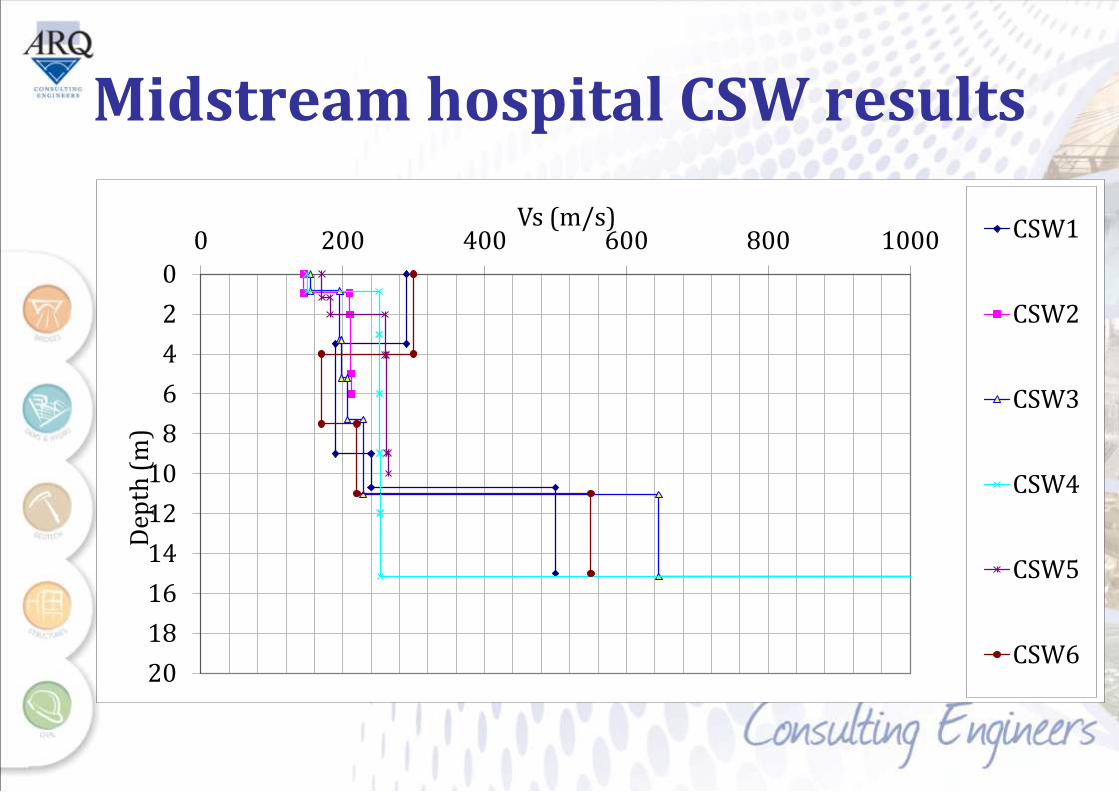
Midstream hospital CSW results
0
2
4
6
8
10
12
14
16
18
20
0 200 400 600 800 1000
Dep
th (
m)
Vs (m/s) CSW1
CSW2
CSW3
CSW4
CSW5
CSW6

Midstream Hospital CSW testing
– The magic number is 160m/sec,
– As Go = V2 x ρ,
– This would translate into Go=46MPa,
– As E = 2(1 + ν) x G,
– This would generate an Eo value of some 2.7 times G ie Eo = 124MPa,
– But using the softening coefficient of 0.3 this generates an insitu E value = 37MPa
– For a 2m x 2m base loaded to 150kPa δ = 5.5mm giving a relative rotation of 1:900 OK
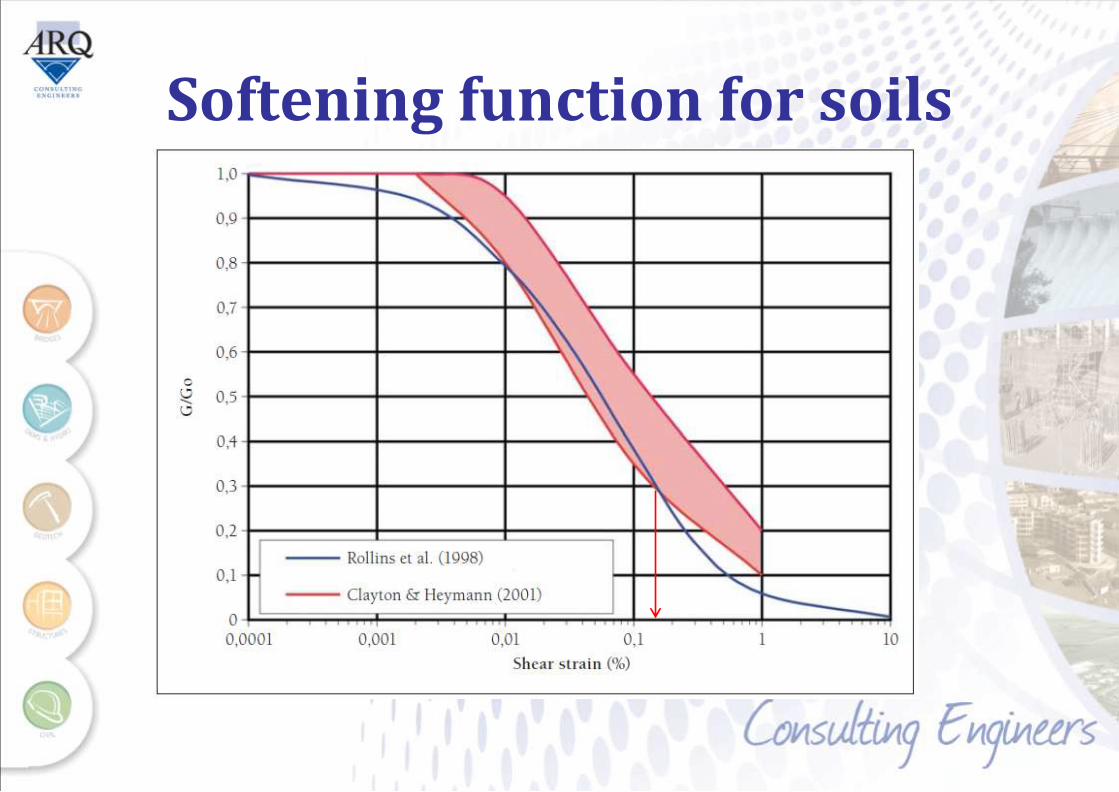
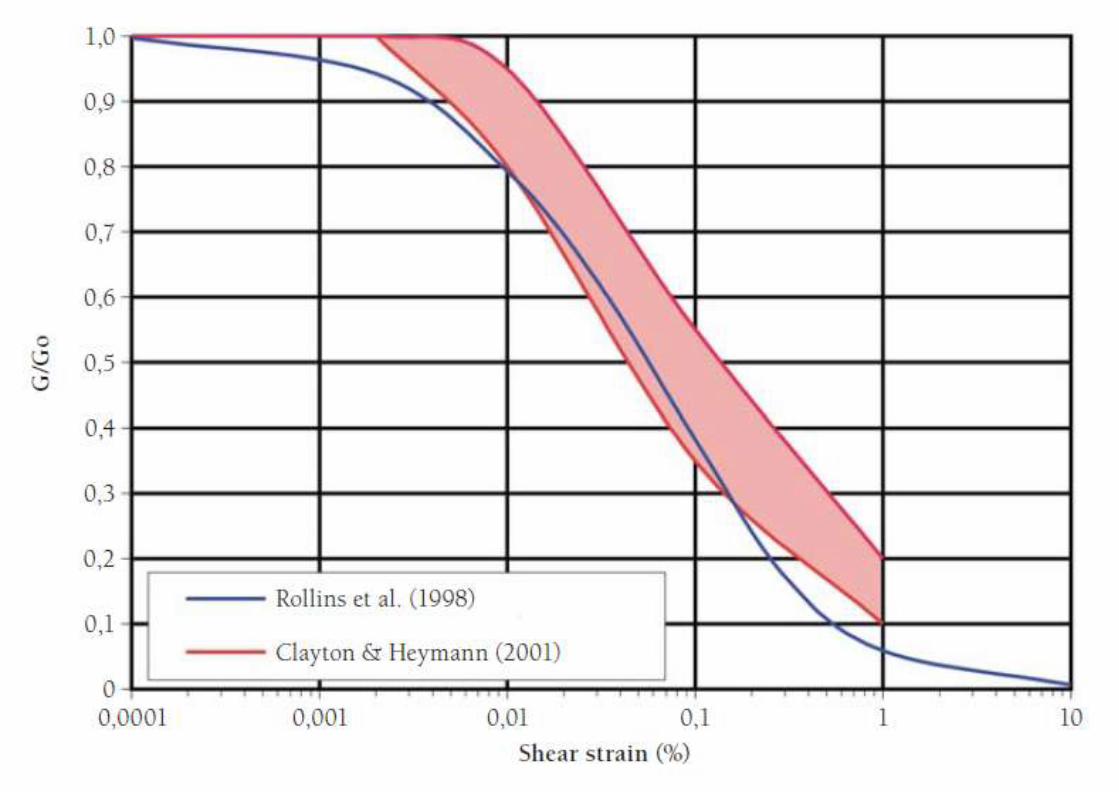
Softening function for soils
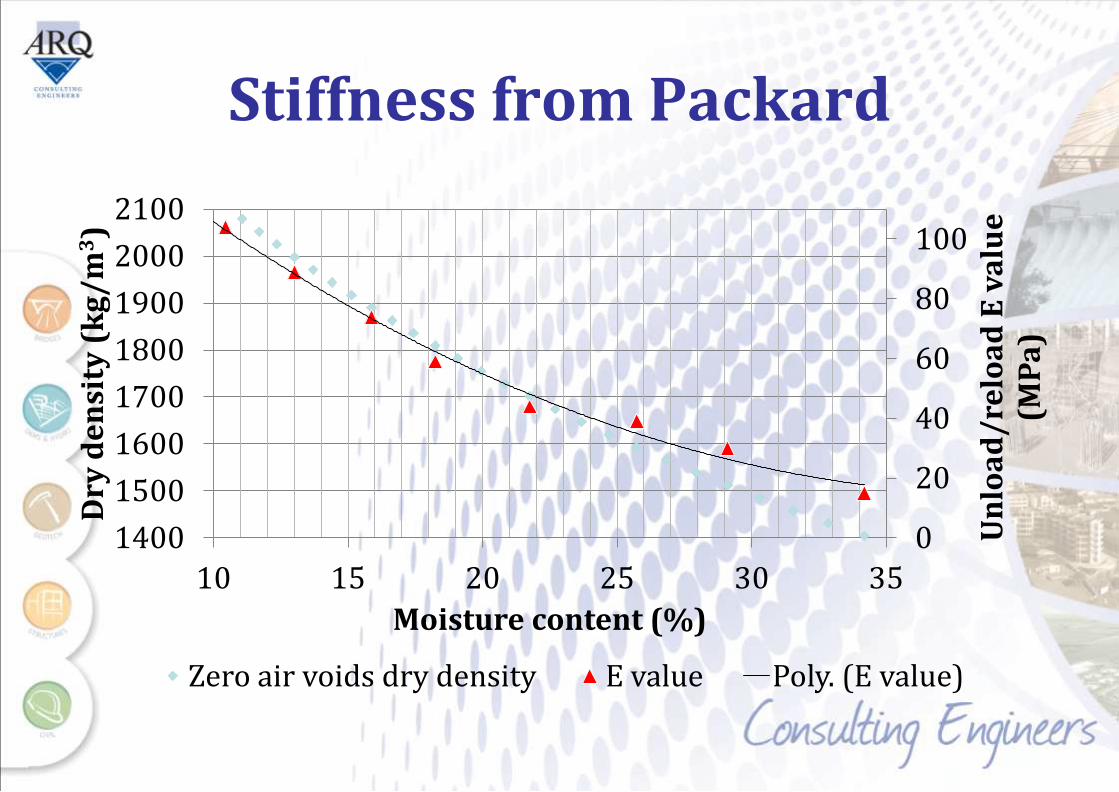
Stiffness from Packard
0
20
40
60
80
100
1400
1500
1600
1700
1800
1900
2000
2100
10 15 20 25 30 35
Un
loa
d/
relo
ad
E v
alu
e
(MP
a)
Dry
de
nsi
ty (
kg
/m
3)
Moisture content (%)
Zero air voids dry density E value Poly. (E value)

And a little further from home…
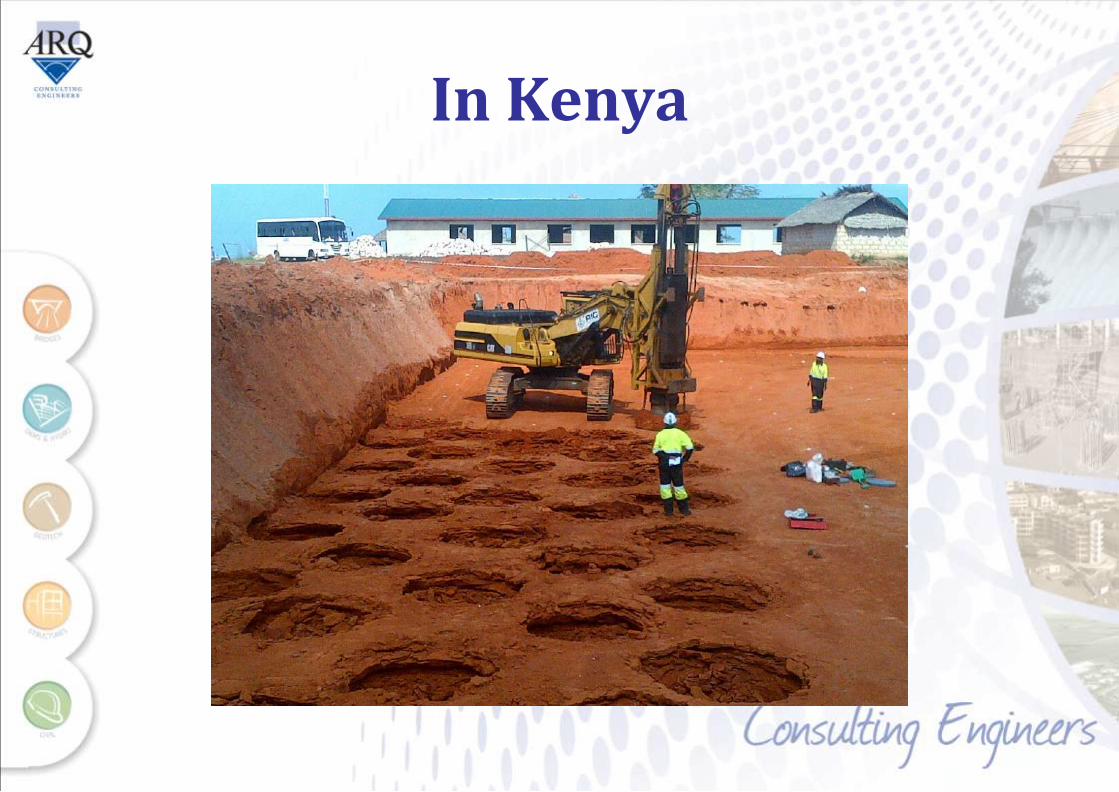
In Kenya
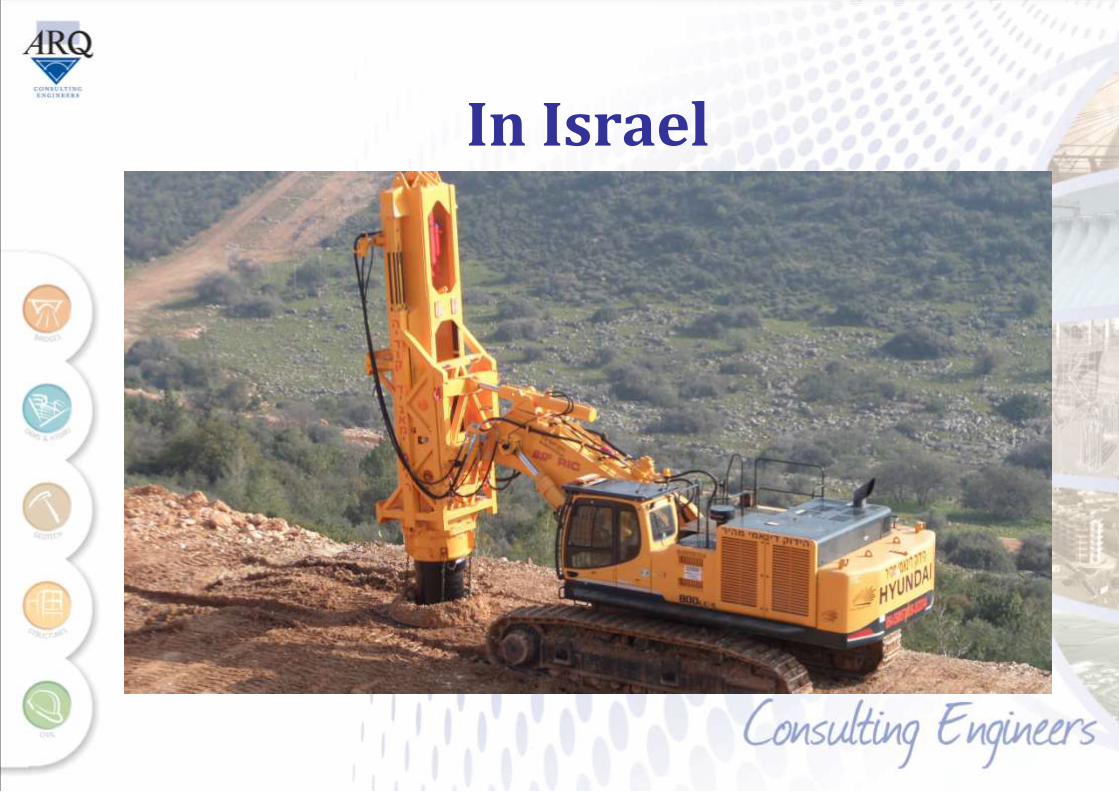
In Israel

In Israel contd….
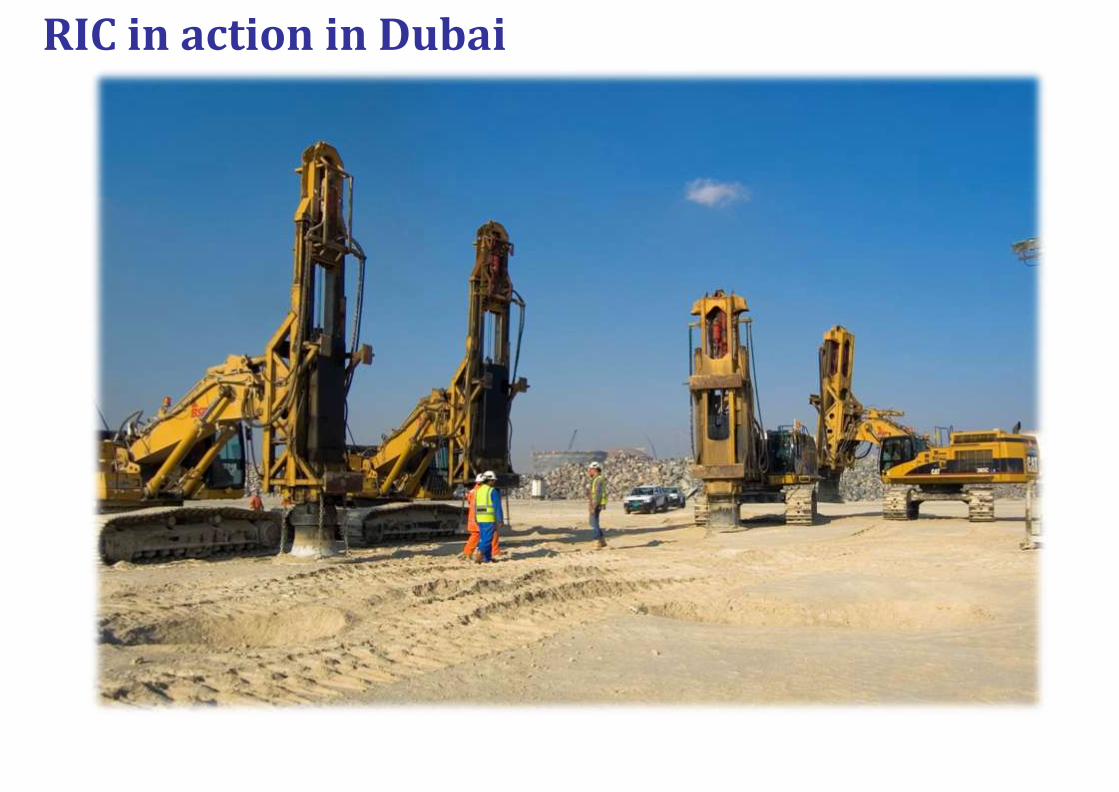
RIC in action in Dubai
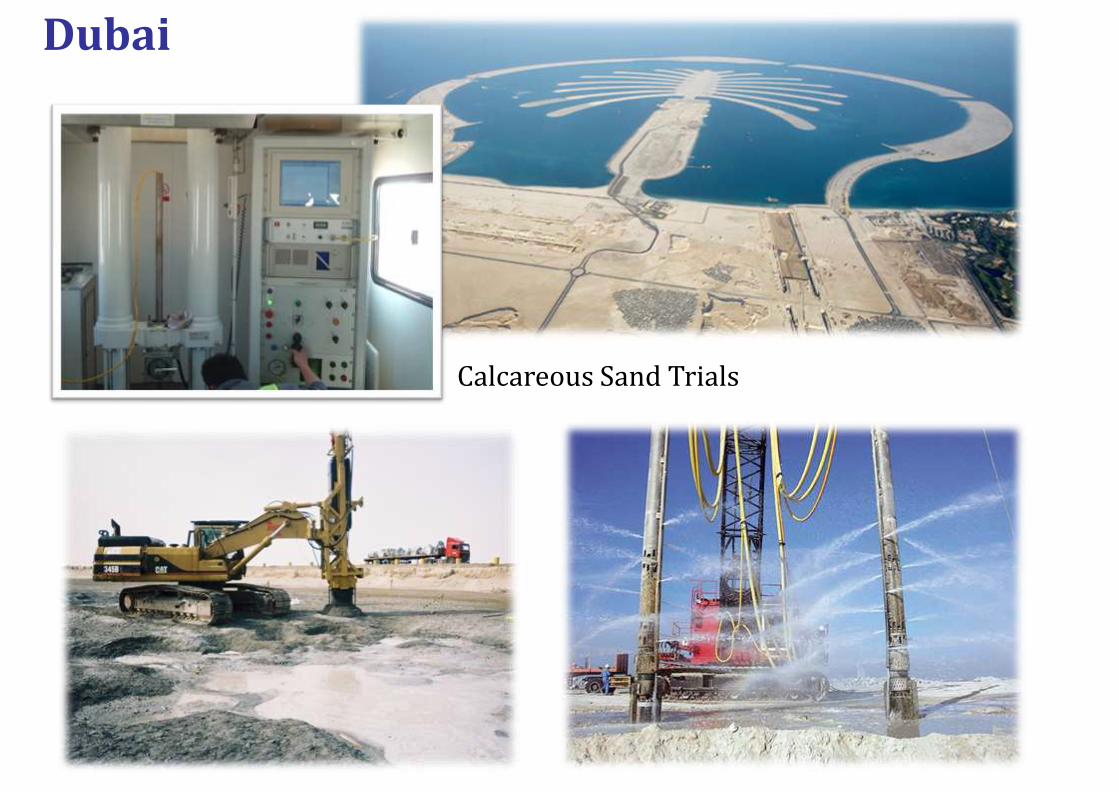
Dubai
Calcareous Sand Trials

Dubai
2m above sea level 3m above sea level

Thank you ladies and gentlemen