Embed Size (px)
Citation preview
Back to Basics Utah City Management Association
and Utah League of Cities and Towns
Chris Hillman, Layne Long and Tom Bakaly
Back to Basics
Back to Basics
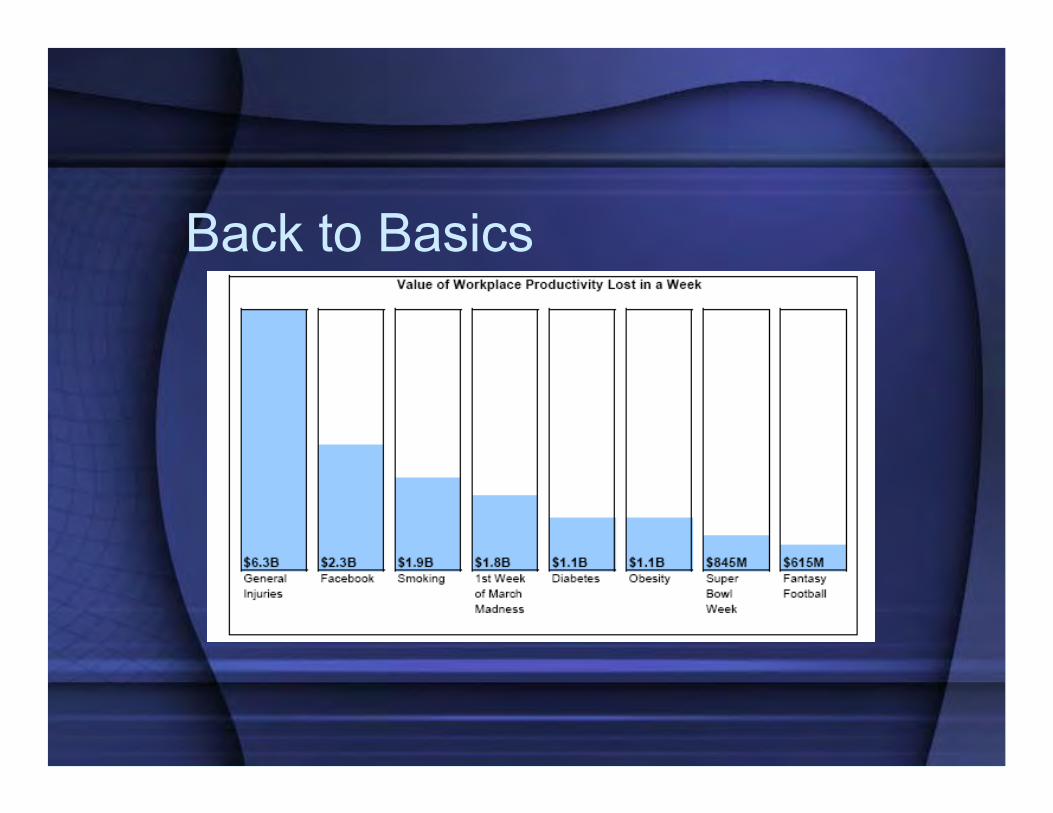
Back to Basics
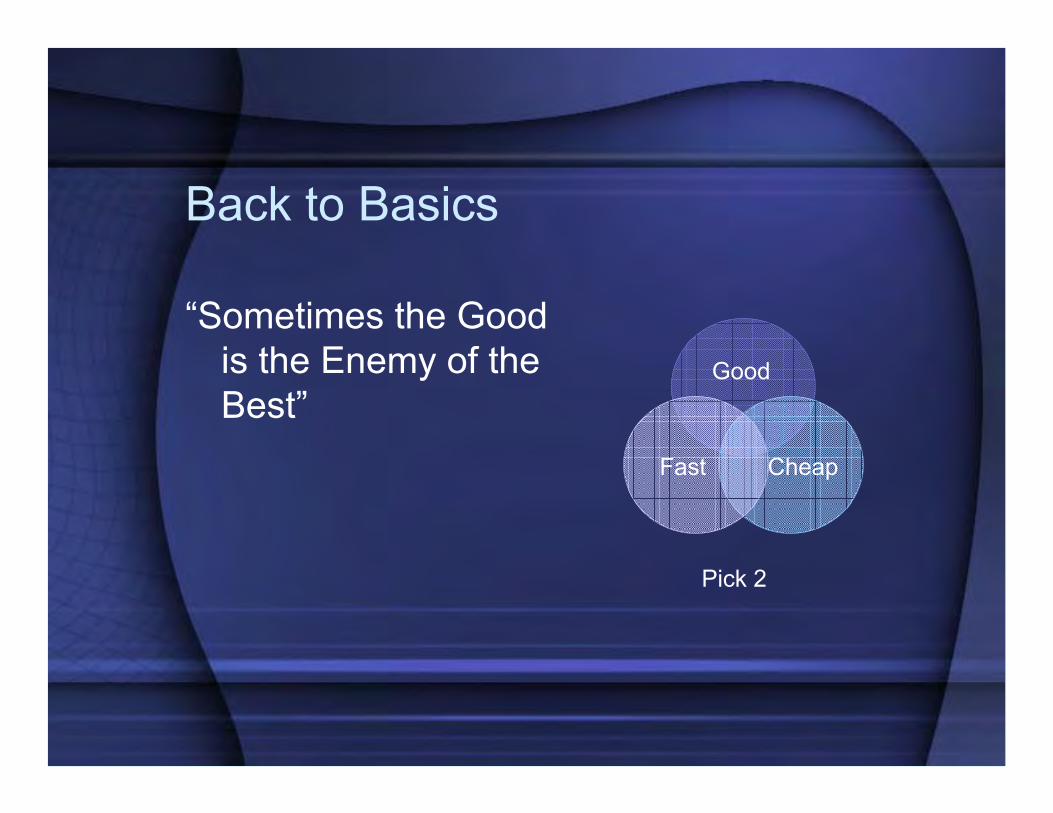
“Sometimes the Good is the Enemy of the Best”
Fast
Good
Cheap
Pick 2

Back to Basics
Short Term – Survive– Across the Board Cuts– Layoffs– Furloughs– Reductions in Salary/Benefits– Defer Capital Expenditures– Reductions in Training and Travel

Back to BasicsLong Term – Innovate
– Re-engineer Processes– Reward Performance– Break-down Insular Silos– Stick to Your Vision– Match Revenues with Expenses– Prioritize Services
Back to BasicsBarriers to Long-Term Approach
– Fear – Inaction• Public/Media Scrutiny• State Legislative Concerns• Perceptions of Inequity – Equality ≠ Equity
– Elected Officials: Need to Get Elected– Organizational Culture: Empire Building

Back to BasicsBenefits to Long-Term Approach
– Lead – Take Risk – Don’t Dumb Down• Provide Most Efficient Services• Cheaper• Prioritize: Departments Not Equal
– Align Policy Goals with Expenditures– Engaged/Accountable Workforce

Back to Basics

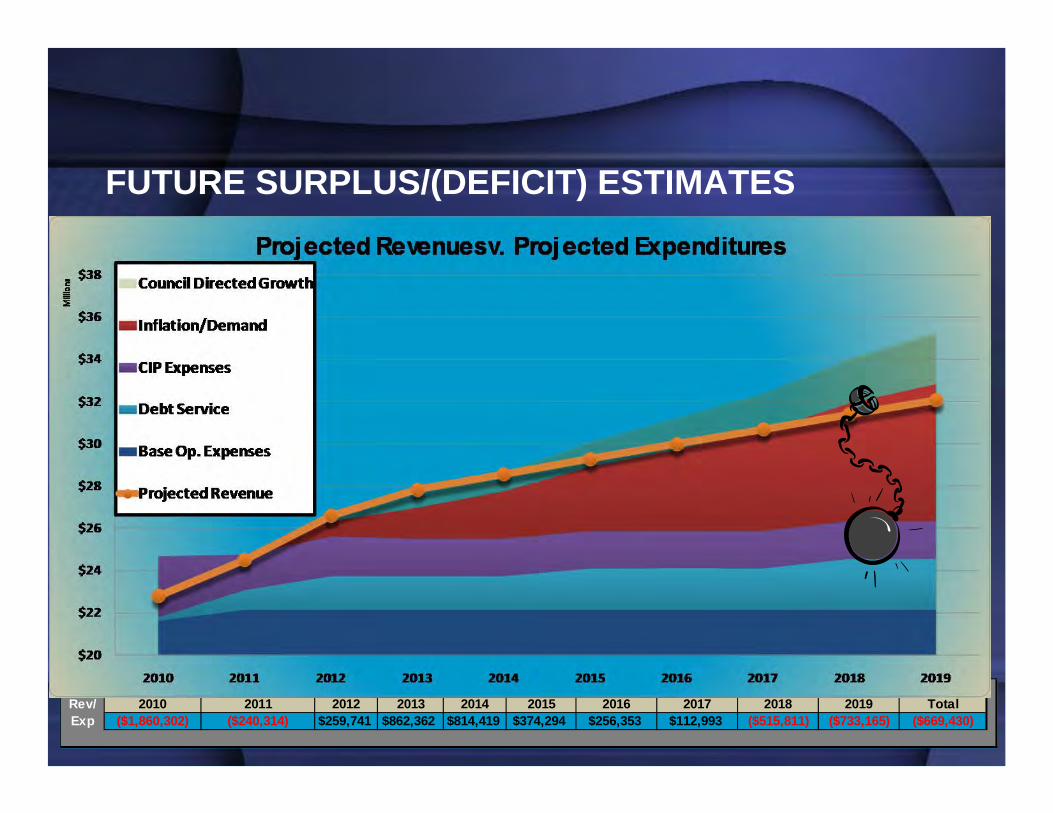
FUTURE SURPLUS/(DEFICIT) ESTIMATES
Rev/ 2010 2011 2012 2013 2014 2015 2016 2017 2018 2019 TotalExp ($1,860,302) ($240,314) $259,741 $862,362 $814,419 $374,294 $256,353 $112,993 ($515,811) ($733,165) ($669,430)
Revenue Surplus (Deficit)Rev/ 2010 2011 2012 2013 2014 2015 2016 2017 2018 2019 TotalExp ($1,860,302) ($240,314) ($38,364) $269,976 ($76,111) ($818,293) ($1,242,254) ($1,695,649) ($2,638,557) ($3,174,136) ($11,514,005)
Revenue Surplus (Deficit)
FUTURE SURPLUS/(DEFICIT) ESTIMATES
Rev/ 2010 2011 2012 2013 2014 2015 2016 2017 2018 2019 TotalExp ($1,860,302) ($240,314) $259,741 $862,362 $814,419 $374,294 $256,353 $112,993 ($515,811) ($733,165) ($669,430)
Revenue Surplus (Deficit)
FUTURE SURPLUS/(DEFICIT) ESTIMATES
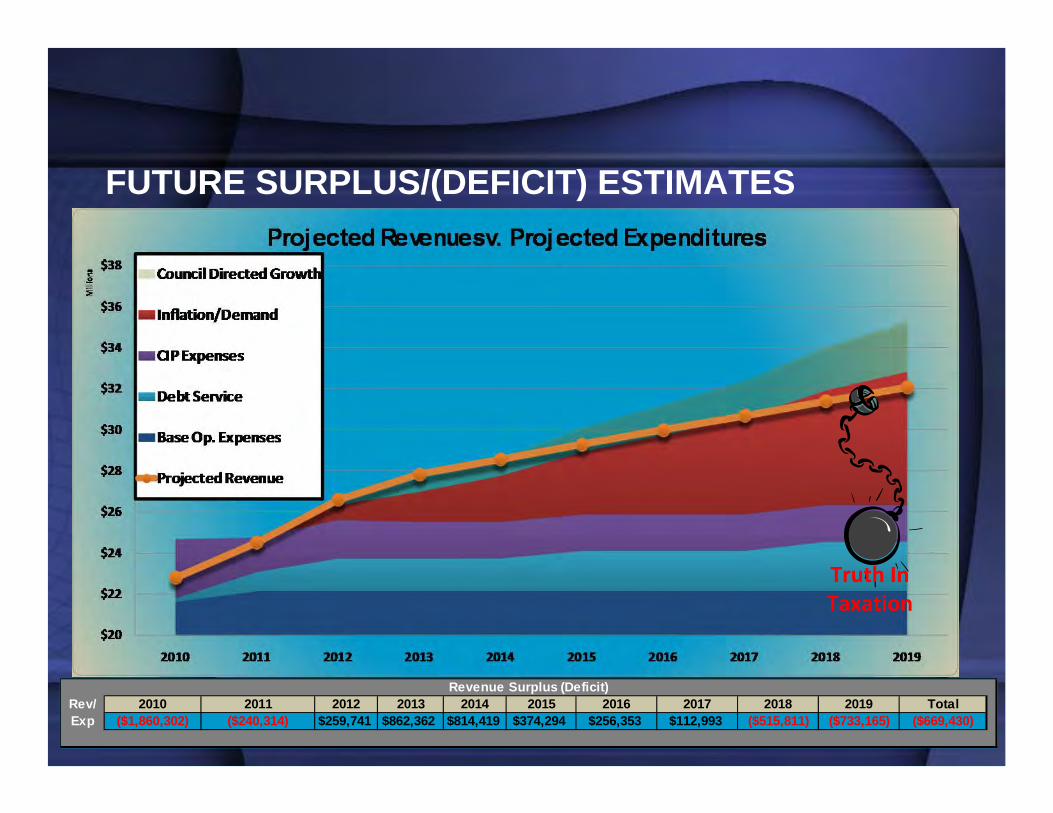
Rev/ 2010 2011 2012 2013 2014 2015 2016 2017 2018 2019 TotalExp ($1,860,302) ($240,314) $259,741 $862,362 $814,419 $374,294 $256,353 $112,993 ($515,811) ($733,165) ($669,430)
Revenue Surplus (Deficit)
Truth In Taxation

FUTURE SURPLUS/(DEFICIT) ESTIMATES
Truth In Taxation
2.5%2.5%
2.5%2.5%
2.5%2.5%
Rev/ 2010 2011 2012 2013 2014 2015 2016 2017 2018 2019 TotalExp ($1,860,302) ($240,314) $259,741 $1,056,797 $1,212,625 $985,616 $1,090,151 $1,178,652 $791,125 $824,507 $5,298,597
Revenue Surplus (Deficit)

32%
33%
12%
5%12%
6%
Current Revenue Mix
Property Tax
Sales Tax
Franchise Tax
BPE Fees
Other Fees
IFTs
36%
31%
12%
8%11% 3%
Service Stability Revenue Mix
Sample Service Funding Matrix
Function Total Budget Property Tax Sales Tax Franchise Tax BPE Fees Other Fees IFTsAdministration 5,181,072$ 26% 41% 12% 8% 3% 11%Community Development 2,957,709$ 14% 27% 7% 50% 0% 2%Public Safety 4,175,373$ 55% 28% 15% 0% 2% 1%Public Works 4,751,184$ 55% 27% 14% 0% 0% 3%Recreation 4,050,096$ 22% 19% 7% 0% 52% 0%Other 965,806$ 27% 37% 11% 0% 24% 0%Capital Projects 2,821,234$ 37% 42% 14% 0% 7% 0%
Revenue Mix Producing Ideal Service Stability
Long-term Revenue Mix Plan
10‐Year Plan to Achieve Ideal Revenue Mix
How do we get back to the basics?• Analysis of core functions, services,
and processes• Willingness to change how, when and
which services are delivered• Set and adhere to priorities• Develop a revenue sustainability plan
Revenue Sustainability Plan• Understand your revenue base
– Traditional forecasting models don’t work– New models require foresight and
flexibility– Must be tuned in to local, regional, state,
and national information and trends
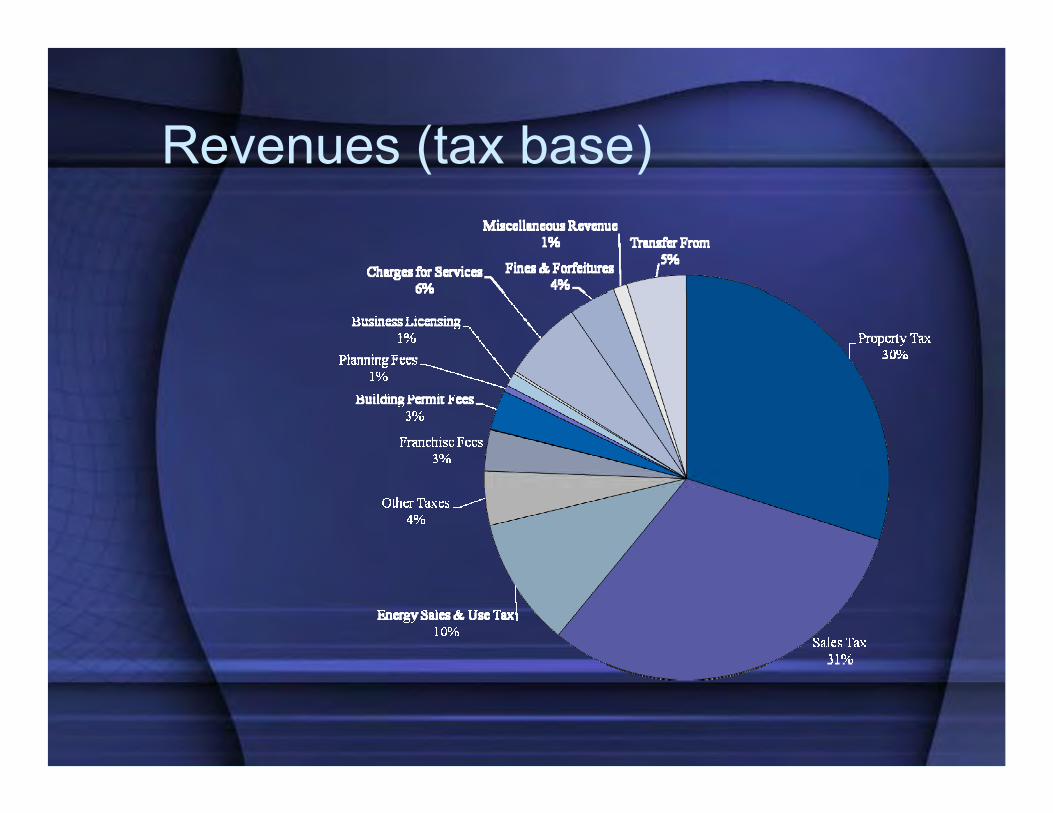
Revenues (tax base)
Revenue Sustainability Plan• Collection of existing revenue
– Equity and fairness– Audits
• Protect and expand tax base• Job growth businesses• Review revenue performance no less
than quarterly

Revenue Sustainability Plan• Consider contracting out services and
equipment where appropriate• Bring services in-house where cost
effective
Revenue Sustainability Plan• Cooperatively share/provide services
with other jurisdictions– Financial, human resources, training– Public works maintenance & repair– Utilities– Public safety (police, fire, dispatch)– Recreation, leisure, library etc.– Building inspection, plan check

Revenue Sustainability Plan• Redesign a smaller, leaner, flatter,
more sustainable organization• Do not sacrifice required infrastructure
maintenance• Establish and maintain appropriate
reserves in all funds• Create flexible staffing models
adaptable to work load fluctuations

Revenue Sustainability Plan• Cost-of-service analysis
– Measurable factors– Benchmarks– Evaluate cost/benefit– Redesign organizational units

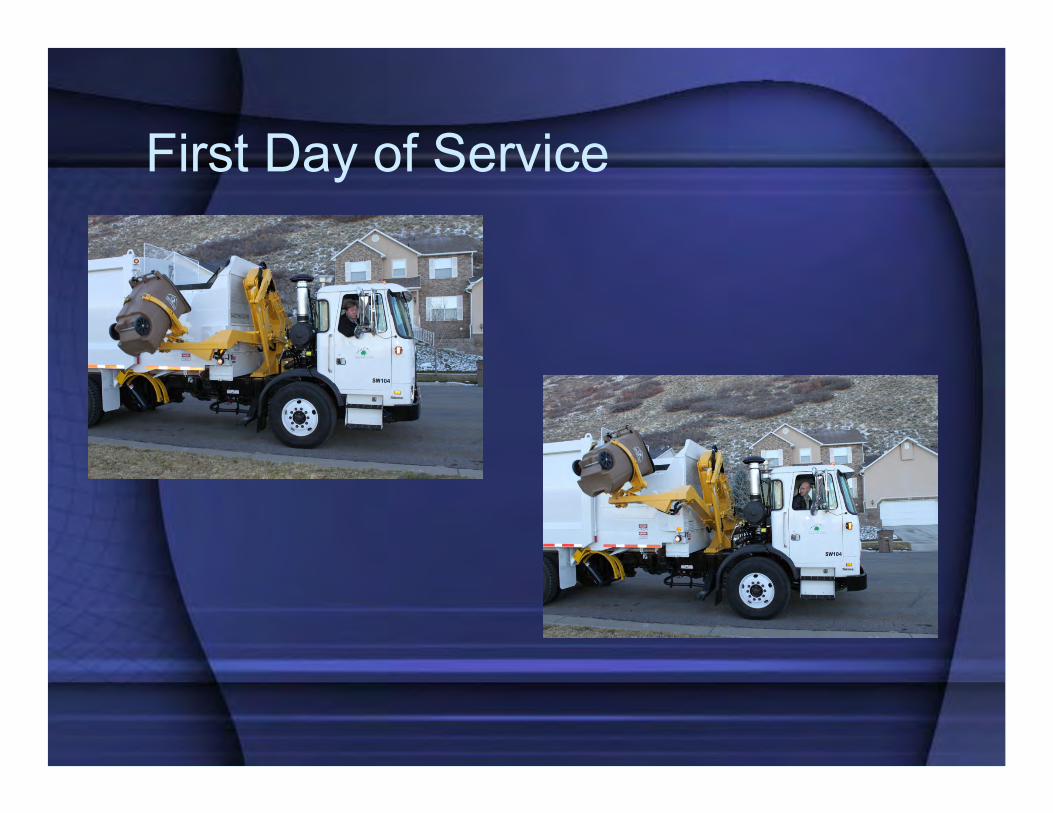
First Day of Service

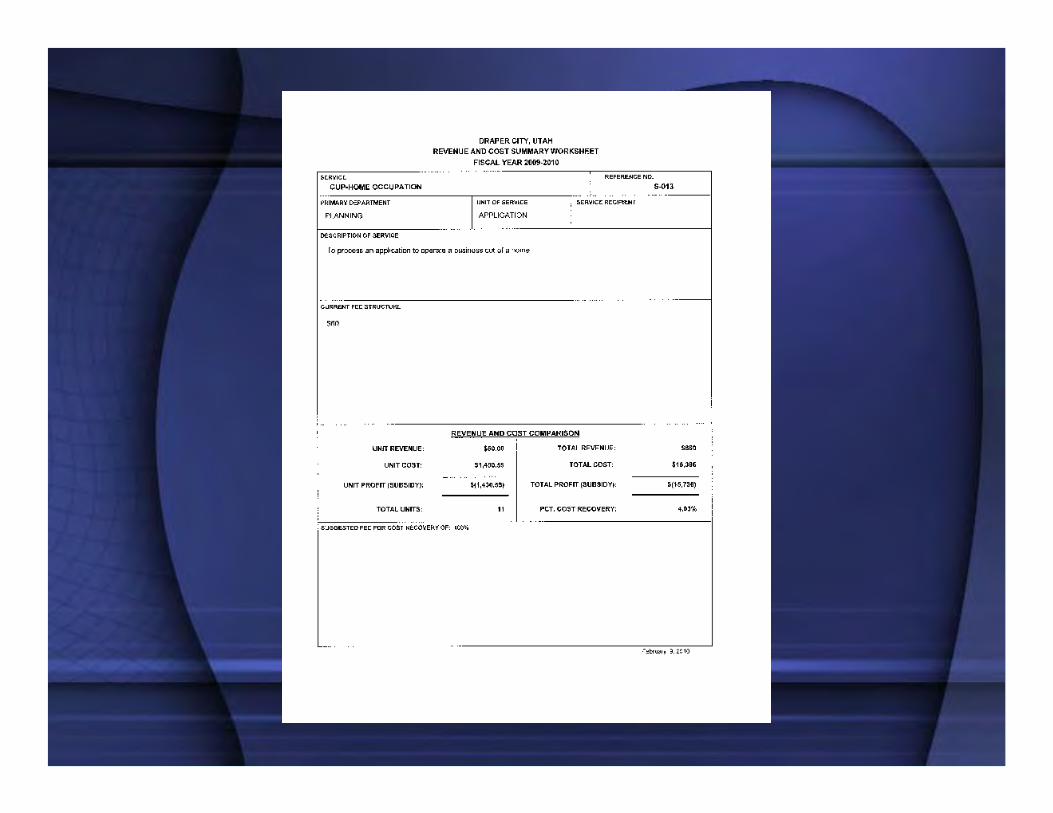
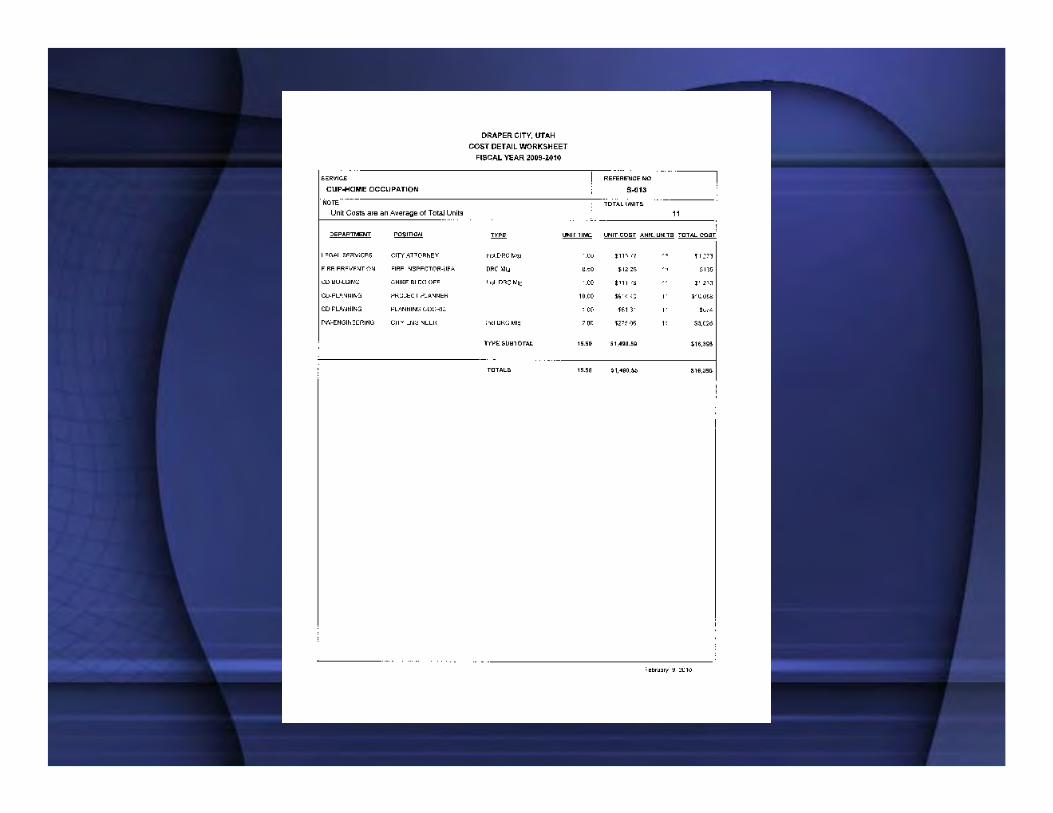
Service Cost Study• Establish appropriate cost-recovery
targets for services and adjust fee structure accordingly

Why calculate service costs?• Helps eliminate unintended diversion of
taxes to fee services• Identifies when costs exceed perceived
value of the process• Shows if a fee service is making a profit• Identifies all costs associated with a
service
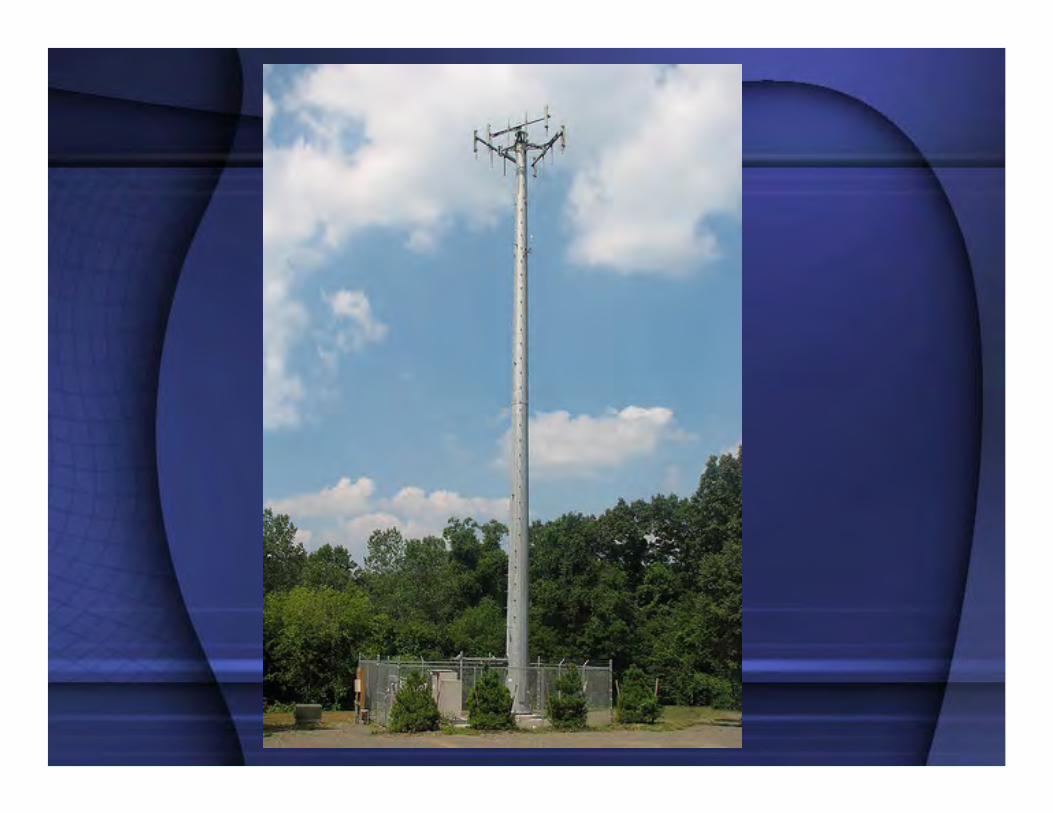
Be Open to New Ideas• Cell Towers• Street Maintenance• Community Services Workers

Back to Basics- Prioritize ServicesClearfield City’s Three-Step Approach of
Budgeting the Basics During & After Economic Downturn
Step 1: Stop the bleedingStep 2: Create new long-term visionStep 3: Prioritize new monies based
upon new long-term vision

Step 1: Stop the Bleeding
• Program/Service Prioritization Exercise– Give them a tool to grasp onto!!– Identified 65 basic services, issues and
programs– Council survey using Likert Scale of 1-19– Survey range and average analysis
• Arranged by overall average and function– Identify revenues, expenses and net
income/loss for each
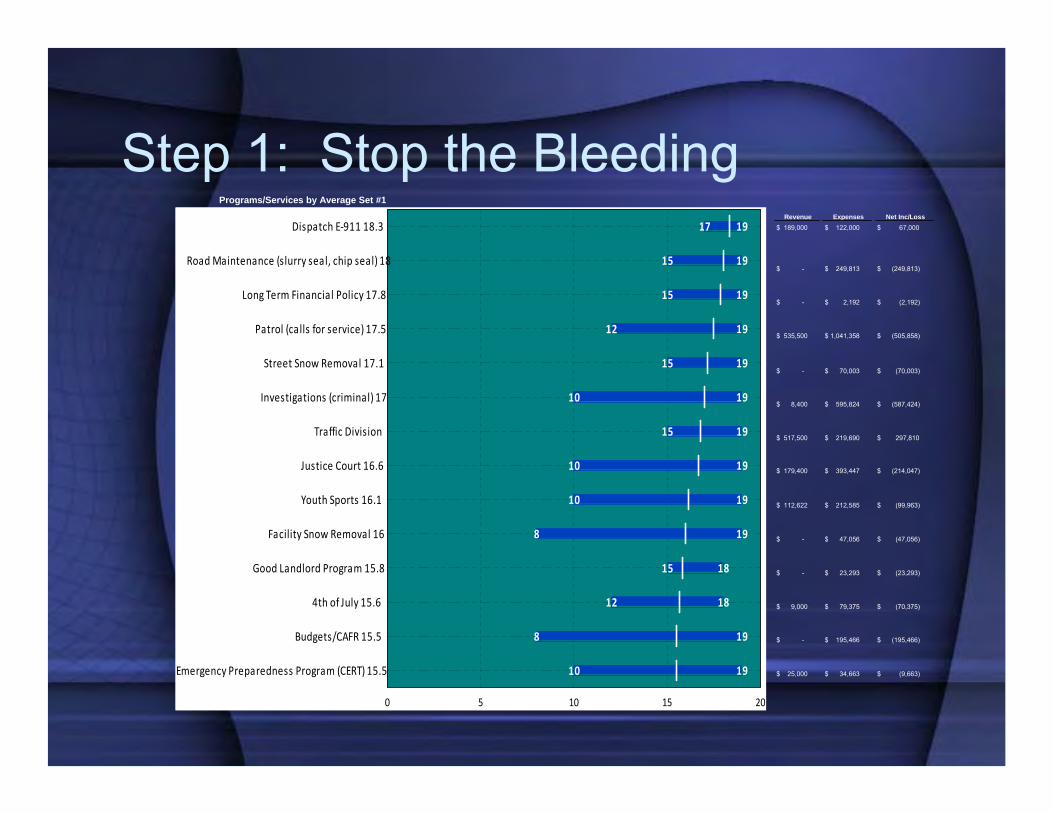
Step 1: Stop the BleedingPrograms/Services by Average Set #1
Revenue Expenses Net Inc/Loss $ 189,000 $ 122,000 $ 67,000
$ - $ 249,813 $ (249,813)
$ - $ 2,192 $ (2,192)
$ 535,500 $ 1,041,358 $ (505,858)
$ - $ 70,003 $ (70,003)
$ 8,400 $ 595,824 $ (587,424)
$ 517,500 $ 219,690 $ 297,810
$ 179,400 $ 393,447 $ (214,047)
$ 112,622 $ 212,585 $ (99,963)
$ - $ 47,056 $ (47,056)
$ - $ 23,293 $ (23,293)
$ 9,000 $ 79,375 $ (70,375)
$ - $ 195,466 $ (195,466)
$ 25,000 $ 34,663 $ (9,663)
19
19
19
19
19
19
19
19
19
19
18
18
19
19
17
15
15
12
15
10
15
10
10
8
15
12
8
10
Dispatch E‐911 18.3
Road Maintenance (slurry seal, chip seal) 18
Long Term Financial Policy 17.8
Patrol (calls for service) 17.5
Street Snow Removal 17.1
Investigations (criminal) 17
Traffic Division
Justice Court 16.6
Youth Sports 16.1
Facility Snow Removal 16
Good Landlord Program 15.8
4th of July 15.6
Budgets/CAFR 15.5
Emergency Preparedness Program (CERT) 15.5
0 5 10 15 20

Step 1: Stop the BleedingEXPENSES
Prof. Total FY09Program/Service Hours FTE % Payroll Operating Services Expense Budget Revenue Profit/Loss
Legislative Duties/Activities 0 0.00 0.0% $ 100,396 $ 25,695 $ ‐ $ 126,091 $ 126,091 $ ‐ $ (126,091)Governmental Relations/Memberships 0 0.00 0.0% $ ‐ $ 15,850 $ ‐ $ 15,850 $ 15,850 $ ‐ $ (15,850)Youth Council 0 0.00 0.0% $ ‐ $ 2,000 $ ‐ $ 2,000 $ 2,000 $ ‐ $ (2,000)Donations/Sponsorships 0 0.00 0.0% $ ‐ $ 5,000 $ ‐ $ 5,000 $ 5,000 $ ‐ $ (5,000)Employee/Citizen Events & Programs 0 0.00 0.0% $ ‐ $ 29,750 $ ‐ $ 29,750 $ 29,750 $ ‐ $ (29,750)
0 0.00 0.0% $ 100,396 $ 78,295 $ ‐ $ 178,691 $ 178,691 $ ‐ $ (178,691)
Justice Court Operations 3,121 1.50 27.7% $ 80,967 $ 6,653 $ 77,500 $ 165,120 $ 165,120 $ 115,000 $ (50,120)Window/Customer Service 6,538 3.14 58.1% $ 169,613 $ 13,936 $ ‐ $ 183,549 $ 183,549 $ 28,750 $ (154,799)Small Claims Court 96 0.05 0.9% $ 2,490 $ 205 $ ‐ $ 2,695 $ 2,695 $ 15,600 $ 12,905
Drug Court 480 0.23 4.3% $ 12,452 $ 1,023 $ ‐ $ 13,475 $ 13,475 $ 50 $ (13,425)Justice Court Administration 347 0.17 3.1% $ 9,002 $ 739 $ ‐ $ 9,741 $ 9,741 $ 10,000 $ 259 Video Arraignments 672 0.32 6.0% $ 17,433 $ 1,432 $ ‐ $ 18,865 $ 18,865 $ 10,000 $ (8,865)
11,254 5.41 100.0% $ 291,959 $ 23,988 $ 77,500 $ 393,447 $ 393,447 $ 179,400 $ (214,047)
General Administration 1,456 0.70 21.2% $ 51,848 $ 14,643 $ ‐ $ 66,491 $ 66,491 $ ‐ $ (66,491)Administrative Support 416 0.20 6.1% $ 14,814 $ 755 $ ‐ $ 15,569 $ 15,569 $ ‐ $ (15,569)Lobbying/Government Affairs 312 0.15 4.5% $ 11,110 $ 566 $ 96,000 $ 107,676 $ 107,676 $ ‐ $ (107,676)Performance Auditing/Analysis 250 0.12 3.6% $ 8,888 $ 453 $ ‐ $ 9,341 $ 9,341 $ ‐ $ (9,341)Employee Programs 208 0.10 3.0% $ 7,407 $ 4,078 $ 2,000 $ 13,485 $ 13,485 $ ‐ $ (13,485)Kiosk/Customer Service 3,032 1.46 44.1% $ 107,969 $ 5,503 $ ‐ $ 113,472 $ 113,472 $ ‐ $ (113,472)Newsletter 364 0.18 5.3% $ 12,962 $ 661 $ ‐ $ 13,623 $ 13,623 $ ‐ $ (13,623)Cell Phones 312 0.15 4.5% $ 11,110 $ 566 $ ‐ $ 11,676 $ 11,676 $ ‐ $ (11,676)Economic Development 520 0.25 7.6% $ 18,517 $ 3,944 $ ‐ $ 22,461 $ 22,461 $ ‐ $ (22,461)
6,870 3.30 100.0% $ 244,626 $ 31,169 $ 98,000 $ 373,795 $ 373,795 $ ‐ $ (373,795)
Elections 312 0.15 7.5% $ 9,391 $ 36,376 $ ‐ $ 45,766 $ 45,766 $ ‐ $ (45,766)Records Management 3,328 1.60 80.0% $ 100,166 $ 14,675 $ 5,850 $ 120,692 $ 120,692 $ ‐ $ (120,692)Customer Service 520 0.25 12.5% $ 15,651 $ 2,293 $ ‐ $ 17,944 $ 17,944 $ ‐ $ (17,944)

Step 2: Create NewLong-term Vision
• Annual Budget Retreat Activity– Prioritize services for upcoming fiscal year
• No long-term approach-only the here and now
• Create a new 10-year strategic plan
• You have to knowwhere you’re goingto prioritize services

Step 2: Create NewLong-term Vision
• Originally slated as a 3-hour afternoon budget retreat
• Ended up as a year-long process
• Extensive public input and public education
• 20-member, community-based planning committee representing all stake holders

• Re-drafted our core values, vision and mission statements
• Recognized 104 strengths, weaknesses, opportunities and threats (SWOT)
• Three targeted environments (Economic, Social & Local Government)
• 9 goals, 20 areas of emphasis, 24 strategies and 81 specific tactics we will accomplish during the next 10 years
Step 2: Create NewLong-term Vision

• You’ve made the tough choices:– Cut operating expenses– Cut one-time capital projects & equipment– Comp plan reductions, furloughs, & layoffs
• Revenues will start going back up (hopefully!)– How are you going to prioritize and make
sure you stay “Back to the Basics?”
Step 3: Prioritize New Monies Using Strategic Plan

• Clearfield’s Pictograph Exercise– Identify from strategic
plan areas of emphasis, strategies and tactics with pictures
– Prioritize each area for the next five fiscal years and set aside a percentage of new money for each one
Step 3: Prioritize New Monies Using Strategic Plan

Prioritization Summary
• Begin with the end in mind– Know where you want to go (strategic
plan) and how to get there• Take advantage of economic downturn
– You’ve already cut expenses deeply– Now is the time to plan for the future and
take advantage of increasing revenues

Back to BasicsQuestions/Comments