Embed Size (px)
DESCRIPTION
The Development of Pupils with and Pupils without Special Educational Needs in Primary Schools in The Netherlands. Ed Smeets Guuske Ledoux ITSKohnstamm Instituut Radboud UniversityUniversity of Amsterdam Nijmegen, The Netherlands Amsterdam, The Netherlands ECER 2013. Background. - PowerPoint PPT Presentation
Citation preview
The Development of Pupils with and Pupils without Special Educational Needs
in Primary Schools in The Netherlands
Ed Smeets Guuske LedouxITS Kohnstamm InstituutRadboud University University of AmsterdamNijmegen, The Netherlands Amsterdam, The Netherlands
ECER 2013
Background
The percentage of pupils in special schools in The Netherlands is among the highest in Europe: between 4 and 5% of pupils aged 4-12.
In addition, 1% of pupils in mainstream schools receive additional SEN budget, whereas teachers consider 26% of their pupils to have special educational needs (Smeets et al., 2007).
This outcome confirms the percentage of 26 found earlier in The United Kingdom (Croll & Moses, 2003).
Research questions
1) What proportion of pupils in mainstream primary school in The Netherlands have SEN according to their teachers and what kind of problems do they have in opinion of their teachers?
2) What is the stability of the ‘SEN label’ over a period of 3 years?3) How do literacy and numeracy attainment levels of pupils with
and pupils without SEN develop over time?4) How do pupils with and pupils without SEN develop according
to their teachers with respect to social-emotional aspects?
Method
• Large cohort study in primary schools (COOL5-18)• Grades 2, 5 and 8• 3 Year interval• ‘Pupil Profile’: Questionnaire, completed by teacher for
every pupil in class• ‘SEN Profile’: Questionnaire, completed by teacher for
every pupil in class considered to have SEN• Tests, completed by every pupil in class: mathematics,
technical reading, vocabulary, comprehensive reading
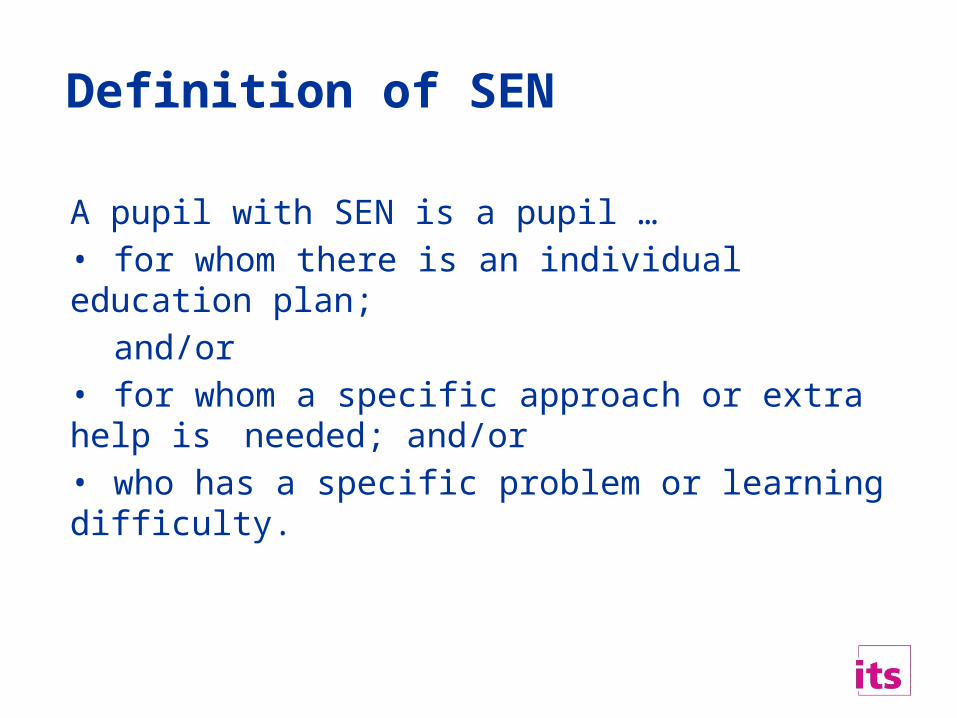
Definition of SEN
A pupil with SEN is a pupil …• for whom there is an individual education plan;
and/or• for whom a specific approach or extra help is
needed; and/or• who has a specific problem or learning difficulty.
Research Question 1: Pupils with SEN and the nature of
their problems (according to their teachers)
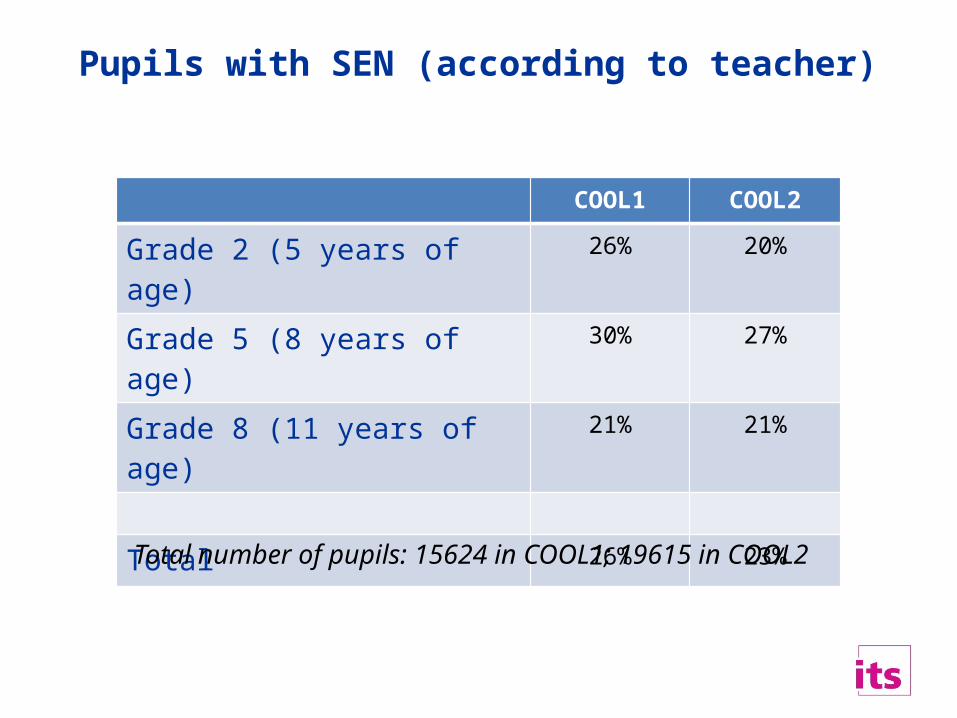
Pupils with SEN (according to teacher)
COOL1 COOL2
Grade 2 (5 years of age) 26% 20%
Grade 5 (8 years of age) 30% 27%
Grade 8 (11 years of age) 21% 21%
Total 26% 23%
Total number of pupils: 15624 in COOL1; 19615 in COOL2
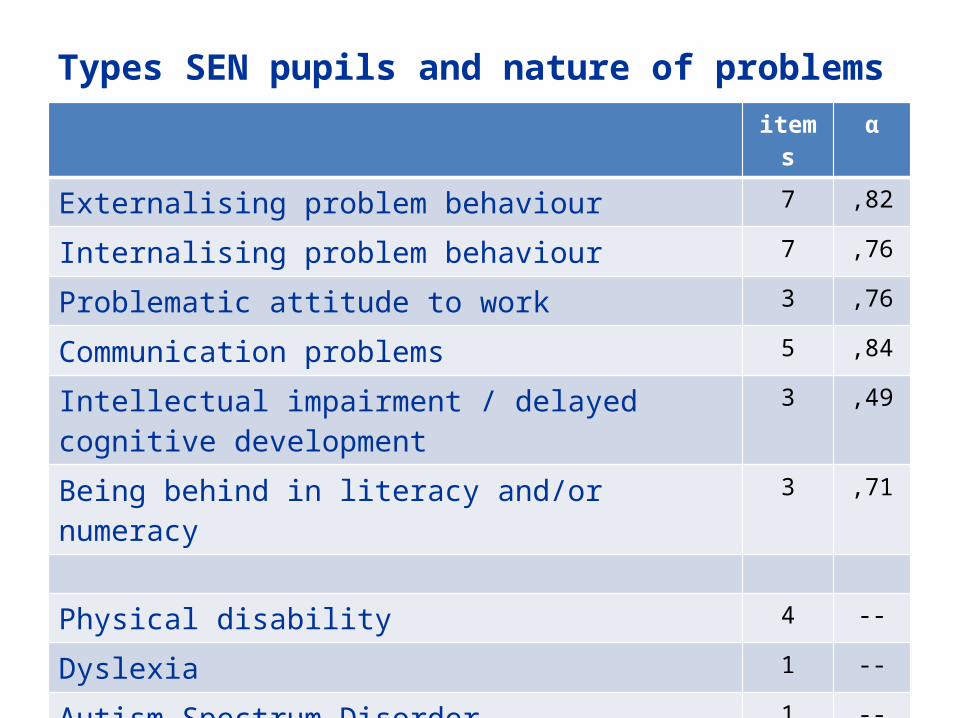
Types SEN pupils and nature of problemsitems α
Externalising problem behaviour 7 ,82
Internalising problem behaviour 7 ,76
Problematic attitude to work 3 ,76
Communication problems 5 ,84
Intellectual impairment / delayed cognitive development 3 ,49
Being behind in literacy and/or numeracy 3 ,71
Physical disability 4 --
Dyslexia 1 --
Autism Spectrum Disorder 1 --
Gifted 1 --
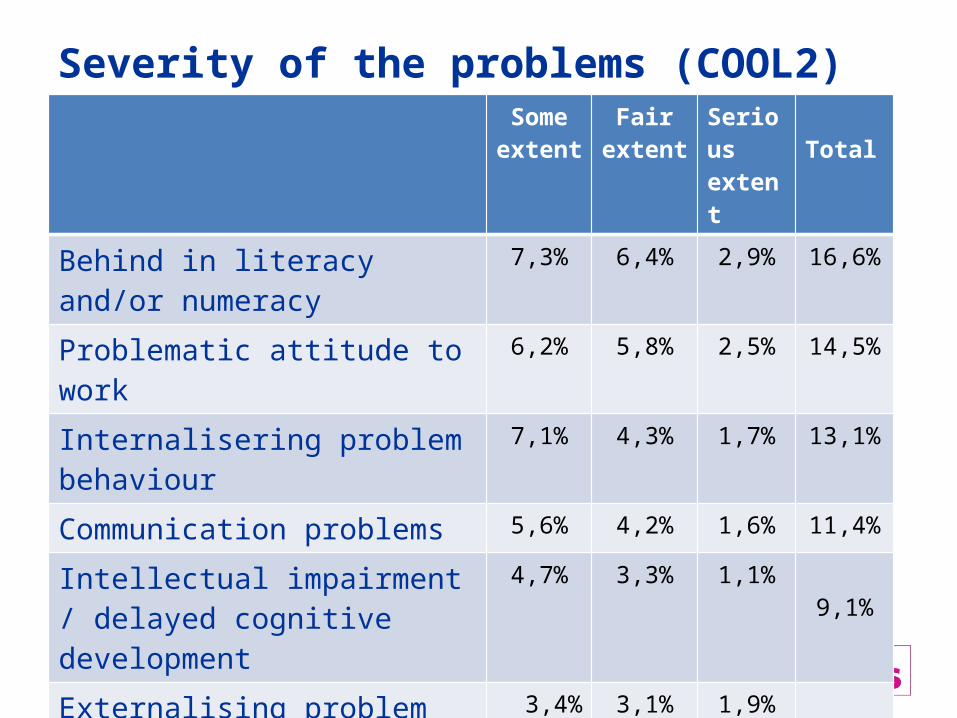
Severity of the problems (COOL2)Some extent
Fair extent
Serious extent
Total
Behind in literacy and/or numeracy 7,3% 6,4% 2,9% 16,6%
Problematic attitude to work 6,2% 5,8% 2,5% 14,5%
Internalisering problem behaviour 7,1% 4,3% 1,7% 13,1%
Communication problems 5,6% 4,2% 1,6% 11,4%
Intellectual impairment / delayed cognitive development
4,7% 3,3% 1,1% 9,1%
Externalising problem behaviour 3,4% 3,1% 1,9% 8,4%
Dyslexia 1,3% 1,7% 1,2% 4,2%
Physical disability 1,7% 0,6% 0,4% 2,7%
Autism Spectrum Disorder 0,8% 0,6% 0,4% 1,8%
Gifted 0,6% 0,4% 0,2% 1,2%
Research Question 2:Stability of the ‘SEN label’
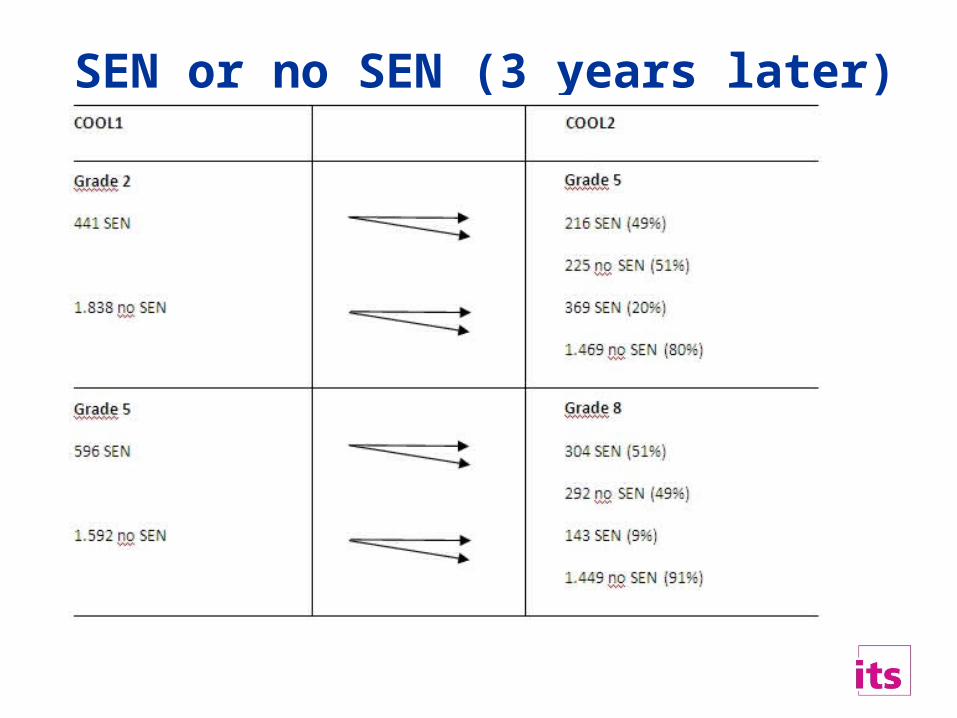
SEN or no SEN (3 years later)
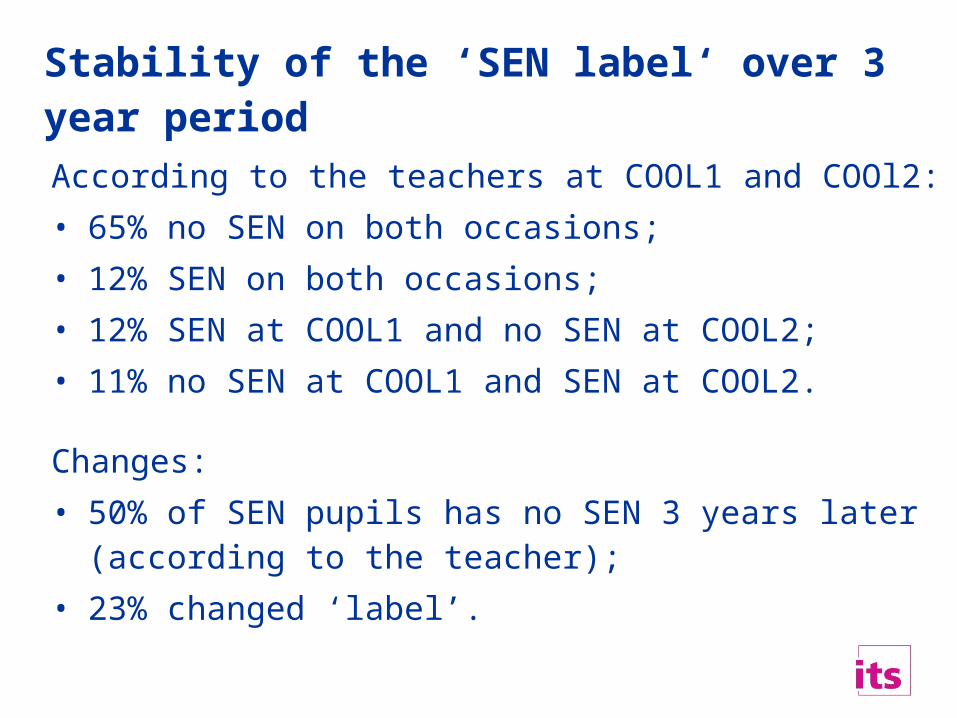
Stability of the ‘SEN label‘ over 3 year period
According to the teachers at COOL1 and COOl2:• 65% no SEN on both occasions; • 12% SEN on both occasions;• 12% SEN at COOL1 and no SEN at COOL2;• 11% no SEN at COOL1 and SEN at COOL2.
Changes:• 50% of SEN pupils has no SEN 3 years later (according to the teacher);• 23% changed ‘label’.
Research Question 3: Development of cognitive attainment levels of pupils
with and pupils without SEN
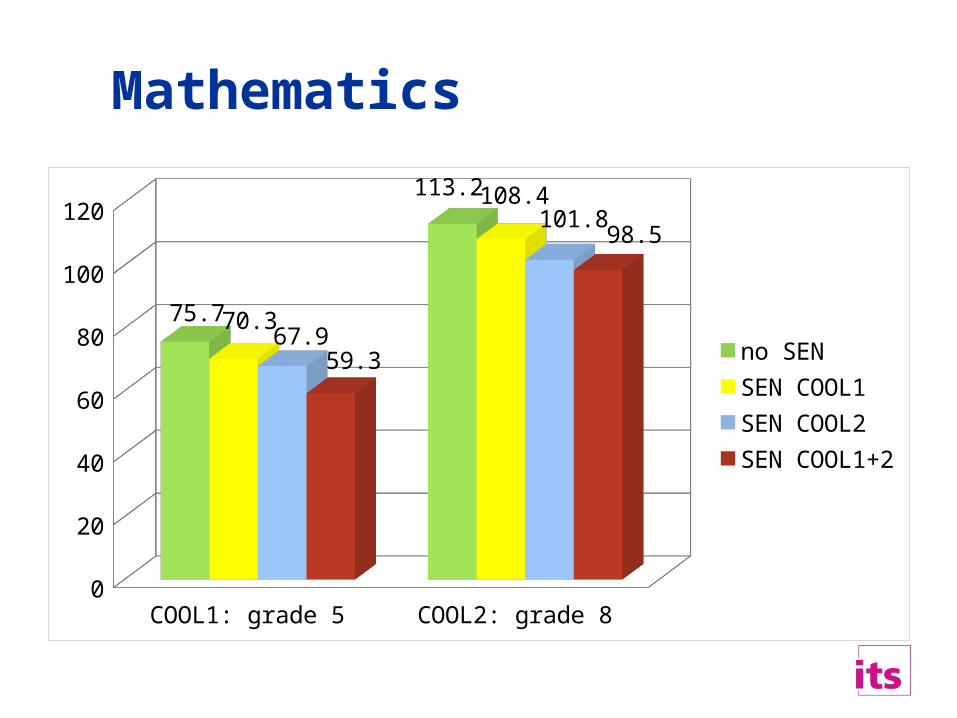
Mathematics
COOL1: grade 5 COOL2: grade 80
20
40
60
80
100
120
75.7
113.2
70.3
108.4
67.9
101.8
59.3
98.5
no SENSEN COOL1SEN COOL2SEN COOL1+2
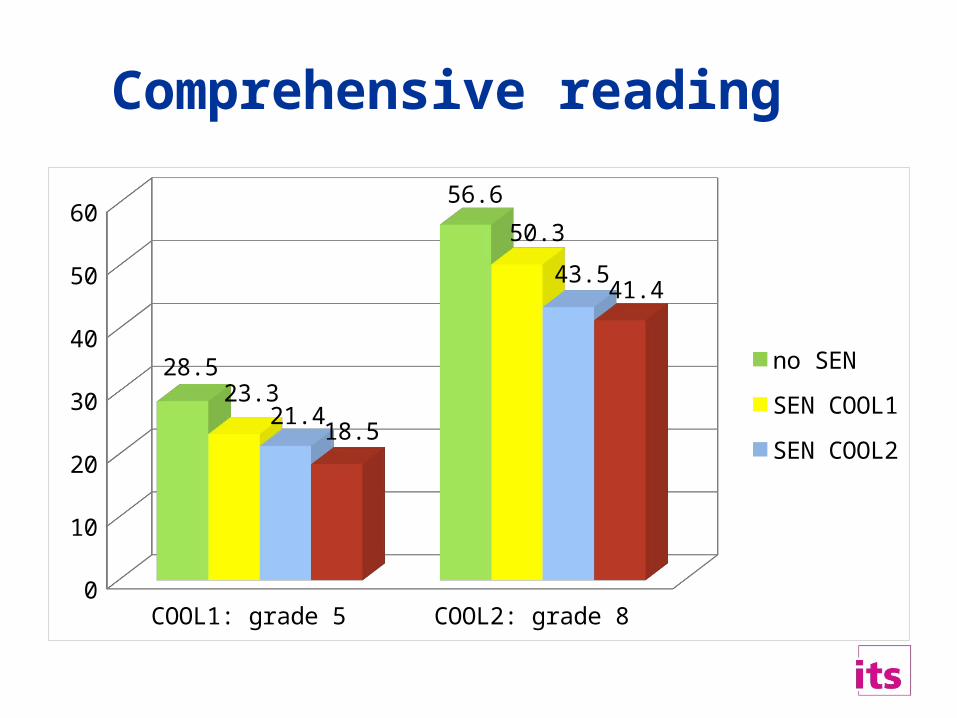
Comprehensive reading
COOL1: grade 5 COOL2: grade 80
10
20
30
40
50
60
28.5
56.6
23.3
50.3
21.4
43.5
18.5
41.4
no SENSEN COOL1SEN COOL2SEN COOL1+2
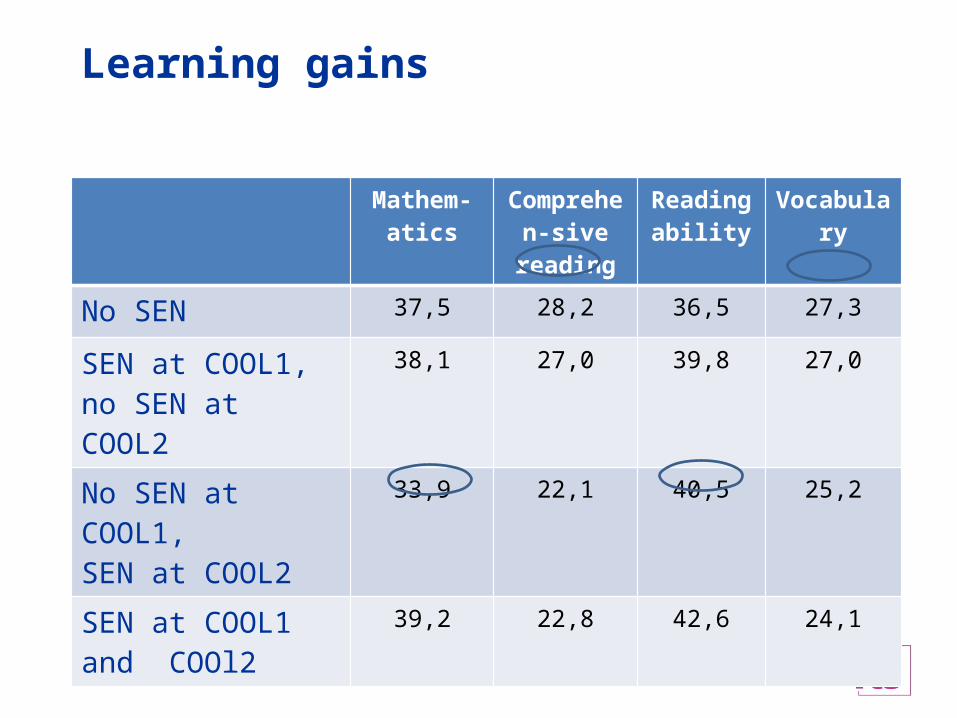
Learning gains
Mathem-atics
Comprehen-sive reading
Reading ability
Vocabulary
No SEN 37,5 28,2 36,5 27,3
SEN at COOL1, no SEN at COOL2
38,1 27,0 39,8 27,0
No SEN at COOL1, SEN at COOL2
33,9 22,1 40,5 25,2
SEN at COOL1 and COOl2
39,2 22,8 42,6 24,1
Research Question 4:Social-emotional development of
pupils with and pupils without SEN (according to their teacher)
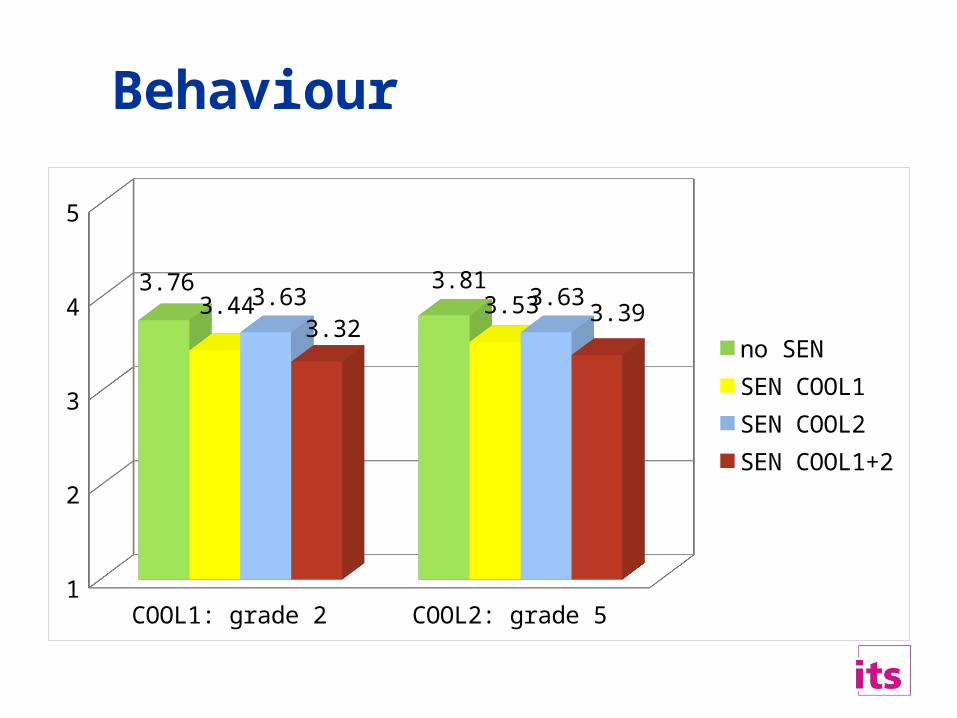
Behaviour
COOL1: grade 2 COOL2: grade 51
2
3
4
5
3.76 3.813.44 3.533.63 3.63
3.323.39
no SENSEN COOL1SEN COOL2SEN COOL1+2
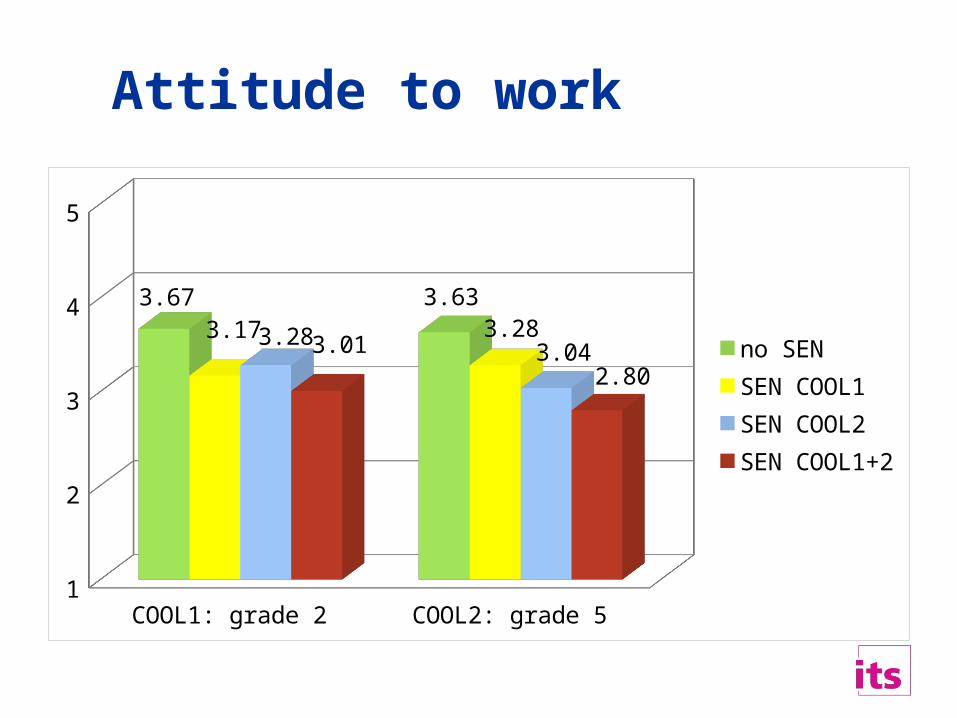
Attitude to work
COOL1: grade 2 COOL2: grade 51
2
3
4
5
3.67 3.633.17 3.283.28
3.043.012.80
no SENSEN COOL1SEN COOL2SEN COOL1+2
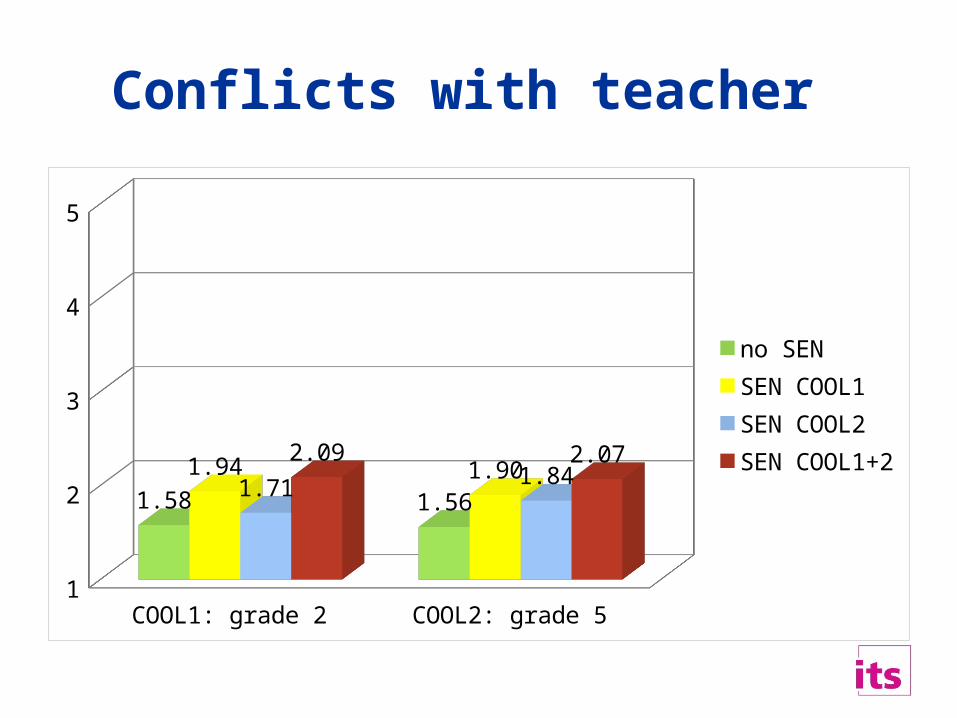
Conflicts with teacher
COOL1: grade 2 COOL2: grade 51
2
3
4
5
1.58 1.56
1.94 1.901.71 1.84
2.09 2.07
no SENSEN COOL1SEN COOL2SEN COOL1+2
Conclusions
Conclusions
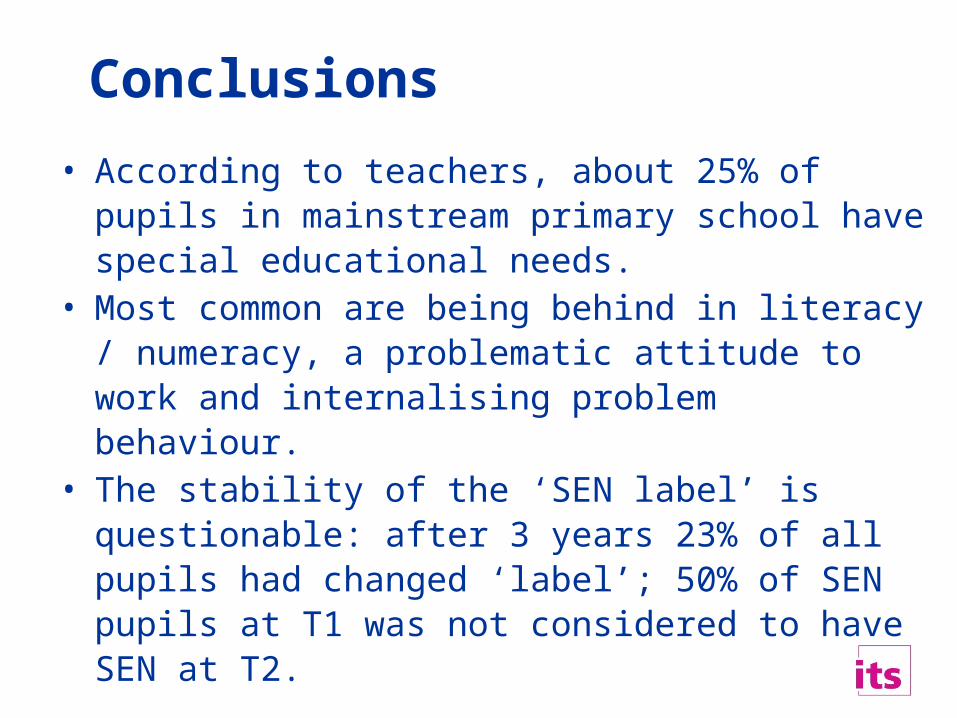
• According to teachers, about 25% of pupils in mainstream primary school have special educational needs.
• Most common are being behind in literacy / numeracy, a problematic attitude to work and internalising problem behaviour.
• The stability of the ‘SEN label’ is questionable: after 3 years 23% of all pupils had changed ‘label’; 50% of SEN pupils at T1 was not considered to have SEN at T2.
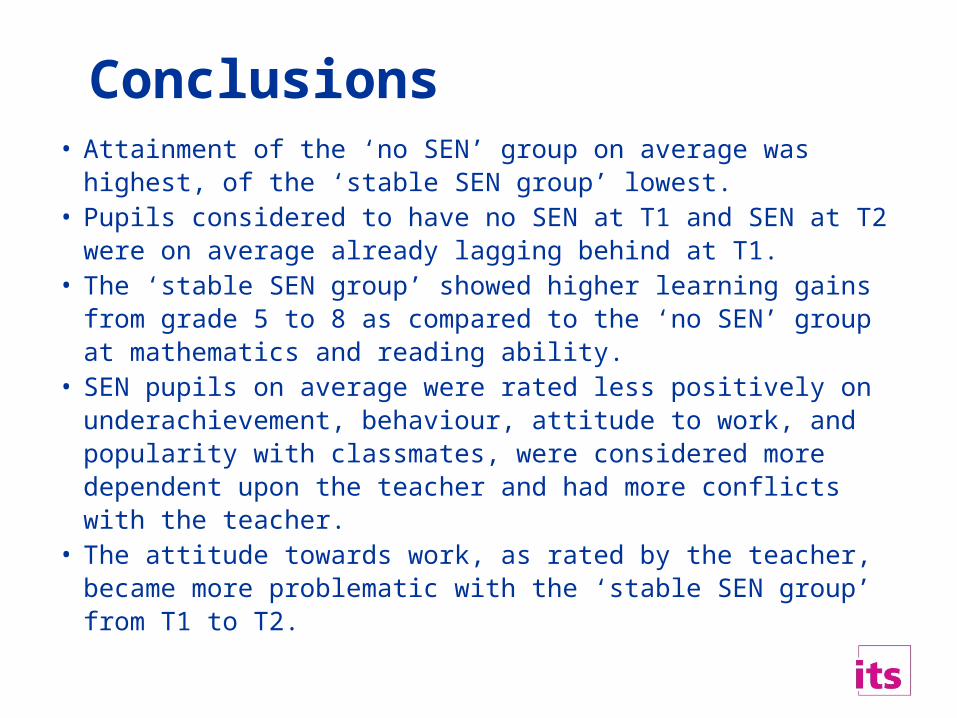
Conclusions• Attainment of the ‘no SEN’ group on average was highest, of the
‘stable SEN group’ lowest.• Pupils considered to have no SEN at T1 and SEN at T2 were on
average already lagging behind at T1. • The ‘stable SEN group’ showed higher learning gains from grade
5 to 8 as compared to the ‘no SEN’ group at mathematics and reading ability.
• SEN pupils on average were rated less positively on underachievement, behaviour, attitude to work, and popularity with classmates, were considered more dependent upon the teacher and had more conflicts with the teacher.
• The attitude towards work, as rated by the teacher, became more problematic with the ‘stable SEN group’ from T1 to T2.
The Development of Pupils with and Pupils without Special Educational Needs
in Primary Schools in The Netherlands
Ed Smeets Guuske LedouxITS Kohnstamm InstituutRadboud University University of AmsterdamNijmegen, The Netherlands Amsterdam, The Netherlands
[email protected] [email protected]
ECER 2013


![1. [Group] Slide01 2. background - Friendship Church · 1. [Group] Slide01 2. background 3. background 4. background!!"!!";&$ 5. Minnesota Miracle Reactio… 6. background!Make a](https://img.pdfslide.net/doc/110x75/5f29a750c10e4376fe0a71c0/1-group-slide01-2-background-friendship-church-1-group-slide01-2-background.jpg)