Background and Motivation - Johns Hopkins Universityme.jhu.edu/lefd/PPIV/Cavitation.pdf ·...
17
Background and Motivation • Cavitation has been investigated in a variety of flows: – Tip vortices , e.g., Arndt et al. (1991), Arndt and Maines (2000), Hsiao et al. (2003). – Lifting and curved surfaces , e.g., Leger and Ceccio (1998), Astolfi et al. (2000), Gopalan and Katz (2000). – Free shear layers , e.g., Ooi and Acosta (1983), O’Hern (1990), Ran and Katz(1994), Gopalan et al. (1999), Laberteaux and Ceccio (2001). • Literature on cavitation for 2D turbulent shear layer flow past an open cavity is non-existent. – Previous studies emphasized self-excited (self-sustained) oscillations of shear layer; (e.g., Rockwell and Knisely (1979) , Tang and Rockwell (1983), Lin and Rockwell (2001), etc.); – Lack of information on the pressure field and the associated occurrence of cavitation. • Cavitation: Vaporization of liquid under the effect of depressurization (Brennen, 1995, Arndt, 2002). – Knowledge of the pressure distribution is of fundamental importance for understanding the inception and subsequent develpoment of cavitation.
Background and Motivation - Johns Hopkins Universityme.jhu.edu/lefd/PPIV/Cavitation.pdf · Background and Motivation • Cavitation has been investigated in a variety of flows: –
Background and Motivation• Cavitation has been investigated in a variety of flows:
– Tip vortices, e.g., Arndt et al. (1991), Arndt and Maines (2000), Hsiao et al. (2003).
– Lifting and curved surfaces, e.g., Leger and Ceccio (1998), Astolfi et al. (2000), Gopalan and Katz (2000).
– Free shear layers, e.g., Ooi and Acosta (1983), O’Hern (1990), Ran and Katz(1994), Gopalan et al. (1999), Laberteaux and Ceccio (2001).
• Literature on cavitation for 2D turbulent shear layer flow past an open cavity is non-existent.
– Previous studies emphasized self-excited (self-sustained) oscillations of shear layer; (e.g., Rockwell and Knisely (1979) , Tang and Rockwell (1983), Lin and Rockwell (2001), etc.);
– Lack of information on the pressure field and the associated occurrence of cavitation.
• Cavitation: Vaporization of liquid under the effect of depressurization (Brennen, 1995, Arndt, 2002).
– Knowledge of the pressure distribution is of fundamental importance for understanding the inception and subsequent develpoment of cavitation.
Presenter
Presentation Notes
We know cavitation is an important topic in fluid mechanics research due to its importance in engineering applications. Previously, people have investigated cavitation in a variety of flows, such as tip vortices, lifting and curved surfaces as well as free shear layers. However, for 2D turbulent shear flow past an open cavity, there is no information available in literature about the pressure field and the associated occurrence of cavitation in a 2D open cavity flow. We know that knowledge of the pressure distribution is of fundamental importance for understanding cavitation. So, to obtain the much needed information on pressure distribution, in the past several years, we developed a novel optical-based measurement technique that can be used to measure the instantaneous spatial pressure distribution over a sample area in a non-intrusive fashion.
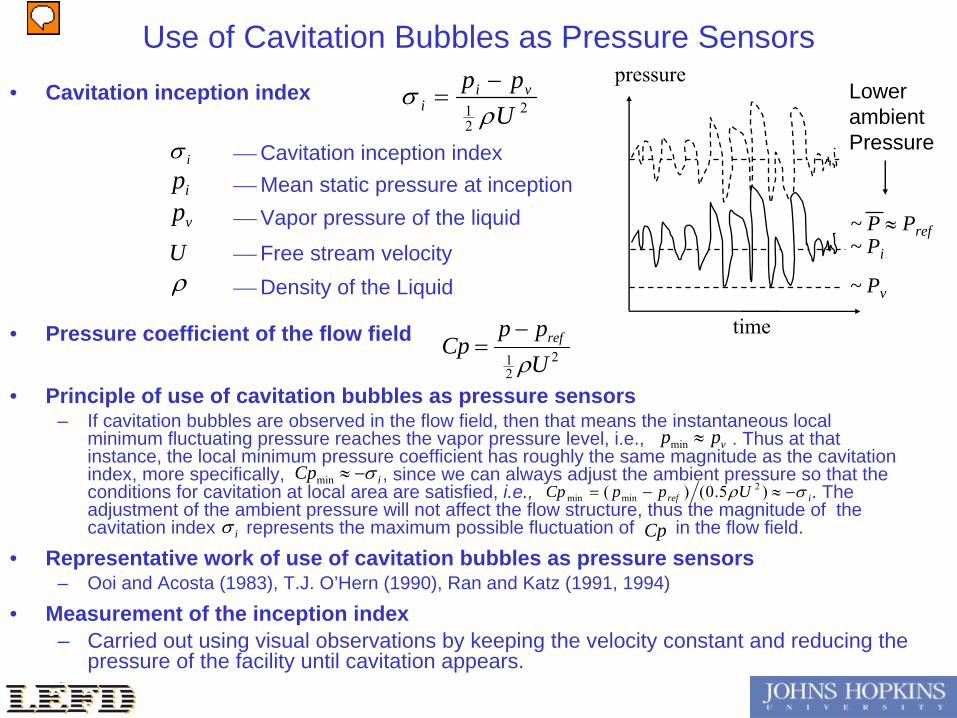
Use of Cavitation Bubbles as Pressure Sensors• Cavitation inception index
• Pressure coefficient of the flow field
• Principle of use of cavitation bubbles as pressure sensors– If cavitation bubbles are observed in the flow field, then that means the instantaneous local
minimum fluctuating pressure reaches the vapor pressure level, i.e., . Thus at that instance, the local minimum pressure coefficient has roughly the same magnitude as the cavitation index, more specifically, , since we can always adjust the ambient pressure so that the conditions for cavitation at local area are satisfied, i.e., . The adjustment of the ambient pressure will not affect the flow structure, thus the magnitude of the cavitation index represents the maximum possible fluctuation of in the flow field.
• Representative work of use of cavitation bubbles as pressure sensors– Ooi and Acosta (1983), T.J. O’Hern (1990), Ran and Katz (1991, 1994)
• Measurement of the inception index– Carried out using visual observations by keeping the velocity constant and reducing the
pressure of the facility until cavitation appears.
221 U
pp vii
Cavitation inception indexiipvp
U
Mean static pressure at inception Vapor pressure of the liquid
Free stream velocity Density of the Liquid
iCp miniref UppCp )5.0()( 2
minmin
Cp
221 U
ppCp ref
i
vpp min
time
pressure
~ Pv
Pmin
~ Pi
~ P
Pref
time
pressure
~ Pv
~ P
Pref
LowerambientPressure
~ Pi
Presenter
Presentation Notes
Now we got the instantaneous spatial pressure distribution of the flow field by using this new pressure measurement technique. Now the question is: how well and how reliable our pressure measurement result is, especially in the shear layer, by using this technique? To answer this question, we need to find a way to gauge the reliability of the pressure measurement results. To do that, we resort to another technique, that is, using the cavitation bubbles as pressure sensors to validate the pressure measurement result. Before I explain the principle of use of cavitation bubble as pressure sensors, let us look at the definition of the cavitation inception index. The cavitatiion inception index is defined as the difference between the mean static pressure and the vapor pressure normalized by the dynamic pressure of the free stream flow. The principle of this measurement technique is like this: If cavitation bubbles are observed in the flow field, then that means the instantaneous local minimum fluctuating pressure reaches the vapor pressure level, that is p_min is about same as the p_vapor. When will this happen? This happens when we adjust the ambient pressure of the facility until the reference pressure P_ref reaches cavitation inception condition. At that condition, P_ref=P_inception and P=P_vapor, therefore the local minimum pressure coefficient Cpmin roughly equals to cavitation index sigma but with a negative sign. The adjustment of the ambient pressure will not affect the relative magnitude of the pressure fluctuation because it will not affect the flow structure, thus the magnitude of the cavitation index truly represents the maximum possible fluctuation of Cp in the flow field. So, once cavitation bubbles are observed in the flow filed, we can can conclude that the fluctuation of Cp should have the same order of magnitude as the cavitation inception index. We may have to admit that we are not the first users of this cavitation-bubbles technique. Representative work of use of this technique can be found in O’Hern’s JFM paper published in 1990. The measurement of the cavitation inception index is carried out using visual observation by keeping the free stream velocity constant and reducing the pressure until cavitation appears.
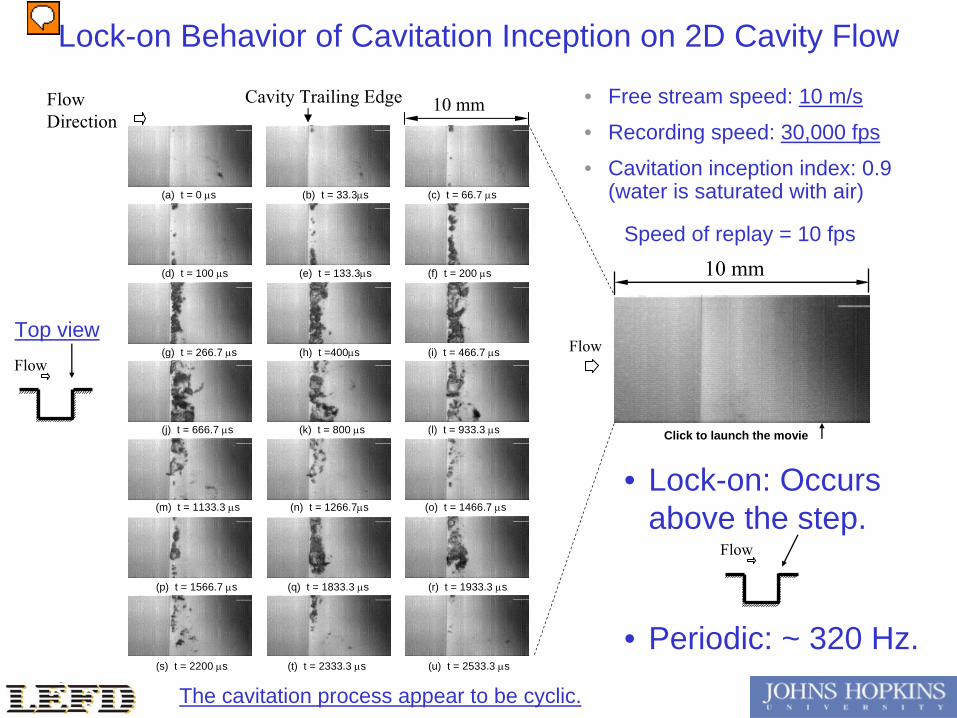
Lock-on Behavior of Cavitation Inception on 2D Cavity Flow
Speed of replay = 10 fps
Cavity Trailing Edge 10 mm
(a) t = 0 s (b) t = 33.3s (c) t = 66.7 s
(d) t = 100 s (e) t = 133.3s (f) t = 200 s
(g) t = 266.7 s (h) t =400s (i) t = 466.7 s
(j) t = 666.7 s (k) t = 800 s (l) t = 933.3 s
(m) t = 1133.3 s (n) t = 1266.7s (o) t = 1466.7 s
(p) t = 1566.7 s (q) t = 1833.3 s (r) t = 1933.3 s
(s) t = 2200 s (t) t = 2333.3 s (u) t = 2533.3 s
10 mm
Top view
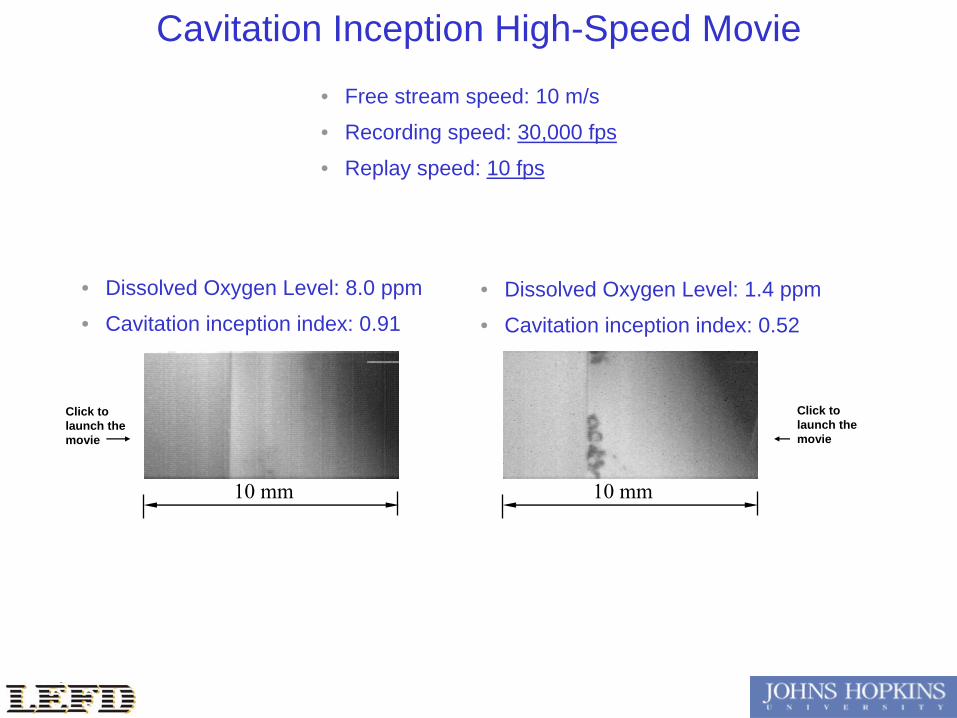
• Free stream speed: 10 m/s
• Recording speed: 30,000 fps
• Cavitation inception index: 0.9 (water is saturated with air)
Flow
The cavitation process appear to be cyclic.
Flow
• Lock-on: Occurs above the step.
• Periodic: ~ 320 Hz.
Flow Direction
Flow
Click to launch the movie
Presenter
Presentation Notes
In our experiment, we found that for this 2-D open cavity flow, the onset of cavitation always occurs right on top of the trailing-edge of the cavity, regardless of the free stream speed. What you see here is a group of sample representative high-speed movie images, recorded at 30000 fps, illustrating a typical process of incipient, growth and collapse of the cavitation bubbles at a free stream speed of 10 m/s. The flow is from left to right, and we are looking down at the cavity trailing edge area. There are two features about this cavitation inception phenomenon that I want to bring to your attention: First, lock-on: the onset of cavitation always occurs right on top of the trailing-edge of the cavity, regardless of the free stream speed. Second, the cavitation process appears to be periodic. You can see here at this beginning moment of the cycle, some small bubbles, [either remnants of the previous cavitation process or nuclei convected from upstream], begin to appear on top of the trailing corner of the cavity. And then, subsequently, these small bubbles begin to grow, first in the spanwise direction to form a continuous cavitation bubble, and then, grow in the streamwise direction, reaching its maximum streamwise dimension, and then collapse and disappear. The remnants of the collapsed bubbles will serve as nuclei to form another round of inception, growth and decay process. Now we may ask ourself two questions: first, why the cavitaion inception is always locked on the trailing edge? Second, why the cavitation inception appear to be periodic? [2 min] From t = 33.3 to 100 micro-second, these small bubbles, while “lingering” at roughly a quarter mm downstream of the trailing edge, grow in size and become more apparent. From t = 100 to 266.7 micro-second, these discrete bubbles continue to grow in both streamwise and spanwise directions, but the spanwise growth rate is higher. Eventually, at t = 266.7 micro-second, a continuous series of attached patches of cavitation spread along the spanwise direction, filling the entire field of view. From t = 266.7 to 466.7 micro-second (Figure g-i), the region with cavitation bubbles continues to grow in the streamwise direction, and reaches its maximum streamwise dimension of about 2mm at t = 466.7 micro-second. During this process, the leading edge of the almost continuous series of cavitation bubbles also propagates upstream and reaches the trailing edge of the 2D cavity. After the continuous series of patches reaches its maximum streamwise dimension, it begins to decay and sheds several bubbles of varying sizes downstream, as shown in t = 666.7 micro-second. From t = 800 micro-second until t = 1466.7 microsecnd, the cavitating region continues to decay while shedding smaller bubbles, until only remnants of the cavitation are left near the trailing edge of the 2D cavity. These cavitation remnants soon serve as nuclei for another round of cavitation inception, growth and decay process, creating a persistent periodic process, as shown in Figure o-u. This cyclic cavitation process may be closely related to the fluttering of the shear layer over the trailing corner of the cavity. We will investigate more about this in our future study. [3min] [With decreasing mean pressure, the cavitating region expands, eventually reaching a “super cavitation” stage that extends far downstream of the trailing edge of the cavity. Yet, the time mean location of the leading edge of cavitation is still locked onto the trailing-edge of the cavity. As will be demonstrated in the next section, this lock-on behavior is a consequence of the fixed location of the time-averaged pressure minimum in the entire flow field. The pressure fluctuations also peak downstream of the cavity trailing edge, but further downstream of the corner. ]
Cp rmsCp
Trailing EdgeCavity Wall
Trailing EdgeCavity Wall
Trailing EdgeCavity Wall
Trailing EdgeCavity Wall (c) (d)
(b)(a)
eUu / eUv /
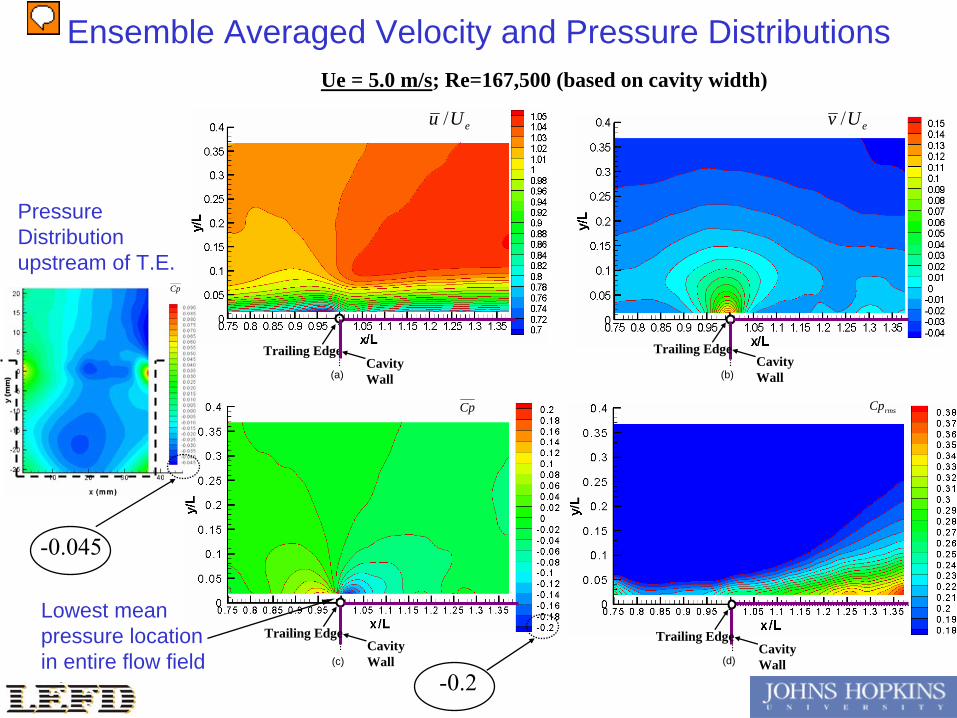
Ue = 5.0 m/s; Re=167,500 (based on cavity width)
Cp
Pressure Distribution upstream of T.E.
-0.045
-0.2
Lowest mean pressure location in entire flow field
Ensemble Averaged Velocity and Pressure Distributions
Presenter
Presentation Notes
To answer the first question, let’s look at the mean velocity and pressure distributions above the trailing corner of the cavity. We see that due to stagnation before the trailing edge, the flow decelerates. And then, immediately after the trailing edge, the flow sees no obstacle and begins to accelerate. Correspondingly, the quick deceleration and acceleration process is associated with the high pressure and low pressure regions around the trailing corner, as you can see on this mean pressure distribution plot. As a reference, we also present here the mean pressure distribution upstream of the trailing corner. If we compare the scales of these two plots, we can see that the location above the trailing edge is indeed the lowest mean pressure location in the whole entire flow field. This is a strong piece of evidence that necessarily explains why the cavitation inception is locked on the trailing edge of the cavity. But the picture is still not complete. We need to further look at the pressure fluctuation levels around the trailing corner to see if the pressure fluctuation at the trailing corner is high enough to guarantee the lock-on behavior to occur and in the same time, to see if the pressure measurement result is reliable.
Cavity Trailing Edge
Cp
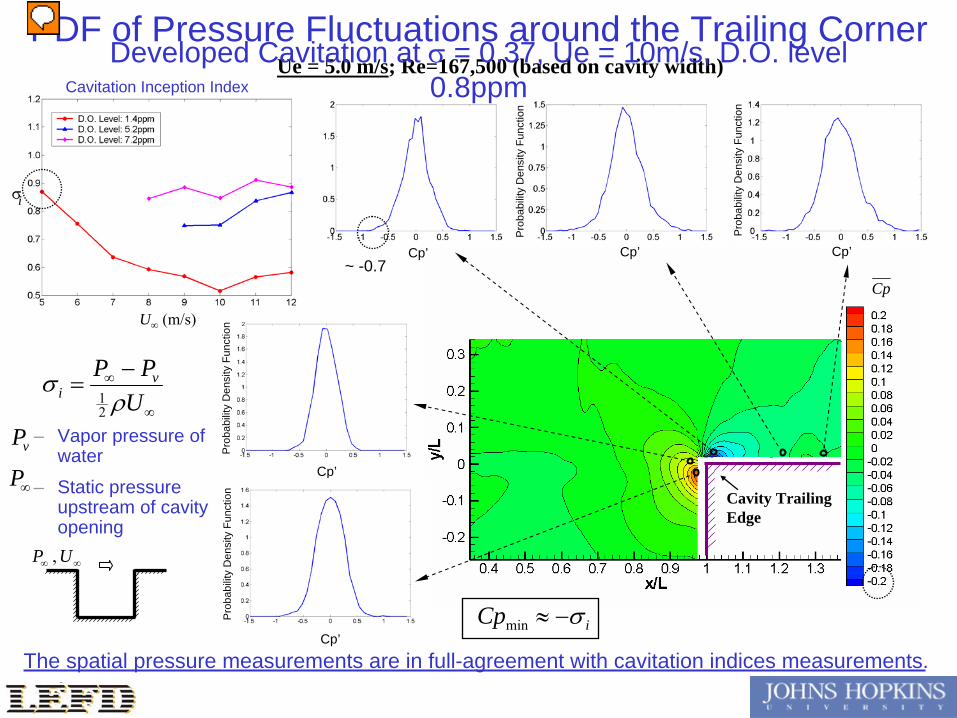
PDF of Pressure Fluctuations around the Trailing Corner
Pro
babi
lity
Den
sity
Fun
ctio
n
Cp’Cp’
Pro
babi
lity
Den
sity
Fun
ctio
n
Pro
babi
lity
Den
sity
Fun
ctio
n
Cp’
Ue = 5.0 m/s; Re=167,500 (based on cavity width)
Cp’
Pro
babi
lity
Den
sity
Fun
ctio
nP
roba
bilit
y D
ensi
ty F
unct
ion
Cp’
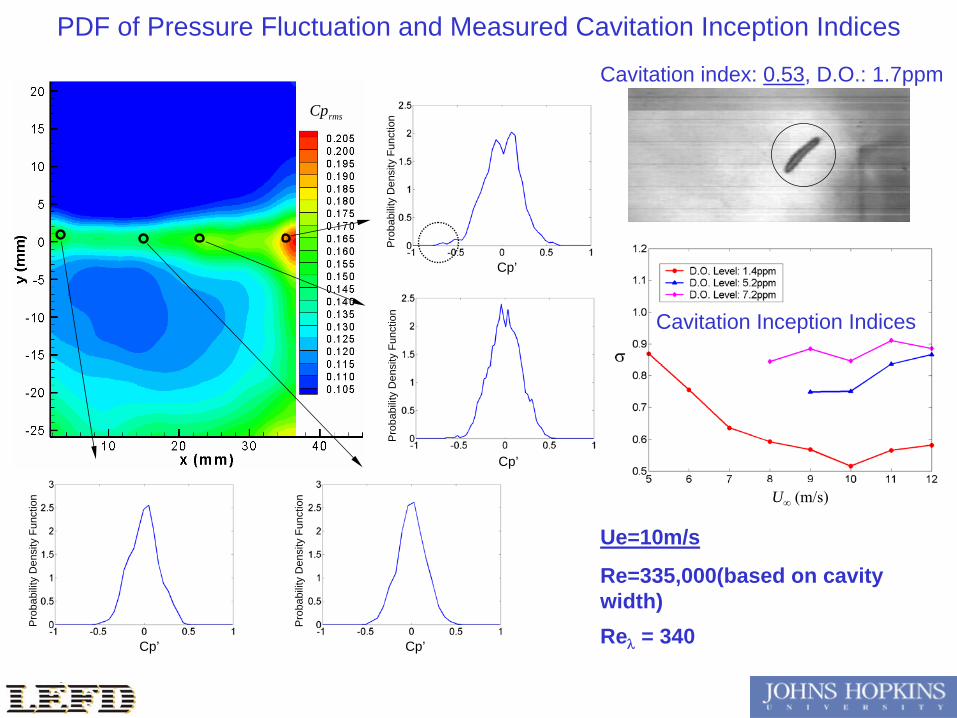
The spatial pressure measurements are in full-agreement with cavitation indices measurements.
Cavitation Inception Index
U∞
(m/s)
i
U
PP vi
21
– Vapor pressure of water
– Static pressure upstream of cavity opening
vP
P
UP ,
~ -0.7
iCp min
Developed Cavitation at = 0.37, Ue = 10m/s, D.O. level 0.8ppm
Presenter
Presentation Notes
Now let us look at the PDF plots of pressure fluctuations around the trailing corner. Also shown on this viewgraph is the cavitaiton inception index measured independantly at different dissolved air levels for this 2D open cavity flow. On this figure, we see for week water, or in other words for water saturated with air, the measured cavitaiton inception index is about 0.9. Now let us look at the measured pressure fluctuation PDF plot. We see the lowest tail of the PDF plot above the trailing corner is roughly minus point 7, and the mean pressure above the trailing corner is roughly minus point 2. So if add these two numbers together, we get minus point 9, the magnitude of which agrees with the measured cavitation inception index, meaning the spatial pressure measurements are in full agreement with cavitation index measurements. So up to this point, we answered the first question about the lock-on behavior of the cavitation, and we see that the pressure measurement data and the cavitation inception index measurments mutually support each other.
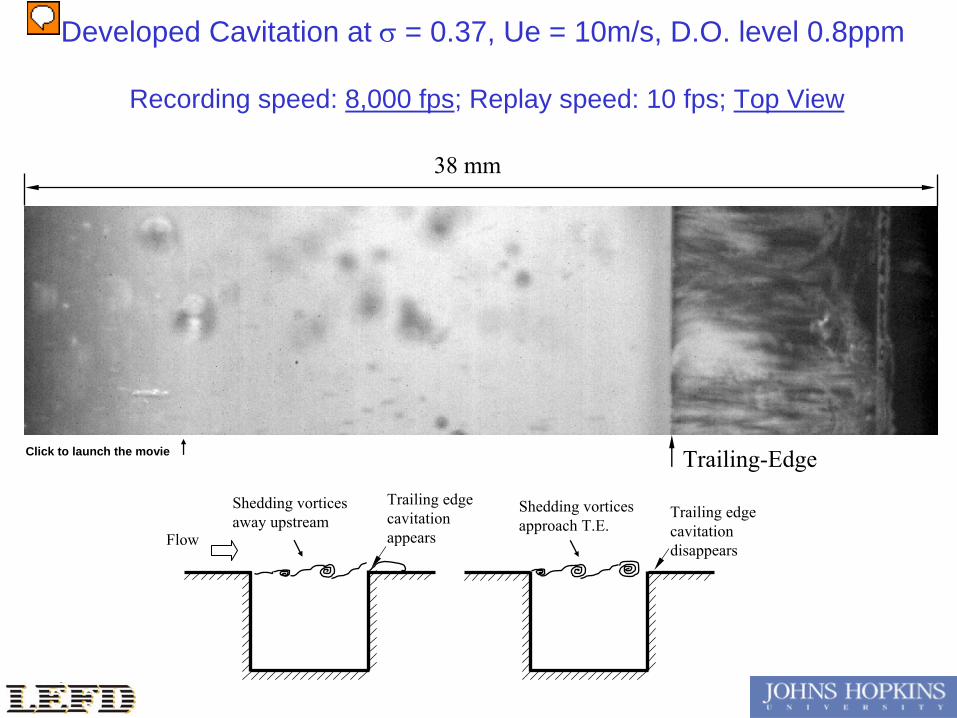
Recording speed: 8,000 fps; Replay speed: 10 fps; Top View
38 mm
Trailing edge cavitationdisappears
Flow
Trailing edgecavitationappears
Shedding vorticesaway upstream
Shedding vorticesapproach T.E.
Trailing-Edge
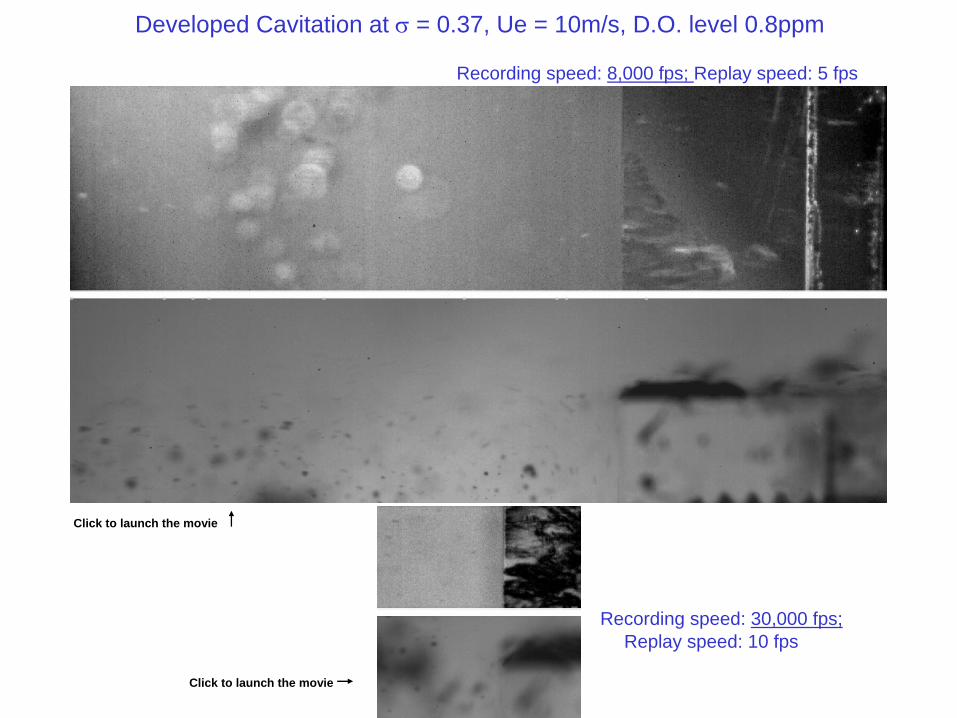
Developed Cavitation at = 0.37, Ue = 10m/s, D.O. level 0.8ppm
Click to launch the movie
Presenter
Presentation Notes
Now we turn to the second question: why the cavitation inception on the trailing corner appear to be periodic. To answer the question, we run the facility at a lower cavitation index level so that the cavitation is more developed, and as a result, pressure upstream of the trailing corner is low enough to allow caviation to occur in the shear layer. At this cavitation index level, the cavitation above the trailing edge still appears to be cyclic. Actually the cavitation in the shear layer are strongly associated with the large shedding vortex structures. And you look at the high speed movie carefully, you can see when the shedding vortex is far upstream of the trailing edge, cavitation appears on the trailing edge, but when the large shedding vortex is close to the trailing edge, the cavitation on the trailing edge disappears. We know that the occurrence of cavitation depends on pressure. If there is no cavitation, the pressure is high; if there is cavitation, the local pressure is low. So let’s move on to see what typical instantaneous flow patterns look like when the instantaneous pressure above the trailing edge is high and low.
Recording speed: 8,000 fps; Replay speed: 5 fps
Recording speed: 30,000 fps; Replay speed: 10 fps
Developed Cavitation at = 0.37, Ue = 10m/s, D.O. level 0.8ppm
Click to launch the movie
Click to launch the movie
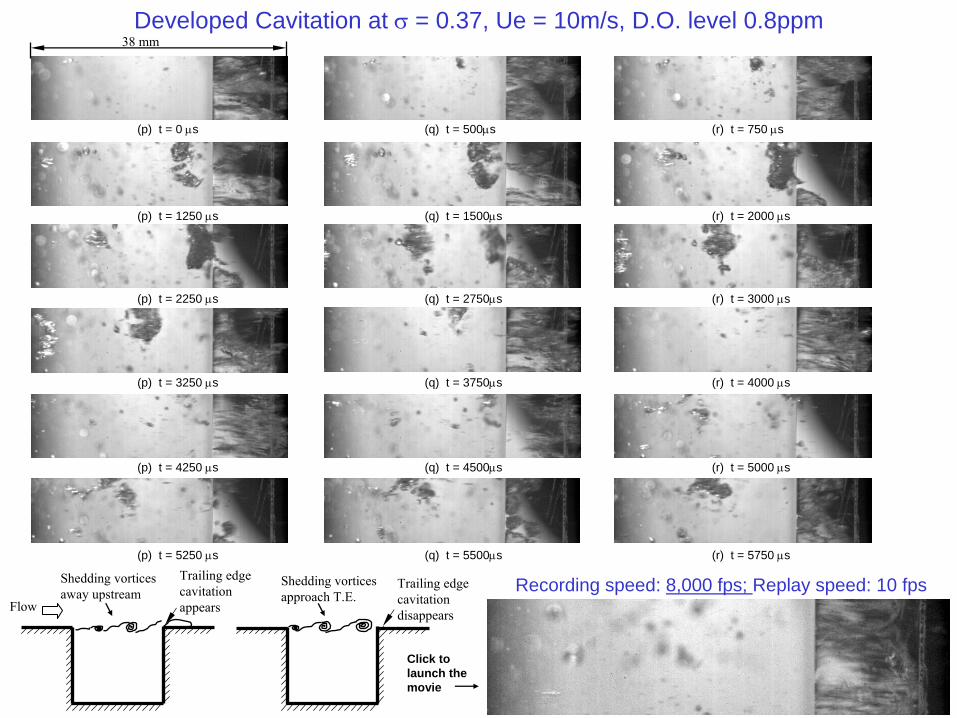
(p) t = 5250 s (q) t = 5500s (r) t = 5750 s
Recording speed: 8,000 fps; Replay speed: 10 fps
(p) t = 4250 s (q) t = 4500s (r) t = 5000 s
(p) t = 3250 s (q) t = 3750s (r) t = 4000 s
(p) t = 2250 s (q) t = 2750s (r) t = 3000 s
(p) t = 1250 s (q) t = 1500s (r) t = 2000 s
(p) t = 0 s (q) t = 500s (r) t = 750 s
38 mm
Trailing edge cavitationdisappears
Flow
Trailing edgecavitationappears
Shedding vorticesaway upstream
Shedding vorticesapproach T.E.
Developed Cavitation at = 0.37, Ue = 10m/s, D.O. level 0.8ppm
Click to launch the movie
Cavity Trailing Edge
Cavity Trailing Edge
Cavity Trailing Edge
Cavity Trailing Edge
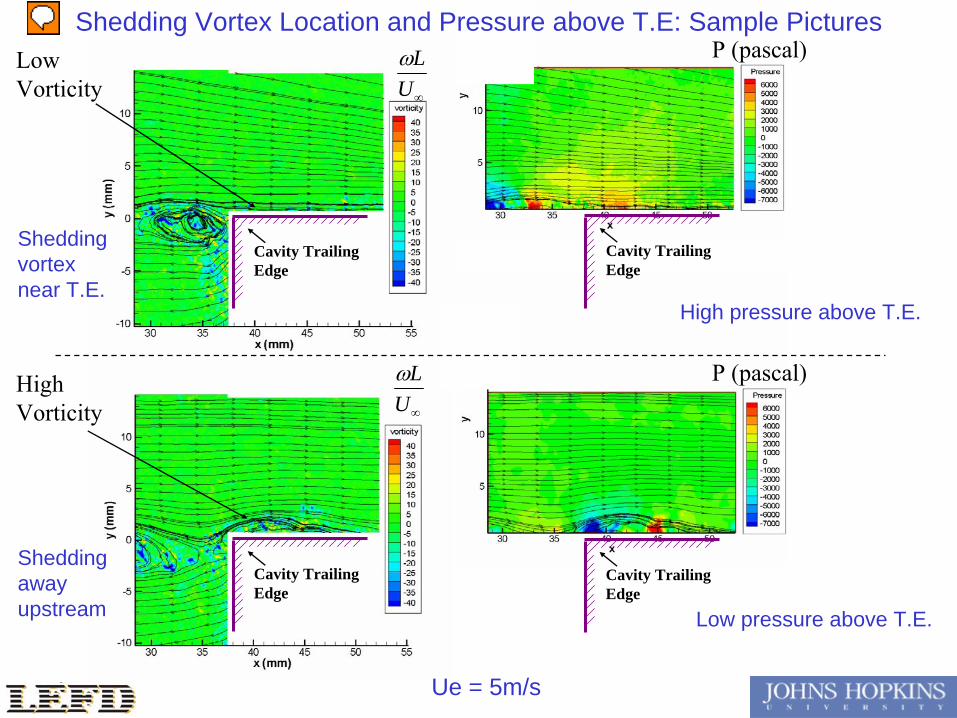
UL
UL
P (pascal)
P (pascal)
Ue = 5m/s
High pressure above T.E.
Low pressure above T.E.
Shedding vortex near T.E.
Shedding away upstream
Low Vorticity
High Vorticity
Shedding Vortex Location and Pressure above T.E: Sample Pictures
Presenter
Presentation Notes
What you see here is a typical instantaneous flow pattern when the pressure is high above the trailing corner. In this case, clearly you can see the large shedding vortex structure is impinging on the trailing wall. Due to downwash induced by the vortex, the vorcity level above the trailing wall is low. However, as a contrast, when the pressure low above the trailing corner, large shedding vortex structure is far away upstream, and there is a large vortex dissected by the trailing corner is creeping over the trailing edge, and as a result, the vorticity level is abundant on the upper surface of the trailing edge. So based on these evidences, we can perform conditional sampling to see if cyclic behavior of the cavitation is really associated with the location of the impinging large vortex structures.
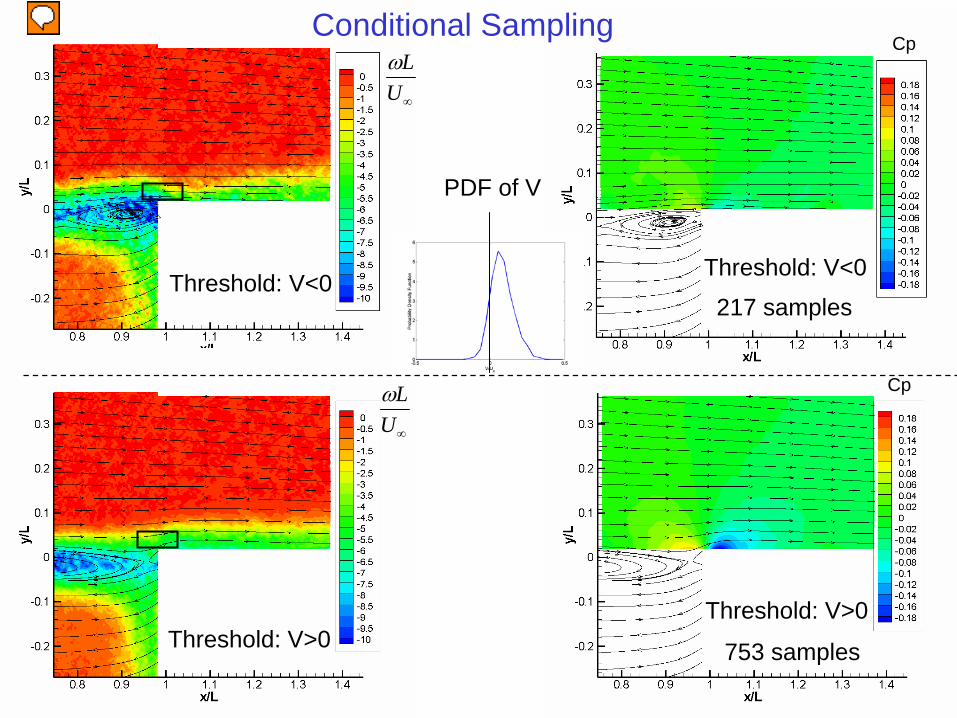
Threshold: V>0
Cp
UL
Threshold: V<0
Cp
217 samplesThreshold: V<0
753 samples
UL
Threshold: V>0
PDF of V
Conditional Sampling
Presenter
Presentation Notes
We choose the averaged V-component velocity as the criterion to detect the location of the shedding vortex. We see that when V is below zero, there is an averaged shedding vortex just impinging on the trailing wall. But when V is above zero, the large vortex is far upstream. Correspondingly, comparing the mean pressure distributions, for this case, the pressure is low and for this case, the pressure is high. This explains that indeed the periodic behavior of the cavition above the T.E. is related to the location of the shedding vortex and the disappearance of the cavitation bubble is due the dwonwash of the large vortex.
0
0.001
0.002
0.003
0.004
0.005
0.006
1 10 100 1000 10000Frequency (Hz)
0
0.001
0.002
0.003
0.004
0.005
0.006
1 10 100 1000 10000Frequency (Hz)
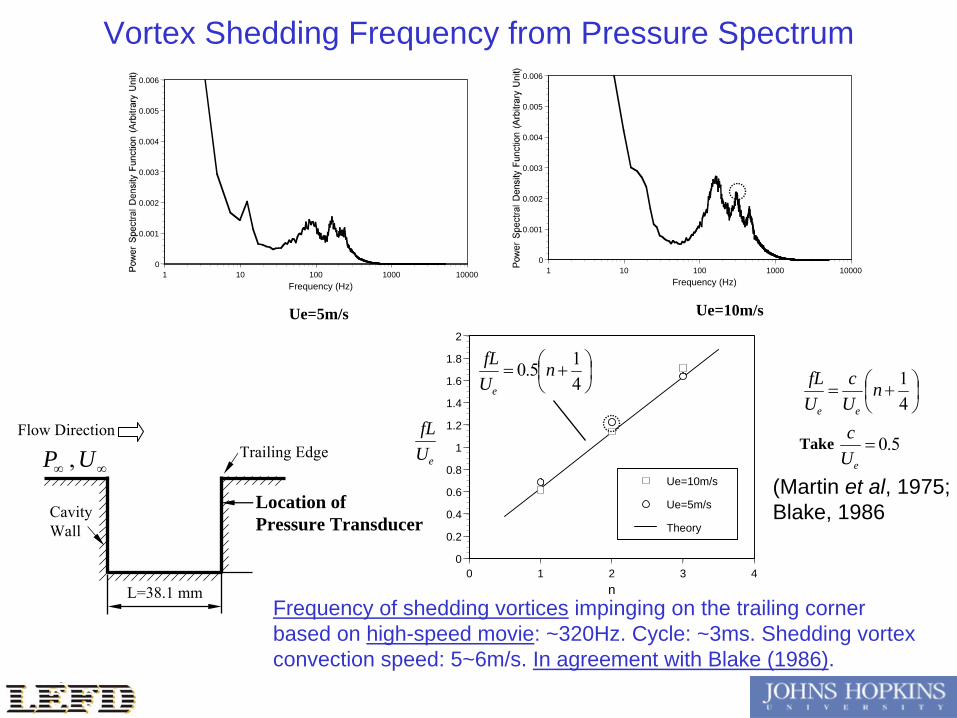
Ue=5m/s Ue=10m/s
0
0.2
0.4
0.6
0.8
1
1.2
1.4
1.6
1.8
2
0 1 2 3 4n
Ue=10m/s
Ue=5m/s
Theory
Ue
fW Take 5.0eU
c
41n
Uc
UfL
ee
415.0 n
UfL
e
Flow DirectionTrailing Edge
Cavity Wall
L=38.1 mm
UP ,
Location of Pressure Transducer
(Martin et al, 1975;Blake, 1986
Frequency of shedding vortices impinging on the trailing corner based on high-speed movie: ~320Hz. Cycle: ~3ms. Shedding vortex convection speed: 5~6m/s. In agreement with Blake (1986).
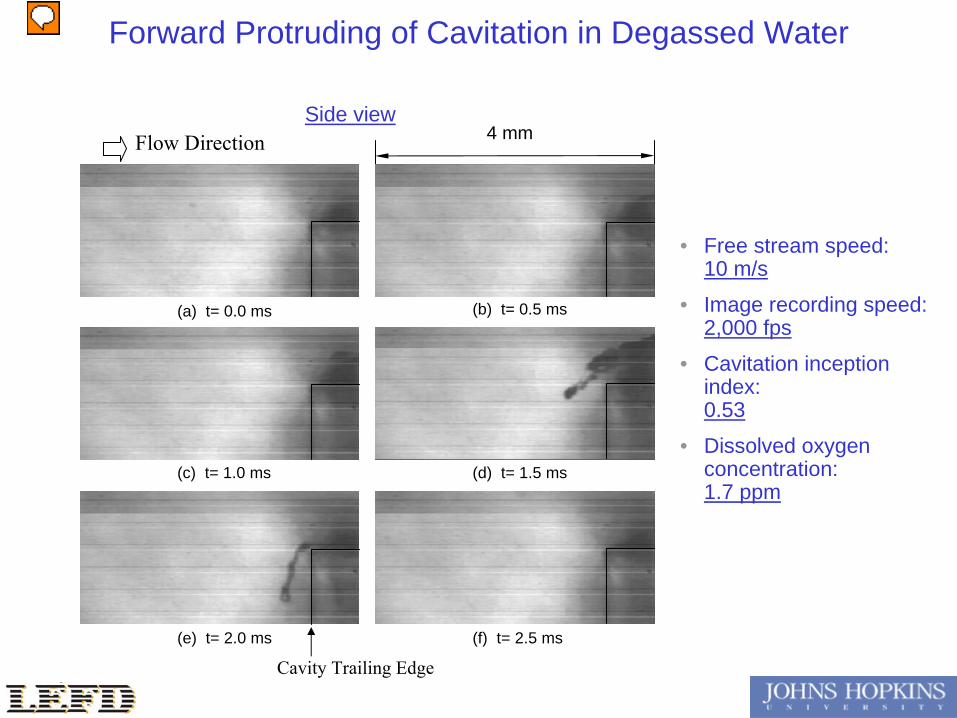
Forward Protruding of Cavitation in Degassed Water
Side view
(a) t= 0.0 ms
4 mmFlow Direction
Cavity Trailing Edge
(b) t= 0.5 ms
(d) t= 1.5 ms(c) t= 1.0 ms
(e) t= 2.0 ms (f) t= 2.5 ms
• Free stream speed: 10 m/s
• Image recording speed: 2,000 fps
• Cavitation inception index: 0.53
• Dissolved oxygen concentration: 1.7 ppm
Presenter
Presentation Notes
The entire cavitation region is highly unsteady. At low dissolved oxygen content of 1.7ppm, and a cavitation index of 0.6, the front of the cavitation bubble may sporadically protrude to the region located upstream of the trailing-edge of the cavity. As shown in Figure d and e, the bent and stretched bubbles are forced towards the trailing wall by the impinging of the shear layer. [At this cavitation index, examination of the high speed images shows that some protrusion of the cavitation to the region located upstream of the cavity occurs about 30% of the total recording time.]
Side view
(a) t= 0.0 ms
4 mmFlow Direction
Cavity Trailing Edge
(b) t= 0.5 ms
(d) t= 1.5 ms(c) t= 1.0 ms
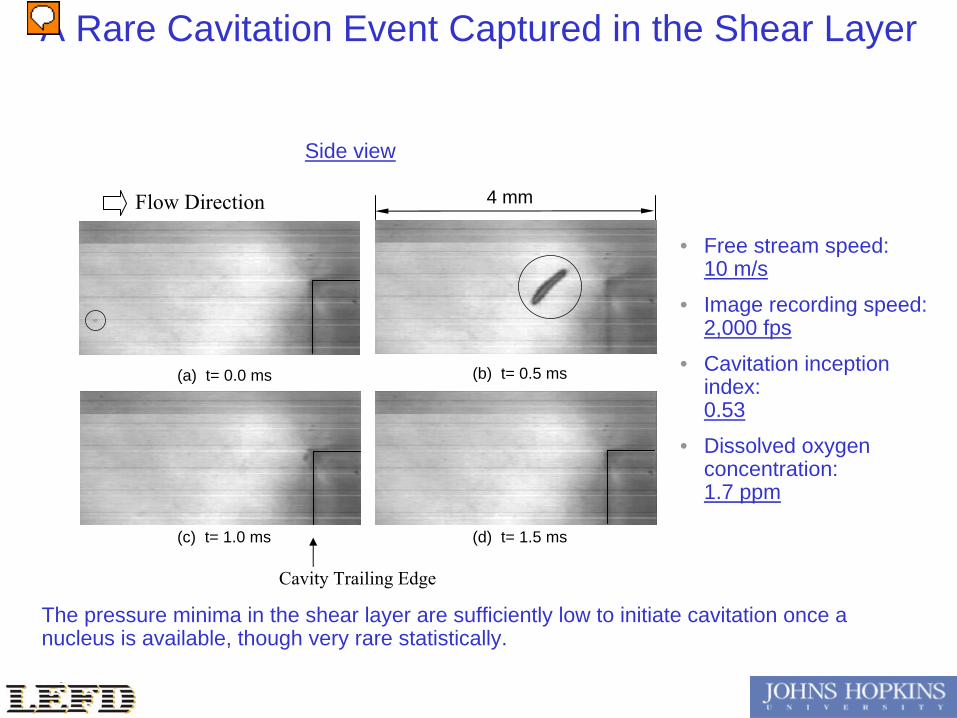
• Free stream speed: 10 m/s
• Image recording speed: 2,000 fps
• Cavitation inception index: 0.53
• Dissolved oxygen concentration: 1.7 ppm
The pressure minima in the shear layer are sufficiently low to initiate cavitation once a nucleus is available, though very rare statistically.
A Rare Cavitation Event Captured in the Shear Layer
Presenter
Presentation Notes
Although the majority of the cavitation inception and more developed events occur above the trailing edge of the cavity, cavitation bubbles appear rarely in the shear layer just upstream the trailing wall. This group of pictures show such a rare event, captured in the shear layer right in front of the trailing wall. Here a small nucleus is transported downstream at a convection speed of roughly 5m/s, and suddenly grows explosively at about 1mm upstream of the trailing edge of the cavity. Subsequently, this slender cavitation bubble impinges on the trailing edge of the cavity and disintegrates. These observations suggest that pressure minima within the shear layer are sufficiently low to initiate cavitation once a nucleus is available.
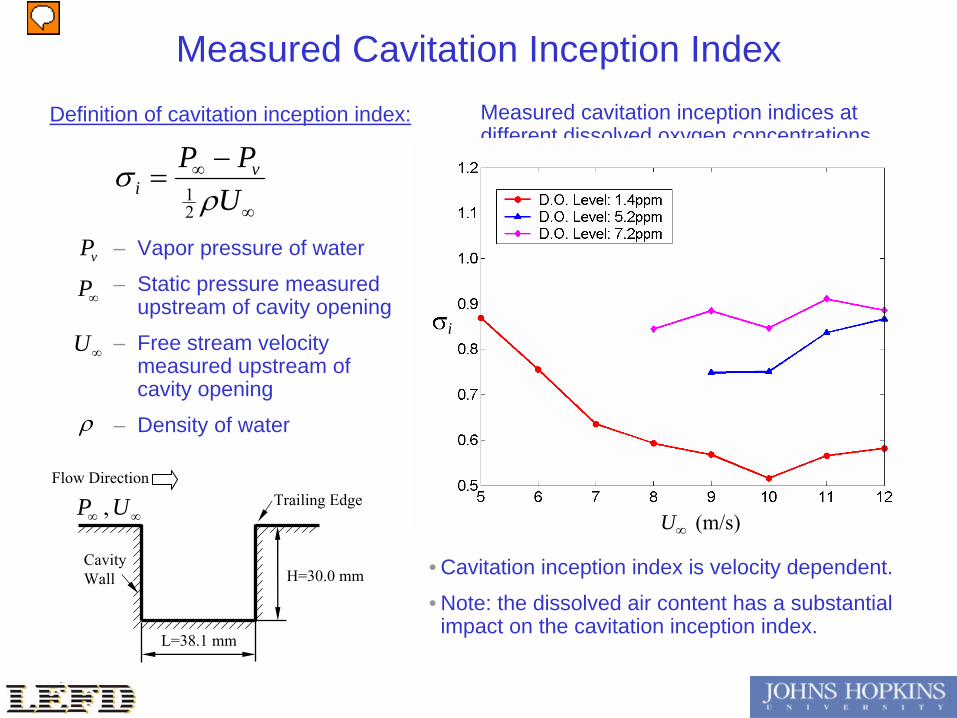
Measured Cavitation Inception Index
U
PP vi
21
vP
P
– Vapor pressure of water
– Static pressure measured upstream of cavity opening
– Free stream velocity measured upstream of cavity opening
– Density of water
U
Flow DirectionTrailing Edge
Cavity Wall
L=38.1 mm
H=30.0 mm
UP ,
Definition of cavitation inception index:
• Cavitation inception index is velocity dependent.
• Note: the dissolved air content has a substantial impact on the cavitation inception index.
Measured cavitation inception indices at different dissolved oxygen concentrations
U∞
(m/s)
i
Presenter
Presentation Notes
Now let’s look at the measured cavitation inception indices at low dissolved oxygen concentration of 1.7 ppm. [The inception indices are measured using visual observations by keeping the velocity constant and gradually reducing the pressure in the facility until cavitation appears. Each point in this figure is an average of several measurements that do not differ significantly]. Clearly, as the free stream speed is increased from 7 m/s to 10 m/s, the cavitation inception index decreases from 1.1 to 0.6. This means for the 2D open cavity flow, the cavitation inception index is velocity or Reynolds number dependent. Furthermore, it should be noted that the dissolved air content has a substantial impact on these results, since steady cavitation appears above the cavity at significantly higher pressure with saturated air. Now, let’s briefly summarize what we have learned so far about the 2D open cavity cavitation: first, the cavitation inception always first occurs on top of the cavity trailing edge; second, the cavitation inception index is velocity dependent. One may ask, how could this happen? Are these measurements correct? Well, let’s see if we can find a answer from the spatial pressure measurements. [These issues need to be investigated carefully, but this figure provides an indication of the minimum magnitude of pressure fluctuation peaks in the cavitation inception region.]
rmsCp
Pro
babi
lity
Den
sity
Fun
ctio
n
Cp’
Pro
babi
lity
Den
sity
Fun
ctio
n
Cp’
Pro
babi
lity
Den
sity
Fun
ctio
n
Cp’
Pro
babi
lity
Den
sity
Fun
ctio
n
Cp’
Ue=10m/s
Re=335,000(based on cavity width)Re
= 340
U∞
(m/s)
Cavitation Inception Indices
Cavitation index: 0.53, D.O.: 1.7ppm
PDF of Pressure Fluctuation and Measured Cavitation Inception Indices
Conclusions• The onset of cavitation always occurs on top of the cavity
trailing edge. • The cavitation inception process appears to be cyclic, with
frequency that matches theoretical predictions of vortex shedding frequencies.
• The mean spatial pressure distribution and PDFs of pressure fluctuations explains why the onset of cavitation is always locked on the cavity trailing edge.
• Flow induced by interaction of shear layer vortex structures with the downstream corner generates a cyclic pressure field, and consequently, a cyclic cavitation process, even at very low cavitation indices.
• Pressure velocity and pressure-rate of strain correlations have been measured. Analysis of trends is in progress.
Presenter
Presentation Notes
Direct cavitation inception index measurements and observation on occurrence of cavitation are compared to novel spatial pressure distribution measurements within a 2D open cavity turbulent shear flow. High speed digital imaging of cavitation inception, indicates that the onset of cavitation always occurs on top of the cavity trailing edge, regardless of the free stream speed. The cavitation inception indices decrease with increasing velocity (Reynolds number). The cavitation inception process appears to be cyclic. The time-averaged spatial pressure distribution has a distinct minimum just above the trailing edge of the cavity . PDFs of pressure fluctuations show that the highest negative pressure peaks occur above the cavity trailing edge. Trends of the negative pressure peaks with velocity agree with those of the measured cavitation inception indices. The trailing edge plays a key role in defining the dynamics of turbulence in the cavity shear layer. For most of the shear layer, the pressure is negatively correlated with the streamwise velocity. However, due to adverse pressure gradient imposed by the presence of the trailing edge, the pressure-streamwise velocity correlation becomes positive near the trailing corner of the cavity. The pressure diffusion is of the same order of magnitude as the production rate, and much larger than the diffusion. Thus, effect of pressure diffusion cannot be neglected in RANS simulations of this flow. Furthermore, trends of pressure diffusion differ substantially from those of the turbulence diffusion, in contrast with typical models for these terms.