Embed Size (px)
Citation preview
2J00533 Community Satisfaction Survey 2017 - Monash City Council
Background and objectives
Survey methodology and sampling
Further information
Key findings & recommendations
Summary of findings
Detailed findings
• Key core measure: Overall performance
• Key core measure: Customer service
• Key core measure: Council direction indicators
• Communications
• Individual service areas
• Detailed demographics
Appendix A: Detailed survey tabulations
Appendix B: Further project information
3J00533 Community Satisfaction Survey 2017 - Monash City Council
Welcome to the report of results and recommendations for the 2017 State-wide Local Government
Community Satisfaction Survey for Monash City Council.
Each year Local Government Victoria (LGV) coordinates and auspices this State-wide Local
Government Community Satisfaction Survey throughout Victorian local government areas. This
coordinated approach allows for far more cost effective surveying than would be possible if councils
commissioned surveys individually.
Participation in the State-wide Local Government Community Satisfaction Survey is optional.
Participating councils have various choices as to the content of the questionnaire and the sample size
to be surveyed, depending on their individual strategic, financial and other considerations.
The main objectives of the survey are to assess the performance of Monash City Council across a
range of measures and to seek insight into ways to provide improved or more effective service delivery.
The survey also provides councils with a means to fulfil some of their statutory reporting requirements
as well as acting as a feedback mechanism to LGV.
4J00533 Community Satisfaction Survey 2017 - Monash City Council
This survey was conducted by Computer Assisted Telephone Interviewing (CATI) as a representative
random probability survey of residents aged 18+ years in Monash City Council.
Survey sample matched to the demographic profile of Monash City Council as determined by the most
recent ABS population estimates was purchased from an accredited supplier of publicly available
phone records, including up to 10% mobile phone numbers to cater to the diversity of residents within
Monash City Council, particularly younger people.
A total of n=400 completed interviews were achieved in Monash City Council. Survey fieldwork was
conducted in the period of 1st February – 30th March, 2017.
The 2017 results are compared with previous years, as detailed below:
Minimum quotas of gender within age groups were applied during the fieldwork phase. Post-survey
weighting was then conducted to ensure accurate representation of the age and gender profile of the
Monash City Council area.
Any variation of +/-1% between individual results and net scores in this report or the detailed survey
tabulations is due to rounding. In reporting, ‘—’ denotes not mentioned and ‘0%’ denotes mentioned by
less than 1% of respondents. ‘Net’ scores refer to two or more response categories being combined
into one category for simplicity of reporting.
• 2016, n=400 completed interviews, conducted in the period of 1st February – 30th March.
• 2015, n=400 completed interviews, conducted in the period of 1st February – 30th March.
• 2014, n=400 completed interviews, conducted in the period of 31st January – 11th March.
• 2013, n=400 completed interviews, conducted in the period of 1st February – 24th March.
• 2012, n=400 completed interviews, conducted in the period of 18th May – 30th June.
5J00533 Community Satisfaction Survey 2017 - Monash City Council
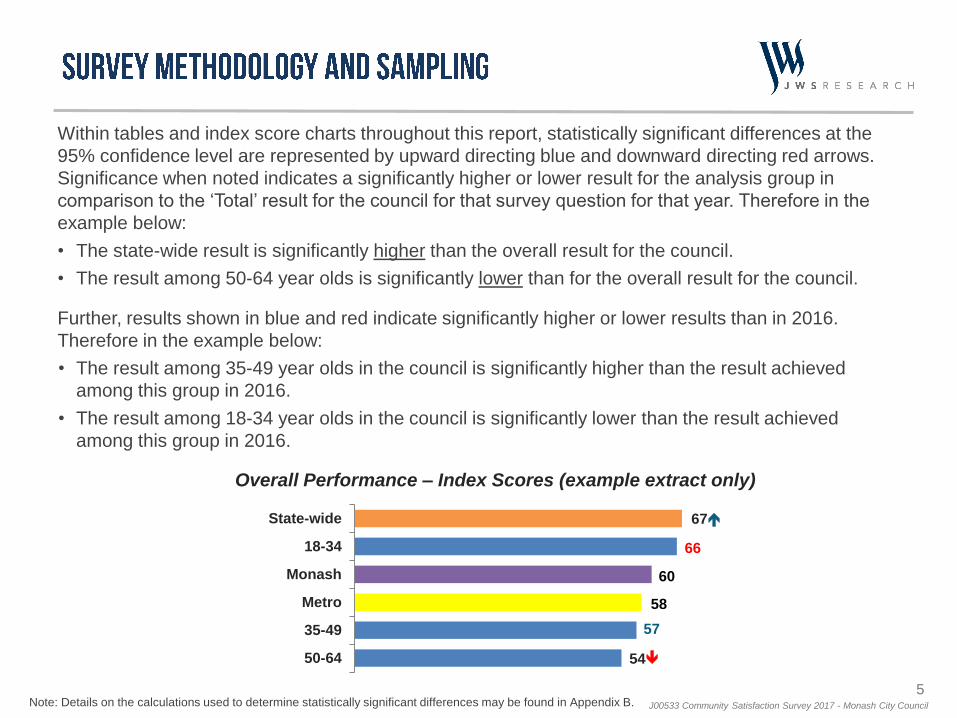
Within tables and index score charts throughout this report, statistically significant differences at the
95% confidence level are represented by upward directing blue and downward directing red arrows.
Significance when noted indicates a significantly higher or lower result for the analysis group in
comparison to the ‘Total’ result for the council for that survey question for that year. Therefore in the
example below:
• The state-wide result is significantly higher than the overall result for the council.
• The result among 50-64 year olds is significantly lower than for the overall result for the council.
Further, results shown in blue and red indicate significantly higher or lower results than in 2016.
Therefore in the example below:
• The result among 35-49 year olds in the council is significantly higher than the result achieved
among this group in 2016.
• The result among 18-34 year olds in the council is significantly lower than the result achieved
among this group in 2016.
54
57
58
60
67
66
50-64
35-49
Metro
Monash
18-34
State-wide
Overall Performance – Index Scores (example extract only)
Note: Details on the calculations used to determine statistically significant differences may be found in Appendix B.
6J00533 Community Satisfaction Survey 2017 - Monash City Council
Further information about the report and explanations about the State-wide Local Government
Community Satisfaction Survey can be found in Appendix B, including:
Background and objectives
Margins of error
Analysis and reporting
Glossary of terms
Contacts
For further queries about the conduct and reporting of the 2017 State-wide Local Government
Community Satisfaction Survey, please contact JWS Research on (03) 8685 8555.
J00533 Community Satisfaction Survey 2017 - Monash City Council
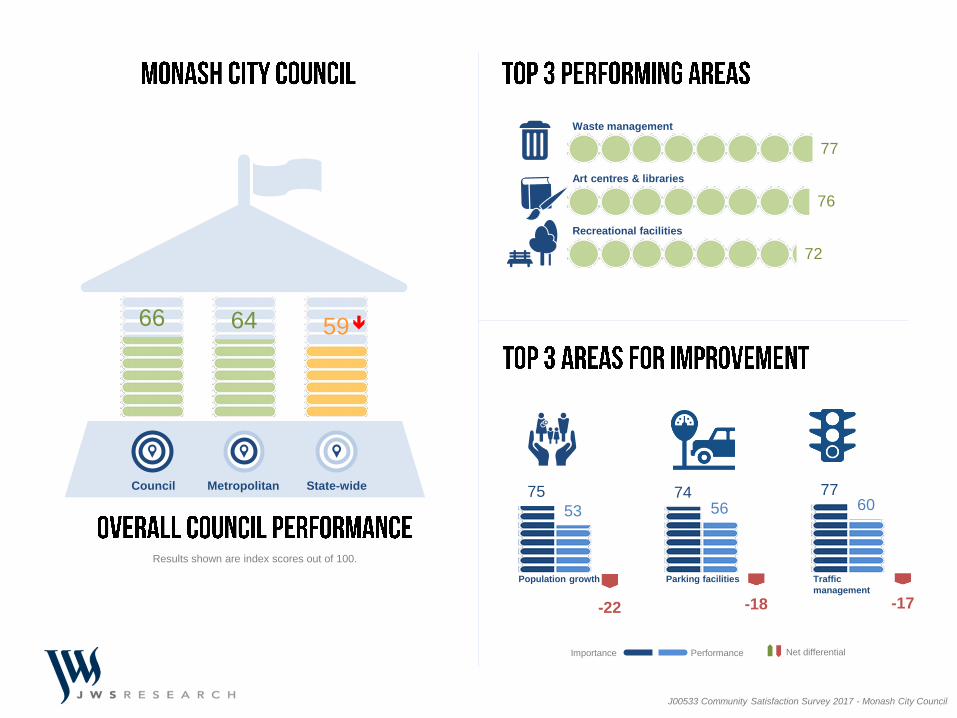
77
76
72
Waste management
Art centres & libraries
Recreational facilities
75
5374
5677
60
-22 -18 -17
Population growth
PerformanceImportance
Parking facilities Traffic
management
Net differential
Council Metropolitan State-wide
66 64 59
Results shown are index scores out of 100.
9J00533 Community Satisfaction Survey 2017 - Monash City Council
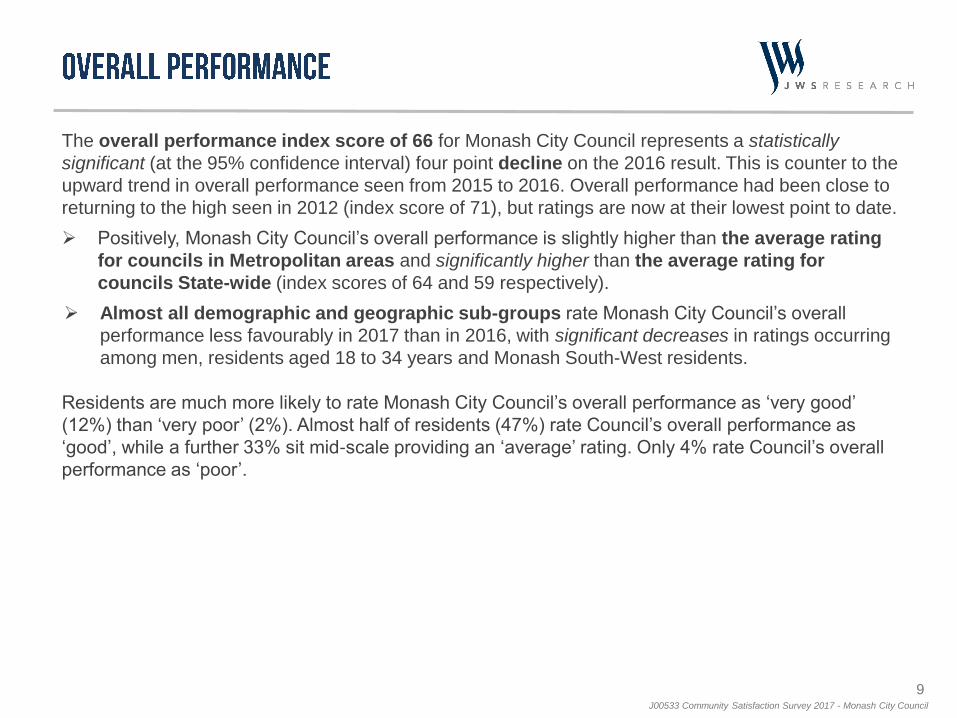
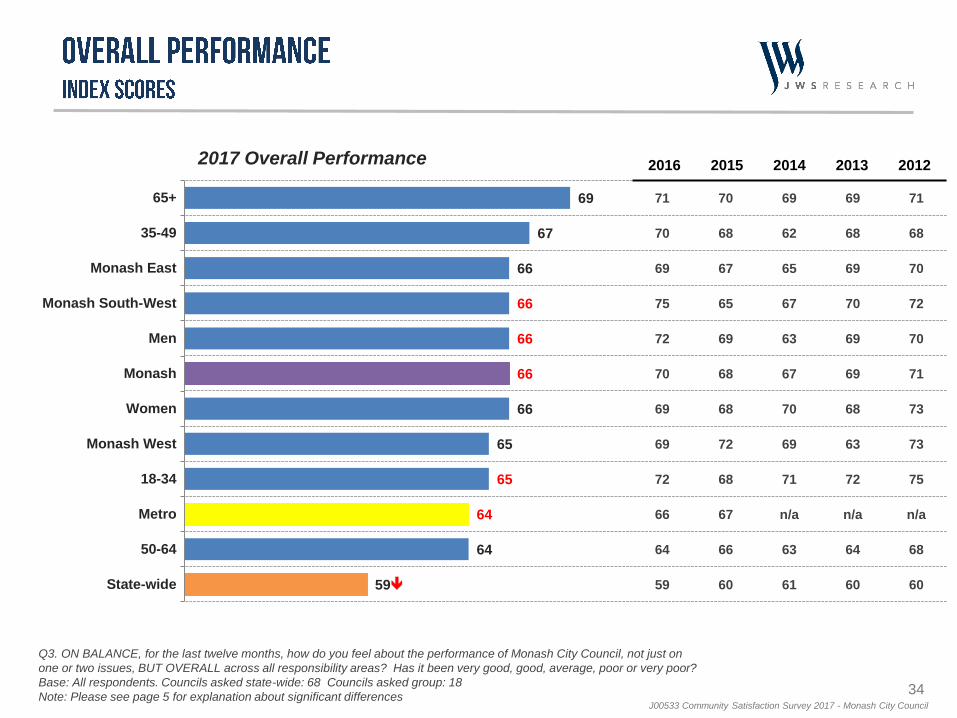
The overall performance index score of 66 for Monash City Council represents a statistically
significant (at the 95% confidence interval) four point decline on the 2016 result. This is counter to the
upward trend in overall performance seen from 2015 to 2016. Overall performance had been close to
returning to the high seen in 2012 (index score of 71), but ratings are now at their lowest point to date.
Positively, Monash City Council’s overall performance is slightly higher than the average rating
for councils in Metropolitan areas and significantly higher than the average rating for
councils State-wide (index scores of 64 and 59 respectively).
Almost all demographic and geographic sub-groups rate Monash City Council’s overall
performance less favourably in 2017 than in 2016, with significant decreases in ratings occurring
among men, residents aged 18 to 34 years and Monash South-West residents.
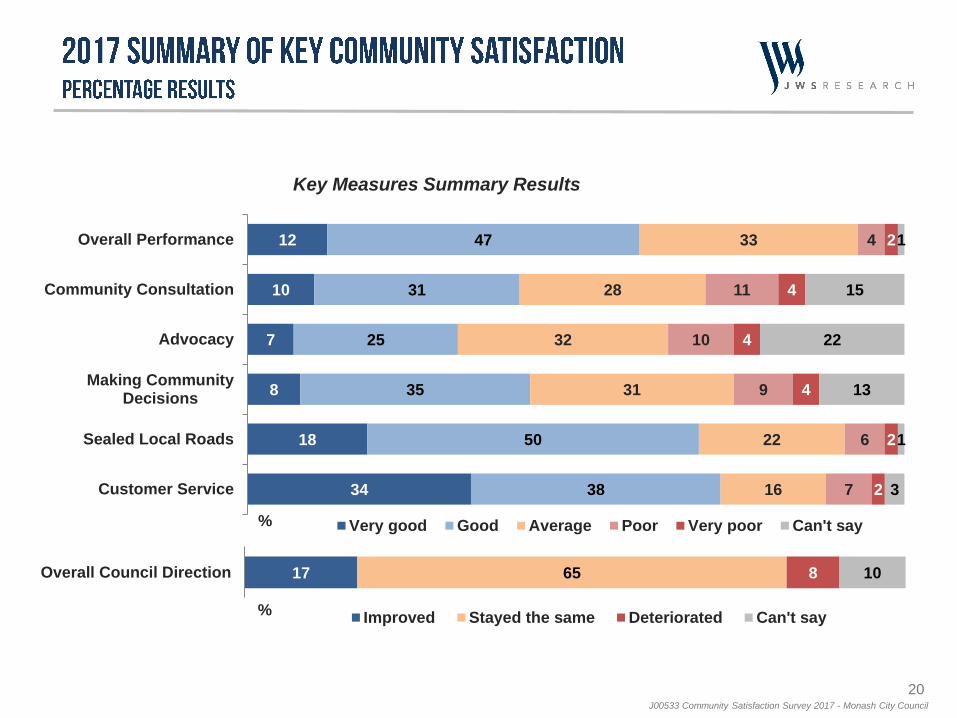
Residents are much more likely to rate Monash City Council’s overall performance as ‘very good’
(12%) than ‘very poor’ (2%). Almost half of residents (47%) rate Council’s overall performance as
‘good’, while a further 33% sit mid-scale providing an ‘average’ rating. Only 4% rate Council’s overall
performance as ‘poor’.
10J00533 Community Satisfaction Survey 2017 - Monash City Council
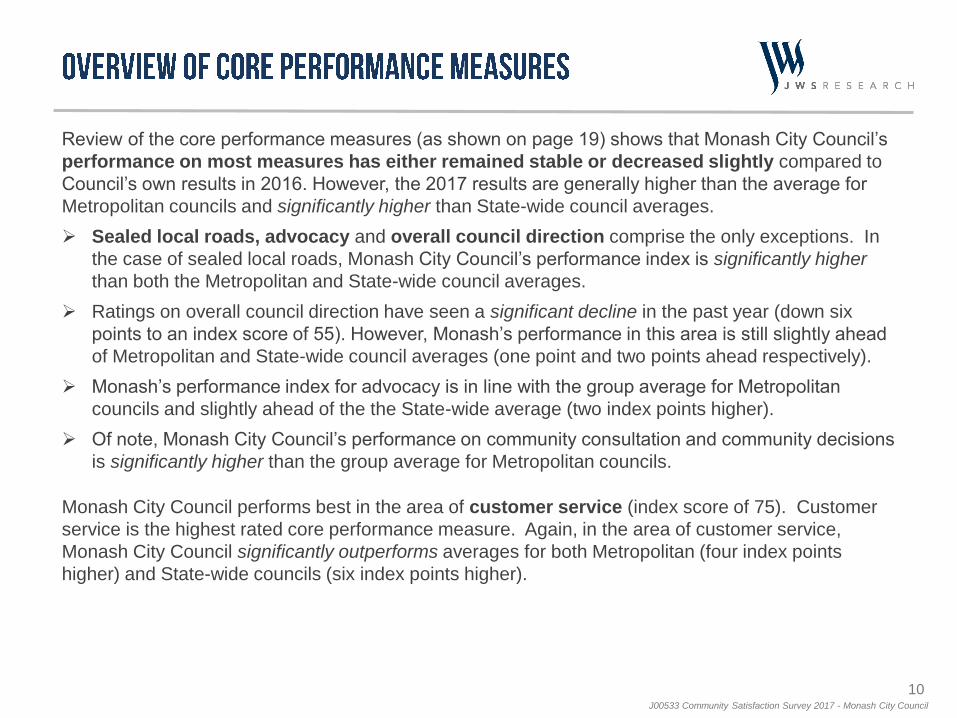
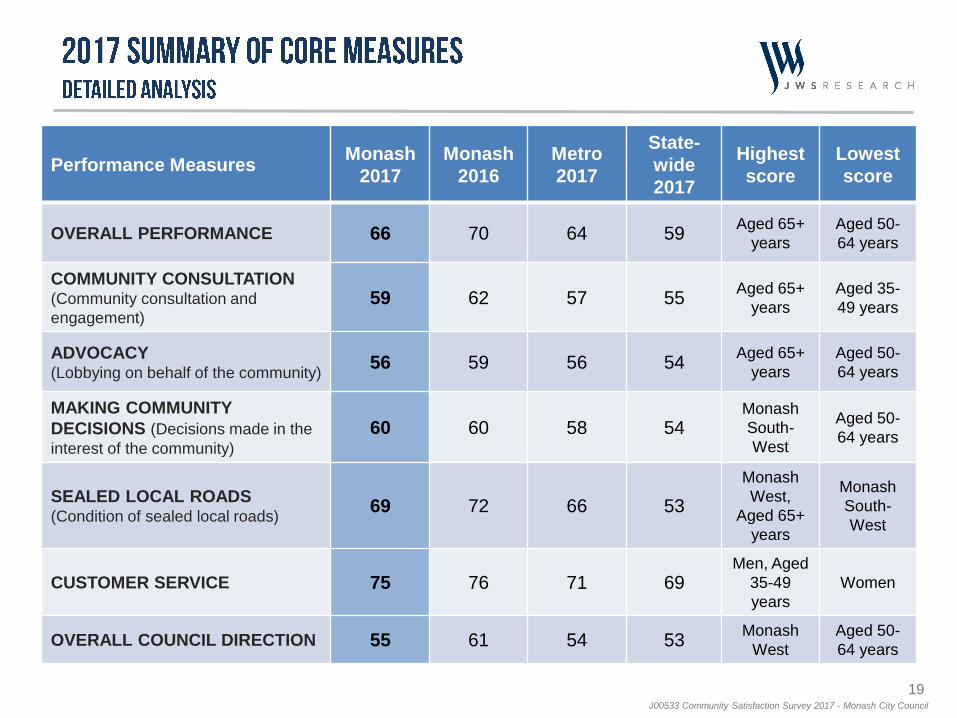
Review of the core performance measures (as shown on page 19) shows that Monash City Council’s
performance on most measures has either remained stable or decreased slightly compared to
Council’s own results in 2016. However, the 2017 results are generally higher than the average for
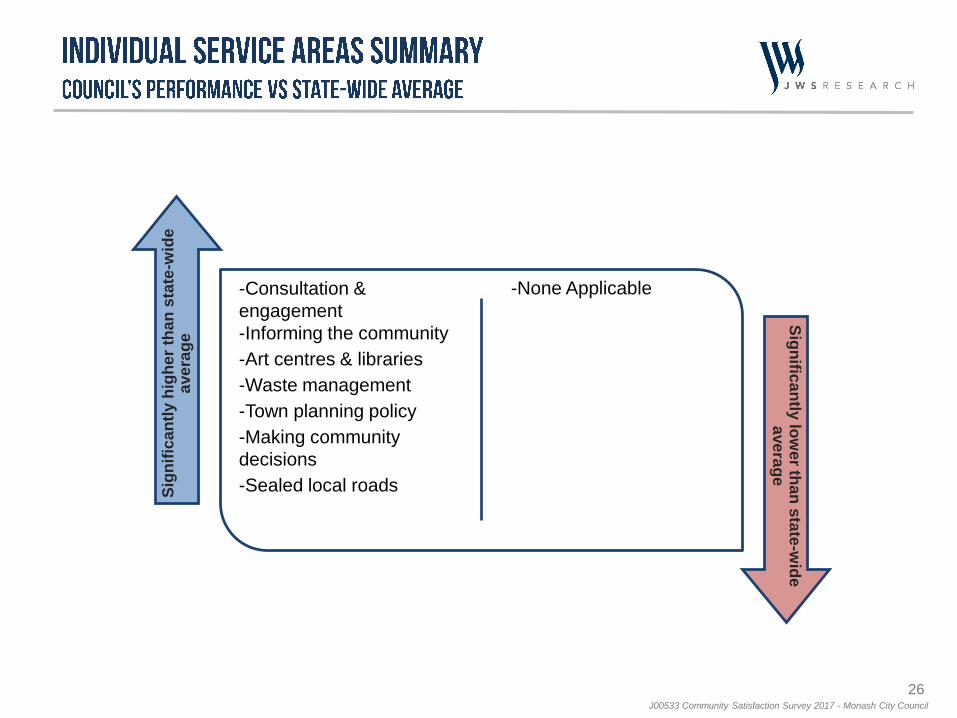
Metropolitan councils and significantly higher than State-wide council averages.
Sealed local roads, advocacy and overall council direction comprise the only exceptions. In
the case of sealed local roads, Monash City Council’s performance index is significantly higher
than both the Metropolitan and State-wide council averages.
Ratings on overall council direction have seen a significant decline in the past year (down six
points to an index score of 55). However, Monash’s performance in this area is still slightly ahead
of Metropolitan and State-wide council averages (one point and two points ahead respectively).
Monash’s performance index for advocacy is in line with the group average for Metropolitan
councils and slightly ahead of the the State-wide average (two index points higher).
Of note, Monash City Council’s performance on community consultation and community decisions
is significantly higher than the group average for Metropolitan councils.
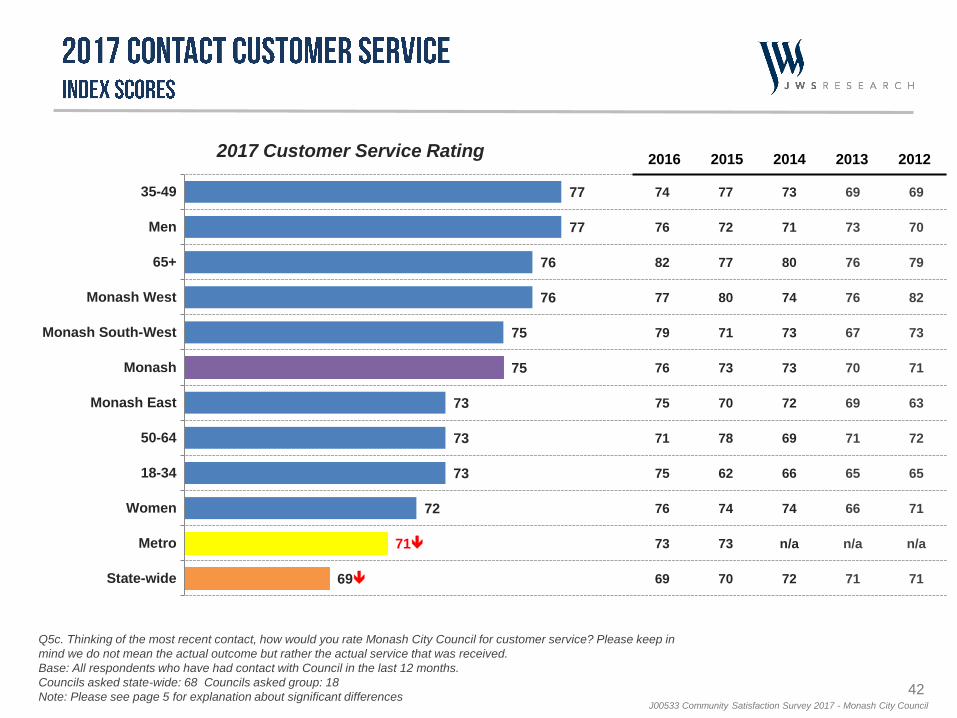
Monash City Council performs best in the area of customer service (index score of 75). Customer
service is the highest rated core performance measure. Again, in the area of customer service,
Monash City Council significantly outperforms averages for both Metropolitan (four index points
higher) and State-wide councils (six index points higher).
11J00533 Community Satisfaction Survey 2017 - Monash City Council
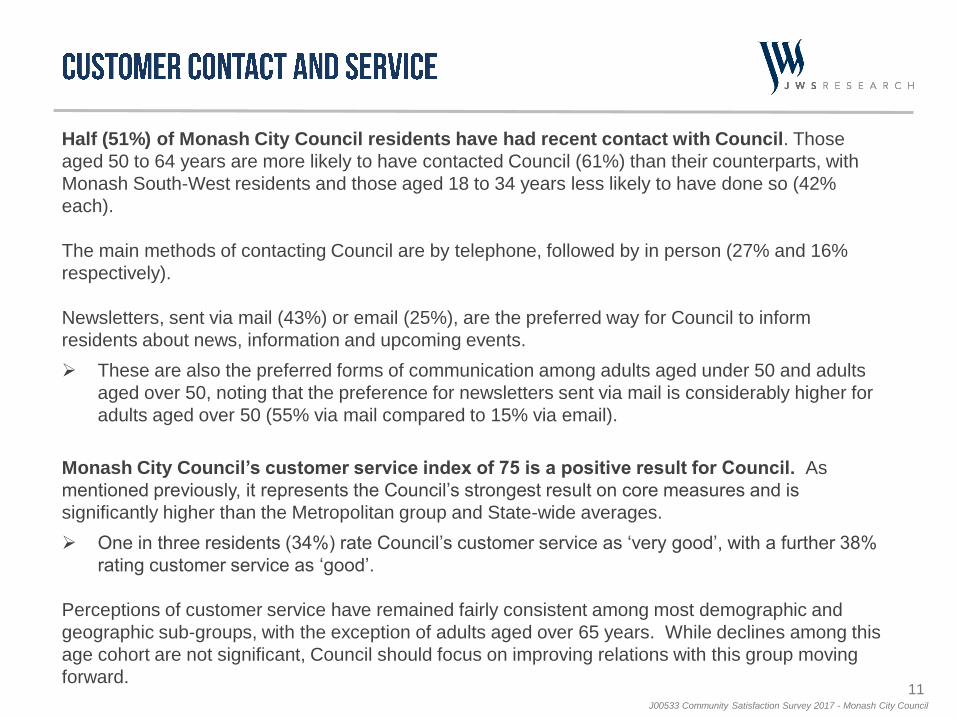
Half (51%) of Monash City Council residents have had recent contact with Council. Those
aged 50 to 64 years are more likely to have contacted Council (61%) than their counterparts, with
Monash South-West residents and those aged 18 to 34 years less likely to have done so (42%
each).
The main methods of contacting Council are by telephone, followed by in person (27% and 16%
respectively).
Newsletters, sent via mail (43%) or email (25%), are the preferred way for Council to inform
residents about news, information and upcoming events.
These are also the preferred forms of communication among adults aged under 50 and adults
aged over 50, noting that the preference for newsletters sent via mail is considerably higher for
adults aged over 50 (55% via mail compared to 15% via email).
Monash City Council’s customer service index of 75 is a positive result for Council. As
mentioned previously, it represents the Council’s strongest result on core measures and is
significantly higher than the Metropolitan group and State-wide averages.
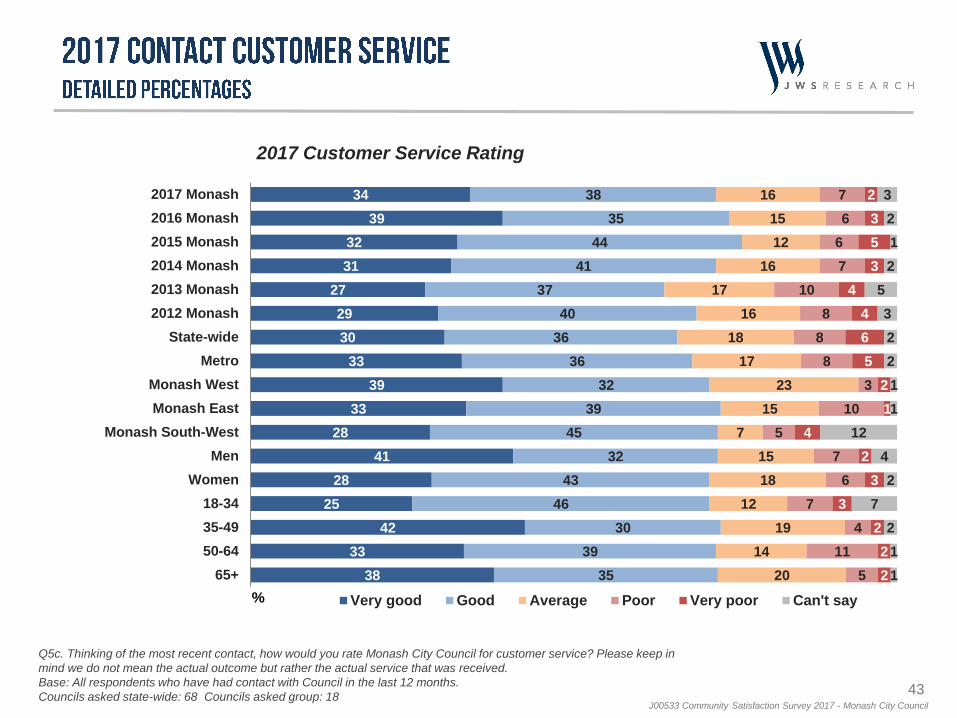
One in three residents (34%) rate Council’s customer service as ‘very good’, with a further 38%
rating customer service as ‘good’.
Perceptions of customer service have remained fairly consistent among most demographic and
geographic sub-groups, with the exception of adults aged over 65 years. While declines among this
age cohort are not significant, Council should focus on improving relations with this group moving
forward.
12J00533 Community Satisfaction Survey 2017 - Monash City Council
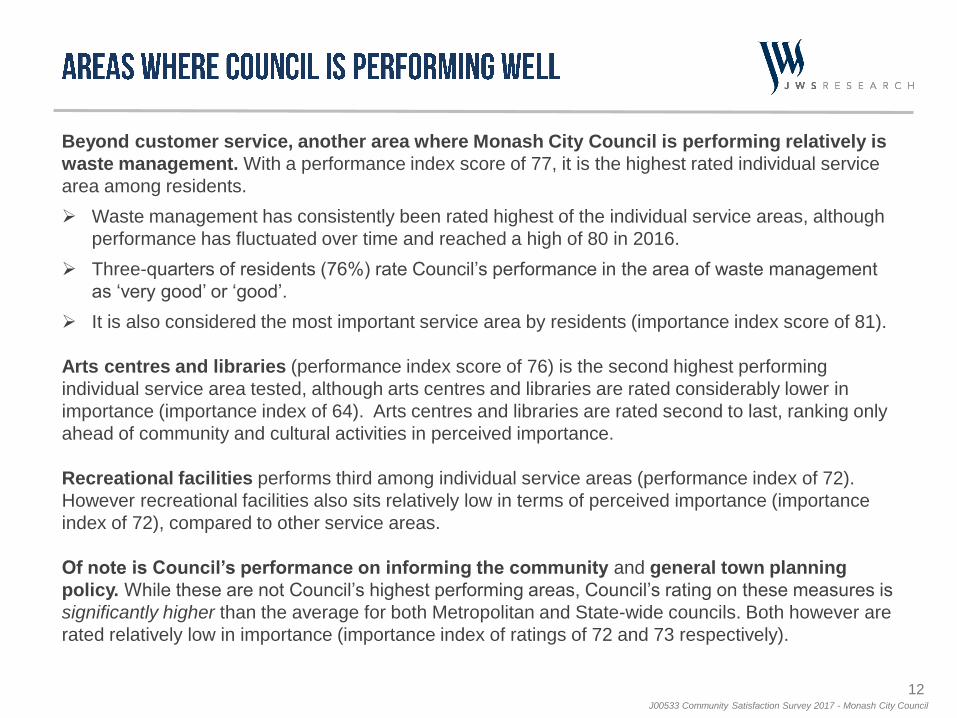
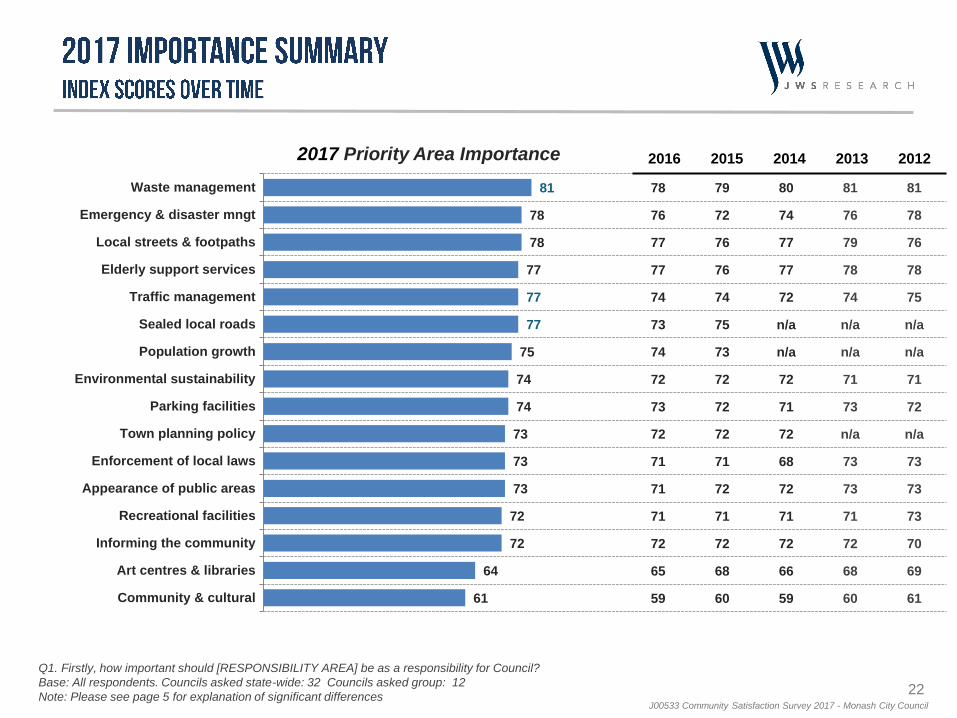
Beyond customer service, another area where Monash City Council is performing relatively is
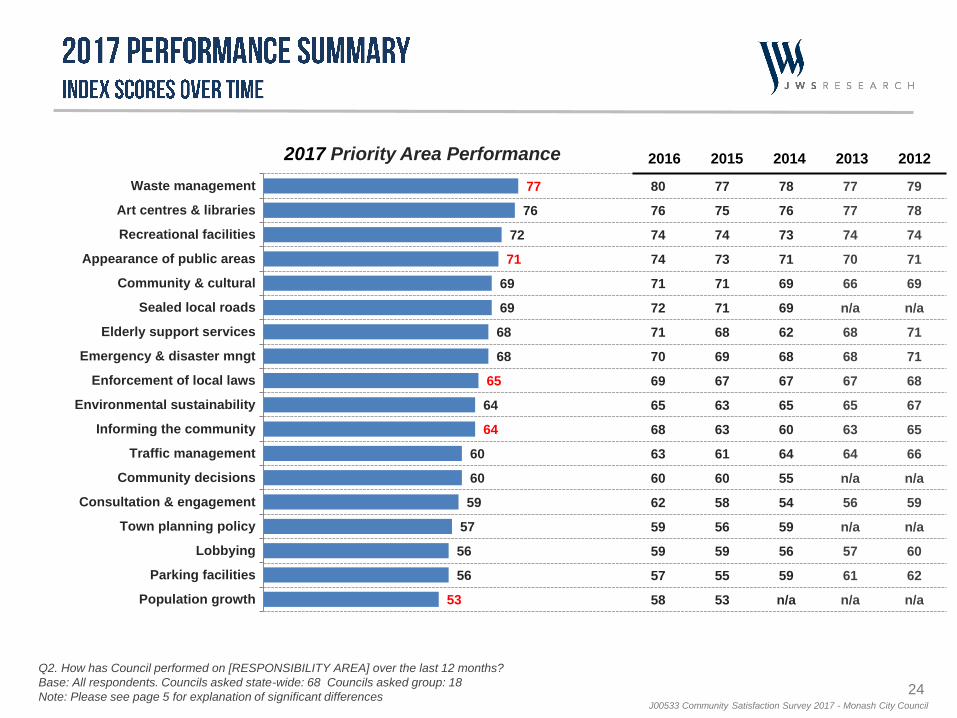
waste management. With a performance index score of 77, it is the highest rated individual service
area among residents.
Waste management has consistently been rated highest of the individual service areas, although
performance has fluctuated over time and reached a high of 80 in 2016.
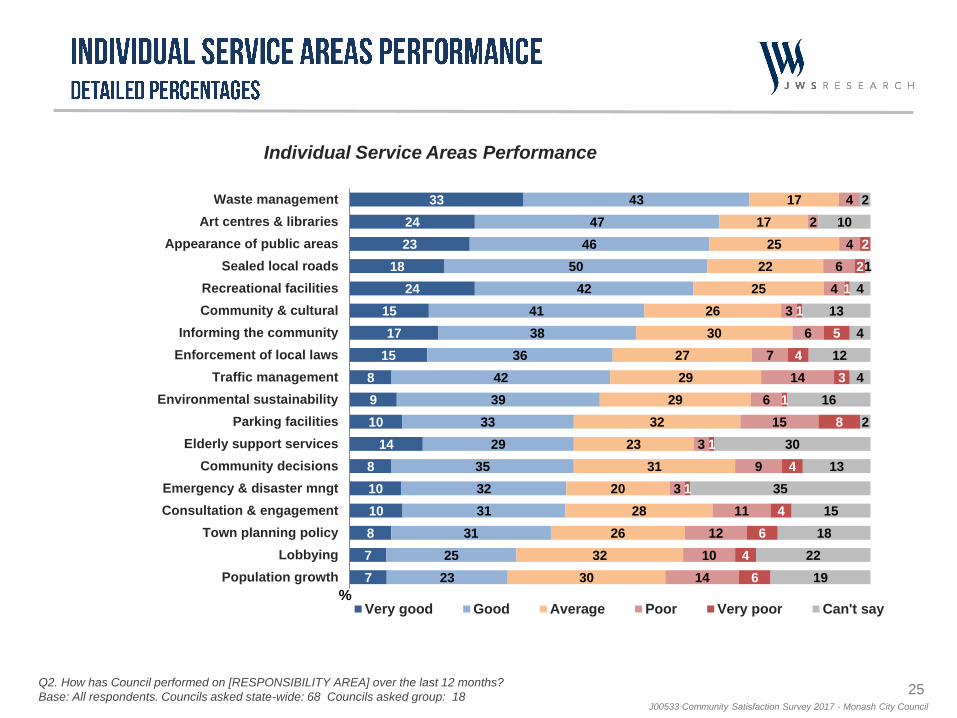
Three-quarters of residents (76%) rate Council’s performance in the area of waste management
as ‘very good’ or ‘good’.
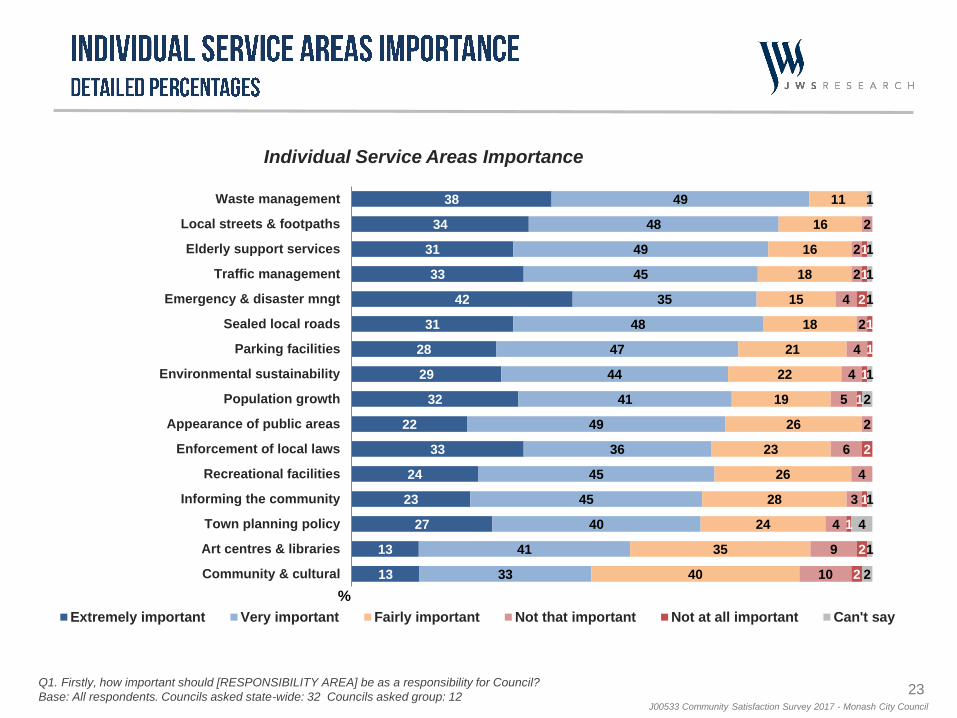
It is also considered the most important service area by residents (importance index score of 81).
Arts centres and libraries (performance index score of 76) is the second highest performing
individual service area tested, although arts centres and libraries are rated considerably lower in
importance (importance index of 64). Arts centres and libraries are rated second to last, ranking only
ahead of community and cultural activities in perceived importance.
Recreational facilities performs third among individual service areas (performance index of 72).
However recreational facilities also sits relatively low in terms of perceived importance (importance
index of 72), compared to other service areas.
Of note is Council’s performance on informing the community and general town planning
policy. While these are not Council’s highest performing areas, Council’s rating on these measures is
significantly higher than the average for both Metropolitan and State-wide councils. Both however are
rated relatively low in importance (importance index of ratings of 72 and 73 respectively).
13J00533 Community Satisfaction Survey 2017 - Monash City Council
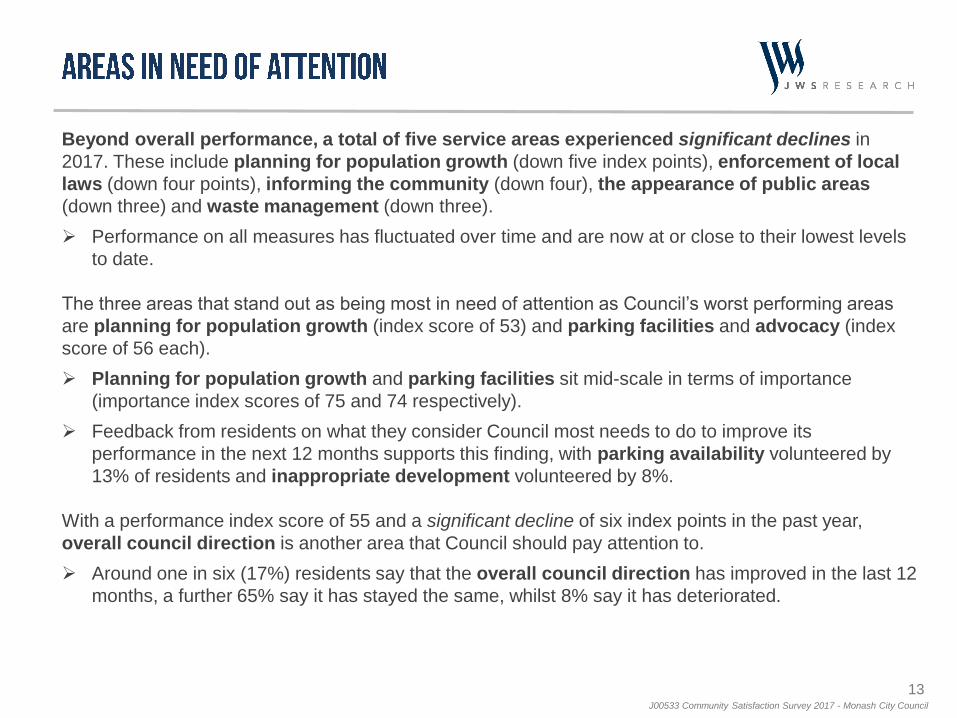
Beyond overall performance, a total of five service areas experienced significant declines in
2017. These include planning for population growth (down five index points), enforcement of local
laws (down four points), informing the community (down four), the appearance of public areas
(down three) and waste management (down three).
Performance on all measures has fluctuated over time and are now at or close to their lowest levels
to date.
The three areas that stand out as being most in need of attention as Council’s worst performing areas
are planning for population growth (index score of 53) and parking facilities and advocacy (index
score of 56 each).
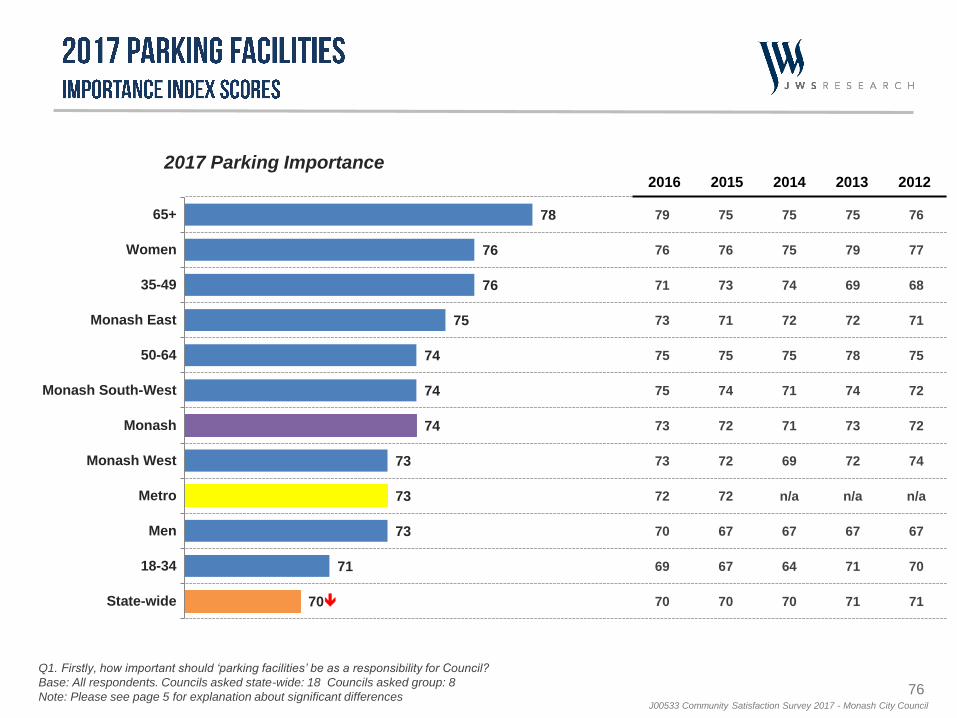
Planning for population growth and parking facilities sit mid-scale in terms of importance
(importance index scores of 75 and 74 respectively).
Feedback from residents on what they consider Council most needs to do to improve its
performance in the next 12 months supports this finding, with parking availability volunteered by
13% of residents and inappropriate development volunteered by 8%.
With a performance index score of 55 and a significant decline of six index points in the past year,
overall council direction is another area that Council should pay attention to.
Around one in six (17%) residents say that the overall council direction has improved in the last 12
months, a further 65% say it has stayed the same, whilst 8% say it has deteriorated.
14J00533 Community Satisfaction Survey 2017 - Monash City Council
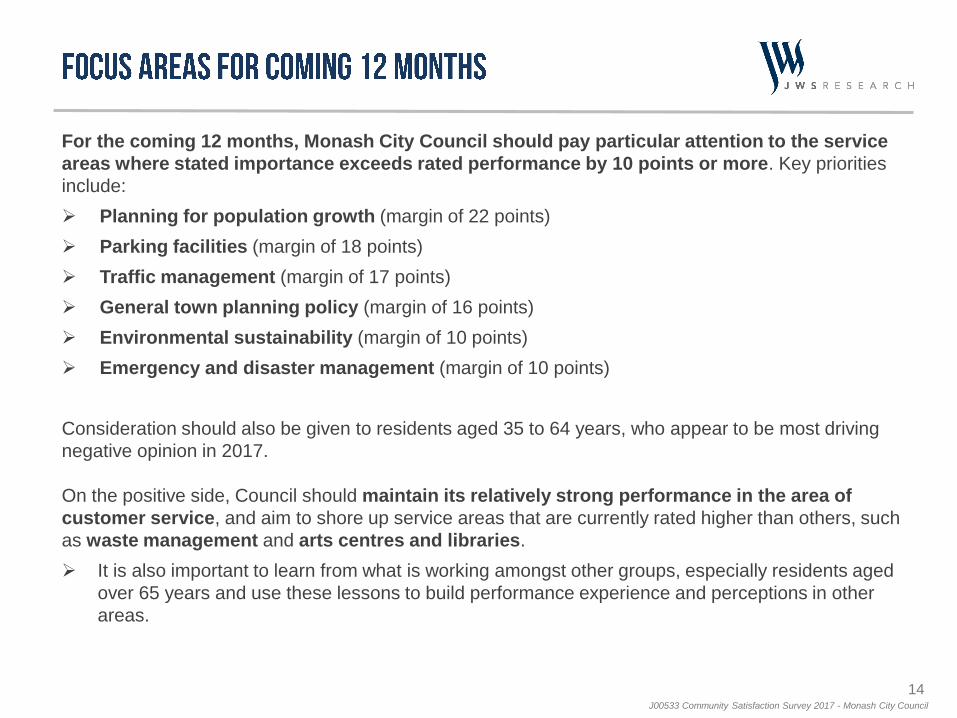
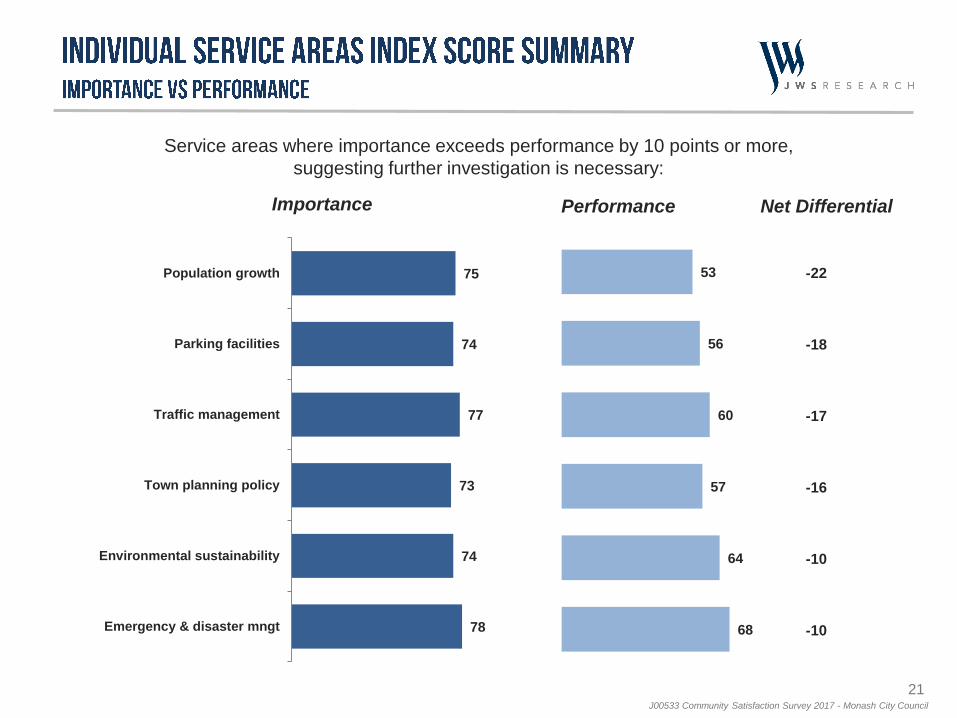
For the coming 12 months, Monash City Council should pay particular attention to the service
areas where stated importance exceeds rated performance by 10 points or more. Key priorities
include:
Planning for population growth (margin of 22 points)
Parking facilities (margin of 18 points)
Traffic management (margin of 17 points)
General town planning policy (margin of 16 points)
Environmental sustainability (margin of 10 points)
Emergency and disaster management (margin of 10 points)
Consideration should also be given to residents aged 35 to 64 years, who appear to be most driving
negative opinion in 2017.
On the positive side, Council should maintain its relatively strong performance in the area of
customer service, and aim to shore up service areas that are currently rated higher than others, such
as waste management and arts centres and libraries.
It is also important to learn from what is working amongst other groups, especially residents aged
over 65 years and use these lessons to build performance experience and perceptions in other
areas.
15J00533 Community Satisfaction Survey 2017 - Monash City Council
An approach we recommend is to further mine the survey data to better understand the profile of these
over and under-performing demographic groups. This can be achieved via additional consultation and
data interrogation, self-mining the SPSS data provided, or via the dashboard portal available to the
council.
Please note that the category descriptions for the coded open ended responses are generic
summaries only. We recommend further analysis of the detailed cross tabulations and the actual
verbatim responses, with a view to understanding the responses of the key gender and age groups,
especially any target groups identified as requiring attention.
A personal briefing by senior JWS Research representatives is also available to assist in
providing both explanation and interpretation of the results. Please contact JWS Research on
03 8685 8555.
16J00533 Community Satisfaction Survey 2017 - Monash City Council
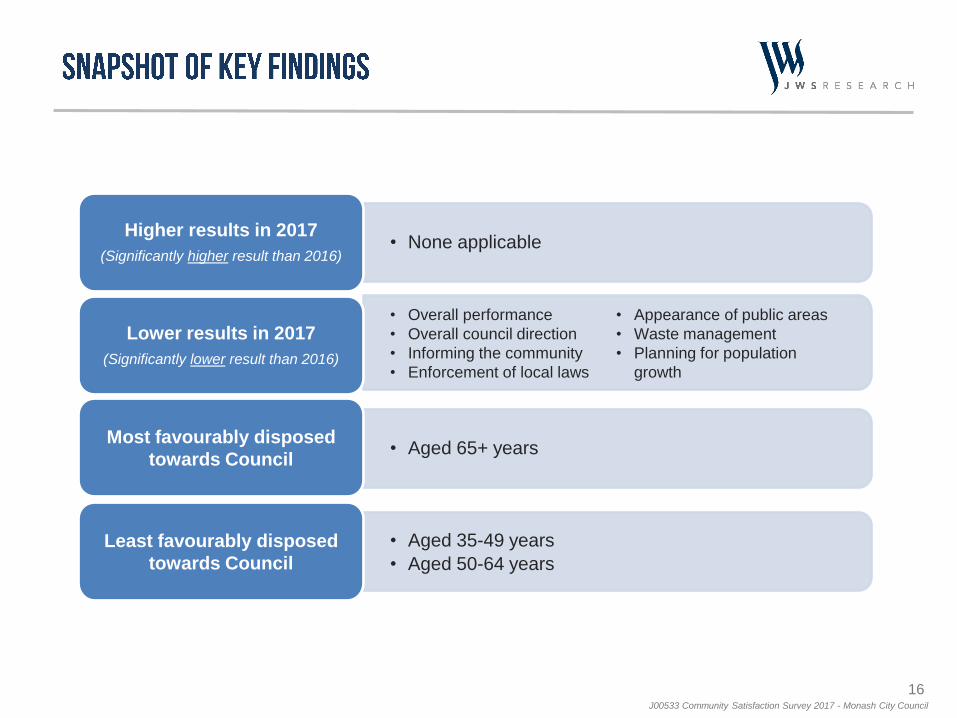
• None applicableHigher results in 2017
(Significantly higher result than 2016)
• Overall performance
• Overall council direction
• Informing the community
• Enforcement of local laws
• Appearance of public areas
• Waste management
• Planning for population
growth
Lower results in 2017
(Significantly lower result than 2016)
• Aged 65+ yearsMost favourably disposed
towards Council
• Aged 35-49 years
• Aged 50-64 years
Least favourably disposed
towards Council
18J00533 Community Satisfaction Survey 2017 - Monash City Council
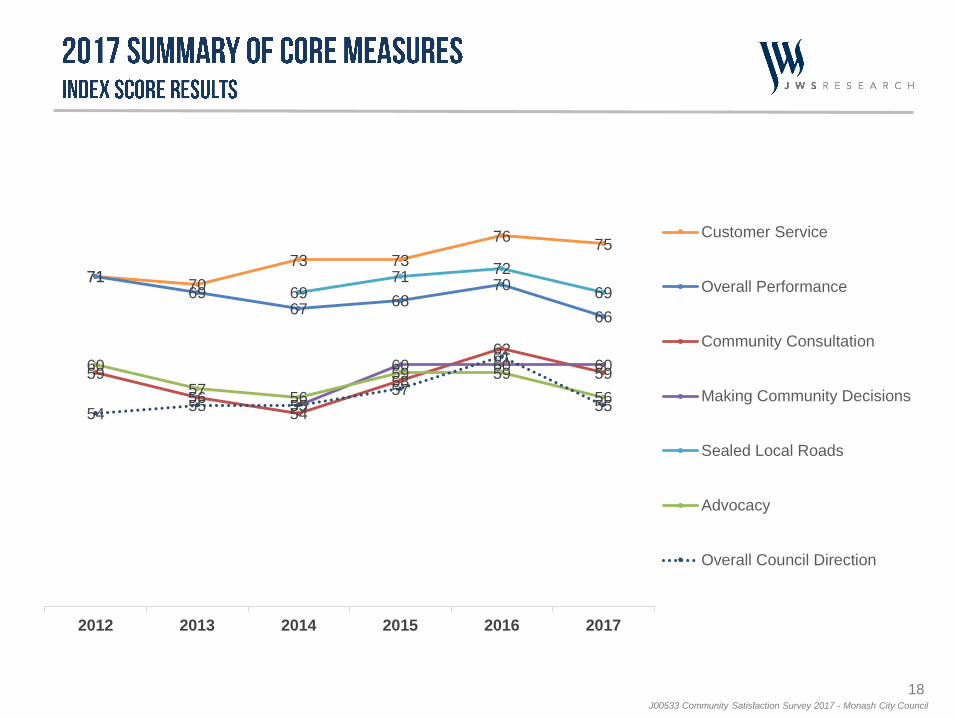
7170
73 73
7675
7169
6768
70
66
59
5654
58
62
59
55
60 60 60
6971
72
69
60
5756
59 59
5654
55 5557
61
55
2012 2013 2014 2015 2016 2017
Customer Service
Overall Performance
Community Consultation
Making Community Decisions
Sealed Local Roads
Advocacy
Overall Council Direction
19J00533 Community Satisfaction Survey 2017 - Monash City Council
Performance MeasuresMonash
2017
Monash
2016
Metro
2017
State-
wide
2017
Highest
score
Lowest
score
OVERALL PERFORMANCE 66 70 64 59Aged 65+
years
Aged 50-
64 years
COMMUNITY CONSULTATION(Community consultation and
engagement)
59 62 57 55Aged 65+
years
Aged 35-
49 years
ADVOCACY(Lobbying on behalf of the community)
56 59 56 54Aged 65+
years
Aged 50-
64 years
MAKING COMMUNITY
DECISIONS (Decisions made in the
interest of the community)
60 60 58 54Monash
South-
West
Aged 50-
64 years
SEALED LOCAL ROADS (Condition of sealed local roads)
69 72 66 53
Monash
West,
Aged 65+
years
Monash
South-
West
CUSTOMER SERVICE 75 76 71 69Men, Aged
35-49
years
Women
OVERALL COUNCIL DIRECTION 55 61 54 53Monash
West
Aged 50-
64 years
20J00533 Community Satisfaction Survey 2017 - Monash City Council
12
10
7
8
18
34
47
31
25
35
50
38
33
28
32
31
22
16
4
11
10
9
6
7
2
4
4
4
2
2
1
15
22
13
1
3
Overall Performance
Community Consultation
Advocacy
Making CommunityDecisions
Sealed Local Roads
Customer Service
% Very good Good Average Poor Very poor Can't say
Key Measures Summary Results
17 65 8 10Overall Council Direction
%Improved Stayed the same Deteriorated Can't say
21J00533 Community Satisfaction Survey 2017 - Monash City Council
75
74
77
73
74
78
Population growth
Parking facilities
Traffic management
Town planning policy
Environmental sustainability
Emergency & disaster mngt
53
56
60
57
64
68
Importance Performance Net Differential
-22
-18
-17
-16
-10
-10
Service areas where importance exceeds performance by 10 points or more,
suggesting further investigation is necessary:
22J00533 Community Satisfaction Survey 2017 - Monash City Council
78
76
77
77
74
73
74
72
73
72
71
71
71
72
65
59
79
72
76
76
74
75
73
72
72
72
71
72
71
72
68
60
80
74
77
77
72
n/a
n/a
72
71
72
68
72
71
72
66
59
81
76
79
78
74
n/a
n/a
71
73
n/a
73
73
71
72
68
60
81
78
76
78
75
n/a
n/a
71
72
n/a
73
73
73
70
69
61
81
78
78
77
77
77
75
74
74
73
73
73
72
72
64
61
Waste management
Emergency & disaster mngt
Local streets & footpaths
Elderly support services
Traffic management
Sealed local roads
Population growth
Environmental sustainability
Parking facilities
Town planning policy
Enforcement of local laws
Appearance of public areas
Recreational facilities
Informing the community
Art centres & libraries
Community & cultural
2016 2015 2014 2013 20122017 Priority Area Importance
Q1. Firstly, how important should [RESPONSIBILITY AREA] be as a responsibility for Council?
Base: All respondents. Councils asked state-wide: 32 Councils asked group: 12
Note: Please see page 5 for explanation of significant differences
23J00533 Community Satisfaction Survey 2017 - Monash City Council
38
34
31
33
42
31
28
29
32
22
33
24
23
27
13
13
49
48
49
45
35
48
47
44
41
49
36
45
45
40
41
33
11
16
16
18
15
18
21
22
19
26
23
26
28
24
35
40
2
2
2
4
2
4
4
5
2
6
4
3
4
9
10
1
1
2
1
1
1
1
2
1
1
2
2
1
1
1
1
1
2
1
4
1
2
Waste management
Local streets & footpaths
Elderly support services
Traffic management
Emergency & disaster mngt
Sealed local roads
Parking facilities
Environmental sustainability
Population growth
Appearance of public areas
Enforcement of local laws
Recreational facilities
Informing the community
Town planning policy
Art centres & libraries
Community & cultural
%
Extremely important Very important Fairly important Not that important Not at all important Can't say
Individual Service Areas Importance
Q1. Firstly, how important should [RESPONSIBILITY AREA] be as a responsibility for Council?
Base: All respondents. Councils asked state-wide: 32 Councils asked group: 12
24J00533 Community Satisfaction Survey 2017 - Monash City Council
80
76
74
74
71
72
71
70
69
65
68
63
60
62
59
59
57
58
77
75
74
73
71
71
68
69
67
63
63
61
60
58
56
59
55
53
78
76
73
71
69
69
62
68
67
65
60
64
55
54
59
56
59
n/a
77
77
74
70
66
n/a
68
68
67
65
63
64
n/a
56
n/a
57
61
n/a
79
78
74
71
69
n/a
71
71
68
67
65
66
n/a
59
n/a
60
62
n/a
77
76
72
71
69
69
68
68
65
64
64
60
60
59
57
56
56
53
Waste management
Art centres & libraries
Recreational facilities
Appearance of public areas
Community & cultural
Sealed local roads
Elderly support services
Emergency & disaster mngt
Enforcement of local laws
Environmental sustainability
Informing the community
Traffic management
Community decisions
Consultation & engagement
Town planning policy
Lobbying
Parking facilities
Population growth
2017 Priority Area Performance 2016 2015 2014 2013 2012
Q2. How has Council performed on [RESPONSIBILITY AREA] over the last 12 months?
Base: All respondents. Councils asked state-wide: 68 Councils asked group: 18
Note: Please see page 5 for explanation of significant differences
25J00533 Community Satisfaction Survey 2017 - Monash City Council
Individual Service Areas Performance
33
24
23
18
24
15
17
15
8
9
10
14
8
10
10
8
7
7
43
47
46
50
42
41
38
36
42
39
33
29
35
32
31
31
25
23
17
17
25
22
25
26
30
27
29
29
32
23
31
20
28
26
32
30
4
2
4
6
4
3
6
7
14
6
15
3
9
3
11
12
10
14
2
2
1
1
5
4
3
1
8
1
4
1
4
6
4
6
2
10
1
4
13
4
12
4
16
2
30
13
35
15
18
22
19
Waste management
Art centres & libraries
Appearance of public areas
Sealed local roads
Recreational facilities
Community & cultural
Informing the community
Enforcement of local laws
Traffic management
Environmental sustainability
Parking facilities
Elderly support services
Community decisions
Emergency & disaster mngt
Consultation & engagement
Town planning policy
Lobbying
Population growth
%Very good Good Average Poor Very poor Can't say
Q2. How has Council performed on [RESPONSIBILITY AREA] over the last 12 months?
Base: All respondents. Councils asked state-wide: 68 Councils asked group: 18
26J00533 Community Satisfaction Survey 2017 - Monash City Council
Sig
nif
ica
ntl
y h
igh
er
tha
n s
tate
-wid
e
ave
rag
e
Sig
nific
an
tly lo
we
r tha
n s
tate
-wid
e
ave
rag
e
-Consultation &
engagement
-Informing the community
-Art centres & libraries
-Waste management
-Town planning policy
-Making community
decisions
-Sealed local roads
-None Applicable
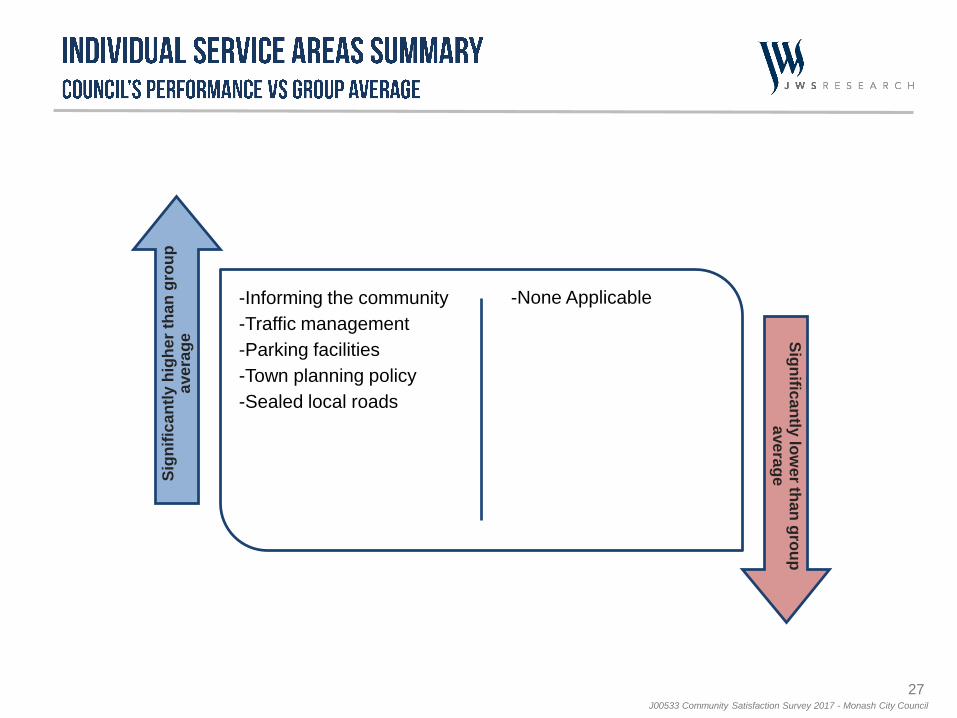
27J00533 Community Satisfaction Survey 2017 - Monash City Council
Sig
nif
ica
ntl
y h
igh
er
tha
n g
rou
p
ave
rag
e Sig
nific
an
tly lo
we
r tha
n g
rou
p
ave
rag
e
-Informing the community
-Traffic management
-Parking facilities
-Town planning policy
-Sealed local roads
-None Applicable
28J00533 Community Satisfaction Survey 2017 - Monash City Council
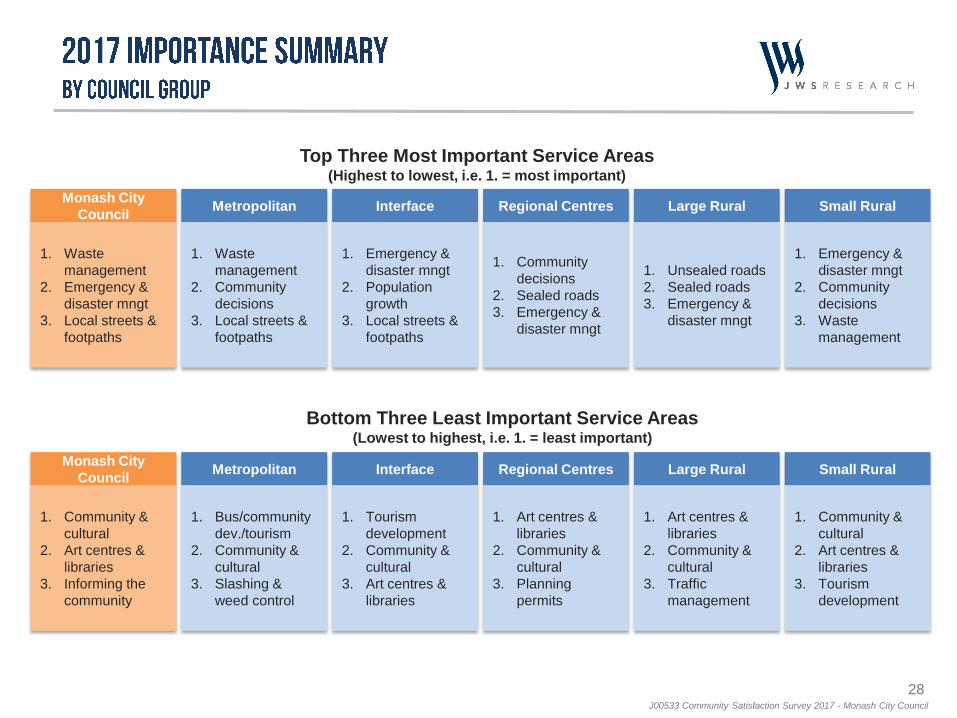
Top Three Most Important Service Areas(Highest to lowest, i.e. 1. = most important)
Monash City
Council
1. Waste
management
2. Emergency &
disaster mngt
3. Local streets &
footpaths
Metropolitan
1. Waste
management
2. Community
decisions
3. Local streets &
footpaths
Interface
1. Emergency &
disaster mngt
2. Population
growth
3. Local streets &
footpaths
Regional Centres
1. Community
decisions
2. Sealed roads
3. Emergency &
disaster mngt
Large Rural
1. Unsealed roads
2. Sealed roads
3. Emergency &
disaster mngt
Small Rural
1. Emergency &
disaster mngt
2. Community
decisions
3. Waste
management
Bottom Three Least Important Service Areas (Lowest to highest, i.e. 1. = least important)
Monash City
Council
1. Community &
cultural
2. Art centres &
libraries
3. Informing the
community
Metropolitan
1. Bus/community
dev./tourism
2. Community &
cultural
3. Slashing &
weed control
Interface
1. Tourism
development
2. Community &
cultural
3. Art centres &
libraries
Regional Centres
1. Art centres &
libraries
2. Community &
cultural
3. Planning
permits
Large Rural
1. Art centres &
libraries
2. Community &
cultural
3. Traffic
management
Small Rural
1. Community &
cultural
2. Art centres &
libraries
3. Tourism
development
29J00533 Community Satisfaction Survey 2017 - Monash City Council
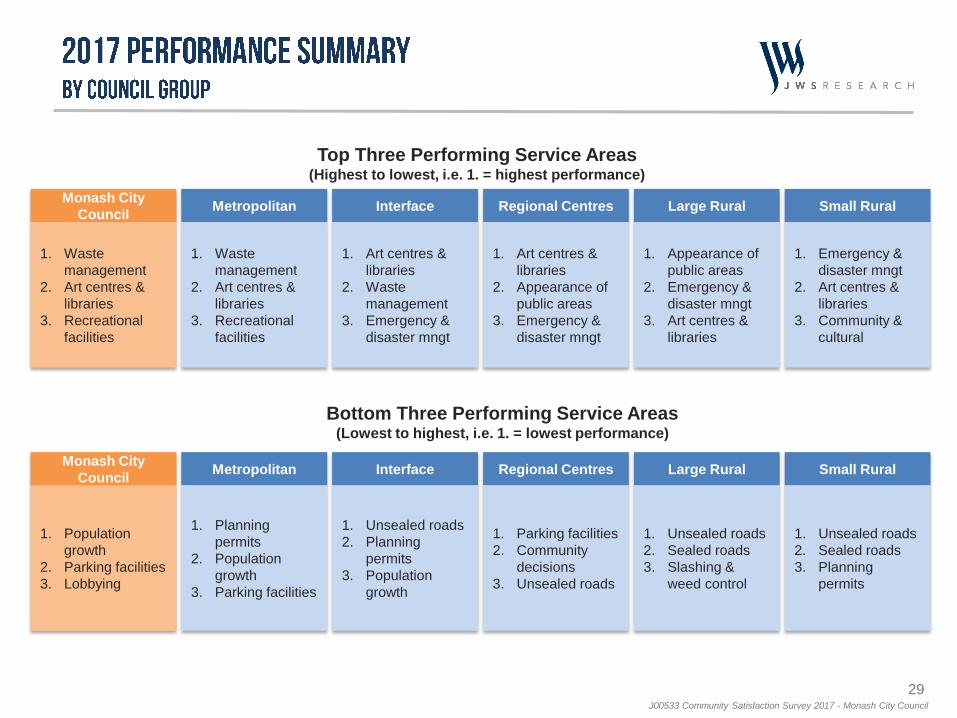
Top Three Performing Service Areas(Highest to lowest, i.e. 1. = highest performance)
Bottom Three Performing Service Areas (Lowest to highest, i.e. 1. = lowest performance)
Monash City
Council
1. Waste
management
2. Art centres &
libraries
3. Recreational
facilities
Metropolitan
1. Waste
management
2. Art centres &
libraries
3. Recreational
facilities
Interface
1. Art centres &
libraries
2. Waste
management
3. Emergency &
disaster mngt
Regional Centres
1. Art centres &
libraries
2. Appearance of
public areas
3. Emergency &
disaster mngt
Large Rural
1. Appearance of
public areas
2. Emergency &
disaster mngt
3. Art centres &
libraries
Small Rural
1. Emergency &
disaster mngt
2. Art centres &
libraries
3. Community &
cultural
Monash City
Council
1. Population
growth
2. Parking facilities
3. Lobbying
Metropolitan
1. Planning
permits
2. Population
growth
3. Parking facilities
Interface
1. Unsealed roads
2. Planning
permits
3. Population
growth
Regional Centres
1. Parking facilities
2. Community
decisions
3. Unsealed roads
Large Rural
1. Unsealed roads
2. Sealed roads
3. Slashing &
weed control
Small Rural
1. Unsealed roads
2. Sealed roads
3. Planning
permits
30J00533 Community Satisfaction Survey 2017 - Monash City Council
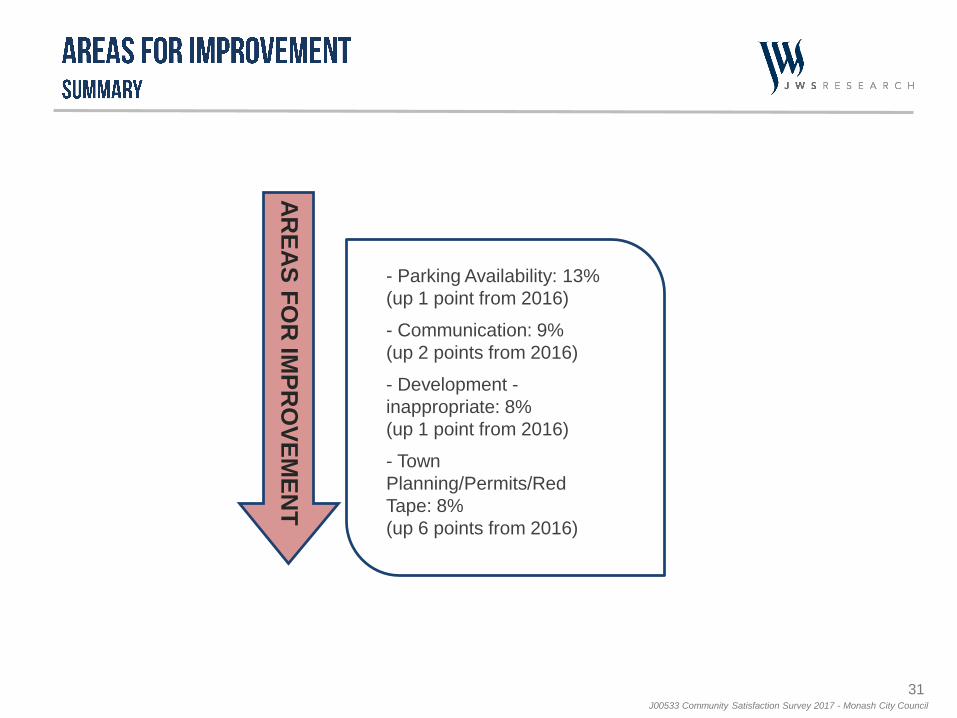
13
9
8
8
7
7
7
11
Parking Availability
Communication
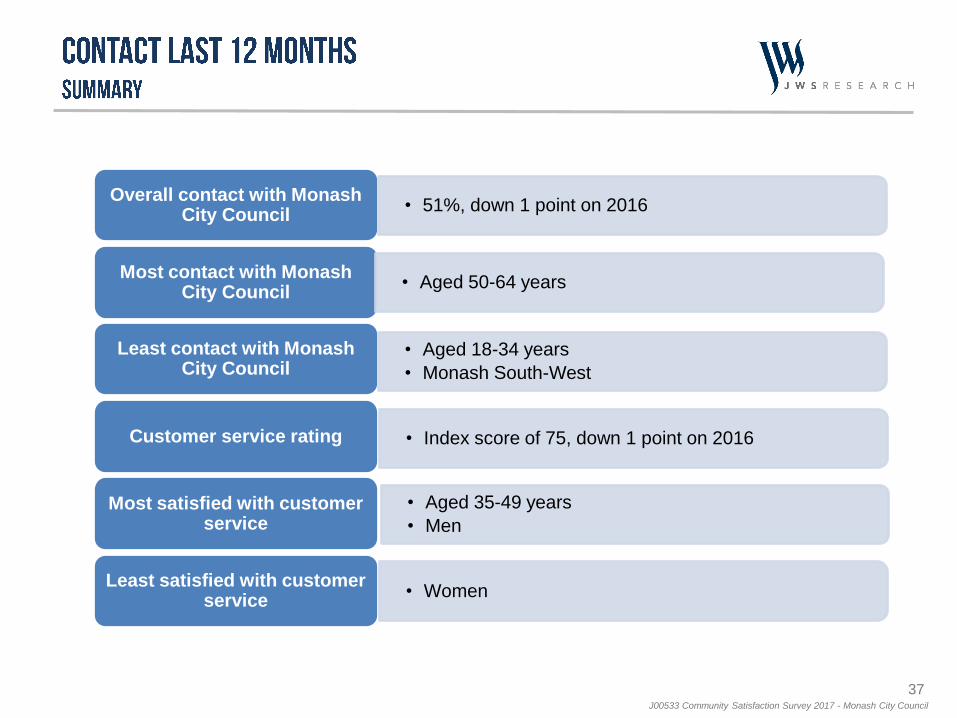
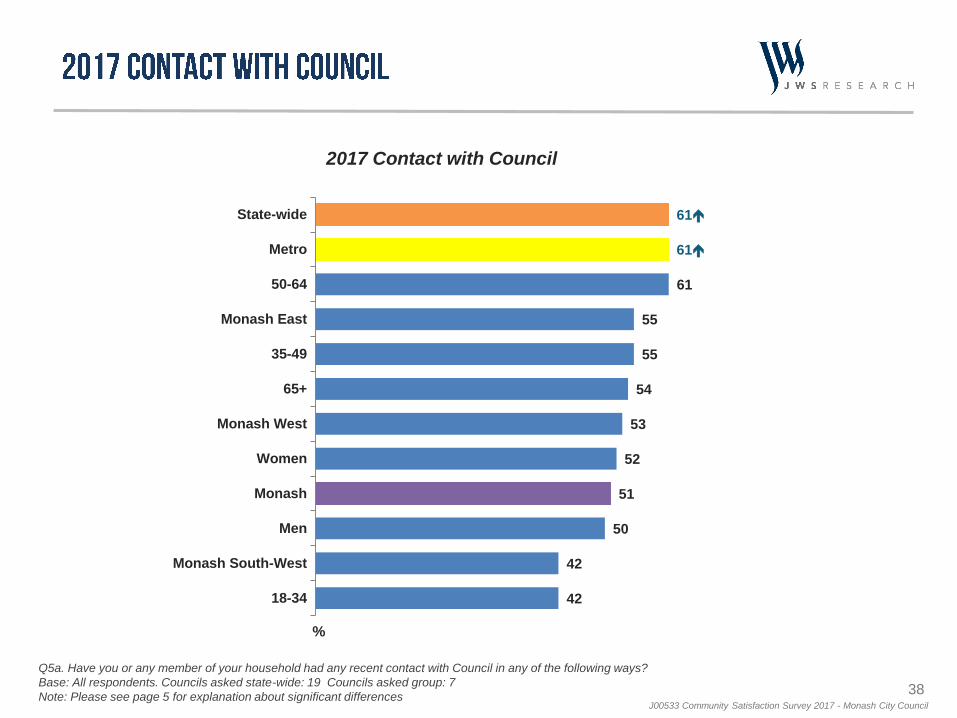
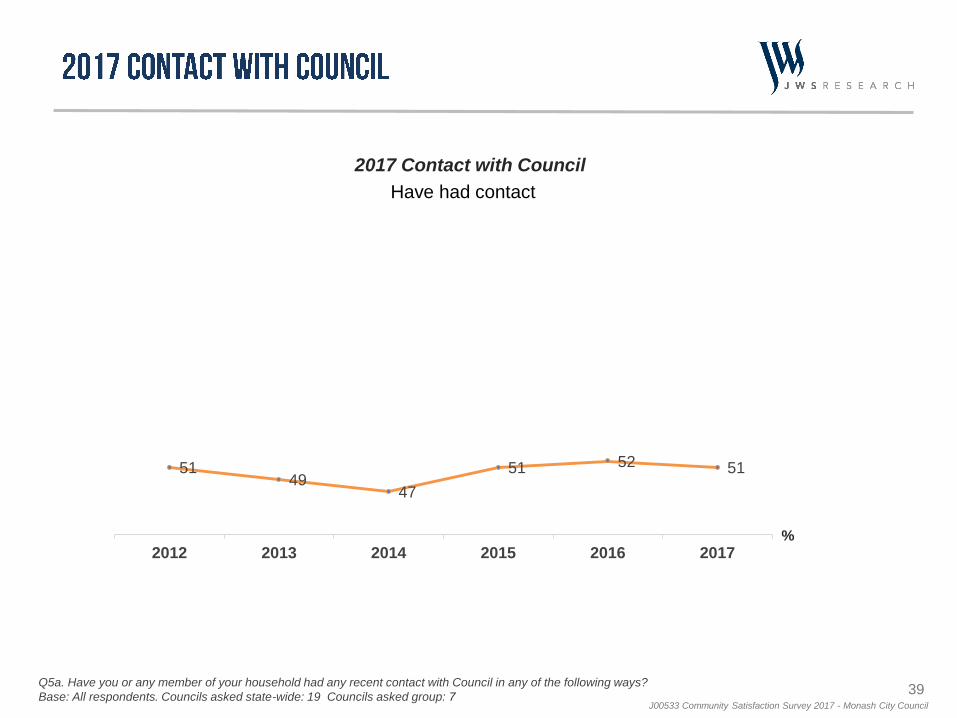
Development - inappropriate
Town Planning/Permits/Red Tape
Community Consultation
Traffic Management
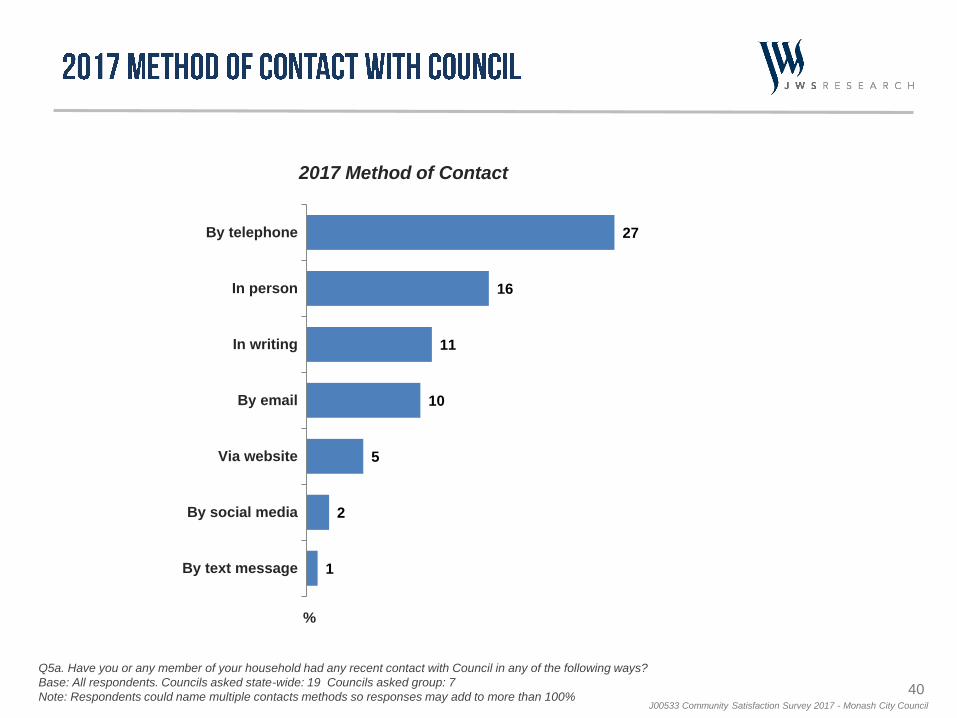
Footpaths/Walking Tracks
Nothing
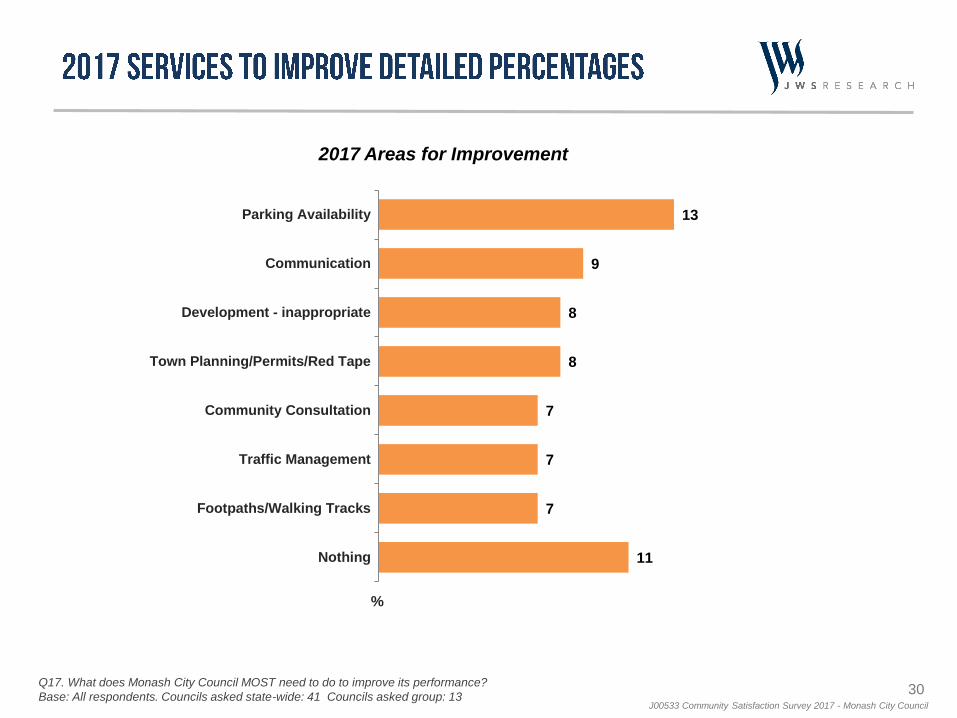
2017 Areas for Improvement
%
Q17. What does Monash City Council MOST need to do to improve its performance?
Base: All respondents. Councils asked state-wide: 41 Councils asked group: 13
31J00533 Community Satisfaction Survey 2017 - Monash City Council
AR
EA
S F
OR
IMP
RO
VE
ME
NT
- Parking Availability: 13%
(up 1 point from 2016)
- Communication: 9%
(up 2 points from 2016)
- Development -
inappropriate: 8%
(up 1 point from 2016)
- Town
Planning/Permits/Red
Tape: 8%
(up 6 points from 2016)
34J00533 Community Satisfaction Survey 2017 - Monash City Council
69
67
66
66
66
66
66
65
65
64
64
59
65+
35-49
Monash East
Monash South-West
Men
Monash
Women
Monash West
18-34
Metro
50-64
State-wide
71
70
69
75
72
70
69
69
72
66
64
59
70
68
67
65
69
68
68
72
68
67
66
60
69
62
65
67
63
67
70
69
71
n/a
63
61
69
68
69
70
69
69
68
63
72
n/a
64
60
71
68
70
72
70
71
73
73
75
n/a
68
60
2017 Overall Performance 2016 2015 2014 2013 2012
Q3. ON BALANCE, for the last twelve months, how do you feel about the performance of Monash City Council, not just on
one or two issues, BUT OVERALL across all responsibility areas? Has it been very good, good, average, poor or very poor?
Base: All respondents. Councils asked state-wide: 68 Councils asked group: 18
Note: Please see page 5 for explanation about significant differences
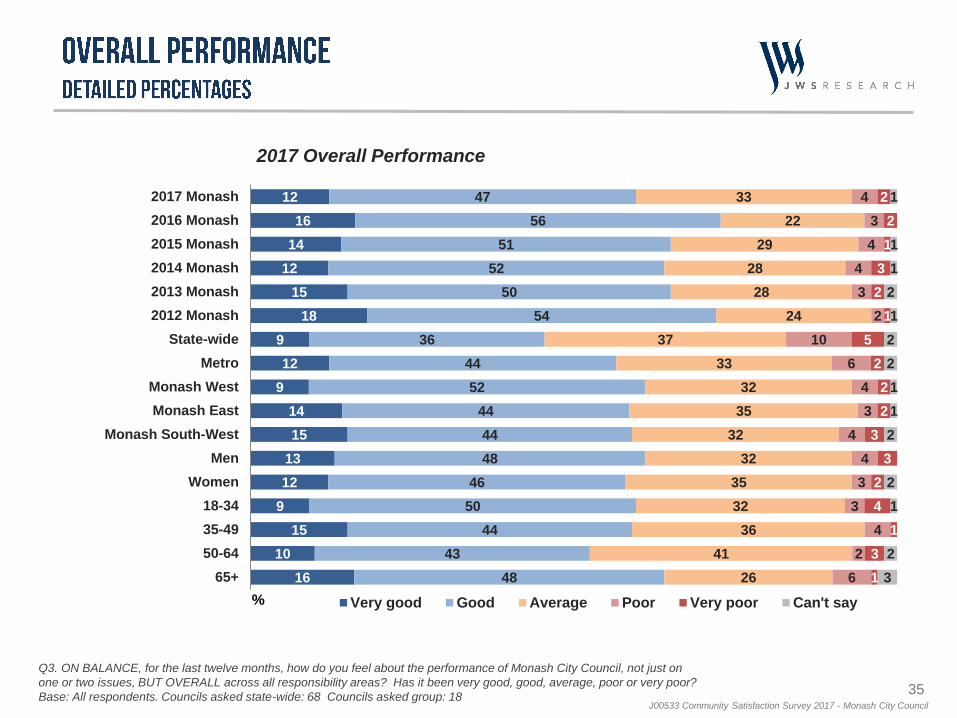
35J00533 Community Satisfaction Survey 2017 - Monash City Council
2017 Overall Performance
12
16
14
12
15
18
9
12
9
14
15
13
12
9
15
10
16
47
56
51
52
50
54
36
44
52
44
44
48
46
50
44
43
48
33
22
29
28
28
24
37
33
32
35
32
32
35
32
36
41
26
4
3
4
4
3
2
10
6
4
3
4
4
3
3
4
2
6
2
2
1
3
2
1
5
2
2
2
3
3
2
4
1
3
1
1
1
1
2
1
2
2
1
1
2
2
1
2
3
2017 Monash
2016 Monash
2015 Monash
2014 Monash
2013 Monash
2012 Monash
State-wide
Metro
Monash West
Monash East
Monash South-West
Men
Women
18-34
35-49
50-64
65+
% Very good Good Average Poor Very poor Can't say
Q3. ON BALANCE, for the last twelve months, how do you feel about the performance of Monash City Council, not just on
one or two issues, BUT OVERALL across all responsibility areas? Has it been very good, good, average, poor or very poor?
Base: All respondents. Councils asked state-wide: 68 Councils asked group: 18
37J00533 Community Satisfaction Survey 2017 - Monash City Council
Overall contact with Monash City Council
Most contact with Monash City Council
Least contact with Monash City Council
Customer service rating
Most satisfied with customer service
Least satisfied with customer service
• Women
• Aged 35-49 years
• Men
• Index score of 75, down 1 point on 2016
• Aged 18-34 years
• Monash South-West
• Aged 50-64 years
• 51%, down 1 point on 2016
38J00533 Community Satisfaction Survey 2017 - Monash City Council
61
61
61
55
55
54
53
52
51
50
42
42
State-wide
Metro
50-64
Monash East
35-49
65+
Monash West
Women
Monash
Men
Monash South-West
18-34
2017 Contact with Council
%
Q5a. Have you or any member of your household had any recent contact with Council in any of the following ways?
Base: All respondents. Councils asked state-wide: 19 Councils asked group: 7
Note: Please see page 5 for explanation about significant differences
39J00533 Community Satisfaction Survey 2017 - Monash City Council
2017 Contact with Council
5149
47
51 52 51
2012 2013 2014 2015 2016 2017
Have had contact
%
Q5a. Have you or any member of your household had any recent contact with Council in any of the following ways?
Base: All respondents. Councils asked state-wide: 19 Councils asked group: 7
40J00533 Community Satisfaction Survey 2017 - Monash City Council
2017 Method of Contact
%
Q5a. Have you or any member of your household had any recent contact with Council in any of the following ways?
Base: All respondents. Councils asked state-wide: 19 Councils asked group: 7
Note: Respondents could name multiple contacts methods so responses may add to more than 100%
27
16
11
10
5
2
1
By telephone
In person
In writing
By email
Via website
By social media
By text message
41J00533 Community Satisfaction Survey 2017 - Monash City Council
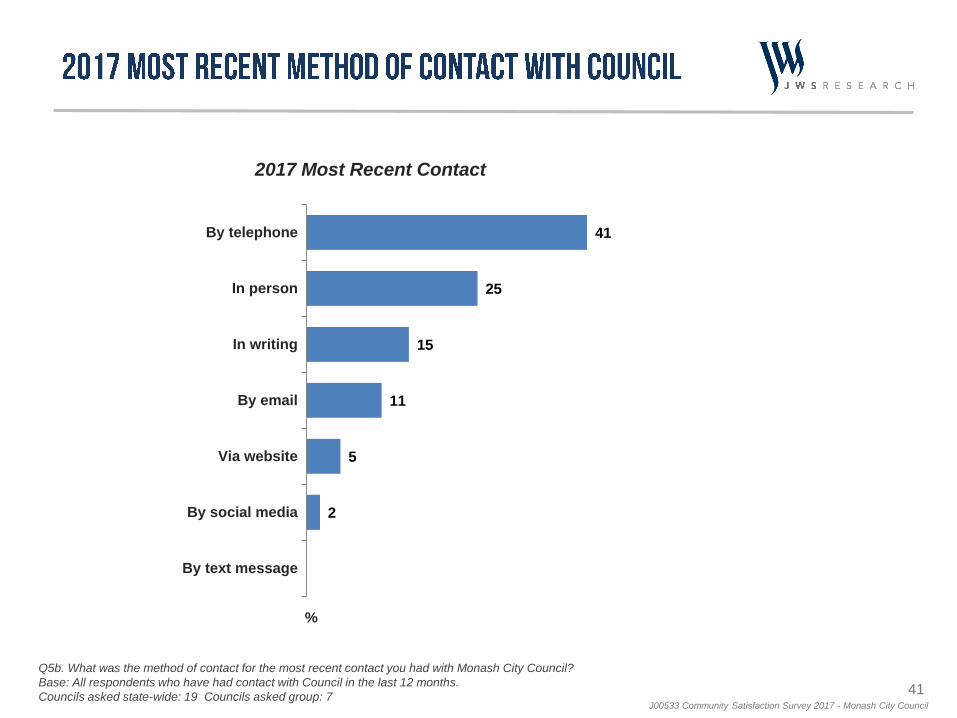
2017 Most Recent Contact
%
Q5b. What was the method of contact for the most recent contact you had with Monash City Council?
Base: All respondents who have had contact with Council in the last 12 months.
Councils asked state-wide: 19 Councils asked group: 7
41
25
15
11
5
2
By telephone
In person
In writing
By email
Via website
By social media
By text message
42J00533 Community Satisfaction Survey 2017 - Monash City Council
77
77
76
76
75
75
73
73
73
72
71
69
35-49
Men
65+
Monash West
Monash South-West
Monash
Monash East
50-64
18-34
Women
Metro
State-wide
74
76
82
77
79
76
75
71
75
76
73
69
77
72
77
80
71
73
70
78
62
74
73
70
73
71
80
74
73
73
72
69
66
74
n/a
72
69
73
76
76
67
70
69
71
65
66
n/a
71
69
70
79
82
73
71
63
72
65
71
n/a
71
2017 Customer Service Rating2016 2015 2014 2013 2012
Q5c. Thinking of the most recent contact, how would you rate Monash City Council for customer service? Please keep in
mind we do not mean the actual outcome but rather the actual service that was received.
Base: All respondents who have had contact with Council in the last 12 months.
Councils asked state-wide: 68 Councils asked group: 18
Note: Please see page 5 for explanation about significant differences
43J00533 Community Satisfaction Survey 2017 - Monash City Council
34
39
32
31
27
29
30
33
39
33
28
41
28
25
42
33
38
38
35
44
41
37
40
36
36
32
39
45
32
43
46
30
39
35
16
15
12
16
17
16
18
17
23
15
7
15
18
12
19
14
20
7
6
6
7
10
8
8
8
3
10
5
7
6
7
4
11
5
2
3
5
3
4
4
6
5
2
1
4
2
3
3
2
2
2
3
2
1
2
5
3
2
2
1
1
12
4
2
7
2
1
1
2017 Monash
2016 Monash
2015 Monash
2014 Monash
2013 Monash
2012 Monash
State-wide
Metro
Monash West
Monash East
Monash South-West
Men
Women
18-34
35-49
50-64
65+
% Very good Good Average Poor Very poor Can't say
2017 Customer Service Rating
Q5c. Thinking of the most recent contact, how would you rate Monash City Council for customer service? Please keep in
mind we do not mean the actual outcome but rather the actual service that was received.
Base: All respondents who have had contact with Council in the last 12 months.
Councils asked state-wide: 68 Councils asked group: 18
44J00533 Community Satisfaction Survey 2017 - Monash City Council
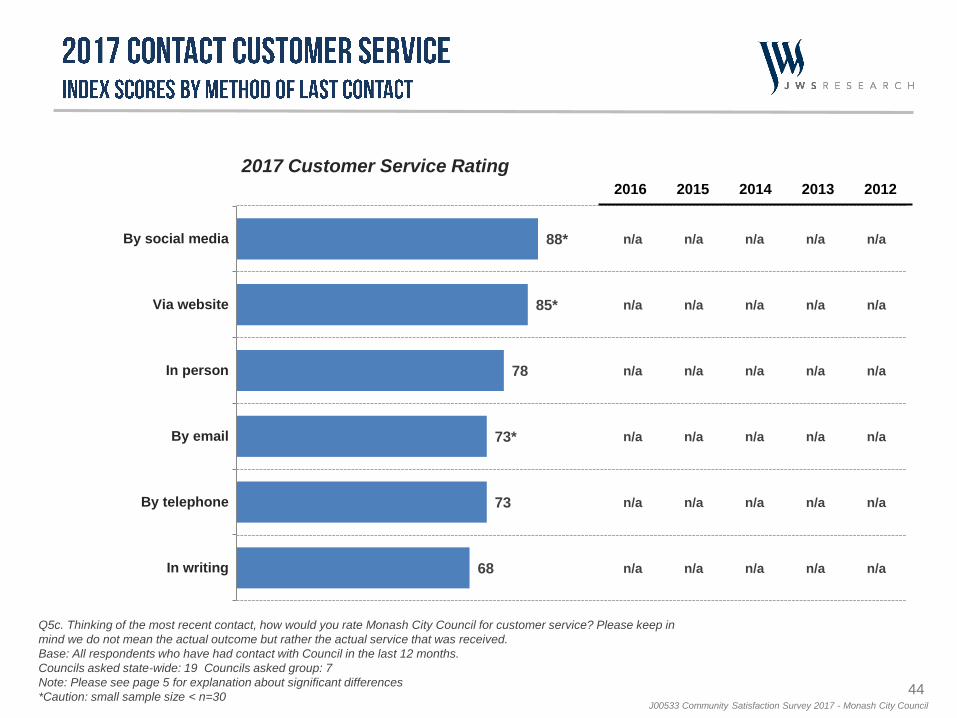
88*
85*
78
73*
73
68
By social media
Via website
In person
By email
By telephone
In writing
n/a
n/a
n/a
n/a
n/a
n/a
n/a
n/a
n/a
n/a
n/a
n/a
n/a
n/a
n/a
n/a
n/a
n/a
n/a
n/a
n/a
n/a
n/a
n/a
n/a
n/a
n/a
n/a
n/a
n/a
2017 Customer Service Rating2016 2015 2014 2013 2012
Q5c. Thinking of the most recent contact, how would you rate Monash City Council for customer service? Please keep in
mind we do not mean the actual outcome but rather the actual service that was received.
Base: All respondents who have had contact with Council in the last 12 months.
Councils asked state-wide: 19 Councils asked group: 7
Note: Please see page 5 for explanation about significant differences
*Caution: small sample size < n=30
45J00533 Community Satisfaction Survey 2017 - Monash City Council
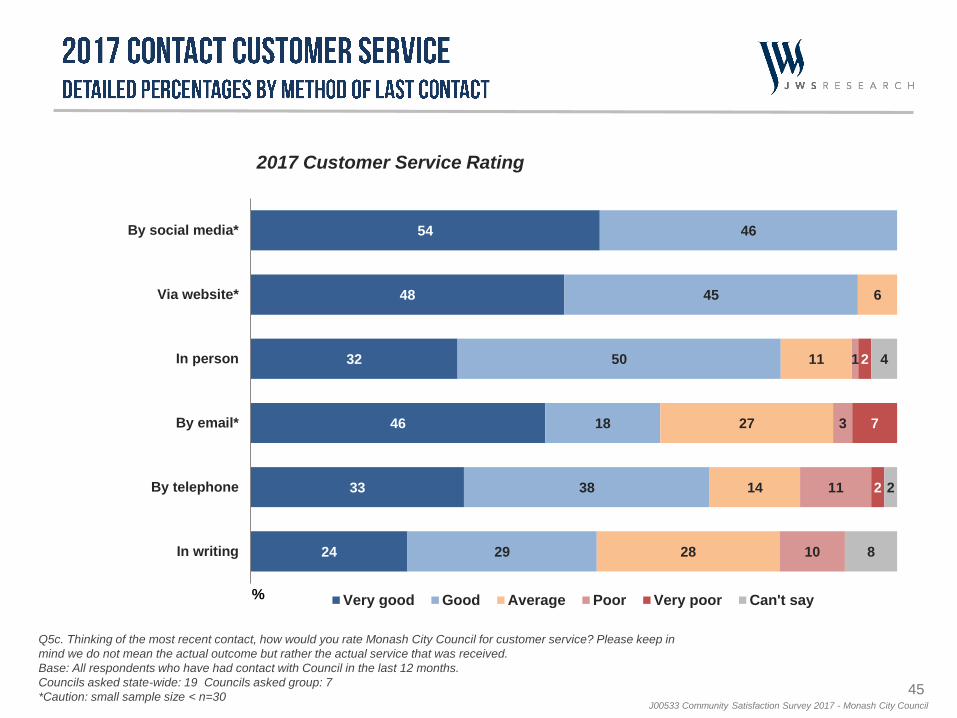
54
48
32
46
33
24
46
45
50
18
38
29
6
11
27
14
28
1
3
11
10
2
7
2
4
2
8
By social media*
Via website*
In person
By email*
By telephone
In writing
% Very good Good Average Poor Very poor Can't say
2017 Customer Service Rating
Q5c. Thinking of the most recent contact, how would you rate Monash City Council for customer service? Please keep in
mind we do not mean the actual outcome but rather the actual service that was received.
Base: All respondents who have had contact with Council in the last 12 months.
Councils asked state-wide: 19 Councils asked group: 7
*Caution: small sample size < n=30
47J00533 Community Satisfaction Survey 2017 - Monash City Council
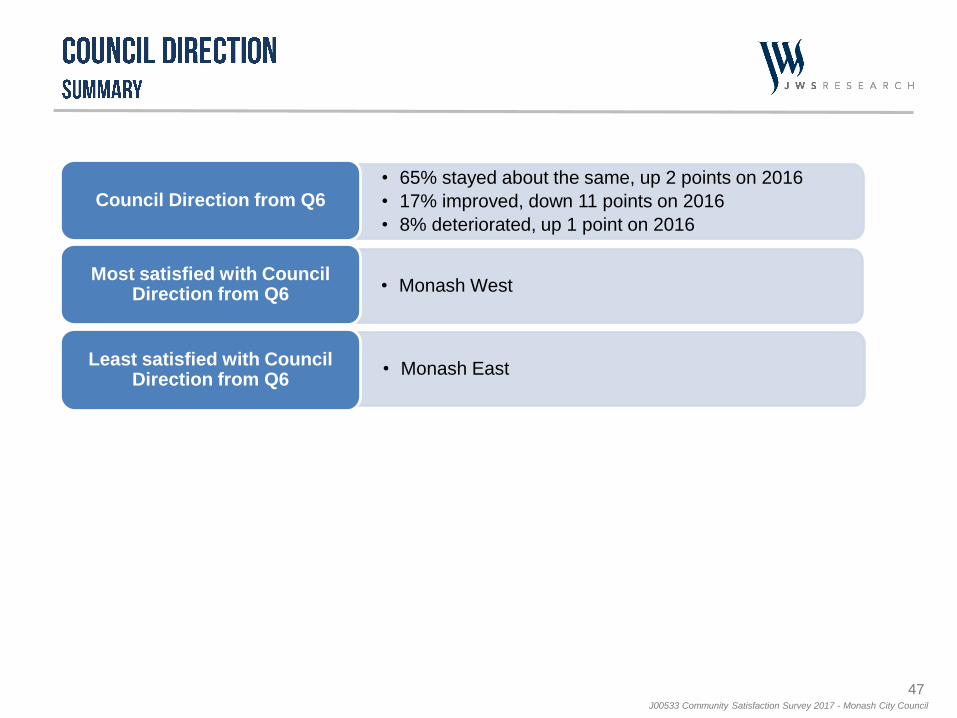
• Monash East
• Monash West
• 65% stayed about the same, up 2 points on 2016
• 17% improved, down 11 points on 2016
• 8% deteriorated, up 1 point on 2016
Least satisfied with Council Direction from Q6
Most satisfied with Council Direction from Q6
Council Direction from Q6
48J00533 Community Satisfaction Survey 2017 - Monash City Council
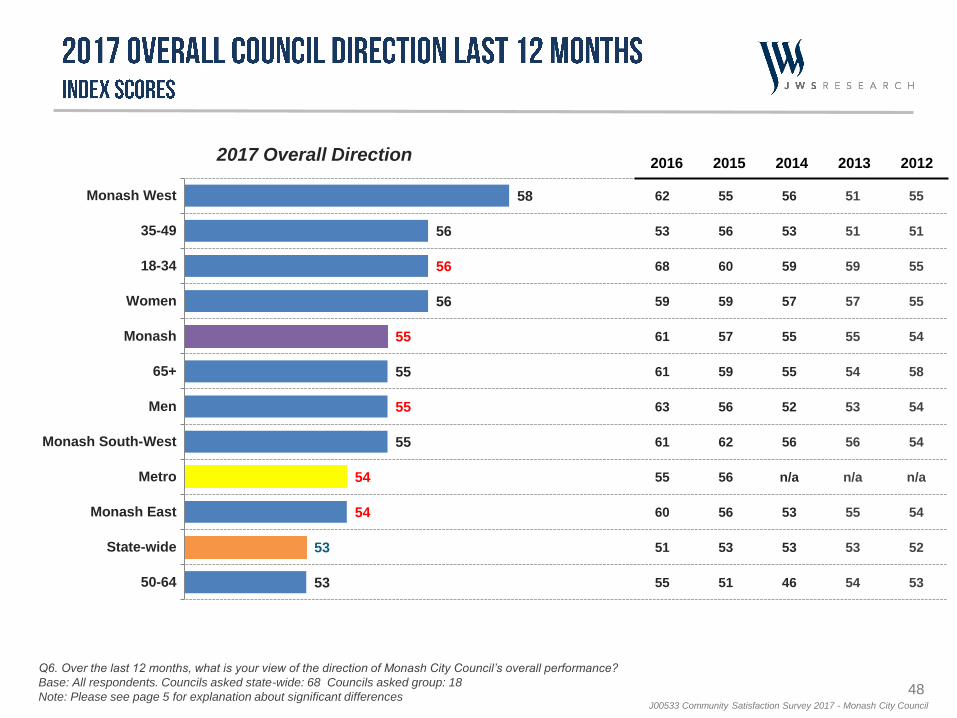
58
56
56
56
55
55
55
55
54
54
53
53
Monash West
35-49
18-34
Women
Monash
65+
Men
Monash South-West
Metro
Monash East
State-wide
50-64
62
53
68
59
61
61
63
61
55
60
51
55
55
56
60
59
57
59
56
62
56
56
53
51
56
53
59
57
55
55
52
56
n/a
53
53
46
51
51
59
57
55
54
53
56
n/a
55
53
54
55
51
55
55
54
58
54
54
n/a
54
52
53
2016 2015 2014 2013 20122017 Overall Direction
Q6. Over the last 12 months, what is your view of the direction of Monash City Council’s overall performance?
Base: All respondents. Councils asked state-wide: 68 Councils asked group: 18
Note: Please see page 5 for explanation about significant differences
49J00533 Community Satisfaction Survey 2017 - Monash City Council
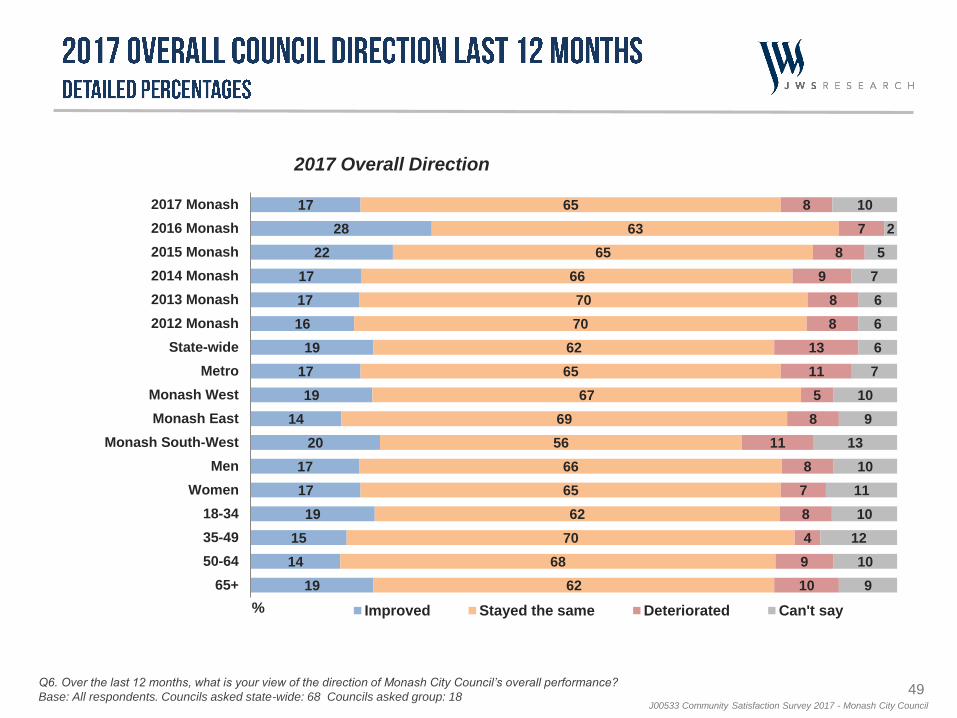
17
28
22
17
17
16
19
17
19
14
20
17
17
19
15
14
19
65
63
65
66
70
70
62
65
67
69
56
66
65
62
70
68
62
8
7
8
9
8
8
13
11
5
8
11
8
7
8
4
9
10
10
2
5
7
6
6
6
7
10
9
13
10
11
10
12
10
9
2017 Monash
2016 Monash
2015 Monash
2014 Monash
2013 Monash
2012 Monash
State-wide
Metro
Monash West
Monash East
Monash South-West
Men
Women
18-34
35-49
50-64
65+
% Improved Stayed the same Deteriorated Can't say
2017 Overall Direction
Q6. Over the last 12 months, what is your view of the direction of Monash City Council’s overall performance?
Base: All respondents. Councils asked state-wide: 68 Councils asked group: 18
51J00533 Community Satisfaction Survey 2017 - Monash City Council
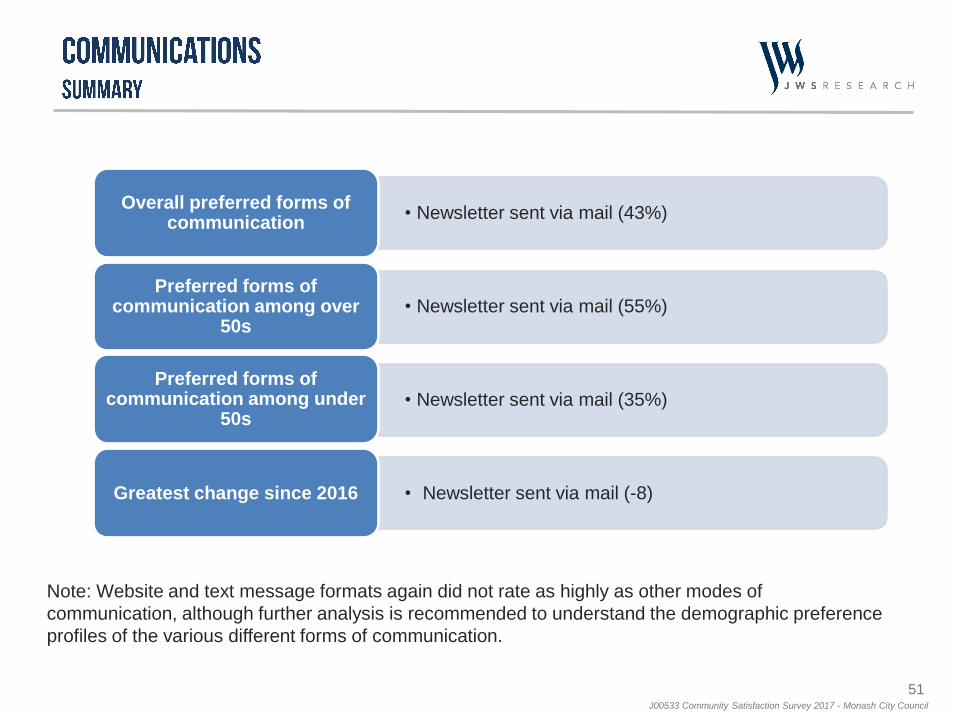
Note: Website and text message formats again did not rate as highly as other modes of
communication, although further analysis is recommended to understand the demographic preference
profiles of the various different forms of communication.
• Newsletter sent via mail (43%) Overall preferred forms of
communication
• Newsletter sent via mail (55%) Preferred forms of
communication among over 50s
• Newsletter sent via mail (35%)Preferred forms of
communication among under 50s
• Newsletter sent via mail (-8) Greatest change since 2016
52J00533 Community Satisfaction Survey 2017 - Monash City Council
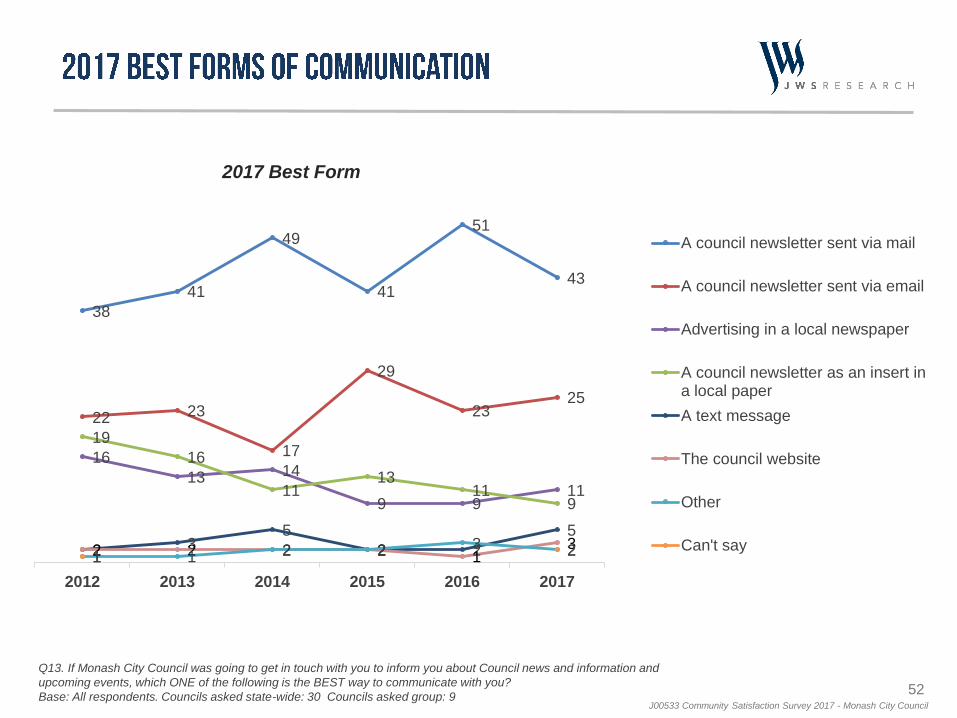
2017 Best Form
38
41
49
41
51
43
22 23
17
29
2325
16
13 14
9 911
19
16
1113
119
2 35
2 2
5
2 2 2 2 13
1 1 2 2 3 21 2
2012 2013 2014 2015 2016 2017
A council newsletter sent via mail
A council newsletter sent via email
Advertising in a local newspaper
A council newsletter as an insert ina local paper
A text message
The council website
Other
Can't say
Q13. If Monash City Council was going to get in touch with you to inform you about Council news and information and
upcoming events, which ONE of the following is the BEST way to communicate with you?
Base: All respondents. Councils asked state-wide: 30 Councils asked group: 9
53J00533 Community Satisfaction Survey 2017 - Monash City Council
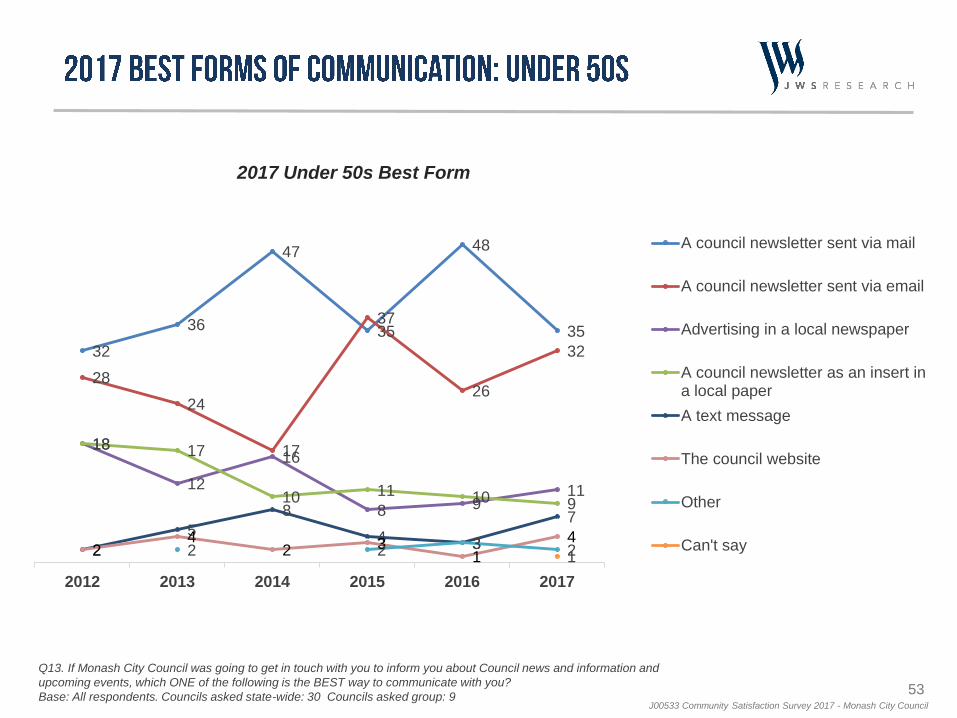
2017 Under 50s Best Form
32
36
47
35
48
35
28
24
17
37
26
32
18
12
16
8 911
18 17
10 11 10 9
2
5
8
4 3
7
24
2 31
42 2 3 21
2012 2013 2014 2015 2016 2017
A council newsletter sent via mail
A council newsletter sent via email
Advertising in a local newspaper
A council newsletter as an insert ina local paper
A text message
The council website
Other
Can't say
Q13. If Monash City Council was going to get in touch with you to inform you about Council news and information and
upcoming events, which ONE of the following is the BEST way to communicate with you?
Base: All respondents. Councils asked state-wide: 30 Councils asked group: 9
54J00533 Community Satisfaction Survey 2017 - Monash City Council
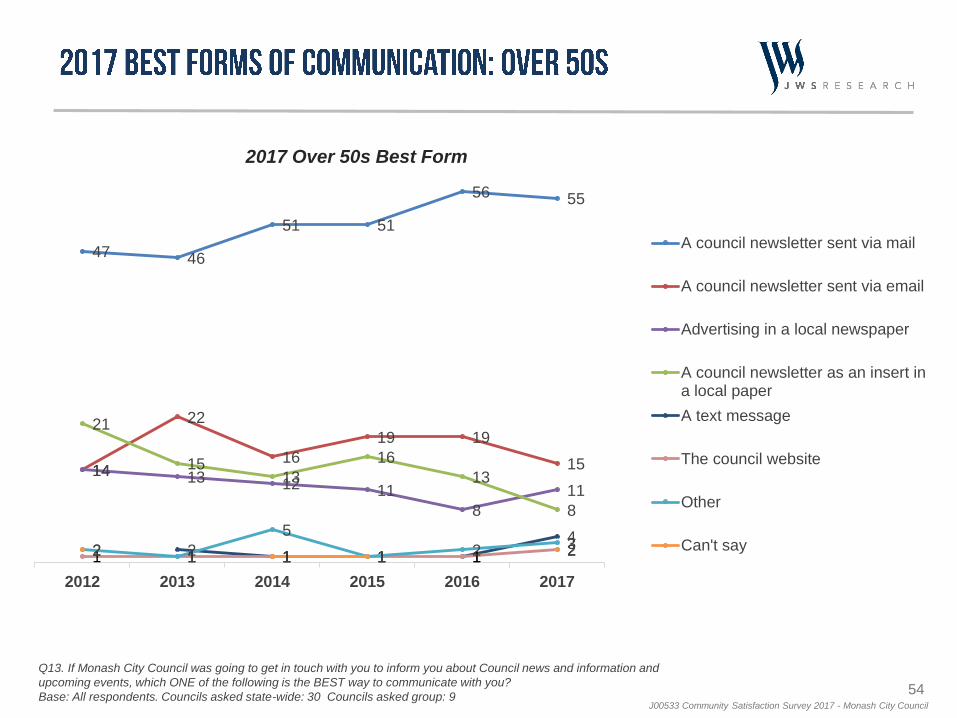
2017 Over 50s Best Form
47 46
51 51
56 55
14
22
16
19 19
1514 13 12 11
8
11
21
1513
16
13
8
2 1 1
4
1 1 1 1 1 22 1
5
1 2 32 1 1 2
2012 2013 2014 2015 2016 2017
A council newsletter sent via mail
A council newsletter sent via email
Advertising in a local newspaper
A council newsletter as an insert ina local paper
A text message
The council website
Other
Can't say
Q13. If Monash City Council was going to get in touch with you to inform you about Council news and information and
upcoming events, which ONE of the following is the BEST way to communicate with you?
Base: All respondents. Councils asked state-wide: 30 Councils asked group: 9
56J00533 Community Satisfaction Survey 2017 - Monash City Council
66
62
60
60
59
59
58
58
57
57
55
55
65+
Monash South-West
Women
Monash West
Monash
18-34
Men
Monash East
50-64
Metro
35-49
State-wide
64
69
60
60
62
63
63
60
62
58
58
54
63
53
58
64
58
58
59
58
54
58
57
56
56
59
57
56
54
53
50
50
46
n/a
57
57
55
57
56
56
56
59
57
55
52
n/a
58
57
60
60
60
56
59
64
58
58
55
n/a
53
57
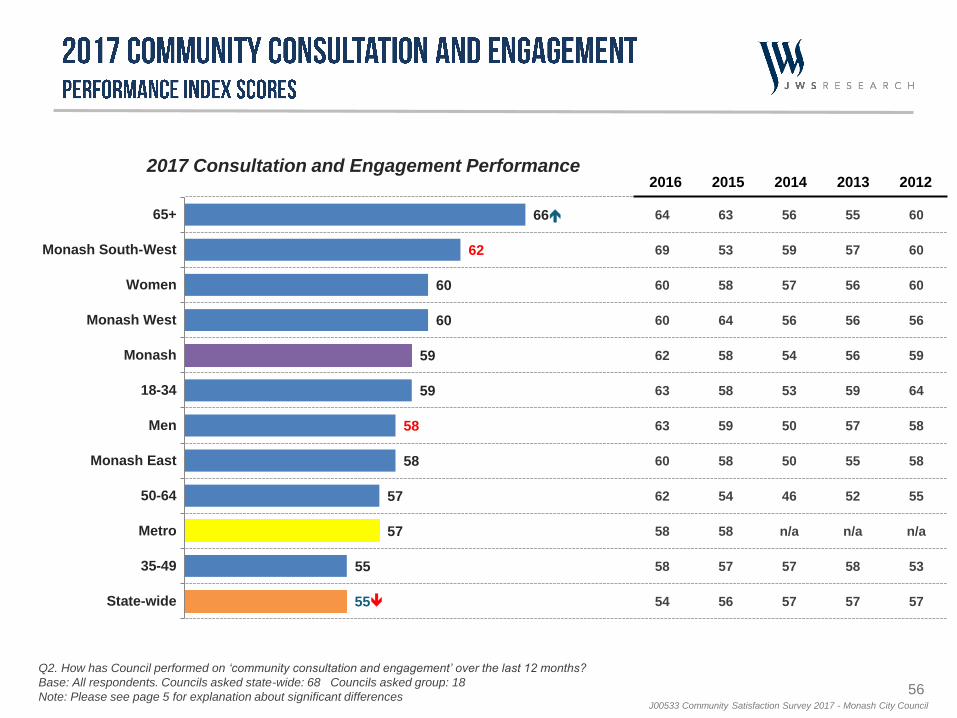
2017 Consultation and Engagement Performance2016 2015 2014 2013 2012
Q2. How has Council performed on ‘community consultation and engagement’ over the last 12 months?
Base: All respondents. Councils asked state-wide: 68 Councils asked group: 18
Note: Please see page 5 for explanation about significant differences
57J00533 Community Satisfaction Survey 2017 - Monash City Council
10
11
9
7
7
9
7
7
10
10
9
10
10
10
6
5
18
31
37
31
25
30
28
29
31
34
28
35
28
35
30
28
34
36
28
31
37
39
38
35
32
31
24
31
29
30
27
27
33
31
22
11
9
12
13
13
10
15
13
10
13
8
10
11
9
13
13
9
4
3
3
6
4
3
6
5
6
4
3
5
4
6
5
3
3
15
9
8
10
10
15
10
13
15
14
16
17
13
18
15
13
12
2017 Monash
2016 Monash
2015 Monash
2014 Monash
2013 Monash
2012 Monash
State-wide
Metro
Monash West
Monash East
Monash South-West
Men
Women
18-34
35-49
50-64
65+
%Very good Good Average Poor Very poor Can't say
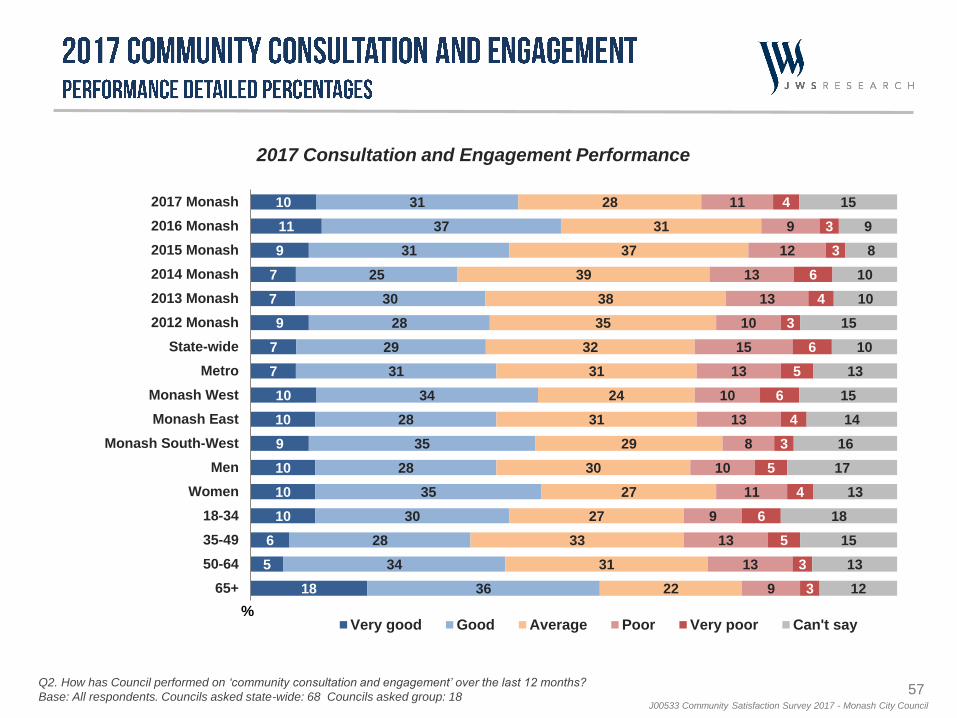
2017 Consultation and Engagement Performance
Q2. How has Council performed on ‘community consultation and engagement’ over the last 12 months?
Base: All respondents. Councils asked state-wide: 68 Councils asked group: 18
58J00533 Community Satisfaction Survey 2017 - Monash City Council
61
59
58
58
58
56
56
55
54
54
53
51
65+
18-34
Monash West
Monash South-West
Men
Monash
Metro
Women
Monash East
State-wide
35-49
50-64
61
60
55
64
58
59
56
60
60
53
57
54
60
63
59
61
57
59
58
60
57
55
54
53
55
56
57
60
51
56
n/a
60
52
56
59
51
56
62
58
58
57
57
n/a
57
56
55
54
54
59
66
65
60
59
60
n/a
61
58
55
56
54
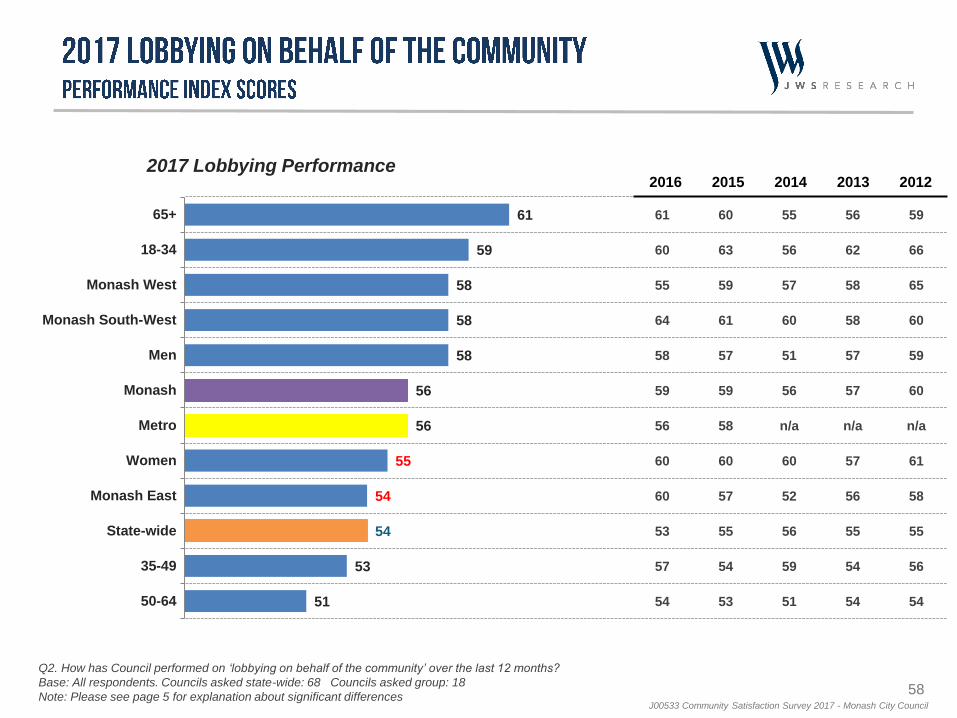
2017 Lobbying Performance2016 2015 2014 2013 2012
Q2. How has Council performed on ‘lobbying on behalf of the community’ over the last 12 months?
Base: All respondents. Councils asked state-wide: 68 Councils asked group: 18
Note: Please see page 5 for explanation about significant differences
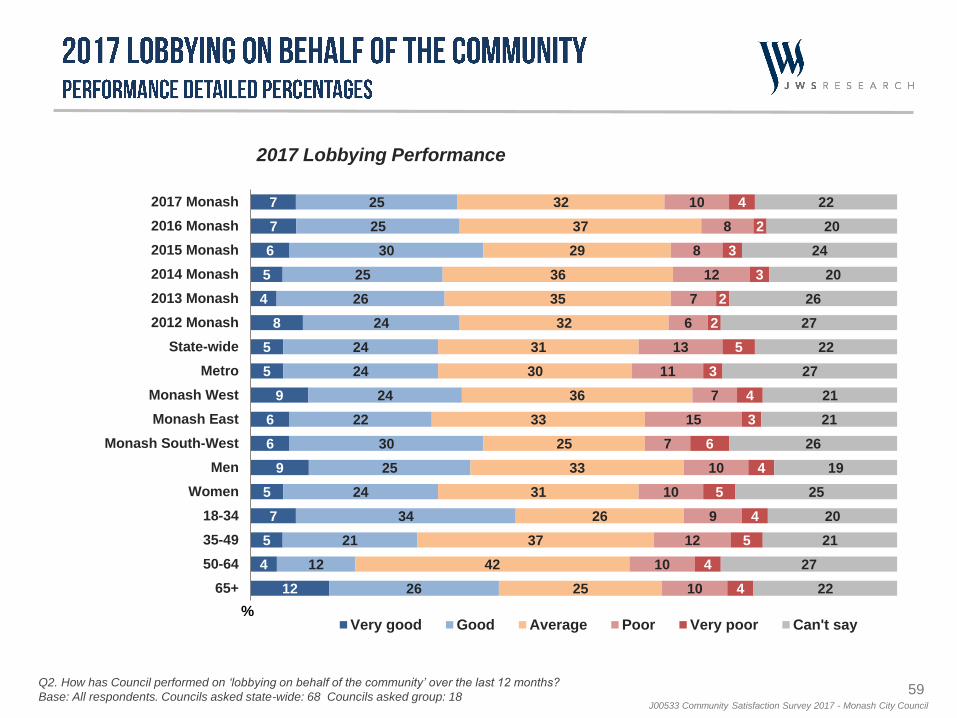
59J00533 Community Satisfaction Survey 2017 - Monash City Council
7
7
6
5
4
8
5
5
9
6
6
9
5
7
5
4
12
25
25
30
25
26
24
24
24
24
22
30
25
24
34
21
12
26
32
37
29
36
35
32
31
30
36
33
25
33
31
26
37
42
25
10
8
8
12
7
6
13
11
7
15
7
10
10
9
12
10
10
4
2
3
3
2
2
5
3
4
3
6
4
5
4
5
4
4
22
20
24
20
26
27
22
27
21
21
26
19
25
20
21
27
22
2017 Monash
2016 Monash
2015 Monash
2014 Monash
2013 Monash
2012 Monash
State-wide
Metro
Monash West
Monash East
Monash South-West
Men
Women
18-34
35-49
50-64
65+
%Very good Good Average Poor Very poor Can't say
2017 Lobbying Performance
Q2. How has Council performed on ‘lobbying on behalf of the community’ over the last 12 months?
Base: All respondents. Councils asked state-wide: 68 Councils asked group: 18
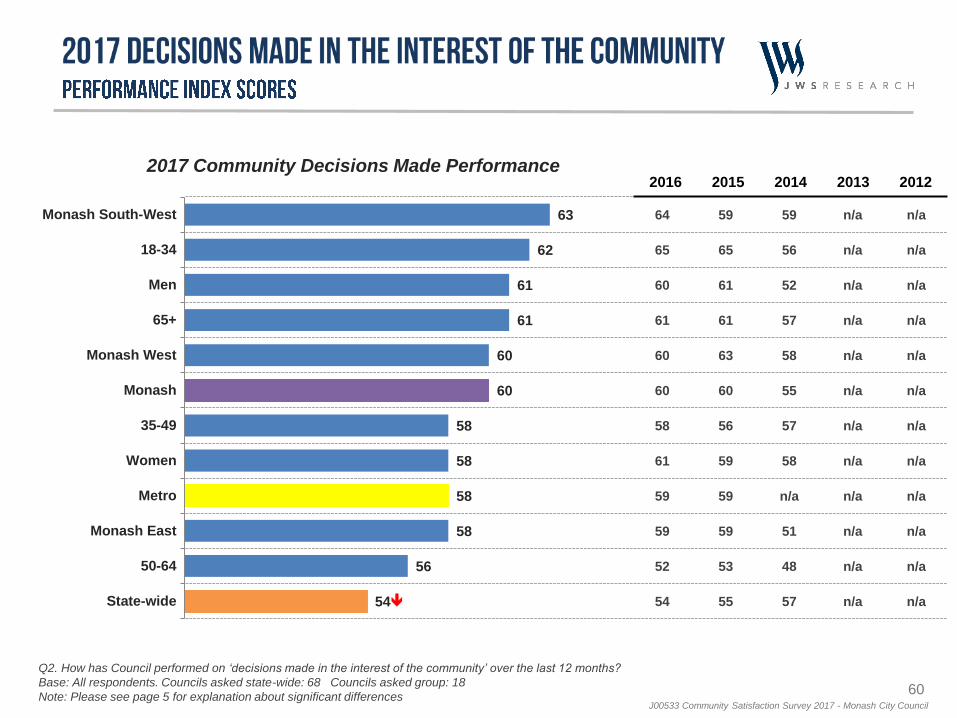
60J00533 Community Satisfaction Survey 2017 - Monash City Council
63
62
61
61
60
60
58
58
58
58
56
54
Monash South-West
18-34
Men
65+
Monash West
Monash
35-49
Women
Metro
Monash East
50-64
State-wide
64
65
60
61
60
60
58
61
59
59
52
54
59
65
61
61
63
60
56
59
59
59
53
55
59
56
52
57
58
55
57
58
n/a
51
48
57
n/a
n/a
n/a
n/a
n/a
n/a
n/a
n/a
n/a
n/a
n/a
n/a
n/a
n/a
n/a
n/a
n/a
n/a
n/a
n/a
n/a
n/a
n/a
n/a
2017 Community Decisions Made Performance2016 2015 2014 2013 2012
Q2. How has Council performed on ‘decisions made in the interest of the community’ over the last 12 months?
Base: All respondents. Councils asked state-wide: 68 Councils asked group: 18
Note: Please see page 5 for explanation about significant differences
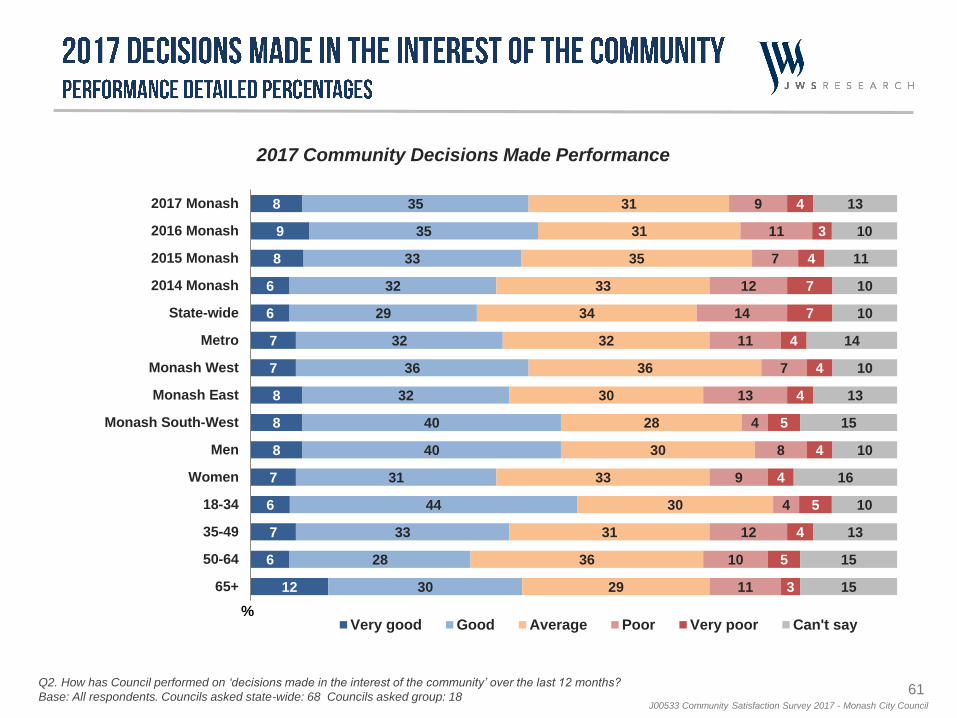
61J00533 Community Satisfaction Survey 2017 - Monash City Council
8
9
8
6
6
7
7
8
8
8
7
6
7
6
12
35
35
33
32
29
32
36
32
40
40
31
44
33
28
30
31
31
35
33
34
32
36
30
28
30
33
30
31
36
29
9
11
7
12
14
11
7
13
4
8
9
4
12
10
11
4
3
4
7
7
4
4
4
5
4
4
5
4
5
3
13
10
11
10
10
14
10
13
15
10
16
10
13
15
15
2017 Monash
2016 Monash
2015 Monash
2014 Monash
State-wide
Metro
Monash West
Monash East
Monash South-West
Men
Women
18-34
35-49
50-64
65+
%Very good Good Average Poor Very poor Can't say
2017 Community Decisions Made Performance
Q2. How has Council performed on ‘decisions made in the interest of the community’ over the last 12 months?
Base: All respondents. Councils asked state-wide: 68 Councils asked group: 18
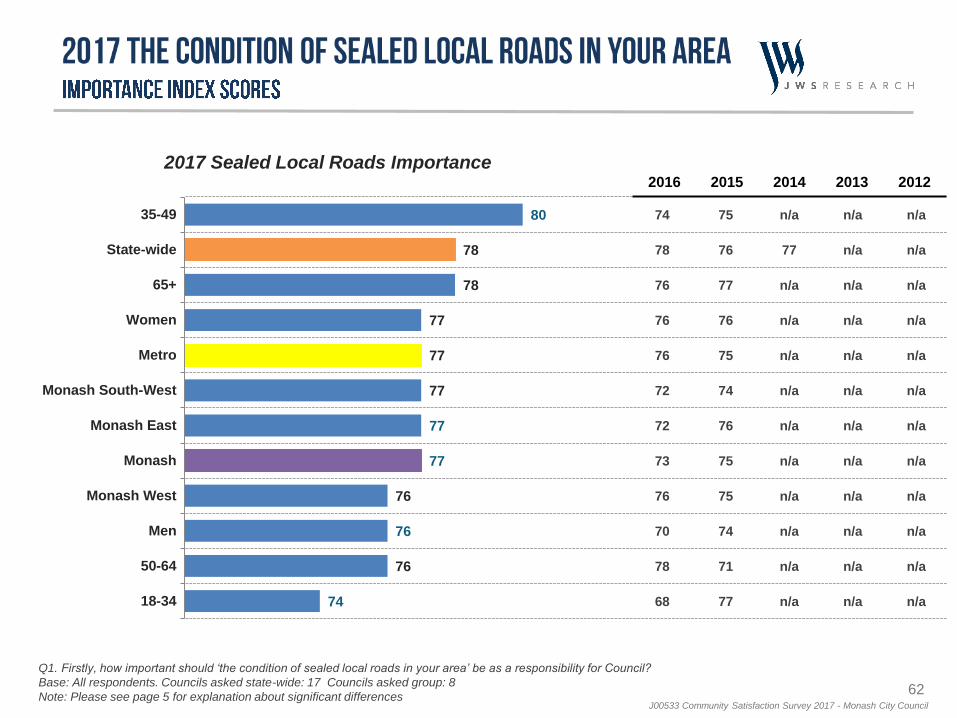
62J00533 Community Satisfaction Survey 2017 - Monash City Council
80
78
78
77
77
77
77
77
76
76
76
74
35-49
State-wide
65+
Women
Metro
Monash South-West
Monash East
Monash
Monash West
Men
50-64
18-34
74
78
76
76
76
72
72
73
76
70
78
68
75
76
77
76
75
74
76
75
75
74
71
77
n/a
77
n/a
n/a
n/a
n/a
n/a
n/a
n/a
n/a
n/a
n/a
n/a
n/a
n/a
n/a
n/a
n/a
n/a
n/a
n/a
n/a
n/a
n/a
n/a
n/a
n/a
n/a
n/a
n/a
n/a
n/a
n/a
n/a
n/a
n/a
2017 Sealed Local Roads Importance2016 2015 2014 2013 2012
Q1. Firstly, how important should ‘the condition of sealed local roads in your area’ be as a responsibility for Council?
Base: All respondents. Councils asked state-wide: 17 Councils asked group: 8
Note: Please see page 5 for explanation about significant differences
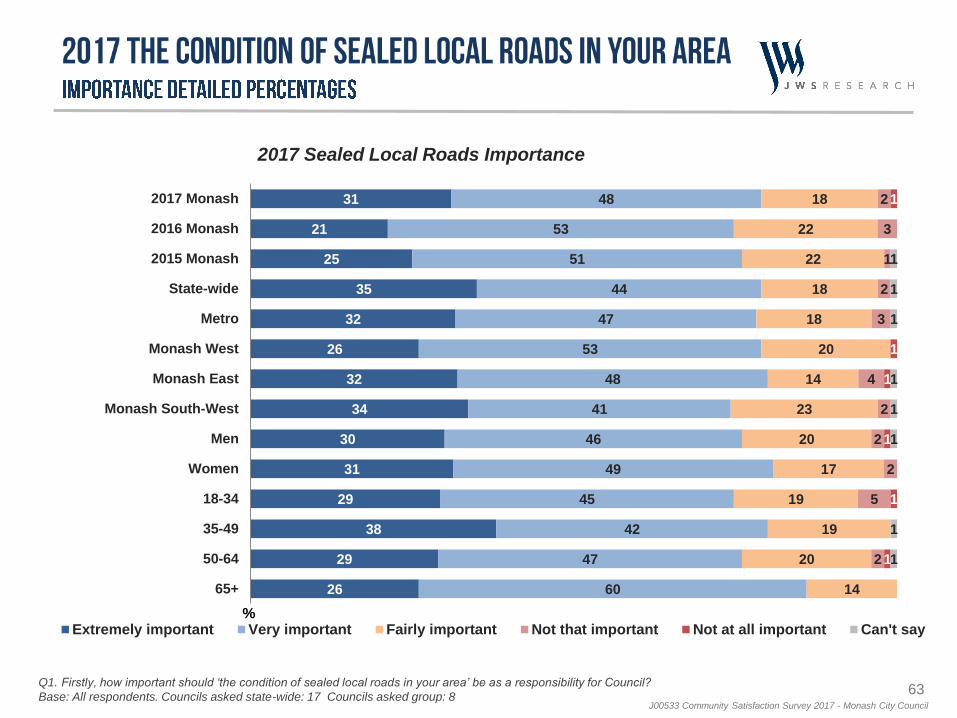
63J00533 Community Satisfaction Survey 2017 - Monash City Council
31
21
25
35
32
26
32
34
30
31
29
38
29
26
48
53
51
44
47
53
48
41
46
49
45
42
47
60
18
22
22
18
18
20
14
23
20
17
19
19
20
14
2
3
1
2
3
4
2
2
2
5
2
1
1
1
1
1
1
1
1
1
1
1
1
1
1
2017 Monash
2016 Monash
2015 Monash
State-wide
Metro
Monash West
Monash East
Monash South-West
Men
Women
18-34
35-49
50-64
65+
%Extremely important Very important Fairly important Not that important Not at all important Can't say
2017 Sealed Local Roads Importance
Q1. Firstly, how important should ‘the condition of sealed local roads in your area’ be as a responsibility for Council?
Base: All respondents. Councils asked state-wide: 17 Councils asked group: 8
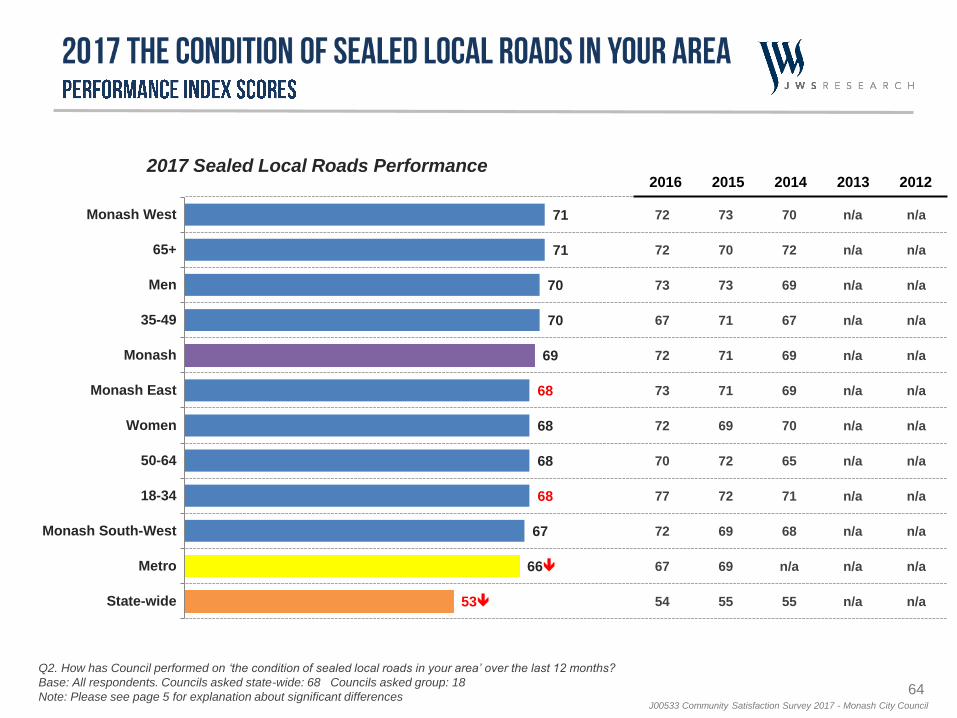
64J00533 Community Satisfaction Survey 2017 - Monash City Council
71
71
70
70
69
68
68
68
68
67
66
53
Monash West
65+
Men
35-49
Monash
Monash East
Women
50-64
18-34
Monash South-West
Metro
State-wide
72
72
73
67
72
73
72
70
77
72
67
54
73
70
73
71
71
71
69
72
72
69
69
55
70
72
69
67
69
69
70
65
71
68
n/a
55
n/a
n/a
n/a
n/a
n/a
n/a
n/a
n/a
n/a
n/a
n/a
n/a
n/a
n/a
n/a
n/a
n/a
n/a
n/a
n/a
n/a
n/a
n/a
n/a
2017 Sealed Local Roads Performance2016 2015 2014 2013 2012
Q2. How has Council performed on ‘the condition of sealed local roads in your area’ over the last 12 months?
Base: All respondents. Councils asked state-wide: 68 Councils asked group: 18
Note: Please see page 5 for explanation about significant differences
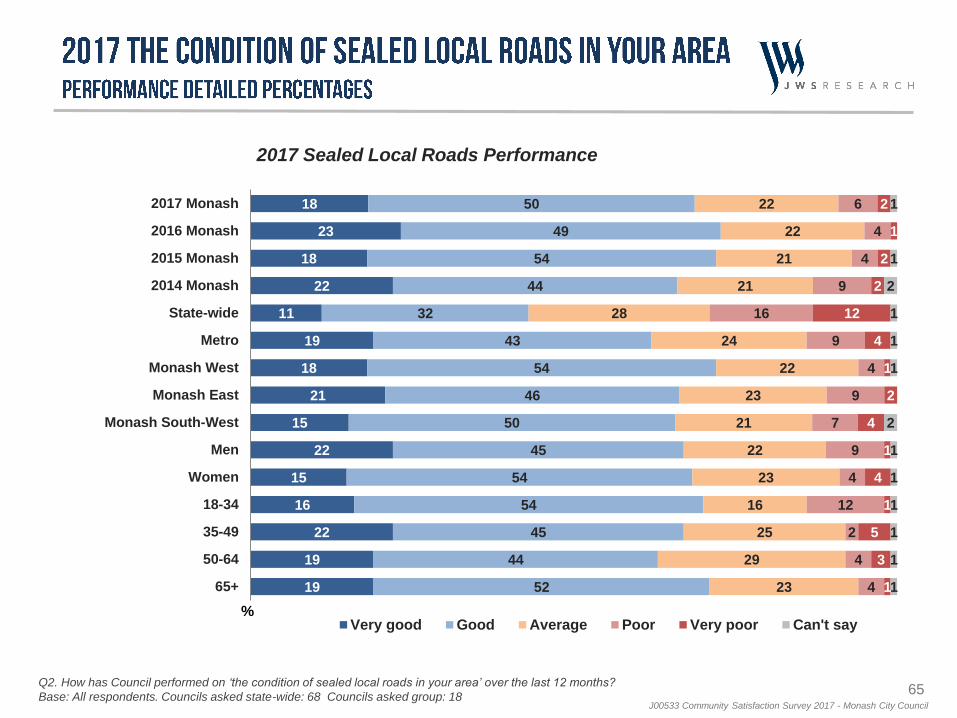
65J00533 Community Satisfaction Survey 2017 - Monash City Council
18
23
18
22
11
19
18
21
15
22
15
16
22
19
19
50
49
54
44
32
43
54
46
50
45
54
54
45
44
52
22
22
21
21
28
24
22
23
21
22
23
16
25
29
23
6
4
4
9
16
9
4
9
7
9
4
12
2
4
4
2
1
2
2
12
4
1
2
4
1
4
1
5
3
1
1
1
2
1
1
1
2
1
1
1
1
1
1
2017 Monash
2016 Monash
2015 Monash
2014 Monash
State-wide
Metro
Monash West
Monash East
Monash South-West
Men
Women
18-34
35-49
50-64
65+
%Very good Good Average Poor Very poor Can't say
2017 Sealed Local Roads Performance
Q2. How has Council performed on ‘the condition of sealed local roads in your area’ over the last 12 months?
Base: All respondents. Councils asked state-wide: 68 Councils asked group: 18
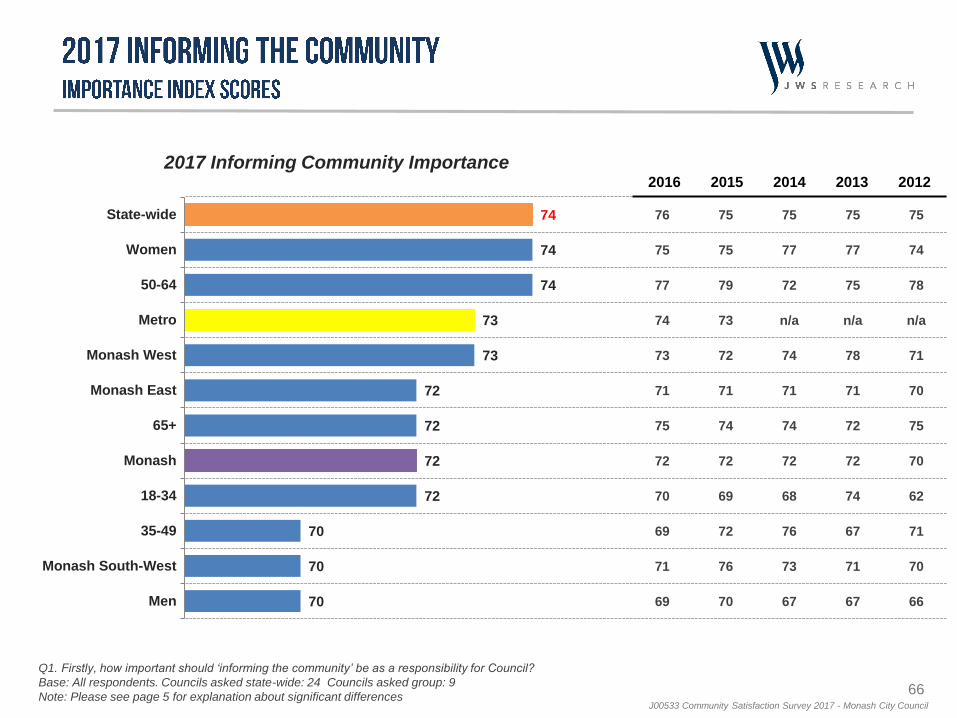
66J00533 Community Satisfaction Survey 2017 - Monash City Council
74
74
74
73
73
72
72
72
72
70
70
70
State-wide
Women
50-64
Metro
Monash West
Monash East
65+
Monash
18-34
35-49
Monash South-West
Men
76
75
77
74
73
71
75
72
70
69
71
69
75
75
79
73
72
71
74
72
69
72
76
70
75
77
72
n/a
74
71
74
72
68
76
73
67
75
77
75
n/a
78
71
72
72
74
67
71
67
75
74
78
n/a
71
70
75
70
62
71
70
66
2017 Informing Community Importance2016 2015 2014 2013 2012
Q1. Firstly, how important should ‘informing the community’ be as a responsibility for Council?
Base: All respondents. Councils asked state-wide: 24 Councils asked group: 9
Note: Please see page 5 for explanation about significant differences
67J00533 Community Satisfaction Survey 2017 - Monash City Council
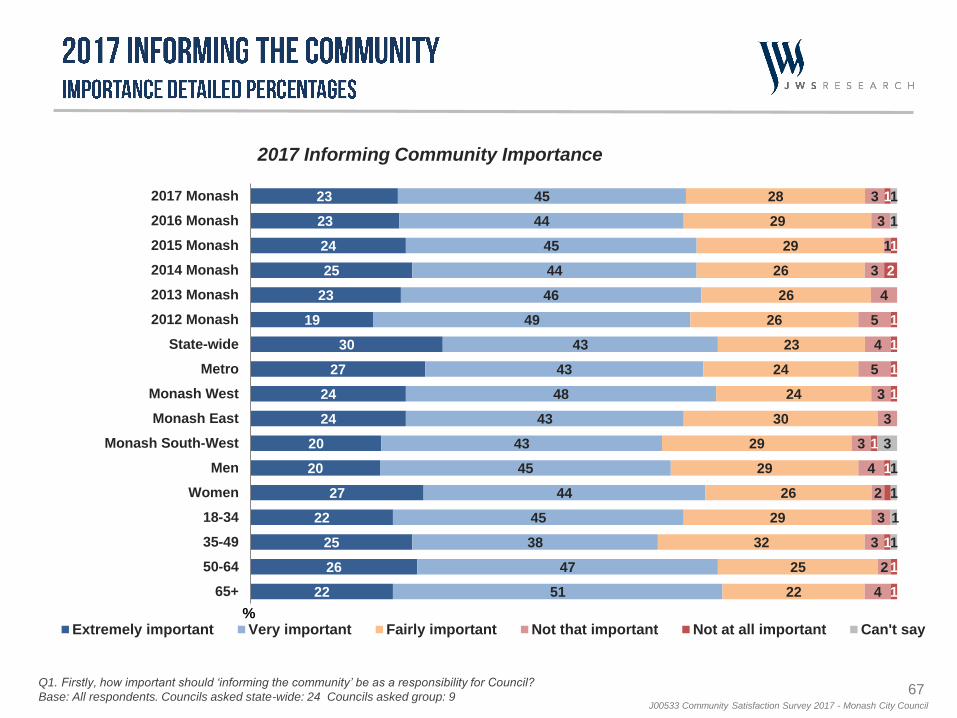
23
23
24
25
23
19
30
27
24
24
20
20
27
22
25
26
22
45
44
45
44
46
49
43
43
48
43
43
45
44
45
38
47
51
28
29
29
26
26
26
23
24
24
30
29
29
26
29
32
25
22
3
3
1
3
4
5
4
5
3
3
3
4
2
3
3
2
4
1
1
2
1
1
1
1
1
1
1
1
1
1
1
3
1
1
1
1
2017 Monash
2016 Monash
2015 Monash
2014 Monash
2013 Monash
2012 Monash
State-wide
Metro
Monash West
Monash East
Monash South-West
Men
Women
18-34
35-49
50-64
65+
%Extremely important Very important Fairly important Not that important Not at all important Can't say
2017 Informing Community Importance
Q1. Firstly, how important should ‘informing the community’ be as a responsibility for Council?
Base: All respondents. Councils asked state-wide: 24 Councils asked group: 9
68J00533 Community Satisfaction Survey 2017 - Monash City Council
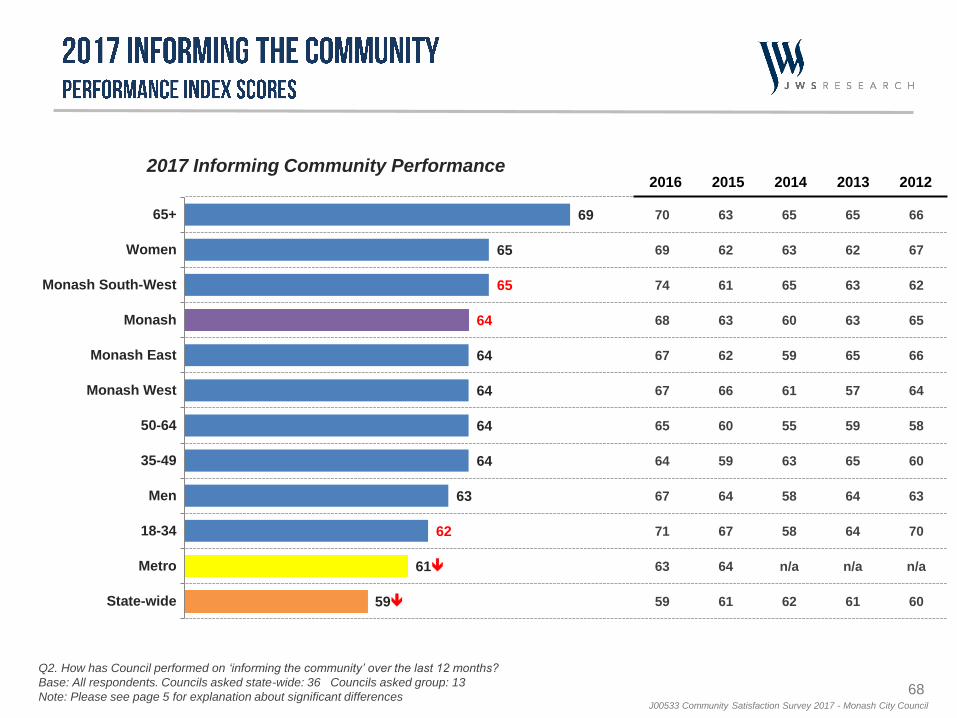
69
65
65
64
64
64
64
64
63
62
61
59
65+
Women
Monash South-West
Monash
Monash East
Monash West
50-64
35-49
Men
18-34
Metro
State-wide
70
69
74
68
67
67
65
64
67
71
63
59
63
62
61
63
62
66
60
59
64
67
64
61
65
63
65
60
59
61
55
63
58
58
n/a
62
65
62
63
63
65
57
59
65
64
64
n/a
61
66
67
62
65
66
64
58
60
63
70
n/a
60
2017 Informing Community Performance2016 2015 2014 2013 2012
Q2. How has Council performed on ‘informing the community’ over the last 12 months?
Base: All respondents. Councils asked state-wide: 36 Councils asked group: 13
Note: Please see page 5 for explanation about significant differences
69J00533 Community Satisfaction Survey 2017 - Monash City Council
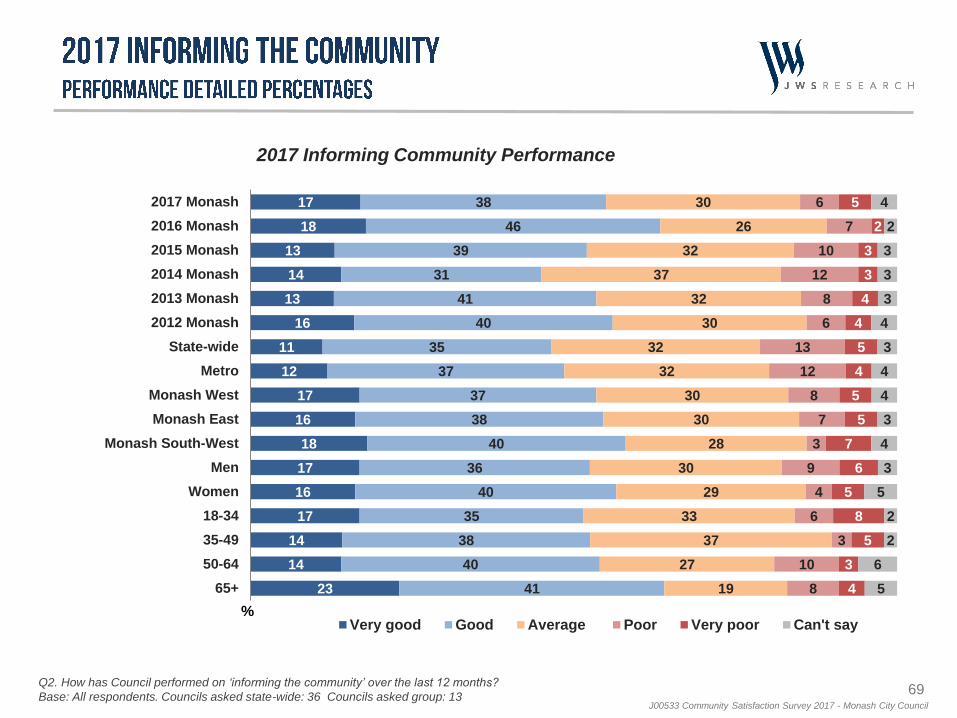
17
18
13
14
13
16
11
12
17
16
18
17
16
17
14
14
23
38
46
39
31
41
40
35
37
37
38
40
36
40
35
38
40
41
30
26
32
37
32
30
32
32
30
30
28
30
29
33
37
27
19
6
7
10
12
8
6
13
12
8
7
3
9
4
6
3
10
8
5
2
3
3
4
4
5
4
5
5
7
6
5
8
5
3
4
4
2
3
3
3
4
3
4
4
3
4
3
5
2
2
6
5
2017 Monash
2016 Monash
2015 Monash
2014 Monash
2013 Monash
2012 Monash
State-wide
Metro
Monash West
Monash East
Monash South-West
Men
Women
18-34
35-49
50-64
65+
%Very good Good Average Poor Very poor Can't say
2017 Informing Community Performance
Q2. How has Council performed on ‘informing the community’ over the last 12 months?
Base: All respondents. Councils asked state-wide: 36 Councils asked group: 13
70J00533 Community Satisfaction Survey 2017 - Monash City Council
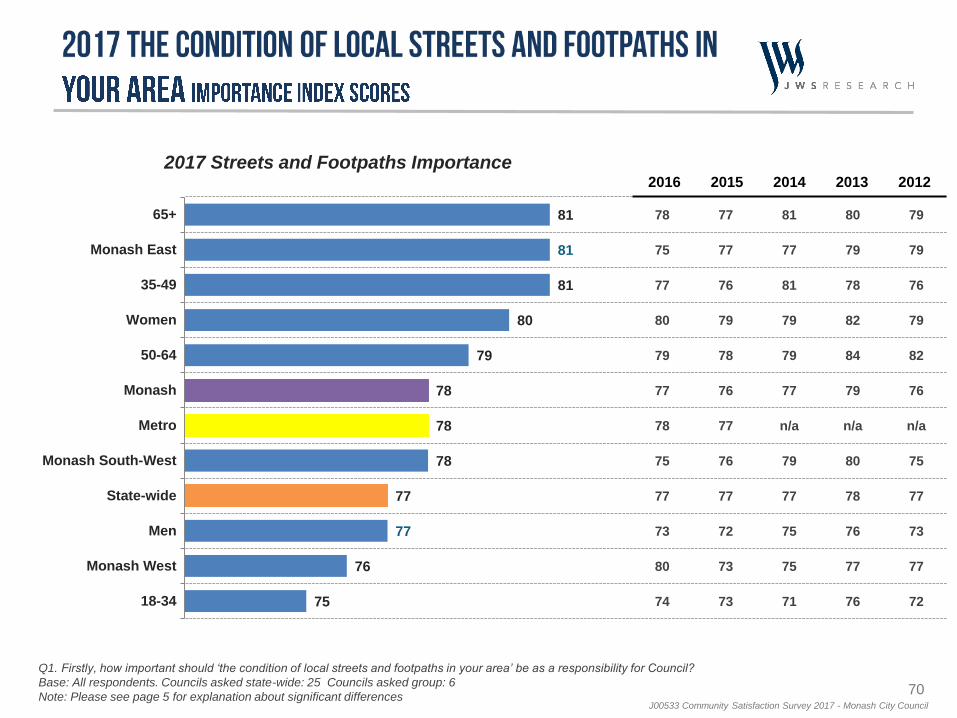
81
81
81
80
79
78
78
78
77
77
76
75
65+
Monash East
35-49
Women
50-64
Monash
Metro
Monash South-West
State-wide
Men
Monash West
18-34
78
75
77
80
79
77
78
75
77
73
80
74
77
77
76
79
78
76
77
76
77
72
73
73
81
77
81
79
79
77
n/a
79
77
75
75
71
80
79
78
82
84
79
n/a
80
78
76
77
76
79
79
76
79
82
76
n/a
75
77
73
77
72
2017 Streets and Footpaths Importance2016 2015 2014 2013 2012
Q1. Firstly, how important should ‘the condition of local streets and footpaths in your area’ be as a responsibility for Council?
Base: All respondents. Councils asked state-wide: 25 Councils asked group: 6
Note: Please see page 5 for explanation about significant differences
71J00533 Community Satisfaction Survey 2017 - Monash City Council
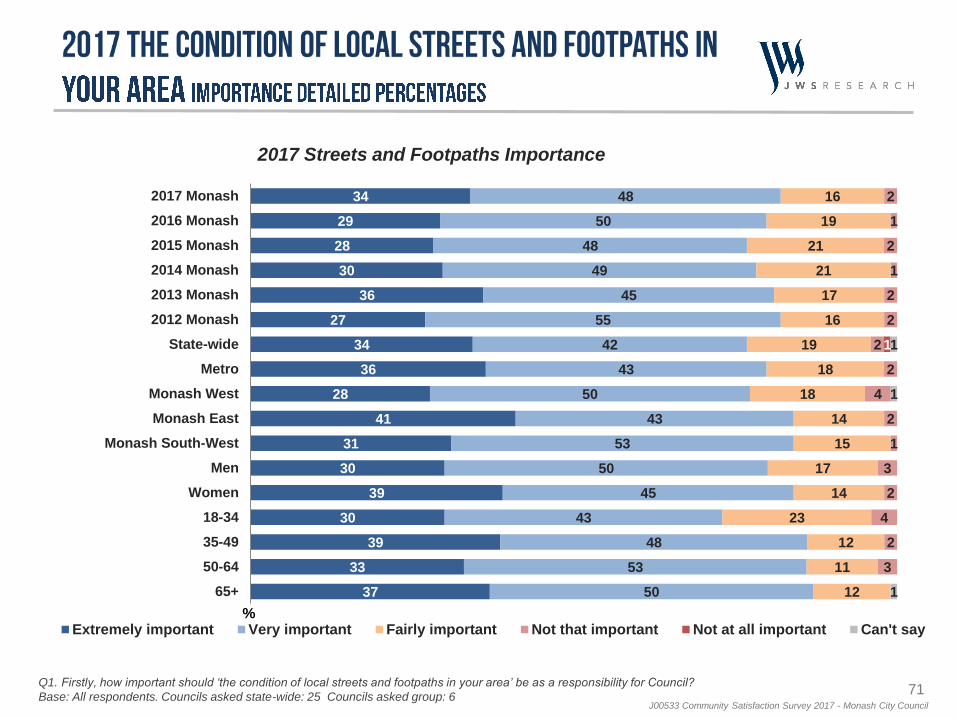
34
29
28
30
36
27
34
36
28
41
31
30
39
30
39
33
37
48
50
48
49
45
55
42
43
50
43
53
50
45
43
48
53
50
16
19
21
21
17
16
19
18
18
14
15
17
14
23
12
11
12
2
1
2
1
2
2
2
2
4
2
1
3
2
4
2
3
11
1
1
2017 Monash
2016 Monash
2015 Monash
2014 Monash
2013 Monash
2012 Monash
State-wide
Metro
Monash West
Monash East
Monash South-West
Men
Women
18-34
35-49
50-64
65+
%Extremely important Very important Fairly important Not that important Not at all important Can't say
2017 Streets and Footpaths Importance
Q1. Firstly, how important should ‘the condition of local streets and footpaths in your area’ be as a responsibility for Council?
Base: All respondents. Councils asked state-wide: 25 Councils asked group: 6
72J00533 Community Satisfaction Survey 2017 - Monash City Council
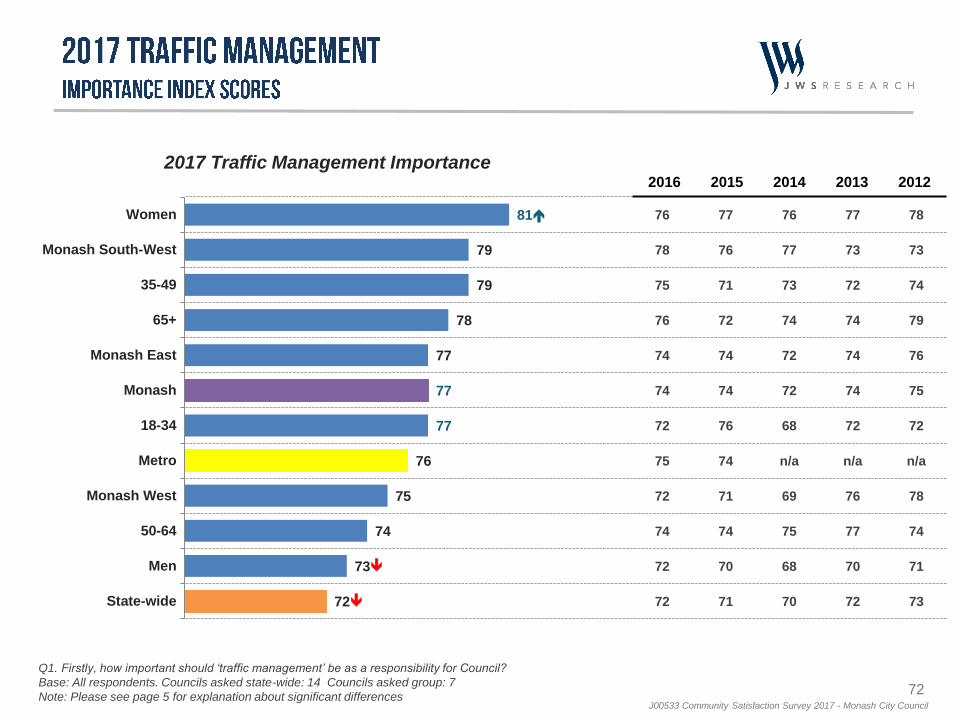
81
79
79
78
77
77
77
76
75
74
73
72
Women
Monash South-West
35-49
65+
Monash East
Monash
18-34
Metro
Monash West
50-64
Men
State-wide
76
78
75
76
74
74
72
75
72
74
72
72
77
76
71
72
74
74
76
74
71
74
70
71
76
77
73
74
72
72
68
n/a
69
75
68
70
77
73
72
74
74
74
72
n/a
76
77
70
72
78
73
74
79
76
75
72
n/a
78
74
71
73
2017 Traffic Management Importance2016 2015 2014 2013 2012
Q1. Firstly, how important should ‘traffic management’ be as a responsibility for Council?
Base: All respondents. Councils asked state-wide: 14 Councils asked group: 7
Note: Please see page 5 for explanation about significant differences
73J00533 Community Satisfaction Survey 2017 - Monash City Council
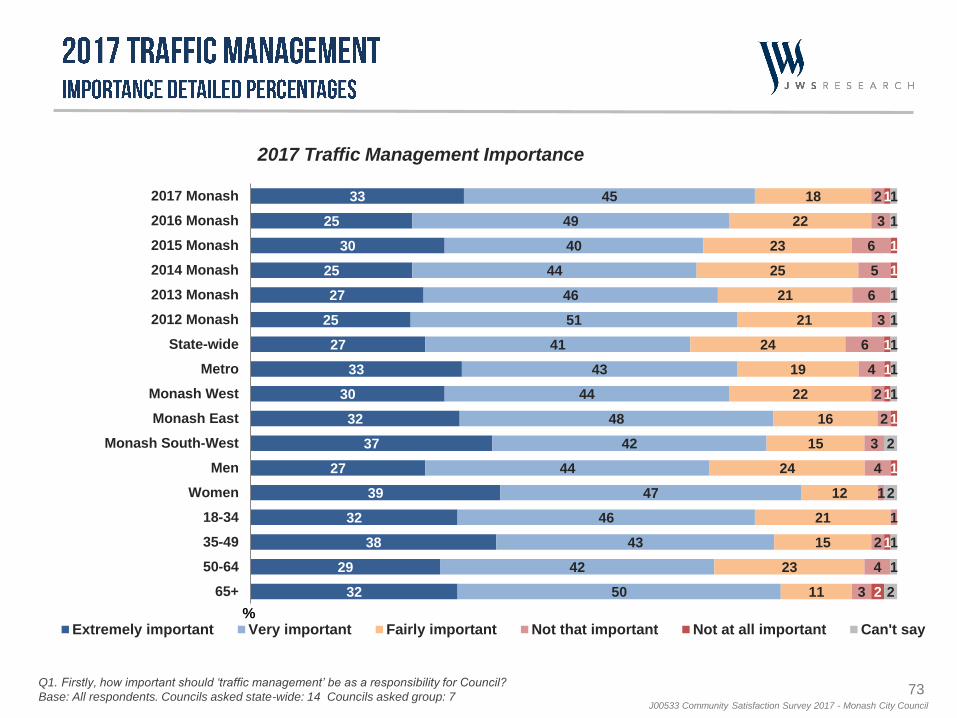
33
25
30
25
27
25
27
33
30
32
37
27
39
32
38
29
32
45
49
40
44
46
51
41
43
44
48
42
44
47
46
43
42
50
18
22
23
25
21
21
24
19
22
16
15
24
12
21
15
23
11
2
3
6
5
6
3
6
4
2
2
3
4
1
1
2
4
3
1
1
1
1
1
1
1
1
1
2
1
1
1
1
1
1
1
2
2
1
1
2
2017 Monash
2016 Monash
2015 Monash
2014 Monash
2013 Monash
2012 Monash
State-wide
Metro
Monash West
Monash East
Monash South-West
Men
Women
18-34
35-49
50-64
65+
%Extremely important Very important Fairly important Not that important Not at all important Can't say
2017 Traffic Management Importance
Q1. Firstly, how important should ‘traffic management’ be as a responsibility for Council?
Base: All respondents. Councils asked state-wide: 14 Councils asked group: 7
74J00533 Community Satisfaction Survey 2017 - Monash City Council
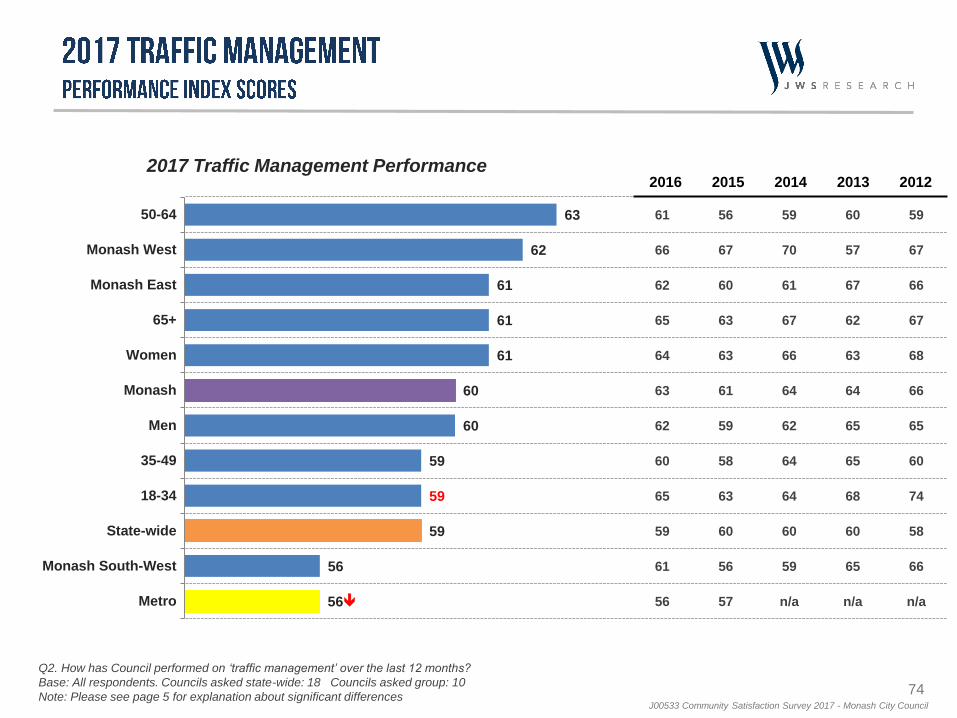
63
62
61
61
61
60
60
59
59
59
56
56
50-64
Monash West
Monash East
65+
Women
Monash
Men
35-49
18-34
State-wide
Monash South-West
Metro
61
66
62
65
64
63
62
60
65
59
61
56
56
67
60
63
63
61
59
58
63
60
56
57
59
70
61
67
66
64
62
64
64
60
59
n/a
60
57
67
62
63
64
65
65
68
60
65
n/a
59
67
66
67
68
66
65
60
74
58
66
n/a
2017 Traffic Management Performance2016 2015 2014 2013 2012
Q2. How has Council performed on ‘traffic management’ over the last 12 months?
Base: All respondents. Councils asked state-wide: 18 Councils asked group: 10
Note: Please see page 5 for explanation about significant differences
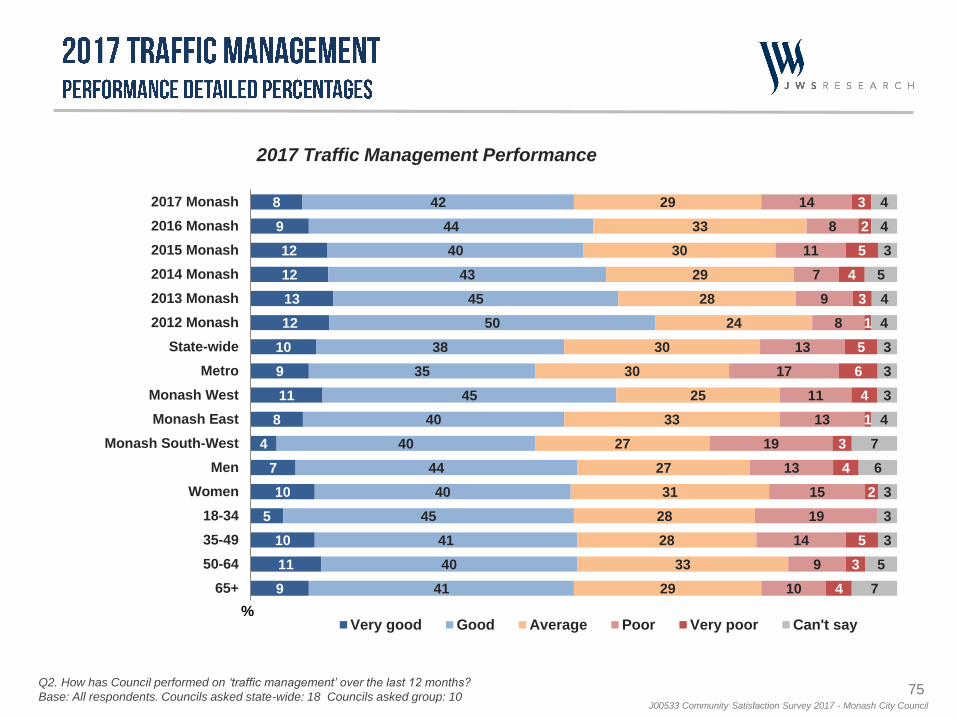
75J00533 Community Satisfaction Survey 2017 - Monash City Council
8
9
12
12
13
12
10
9
11
8
4
7
10
5
10
11
9
42
44
40
43
45
50
38
35
45
40
40
44
40
45
41
40
41
29
33
30
29
28
24
30
30
25
33
27
27
31
28
28
33
29
14
8
11
7
9
8
13
17
11
13
19
13
15
19
14
9
10
3
2
5
4
3
1
5
6
4
1
3
4
2
5
3
4
4
4
3
5
4
4
3
3
3
4
7
6
3
3
3
5
7
2017 Monash
2016 Monash
2015 Monash
2014 Monash
2013 Monash
2012 Monash
State-wide
Metro
Monash West
Monash East
Monash South-West
Men
Women
18-34
35-49
50-64
65+
%Very good Good Average Poor Very poor Can't say
2017 Traffic Management Performance
Q2. How has Council performed on ‘traffic management’ over the last 12 months?
Base: All respondents. Councils asked state-wide: 18 Councils asked group: 10
76J00533 Community Satisfaction Survey 2017 - Monash City Council
78
76
76
75
74
74
74
73
73
73
71
70
65+
Women
35-49
Monash East
50-64
Monash South-West
Monash
Monash West
Metro
Men
18-34
State-wide
79
76
71
73
75
75
73
73
72
70
69
70
75
76
73
71
75
74
72
72
72
67
67
70
75
75
74
72
75
71
71
69
n/a
67
64
70
75
79
69
72
78
74
73
72
n/a
67
71
71
76
77
68
71
75
72
72
74
n/a
67
70
71
2017 Parking Importance2016 2015 2014 2013 2012
Q1. Firstly, how important should ‘parking facilities’ be as a responsibility for Council?
Base: All respondents. Councils asked state-wide: 18 Councils asked group: 8
Note: Please see page 5 for explanation about significant differences
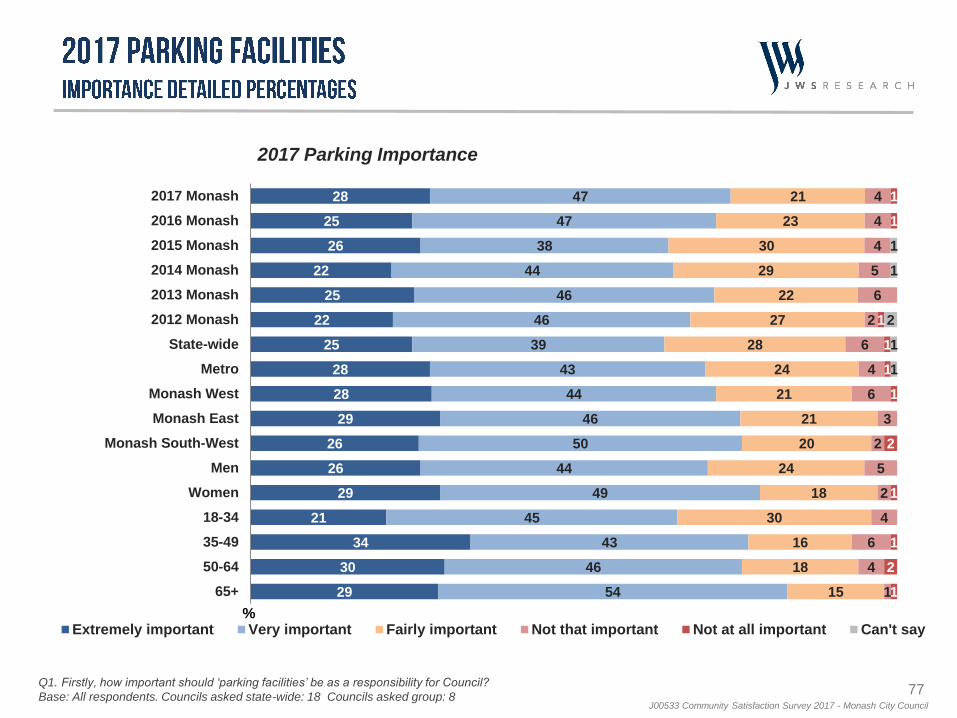
77J00533 Community Satisfaction Survey 2017 - Monash City Council
28
25
26
22
25
22
25
28
28
29
26
26
29
21
34
30
29
47
47
38
44
46
46
39
43
44
46
50
44
49
45
43
46
54
21
23
30
29
22
27
28
24
21
21
20
24
18
30
16
18
15
4
4
4
5
6
2
6
4
6
3
2
5
2
4
6
4
1
1
1
1
1
1
1
2
1
1
2
1
1
1
2
1
1
2017 Monash
2016 Monash
2015 Monash
2014 Monash
2013 Monash
2012 Monash
State-wide
Metro
Monash West
Monash East
Monash South-West
Men
Women
18-34
35-49
50-64
65+
%Extremely important Very important Fairly important Not that important Not at all important Can't say
2017 Parking Importance
Q1. Firstly, how important should ‘parking facilities’ be as a responsibility for Council?
Base: All respondents. Councils asked state-wide: 18 Councils asked group: 8
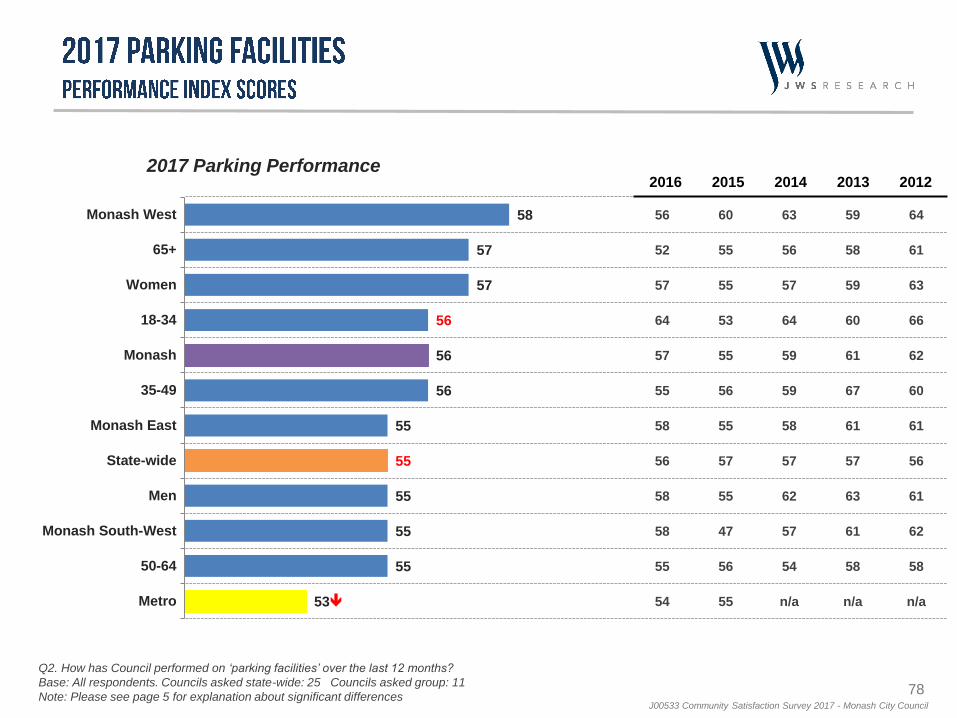
78J00533 Community Satisfaction Survey 2017 - Monash City Council
58
57
57
56
56
56
55
55
55
55
55
53
Monash West
65+
Women
18-34
Monash
35-49
Monash East
State-wide
Men
Monash South-West
50-64
Metro
56
52
57
64
57
55
58
56
58
58
55
54
60
55
55
53
55
56
55
57
55
47
56
55
63
56
57
64
59
59
58
57
62
57
54
n/a
59
58
59
60
61
67
61
57
63
61
58
n/a
64
61
63
66
62
60
61
56
61
62
58
n/a
2017 Parking Performance2016 2015 2014 2013 2012
Q2. How has Council performed on ‘parking facilities’ over the last 12 months?
Base: All respondents. Councils asked state-wide: 25 Councils asked group: 11
Note: Please see page 5 for explanation about significant differences
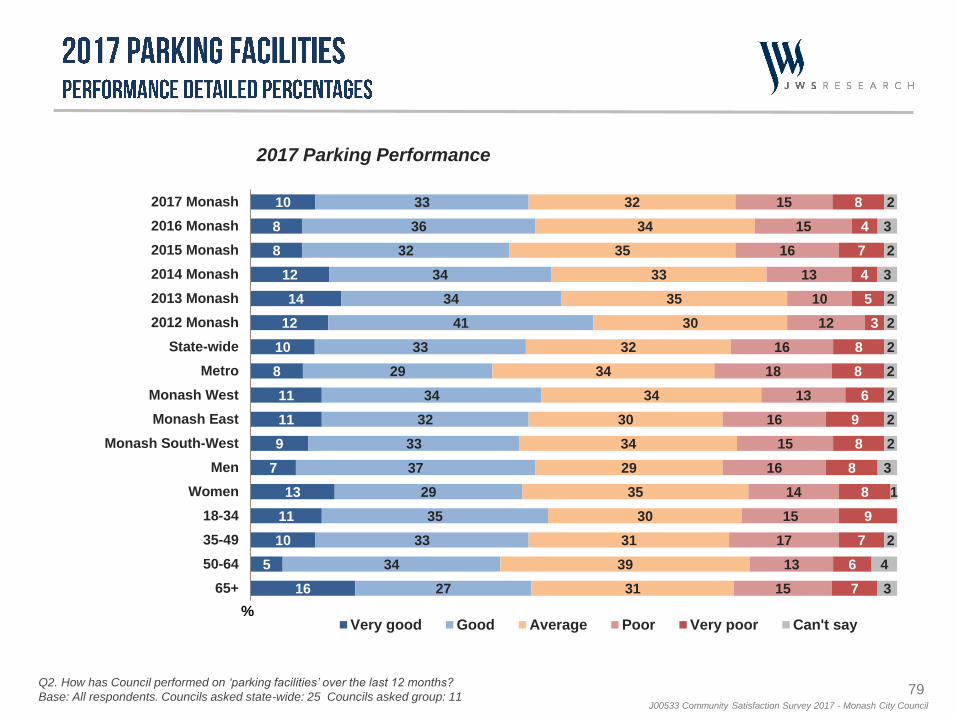
79J00533 Community Satisfaction Survey 2017 - Monash City Council
10
8
8
12
14
12
10
8
11
11
9
7
13
11
10
5
16
33
36
32
34
34
41
33
29
34
32
33
37
29
35
33
34
27
32
34
35
33
35
30
32
34
34
30
34
29
35
30
31
39
31
15
15
16
13
10
12
16
18
13
16
15
16
14
15
17
13
15
8
4
7
4
5
3
8
8
6
9
8
8
8
9
7
6
7
2
3
2
3
2
2
2
2
2
2
2
3
1
2
4
3
2017 Monash
2016 Monash
2015 Monash
2014 Monash
2013 Monash
2012 Monash
State-wide
Metro
Monash West
Monash East
Monash South-West
Men
Women
18-34
35-49
50-64
65+
%Very good Good Average Poor Very poor Can't say
2017 Parking Performance
Q2. How has Council performed on ‘parking facilities’ over the last 12 months?
Base: All respondents. Councils asked state-wide: 25 Councils asked group: 11
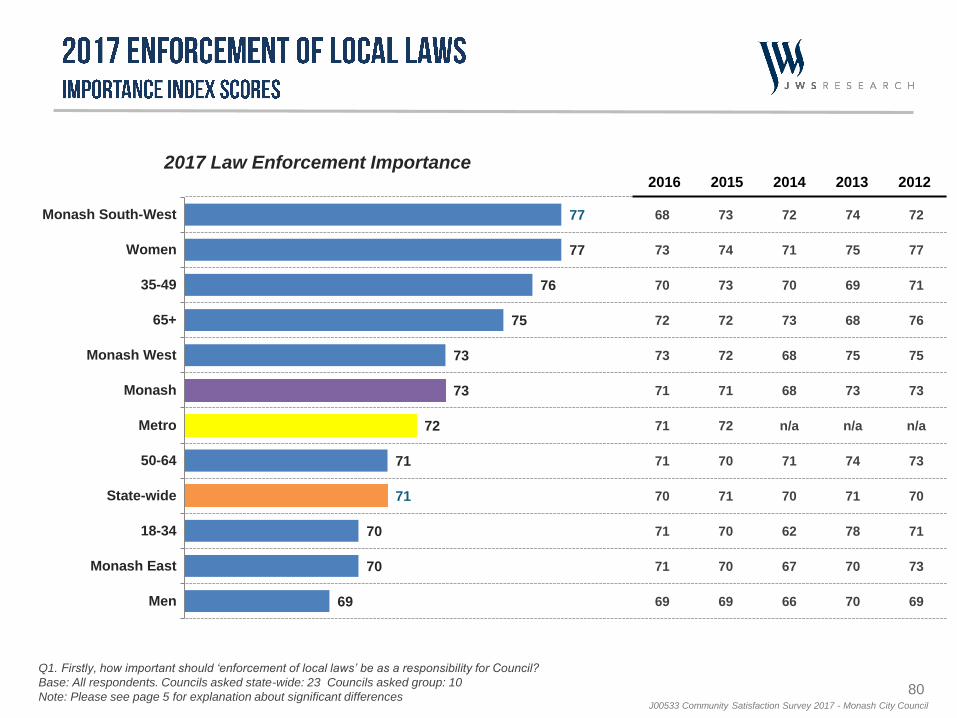
80J00533 Community Satisfaction Survey 2017 - Monash City Council
77
77
76
75
73
73
72
71
71
70
70
69
Monash South-West
Women
35-49
65+
Monash West
Monash
Metro
50-64
State-wide
18-34
Monash East
Men
68
73
70
72
73
71
71
71
70
71
71
69
73
74
73
72
72
71
72
70
71
70
70
69
72
71
70
73
68
68
n/a
71
70
62
67
66
74
75
69
68
75
73
n/a
74
71
78
70
70
72
77
71
76
75
73
n/a
73
70
71
73
69
2017 Law Enforcement Importance2016 2015 2014 2013 2012
Q1. Firstly, how important should ‘enforcement of local laws’ be as a responsibility for Council?
Base: All respondents. Councils asked state-wide: 23 Councils asked group: 10
Note: Please see page 5 for explanation about significant differences
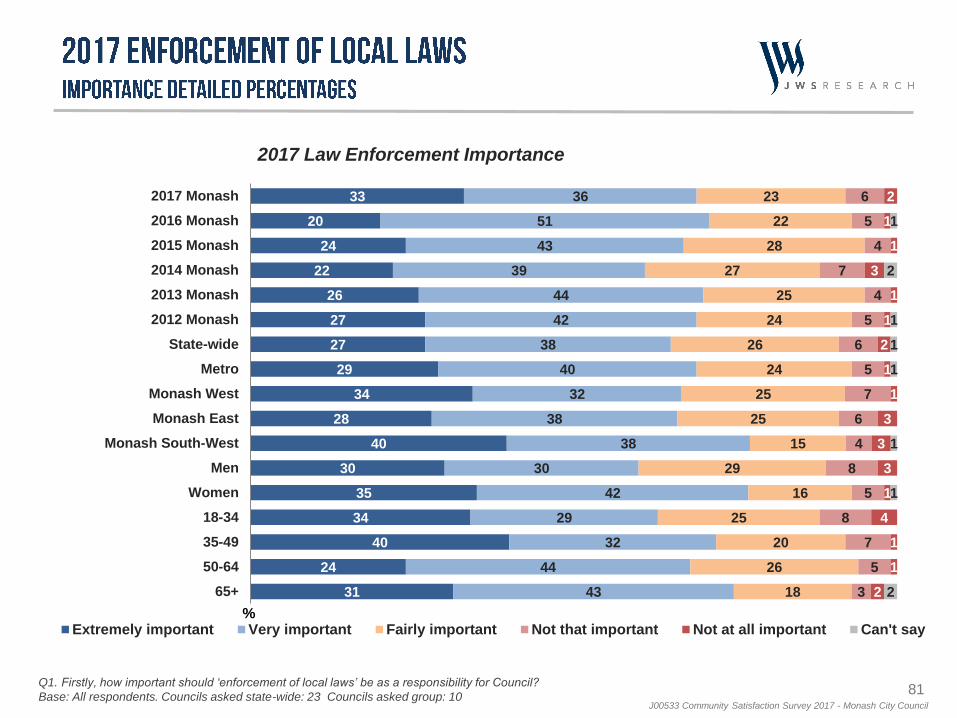
81J00533 Community Satisfaction Survey 2017 - Monash City Council
33
20
24
22
26
27
27
29
34
28
40
30
35
34
40
24
31
36
51
43
39
44
42
38
40
32
38
38
30
42
29
32
44
43
23
22
28
27
25
24
26
24
25
25
15
29
16
25
20
26
18
6
5
4
7
4
5
6
5
7
6
4
8
5
8
7
5
3
2
1
1
3
1
1
2
1
1
3
3
3
1
4
1
1
2
1
2
1
1
1
1
1
2
2017 Monash
2016 Monash
2015 Monash
2014 Monash
2013 Monash
2012 Monash
State-wide
Metro
Monash West
Monash East
Monash South-West
Men
Women
18-34
35-49
50-64
65+
%Extremely important Very important Fairly important Not that important Not at all important Can't say
2017 Law Enforcement Importance
Q1. Firstly, how important should ‘enforcement of local laws’ be as a responsibility for Council?
Base: All respondents. Councils asked state-wide: 23 Councils asked group: 10
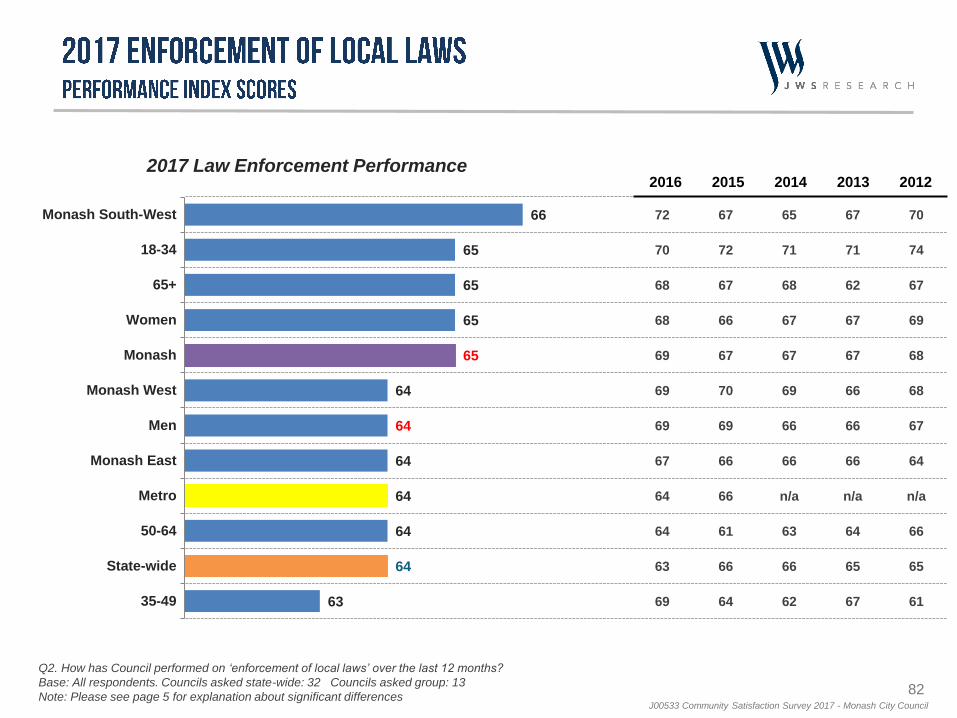
82J00533 Community Satisfaction Survey 2017 - Monash City Council
66
65
65
65
65
64
64
64
64
64
64
63
Monash South-West
18-34
65+
Women
Monash
Monash West
Men
Monash East
Metro
50-64
State-wide
35-49
72
70
68
68
69
69
69
67
64
64
63
69
67
72
67
66
67
70
69
66
66
61
66
64
65
71
68
67
67
69
66
66
n/a
63
66
62
67
71
62
67
67
66
66
66
n/a
64
65
67
70
74
67
69
68
68
67
64
n/a
66
65
61
2017 Law Enforcement Performance2016 2015 2014 2013 2012
Q2. How has Council performed on ‘enforcement of local laws’ over the last 12 months?
Base: All respondents. Councils asked state-wide: 32 Councils asked group: 13
Note: Please see page 5 for explanation about significant differences
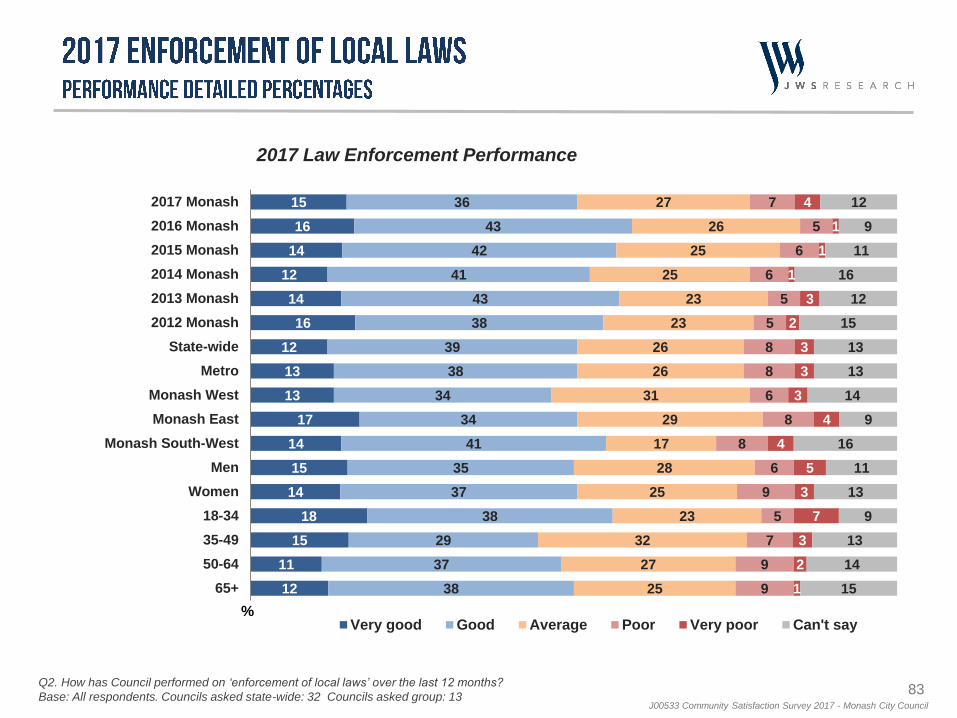
83J00533 Community Satisfaction Survey 2017 - Monash City Council
15
16
14
12
14
16
12
13
13
17
14
15
14
18
15
11
12
36
43
42
41
43
38
39
38
34
34
41
35
37
38
29
37
38
27
26
25
25
23
23
26
26
31
29
17
28
25
23
32
27
25
7
5
6
6
5
5
8
8
6
8
8
6
9
5
7
9
9
4
1
1
1
3
2
3
3
3
4
4
5
3
7
3
2
1
12
9
11
16
12
15
13
13
14
9
16
11
13
9
13
14
15
2017 Monash
2016 Monash
2015 Monash
2014 Monash
2013 Monash
2012 Monash
State-wide
Metro
Monash West
Monash East
Monash South-West
Men
Women
18-34
35-49
50-64
65+
%Very good Good Average Poor Very poor Can't say
2017 Law Enforcement Performance
Q2. How has Council performed on ‘enforcement of local laws’ over the last 12 months?
Base: All respondents. Councils asked state-wide: 32 Councils asked group: 13
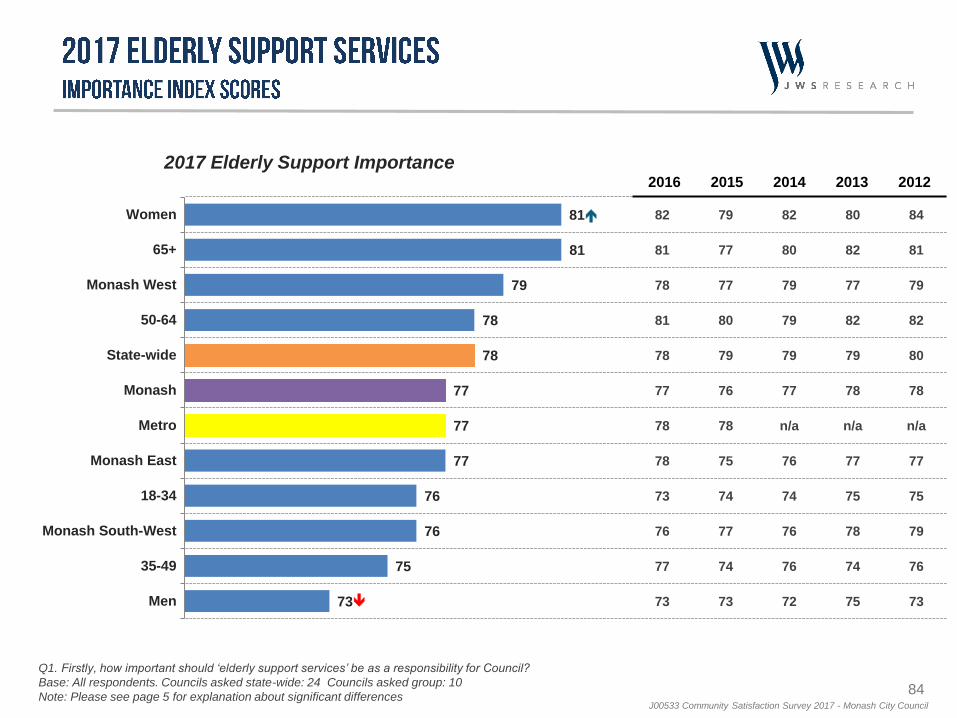
84J00533 Community Satisfaction Survey 2017 - Monash City Council
81
81
79
78
78
77
77
77
76
76
75
73
Women
65+
Monash West
50-64
State-wide
Monash
Metro
Monash East
18-34
Monash South-West
35-49
Men
82
81
78
81
78
77
78
78
73
76
77
73
79
77
77
80
79
76
78
75
74
77
74
73
82
80
79
79
79
77
n/a
76
74
76
76
72
80
82
77
82
79
78
n/a
77
75
78
74
75
84
81
79
82
80
78
n/a
77
75
79
76
73
2017 Elderly Support Importance2016 2015 2014 2013 2012
Q1. Firstly, how important should ‘elderly support services’ be as a responsibility for Council?
Base: All respondents. Councils asked state-wide: 24 Councils asked group: 10
Note: Please see page 5 for explanation about significant differences
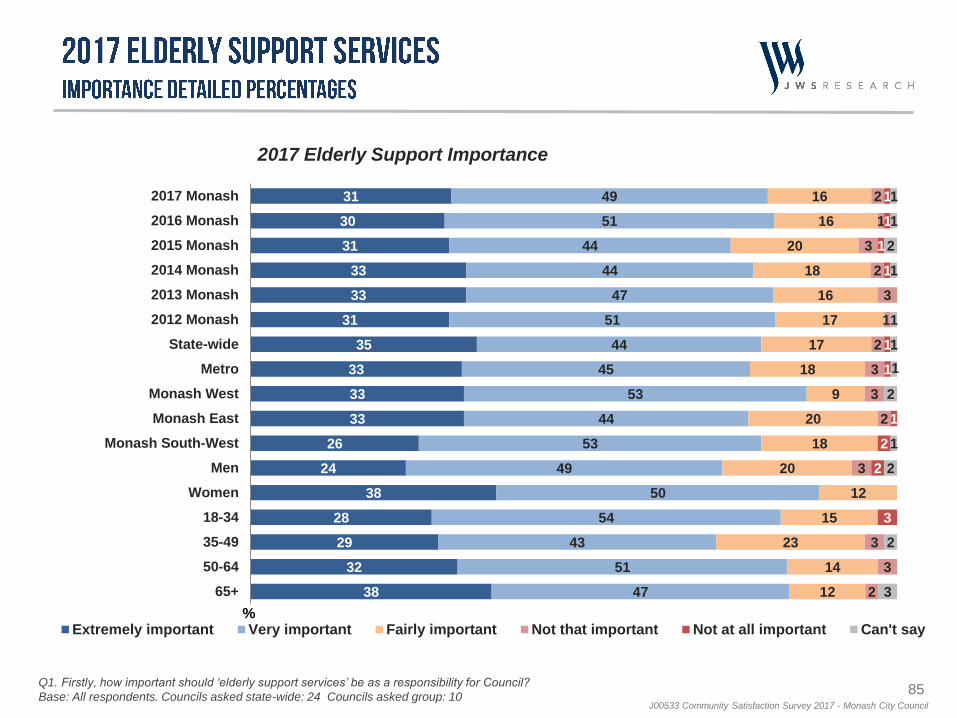
85J00533 Community Satisfaction Survey 2017 - Monash City Council
31
30
31
33
33
31
35
33
33
33
26
24
38
28
29
32
38
49
51
44
44
47
51
44
45
53
44
53
49
50
54
43
51
47
16
16
20
18
16
17
17
18
9
20
18
20
12
15
23
14
12
2
1
3
2
3
1
2
3
3
2
3
3
3
2
1
1
1
1
1
1
1
2
2
3
1
1
2
1
1
1
1
2
1
2
2
3
2017 Monash
2016 Monash
2015 Monash
2014 Monash
2013 Monash
2012 Monash
State-wide
Metro
Monash West
Monash East
Monash South-West
Men
Women
18-34
35-49
50-64
65+
%Extremely important Very important Fairly important Not that important Not at all important Can't say
2017 Elderly Support Importance
Q1. Firstly, how important should ‘elderly support services’ be as a responsibility for Council?
Base: All respondents. Councils asked state-wide: 24 Councils asked group: 10
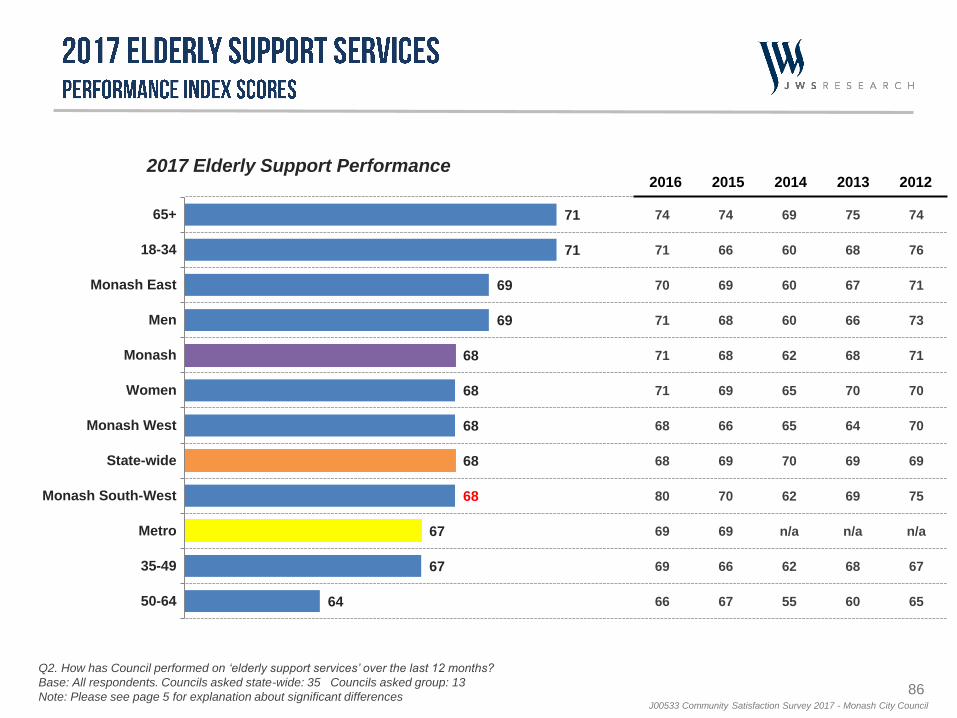
86J00533 Community Satisfaction Survey 2017 - Monash City Council
71
71
69
69
68
68
68
68
68
67
67
64
65+
18-34
Monash East
Men
Monash
Women
Monash West
State-wide
Monash South-West
Metro
35-49
50-64
74
71
70
71
71
71
68
68
80
69
69
66
74
66
69
68
68
69
66
69
70
69
66
67
69
60
60
60
62
65
65
70
62
n/a
62
55
75
68
67
66
68
70
64
69
69
n/a
68
60
74
76
71
73
71
70
70
69
75
n/a
67
65
2017 Elderly Support Performance2016 2015 2014 2013 2012
Q2. How has Council performed on ‘elderly support services’ over the last 12 months?
Base: All respondents. Councils asked state-wide: 35 Councils asked group: 13
Note: Please see page 5 for explanation about significant differences
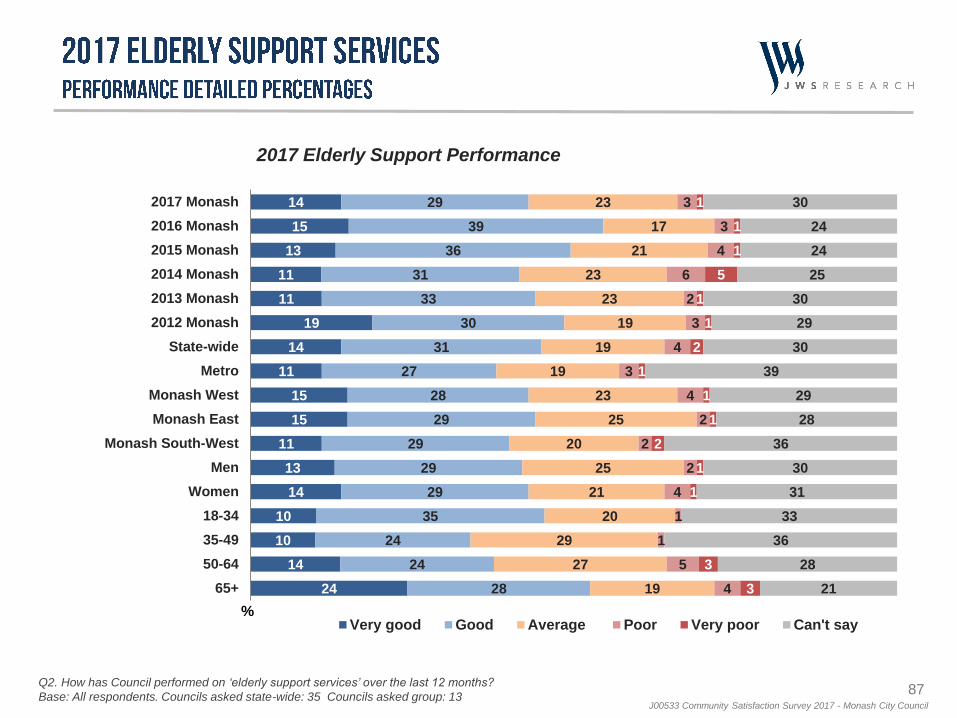
87J00533 Community Satisfaction Survey 2017 - Monash City Council
14
15
13
11
11
19
14
11
15
15
11
13
14
10
10
14
24
29
39
36
31
33
30
31
27
28
29
29
29
29
35
24
24
28
23
17
21
23
23
19
19
19
23
25
20
25
21
20
29
27
19
3
3
4
6
2
3
4
3
4
2
2
2
4
1
1
5
4
1
1
1
5
1
1
2
1
1
1
2
1
1
3
3
30
24
24
25
30
29
30
39
29
28
36
30
31
33
36
28
21
2017 Monash
2016 Monash
2015 Monash
2014 Monash
2013 Monash
2012 Monash
State-wide
Metro
Monash West
Monash East
Monash South-West
Men
Women
18-34
35-49
50-64
65+
%Very good Good Average Poor Very poor Can't say
2017 Elderly Support Performance
Q2. How has Council performed on ‘elderly support services’ over the last 12 months?
Base: All respondents. Councils asked state-wide: 35 Councils asked group: 13
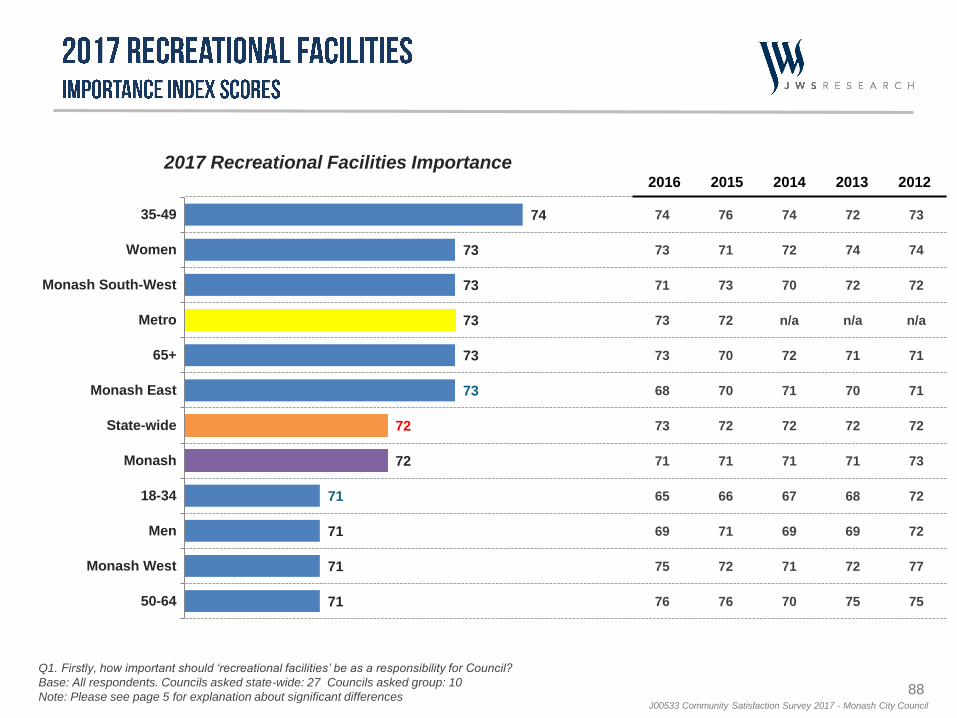
88J00533 Community Satisfaction Survey 2017 - Monash City Council
74
73
73
73
73
73
72
72
71
71
71
71
35-49
Women
Monash South-West
Metro
65+
Monash East
State-wide
Monash
18-34
Men
Monash West
50-64
74
73
71
73
73
68
73
71
65
69
75
76
76
71
73
72
70
70
72
71
66
71
72
76
74
72
70
n/a
72
71
72
71
67
69
71
70
72
74
72
n/a
71
70
72
71
68
69
72
75
73
74
72
n/a
71
71
72
73
72
72
77
75
2017 Recreational Facilities Importance2016 2015 2014 2013 2012
Q1. Firstly, how important should ‘recreational facilities’ be as a responsibility for Council?
Base: All respondents. Councils asked state-wide: 27 Councils asked group: 10
Note: Please see page 5 for explanation about significant differences
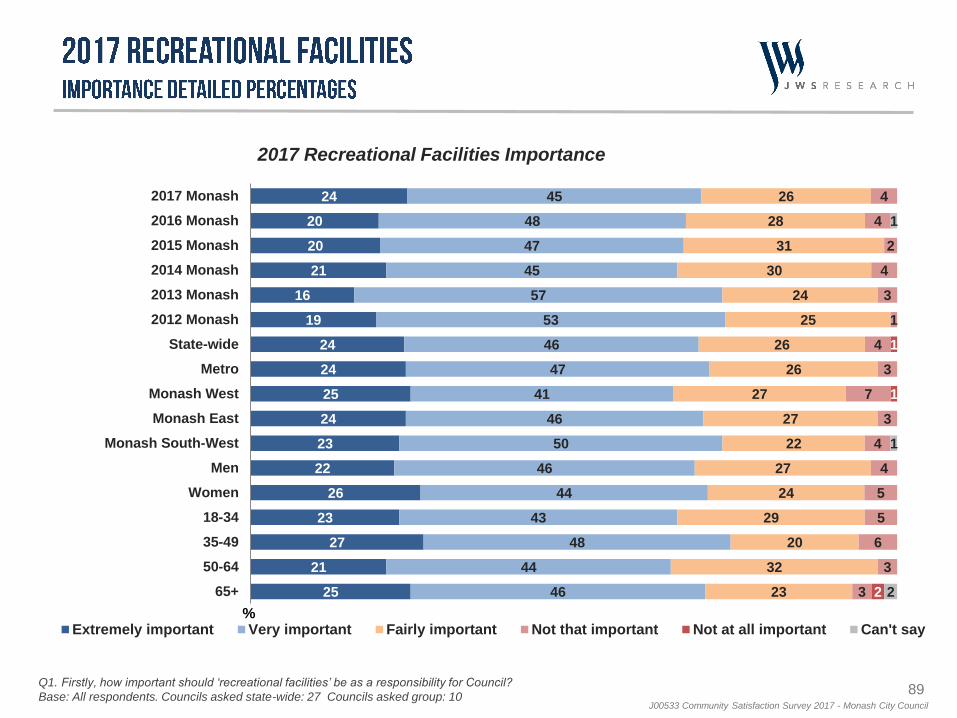
89J00533 Community Satisfaction Survey 2017 - Monash City Council
24
20
20
21
16
19
24
24
25
24
23
22
26
23
27
21
25
45
48
47
45
57
53
46
47
41
46
50
46
44
43
48
44
46
26
28
31
30
24
25
26
26
27
27
22
27
24
29
20
32
23
4
4
2
4
3
1
4
3
7
3
4
4
5
5
6
3
3
1
1
2
1
1
2
2017 Monash
2016 Monash
2015 Monash
2014 Monash
2013 Monash
2012 Monash
State-wide
Metro
Monash West
Monash East
Monash South-West
Men
Women
18-34
35-49
50-64
65+
%Extremely important Very important Fairly important Not that important Not at all important Can't say
2017 Recreational Facilities Importance
Q1. Firstly, how important should ‘recreational facilities’ be as a responsibility for Council?
Base: All respondents. Councils asked state-wide: 27 Councils asked group: 10
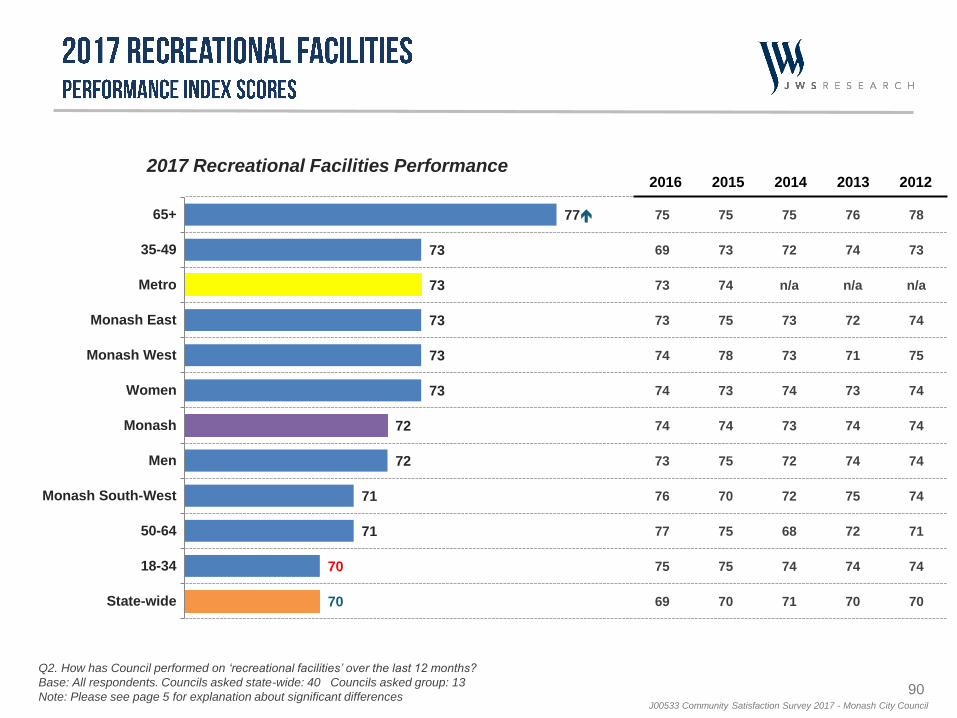
90J00533 Community Satisfaction Survey 2017 - Monash City Council
77
73
73
73
73
73
72
72
71
71
70
70
65+
35-49
Metro
Monash East
Monash West
Women
Monash
Men
Monash South-West
50-64
18-34
State-wide
75
69
73
73
74
74
74
73
76
77
75
69
75
73
74
75
78
73
74
75
70
75
75
70
75
72
n/a
73
73
74
73
72
72
68
74
71
76
74
n/a
72
71
73
74
74
75
72
74
70
78
73
n/a
74
75
74
74
74
74
71
74
70
2017 Recreational Facilities Performance2016 2015 2014 2013 2012
Q2. How has Council performed on ‘recreational facilities’ over the last 12 months?
Base: All respondents. Councils asked state-wide: 40 Councils asked group: 13
Note: Please see page 5 for explanation about significant differences

91J00533 Community Satisfaction Survey 2017 - Monash City Council
24
25
23
22
26
24
22
25
24
26
21
25
23
20
27
19
32
42
45
51
47
46
46
43
45
43
40
45
42
43
45
39
47
38
25
23
18
25
20
23
22
20
28
25
22
26
24
26
27
27
20
4
2
3
2
3
3
7
5
1
4
6
4
4
6
3
2
2
1
1
1
1
2
1
1
1
1
2
1
4
3
4
4
3
4
4
4
3
5
4
2
6
2
4
3
8
2017 Monash
2016 Monash
2015 Monash
2014 Monash
2013 Monash
2012 Monash
State-wide
Metro
Monash West
Monash East
Monash South-West
Men
Women
18-34
35-49
50-64
65+
%Very good Good Average Poor Very poor Can't say
2017 Recreational Facilities Performance
Q2. How has Council performed on ‘recreational facilities’ over the last 12 months?
Base: All respondents. Councils asked state-wide: 40 Councils asked group: 13
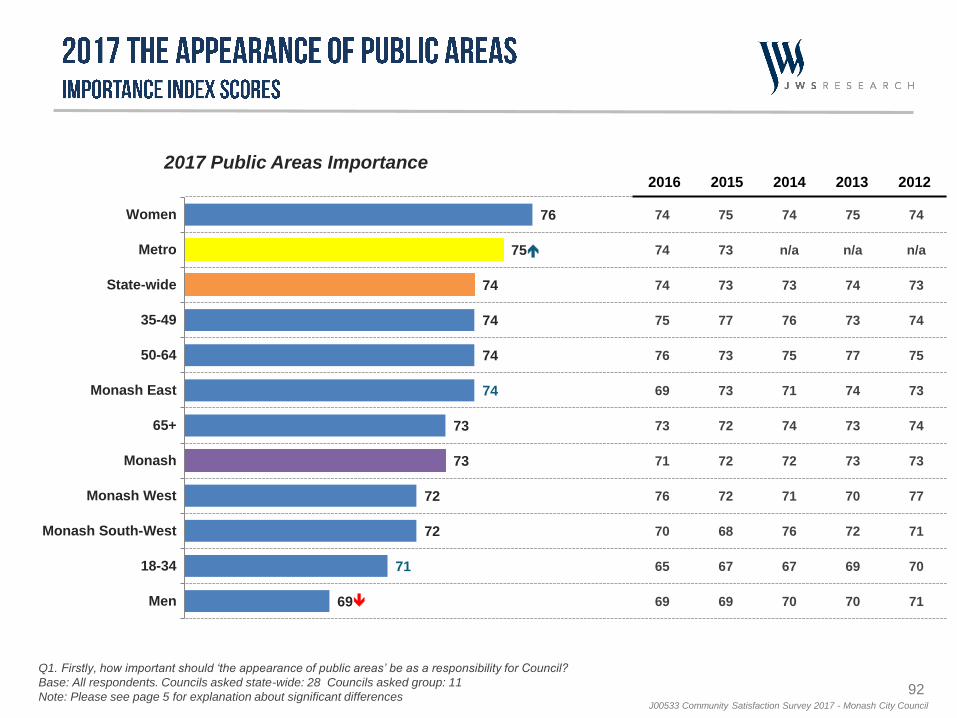
92J00533 Community Satisfaction Survey 2017 - Monash City Council
76
75
74
74
74
74
73
73
72
72
71
69
Women
Metro
State-wide
35-49
50-64
Monash East
65+
Monash
Monash West
Monash South-West
18-34
Men
74
74
74
75
76
69
73
71
76
70
65
69
75
73
73
77
73
73
72
72
72
68
67
69
74
n/a
73
76
75
71
74
72
71
76
67
70
75
n/a
74
73
77
74
73
73
70
72
69
70
74
n/a
73
74
75
73
74
73
77
71
70
71
2017 Public Areas Importance2016 2015 2014 2013 2012
Q1. Firstly, how important should ‘the appearance of public areas’ be as a responsibility for Council?
Base: All respondents. Councils asked state-wide: 28 Councils asked group: 11
Note: Please see page 5 for explanation about significant differences
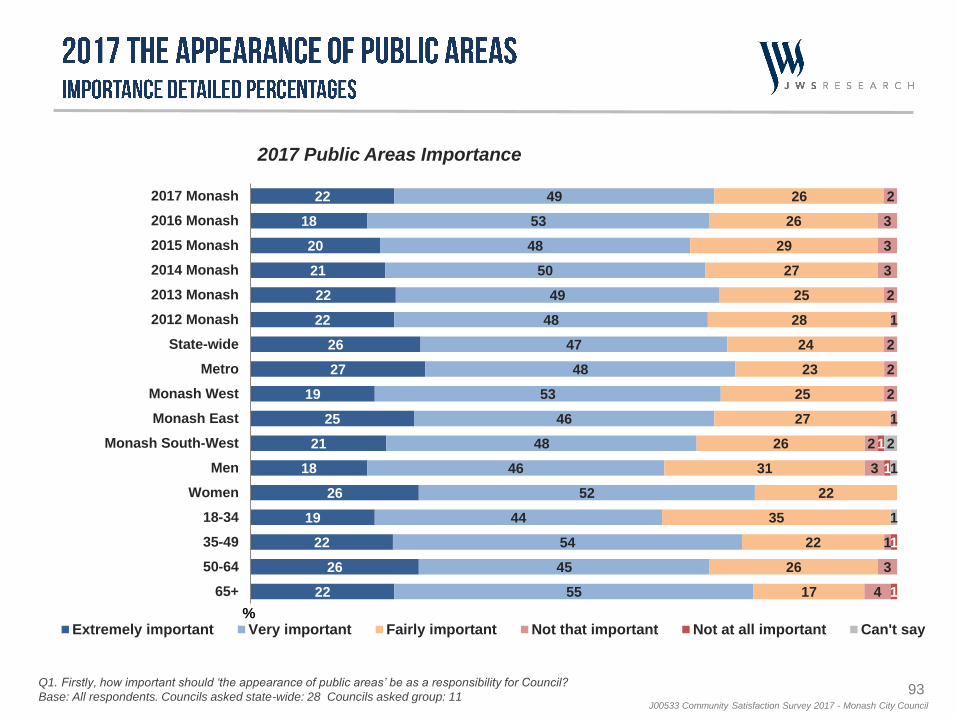
93J00533 Community Satisfaction Survey 2017 - Monash City Council
22
18
20
21
22
22
26
27
19
25
21
18
26
19
22
26
22
49
53
48
50
49
48
47
48
53
46
48
46
52
44
54
45
55
26
26
29
27
25
28
24
23
25
27
26
31
22
35
22
26
17
2
3
3
3
2
1
2
2
2
1
2
3
1
3
4
1
1
1
1
2
1
1
2017 Monash
2016 Monash
2015 Monash
2014 Monash
2013 Monash
2012 Monash
State-wide
Metro
Monash West
Monash East
Monash South-West
Men
Women
18-34
35-49
50-64
65+
%Extremely important Very important Fairly important Not that important Not at all important Can't say
2017 Public Areas Importance
Q1. Firstly, how important should ‘the appearance of public areas’ be as a responsibility for Council?
Base: All respondents. Councils asked state-wide: 28 Councils asked group: 11
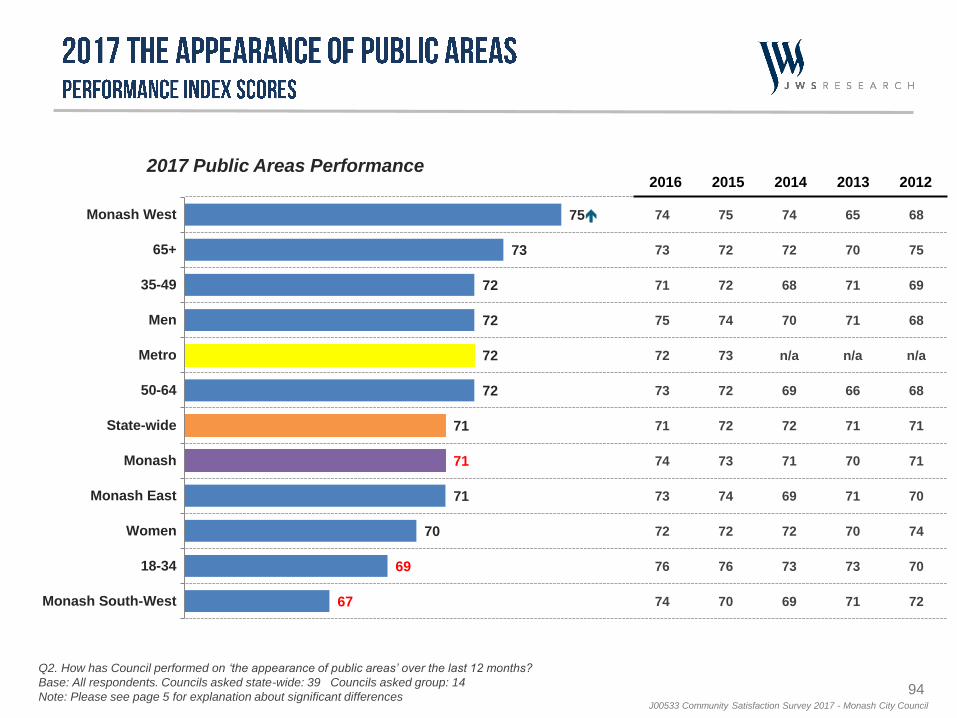
94J00533 Community Satisfaction Survey 2017 - Monash City Council
75
73
72
72
72
72
71
71
71
70
69
67
Monash West
65+
35-49
Men
Metro
50-64
State-wide
Monash
Monash East
Women
18-34
Monash South-West
74
73
71
75
72
73
71
74
73
72
76
74
75
72
72
74
73
72
72
73
74
72
76
70
74
72
68
70
n/a
69
72
71
69
72
73
69
65
70
71
71
n/a
66
71
70
71
70
73
71
68
75
69
68
n/a
68
71
71
70
74
70
72
2017 Public Areas Performance2016 2015 2014 2013 2012
Q2. How has Council performed on ‘the appearance of public areas’ over the last 12 months?
Base: All respondents. Councils asked state-wide: 39 Councils asked group: 14
Note: Please see page 5 for explanation about significant differences
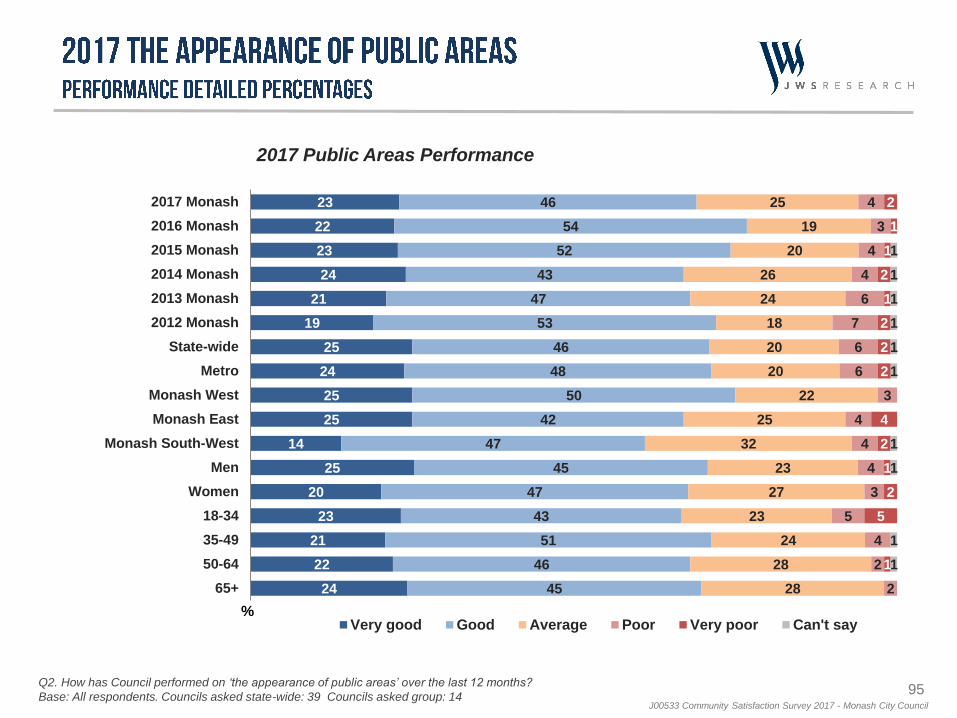
95J00533 Community Satisfaction Survey 2017 - Monash City Council
23
22
23
24
21
19
25
24
25
25
14
25
20
23
21
22
24
46
54
52
43
47
53
46
48
50
42
47
45
47
43
51
46
45
25
19
20
26
24
18
20
20
22
25
32
23
27
23
24
28
28
4
3
4
4
6
7
6
6
3
4
4
4
3
5
4
2
2
2
1
1
2
1
2
2
2
4
2
1
2
5
1
1
1
1
1
1
1
1
1
1
1
2017 Monash
2016 Monash
2015 Monash
2014 Monash
2013 Monash
2012 Monash
State-wide
Metro
Monash West
Monash East
Monash South-West
Men
Women
18-34
35-49
50-64
65+
%Very good Good Average Poor Very poor Can't say
2017 Public Areas Performance
Q2. How has Council performed on ‘the appearance of public areas’ over the last 12 months?
Base: All respondents. Councils asked state-wide: 39 Councils asked group: 14
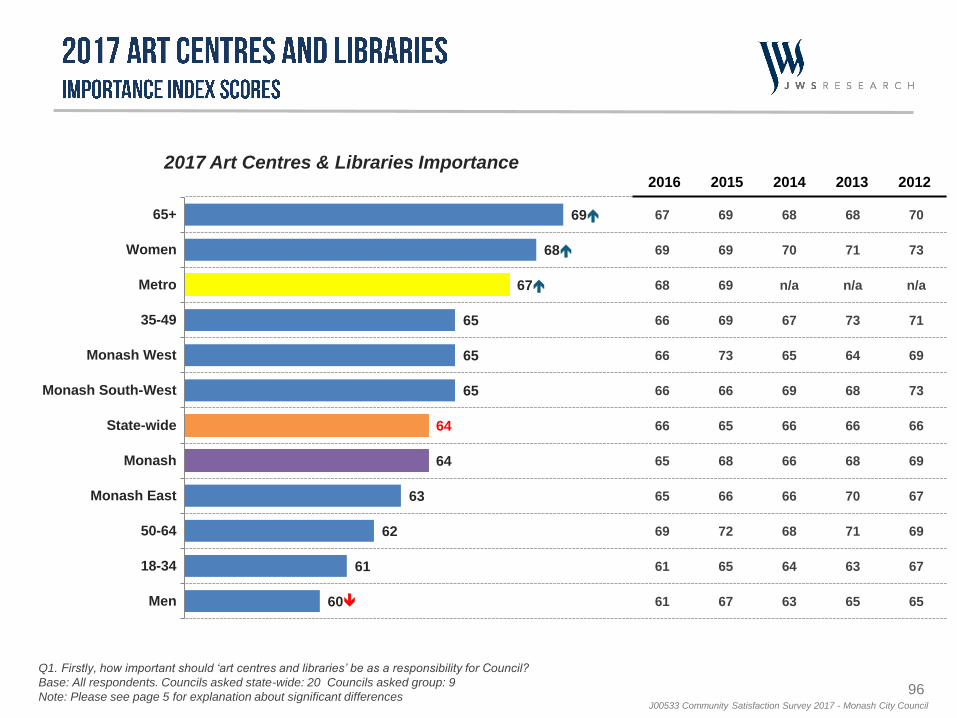
96J00533 Community Satisfaction Survey 2017 - Monash City Council
69
68
67
65
65
65
64
64
63
62
61
60
65+
Women
Metro
35-49
Monash West
Monash South-West
State-wide
Monash
Monash East
50-64
18-34
Men
67
69
68
66
66
66
66
65
65
69
61
61
69
69
69
69
73
66
65
68
66
72
65
67
68
70
n/a
67
65
69
66
66
66
68
64
63
68
71
n/a
73
64
68
66
68
70
71
63
65
70
73
n/a
71
69
73
66
69
67
69
67
65
2017 Art Centres & Libraries Importance2016 2015 2014 2013 2012
Q1. Firstly, how important should ‘art centres and libraries’ be as a responsibility for Council?
Base: All respondents. Councils asked state-wide: 20 Councils asked group: 9
Note: Please see page 5 for explanation about significant differences
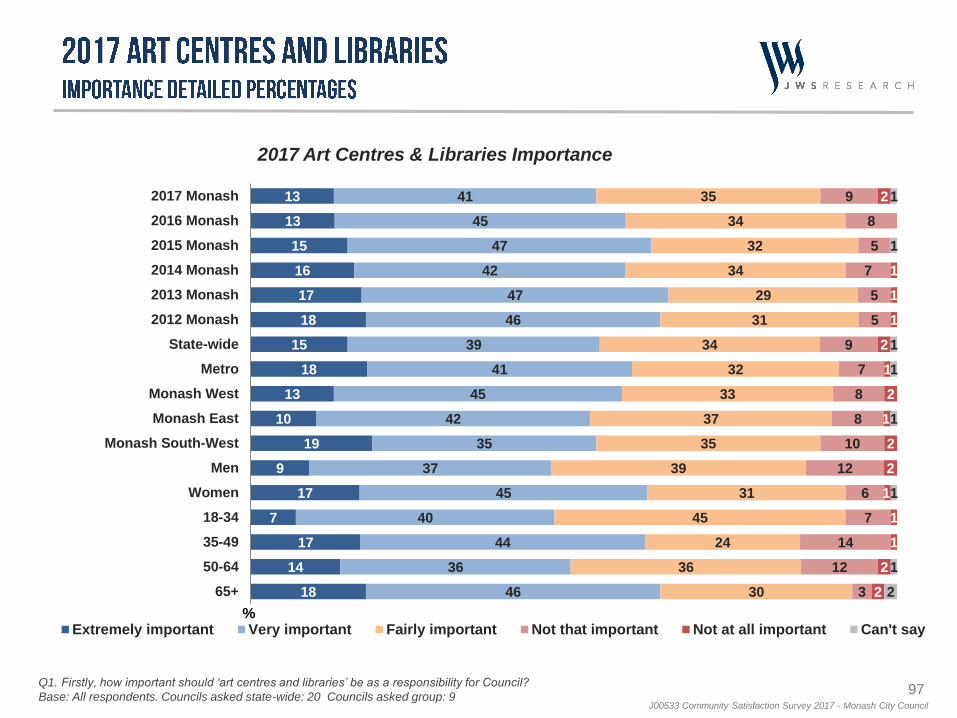
97J00533 Community Satisfaction Survey 2017 - Monash City Council
13
13
15
16
17
18
15
18
13
10
19
9
17
7
17
14
18
41
45
47
42
47
46
39
41
45
42
35
37
45
40
44
36
46
35
34
32
34
29
31
34
32
33
37
35
39
31
45
24
36
30
9
8
5
7
5
5
9
7
8
8
10
12
6
7
14
12
3
2
1
1
1
2
1
2
1
2
2
1
1
1
2
2
1
1
1
1
1
1
1
2
2017 Monash
2016 Monash
2015 Monash
2014 Monash
2013 Monash
2012 Monash
State-wide
Metro
Monash West
Monash East
Monash South-West
Men
Women
18-34
35-49
50-64
65+
%Extremely important Very important Fairly important Not that important Not at all important Can't say
2017 Art Centres & Libraries Importance
Q1. Firstly, how important should ‘art centres and libraries’ be as a responsibility for Council?
Base: All respondents. Councils asked state-wide: 20 Councils asked group: 9
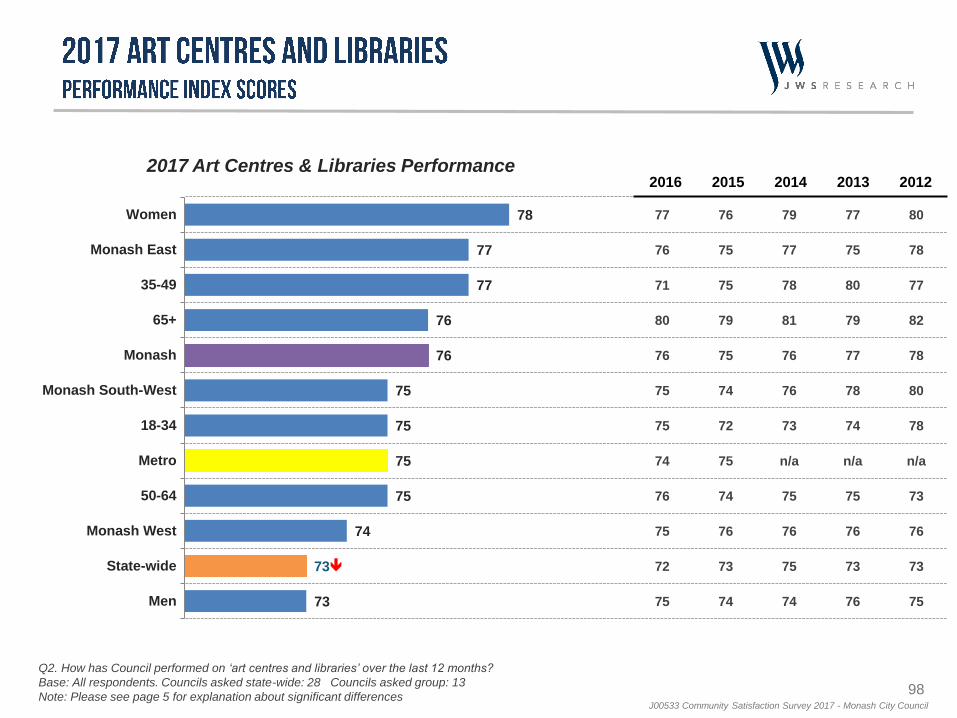
98J00533 Community Satisfaction Survey 2017 - Monash City Council
78
77
77
76
76
75
75
75
75
74
73
73
Women
Monash East
35-49
65+
Monash
Monash South-West
18-34
Metro
50-64
Monash West
State-wide
Men
77
76
71
80
76
75
75
74
76
75
72
75
76
75
75
79
75
74
72
75
74
76
73
74
79
77
78
81
76
76
73
n/a
75
76
75
74
77
75
80
79
77
78
74
n/a
75
76
73
76
80
78
77
82
78
80
78
n/a
73
76
73
75
2017 Art Centres & Libraries Performance2016 2015 2014 2013 2012
Q2. How has Council performed on ‘art centres and libraries’ over the last 12 months?
Base: All respondents. Councils asked state-wide: 28 Councils asked group: 13
Note: Please see page 5 for explanation about significant differences
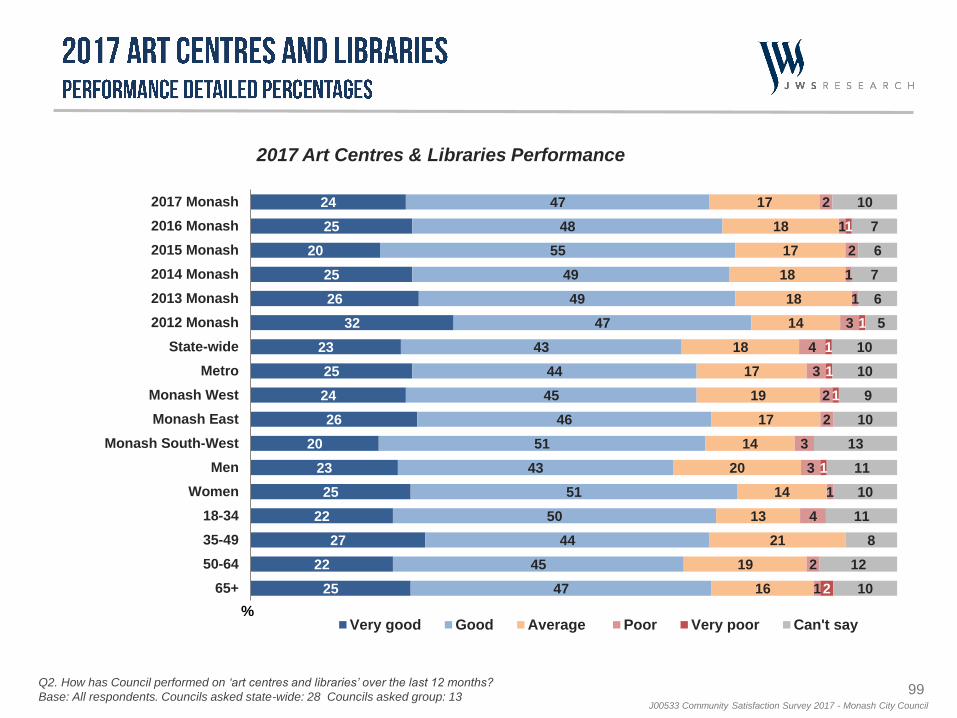
99J00533 Community Satisfaction Survey 2017 - Monash City Council
24
25
20
25
26
32
23
25
24
26
20
23
25
22
27
22
25
47
48
55
49
49
47
43
44
45
46
51
43
51
50
44
45
47
17
18
17
18
18
14
18
17
19
17
14
20
14
13
21
19
16
2
1
2
1
1
3
4
3
2
2
3
3
1
4
2
1
1
1
1
1
1
1
2
10
7
6
7
6
5
10
10
9
10
13
11
10
11
8
12
10
2017 Monash
2016 Monash
2015 Monash
2014 Monash
2013 Monash
2012 Monash
State-wide
Metro
Monash West
Monash East
Monash South-West
Men
Women
18-34
35-49
50-64
65+
%Very good Good Average Poor Very poor Can't say
2017 Art Centres & Libraries Performance
Q2. How has Council performed on ‘art centres and libraries’ over the last 12 months?
Base: All respondents. Councils asked state-wide: 28 Councils asked group: 13
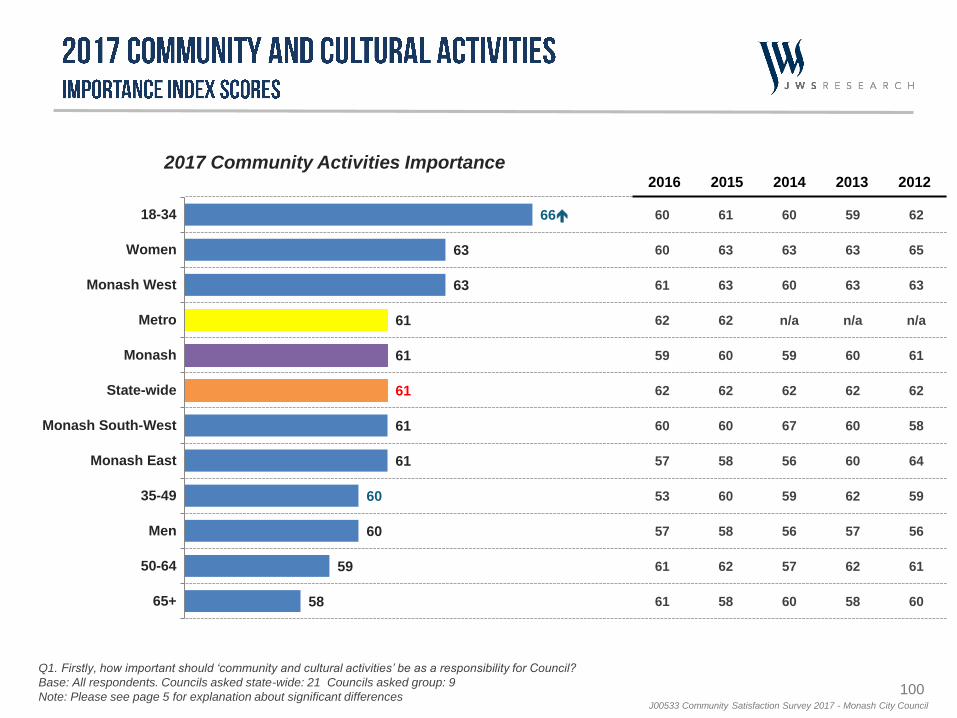
100J00533 Community Satisfaction Survey 2017 - Monash City Council
66
63
63
61
61
61
61
61
60
60
59
58
18-34
Women
Monash West
Metro
Monash
State-wide
Monash South-West
Monash East
35-49
Men
50-64
65+
60
60
61
62
59
62
60
57
53
57
61
61
61
63
63
62
60
62
60
58
60
58
62
58
60
63
60
n/a
59
62
67
56
59
56
57
60
59
63
63
n/a
60
62
60
60
62
57
62
58
62
65
63
n/a
61
62
58
64
59
56
61
60
2017 Community Activities Importance2016 2015 2014 2013 2012
Q1. Firstly, how important should ‘community and cultural activities’ be as a responsibility for Council?
Base: All respondents. Councils asked state-wide: 21 Councils asked group: 9
Note: Please see page 5 for explanation about significant differences
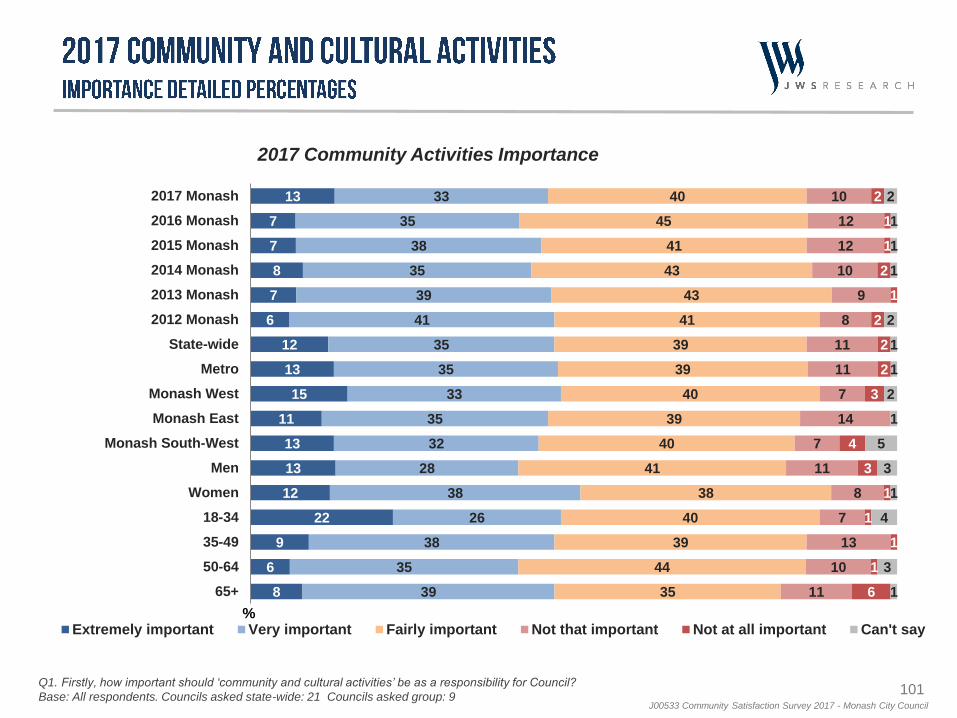
101J00533 Community Satisfaction Survey 2017 - Monash City Council
13
7
7
8
7
6
12
13
15
11
13
13
12
22
9
6
8
33
35
38
35
39
41
35
35
33
35
32
28
38
26
38
35
39
40
45
41
43
43
41
39
39
40
39
40
41
38
40
39
44
35
10
12
12
10
9
8
11
11
7
14
7
11
8
7
13
10
11
2
1
1
2
1
2
2
2
3
4
3
1
1
1
1
6
2
1
1
1
2
1
1
2
1
5
3
1
4
3
1
2017 Monash
2016 Monash
2015 Monash
2014 Monash
2013 Monash
2012 Monash
State-wide
Metro
Monash West
Monash East
Monash South-West
Men
Women
18-34
35-49
50-64
65+
%Extremely important Very important Fairly important Not that important Not at all important Can't say
2017 Community Activities Importance
Q1. Firstly, how important should ‘community and cultural activities’ be as a responsibility for Council?
Base: All respondents. Councils asked state-wide: 21 Councils asked group: 9
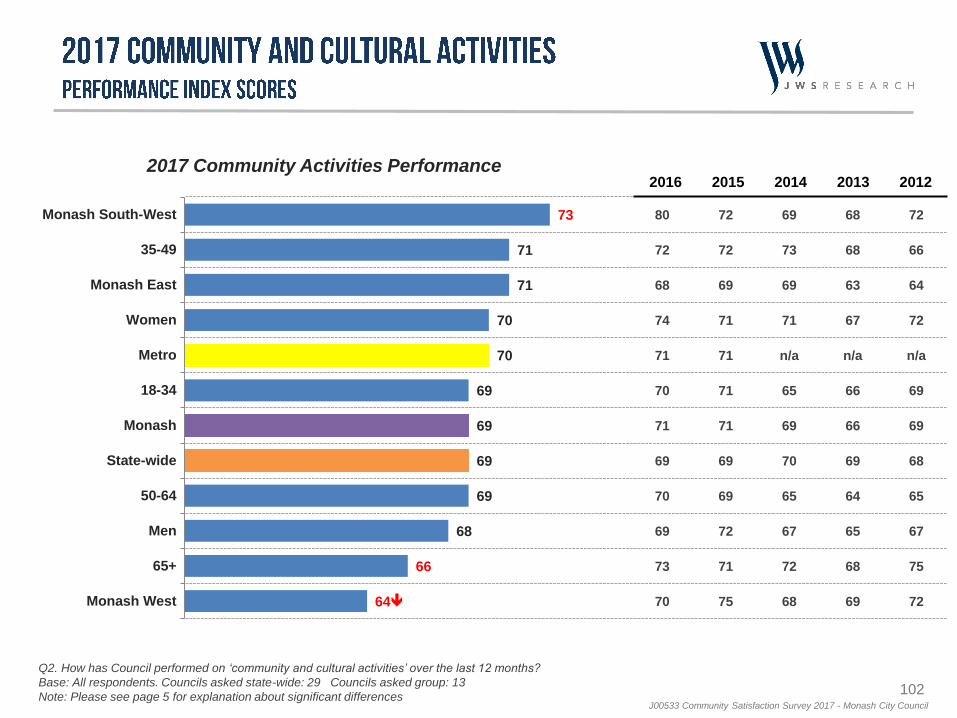
102J00533 Community Satisfaction Survey 2017 - Monash City Council
73
71
71
70
70
69
69
69
69
68
66
64
Monash South-West
35-49
Monash East
Women
Metro
18-34
Monash
State-wide
50-64
Men
65+
Monash West
80
72
68
74
71
70
71
69
70
69
73
70
72
72
69
71
71
71
71
69
69
72
71
75
69
73
69
71
n/a
65
69
70
65
67
72
68
68
68
63
67
n/a
66
66
69
64
65
68
69
72
66
64
72
n/a
69
69
68
65
67
75
72
2017 Community Activities Performance2016 2015 2014 2013 2012
Q2. How has Council performed on ‘community and cultural activities’ over the last 12 months?
Base: All respondents. Councils asked state-wide: 29 Councils asked group: 13
Note: Please see page 5 for explanation about significant differences
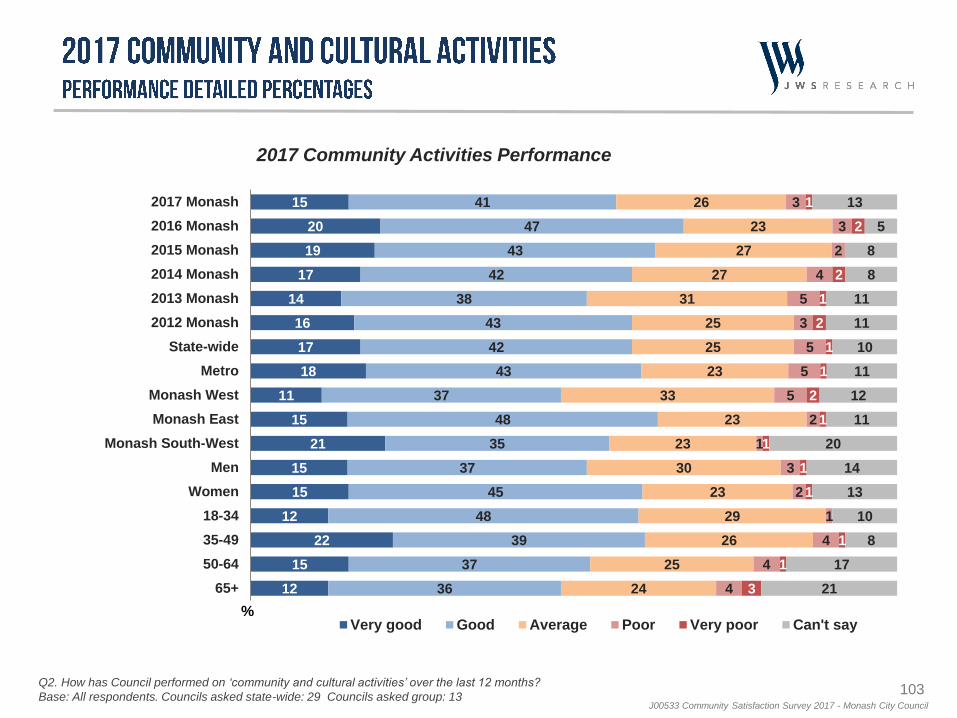
103J00533 Community Satisfaction Survey 2017 - Monash City Council
15
20
19
17
14
16
17
18
11
15
21
15
15
12
22
15
12
41
47
43
42
38
43
42
43
37
48
35
37
45
48
39
37
36
26
23
27
27
31
25
25
23
33
23
23
30
23
29
26
25
24
3
3
2
4
5
3
5
5
5
2
1
3
2
1
4
4
4
1
2
2
1
2
1
1
2
1
1
1
1
1
1
3
13
5
8
8
11
11
10
11
12
11
20
14
13
10
8
17
21
2017 Monash
2016 Monash
2015 Monash
2014 Monash
2013 Monash
2012 Monash
State-wide
Metro
Monash West
Monash East
Monash South-West
Men
Women
18-34
35-49
50-64
65+
%Very good Good Average Poor Very poor Can't say
2017 Community Activities Performance
Q2. How has Council performed on ‘community and cultural activities’ over the last 12 months?
Base: All respondents. Councils asked state-wide: 29 Councils asked group: 13
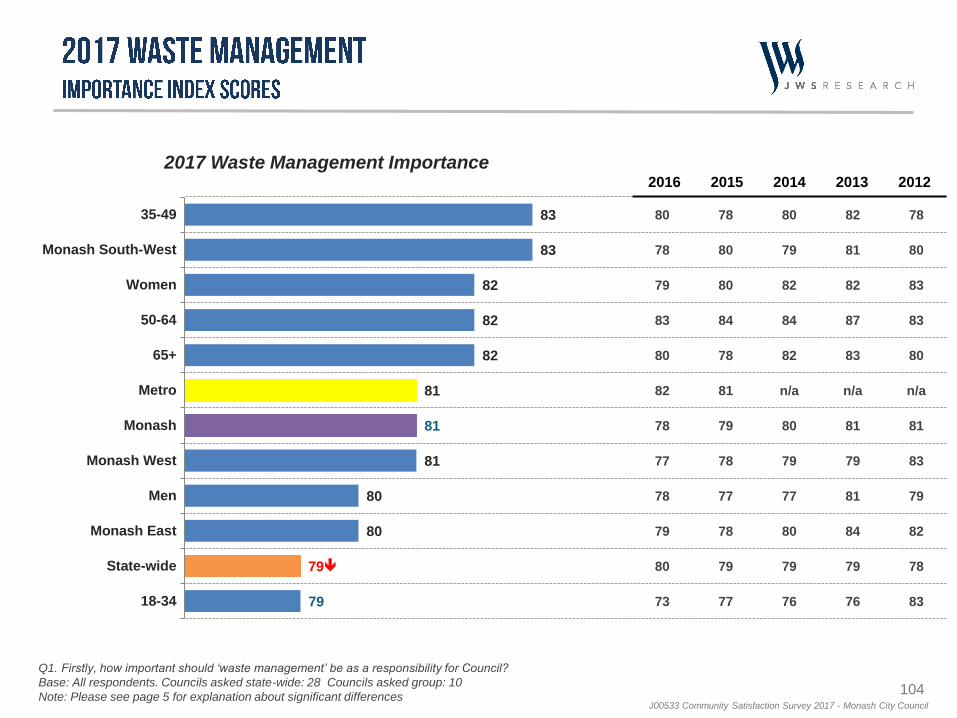
104J00533 Community Satisfaction Survey 2017 - Monash City Council
83
83
82
82
82
81
81
81
80
80
79
79
35-49
Monash South-West
Women
50-64
65+
Metro
Monash
Monash West
Men
Monash East
State-wide
18-34
80
78
79
83
80
82
78
77
78
79
80
73
78
80
80
84
78
81
79
78
77
78
79
77
80
79
82
84
82
n/a
80
79
77
80
79
76
82
81
82
87
83
n/a
81
79
81
84
79
76
78
80
83
83
80
n/a
81
83
79
82
78
83
2017 Waste Management Importance2016 2015 2014 2013 2012
Q1. Firstly, how important should ‘waste management’ be as a responsibility for Council?
Base: All respondents. Councils asked state-wide: 28 Councils asked group: 10
Note: Please see page 5 for explanation about significant differences
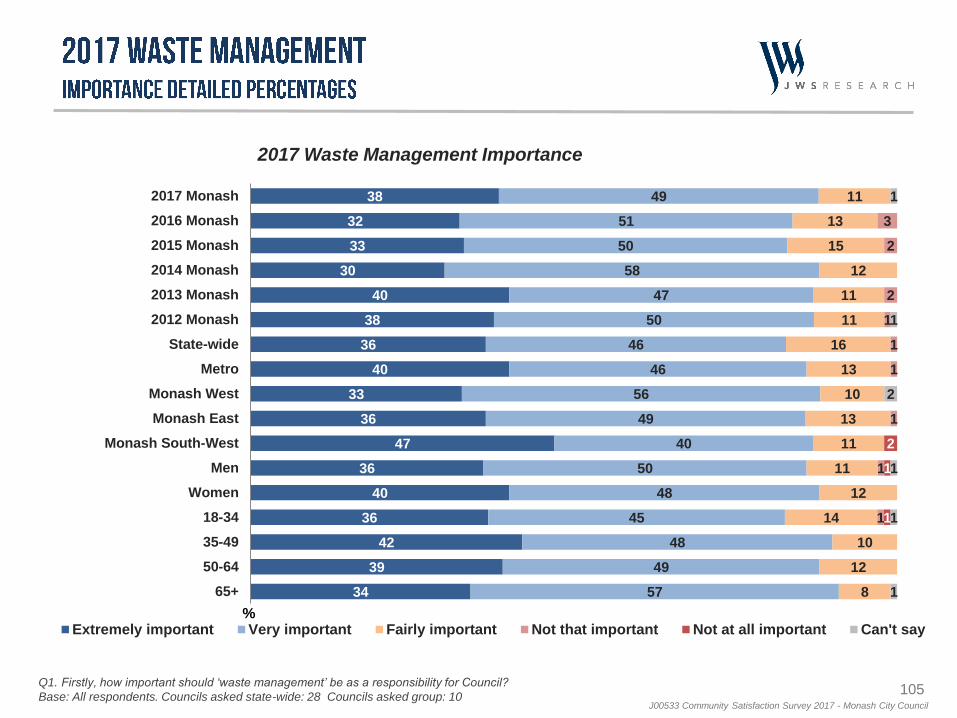
105J00533 Community Satisfaction Survey 2017 - Monash City Council
38
32
33
30
40
38
36
40
33
36
47
36
40
36
42
39
34
49
51
50
58
47
50
46
46
56
49
40
50
48
45
48
49
57
11
13
15
12
11
11
16
13
10
13
11
11
12
14
10
12
8
3
2
2
1
1
1
1
1
1
2
1
1
1
1
2
1
1
1
2017 Monash
2016 Monash
2015 Monash
2014 Monash
2013 Monash
2012 Monash
State-wide
Metro
Monash West
Monash East
Monash South-West
Men
Women
18-34
35-49
50-64
65+
%Extremely important Very important Fairly important Not that important Not at all important Can't say
2017 Waste Management Importance
Q1. Firstly, how important should ‘waste management’ be as a responsibility for Council?
Base: All respondents. Councils asked state-wide: 28 Councils asked group: 10
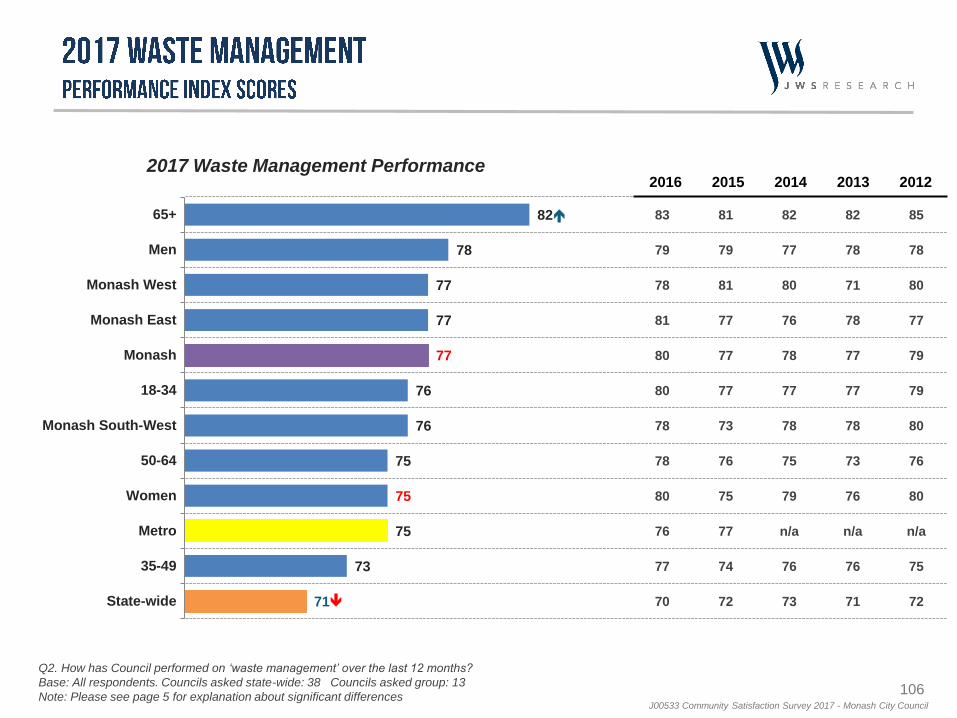
106J00533 Community Satisfaction Survey 2017 - Monash City Council
82
78
77
77
77
76
76
75
75
75
73
71
65+
Men
Monash West
Monash East
Monash
18-34
Monash South-West
50-64
Women
Metro
35-49
State-wide
83
79
78
81
80
80
78
78
80
76
77
70
81
79
81
77
77
77
73
76
75
77
74
72
82
77
80
76
78
77
78
75
79
n/a
76
73
82
78
71
78
77
77
78
73
76
n/a
76
71
85
78
80
77
79
79
80
76
80
n/a
75
72
2017 Waste Management Performance2016 2015 2014 2013 2012
Q2. How has Council performed on ‘waste management’ over the last 12 months?
Base: All respondents. Councils asked state-wide: 38 Councils asked group: 13
Note: Please see page 5 for explanation about significant differences
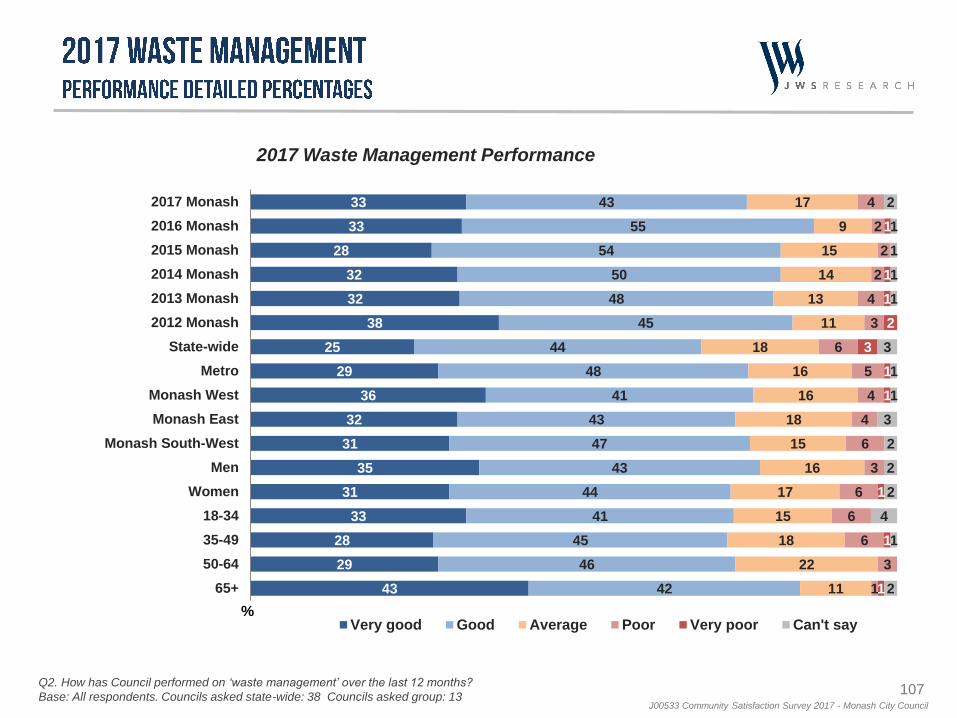
107J00533 Community Satisfaction Survey 2017 - Monash City Council
33
33
28
32
32
38
25
29
36
32
31
35
31
33
28
29
43
43
55
54
50
48
45
44
48
41
43
47
43
44
41
45
46
42
17
9
15
14
13
11
18
16
16
18
15
16
17
15
18
22
11
4
2
2
2
4
3
6
5
4
4
6
3
6
6
6
3
1
1
1
1
2
3
1
1
1
1
1
2
1
1
1
1
3
1
1
3
2
2
2
4
1
2
2017 Monash
2016 Monash
2015 Monash
2014 Monash
2013 Monash
2012 Monash
State-wide
Metro
Monash West
Monash East
Monash South-West
Men
Women
18-34
35-49
50-64
65+
%Very good Good Average Poor Very poor Can't say
2017 Waste Management Performance
Q2. How has Council performed on ‘waste management’ over the last 12 months?
Base: All respondents. Councils asked state-wide: 38 Councils asked group: 13
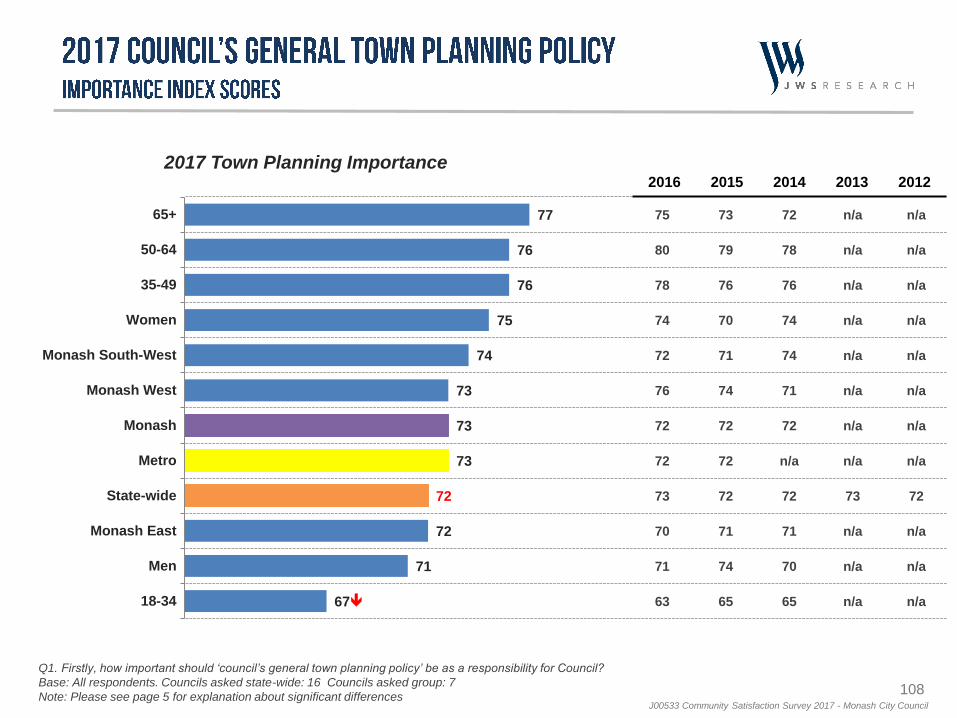
108J00533 Community Satisfaction Survey 2017 - Monash City Council
77
76
76
75
74
73
73
73
72
72
71
67
65+
50-64
35-49
Women
Monash South-West
Monash West
Monash
Metro
State-wide
Monash East
Men
18-34
75
80
78
74
72
76
72
72
73
70
71
63
73
79
76
70
71
74
72
72
72
71
74
65
72
78
76
74
74
71
72
n/a
72
71
70
65
n/a
n/a
n/a
n/a
n/a
n/a
n/a
n/a
73
n/a
n/a
n/a
n/a
n/a
n/a
n/a
n/a
n/a
n/a
n/a
72
n/a
n/a
n/a
2017 Town Planning Importance2016 2015 2014 2013 2012
Q1. Firstly, how important should ‘council’s general town planning policy’ be as a responsibility for Council?
Base: All respondents. Councils asked state-wide: 16 Councils asked group: 7
Note: Please see page 5 for explanation about significant differences
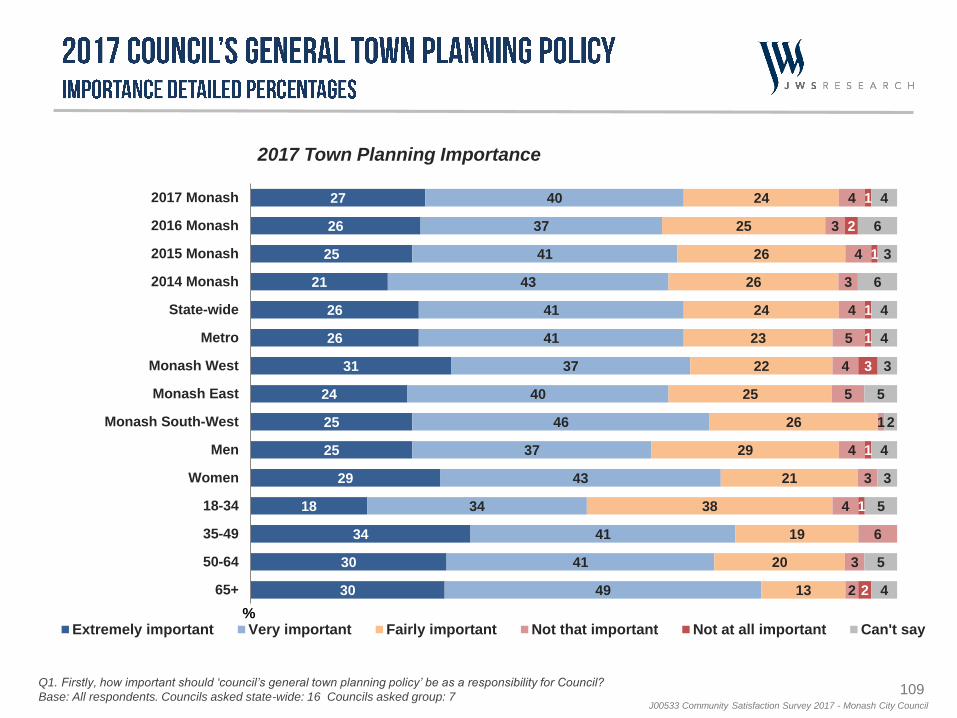
109J00533 Community Satisfaction Survey 2017 - Monash City Council
27
26
25
21
26
26
31
24
25
25
29
18
34
30
30
40
37
41
43
41
41
37
40
46
37
43
34
41
41
49
24
25
26
26
24
23
22
25
26
29
21
38
19
20
13
4
3
4
3
4
5
4
5
1
4
3
4
6
3
2
1
2
1
1
1
3
1
1
2
4
6
3
6
4
4
3
5
2
4
3
5
5
4
2017 Monash
2016 Monash
2015 Monash
2014 Monash
State-wide
Metro
Monash West
Monash East
Monash South-West
Men
Women
18-34
35-49
50-64
65+
%Extremely important Very important Fairly important Not that important Not at all important Can't say
2017 Town Planning Importance
Q1. Firstly, how important should ‘council’s general town planning policy’ be as a responsibility for Council?
Base: All respondents. Councils asked state-wide: 16 Councils asked group: 7
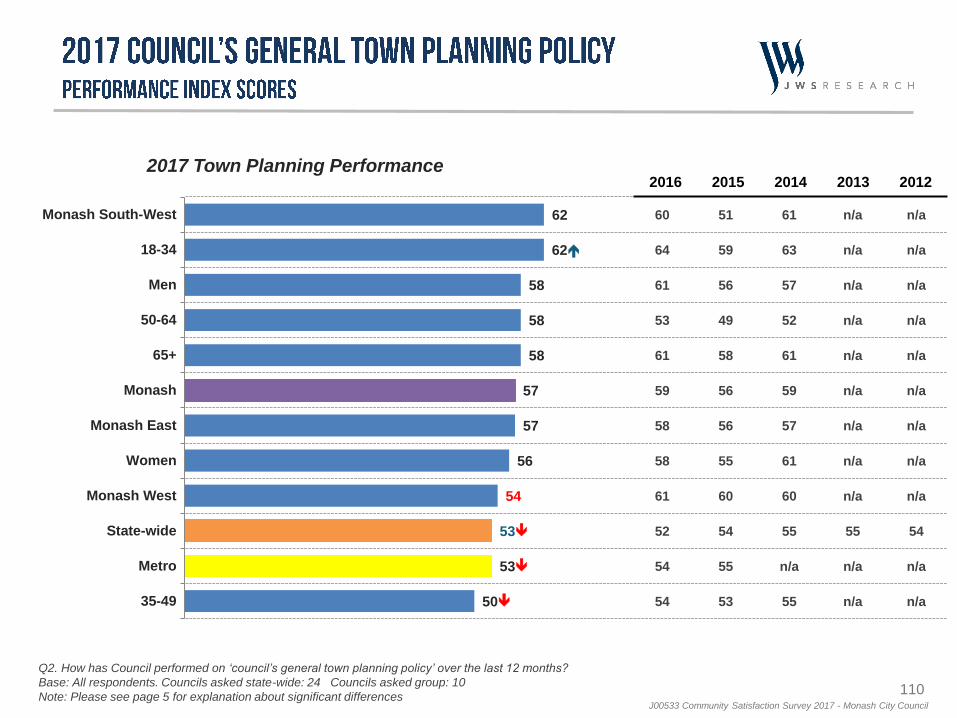
110J00533 Community Satisfaction Survey 2017 - Monash City Council
62
62
58
58
58
57
57
56
54
53
53
50
Monash South-West
18-34
Men
50-64
65+
Monash
Monash East
Women
Monash West
State-wide
Metro
35-49
60
64
61
53
61
59
58
58
61
52
54
54
51
59
56
49
58
56
56
55
60
54
55
53
61
63
57
52
61
59
57
61
60
55
n/a
55
n/a
n/a
n/a
n/a
n/a
n/a
n/a
n/a
n/a
55
n/a
n/a
n/a
n/a
n/a
n/a
n/a
n/a
n/a
n/a
n/a
54
n/a
n/a
2017 Town Planning Performance2016 2015 2014 2013 2012
Q2. How has Council performed on ‘council’s general town planning policy’ over the last 12 months?
Base: All respondents. Councils asked state-wide: 24 Councils asked group: 10
Note: Please see page 5 for explanation about significant differences
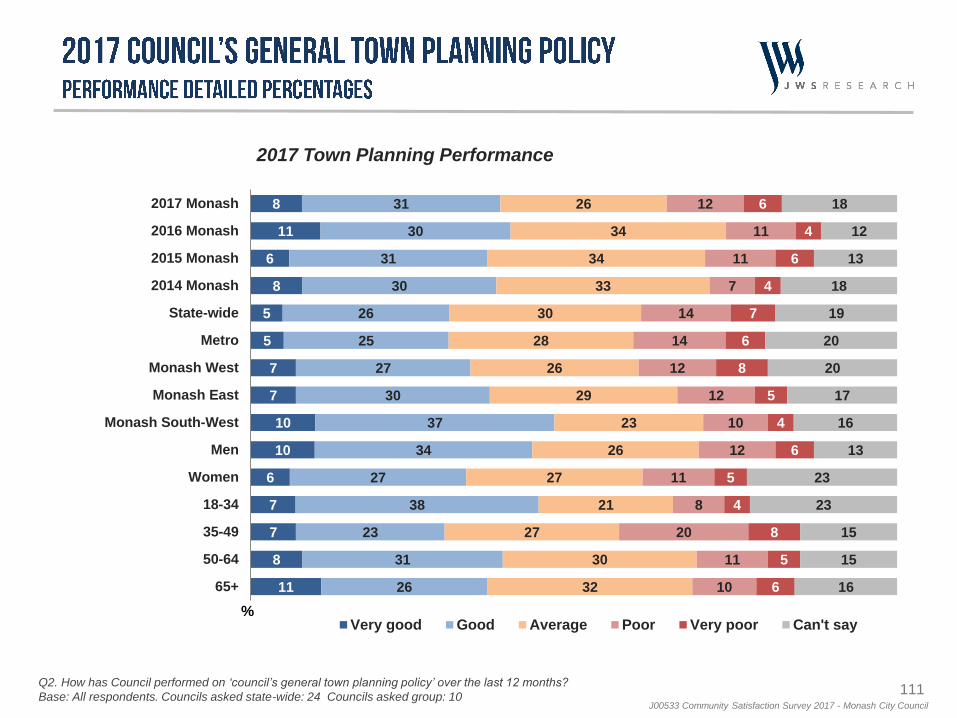
111J00533 Community Satisfaction Survey 2017 - Monash City Council
8
11
6
8
5
5
7
7
10
10
6
7
7
8
11
31
30
31
30
26
25
27
30
37
34
27
38
23
31
26
26
34
34
33
30
28
26
29
23
26
27
21
27
30
32
12
11
11
7
14
14
12
12
10
12
11
8
20
11
10
6
4
6
4
7
6
8
5
4
6
5
4
8
5
6
18
12
13
18
19
20
20
17
16
13
23
23
15
15
16
2017 Monash
2016 Monash
2015 Monash
2014 Monash
State-wide
Metro
Monash West
Monash East
Monash South-West
Men
Women
18-34
35-49
50-64
65+
%Very good Good Average Poor Very poor Can't say
2017 Town Planning Performance
Q2. How has Council performed on ‘council’s general town planning policy’ over the last 12 months?
Base: All respondents. Councils asked state-wide: 24 Councils asked group: 10
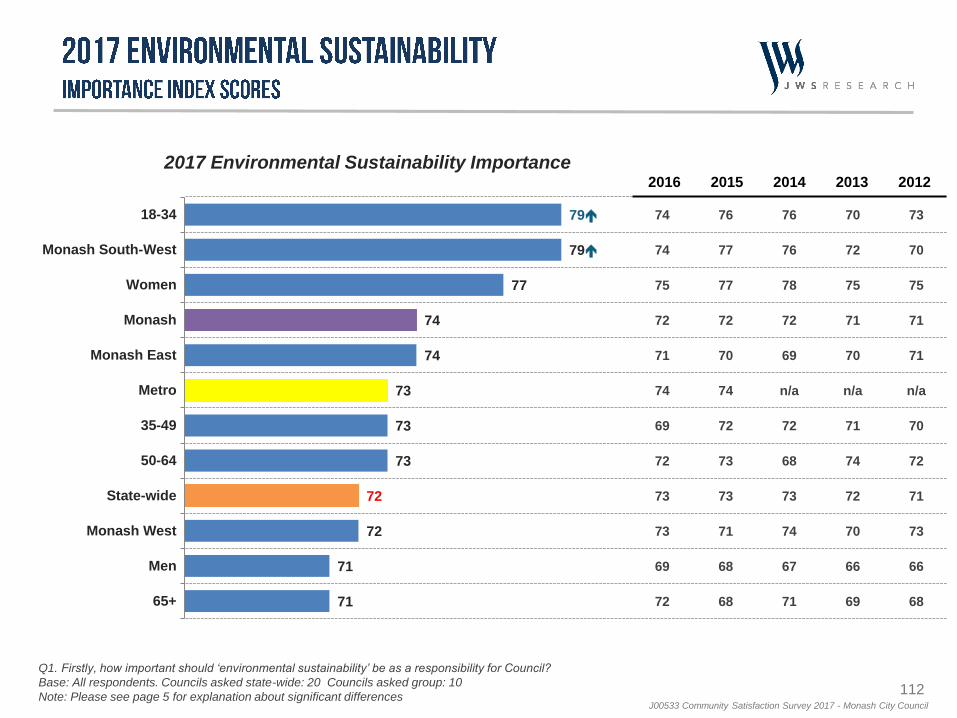
112J00533 Community Satisfaction Survey 2017 - Monash City Council
79
79
77
74
74
73
73
73
72
72
71
71
18-34
Monash South-West
Women
Monash
Monash East
Metro
35-49
50-64
State-wide
Monash West
Men
65+
74
74
75
72
71
74
69
72
73
73
69
72
76
77
77
72
70
74
72
73
73
71
68
68
76
76
78
72
69
n/a
72
68
73
74
67
71
70
72
75
71
70
n/a
71
74
72
70
66
69
73
70
75
71
71
n/a
70
72
71
73
66
68
2017 Environmental Sustainability Importance2016 2015 2014 2013 2012
Q1. Firstly, how important should ‘environmental sustainability’ be as a responsibility for Council?
Base: All respondents. Councils asked state-wide: 20 Councils asked group: 10
Note: Please see page 5 for explanation about significant differences
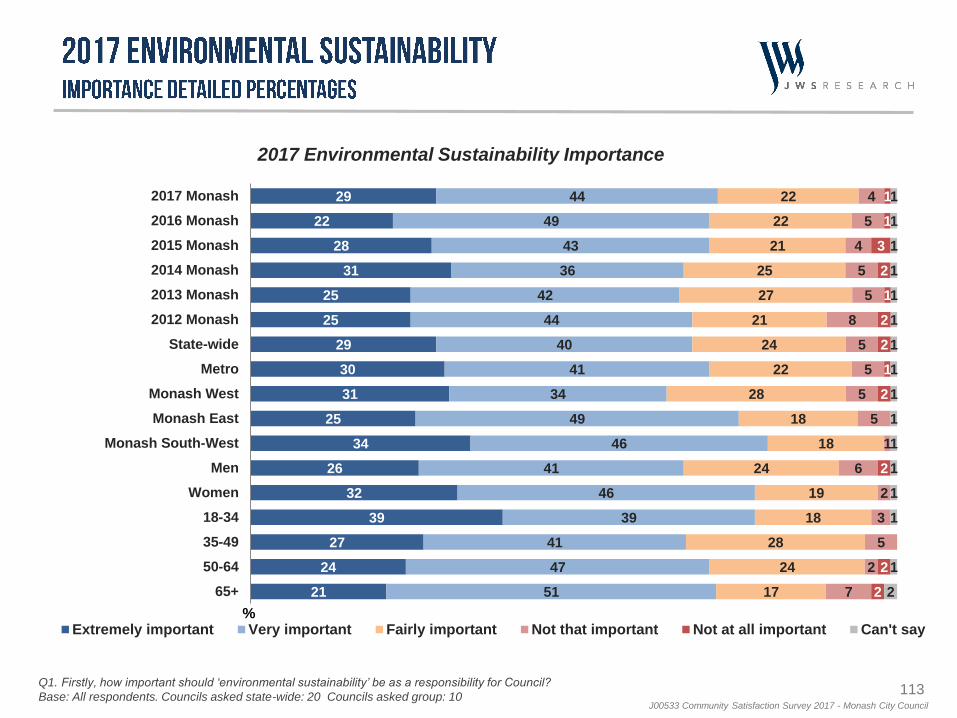
113J00533 Community Satisfaction Survey 2017 - Monash City Council
29
22
28
31
25
25
29
30
31
25
34
26
32
39
27
24
21
44
49
43
36
42
44
40
41
34
49
46
41
46
39
41
47
51
22
22
21
25
27
21
24
22
28
18
18
24
19
18
28
24
17
4
5
4
5
5
8
5
5
5
5
1
6
2
3
5
2
7
1
1
3
2
1
2
2
1
2
2
2
2
1
1
1
1
1
1
1
1
1
1
1
1
1
1
1
2
2017 Monash
2016 Monash
2015 Monash
2014 Monash
2013 Monash
2012 Monash
State-wide
Metro
Monash West
Monash East
Monash South-West
Men
Women
18-34
35-49
50-64
65+
%Extremely important Very important Fairly important Not that important Not at all important Can't say
2017 Environmental Sustainability Importance
Q1. Firstly, how important should ‘environmental sustainability’ be as a responsibility for Council?
Base: All respondents. Councils asked state-wide: 20 Councils asked group: 10
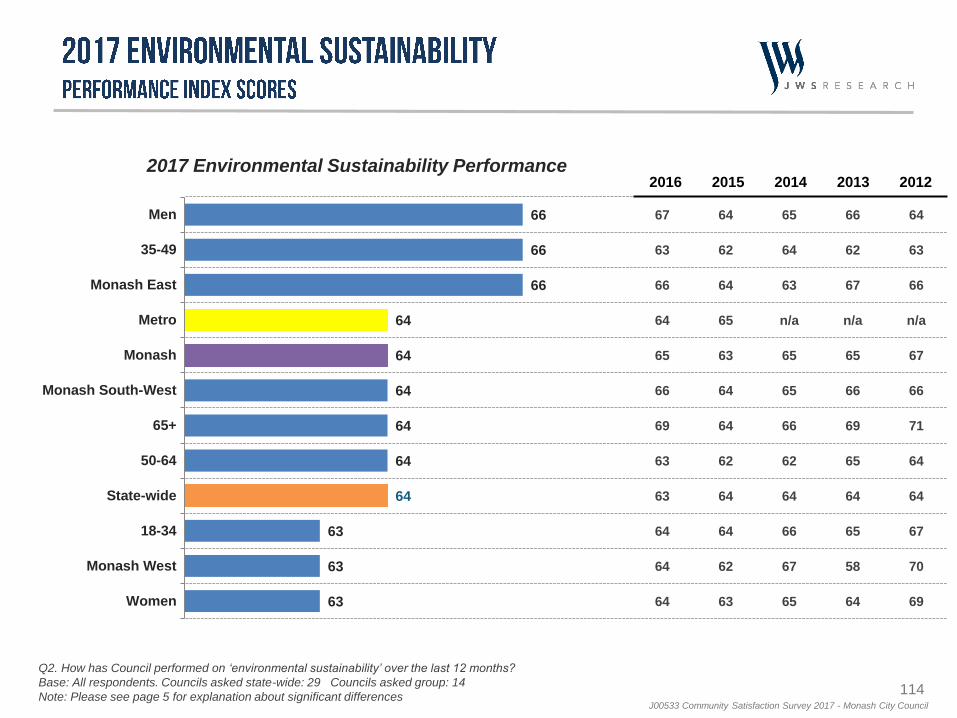
114J00533 Community Satisfaction Survey 2017 - Monash City Council
66
66
66
64
64
64
64
64
64
63
63
63
Men
35-49
Monash East
Metro
Monash
Monash South-West
65+
50-64
State-wide
18-34
Monash West
Women
67
63
66
64
65
66
69
63
63
64
64
64
64
62
64
65
63
64
64
62
64
64
62
63
65
64
63
n/a
65
65
66
62
64
66
67
65
66
62
67
n/a
65
66
69
65
64
65
58
64
64
63
66
n/a
67
66
71
64
64
67
70
69
2017 Environmental Sustainability Performance2016 2015 2014 2013 2012
Q2. How has Council performed on ‘environmental sustainability’ over the last 12 months?
Base: All respondents. Councils asked state-wide: 29 Councils asked group: 14
Note: Please see page 5 for explanation about significant differences
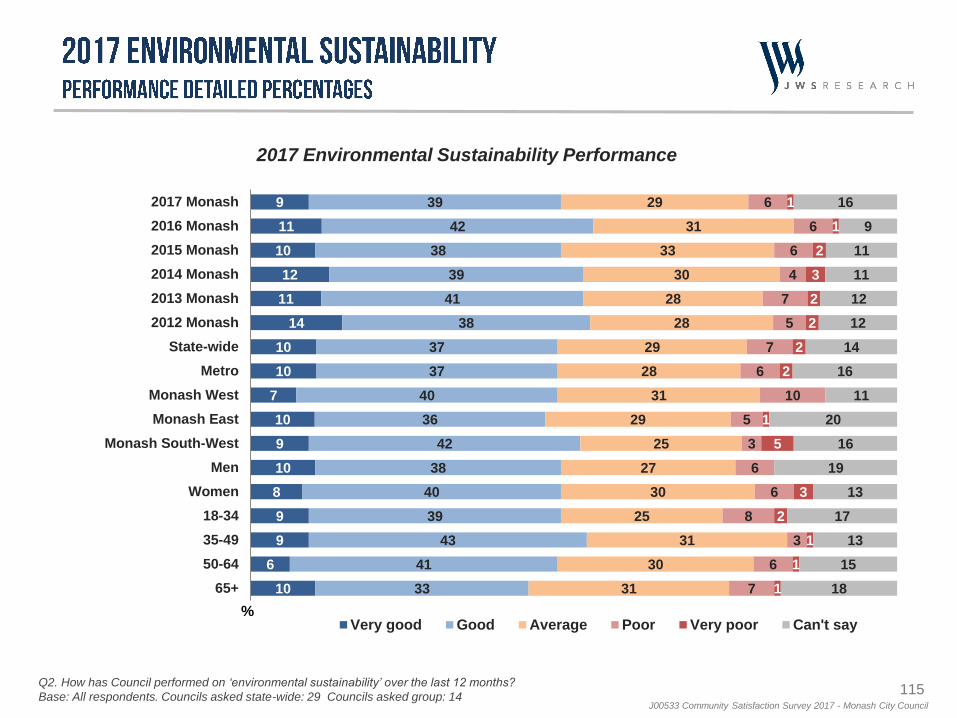
115J00533 Community Satisfaction Survey 2017 - Monash City Council
9
11
10
12
11
14
10
10
7
10
9
10
8
9
9
6
10
39
42
38
39
41
38
37
37
40
36
42
38
40
39
43
41
33
29
31
33
30
28
28
29
28
31
29
25
27
30
25
31
30
31
6
6
6
4
7
5
7
6
10
5
3
6
6
8
3
6
7
1
1
2
3
2
2
2
2
1
5
3
2
1
1
1
16
9
11
11
12
12
14
16
11
20
16
19
13
17
13
15
18
2017 Monash
2016 Monash
2015 Monash
2014 Monash
2013 Monash
2012 Monash
State-wide
Metro
Monash West
Monash East
Monash South-West
Men
Women
18-34
35-49
50-64
65+
%Very good Good Average Poor Very poor Can't say
2017 Environmental Sustainability Performance
Q2. How has Council performed on ‘environmental sustainability’ over the last 12 months?
Base: All respondents. Councils asked state-wide: 29 Councils asked group: 14
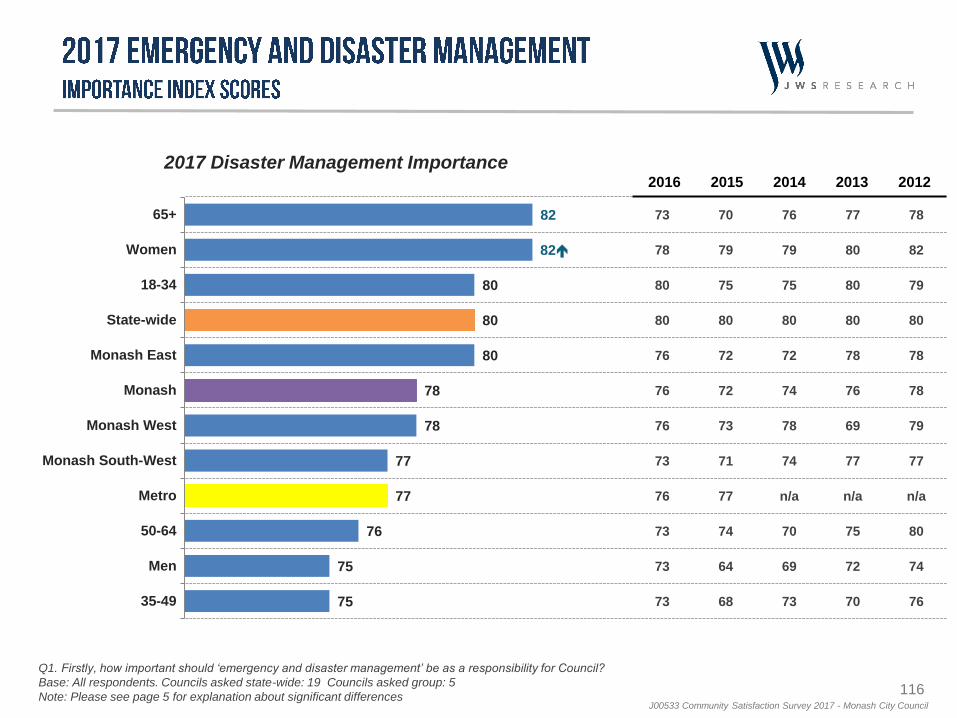
116J00533 Community Satisfaction Survey 2017 - Monash City Council
82
82
80
80
80
78
78
77
77
76
75
75
65+
Women
18-34
State-wide
Monash East
Monash
Monash West
Monash South-West
Metro
50-64
Men
35-49
73
78
80
80
76
76
76
73
76
73
73
73
70
79
75
80
72
72
73
71
77
74
64
68
76
79
75
80
72
74
78
74
n/a
70
69
73
77
80
80
80
78
76
69
77
n/a
75
72
70
78
82
79
80
78
78
79
77
n/a
80
74
76
2017 Disaster Management Importance2016 2015 2014 2013 2012
Q1. Firstly, how important should ‘emergency and disaster management’ be as a responsibility for Council?
Base: All respondents. Councils asked state-wide: 19 Councils asked group: 5
Note: Please see page 5 for explanation about significant differences
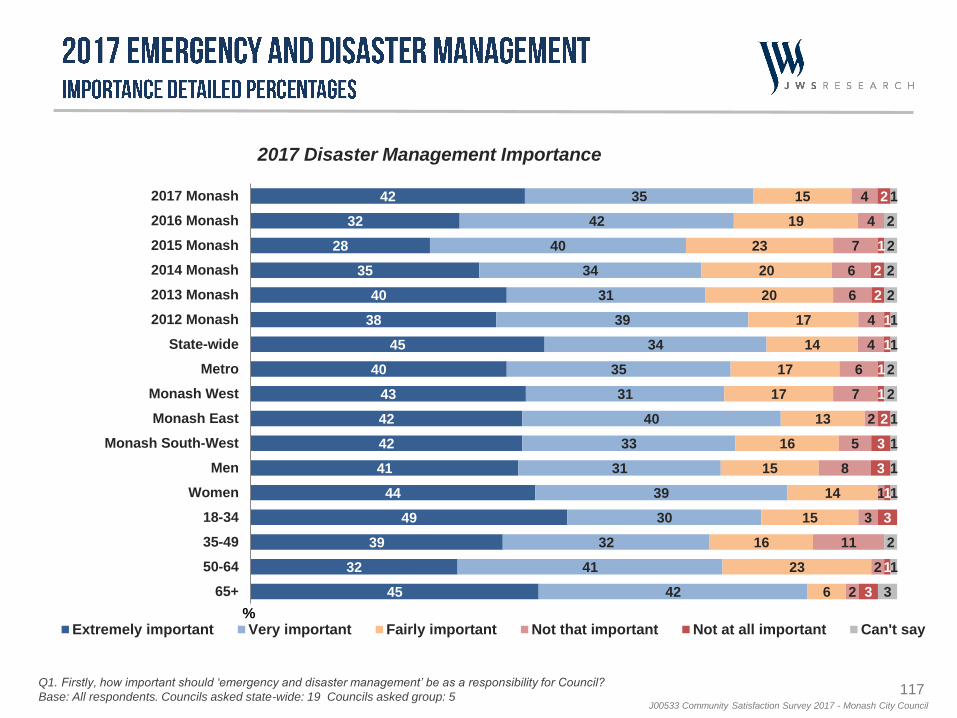
117J00533 Community Satisfaction Survey 2017 - Monash City Council
42
32
28
35
40
38
45
40
43
42
42
41
44
49
39
32
45
35
42
40
34
31
39
34
35
31
40
33
31
39
30
32
41
42
15
19
23
20
20
17
14
17
17
13
16
15
14
15
16
23
6
4
4
7
6
6
4
4
6
7
2
5
8
1
3
11
2
2
2
1
2
2
1
1
1
1
2
3
3
1
3
1
3
1
2
2
2
2
1
1
2
2
1
1
1
1
2
1
3
2017 Monash
2016 Monash
2015 Monash
2014 Monash
2013 Monash
2012 Monash
State-wide
Metro
Monash West
Monash East
Monash South-West
Men
Women
18-34
35-49
50-64
65+
%Extremely important Very important Fairly important Not that important Not at all important Can't say
2017 Disaster Management Importance
Q1. Firstly, how important should ‘emergency and disaster management’ be as a responsibility for Council?
Base: All respondents. Councils asked state-wide: 19 Councils asked group: 5
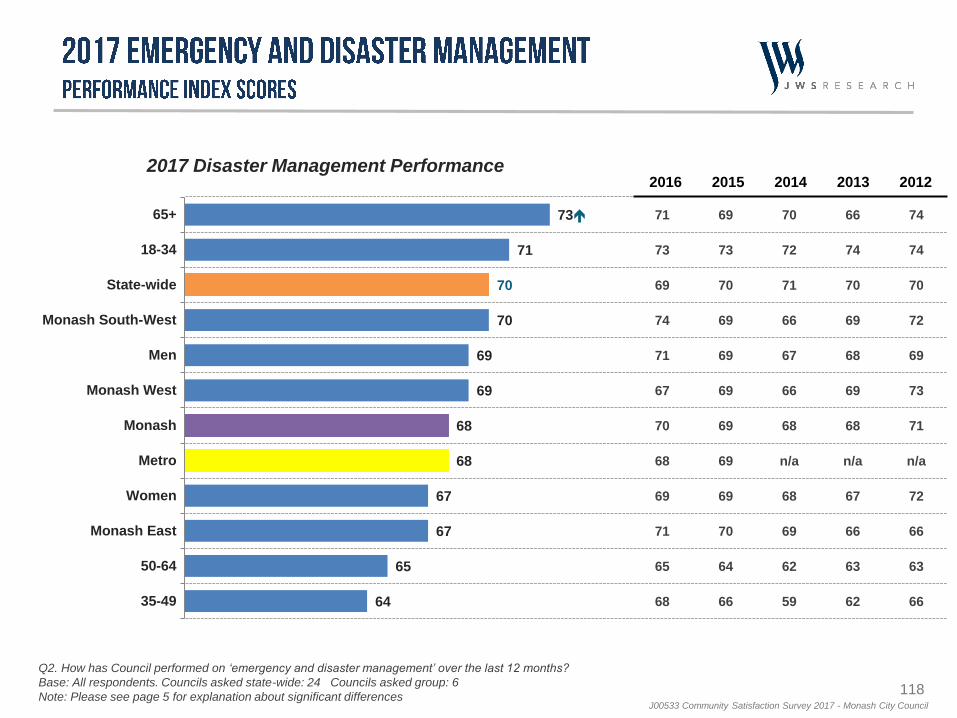
118J00533 Community Satisfaction Survey 2017 - Monash City Council
73
71
70
70
69
69
68
68
67
67
65
64
65+
18-34
State-wide
Monash South-West
Men
Monash West
Monash
Metro
Women
Monash East
50-64
35-49
71
73
69
74
71
67
70
68
69
71
65
68
69
73
70
69
69
69
69
69
69
70
64
66
70
72
71
66
67
66
68
n/a
68
69
62
59
66
74
70
69
68
69
68
n/a
67
66
63
62
74
74
70
72
69
73
71
n/a
72
66
63
66
2017 Disaster Management Performance2016 2015 2014 2013 2012
Q2. How has Council performed on ‘emergency and disaster management’ over the last 12 months?
Base: All respondents. Councils asked state-wide: 24 Councils asked group: 6
Note: Please see page 5 for explanation about significant differences
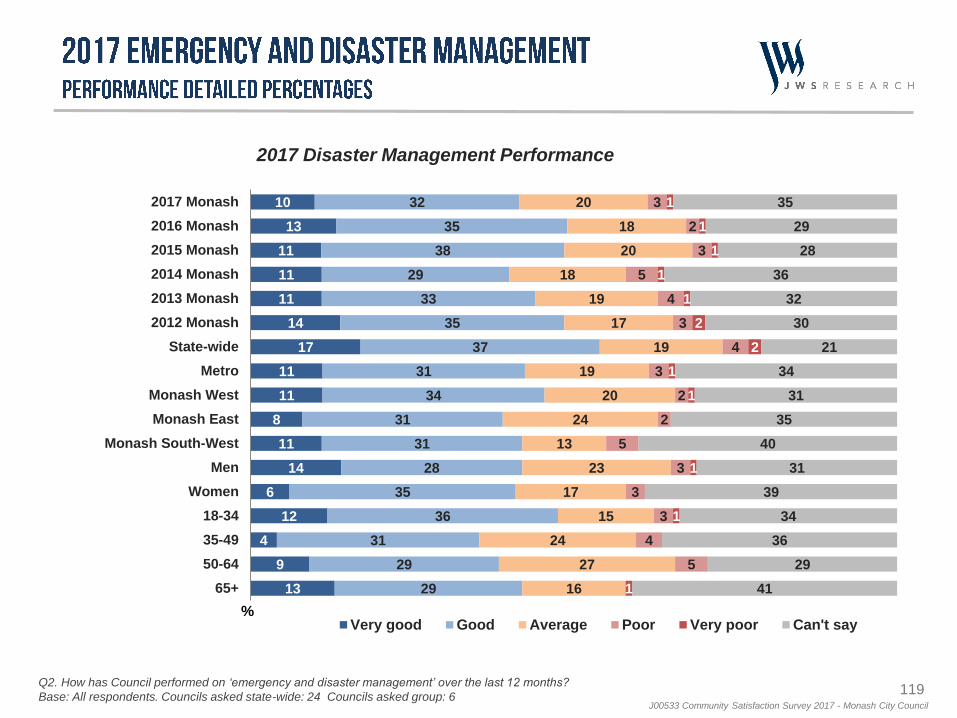
119J00533 Community Satisfaction Survey 2017 - Monash City Council
10
13
11
11
11
14
17
11
11
8
11
14
6
12
4
9
13
32
35
38
29
33
35
37
31
34
31
31
28
35
36
31
29
29
20
18
20
18
19
17
19
19
20
24
13
23
17
15
24
27
16
3
2
3
5
4
3
4
3
2
2
5
3
3
3
4
5
1
1
1
1
1
2
2
1
1
1
1
1
35
29
28
36
32
30
21
34
31
35
40
31
39
34
36
29
41
2017 Monash
2016 Monash
2015 Monash
2014 Monash
2013 Monash
2012 Monash
State-wide
Metro
Monash West
Monash East
Monash South-West
Men
Women
18-34
35-49
50-64
65+
%Very good Good Average Poor Very poor Can't say
2017 Disaster Management Performance
Q2. How has Council performed on ‘emergency and disaster management’ over the last 12 months?
Base: All respondents. Councils asked state-wide: 24 Councils asked group: 6
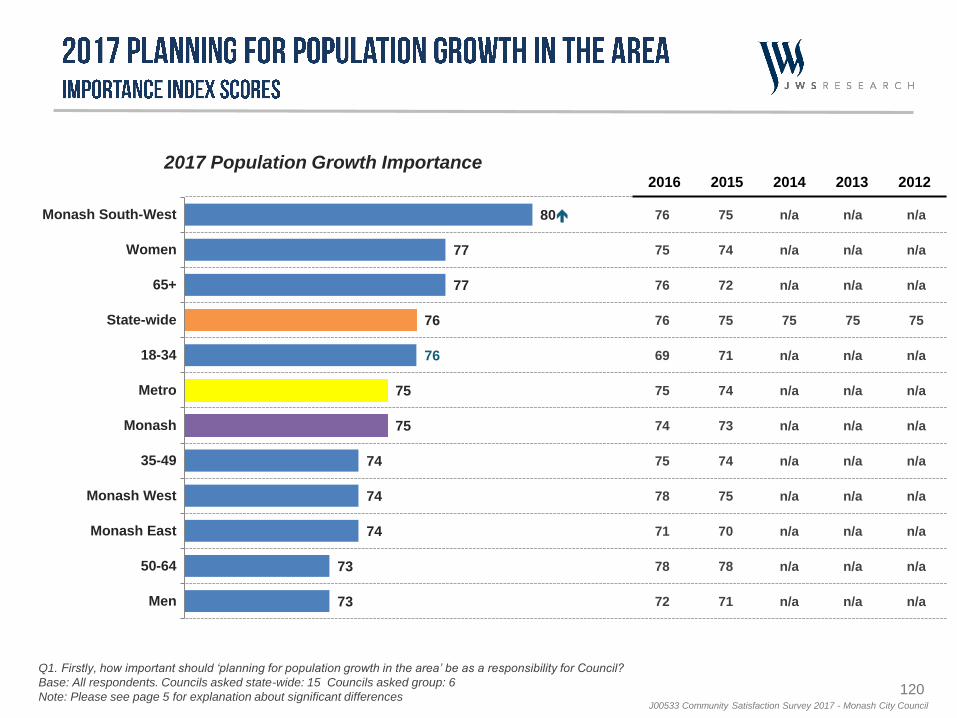
120J00533 Community Satisfaction Survey 2017 - Monash City Council
80
77
77
76
76
75
75
74
74
74
73
73
Monash South-West
Women
65+
State-wide
18-34
Metro
Monash
35-49
Monash West
Monash East
50-64
Men
76
75
76
76
69
75
74
75
78
71
78
72
75
74
72
75
71
74
73
74
75
70
78
71
n/a
n/a
n/a
75
n/a
n/a
n/a
n/a
n/a
n/a
n/a
n/a
n/a
n/a
n/a
75
n/a
n/a
n/a
n/a
n/a
n/a
n/a
n/a
n/a
n/a
n/a
75
n/a
n/a
n/a
n/a
n/a
n/a
n/a
n/a
2017 Population Growth Importance2016 2015 2014 2013 2012
Q1. Firstly, how important should ‘planning for population growth in the area’ be as a responsibility for Council?
Base: All respondents. Councils asked state-wide: 15 Councils asked group: 6
Note: Please see page 5 for explanation about significant differences
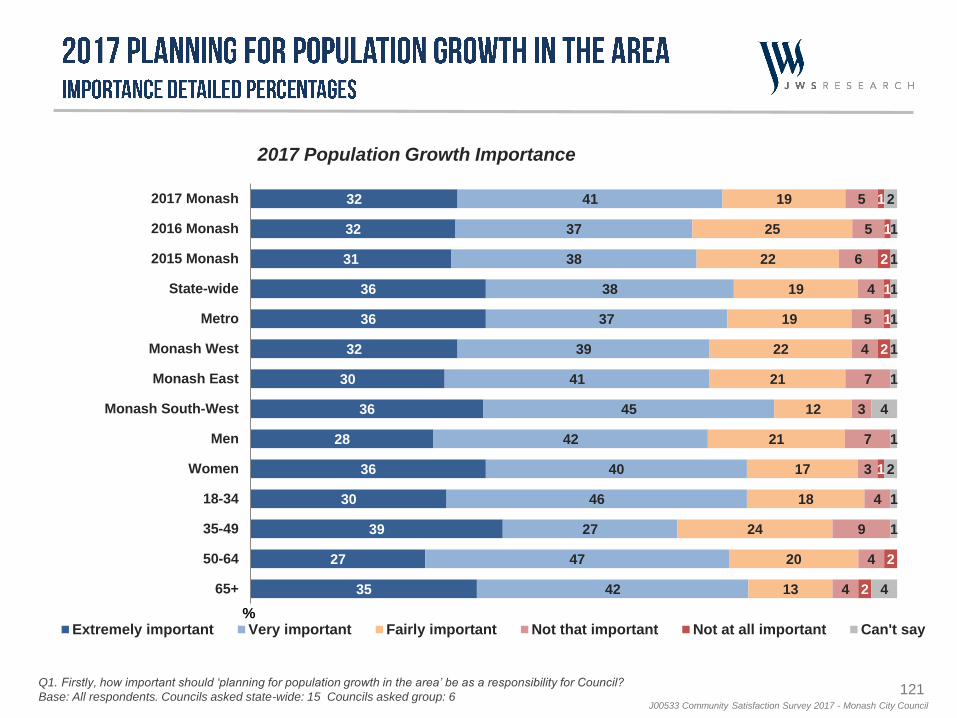
121J00533 Community Satisfaction Survey 2017 - Monash City Council
32
32
31
36
36
32
30
36
28
36
30
39
27
35
41
37
38
38
37
39
41
45
42
40
46
27
47
42
19
25
22
19
19
22
21
12
21
17
18
24
20
13
5
5
6
4
5
4
7
3
7
3
4
9
4
4
1
1
2
1
1
2
1
2
2
2
1
1
1
1
1
1
4
1
2
1
1
4
2017 Monash
2016 Monash
2015 Monash
State-wide
Metro
Monash West
Monash East
Monash South-West
Men
Women
18-34
35-49
50-64
65+
%Extremely important Very important Fairly important Not that important Not at all important Can't say
2017 Population Growth Importance
Q1. Firstly, how important should ‘planning for population growth in the area’ be as a responsibility for Council?
Base: All respondents. Councils asked state-wide: 15 Councils asked group: 6
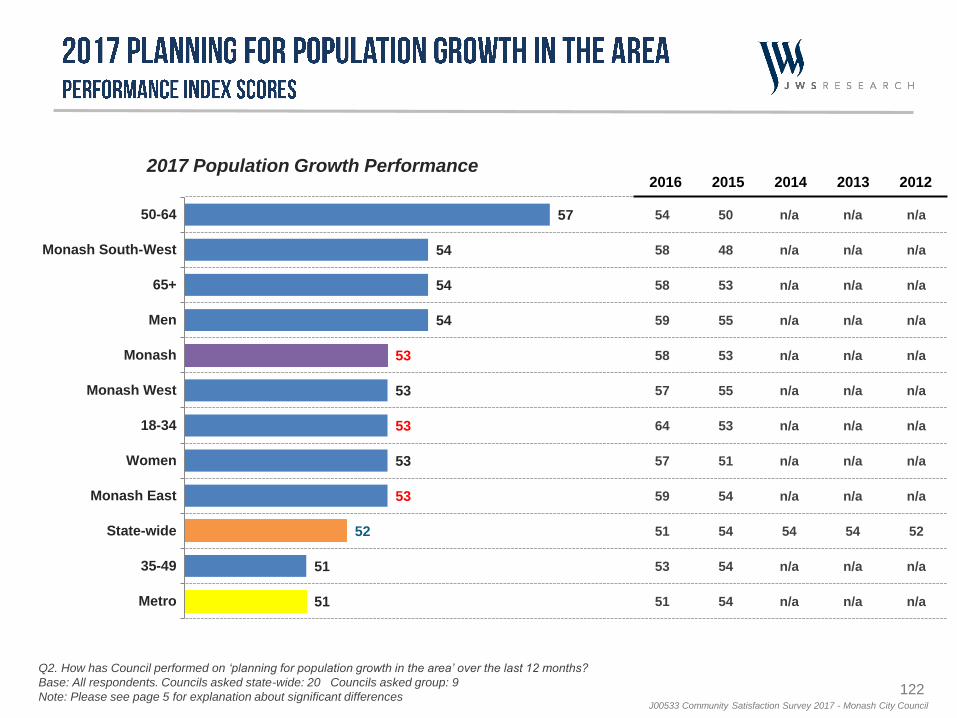
122J00533 Community Satisfaction Survey 2017 - Monash City Council
57
54
54
54
53
53
53
53
53
52
51
51
50-64
Monash South-West
65+
Men
Monash
Monash West
18-34
Women
Monash East
State-wide
35-49
Metro
54
58
58
59
58
57
64
57
59
51
53
51
50
48
53
55
53
55
53
51
54
54
54
54
n/a
n/a
n/a
n/a
n/a
n/a
n/a
n/a
n/a
54
n/a
n/a
n/a
n/a
n/a
n/a
n/a
n/a
n/a
n/a
n/a
54
n/a
n/a
n/a
n/a
n/a
n/a
n/a
n/a
n/a
n/a
n/a
52
n/a
n/a
2017 Population Growth Performance2016 2015 2014 2013 2012
Q2. How has Council performed on ‘planning for population growth in the area’ over the last 12 months?
Base: All respondents. Councils asked state-wide: 20 Councils asked group: 9
Note: Please see page 5 for explanation about significant differences
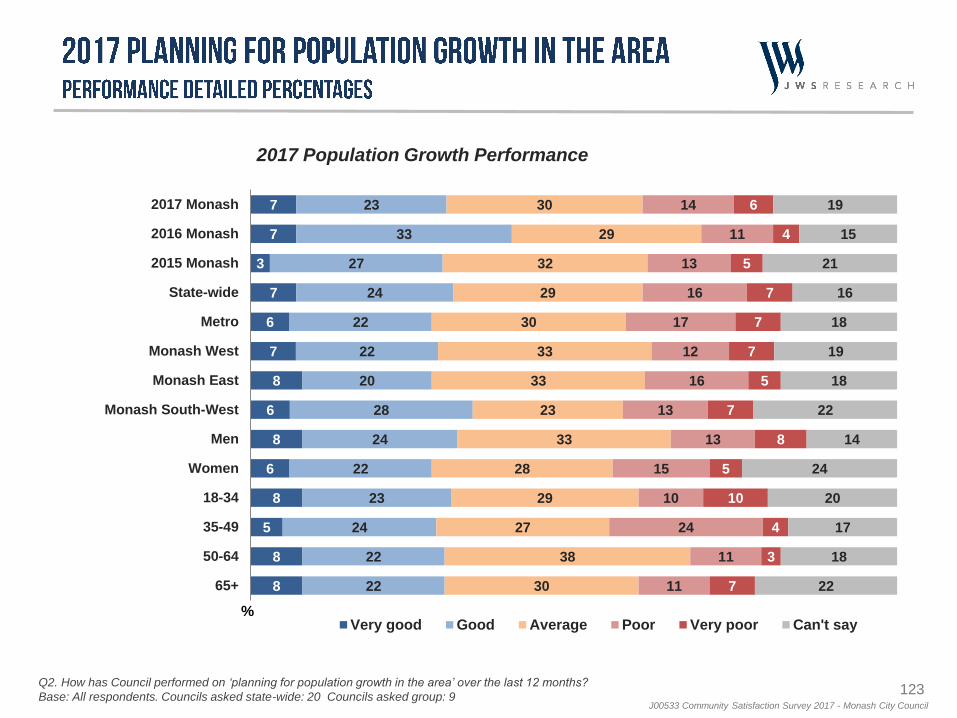
123J00533 Community Satisfaction Survey 2017 - Monash City Council
7
7
3
7
6
7
8
6
8
6
8
5
8
8
23
33
27
24
22
22
20
28
24
22
23
24
22
22
30
29
32
29
30
33
33
23
33
28
29
27
38
30
14
11
13
16
17
12
16
13
13
15
10
24
11
11
6
4
5
7
7
7
5
7
8
5
10
4
3
7
19
15
21
16
18
19
18
22
14
24
20
17
18
22
2017 Monash
2016 Monash
2015 Monash
State-wide
Metro
Monash West
Monash East
Monash South-West
Men
Women
18-34
35-49
50-64
65+
%Very good Good Average Poor Very poor Can't say
2017 Population Growth Performance
Q2. How has Council performed on ‘planning for population growth in the area’ over the last 12 months?
Base: All respondents. Councils asked state-wide: 20 Councils asked group: 9
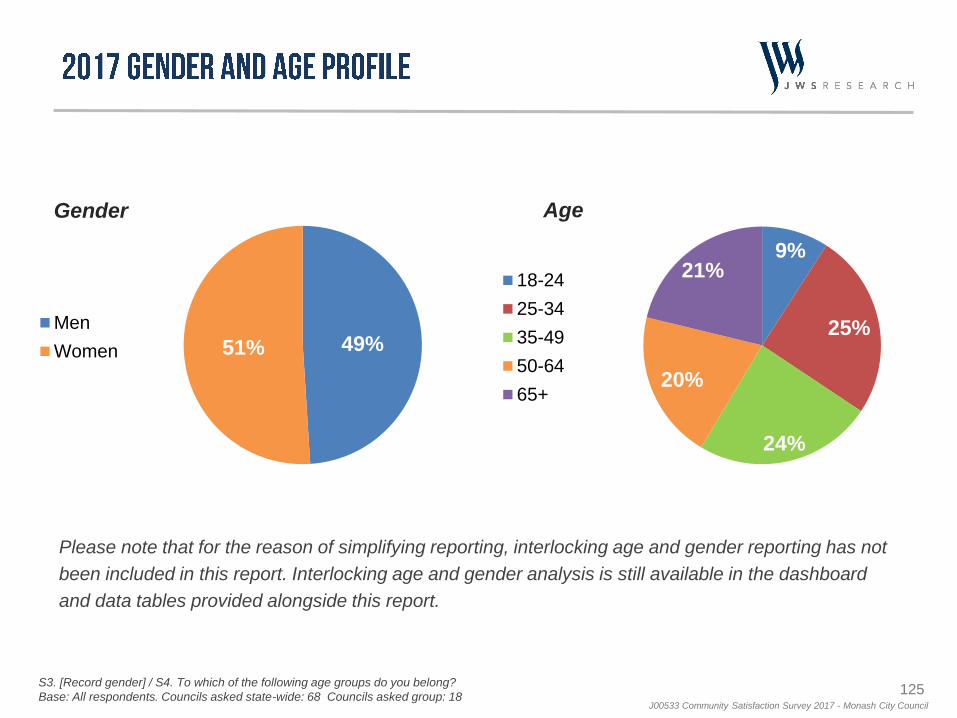
125J00533 Community Satisfaction Survey 2017 - Monash City Council
Please note that for the reason of simplifying reporting, interlocking age and gender reporting has not
been included in this report. Interlocking age and gender analysis is still available in the dashboard
and data tables provided alongside this report.
Gender Age
49%51%
Men
Women
9%
25%
24%
20%
21%18-24
25-34
35-49
50-64
65+
S3. [Record gender] / S4. To which of the following age groups do you belong?
Base: All respondents. Councils asked state-wide: 68 Councils asked group: 18
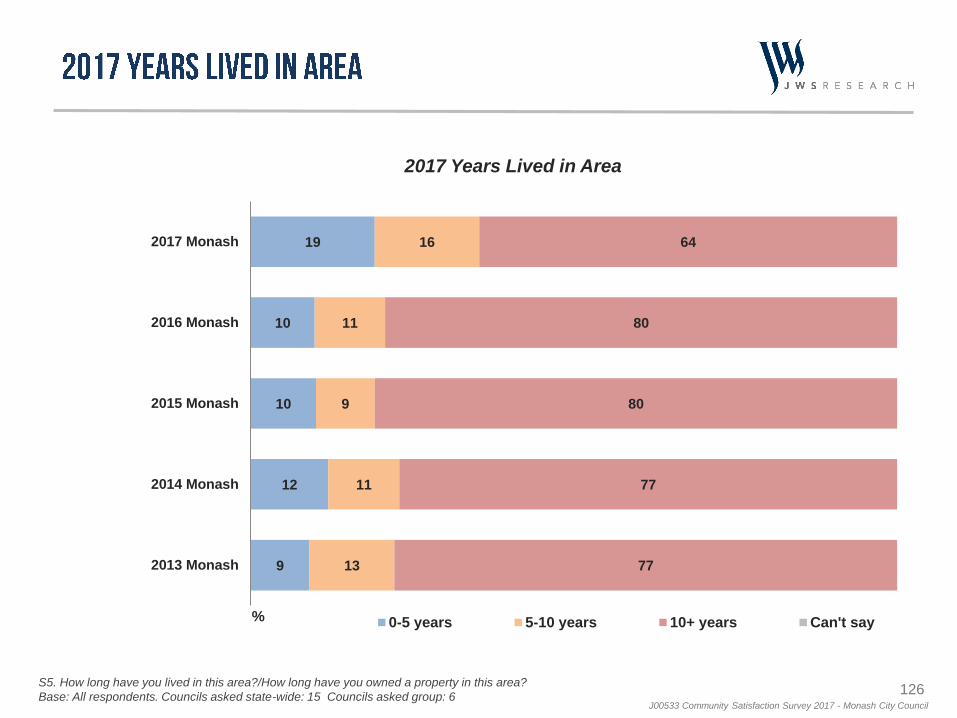
126J00533 Community Satisfaction Survey 2017 - Monash City Council
2017 Years Lived in Area
19
10
10
12
9
16
11
9
11
13
64
80
80
77
77
2017 Monash
2016 Monash
2015 Monash
2014 Monash
2013 Monash
% 0-5 years 5-10 years 10+ years Can't say
S5. How long have you lived in this area?/How long have you owned a property in this area?
Base: All respondents. Councils asked state-wide: 15 Councils asked group: 6
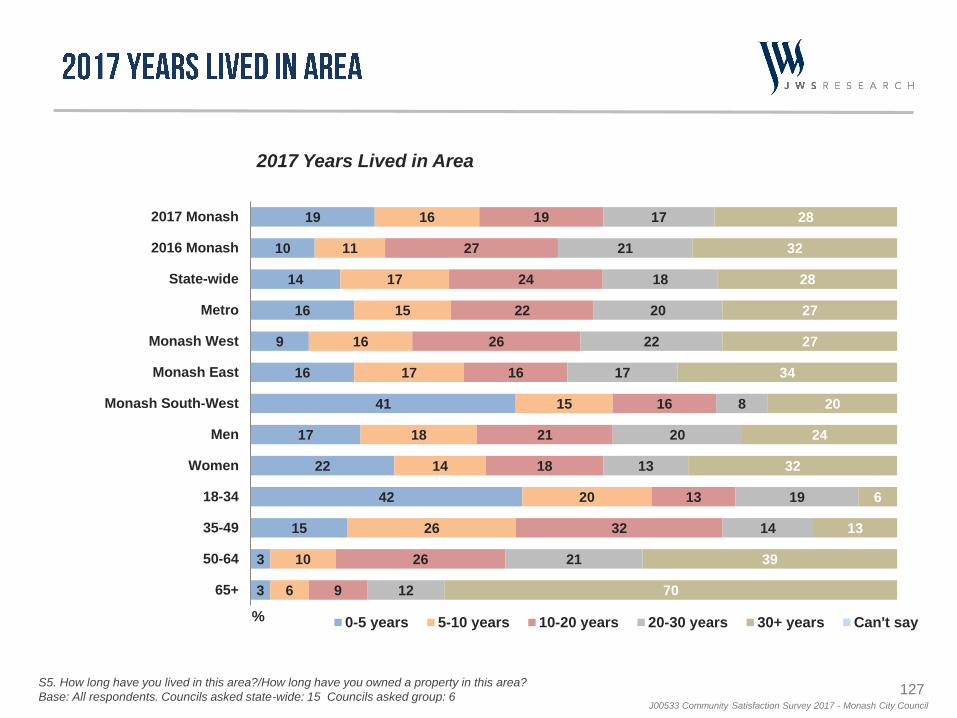
127J00533 Community Satisfaction Survey 2017 - Monash City Council
2017 Years Lived in Area
19
10
14
16
9
16
41
17
22
42
15
3
3
16
11
17
15
16
17
15
18
14
20
26
10
6
19
27
24
22
26
16
16
21
18
13
32
26
9
17
21
18
20
22
17
8
20
13
19
14
21
12
28
32
28
27
27
34
20
24
32
6
13
39
70
2017 Monash
2016 Monash
State-wide
Metro
Monash West
Monash East
Monash South-West
Men
Women
18-34
35-49
50-64
65+
% 0-5 years 5-10 years 10-20 years 20-30 years 30+ years Can't say
S5. How long have you lived in this area?/How long have you owned a property in this area?
Base: All respondents. Councils asked state-wide: 15 Councils asked group: 6
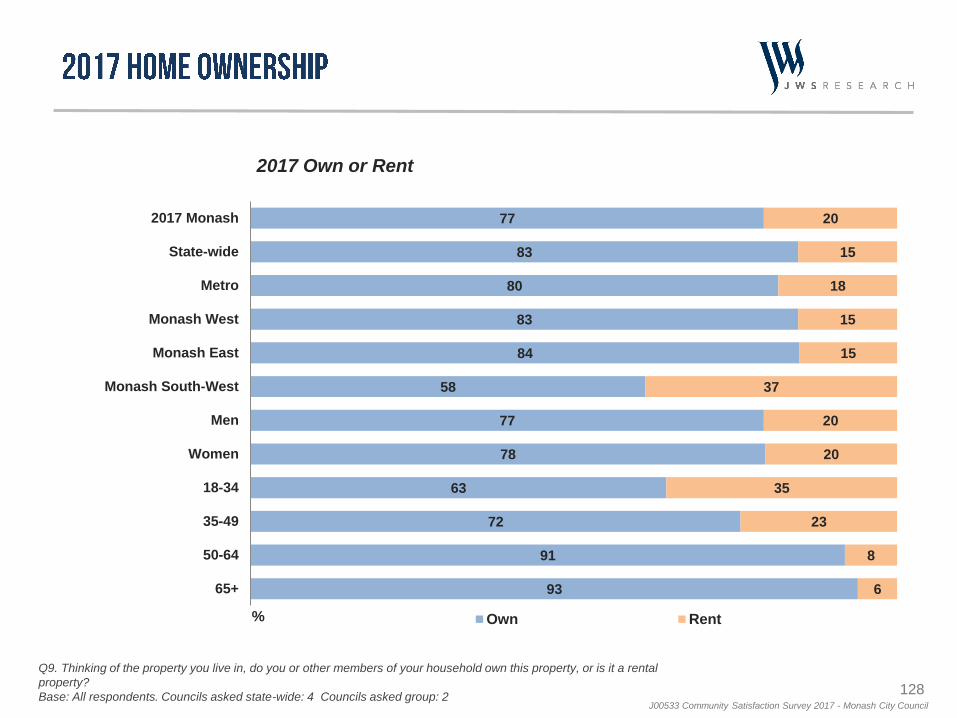
128J00533 Community Satisfaction Survey 2017 - Monash City Council
2017 Own or Rent
77
83
80
83
84
58
77
78
63
72
91
93
20
15
18
15
15
37
20
20
35
23
8
6
2017 Monash
State-wide
Metro
Monash West
Monash East
Monash South-West
Men
Women
18-34
35-49
50-64
65+
% Own Rent
Q9. Thinking of the property you live in, do you or other members of your household own this property, or is it a rental
property?
Base: All respondents. Councils asked state-wide: 4 Councils asked group: 2
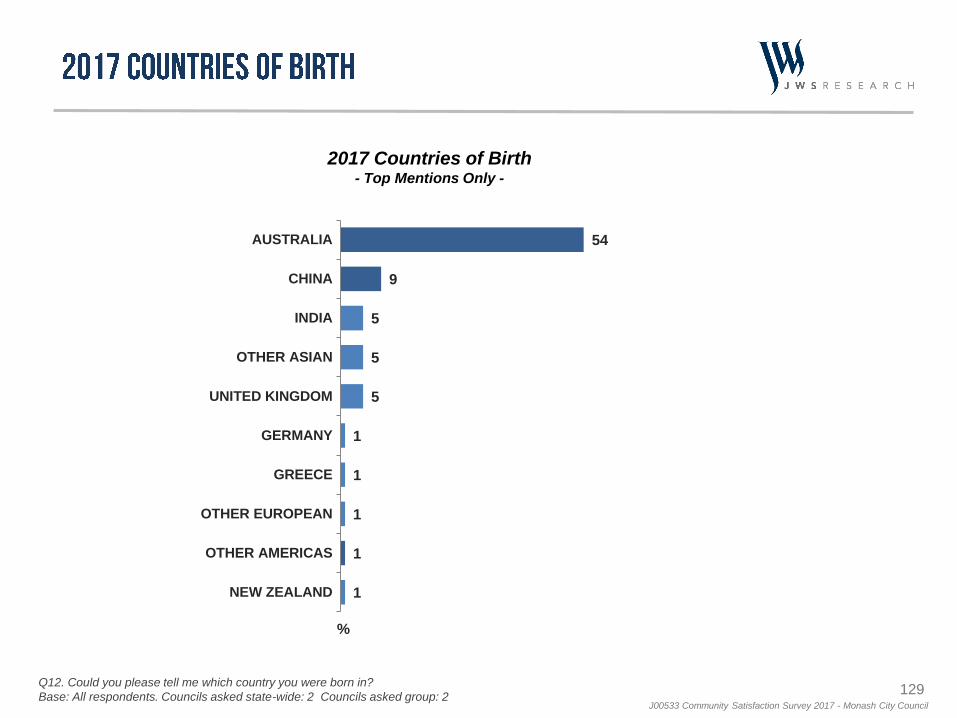
129J00533 Community Satisfaction Survey 2017 - Monash City Council
2017 Countries of Birth- Top Mentions Only -
%
54
9
5
5
5
1
1
1
1
1
AUSTRALIA
CHINA
INDIA
OTHER ASIAN
UNITED KINGDOM
GERMANY
GREECE
OTHER EUROPEAN
OTHER AMERICAS
NEW ZEALAND
Q12. Could you please tell me which country you were born in?
Base: All respondents. Councils asked state-wide: 2 Councils asked group: 2
132J00533 Community Satisfaction Survey 2017 - Monash City Council
The survey was revised in 2012. As a result:
The survey is now conducted as a representative random probability survey of residents aged 18
years or over in local councils, whereas previously it was conducted as a ‘head of household’
survey.
As part of the change to a representative resident survey, results are now weighted post survey to
the known population distribution of Monash City Council according to the most recently available
Australian Bureau of Statistics population estimates, whereas the results were previously not
weighted.
The service responsibility area performance measures have changed significantly and the rating
scale used to assess performance has also changed.
As such, the results of the 2012 State-wide Local Government Community Satisfaction Survey should
be considered as a benchmark. Please note that comparisons should not be made with the State-wide
Local Government Community Satisfaction Survey results from 2011 and prior due to the
methodological and sampling changes. Comparisons in the period 2012-2017 have been made
throughout this report as appropriate.
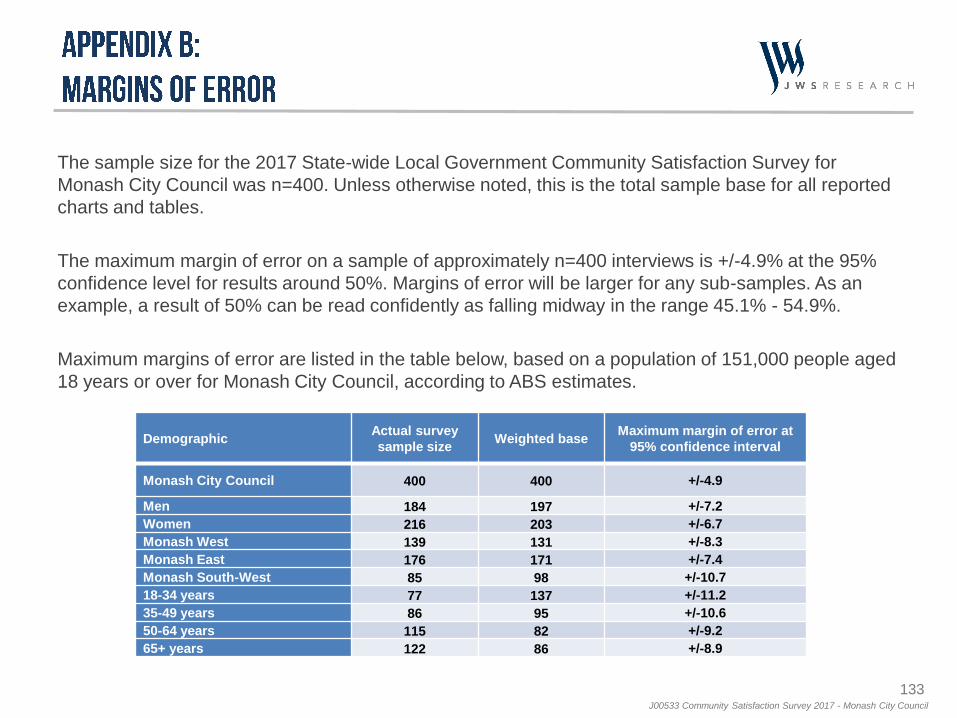
133J00533 Community Satisfaction Survey 2017 - Monash City Council
Demographic Actual survey
sample sizeWeighted base
Maximum margin of error at
95% confidence interval
Monash City Council 400 400 +/-4.9
Men 184 197 +/-7.2
Women 216 203 +/-6.7
Monash West 139 131 +/-8.3
Monash East 176 171 +/-7.4
Monash South-West 85 98 +/-10.7
18-34 years 77 137 +/-11.2
35-49 years 86 95 +/-10.6
50-64 years 115 82 +/-9.2
65+ years 122 86 +/-8.9
The sample size for the 2017 State-wide Local Government Community Satisfaction Survey for
Monash City Council was n=400. Unless otherwise noted, this is the total sample base for all reported
charts and tables.
The maximum margin of error on a sample of approximately n=400 interviews is +/-4.9% at the 95%
confidence level for results around 50%. Margins of error will be larger for any sub-samples. As an
example, a result of 50% can be read confidently as falling midway in the range 45.1% - 54.9%.
Maximum margins of error are listed in the table below, based on a population of 151,000 people aged
18 years or over for Monash City Council, according to ABS estimates.
134J00533 Community Satisfaction Survey 2017 - Monash City Council
All participating councils are listed in the state-wide report published on the DELWP website. In 2017,
68 of the 79 Councils throughout Victoria participated in this survey. For consistency of analysis and
reporting across all projects, Local Government Victoria has aligned its presentation of data to use
standard council groupings. Accordingly, the council reports for the community satisfaction survey
provide analysis using these standard council groupings. Please note that councils participating across
2012-2017 vary slightly.
Council Groups
Monash City Council is classified as a Metropolitan council according to the following classification list:
Metropolitan, Interface, Regional Centres, Large Rural & Small Rural
Councils participating in the Metropolitan group are: Banyule, Bayside, Boroondara, Brimbank, Glen
Eira, Greater Dandenong, Frankston, Kingston, Knox, Manningham, Maroondah, Melbourne, Monash,
Moonee Valley, Moreland, Port Phillip, Stonnington and Whitehorse.
Wherever appropriate, results for Monash City Council for this 2017 State-wide Local Government
Community Satisfaction Survey have been compared against other participating councils in the
Metropolitan group and on a state-wide basis. Please note that council groupings changed for 2015,
and as such comparisons to council group results before that time can not be made within the reported
charts.
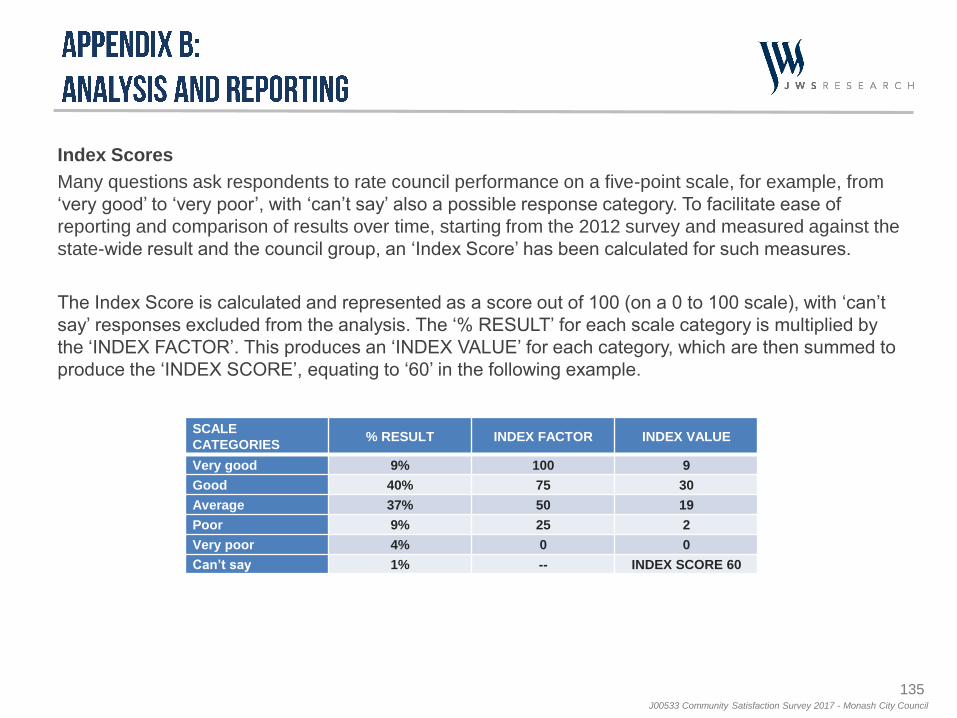
135J00533 Community Satisfaction Survey 2017 - Monash City Council
Index Scores
Many questions ask respondents to rate council performance on a five-point scale, for example, from
‘very good’ to ‘very poor’, with ‘can’t say’ also a possible response category. To facilitate ease of
reporting and comparison of results over time, starting from the 2012 survey and measured against the
state-wide result and the council group, an ‘Index Score’ has been calculated for such measures.
The Index Score is calculated and represented as a score out of 100 (on a 0 to 100 scale), with ‘can’t
say’ responses excluded from the analysis. The ‘% RESULT’ for each scale category is multiplied by
the ‘INDEX FACTOR’. This produces an ‘INDEX VALUE’ for each category, which are then summed to
produce the ‘INDEX SCORE’, equating to ‘60’ in the following example.
SCALE
CATEGORIES% RESULT INDEX FACTOR INDEX VALUE
Very good 9% 100 9
Good 40% 75 30
Average 37% 50 19
Poor 9% 25 2
Very poor 4% 0 0
Can’t say 1% -- INDEX SCORE 60
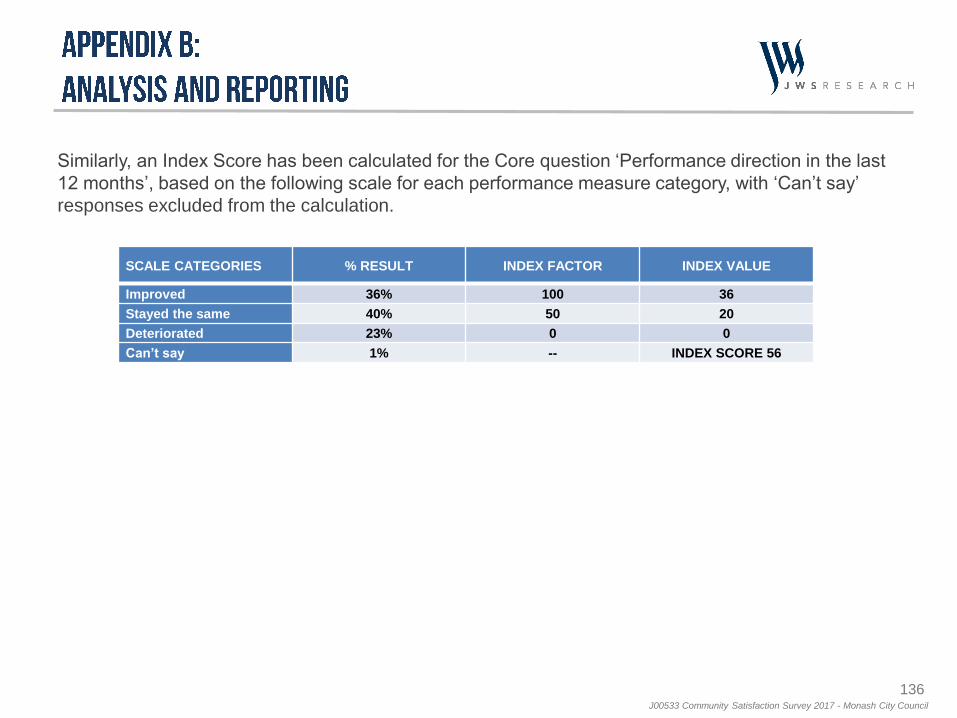
136J00533 Community Satisfaction Survey 2017 - Monash City Council
Similarly, an Index Score has been calculated for the Core question ‘Performance direction in the last
12 months’, based on the following scale for each performance measure category, with ‘Can’t say’
responses excluded from the calculation.
SCALE CATEGORIES % RESULT INDEX FACTOR INDEX VALUE
Improved 36% 100 36
Stayed the same 40% 50 20
Deteriorated 23% 0 0
Can’t say 1% -- INDEX SCORE 56
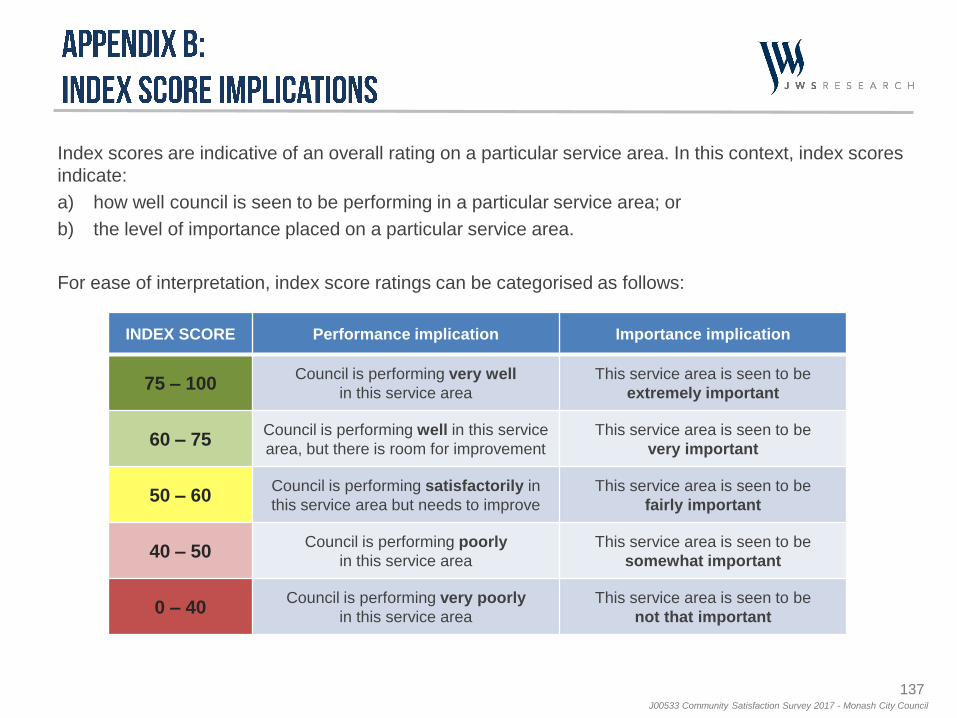
137J00533 Community Satisfaction Survey 2017 - Monash City Council
Index scores are indicative of an overall rating on a particular service area. In this context, index scores
indicate:
a) how well council is seen to be performing in a particular service area; or
b) the level of importance placed on a particular service area.
For ease of interpretation, index score ratings can be categorised as follows:
INDEX SCORE Performance implication Importance implication
75 – 100Council is performing very well
in this service area
This service area is seen to be
extremely important
60 – 75Council is performing well in this service
area, but there is room for improvement
This service area is seen to be
very important
50 – 60Council is performing satisfactorily in
this service area but needs to improve
This service area is seen to be
fairly important
40 – 50Council is performing poorly
in this service area
This service area is seen to be
somewhat important
0 – 40Council is performing very poorly
in this service area
This service area is seen to be
not that important
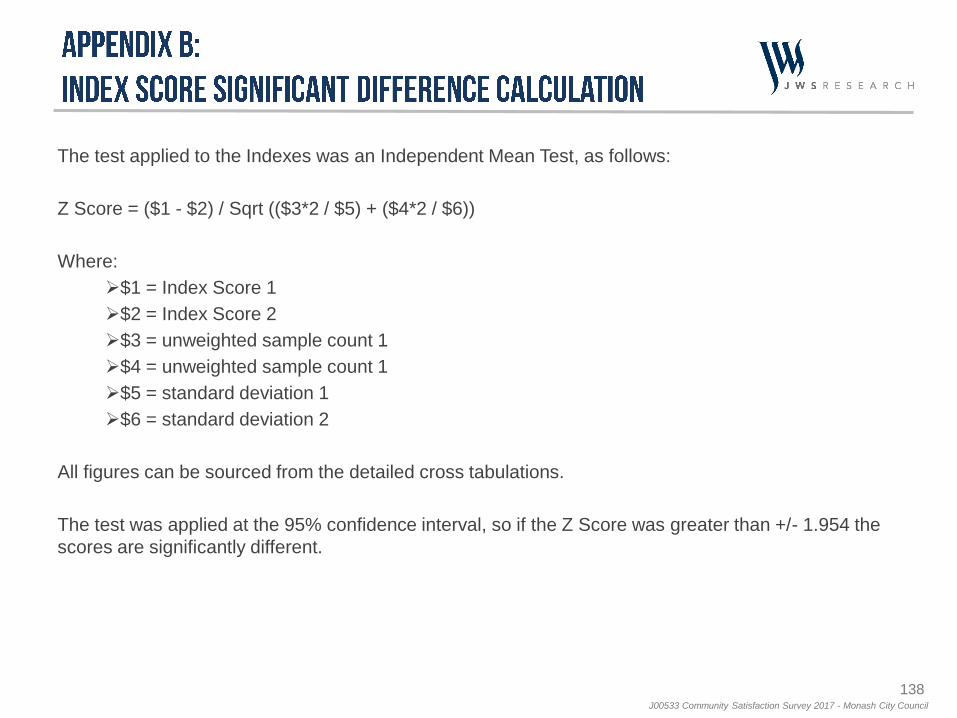
138J00533 Community Satisfaction Survey 2017 - Monash City Council
The test applied to the Indexes was an Independent Mean Test, as follows:
Z Score = ($1 - $2) / Sqrt (($3*2 / $5) + ($4*2 / $6))
Where:
$1 = Index Score 1
$2 = Index Score 2
$3 = unweighted sample count 1
$4 = unweighted sample count 1
$5 = standard deviation 1
$6 = standard deviation 2
All figures can be sourced from the detailed cross tabulations.
The test was applied at the 95% confidence interval, so if the Z Score was greater than +/- 1.954 the
scores are significantly different.
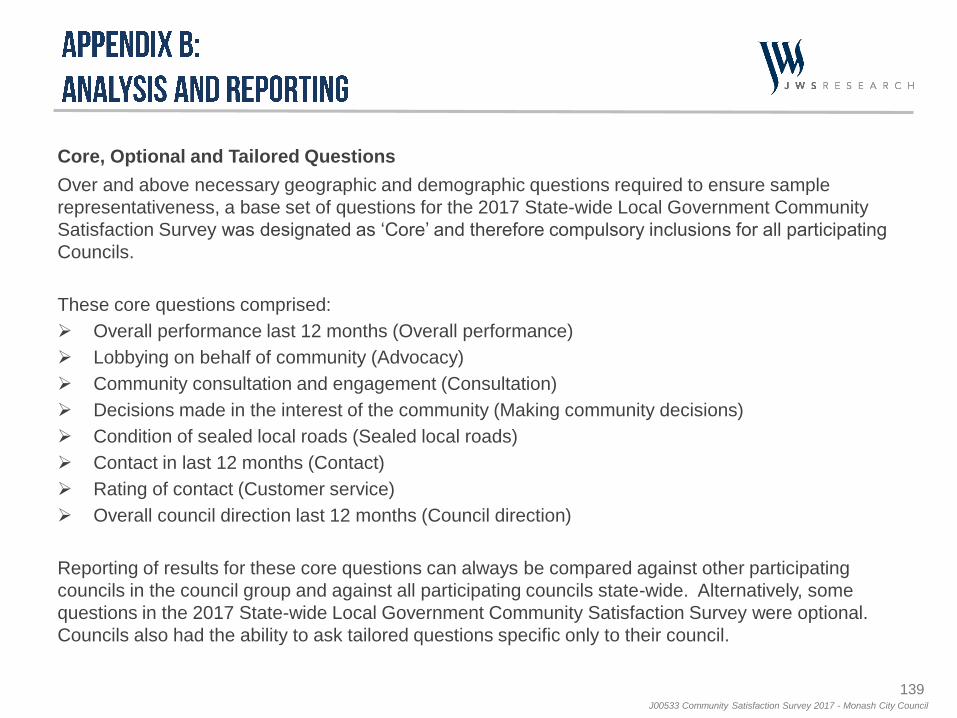
139J00533 Community Satisfaction Survey 2017 - Monash City Council
Core, Optional and Tailored Questions
Over and above necessary geographic and demographic questions required to ensure sample
representativeness, a base set of questions for the 2017 State-wide Local Government Community
Satisfaction Survey was designated as ‘Core’ and therefore compulsory inclusions for all participating
Councils.
These core questions comprised:
Overall performance last 12 months (Overall performance)
Lobbying on behalf of community (Advocacy)
Community consultation and engagement (Consultation)
Decisions made in the interest of the community (Making community decisions)
Condition of sealed local roads (Sealed local roads)
Contact in last 12 months (Contact)
Rating of contact (Customer service)
Overall council direction last 12 months (Council direction)
Reporting of results for these core questions can always be compared against other participating
councils in the council group and against all participating councils state-wide. Alternatively, some
questions in the 2017 State-wide Local Government Community Satisfaction Survey were optional.
Councils also had the ability to ask tailored questions specific only to their council.
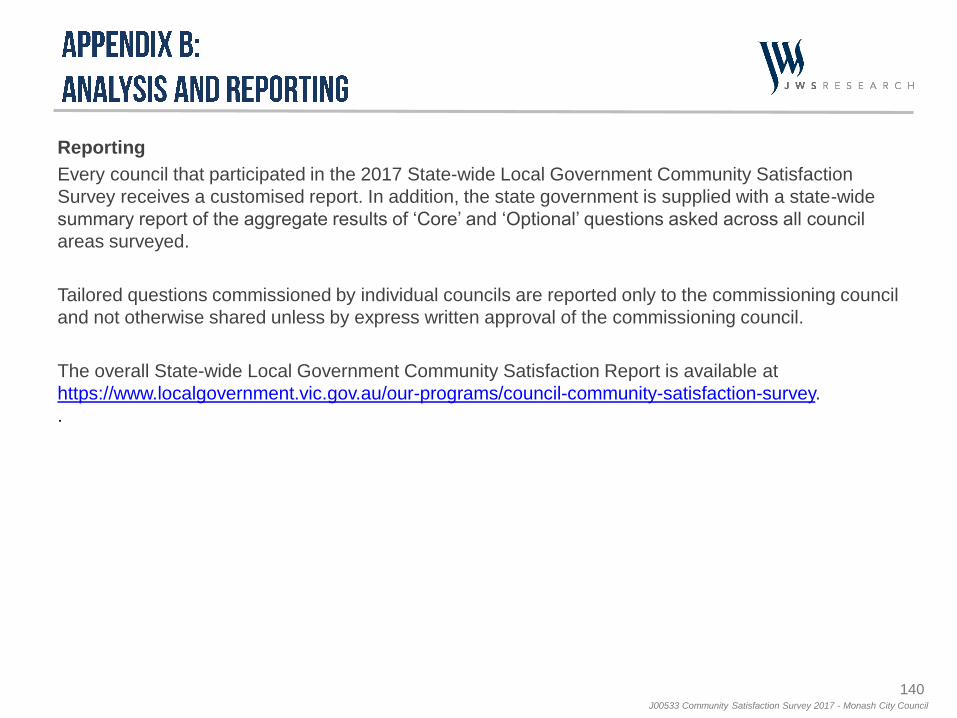
140J00533 Community Satisfaction Survey 2017 - Monash City Council
Reporting
Every council that participated in the 2017 State-wide Local Government Community Satisfaction
Survey receives a customised report. In addition, the state government is supplied with a state-wide
summary report of the aggregate results of ‘Core’ and ‘Optional’ questions asked across all council
areas surveyed.
Tailored questions commissioned by individual councils are reported only to the commissioning council
and not otherwise shared unless by express written approval of the commissioning council.
The overall State-wide Local Government Community Satisfaction Report is available at
https://www.localgovernment.vic.gov.au/our-programs/council-community-satisfaction-survey.
.
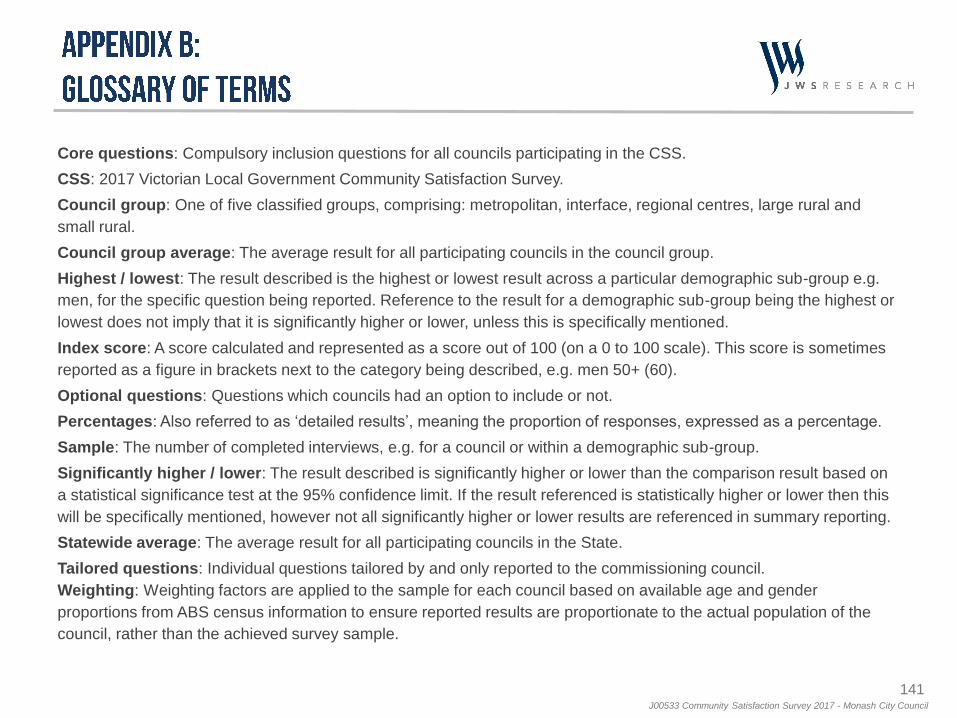
141J00533 Community Satisfaction Survey 2017 - Monash City Council
Core questions: Compulsory inclusion questions for all councils participating in the CSS.
CSS: 2017 Victorian Local Government Community Satisfaction Survey.
Council group: One of five classified groups, comprising: metropolitan, interface, regional centres, large rural and
small rural.
Council group average: The average result for all participating councils in the council group.
Highest / lowest: The result described is the highest or lowest result across a particular demographic sub-group e.g.
men, for the specific question being reported. Reference to the result for a demographic sub-group being the highest or
lowest does not imply that it is significantly higher or lower, unless this is specifically mentioned.
Index score: A score calculated and represented as a score out of 100 (on a 0 to 100 scale). This score is sometimes
reported as a figure in brackets next to the category being described, e.g. men 50+ (60).
Optional questions: Questions which councils had an option to include or not.
Percentages: Also referred to as ‘detailed results’, meaning the proportion of responses, expressed as a percentage.
Sample: The number of completed interviews, e.g. for a council or within a demographic sub-group.
Significantly higher / lower: The result described is significantly higher or lower than the comparison result based on
a statistical significance test at the 95% confidence limit. If the result referenced is statistically higher or lower then this
will be specifically mentioned, however not all significantly higher or lower results are referenced in summary reporting.
Statewide average: The average result for all participating councils in the State.
Tailored questions: Individual questions tailored by and only reported to the commissioning council.
Weighting: Weighting factors are applied to the sample for each council based on available age and gender
proportions from ABS census information to ensure reported results are proportionate to the actual population of the
council, rather than the achieved survey sample.
Contact Us:
03 8685 8555
John Scales
Managing Director
Mark Zuker
Managing Director