Embed Size (px)
Citation preview

Fundamentals of Asset Management
Background: Optimized Investment Decision
Making
A Hands-On Approach

Advancing Asset Management 2
Investment Decision-Making
Root Cause;
RCM; PdM;
ORDM
Confidence Level
Rating; Strategic
Validation;
ORDM
View 6: AM plan 10-step process
Develop
Asset
Registry
Assess
Performance,
Failure Modes
Determine
Residual
Life
Determine
Life Cycle &
Replacement
Costs
Set Target
Levels of
Service (LOS)
Determine
Business Risk
(“Criticality”)
Optimize
O&M
Investment
Optimize
Capital
Investment
Determine
Funding
Strategy
Build AM
Plan

Advancing Asset Management 3
Three fundamental management decisions
1. What are my work crews doing, where are they
doing it—and why?
2. What CIP projects should be done—and when?
3. When should I repair, when should I rehab, when
should I replace?
These decisions typically account for over 80% of a
utility’s annual expenditures

Advancing Asset Management 4
Asset decision framework
Big picture
Whole portfolio
perspective
• Trends
• Macro forces
Policy framework
Budget arena
Micro view
Event based
Specific asset focus
Case-by-case decision
points
Maintain? Repair? Refurbish? Replace? Augment?

Advancing Asset Management 5
There exists for every asset, a theoretical ―best‖
investment
Optio
n 1
Optio
n 2
Optio
n 3
Optio
n 4
Optio
n 5
20
02
To
da
y
2005
2015
2025
2030
2035
Treatment options M M RH RP RP
Direct Cost 270 72 360 610 630
Indirect Cost 0 10 20 40 130
Benefit 200 75 480 780 320
Option Ranking 4 3 1 2 5
Decay Curve
Catastrophic Failure
100% Level of Service
Minimum Level of Service
Benefit/Cost Ratio 0.7 0.9 1.3 1.2 0.42

Advancing Asset Management
Option 3 Replace
Option 2 Refurbish
Option 1 Repair
Preventive Maintenance
Maintenance/repair
Rehabilitation
Replace
Managing the ―asset consumption‖ process
Advancing Asset Management 7
Bringing it all together
Repair-refurbish-replace decision
1. Fix when broken (run to failure)
2. End of prescriptive life
12 years old
3,000 run-time hours
35,000 miles
3. Rule of thumb
3 breaks per mile or in 24 hours
Poor condition (and worst first)
FCI > 6% (Facility condition index—O&M as a
percentage of replacement cost)
4. Optimized renewal decision making (ORDM)

Advancing Asset Management 8
What is optimized decision making?
Systematic search for lowest-cost renewal investment
Based on interaction of
• Cost trends (direct O&M, indirect)
• Condition trends (decay/survivor curve)
• Risk-consequence trends
Three major approaches
• Valued expert judgment
• Lowest projected average life-cycle cost per year of residual life;
• Operational costs
• Risk-weighted, full economic costs
• Intervention factors; condition, performance, reliability, Business Risk Exposure, etc.
Advancing Asset Management 9
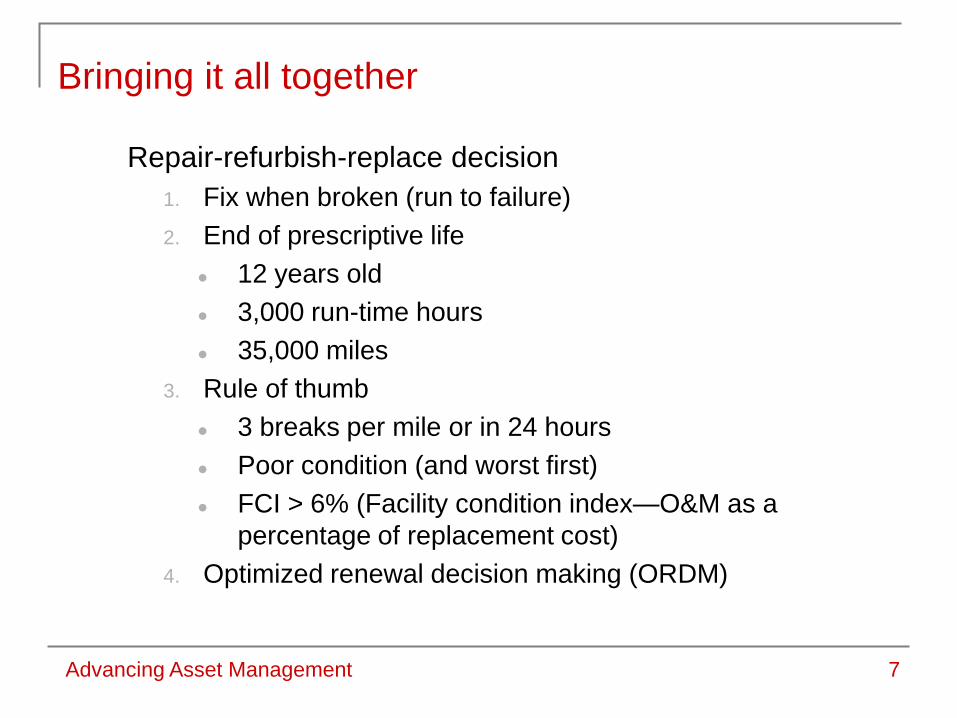
Three levels of ORDM
Level 1 Decision tables/trees
• Structured, often substantially qualitative, value judgment-based
• Event-focused, scenario-based
Level 2 Lowest average PV life cycle cost scenario analysis
• Specific decision event-focused
• Spreadsheet-driven
• Can be used to refine decision tables/trees
Level 3 Integrated intervention and full economic life cycle cost optimization
• Sophisticated modeling
• Objective function-driven
• Both portfolio- and event-driven

Advancing Asset Management 10
So, what to we mean by…
Minimum life cycle cost strategies
Fundamental asset management options available to the management team are:
Do nothing (zero-based strategy)
Status quo
Operate differently
Maintain differently—run to failure, preventive-based, predictive-based (condition, usage)
Repair
Refurbish/rehabilitate
Replace
Decommission
Non asset-based
Which strategy for each asset?
Combinations over life cycle
It’s all investment!

Advancing Asset Management 11
What do we mean by ―alternative (management)
treatment options‖?
Maintain
and Repair
Option 1
Option 2
Refurbish
Option 1
Option 2
Replace
Option 1
Option 2
Option 3
Non-asset
Options
Option 1
Advancing Asset Management 12
Maintenance/repair 0ption 1
Capital
Maintenance
Total
Yr 1 Yr 2 Yr 4 Yr 5
Say, a 5-year solution
Operations
Yr3
NPV Total
Costs Maintenance/repair 0ption 1...N
Capital
Maintenance
Total
Yr 1 Yr 2
Operations
Yr3
NPV Total
Costs
Refurbish 0ption 1
Capital
Maintenance
Total
Yr 1 Yr 2 Yr 4 Yr 5
Say, a 20-year solution
Operations
Yr3
NPV Total
Costs
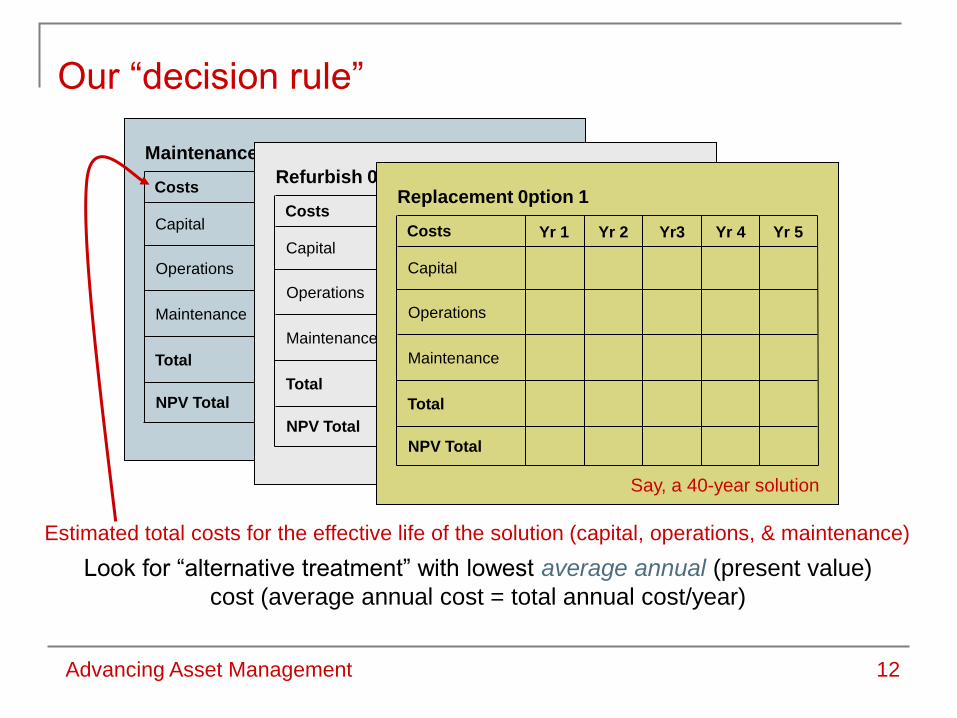
Our ―decision rule‖
Maintenance/repair 0ption 1...N
Capital
Maintenance
Total
Yr 1 Yr 2
Operations
Yr3
NPV Total
Costs
Replacement 0ption 1
Capital
Maintenance
Total
Yr 1 Yr 2 Yr 4 Yr 5
Say, a 40-year solution
Operations
Yr3
NPV Total
Costs
Look for ―alternative treatment‖ with lowest average annual (present value)
cost (average annual cost = total annual cost/year)
Estimated total costs for the effective life of the solution (capital, operations, & maintenance)

Advancing Asset Management 13
ORDM decision rules
Which strategies are most cost effective here?
Lowest average annual cost (PV) is used to determine which strategies to use
When to change strategies?
• Lowest marginal cost is used to determine when to transition to the next strategy, or
• When an intervention point is triggered by interaction of ―constraint‖ trend lines (maximum business risk exposure, minimum tolerable condition, etc.)
PV is present value

Advancing Asset Management 14
ORDM future costs
Age of Assets
Future total maintenance costs
Unplanned maintenance
High
Low
Increasing Decreasing
Planned maintenance Total M
aintenance C
osts

Advancing Asset Management 15
ORDM - where do the savings come from?
Age of Assets
High
Low
Increasing Decreasing
Total O
&M
C
osts
Future total O&M before renewal
Potential
O&M
savings
Future total O&M after
renewal
Estimated future
unplanned O&M
costs Estimated future planned O&M cost
Renewal work completed

Advancing Asset Management 16
ORDM - timing the renewal
Time
High
Low
O&
M C
osts
Optimizing the “savings”
Trial: Several renewal dates
1
+5
2
+10
3
+12
4
+14
5
+16 LTD
ORDM is optimized renewal decision-making, LTD is life to date

Advancing Asset Management 17
Setting up the basic analysis: lowest annual life
cycle cost
Discount Rate 5.0% Avg Annual $
Repair/Maintenance Total 1 2 3 4 5
Capital 4,500$ 4,500$ -$ -$ -$
Operations 2,034$ 350$ 403$ 415$ 427$ 440$
Maintenance 1,803$ 350$ 355$ 361$ 366$ 371$
Total Costs 8,337$ 1,667$ 5,200$ 758$ 775$ 793$ 811$
PV Total Costs 7,977$ 1,595$ 5,200$ 722$ 703$ 685$ 667$
Refurbish 1 2 3 4 5 6 7 8 9 10
Capital 35,500$ 1,775$ 1,775$ 1,775$ 1,775$ 1,775$ 1,775$ 1,775$ 1,775$ 1,775$ 1,775$
Operations 7,515$ 325$ 330$ 335$ 340$ 345$ 350$ 355$ 361$ 366$ 372$
Maintenance 6,888$ 275$ 279$ 283$ 288$ 292$ 296$ 301$ 305$ 310$ 319$
Total Costs 49,903$ 2,495$ 2,375$ 2,384$ 2,393$ 2,402$ 2,412$ 2,421$ 2,431$ 2,441$ 2,451$ 2,466$
PV Total Costs 32,329$ 1,616$ 2,375$ 2,270$ 2,171$ 2,075$ 1,984$ 1,897$ 1,814$ 1,735$ 1,659$ 1,589$
Replace 1 2 3 4 5 6 7 8 9 10
Capital 61,000$ 1,525$ 1,525$ 1,525$ 1,525$ 1,525$ 1,525$ 1,525$ 1,525$ 1,525$ 1,525$
Operations 10,854$ 200$ 203$ 206$ 209$ 212$ 215$ 219$ 222$ 225$ 229$
Maintenance 12,244$ 200$ 200$ 200$ 200$ 200$ 225$ 228$ 232$ 235$ 239$
Total Costs 84,097$ 2,102$ 1,925$ 1,928$ 1,931$ 1,934$ 1,937$ 1,965$ 1,972$ 1,979$ 1,986$ 1,992$
PV Total Costs 36,707$ 918$ 1,925$ 1,836$ 1,752$ 1,671$ 1,594$ 1,540$ 1,472$ 1,406$ 1,344$ 1,284$

Advancing Asset Management 18
Setting up the basic analysis: lowest annual life
cycle cost
Discount Rate 1.0% Avg Annual $
Repair/Maintenance Total 1 2 3 4 5
Capital 4,500$ 4,500$ -$ -$ -$
Operations 2,034$ 350$ 403$ 415$ 427$ 440$
Maintenance 1,803$ 350$ 355$ 361$ 366$ 371$
Total Costs 8,337$ 1,667$ 5,200$ 758$ 775$ 793$ 811$
PV Total Costs 8,259$ 1,652$ 5,200$ 750$ 760$ 770$ 780$
Refurbish 1 2 3 4 5 6 7 8 9 10
Capital 35,500$ 1,775$ 1,775$ 1,775$ 1,775$ 1,775$ 1,775$ 1,775$ 1,775$ 1,775$ 1,775$
Operations 7,515$ 325$ 330$ 335$ 340$ 345$ 350$ 355$ 361$ 366$ 372$
Maintenance 6,888$ 275$ 279$ 283$ 288$ 292$ 296$ 301$ 305$ 310$ 319$
Total Costs 49,903$ 2,495$ 2,375$ 2,384$ 2,393$ 2,402$ 2,412$ 2,421$ 2,431$ 2,441$ 2,451$ 2,466$
PV Total Costs 45,382$ 2,269$ 2,375$ 2,360$ 2,346$ 2,332$ 2,318$ 2,304$ 2,290$ 2,277$ 2,263$ 2,254$
Replace 1 2 3 4 5 6 7 8 9 10
Capital 61,000$ 1,525$ 1,525$ 1,525$ 1,525$ 1,525$ 1,525$ 1,525$ 1,525$ 1,525$ 1,525$
Operations 10,854$ 200$ 203$ 206$ 209$ 212$ 215$ 219$ 222$ 225$ 229$
Maintenance 12,244$ 200$ 200$ 200$ 200$ 200$ 225$ 228$ 232$ 235$ 239$
Total Costs 84,097$ 2,102$ 1,925$ 1,928$ 1,931$ 1,934$ 1,937$ 1,965$ 1,972$ 1,979$ 1,986$ 1,992$
PV Total Costs 69,241$ 1,731$ 1,925$ 1,909$ 1,893$ 1,877$ 1,862$ 1,870$ 1,858$ 1,846$ 1,834$ 1,822$

Advanced Concepts and Techniques in Infrastructure
Asset Management 19
Decision rule: minimize
―annualized (marginal) total long
term costs‖
Acquisition
Time
$
Time
$
Here’s where the extra
value in capital investment
gained by operating one
more year starts to be
eaten up by the increase in
O&M associated with
keeping it performing
during that additional year
Look for that point in time
where average annual total
costs begins to increase
Lowest cost
point
Numbers are illustrative only
Capital
Cost $ 2,000
O&M
Costs
Year
Avg Annual
Cost
Annual
O&M
Annualized
(Marginal)
Total Costs
1 $ 2,000 $ 200 $ 2,200
2 $ 1,000 $ 220 $ 1,220
3 $ 667 $ 242 $ 909
4 $ 500 $ 266 $ 766
5 $ 400 $ 293 $ 693
6 $ 333 $ 322 $ 655
7 $ 286 $ 354 $ 640
8 $ 250 $ 390 $ 640
9 $ 222 $ 429 $ 651
10 $ 200 $ 472 $ 672
15.
Is proactive
reinvestment
cost effective?

Advancing Asset Management 20
Adding non-financial decision elements: weighted
decision tables Repair Refurbish
Criteria Weight A*
Weight
A B*
Weight
B
Life cycle cost** 3 10 30 8 24
Safety 1 8 8 8 8
Environmental impact
Noise 1 7 7 8 8
Odor 1 7 7 9 9
Performance
Level of service 1 7 7 9 9
Reliability 2 7 14 10 20
Availability 1 8 8 7 7
Total 10 81 85
* Scored 1 (poorest) to 10 (best) ** Based on estimated $
Advancing Asset Management 21
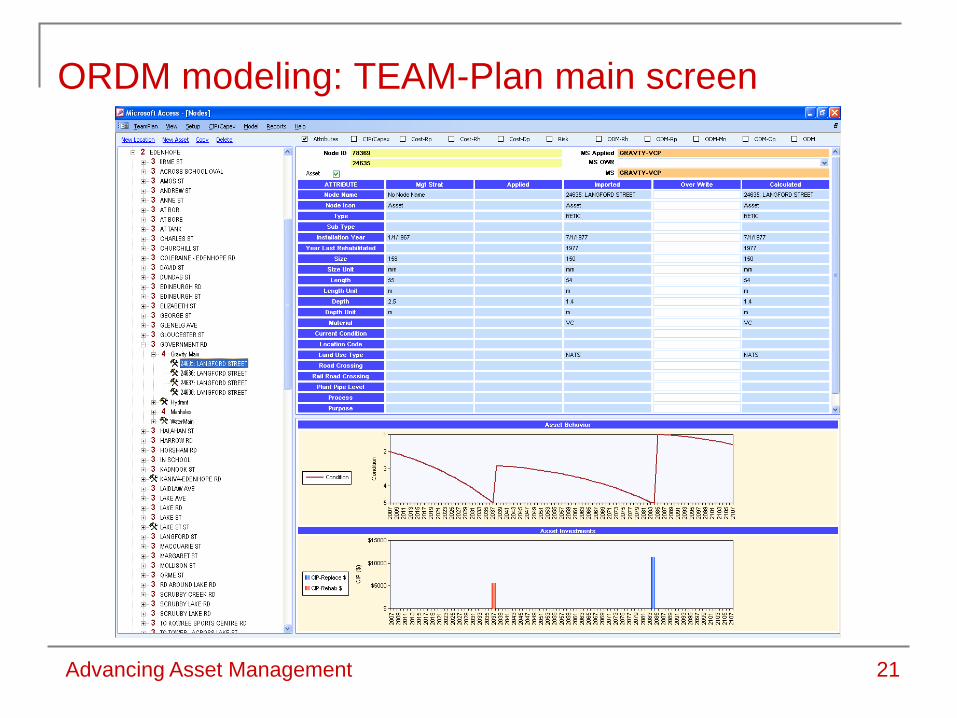
ORDM modeling: TEAM-Plan main screen

Advancing Asset Management 22
Management strategy groups
Grouping of assets with similar renewal and behavioral
patterns
Purpose
• Allocate defaults to assets (missing data)
• Assign asset lives and decay curves
• Calculate current replacement costs
• Calculate business risk
• Consequence of failure
• Probability of failure
• Determine appropriate investment intervention
Example
Gravity pipes, RCP, built <1950, high H2S

23
Determining the end of
asset life - the heart of
the investment
optimization process
(the focus of the
Advanced Workshop
materials)
No
5.
Is performance
score/capacity
≥ designated
trigger?
11.
Is BRE within
tolerable risk
limits?
Yes
No
15.
Is proactive
reinvestment
cost effective?
No
Yes
16.
Within CIP/Ops
budget
window?
No
Yes
Yes (alt)
This is the End of Service
(Level) Life trigger/tripwire
Yes
This is the End of Economic
Life trigger/tripwire.
This is the End of Physical
Life trigger/tripwire.
This alternative is
used where Level of
Service standards
are ―absolute‖
triggers
Conceptual Decision Process Flow:
―End of Asset Life‖ and its role in the
Asset Reinvestment Decision
(This process is executed on a periodic, recurrent basis)
Start
End
14.
Continue to run
and monitor
(to step 3)
7.
Review likelihood
of failure score
13.
Project life cycle
costs of feasible
alternatives
17.
Schedule for
funding
8.
Review
consequence of
failure score
6.
Review residual
physical life
9.
Review current
risk mitigation
strategies
10.
Determine
Business Risk
Exposure score
(BRE)
12.
Determine feasible
risk mitigation
alternatives
4.
Assess condition,
performance
3.
Define business
rules for service
level & capacity
failure
1.
Set strategic
levels of service &
tolerable risk limits
2.
Set minimum
levels of
performance at
asset level
Advancing Asset Management

From the strategic AM funding perspective
From a strategic AM funding perspective, two separate
fundamental management questions:
• How many/when – how many assets of a particular class are
likely to fail within a specific timeframe? (used to build the
―nessie curve – a projection of future expected costs)
• Which/when – which specific assets are likely to fail in a given
timeframe? (used to build the detailed CIP budget)
24 Advancing Asset Management

25
30 Year Infrastructure Plan - Full Requirement
0
100,000,000
200,000,000
300,000,000
400,000,000
500,000,000
600,000,000
700,000,000
800,000,000
2009
2011
2013
2015
2017
2019
2021
2023
2025
2027
2029
2031
2033
2035
2037
Inv
est
men
t ($
)
Water Reconstruction Program Sewer Reconstruction Program Facilities
Projects Non-Rate Impact - Funded Projects
Strategic level - how many/when assets in
timeframe period and at what cost each (this sets
the funding framework)
Advancing Asset Management
26
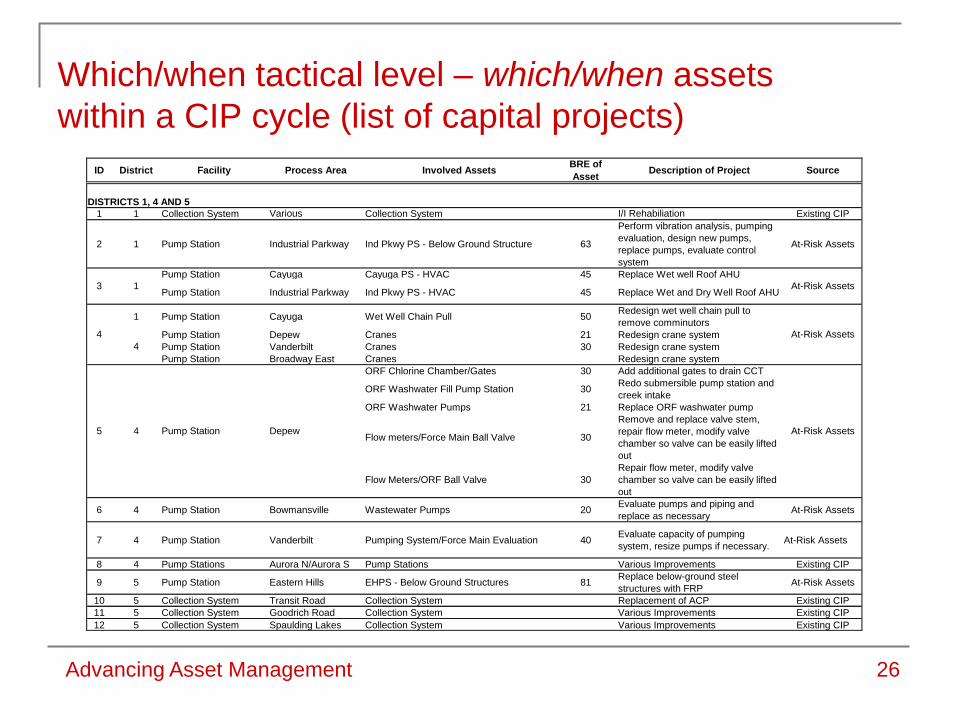
Which/when tactical level – which/when assets
within a CIP cycle (list of capital projects)
ID District Facility Process Area Involved AssetsBRE of
AssetDescription of Project Source
DISTRICTS 1, 4 AND 5
1 1 Collection System Various Collection System I/I Rehabiliation Existing CIP
2 1 Pump Station Industrial Parkway Ind Pkwy PS - Below Ground Structure 63
Perform vibration analysis, pumping
evaluation, design new pumps,
replace pumps, evaluate control
system
At-Risk Assets
Pump Station Cayuga Cayuga PS - HVAC 45 Replace Wet well Roof AHU
Pump Station Industrial Parkway Ind Pkwy PS - HVAC 45 Replace Wet and Dry Well Roof AHU
1 Pump Station Cayuga Wet Well Chain Pull 50Redesign wet well chain pull to
remove comminutors
Pump Station Depew Cranes 21 Redesign crane system
Pump Station Vanderbilt Cranes 30 Redesign crane system
Pump Station Broadway East Cranes Redesign crane system
ORF Chlorine Chamber/Gates 30 Add additional gates to drain CCT
ORF Washwater Fill Pump Station 30Redo submersible pump station and
creek intake
ORF Washwater Pumps 21 Replace ORF washwater pump
Flow meters/Force Main Ball Valve 30
Remove and replace valve stem,
repair flow meter, modify valve
chamber so valve can be easily lifted
out
Flow Meters/ORF Ball Valve 30
Repair flow meter, modify valve
chamber so valve can be easily lifted
out
6 4 Pump Station Bowmansville Wastewater Pumps 20Evaluate pumps and piping and
replace as necessaryAt-Risk Assets
7 4 Pump Station Vanderbilt Pumping System/Force Main Evaluation 40Evaluate capacity of pumping
system, resize pumps if necessary.At-Risk Assets
8 4 Pump Stations Aurora N/Aurora S Pump Stations Various Improvements Existing CIP
9 5 Pump Station Eastern Hills EHPS - Below Ground Structures 81Replace below-ground steel
structures with FRPAt-Risk Assets
10 5 Collection System Transit Road Collection System Replacement of ACP Existing CIP
11 5 Collection System Goodrich Road Collection System Various Improvements Existing CIP
12 5 Collection System Spaulding Lakes Collection System Various Improvements Existing CIP
At-Risk Assets
At-Risk Assets
At-Risk Assets
Pump Station Depew
4
4
3
5
1
4
Advancing Asset Management

Advancing Asset Management 27
Key points from this session
Key Points:
Follow a logical best practice process – Optimized Decision Making or Life Cycle Costing Analysis.
Get the best information and data you have, consider all feasible alternatives, and generate your best strategy.
Consider non-asset solutions!
Associated Techniques:
Optimized renewal
decision-making
Life-cycle costing
(including projections)
Decision-tree analysis
Weighted decision tables
How do I optimize O&M and capital investment?


![[Final]optimized Inverter Technology training guide V3 111114-farFinal]optimized Inverter Technology... · 2018-05-24 · Background ًﻼﻣﺎآ ﻲﺷزﻮﻣﺁ ياﻮﺘﺤﻣ](https://img.pdfslide.net/doc/110x75/5f0f087a7e708231d44227e0/finaloptimized-inverter-technology-training-guide-v3-111114-finaloptimized-inverter.jpg)