Embed Size (px)
Citation preview
I
Background Report Reference
AP-42 Section Number: 12.15
Background Chapter: 4
Reference Number: 16
Title: Source Sampling Report for Jonson Controls, Inc., Winston-Salem, NC
Environmental Testing
1988
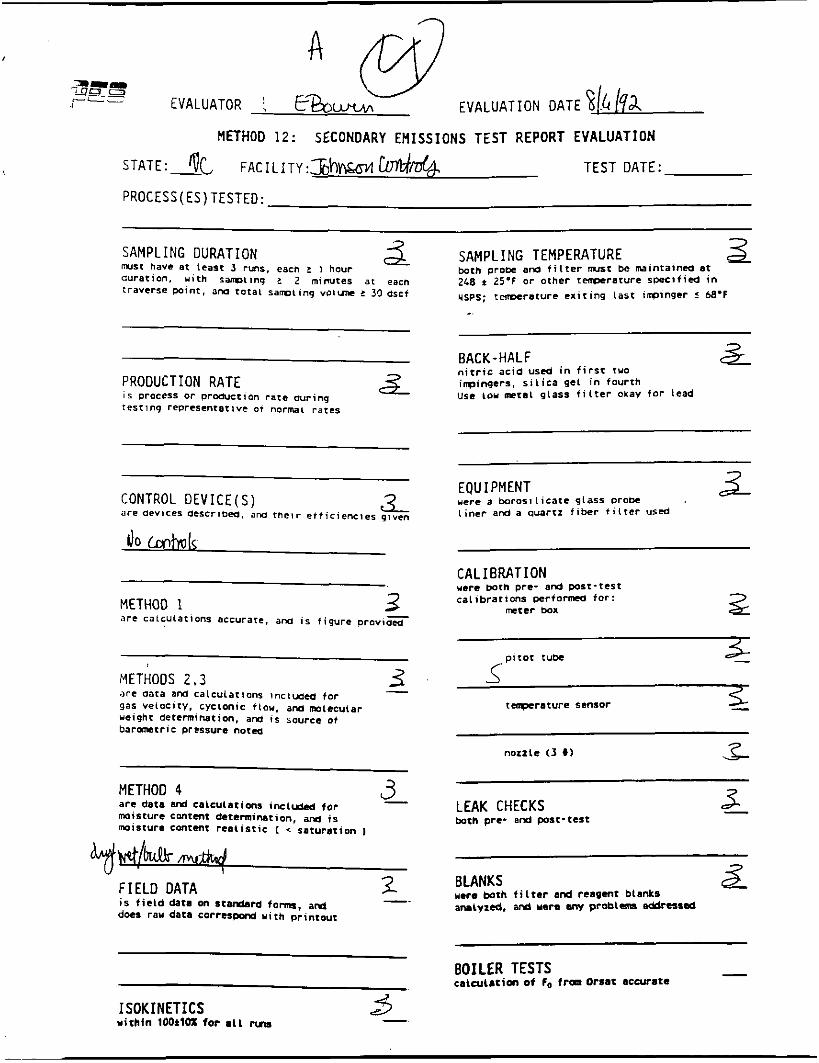
METHOD 12: SECONDARY EMISSIONS TEST REPORT EVALUATION
PROCESS( ES) TESTED:
SAMPLING DURATION auration. with Samiinq I 2 minutes a t e a ~ n traverse point, a m t o t a l saminng voivrr c 30 dscf
W S t have at least 3 runs. each Z 1 hour
z PRODUCTION RATE i s process or ProLIUctIon rate dur ing test ing representative or normal r a t e s
3- CONTROL OEVICE(S) a r e aevices described. a n a t h e l r etf iciencnes qnven
~.
METHOD 1 3 arc calculat ions accurare. and i s f igure p r o v ~ G
3 - METHODS 2 . 3 a r e aata a M calculat ions l n c l w e d for gas ve loci ty . cyclonic flow. a m molecular weight determination. T S hOUrCe of baranetric prtssurc n o t a
3 - METHOD 4 are data and CalcUlatiMs includsd fo r moisture content determination. and i s moisture content r e a l i s t i c 1 < saturat ion I
2 -.
F I E L D DATA i s f i e l d data an 5 t m r d fama, a d doe. raw data c0rrespx-d w i t h pr in tat
SAMPLING TEMPERATURE 3 both prow end f i l t e r MSC be maintained at 268 t 25' f or Other t-rarure speci f ied i n USPS; t-raturc e x i t i n g Last i m l n g e r I MI'F
-.
BACK - HAL F & n i t r i c ac id used i n f i r s t two i w i n q e r a . s i l i c a gel i n four th use L O W m t a l glass f i l t e r okay f o r lead
EQUIPMENT 3- "ere a b o r o s i l i c a t e glass probe l i n e r and a quartz f i b e r f i l t e r used
CALIBRATION yere mth pre- and post-test ca l ib ra t ions per fo rma for :
mter boa 2-
LEAK CHECKS both pre- a n d post-teat
BLANKS 22 Mere both f i l t e r a d reagent blanks ardyzed, and wrn any prob(+na d r e s s e d
BOILER TESTS - calcuL.tim of fo trm Orsat accurate
ISOKINETICS within 100tlOX for a l l r(lg
4 -
. . . . . . . . . J c--vLA CL&\ . . . . . . . . . . . . . . . . . . . . . . . . . . . . - ._ .- ..... -. . . . .
SOURCE SWPLIlG REPORT
POP
JOEWSOW CONTROLS. IWC.
Winston-Salem. north Carolina
TABLE OF COUTEUTS
INTRODUCTION
SUMMARY OF RESULTS
PROCESS DESCRIPTION
LOCATION OF SAMPLING POINTS
SAMPLING AND ANALYTICAL PROCEDURES
APPENDICES
A. Summary of Results
B. Field Data
C. Process Data
D. Test Participants
E. Sampling and Analytical Procedures
F. Calibration Data
1
3
6
7
10
11
IITPODUCTIOI
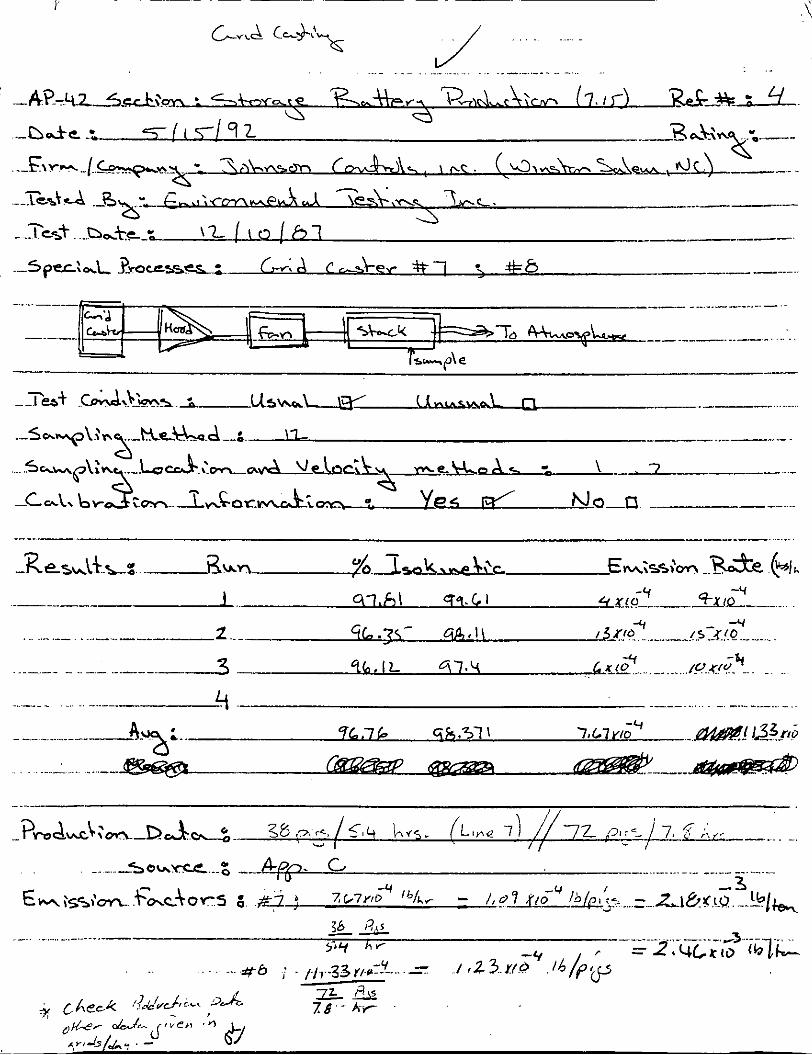
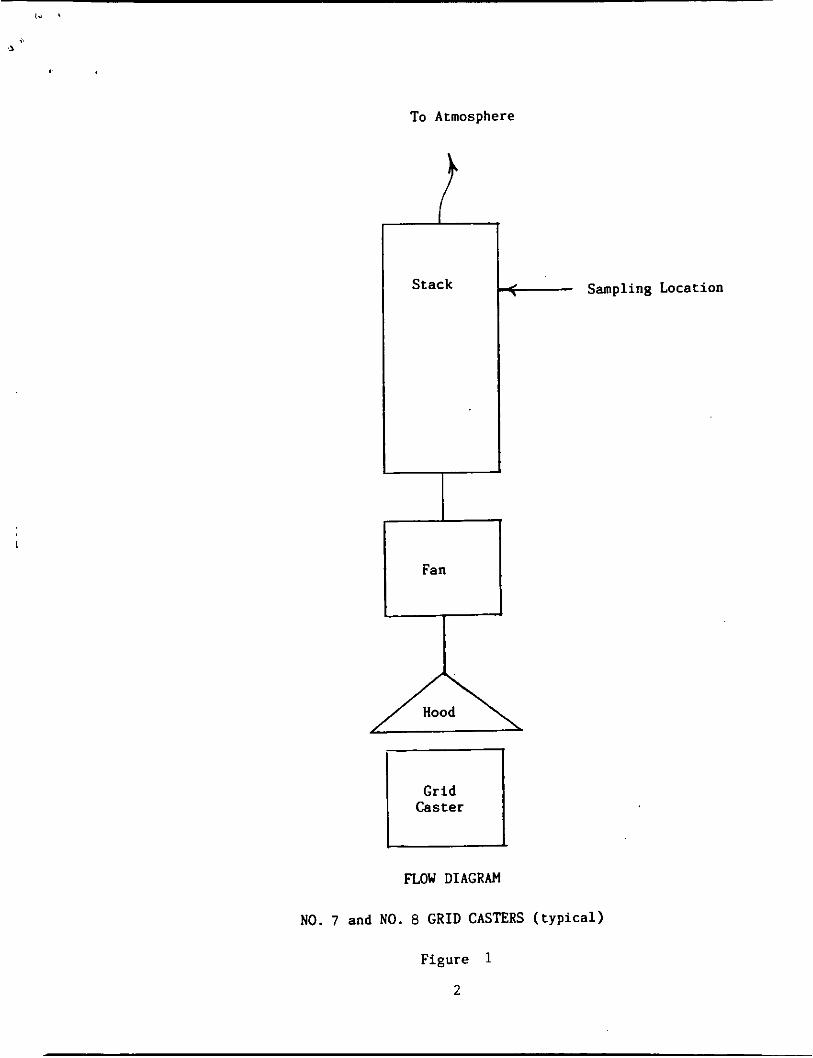
Source sampling was performed for the Johnson Controls, Inc.
Winston-Salem, North Carolina. plant to determine lead
emissions from Grid Caster Number 7 and Grid Caster Number
8. Both stacks were sampled on December 10, 1987. Three
sampling runs were made at each location. A typical
sampling location is shown in Figure 1.
The measurements of stack g a s flow rate and pollutant
concentrations were made according to U.S. Environmental
Protection Agency and the Forsyth County Department of
Environmental Affairs (FCDEA) recommendations. Ms. Lili
Choi. FCDEA, vas present as an observer.
The following sections of the report treat the summary of
results, the process and its operation, the location of the
sampling points and the sampling and analytical procedures
used.
1
To Atmosphere
<-, Sampling Location
El Caster
n O W DIAGRAM
NO. 7 and NO. 8 G R I D CASTERS (typical)
Figure 1
2
,I
b -rene(gig
SUMHABY OF RESULTS
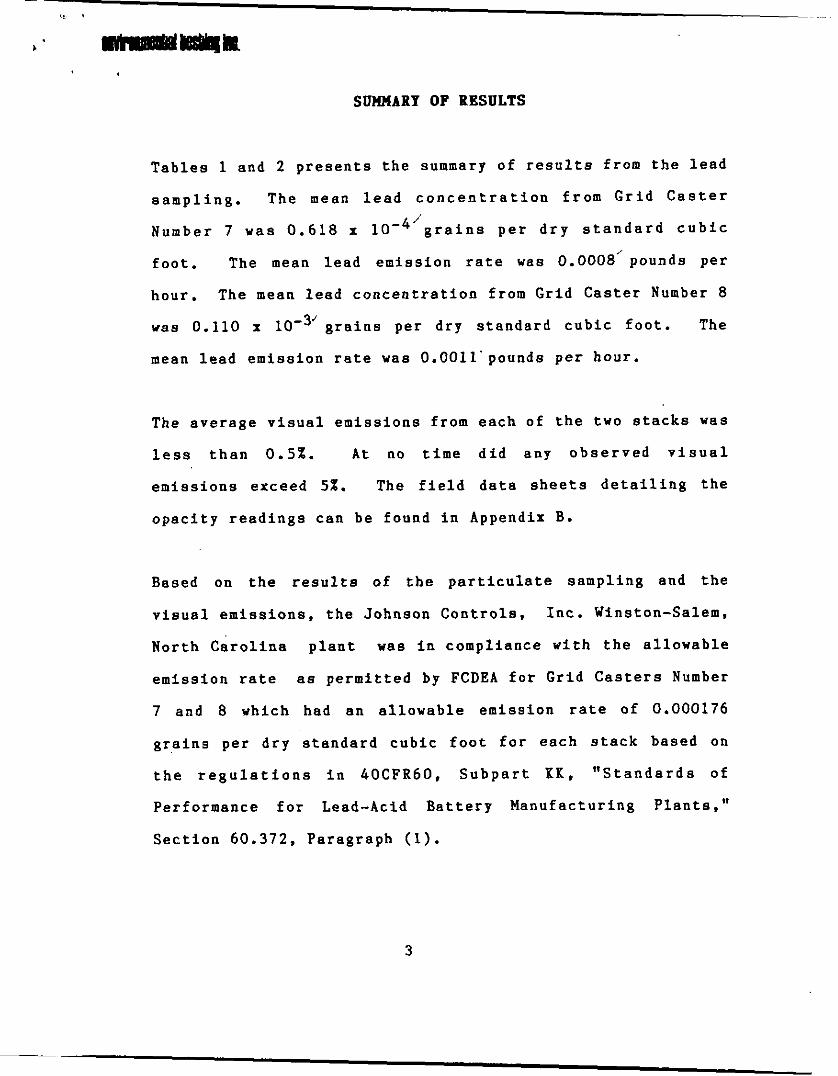
Tables 1 and 2 presents the summary of results from the lead
sampling. The mean lead concentration from Grid Caster
Number 7 was 0.618 x 10⁻⁴'grains per dry standard cubic
foot. The mean lead emission rate was 0.0008"pounds per
hour. The mean lead concentration from Grid Caster Number 8
was 0.110 x 10⁻³'grains per d r y standard cubic foot. The
mean lead emission rate was 0.0011'pounds per hour.
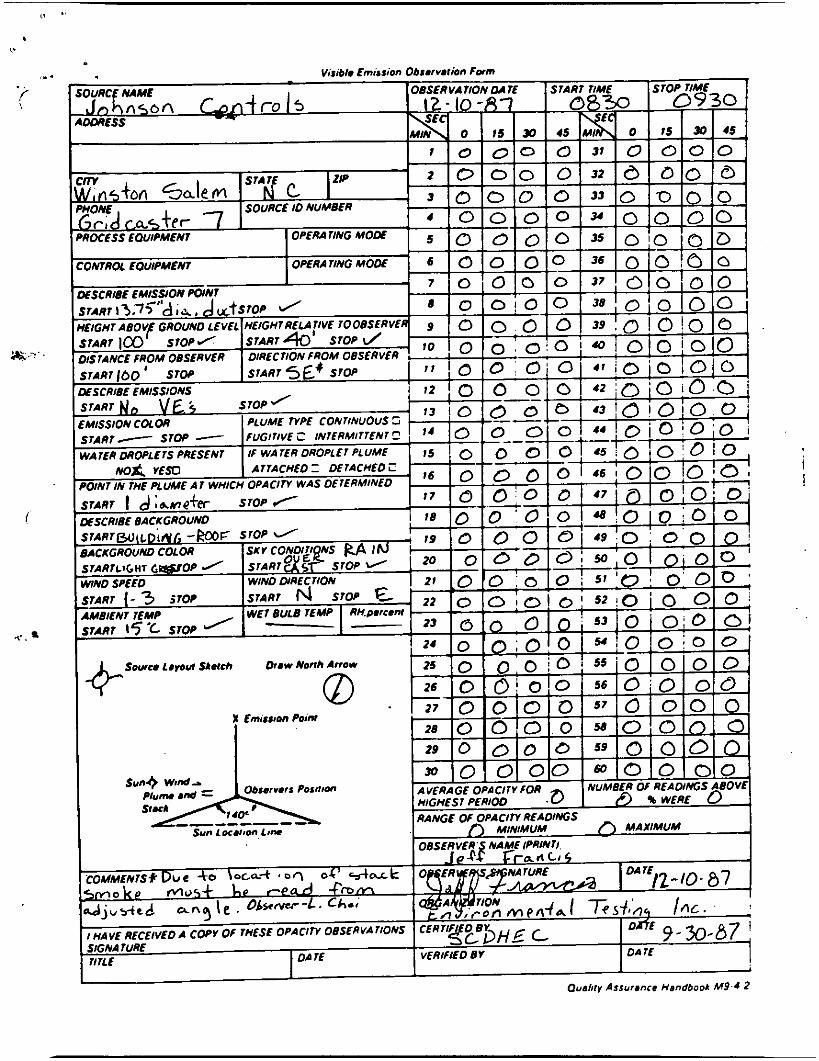
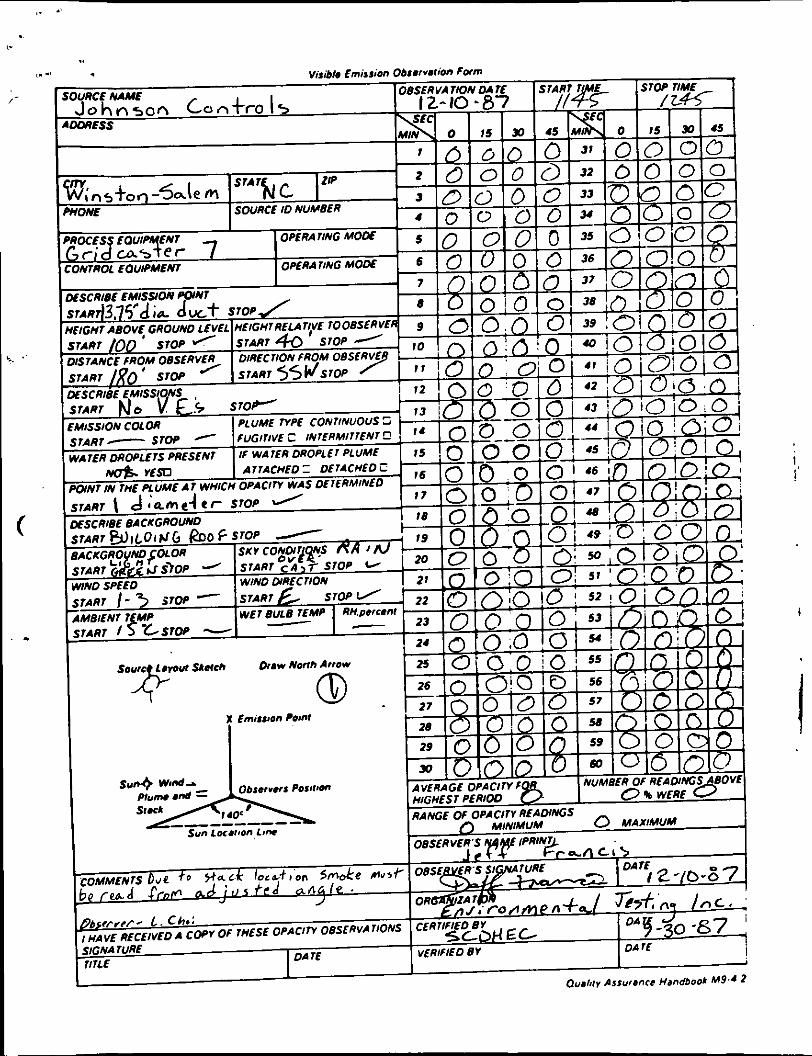
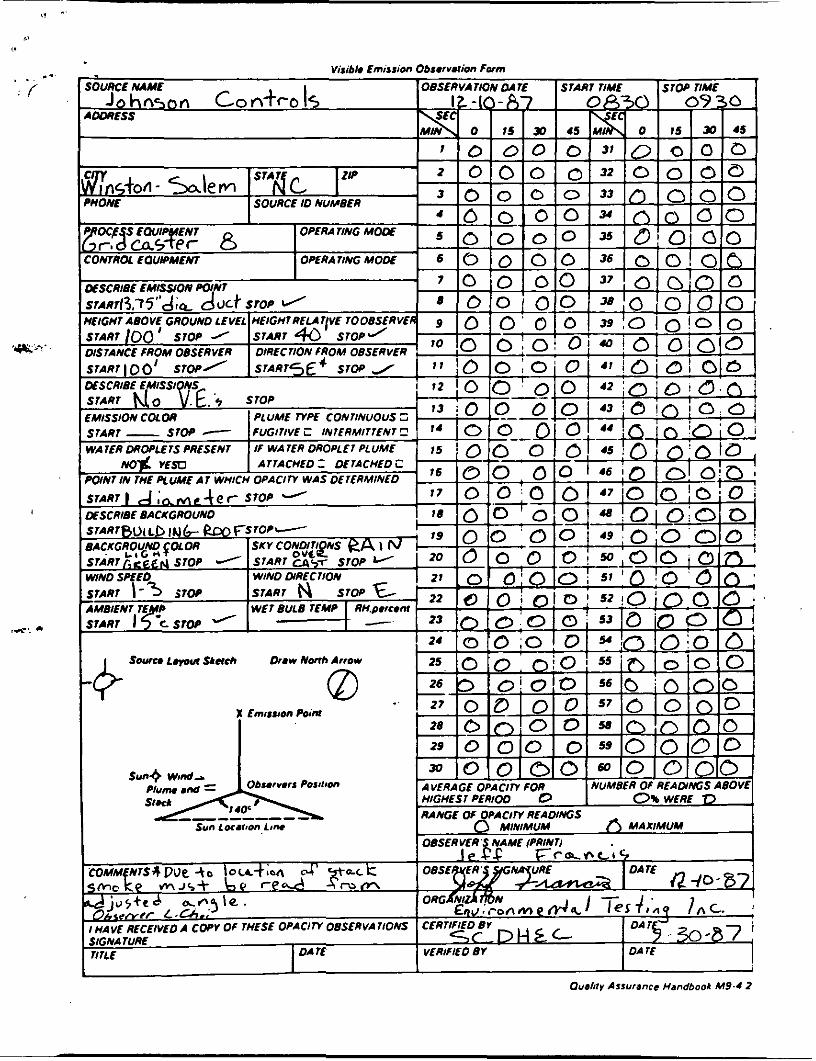
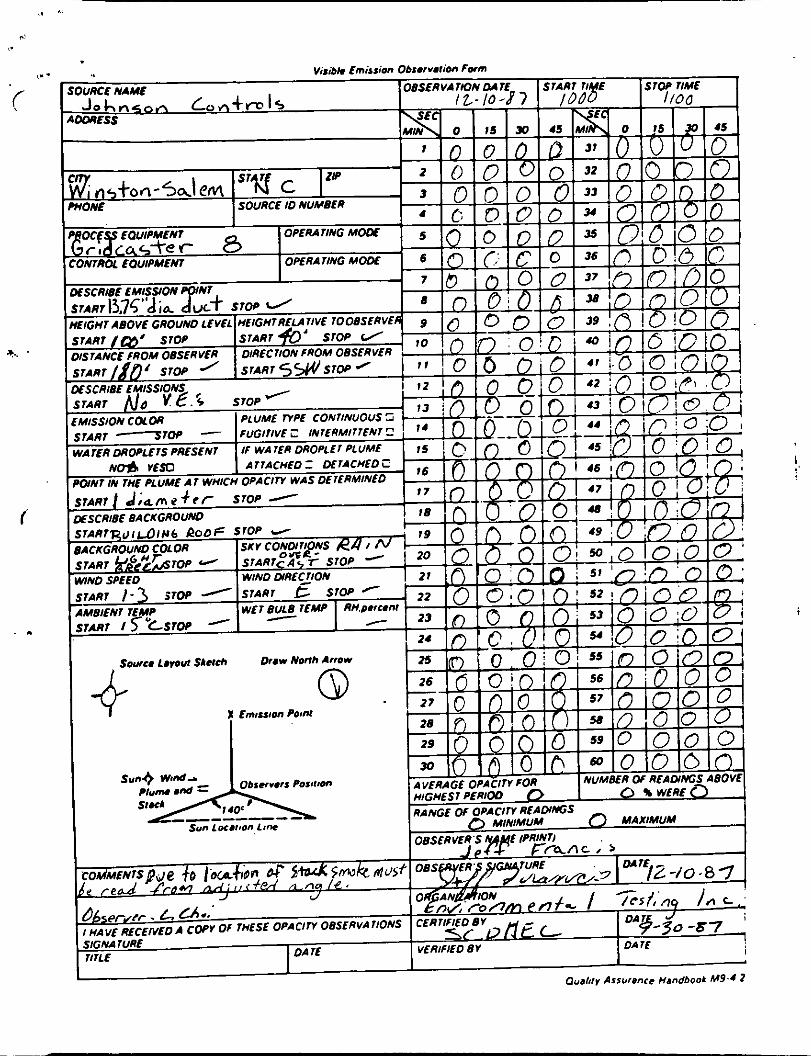
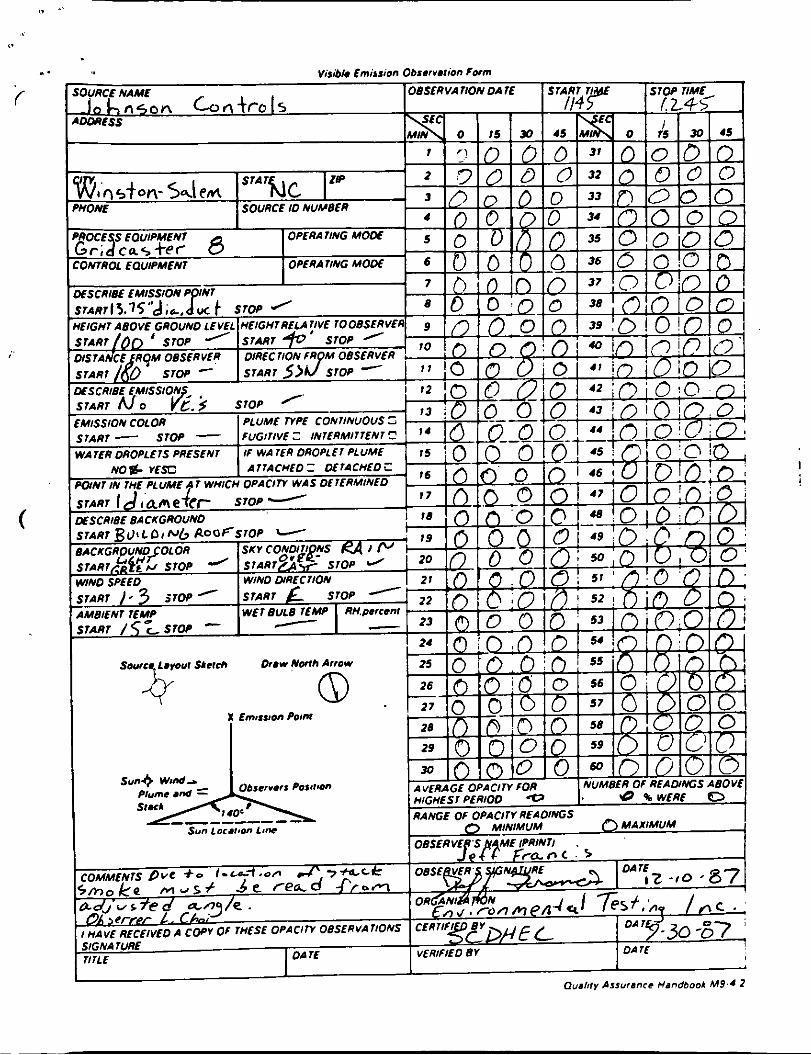
The average visual emissions from each of the two stacks was
less than 0.5%. At no time did any observed visual
emissions exceed 5%. The field data sheets detailing the
opacity readings can be found in Appendix B.
Based on the results of the particulate sampling and the
visual emissions, the Johnson Controls, Inc. Winston-Salem,
North Carolina plant was in compliance with the allowable
emission rate as permitted by FCDEA for Grid Casters Number
7 and 8 which had an allowable emission rate of 0.000176
grains per dry standard cubic foot for each stack based on
the regulations i n 40CFR60, Subpart KK. "Standards of
Performance for Lead-Acid Battery Manufacturing Plants."
Section 60.372, Paragraph (1).
3
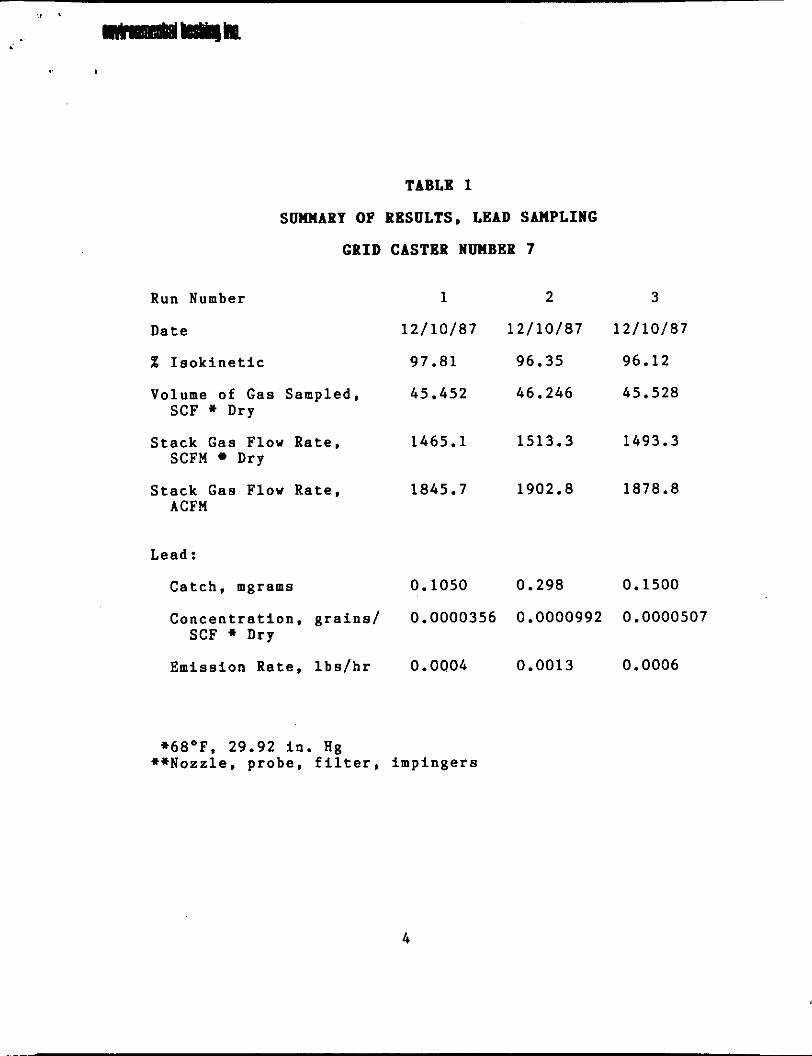
TABLE 1
SUXHARY OF RESULTS, LEAD SAHPLING
G R I D CASTER NUMBER 7
Run Number
Date
1 2 3
12/10/07 12/10/87 12/10/07
% Isokinetlc 97.01 96.35 96.12
Volume of Gas Sampled, 45.452 46.246 45.520 SCF + Dry
SCFM Dry Stack Gas Flow Rate, 1465.1 1513.3 1493.3
Stack Gas Flow Rate, 1045.7 1902.0 1070.0 ACFM
Lead :
Catch, mgrams 0.1050 0.290 0.1500
Concentration, grains/ 0.0000356 0.0000992 0.0000507 SCF * Dry
0.0013 0.0006 Emission Rate, lbs/hr 0.0004
* 6 0 O F . 29.92 in. Hg *+Nozzle, probe, filter, impingers
4
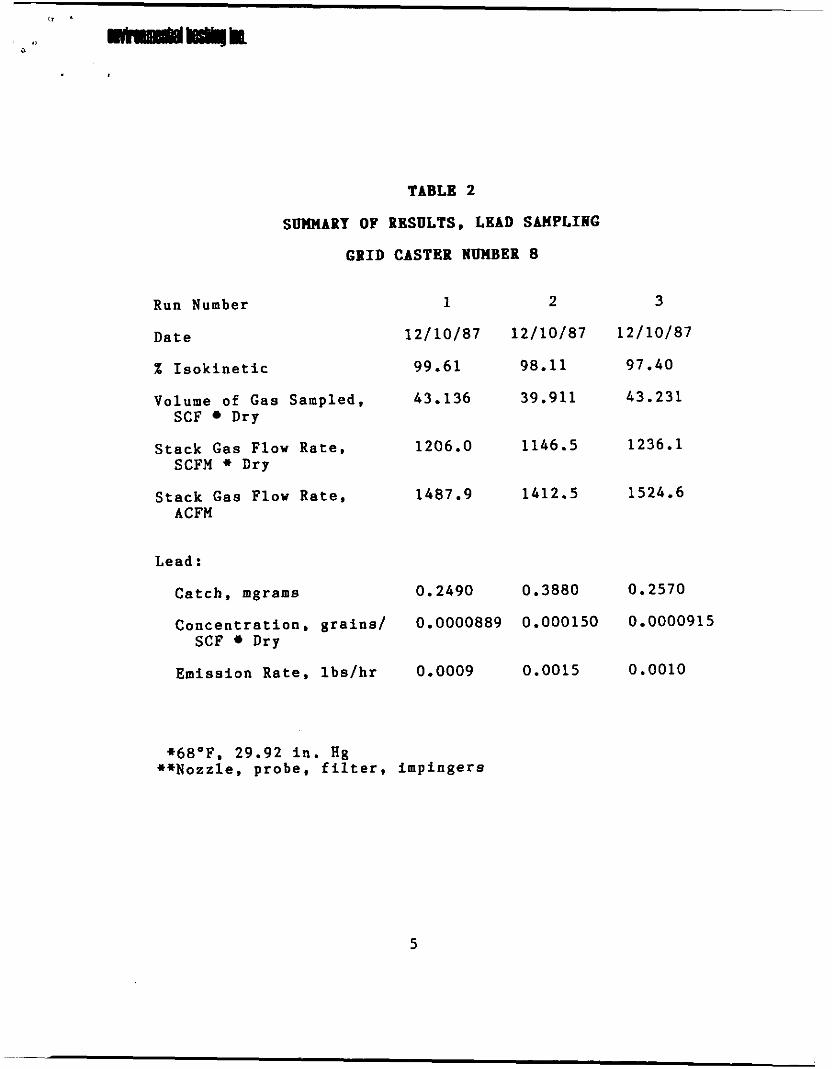
TABLE 2
SOIMARY OF RESULTS, LEAD SWPLIAG
G R I D CASTER NUMBER 8
Run Number
Date
% Isokinetic
Volume of Gas Sampled, SCF Dry
SCFM * Dry
ACFM
Stack Gas Flow Rate,
Stack Gas Flow Rate,
Lead :
Catch. mgrams
Concentration, SCF Dry
Emission Rate,
grains1
lbslhr
1
121 10187
99.61
43.136
1206.0
1487.9
0.2490
2
12/10/87
98.11
39.911
1146.5
1412.5
0.3880
0.0000889 0.000150
0.0009 0.0015
3
1 2 1 10187
97.40
43.231
1236.1
1524.6
0.2570
0.0000915
0.0010
+68OF. 29.92 in. Hg **Nozzle. probe, filter, impingers
5
PBOCESS DESCPIPTIOR AND OPEBATIOR
The Johnson Controls, Inc. Winston Salem, North Carolina,
plant has a grid casting operation that is typical. For
Grid Casters Number 7 and 8 lead is melted in a pot and
flows down runners to the grid casting operation. T h e
combustion gases are exhausted to the atmosphere as shown in
Figure 1. No control devices are employed in this process.
No unusual conditions were noted during sampling. T h e
process was continuous and ran in a normal manner.
6
i
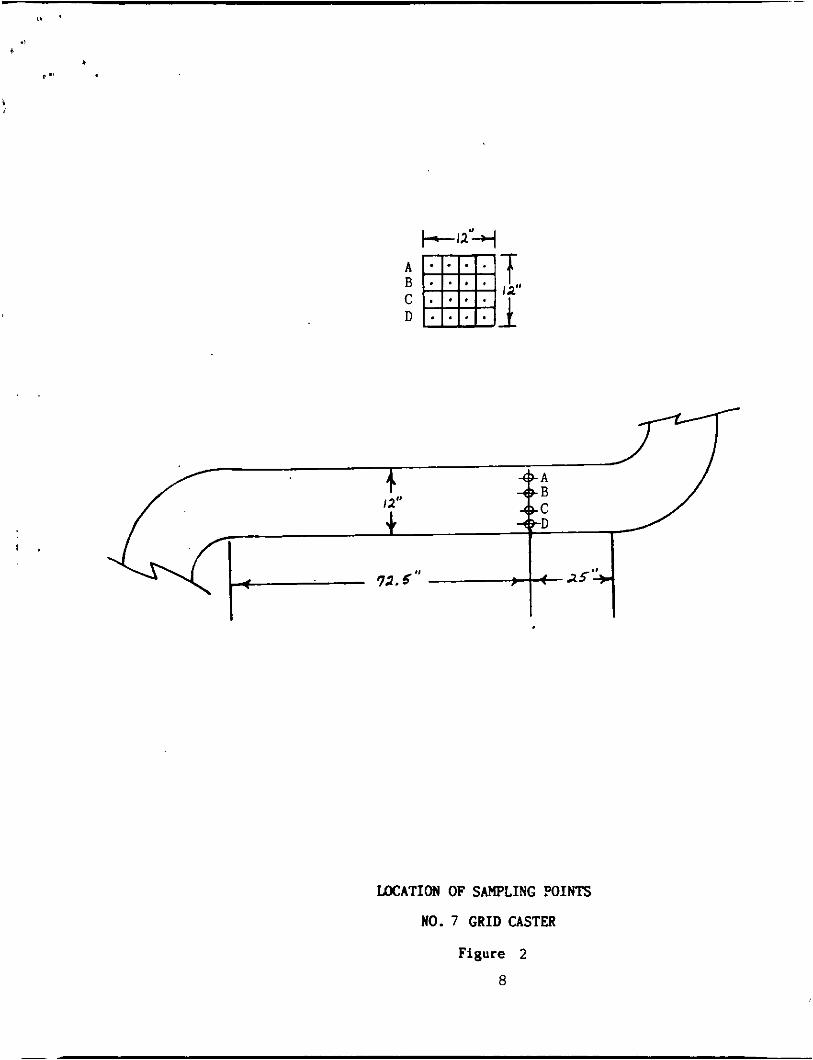
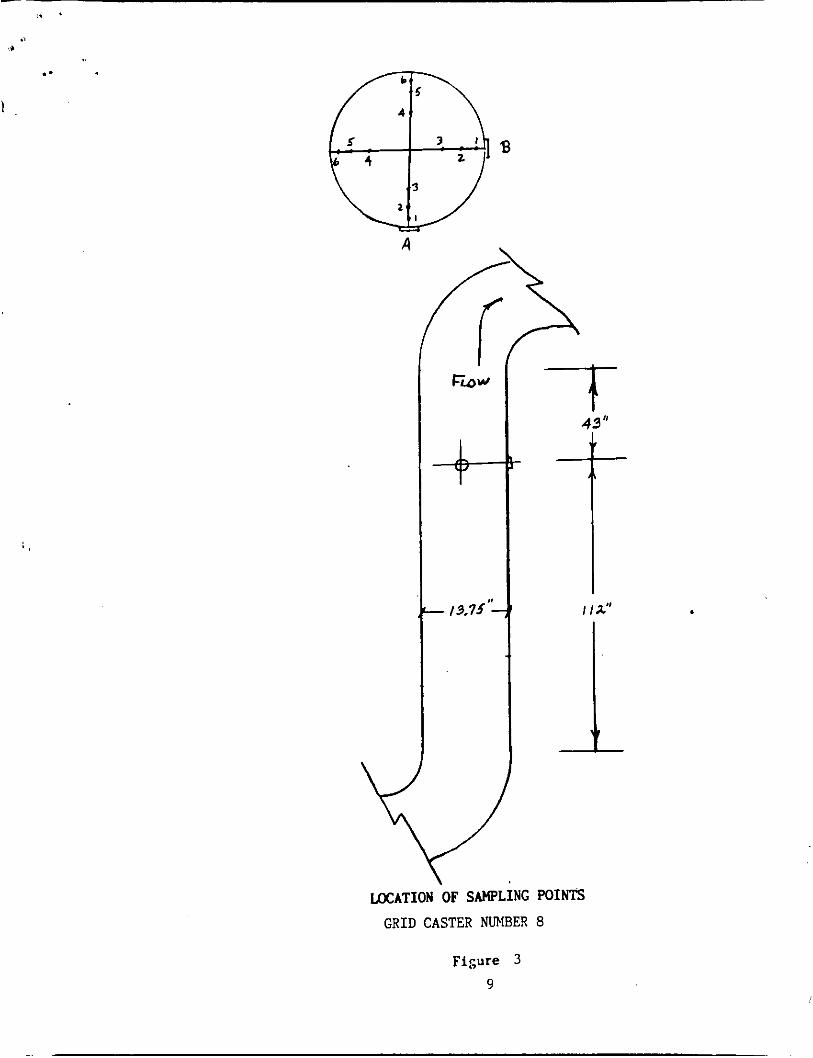
LOCATION OF SWPLIUG POIUTS
The dimensions of the stacks and the location of the
sampling points are shown in Figures 2 and 3. The stack
cross section for Grid Caster Number 7 was divided into 16
equal areas. The ports were labeled A , B . C , and D. Each
point was sampled for a period o f 4 minutes per point which
yielded a total test time of 64 minutes per run. The stack
cross section for Grid Caster Number 8 was divided into 12
equal areas. The ports were labeled A and B. Each point
was sampled for a period of 5 minutes per point which
yielded a total test time of 60 minutes per run. The number
of sampling points was determined by the distance from the
last disturbance in the gas flow as outlined in Method 1,
Federal Register. Volume 48, No. 191. 30 September 1983.
7
-- I< 71.5" -
LOCATION OF SAWLING POINTS
NO. 7 GRID CASTER
Figure 2
a
3
1 a3 I
B
LOCATION OF SAMPLING POINTS GRID CASTER NUMBER 8
Figure 3 9
I
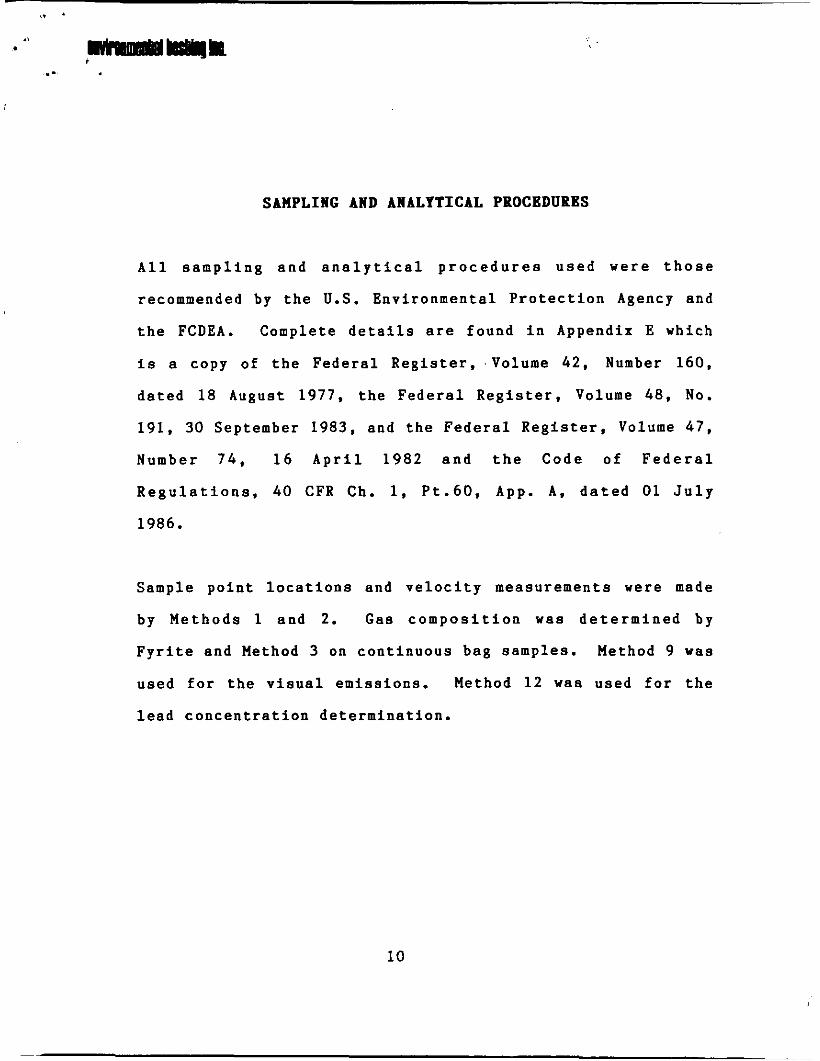
SAUPLING AND ANALYTICAL PROCEDURES
All sampling and analytical procedures used were those
recommended by the U.S. Environmental Protection Agency and
the FCDEA. Complete details are found in Appendix E which
is a copy of the Federal Register. .Volume 42, Number 160,
dated 18 August 1977. the Federal Register. Volume 48, No.
191, 30 September 1983, and the Federal Register, Volume 47,
Number 74, 1 6 April 1982 and the Code of Federal
Regulations, 40 CFR Ch. 1, Pt.60, App. A, dated 01 July
1986.
Sample point locations and velocity measurements were made
b y Methods 1 and 2. Gas composition was determined b y
Fyrite and Method 3 on continuous bag samples. Method 9 was
used for the visual emissions. Method 12 was used for the
lead concentration determination.
10

APPEIDICES
11
<. ,.
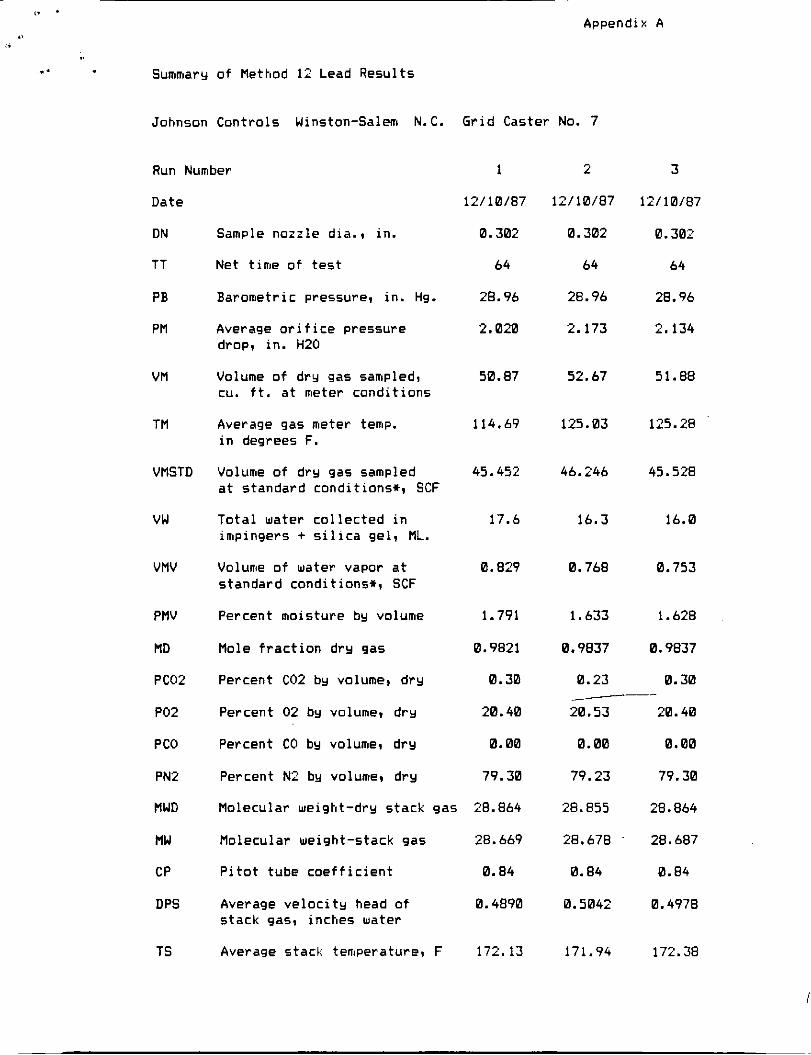
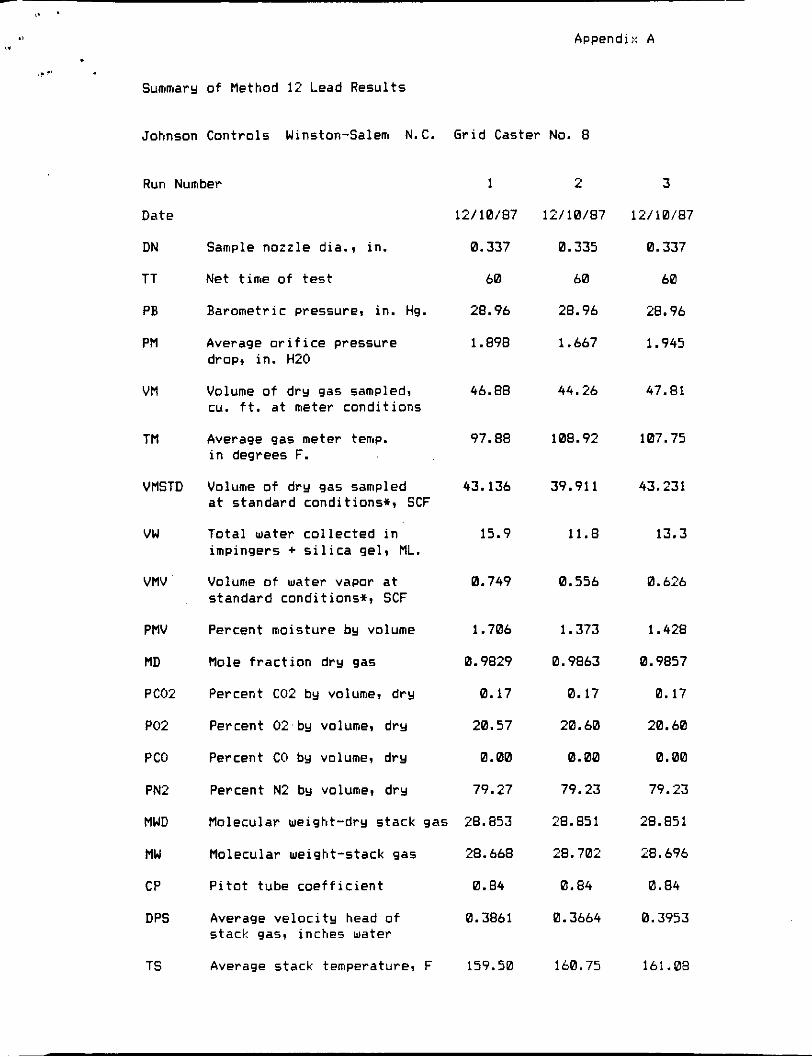
.- Summary of Method 12 Lead Results
Appendix A
Johnson Controls Winston-Salem N.C.
Run Number
Date
DN
TT
PB
PM
V M
TM
VMSTD
vw
VMV
PMV
MD
PC02
PO2
PCO
PN2
MWD
MW
CP
DPS
TS
Sample nozzle dia., in.
Net time of test
Barometric pressure, in. Hg.
Average orifice pressure drop, in. H20
Volume of dry gas sampledr cu. ft. at meter conditions
Average gas meter temp. in degrees F.
Volume of dry gas sampled at standard conditions*, SCF
Total water collected in impingers + silica gell ML.
Volume of water vapor at standard conditions*, SCF
Percent moisture by volume
Mole fraction dry gas
Percent C02 by volume, dry
Percent 02 by volume, dry
Percent CO by volumel dry
Percent N2 by volume, dry
Molecular weight-dry stack gas
Molecular weight-stack gas
Pitot tube coefficient
Average velocity head of stack gas1 inches water
Average stack temperatureu F
Grid Caster No. 7
1 2 3
12/18/87 12110187 12/10/87
0.302 0.302 0.302
64 64 64
28.96 28.96 28.96
2.020 2.173 2.134
50.87 52.67 51.88
114.69 125.03 125.28
45.452 46.246 45.528
17.6 16.3 16.0
0.829 0.768 0.753
1.791
0.9821
0.30
20.40
0.00
79.30
28.864
28.669
0.84
0.4890
1.633 1.628
0.9837 0.9837
0.23 0.30
20.53 20.40
0.00 0.00
79.23 79.30
28.855 28.864
.---
28.678 . 28.687
0.84 0.84
0.5042 0.4978
172.13 171.94 172.38
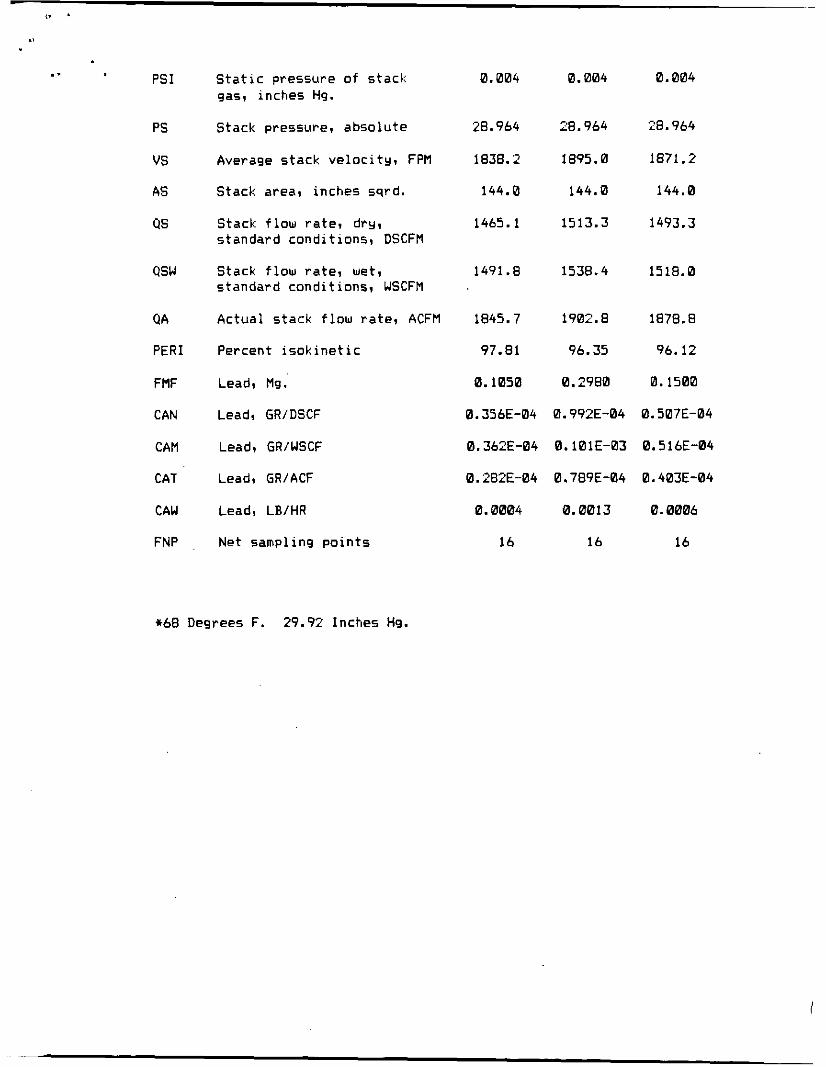
PSI ..
PS
vs
AS
45
asu
QA
PER1
FMF
CAN
CAM
CAT
CAW
FNP
Static pressure o f stack gas, inches Hg.
Stack pressure, absolute
Average stack velocity, FPM
Stack area, inches ssrd.
Stack flow rate, dry, standard conditions, DSCFM
Stack flow rate, wet, standard conditions, USCFM
Actual stack flow rate, ACFM
Percent isokinetic
Lead, Mg.
Lead, GRIDSCF
Lead, GRIWSCF
Lead, GR/ACF
Lead, LB/HR
Net sampling points
+68 Degrees F. 29.92 Inches Hg.
~
0.004
28.964
1838.2
144.0
1465.1
1491.8
1845.7
97.81
0.1050
0.356E-04
0.362E-04
0.282E-04
0.0004
0.004 0.004
28.964 28.964
1895.0 1871.2
144.0 144.0
1513.3 1493.3
1538.4 1518.0
1902.8 1878.8
96.35 96.12
0.2980 0.1500
0.992E-04 0.507E-04
0.101E-03 0.516E-04
0.789E-04 0.403E-04
0.0013 0.0006
16 16 16
,.
. .'
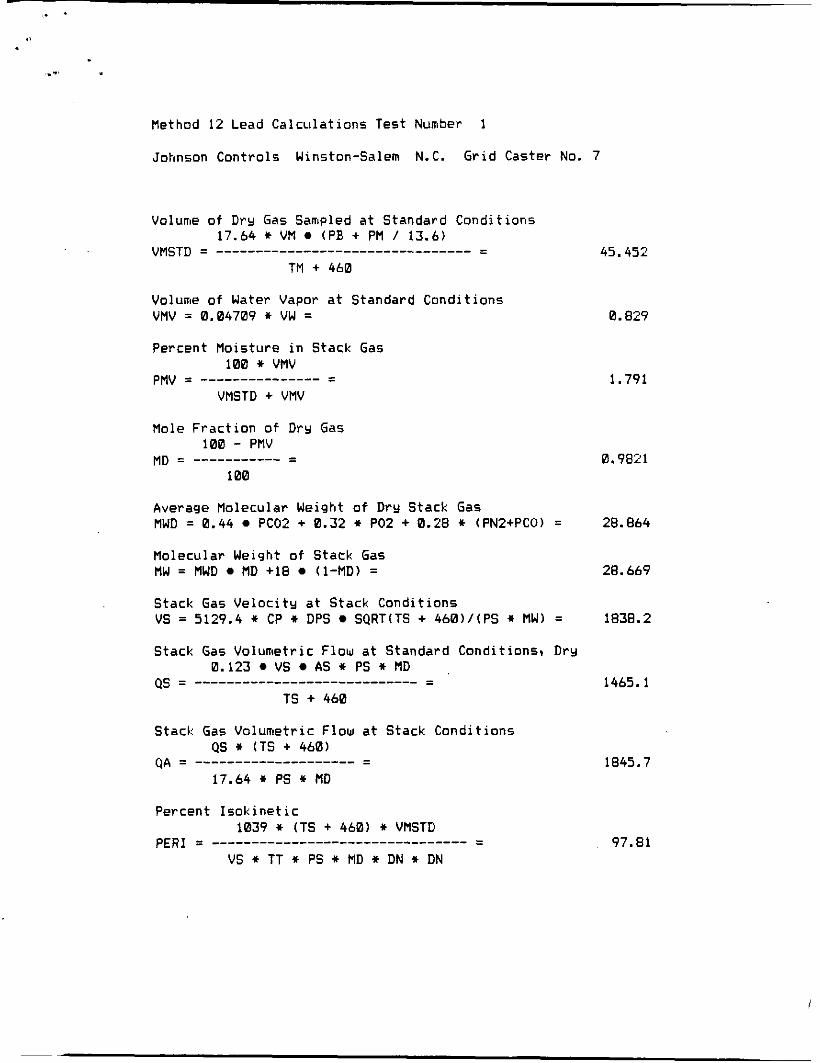
Method 12 Lead Calculations Test Number 1
Johnson Controls Winston-Salem N.C. Grid Caster No. 7
Volume o f Dry Gas Sampled at Standard Conditions 17.64 * VM (PB + PM / 13.6)
45.452 VMSTD = ________________________________ = TM + 460
Volurre o f Water Vapor at Standard Conditions VMV = 0.04709 * VW =
Percent Moisture in Stack Gas 100 * VMV VMSTD + VMV
PMV = _ _ _ _ _ _ _ _ _ _ _ _ _ _ _ =
Mole Fraction of Dry Gas 100 - PMV
100 MD = _ _ _ _ _ _ _ _ _ _ _ =
0.829
1.791
0.9821
Average Molecular Weight of Dry Stack Gas MUD = 0.44 PC02 + 0.32 * PO2 + 0.28 * (PN2+PCO) = 28.864
Molecular Weight o f Stack Gas MW = MWD MD +18 (1-MD) = 28.669
Stack Gas Velocity at Stack Conditions VS = 5129.4 * CP * DPS SQRT(TS + 460)/(PS * MW) = 1838.2
Stack Gas Volumetric Flow at Standard Conditions, Dry
QS = _-______-______----_-------_ = 0.123 VS AS * PS * MD
TS + 460 1465.1
Stack Gas Volumetric Flow at Stack Conditions QS * (TS + 460)
17.64 * PS * MD 1845.7 QA = ________-___________ =
Percent Isokinetic 1039 * (TS + 460) * VMSTD VS * TT * PS * MD * DN * DN
PER1 ________________________________ = 97.81
,. .-
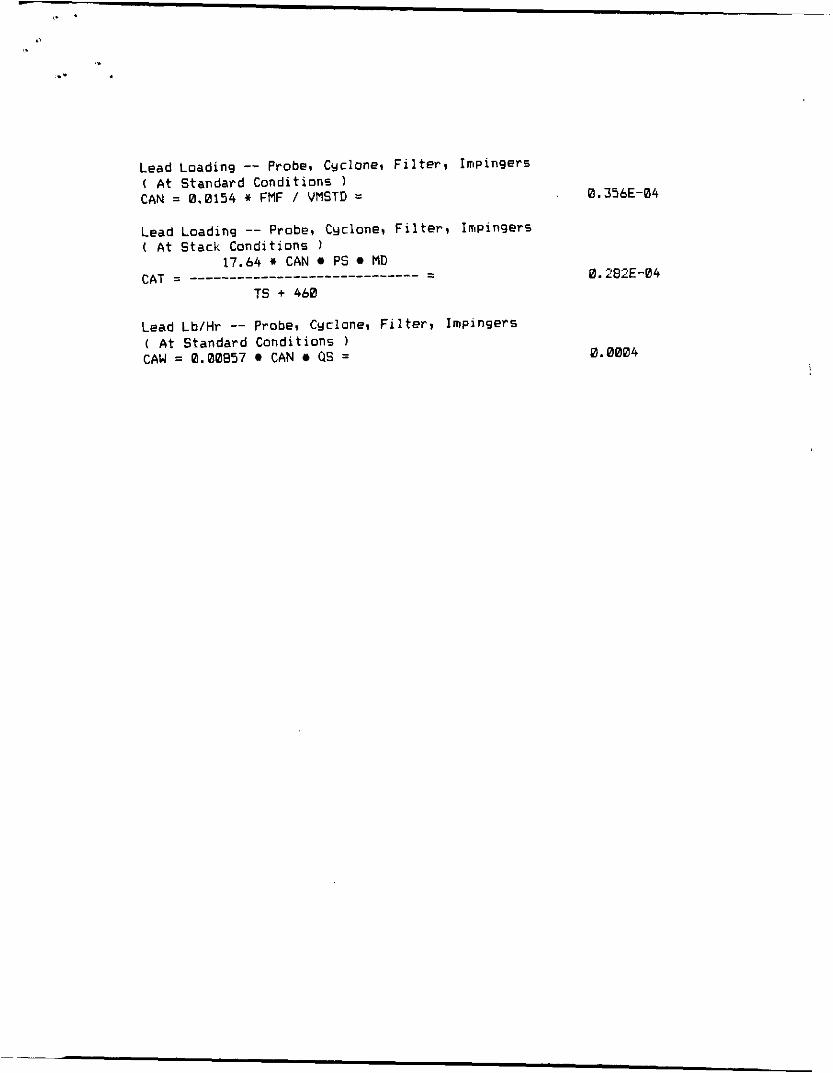
Lead Loading -- Probe, Cyclone, Filter, Impingers ( At Standard Conditions ) CAN = 0.0154 * FMF / VMSTD = 0.356E-04
Lead Loading -- Probe, Cyclone, Filter, Impingers At Stack Conditions )
17.64 * CAN PS MD CAT = ____________________--------- = 0.282E-04
TS + 460
Lead Lb/Hr -- Probe, Cyclone, Filter, Impingers ( A t Standard Conditions ) CAW = 0.00857 CAN US = 0.0004
Appendix A
..I
Summary of Method 12 Lead Results
Johnson Controls Winston-Salem N.C. Grid Caster No. 8
Run Number 1
Date
DN
TT
PB
PM
VM
TM
VMSTD
vw
VMV
PMV
MD
PCO2
PO2
PC0
PN2
MWD
MW
CP
DPS
TS
Sample nozzle did. in.
Net time of test
Barometric pressure, in. Hg.
Average orifice pressure dropl in. H20
Volume of dry gas sampled, cu. ft. at meter conditions
Average gas meter temp. in degrees F.
Volume of dry gas sampled at standard conditions*, SCF
Total water collected in impingers + silica gell ML.
Volume of water vapor at standard conditions*, SCF
Percent moisture by volume
Mole fraction dry gas
Percent C02 by volume, dry
Percent 02 by volume, dry
Percent CO by volumel dry
Percent N2 by volumel dry
Molecular weight-dry stack gas
Molecular weight-stack gas
Pitot tube coefficient
Average velocity head of stack gasl inches water
Average stack temperaturel F
12/18/07
0.337
60
28.96
1.898
46.88
97.88
43.136
15.9
0.749
1.706
0.9829
0.17
20.57
0.00
79.27
28.853
28.668
0.84
0.3861
159.50
2
12/10/87
0.335
60
28.96
1.667
44.26
108.92
39.91 1
11.8
0.556
1.373
0.9863
0.17
20.60
0.00
79.23
28.851
28.702
0.84
0.3664
160.75
3
12/10/87
0.337
60
28.96
1.945
47.81
107.75
43.231
13.3
0.626
1.428
0.9857
0.17
20.60
0.00
79.23
28.851
28.696
0.84
0.3953
161.08
<. *
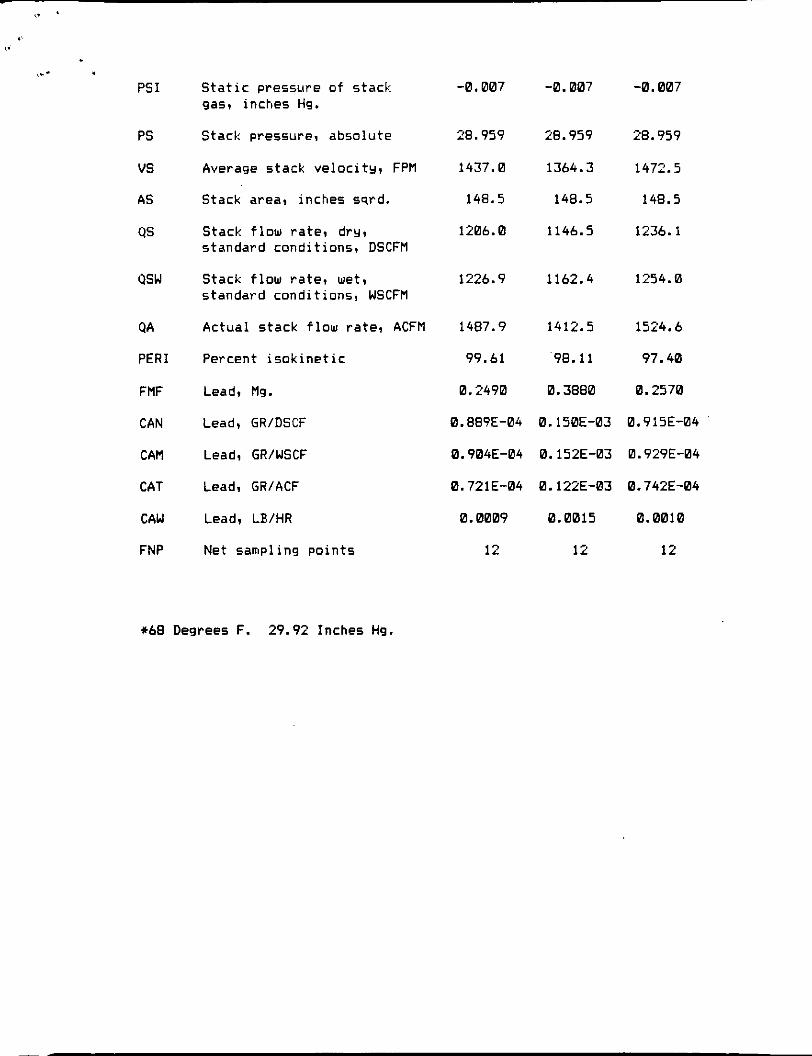
,.* PSI
PS
vs
AS
QS
QSW
QA
PER1
FMF
CAN
CAM
CAT
CAW
FNP
S t a t i c pressure o f stack gas, inches Hg.
Stack pressure, absolute
Average stack ve loc i t y , FPM
Stack area, inches sqrd.
Stack f l ow ra te , dry, standard condi t ions, DSCFM
Stack f l o w ra te , wet, standard condi t ions, WSCFM
Actual stack f low ra te , ACFM
Percent i s o k i n e t i c
Lead, Mg.
Lead, GR/DSCF
Lead, GR/WSCF
Lead, GR/ACF
Lead, LWHR
Net sampling po in ts
-0.007
28.959
1437.0
148.5
1204.0
1224.9
1487.9
99.41
0.2490
0.889E-04
0.904E-04
0.721 E-04
0.0009
12
-0.007
28.959
1344.3
148.5
1144.5
1142.4
1412.5
98.11
0.3880
0.150E-03
0.152E-03
0.122E-03
0.0015
12
-0.007
28.959
1472.5
148.5
1234.1
1254.0
1524.4
97.40
0.2570
0.915E-04
0.929E-04
0.742E-04
0.0010
12
*48 Degrees F. 29.92 Inches Hg.
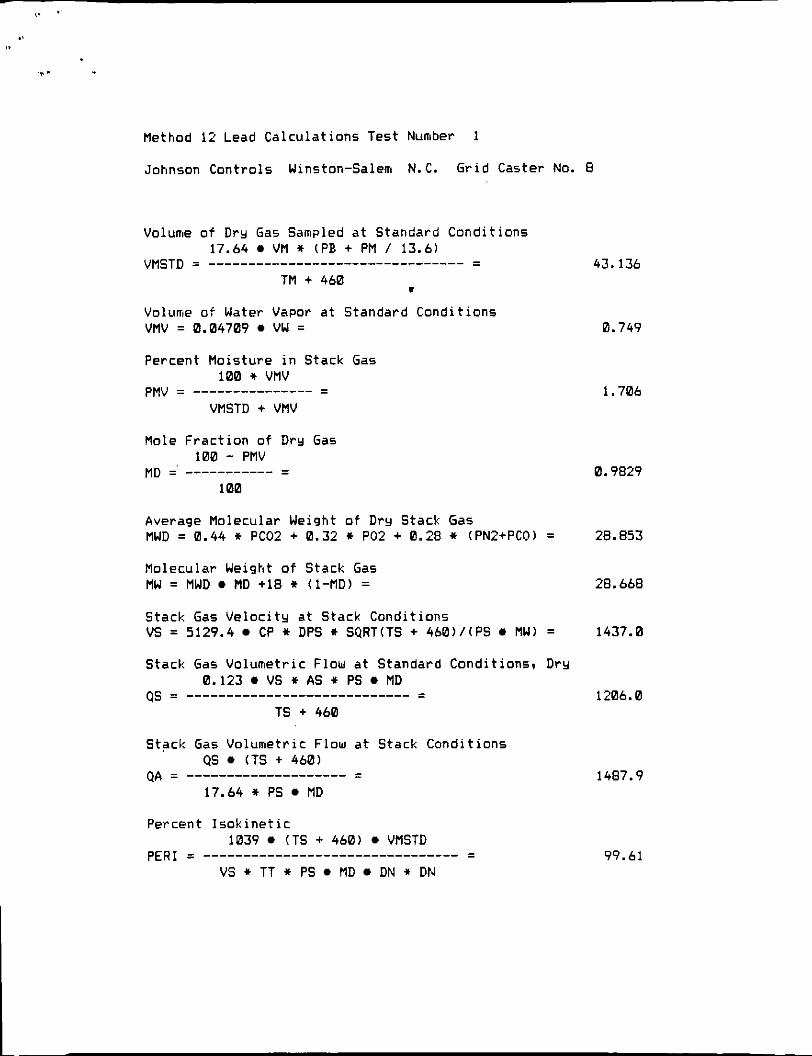
Method 12 Lead Calculations Test Number 1
Johnson Controls Winston-Salem N.C. Grid Caster No. 8
Volume o f Dry Gas Sampled at Standard Conditions 17.64 VM * (PB + PM / 13.6)
43.136 VMSTD = __________---___________________ =
m TM + 460
Volume of Water Vapor at Standard Conditions VMV = 0.04709 VU =
Percent Moisture in Stack Gas 100 * VMV
VMSTD + VMV PMV = _ _ _ _ _ _ _ _ _ _ _ _ _ _ _ =
Mole Fraction o f Dry Gas 100 - PMV
100 MD =' ___________ =
0.749
1.706
0.9829
Average Molecular Weight of Dry Stack Gas MWD = 0.44 * PC02 + 0.32 * PO2 + 0.28 * (PN2+PCO) = 28.853
Molecular Weight of Stack Gas MU = MWD MD +18 * (1-MD) = 28.668
Stack Gas Velocity at Stack Conditions VS = 5129.4 CP * DPS * SQRT(TS + 460) / (PS MW) = 1437.0
Stack Gas Volumetric Flow at Standard Conditions, Dry 0.123 VS * AS * PS MD
TS + 460 1206.0 QS = ____________________________ I
Stack Gas Volumetric Flow at Stack Conditions QS (TS + 460)
17.64 * PS MD 1487.9 QA = . . . . . . . . . . . . . . . . . . . . =
Percent Isokinetic 1039 (TS + 460) VMSTD
VS * TT * PS MD DN * DN PER1 = ________________________________ = 99.61
..
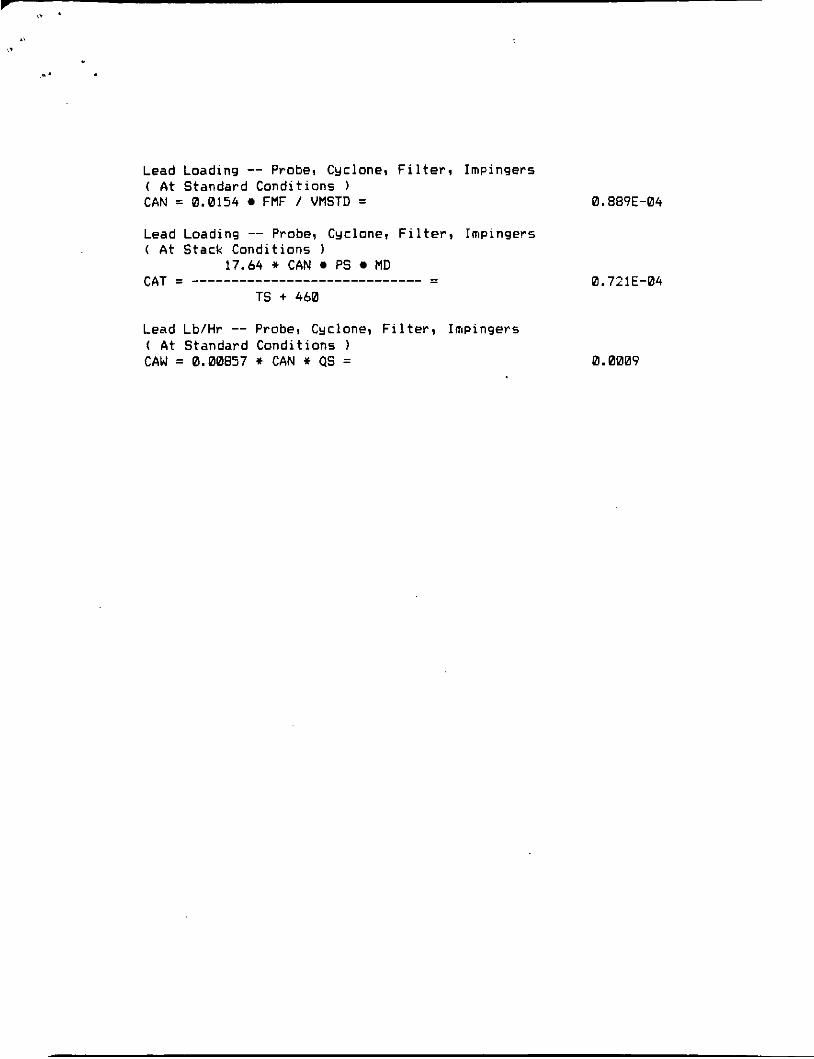
Lead Loading -- Probe, Cyclone, Filter, Impingers ( At Standard Conditions ) CAN = 0.0154 FMF / VMSTD = 0.889E-04
Lead Loading -- Probe, Cyclone, Filter, Impingers ( At Stack Conditions )
17.64 * CAN PS MD 0.72 1 E-04 CAT = _____________________________ =
TS t 460
Lead Lb/Hr -- Probe, Cyclone, Filter, I~tpingers ( At Standard Conditions ) CAW = 0.00857 * CAN * QS = 0.0009
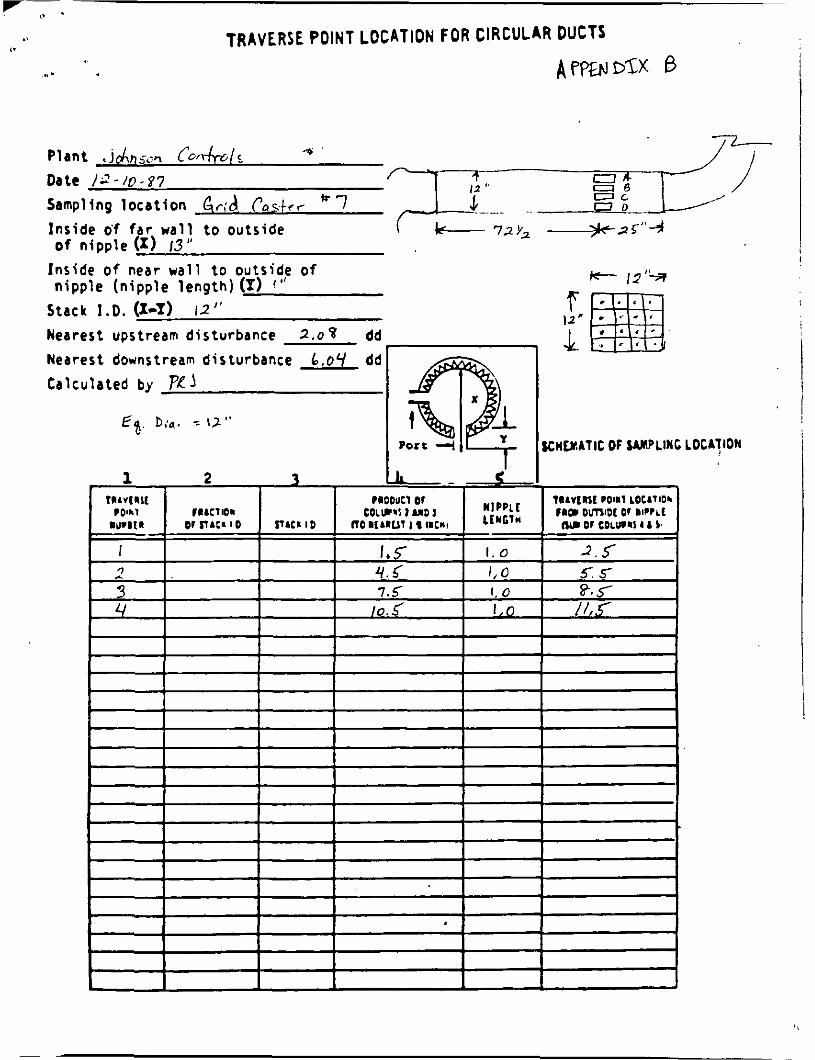
TRAVERSE POINT LOCATION FOR CIRCULAR DUCTS
APPEE~DZX 0
Inside o’f far wall t o outside of nipple 0 ) 13”
Inside of near wall to outside o f nipple (nipple length) (1) ‘”
Stack I . D . (1-T) 12”
Nearest upstream disturbance 3 .08 dd Nearest downstream disturbance b . O Y dd Calculated by P . j
e- IZ”* T
<. *
(1
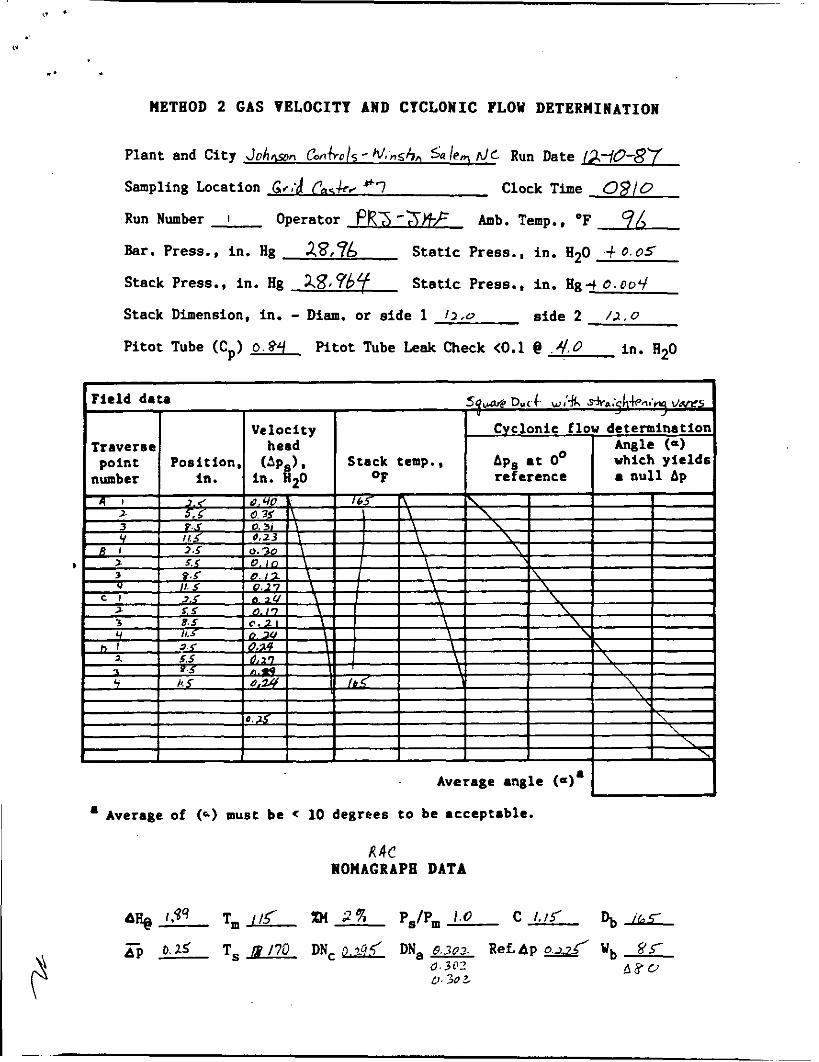
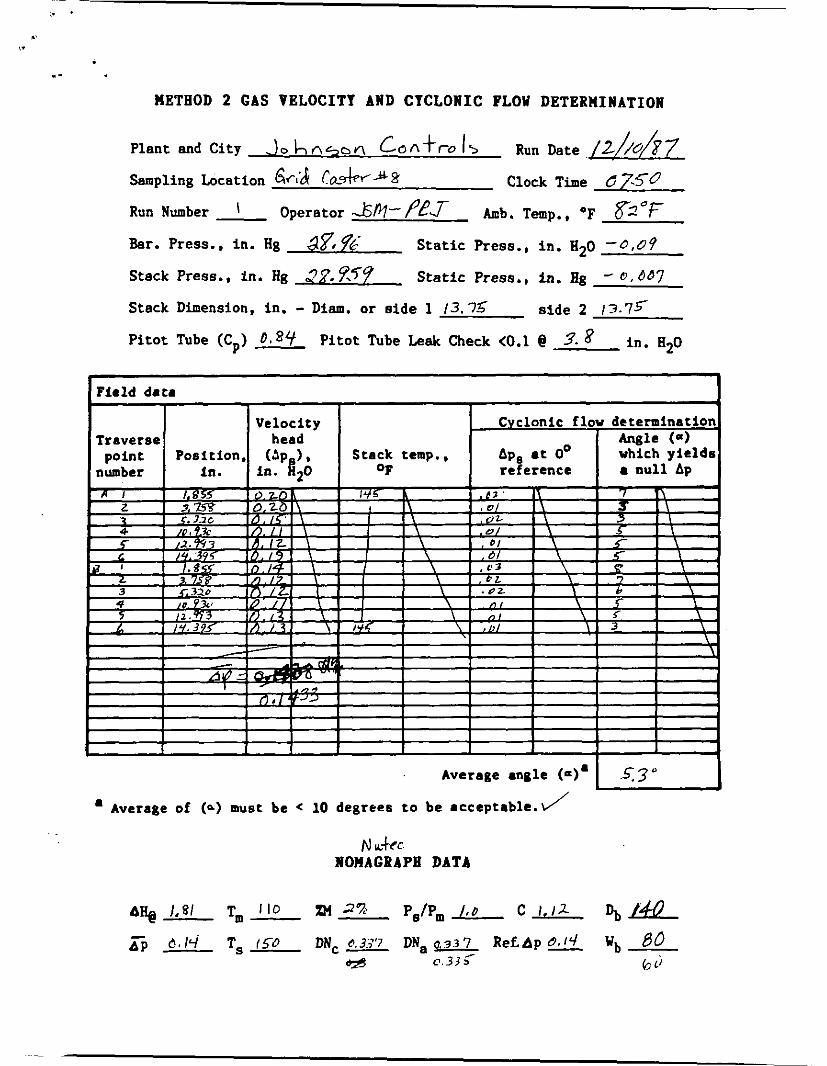
.. METHOD 2 GAS VELOCITY AND CYCLONIC PLOY DETERMINATION
~ ~~
1 1 I I I I I I I I
. Average angle (a)'
Plant and City Johrl+on C d r o / s - w#nsh,, s a /e, hlC Run Date Q.dO-87
Sampling Location G,;d Pa% Av "7 Clock Time 0910 Run Number I Operator PRJ -3Rf Amb. Temp., OF 9/, Bar. Press., in. Hg 2,8,?6 Stack Press., in. Hg W S Y 6 4 Static Press., in. Hg4 O.OO+'
Stack Dimension, in. - Dim. or side 1 / 2 , 0 side 2 1 3 . 0
Pitot Tube (Cp> 0.8Y Pitot Tube Leak Check <0.1 @ . I / o
Static Press., in. H20 .t 0 . 0 5
in. R20
L
I I I
I 1 I
1 I
1 I
I 1
I 1
\ I Y I 1
I I 1 U . S I I I I \
I I I \
I \ I \
R 4C WOMAGRAPB DATA
_.
E p* a- -

.
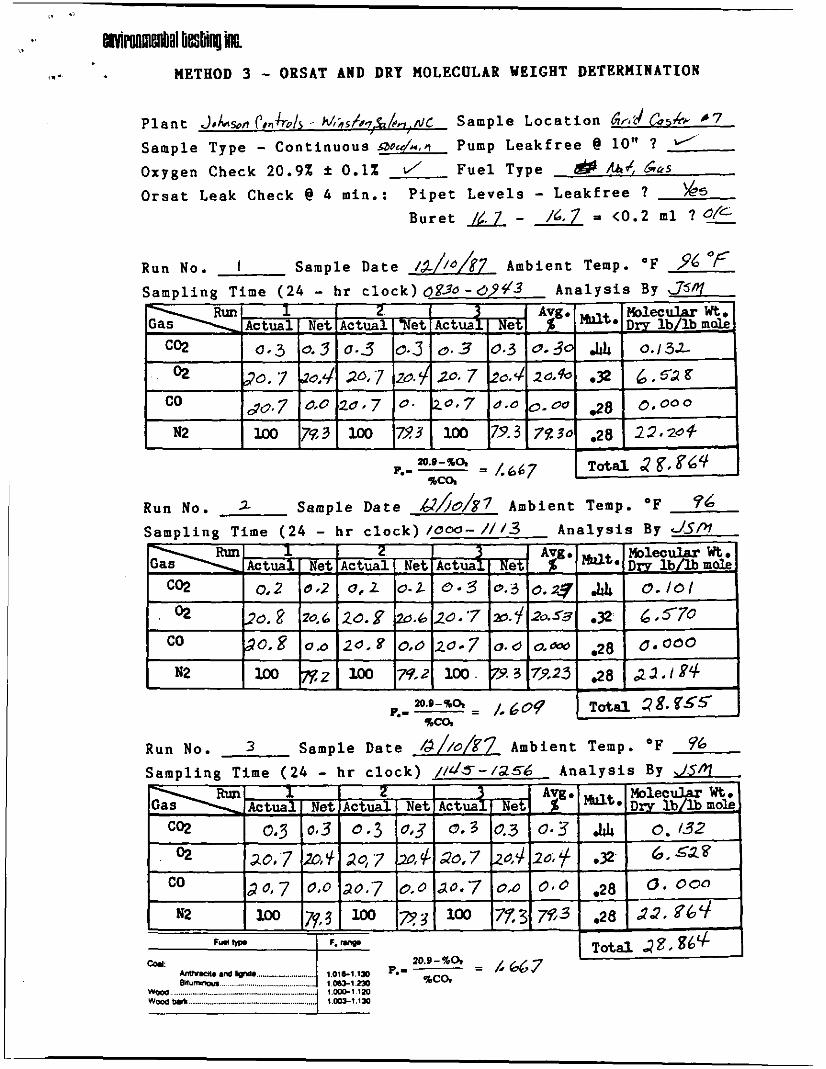
emronMal BesMnq M ,.. METHOD 3 - ORSAT AND DRY HOLECULAR YEIGET DETERMINATION
Plant J,Lm c m + r o / s . W,;7sfm%L/11c Sample Location GSkr *7 Sample Type - Continuous L W d - . q
Oxygen Check 20.9% f 0.1% J Fuel Type & &as
Orsat Leak Check @ 4 min.: Pipet Levels - Leakfree ?
Pump Leakfree @ 10” ?
%S
Buret - &.7 - <0.2 ml ? d/L-
Run No. 1 Sample Date /2//0/g7 Ambient Temp. OF 96 “/E Sampling Time (24 - hr clock) 0830 -S9#’3 Analysis By JSV
F.- - Run No. 2 Sample Date &/5~9/X7 Ambient Temp. O F ?6 Sampling Time (24 - hr clock) /OOO- / / I 3 Analysis B y JSM
Run No. 3 Sample Date / d / / O / 8 7 Ambient Temp. O F 96 Sampling Time (24 - hr clock) //dJ-/256 Analysis By J.Y/r7
. I
= /I667 m a e M . n d p r * 1.0161.lW p.- - 10.9 -%ox %COS I co*:
mu- .............................................. 1 ca-1.m
/.
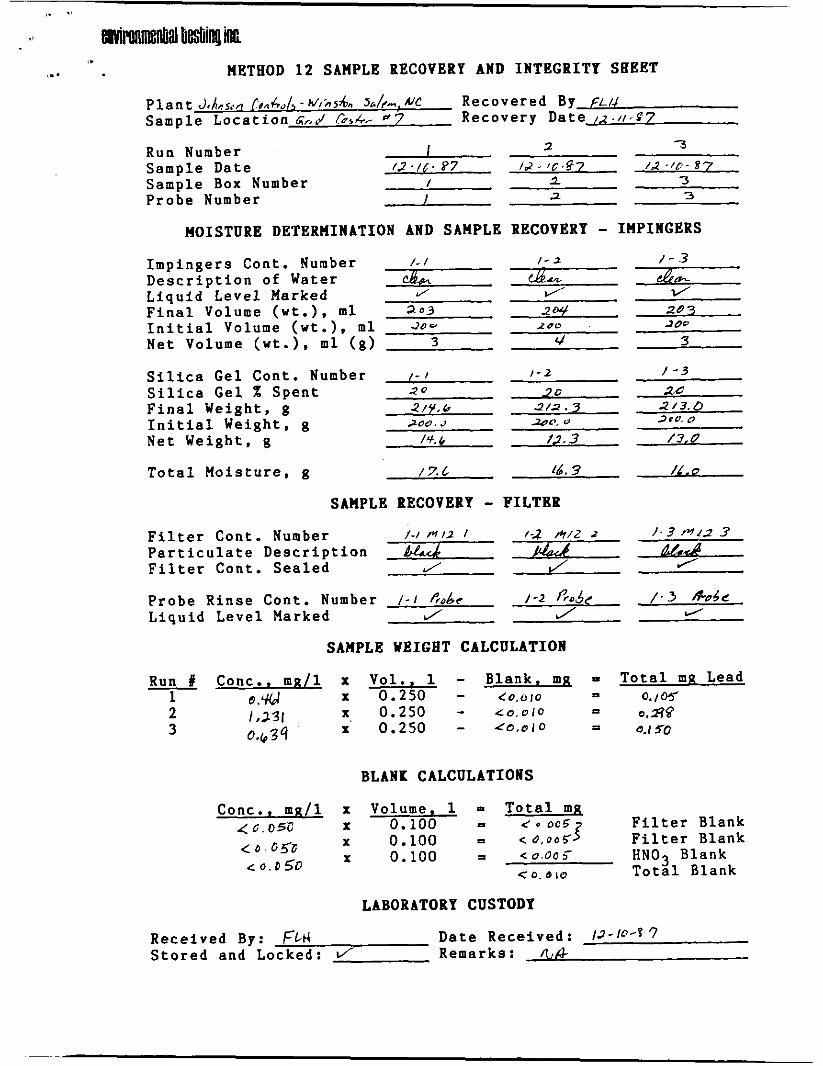
I. UETHOD 12 SAUPLE RECOVERY AND INTEGRITY SEEET
Plant J.X.?~..~ rmclol, - W , ~ S & SA! Recovered By FLU Sample Location G<,U/ 4 7 Recovery Date 1~ . I I - E ~
Run Number I Sample Date /Z./[. 87 Sample Box Number / 1 3
Probe Number I
2 3
i d , IC 97 / a 1 0 - 8 7
2 3
MOISTURE DETERUINATION AND SAUPLE RECOVERY - IHPINGERS I - a / - 3
&a x Liquid Level Marked J r/ 1/ Final Volume (wt.). m l a03 2c4 28 3 Initial Volume (wt.). ml JU 0 1 0 0 200
Net Volume (wt.), ml ( g ) 3 4 3
/ - I 1-2 1 - 3 Silica Gel % Spent 20 3 0 20 Final Weight, g 2 V . b 2/2.3 2 /3.0 Initial Weight, g 200 J a@, 0
Net Weight, g /4. & 13.3 /3.0
Total Moisture, g / 7. L u. 3 / f * o
Impingers Cont. Number Description of Water
Silica Gel Cont. Number
ZJru 0
SAUPLE RECOVERY - FILTER Filter Cont. Number / - I N I Z I /;z Pr/2 2 1 3 M I 2 3
Particulate Description A!& L- Filter Cont. Sealed J J J
Liquid Level Marked J J J
Probe Rinse Cont. Number / - I && / - 2 J?O& / - 3 & d e
SAUPLE YEIGBT CALCULATION
Run # Conc.. mg/l x Vol.. 1 - Blank, mg D Total mp. Lead x 0.250 - C O . U l 0 a O . / M x 0 . 2 5 0 - c o 010 P 0.29 x 0.250 - d 0 , 0 1 0 a
1 0 . 4
0.1 so 2 1,231 3 0.b3q
BLANK CALCULATIONS
Conc.. mgjl x Volume. 1 = Total mg Filter Blank Filter Blank HN03 Blank
O o S 3 X 0.100 P
X 0.100 a < 0 . 0 0 s'
< C . 0 5 0
CD OgD X 0.100 P < 0 , 0 0 5
< 0 . 0 5 0 c 0 . 6 I O Total Blank
LABORATORY CUSTODY
Received By: FL4 Date Received: 13-lnaP '7 Stored and Locked: I/ Remarks: /LB
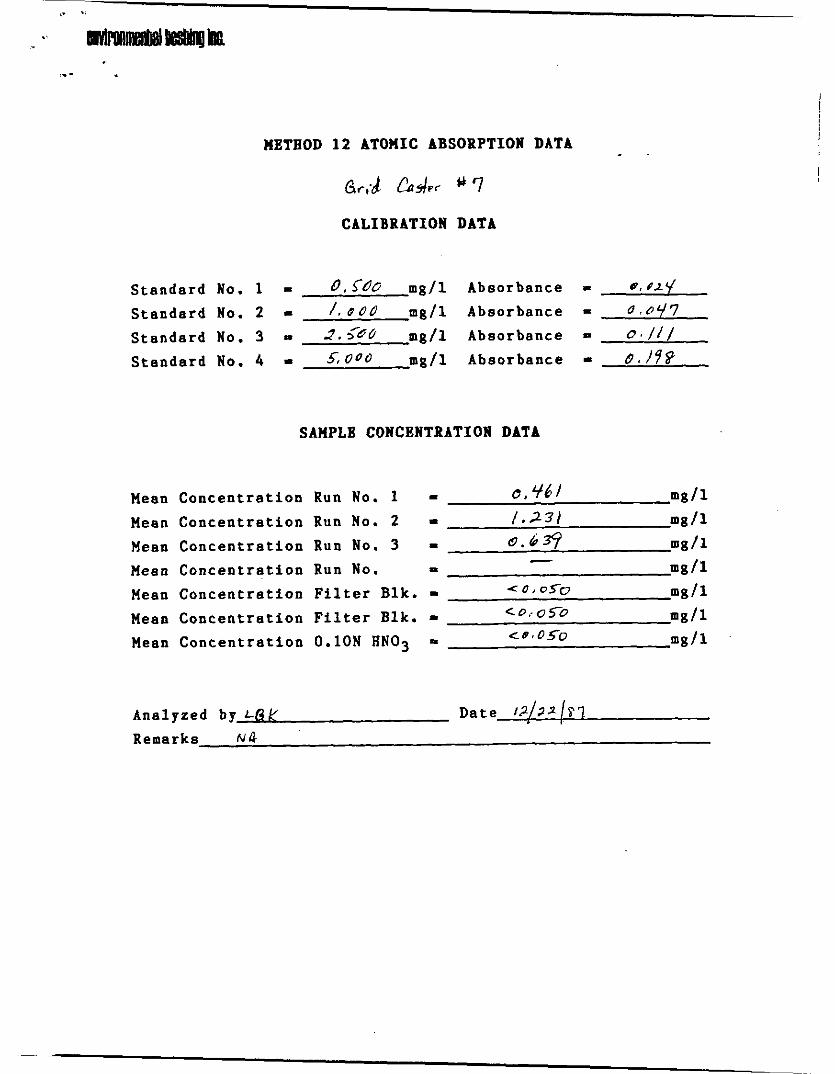
HETBOD 1 2 ATOHIC ABSORPTION DATA
Gc;d &dw 7
CALIBRATION DATA
Standard No. 1 = o.C@G mg/l Absorbance - e. e ~ q Standard No. 2 = / . P O U mg/l Absorbance = O,or /7
Standard No. 3 P 2’ .5 / f lO m g / l Absorbance a O . / / /
Standard No. 4 = ~~0~ mg/l Absorbance = B . l 9 P
SAMPLE CONCENTRATION DATA
Mean Concentration Run No. 1 = 0 , Y d J m g / l
Mean Concentration Run No. 2 = /.23/ mg/l Mean Concentration Run No. 3 = Q.b* m g / l
mg/l Mean Concentration Run No. P
Mean Concentration Filter Blk. - - = O , O ~ O mg/l Mean Concentration Filter Blk. - c 0 i 0 50 mg/l Mean Concentration 0.10N HN03 = ce.0?70 mg/l
-
Analyzed b y L O K Date / 2 / 3 X / S ’ l
Remarks N&
. -
,.-
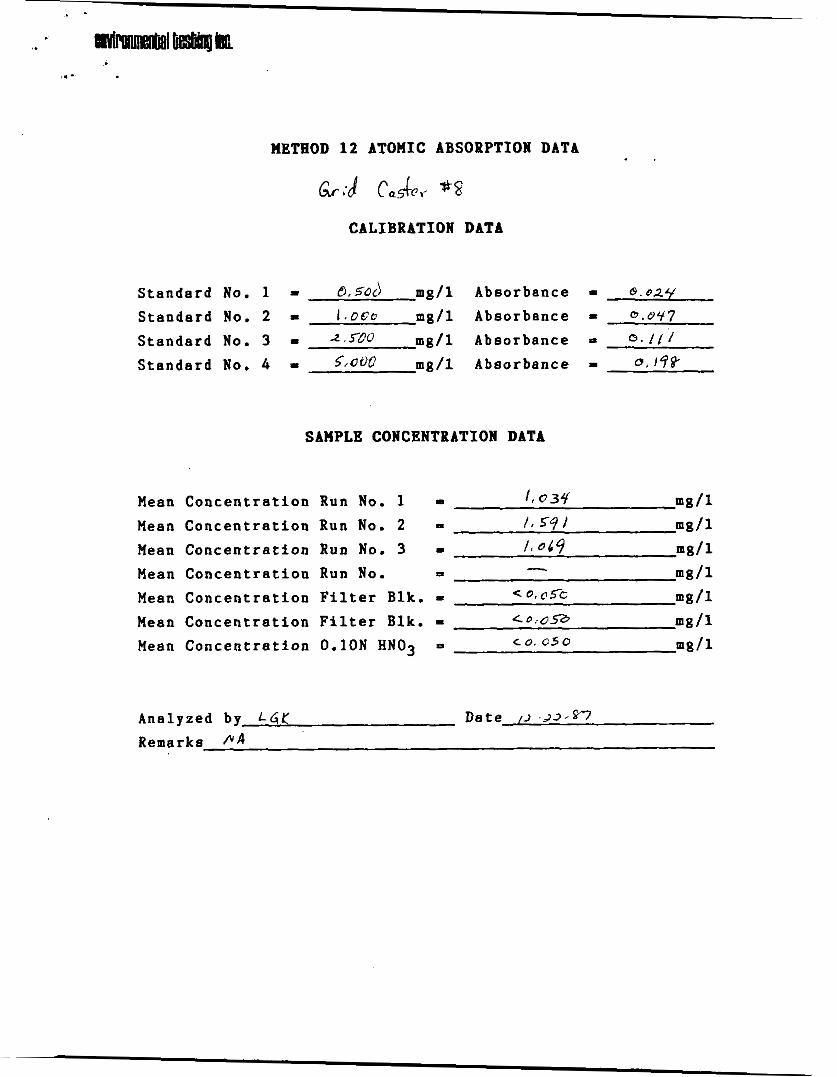
UETBOD 12 ATOUIC ABSORPTION DATA
Grd Ca&v *8
CALIBRATION DATA
Standard No. 1 - 0.503 mg/l Absorbance - 6.024
Standard No. 2 - I , oca mg/l Absorbance - e .897 Standard No. 3 - i.rL'O mg/l Absorbance - e . / / / Standard No. 4 - 5,090 mg/l Absorbance - 0 , rye
SAUPLB CONCENTRATION DATA
Mean Concentration Run No. 1 = /.034 mg/ 1 Mean Concentration Run No. 2 I , 57) mg/l
It o c q mg/l Mean Concentration Run No. 3 - mg/l Mean Concentration Run No. P
< 0 , c5C mg/l L O . . O 5 3 m g / l
- Mean Concentration Filter Blk. - Mean Concentration Filter Blk. - Mean Concentration 0.10N HN03 = c 0. c s o mg/l
Analyzed by L4Y Date 12 .3~ ,m Remarks PA
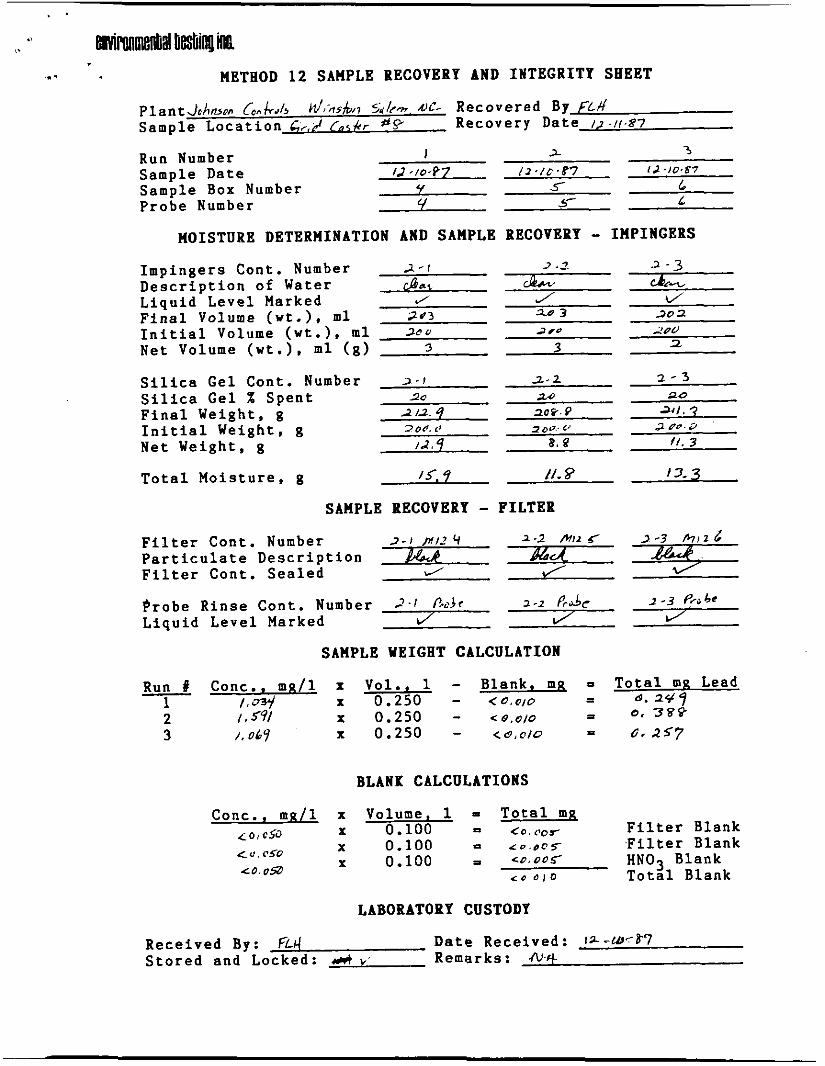
. . errirnnmental D&ing i@
1. METEOD 12 SAMPLE RECOVERY AND INTEGRITY SEEET
a 3
5- L, L
Run Number I
Sample Box Number Y Probe Number Y 5-
Id - / O * P 7 l Z . / C . k 7 13 - IO .h7 Sample Date
MOISTURE DETERMINATION AND SAMPLE RECOVEBY - IHPINGERS 2 -2 2 - 3
tQN, ekr, Impingers Cont. Number a-I Description of Water a* Liquid Level Marked J J c/ Final Volume (wt.). ml 2 f f 3 a473 2 0 2 Initial Volume (wt.), ml 3 E U 2 ,o 1uu Net Volume (wt.). ml (8) 3 3
Silica Gel X Spent 20 zo 10
Net Weight, g /a,q 8 . 8 I t . 3
Total Moisture, g is. 9 I/. 8 I 3.3
2
2-1 a- I 2 - 3 Silica Gel Cont. Number
Final Weight, g Initial Weight, g
2/2 q 20P P 3r l . q 3 0 E ' 1 I O 0 L' am u
SAMPLE RECOVERY - FILTER Filter Cont. Number 2-J&.?q 1.2 ~~ MI1 < E q L Particulate Description Filter Cont. Sealed J J
3-2 fc& 2 -3 P L b c Probe Rinse Cont. Number 2 I f l d r Liquid Level Marked JY'J
SAMPLE YEIGET CALCULATION
Run # Conc.. mg/1 x Vol.. 1 - Blank. mg - Total mp. Lead 1 1.339 x 0 .250 - < O , O / O i 8 . 2 Y q
0 . 3 8 8 2 I . $91 x 0.250 - <@,o /o 3 1.06Y x 0 .250 - < Q , O / O = 0,257
=
BLANK CALCULATIONS
Conc.. m a l l x Volume, 1 I Total mK Filter Blank .Filter Blank
X 0.100 = co.cos- X 0.100 = r o . o c r
L 0 , C S J
C U . P S 0
L O . 0 9 < o d l 0 Total Blank 0.100 = < 0 . 0 0 5 HN03 Blank X
LABORATORY CUSTODY
Received By: FLIi Date Received: 1% -m-87 Stored and Locked: A v' Remarks: &-Y
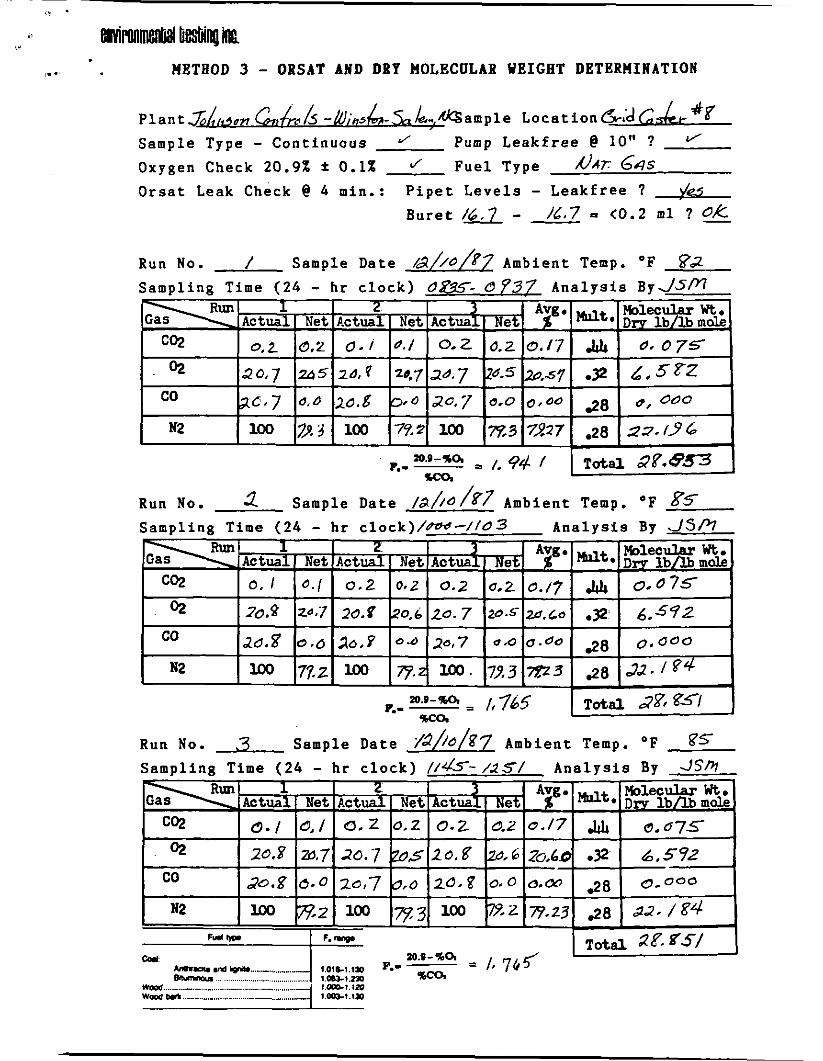
,. mronmbestrmgnc. .. METEOD 3 - OBSAT AND DRY MOLECULAR WEIGHT DETERMINATION
Plant&t,+- &4- 4 1 5 -w;n5fLa-5n L..,m a m p 1 e LO c a t ion G-J &* %B Sample Type - Continuous P u m p Leakfree @ 10” ?
Oxygen Check 20.9% f 0.1% J Fuel Type 6-45
Orsat Leak Check @ 4 min.: Pipet Levels - Leakfree ? y!& L.7 P <0 .2 ml ? 0.k - Buret /u -
Run No. f Sample Date / a / / o / f 7 Ambient Temp. O F
Sampling Time (24 - hr clock) d e - 0937 Analysis ByJ5M
+M
Run No. 2 Sample Date /2//4/g7 Ambient Temp. O F gs Sampling Time (24 - hr clock)/m-/ld3 Analysis B y .-/sfi
%ca
Run No. 3 Sample Date i / a / / / S 7 Ambient Temp. O F g 5 Sampling Time (24 - hr clock) / / & - / d S / Analysis By Jsm
WOm m... 1.aQ-t.IO WOm 1 ‘.-‘,Iw
,. .'
..
d I
I
,. .
.-
.~
/. .
I I I
. Average angle (E)'
METHOD 2 GAS VELOCITY A N D CYCLONIC PLOW DETERHINATIOR
1
.53"
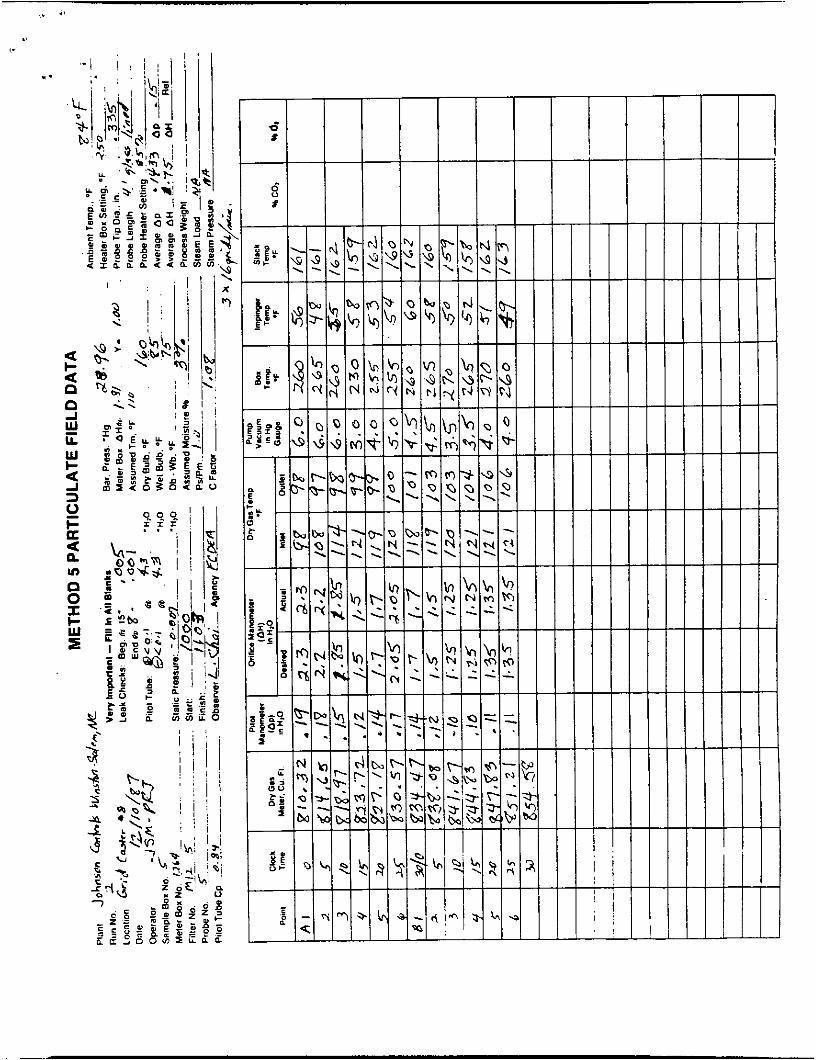
Plant and C i t y 30 hn+oa C O A t r o I-, Run Date /2/h/$'7 Sampling Location &;A ~ c ~ d p v a 8 Clock Time a750 Run Number Operator & M - f f ? J Amb. Temp., O F 82°F Bar. Press. , i n . ~g a?% S t a t i c Press., in . U ~ O -8.09
Stack Press., i n . Ug 22 . ET9 S t a t i c Press., i n . Hg - Q t 8 d 7
Stack Dimension, in. - Dim. o r s i d e 1 13.73 s i d e 2 13.7s
P i t o t Tube (C,) os*'? P i t o t Tube Leak Check <0.1 @ 3. 8 in. E20
~
1 1 I I I I I I 1
Fie ld data 1
.
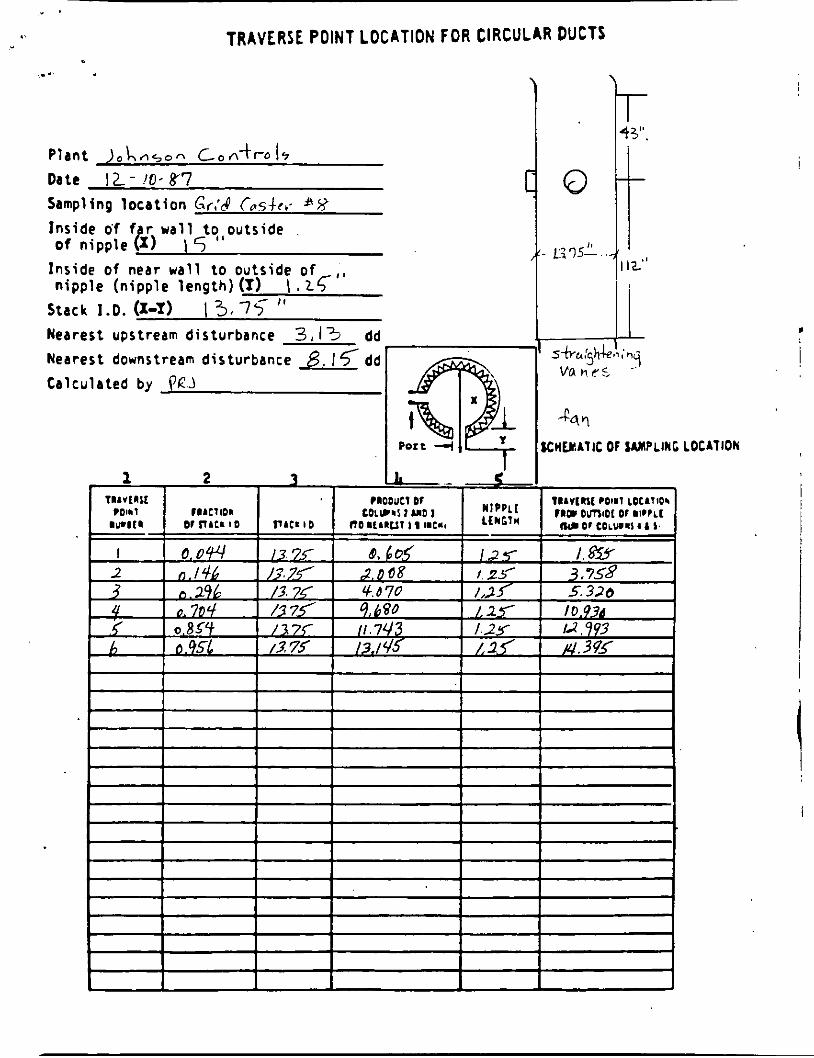
TRAVERSE POINT LOCATION FOR CIRCULAR DUCTS
,. .'
Inside cif f r wall tq,outside o f nipple e XI 5 Inside o f near wall to outside o f
Stack 1.0. I3,7$ ' I
nipple (nipple length) (1) \ I Z q "
Nearest upstream disturbance 3, I 3 dd Nearest downstream disturbance 8. dd Calculated by P C J
Port --I
I I I I I I I I I
1 1 I 1 ' 1
r 43". I I I?-"
i ; "4
J vn q r c
-t?c4*\
CHLuATlC OF SAMPLING LOCATION
1
I
,. . .. f ',
ib; .-
1
,..
I I I
Ouably Assurance Handbook M9.4 2

<. . . I..
f
%. '
c
.. .
Visible Emission Observation Form
I I
OuaBIr Assurance Handbook M9-4 2
I. *
,"
I -
(
.
I I I
Oualrtr Assurance Handbook M9.4 2
,.
I !'
.. f
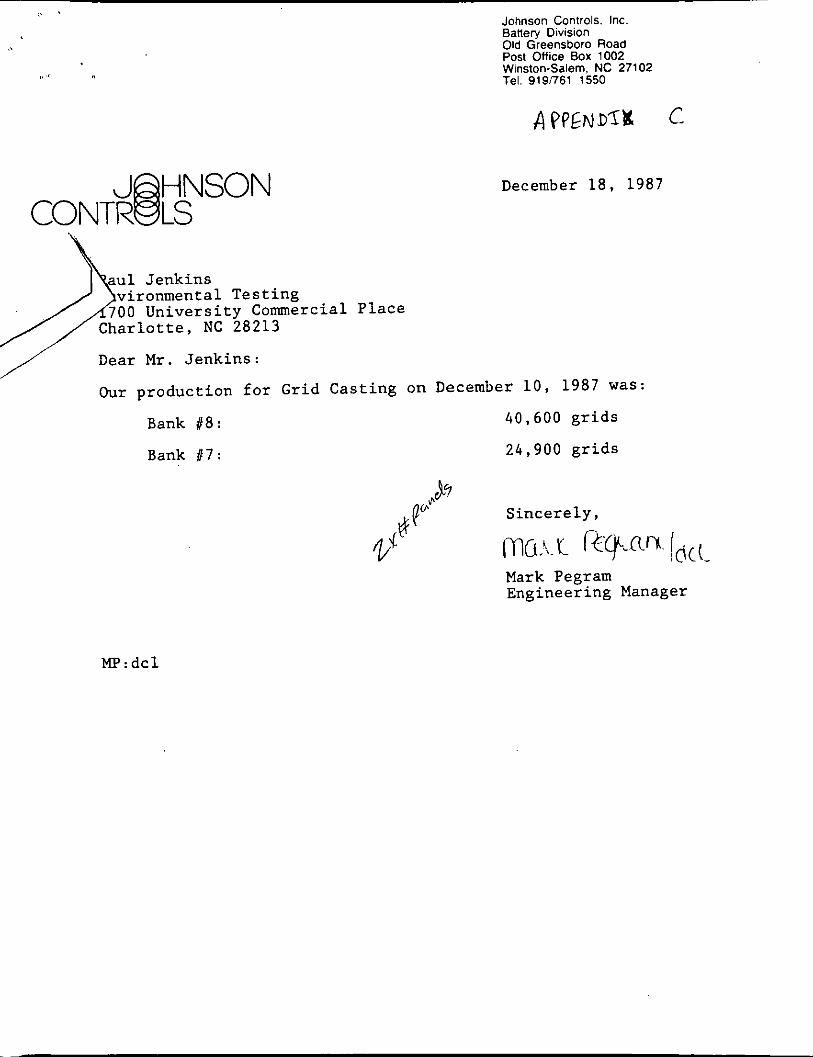
J "SON CONTR 8 LS
Johnson Controls. Inc. Battery Division Old Greensboro Road Post Office Box 1002 Winston-Salem, NC 27102 Tel. 919!761 1550
December 18. 1987
vironmental Testing Commercial Place
/ Dear Mr. Jenkins:
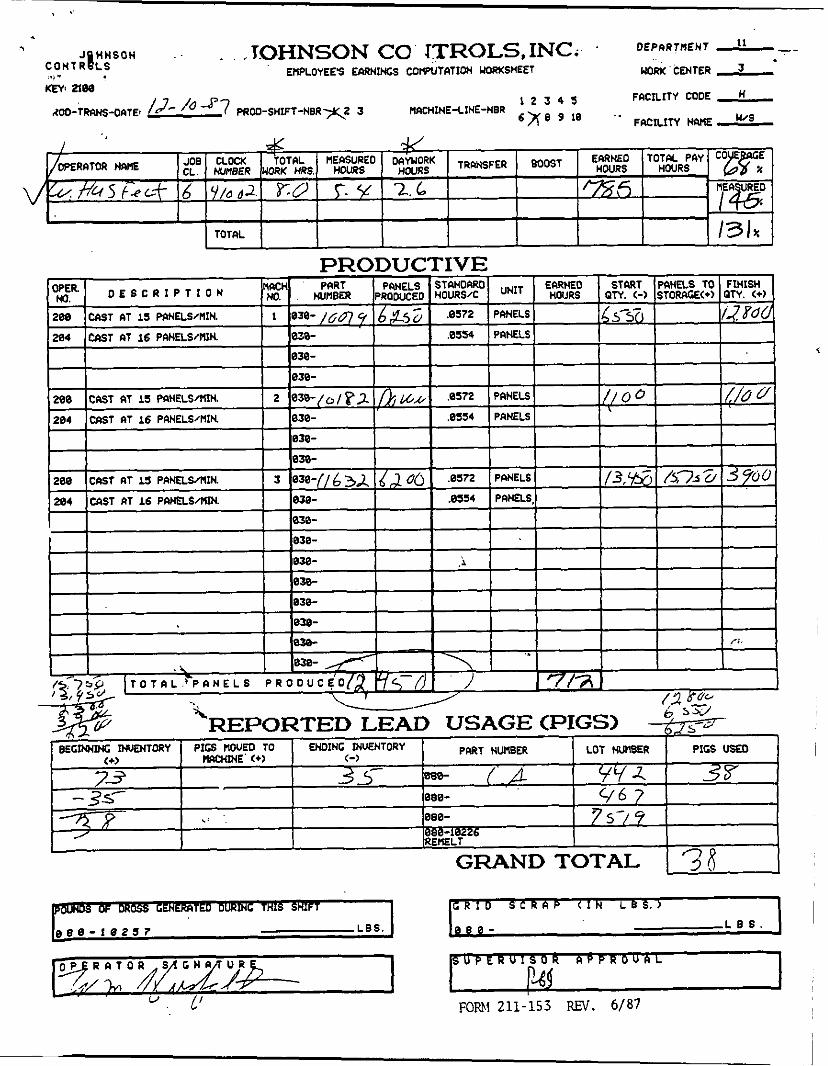
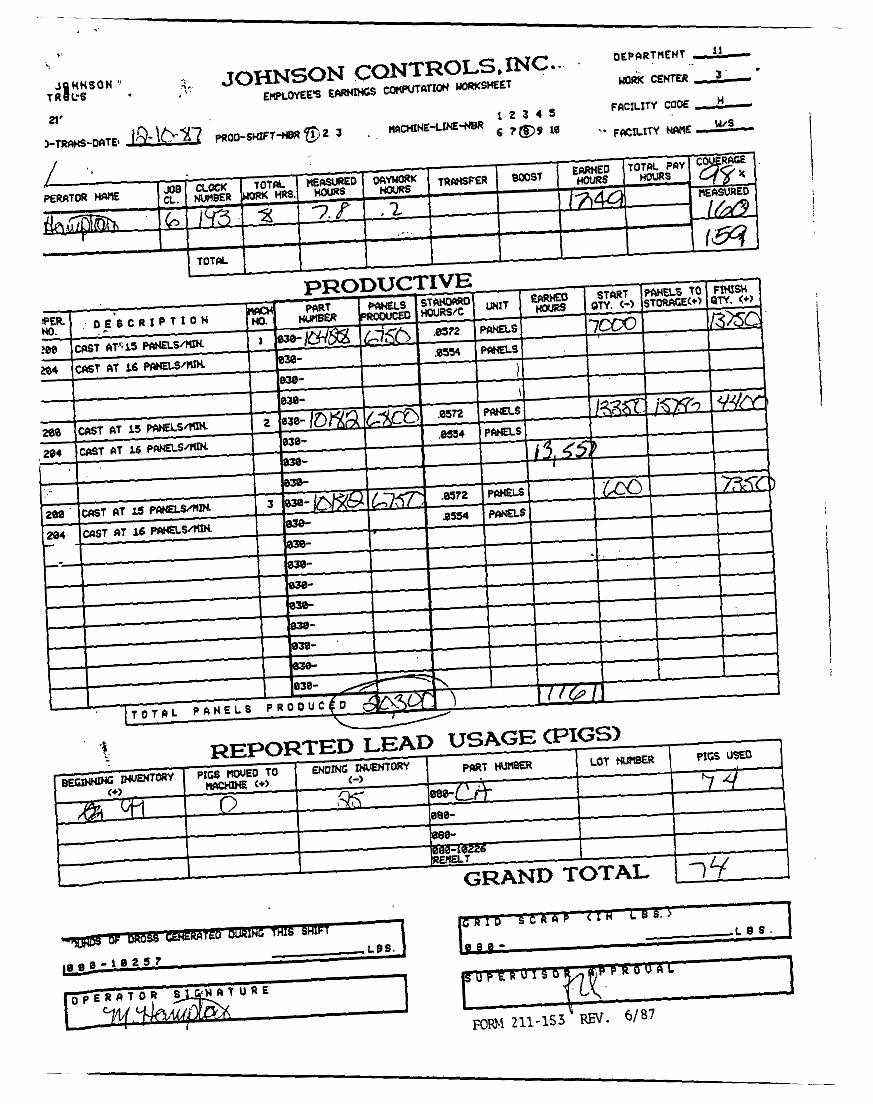
Our production for Grid Casting on December 10, 1987 was: Bank 118: 40,600 grids
Bank 87 : 24,900 grids
Mark Pegram Engineering Manager
MP:dcl
I
> DEPhRTUENT - 11 -~ J HHSOH . , 1.OHNSON CO TTROLS,INC. '
EWLOYEES EPRNINGS COPIPVTPTX~ UORKSttEET WORK CENTER
FACILITY CODE
C O H T R 1 L S ., " KEY, ZIW
1 2 3 4 5
' X e I' ' FRCILXTY wr(E !.Us 12- lo J? PROD-SHIFT-NBRx2 3 ACD-TRWS-OIITE* MACHWE-LINE-NBR
PRODUCTIVE
<
I
I
I
GRANDTOTAL
N L B S . )
L B S I
I FONI 211-153 REV. 6/87
J H N S O N " ~ 4. JOHNSON CONTROLS,INC.. . OEPRRTMENT $1
EWLOYEES E W W S COWUTflION YORKSHEEl UORK CENTER 3 TR 8 L.8
APPENDIX D
TEST PAPTICIPAATS
James S. McCormack. P.E. President Environmental Testing, Inc.
Paul R. Jenkins, Jr. Vice-president Environmental Testing, Inc.
F. Larson Aarsep Biologist Environmental. Testing, Inc.
Jeff A. Francis Biologist Environmental Testing, Inc.

THURSDAY, AUGUST 18, 1977 PART I I
ENVIRONMENTAL PROTECTION
AGENCY
STANDARDS OF PERFORMANCE FOR NEW STATIONARY SOURCES
Revision to Reference Method 1-8
RDWAL I t G I S I f I . VOL 4 1 , NO I b L T N U I S O A V . AUGUST I#. 1977
,, .I
,.
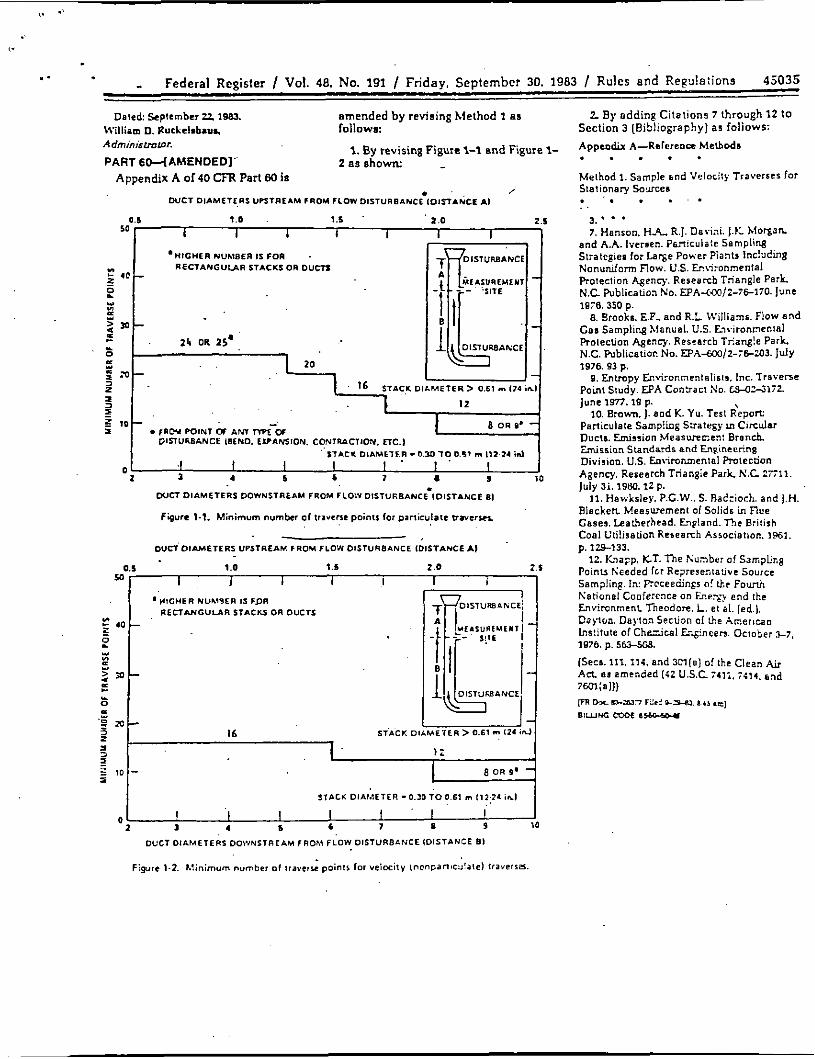
- Federal RcgisIer / Vol. 48. No. 191 / Friday, September 30. 1983 / Rules and Re&liDn9 45035 ..
50
40
PD-
Dalod Srplrmbcr 22 1983. William D. ifuclelshaus Adminir~m~or .
PART BMAMENDED] Appendix A of 40 CFR Par1 80 is
I I 1 I I I I
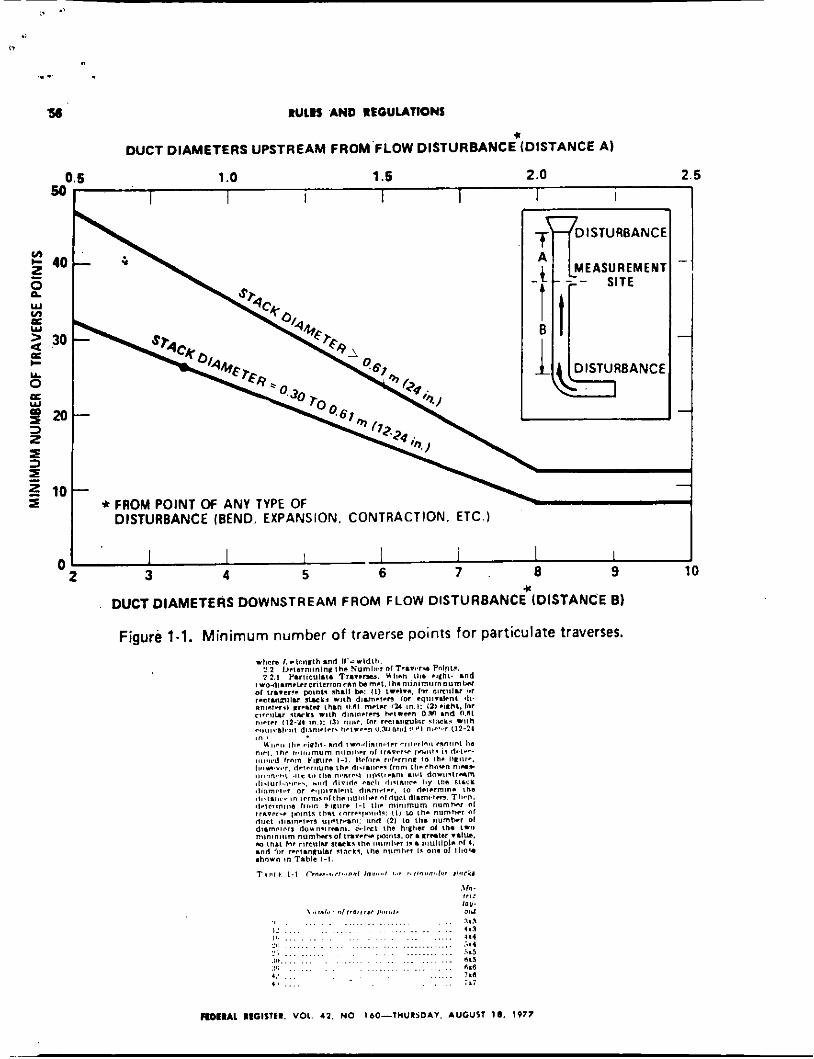
*HIGHER NUMBER IS FOR . R E C T A N G U I A R STACKS OR DUCTS -
. 24 OR 25.
amended by revising h le lhod 1 as follows:
2 as shown: ~
1. By revising Figure 1-1 and Figure 1-
I2
I 8 OR 9' - - " - f l C Y POIN1 W ANV --W DISTURBANCE 18INO. I Y A . M I O N . CONlRACllON. nC.1
S l l C X O l A M E ~ f . R - O . Y ) l O 0 . 5 ~ rnlll.24id I I I I I . I ' I 0
Z By ndding Cilaliona 7 through 12 10 Section 3 (Bibliography) a5 foiiows: Appendix A-Rslcrcnoc M c l b o d ~
hielhod 1. Sample snd Velocity Traverses for Stationary So,wces
. . . . .
. . . . . . . . 3: * 7. Hsnron. H A R.1. Daviai. 1.): h b w n
end A.A. Ivcrsen. P&nicula:e Sampling Strategies for L a s e Power Pianu Including N o n u d a m Flow. US. Fmironnental Rotection Agency. Reresrch Triangle Perk N . C Fublication No. EPA-C€Q/2-i&liO. lune 1078.350 p.
c a s Sampling hianual. U.S. Lxironnenlal Rolection Agency. Resrarcb Ti.ang!e P a r t N.C. Fublicatior No. WA-Cm/Z-X-Z03. JdY 1976.93 p.
0, Envopy G..vironnenlalisli. Inc. Traverse Point Study. EPA Consact So. W 2 - J l i Z lune 1977.18 p.
10. Brown. I. and K. Yu. Test depon: Particulate Samp!iig Strategy in Circular Ducts. Emission Measmcccn! Branch Emission Standards and Eneinecnng ~iv is ion . U.S. Enrimmental Rolection Aaency. Research Triangie Park, N.C 277:l. July 3 i . 19ffl. 12 p.
Biackett Meesuremenl of Solids in Rue Cases. Leatherhead. Enpland. T h e British Coal L'ti!irslian Rerearch Asvxialion. ]MI. p. 129-133.
8. Brooks. E.P.. and R.L iVilliama. Flow and
11. Hewkrley. P.C.W.. S. RaZ:iocb and I.H.
12. b a p p . KT. The Xu.nber of S3mpiir.g Poinu Xeeded fcr Representative SOWCC Ssmp!ing. In: pmceedings o! Lte Founh National Conference an Fkqy end !he FnvimnmcnL Tneodom. 1. e t al. (ed.). Dayton. Dayton Section 01 &e ~ m e r , c a ~ ha ! i t u te of Che=.ical L~incen. Ocmber 3-7, 107b. p. 5 6 3 4 E a
(Seci. 111.:14. and 3m(s) of the Clean ~ i r An. ~ 1 s amended [:Z U.S.C 741;. i a 4 , snd 7601;all) IFR Dr -7 F M e-. 8 ,I
B l y l f f i CMIf 6-
DUCT OtAMETERS DOWNSTRCAM FROM FLOW 01STURB~NCE IOISTANCE e l
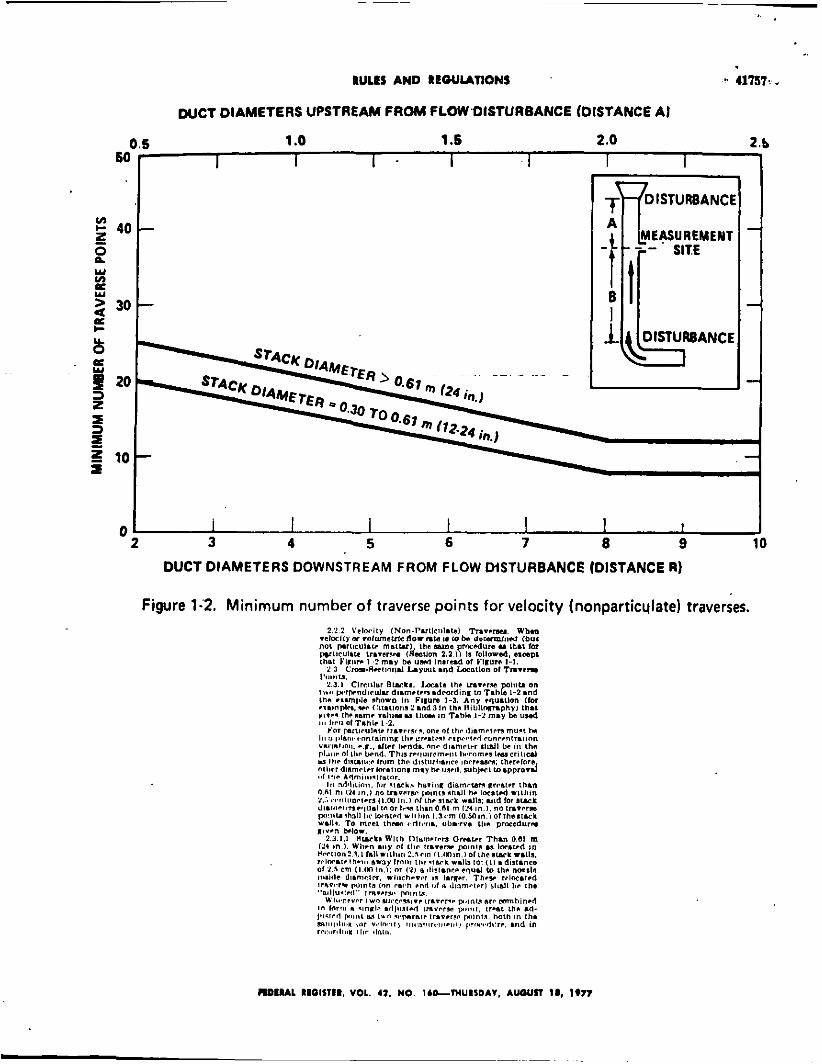
F i p r e 1-2. h!inirnum number 0 1 t r a v c l y poinli lor v e t a i l y lnonpanlc>!alel IIIVLISCI.
RULH AND REGULATIONS
DUCT DIAMETERS UPSTREAM FROM FLOW DISTURBANCE (DISTANCE A) c
0.5 1 .o 1.5 2.0 2 5
I I I I I I I
I I I I I I I
3 4 5 6 7 0 9 0
2 +I
DUCT DIAMETERS DOWNSTREAM FROM FLOW DISTURBANCE (DISTANCE B)
Figure 1-1. Minimum number of traverse points for particulate traverses.
. . . . . . . . . . . . . . . . . . . . . . . 1.1 i l . . . . . . . . . . . . . . . . . . . . . . 4 . 1 I,. . . . . . . . . . . . . . . . . . . . 1.k 1'8 . . . . . . . . . . . . . . . . . . . . . . . . . . . .11 . . . . . . . . . . . . . . . . . . . . . . . . . . i .5 . \ l l . . . . . . . . . . . . . . . . . . . . . . 0.3 .\ti . . . . . . . . . . . . . . . . . . . . n.6
.,;
. . . . . . . . ! '? .... . . . . . . 42 , I
R D I I A L 1)1011111. VOL 4 2 , NO 160- lHUI5DIV. AUGUSI 10. lV77
WCT DIAMETERS UPSTREAM FROM FLOWN.DISTURBANCE (DISTANCE A I
0.5 1 .o 1 .s 2.0 I I 1 - 1 I I I
I I 1 I I I 1
3 4 5 6 7 8 9
DUCT DIAMETERS DOWNSTREAM FROM FLOW DISTURBANCE (DISTANCE R)
0 2
Figure 1 i2. (nonparticqlate) traverses.
41758 uuus A)(D ~ U T l o N S
7aAVEME DlSlANCE.
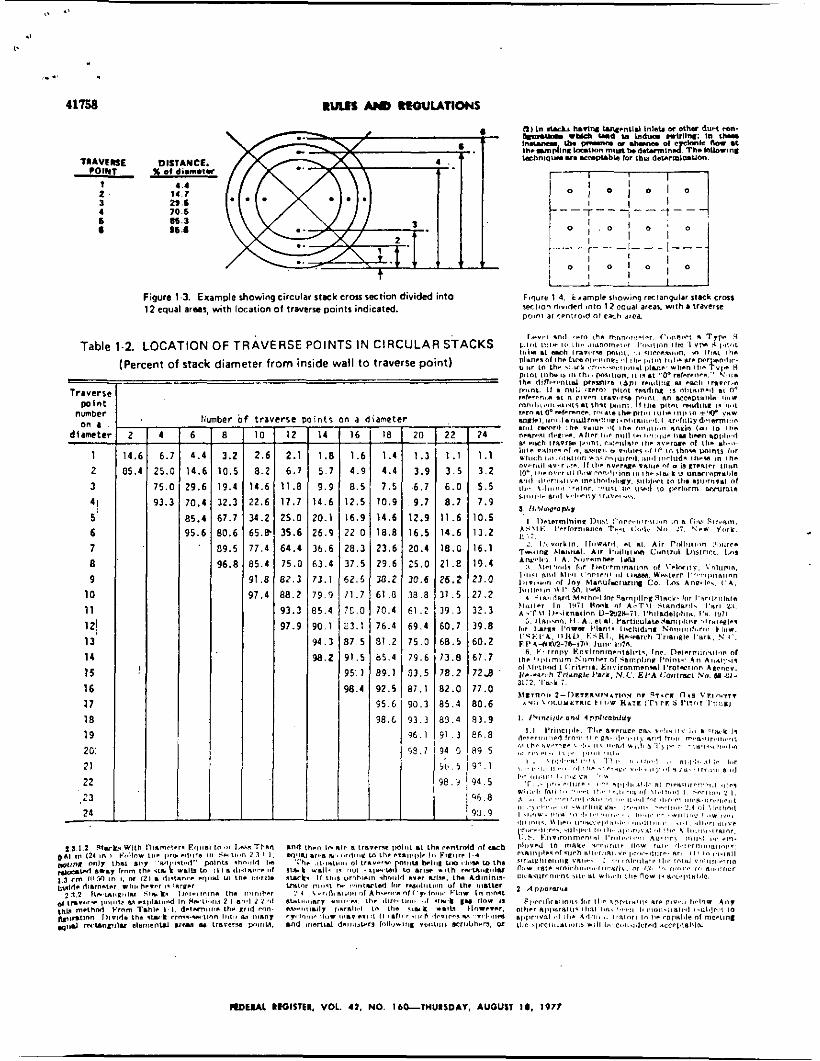
1 4 .4 2 . 14.7 3 29.6 4 70.6 6 86.3 1 16 .1
COIN1 x D I do.m.lr
Figure 1-3. Example showing circular s t x k cross section divided into 1 2 equal amas, with location of l r a v ~ r y points indicated.
Table 1.2. LOCATION OF TRAVERSE POINTS I N CIRCULAR STACKS (Percent of stack diameter from inside wall to traverse point) -
Trwerr, wlnt
d 1 anrtc
nMIbFr on a -
1 2 3
4 ! 5' 6 7 8 9
1 0
11
13
14
15 1 6 I7 I8 19
20: 21 22
, 2 1 26
12:
-
2 4
14.6 6.1 05.4 25.c
75.c
93.3
I - 6
6.1
14.1
!9.1 '0.1 15.4 15.1
- ,er 8
3.2 10.5 19.4 12.1
57.7 30.6
19.5
36.8
- -
t r IO
2. 8.
14. 22.
34. 65. 7 7 .
B 5 . 91 . ,
3 7 .
- -
're D o i n t r
12 14
2.1 1.8 6.7 5 .7 1.8 9.9 7 . 7 14 .6
15.0 20.1 15.6 26.9 i4.4 l b . 6
' 5 . 0 61.4
L . 3 73.1
i8.2 79.9
13.3 8 5 . 4
17.9 90 1 9 4 . 1
90.2
m a 16
1 .6 4 . 9
8.5 12.5
16.9 22 0
28.3 37.5
52.5 11.7
!E 0 - 3 . 1 37 5
91.5
95 1
38 4
- -
-
dfWt
18
1 . 4 6.1
7.: IO.! I 4 . t 18.f
23.t 29. t
- -
3n.z 61 .E
70.4 76.4
81 .i n5.4
89.1
92.5 5 5 . 6
38.6
-
- 20
1 . I 3.9
.6.7 9.7
12.9 16.5 20.4 25.0 10.6 18 .8
61 .2
69.4 75.0
79.6
31.5 87.1
90.3
91.3
9 6 . 1
49.7
-.
-
l b . 5 19 ' .1
93 .9
I T - 7- - -1 - - -t - - _ _
R D E U L W C l l l E l . VOL. 41. NO. Ib&THUtSDAV. AUGUSI 11, I977
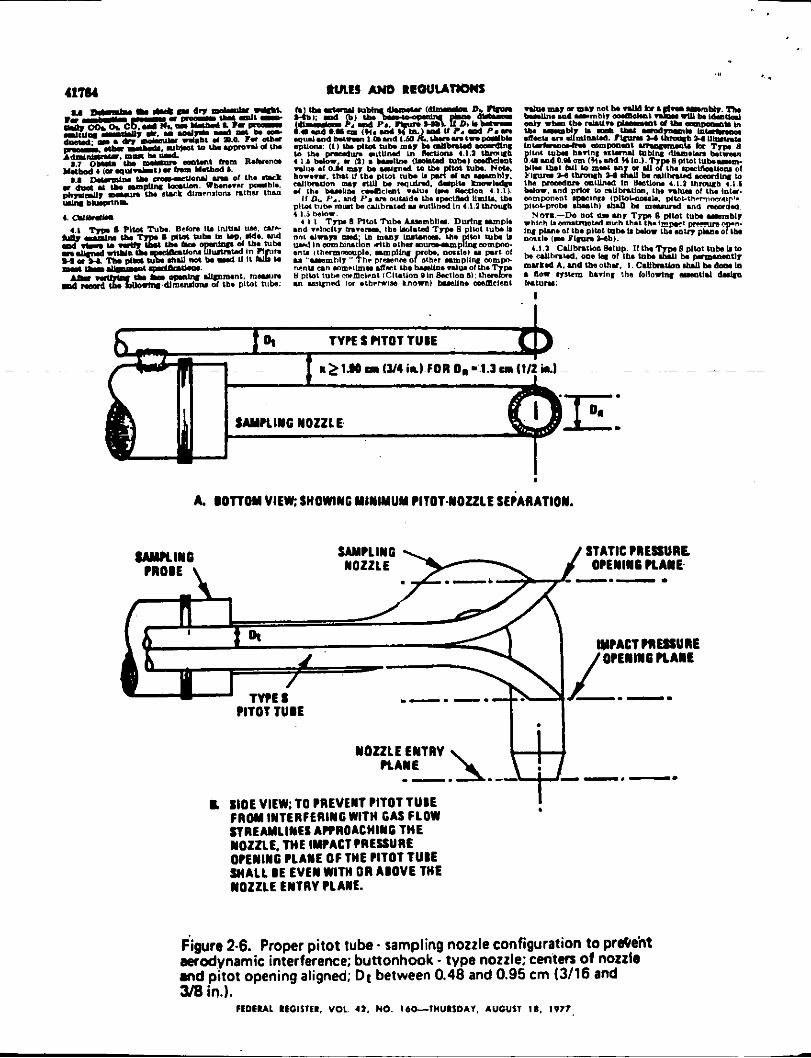
41764
1-011:
I ' I
A. BOTTOM VIEW SHOWING M4NIMUM PITOT-NOZZLE SE)ARATION.
NOZZLE E m v
--. ..--y --,-. L. SIOE VIEW; TO m v m PITOT TUBE
NOZZLE, THE IMPACT PnEssunE OPENING PLANE OF TnE PITOT TUBE SHALL BE EVEN WITH on ABOVE THE NOZZLE w i n v PLANE.
FROM INTERFERING WITH GAS FLOW STREAMLINES AWROACHING THE
Figure 2-6. Proper pitot tube. sampling nozzle configuration to prsVeht aerodynamic interference; buttonhook - type nozzle; centers of nozzle and pitot opening aligned; Dt between 0.48 and 0.95 cm (3/16 and 3/8 in.).
F f D f U L IfGlSlEl, VOL. 42 , NO. 160-THUISDAV. AUGUST I O . IP7I
TIIEIIOCOLIPLE TWERYOCOUPLE
- TYPE S?lTOT TUDE ol T W E S PITOT TUDE
I
i I i
S I Y P L E PRO8E
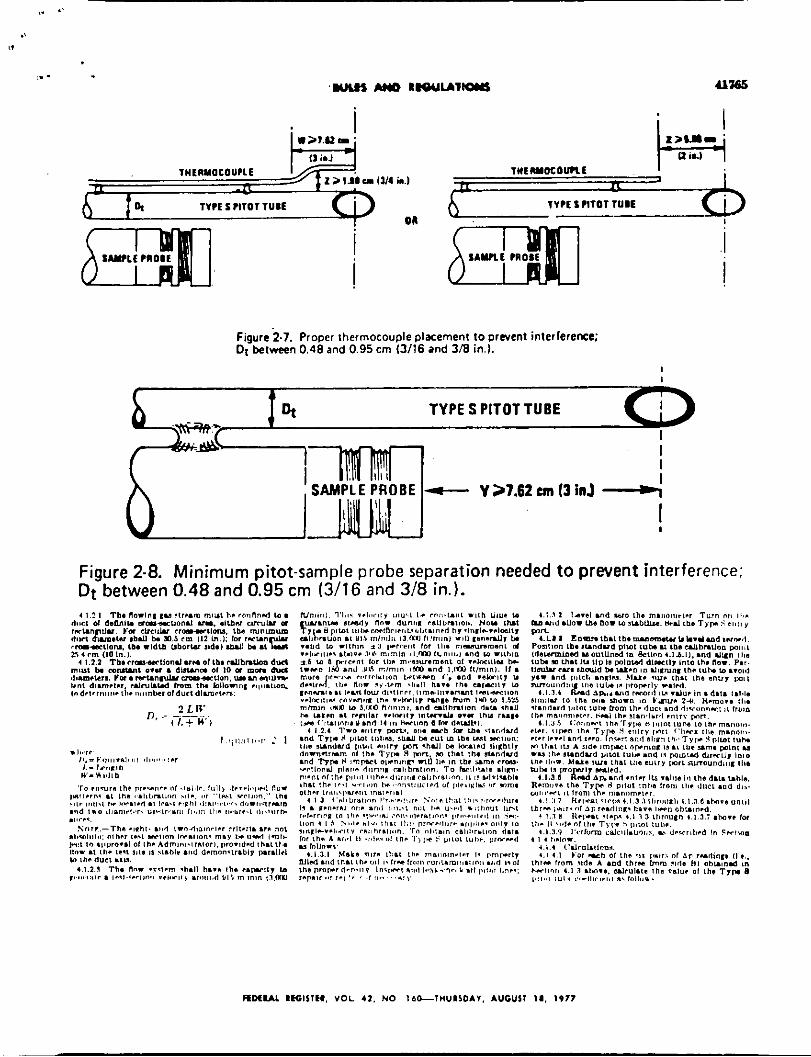
Figure2.7. Proper thermocouple placement to prevent interference; Dt between 0.48 and 0.95 cm W16 and 3/8 in.).
TYPE S PITOT TUBE
I I I - Y >7.62 em (3 i d T I I
Figure 2-8. Minimum pitot-sample probe separation needed to prevent interference; Dt between 0.48 and 0.95 cm (3/16 and 3/8 in.).
K D t U L Iffil$TH. VOL 4 1 . NO I b L T M U t I D A Y . AUGUSI I t , 1971
rnss
I I I I I I I r l I I I I I 3 ' I I I I - 1
I I M 1
2 I I 1 I I 1 I I 1
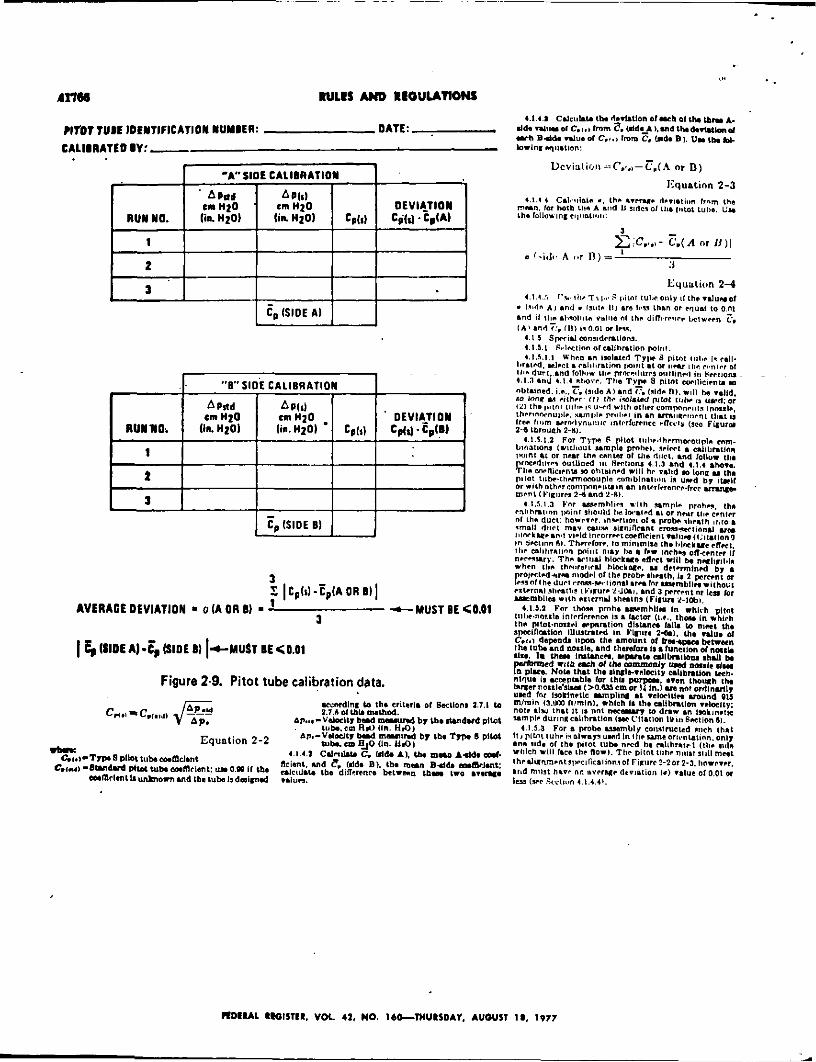
1 X I CpIlJ - t p I A OR 0) I
AVERAGE DEVIATION 0 u (A on 01 - ' C MUST BE CO.01 3
I E, WIEAI-C; BIDE BI I+MUJT OE a . 0 1
Figure 2.9. Pitot tube calibrbtion data.
R D € U L Rw) IS l€ t . VOL 41, NO. 16L) IUtSDA.I . AUOUSI 18. 1977
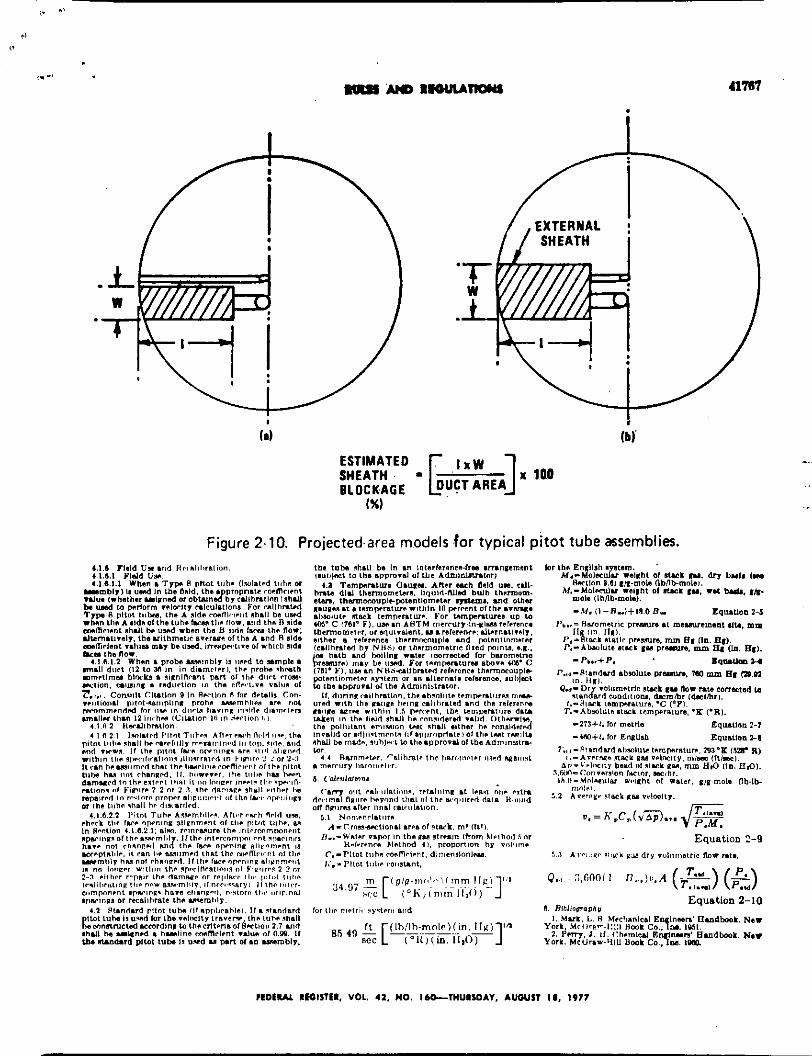
ESTIMATED SHEATH [ 1'' ] X 100 BLOCKAGE OUCT
(XI
Figure 2.10. Projected-area models for typical pitot tube assemblies.
-273+1. lo, mama -w+l.for Ensllah
Equation 2-10 t Rlhl,"orooh"
R D l l U 11011111. VQL 41, 110. l&MUUDAV. AYOUST 11. 1977
". 4 1 0 RULES AND RCOUUT"8
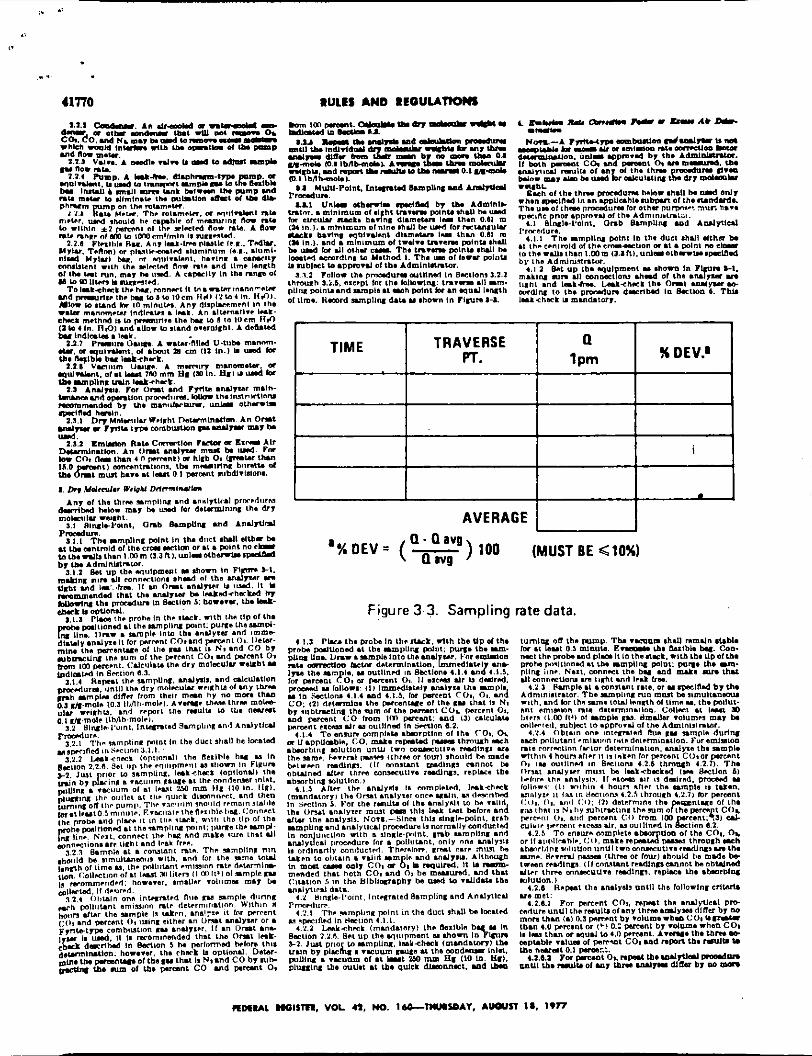
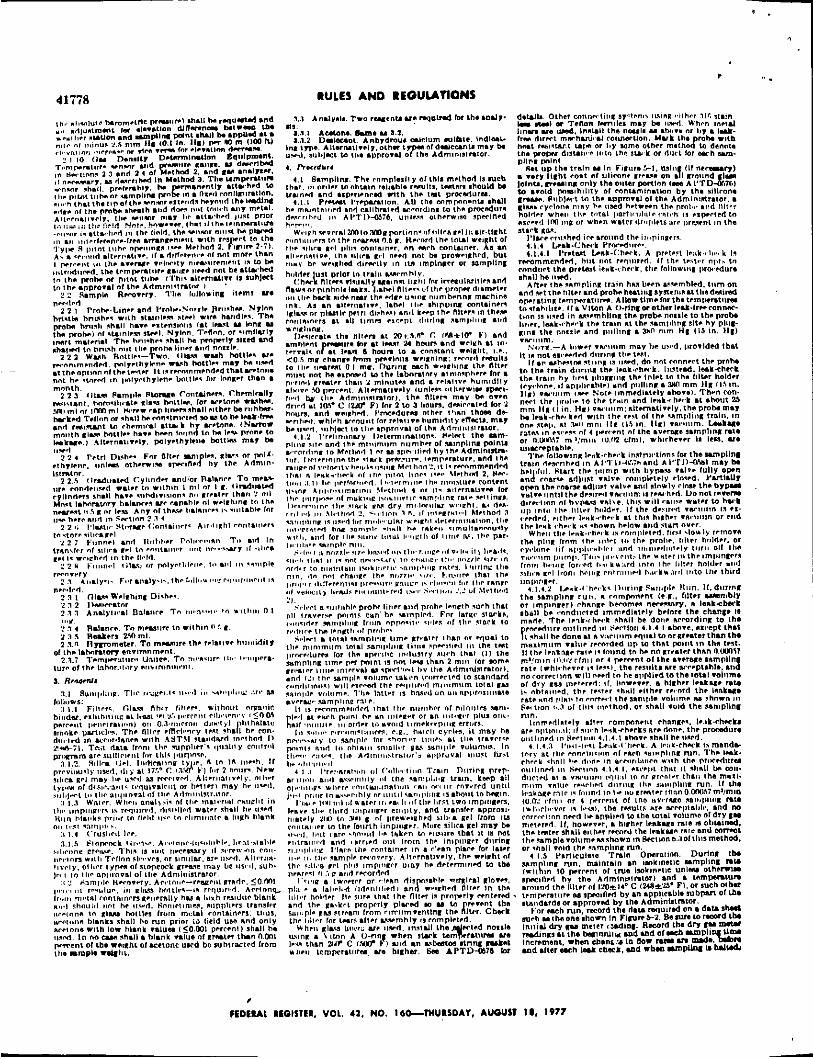
Figure 3-3. Sampling rate data.
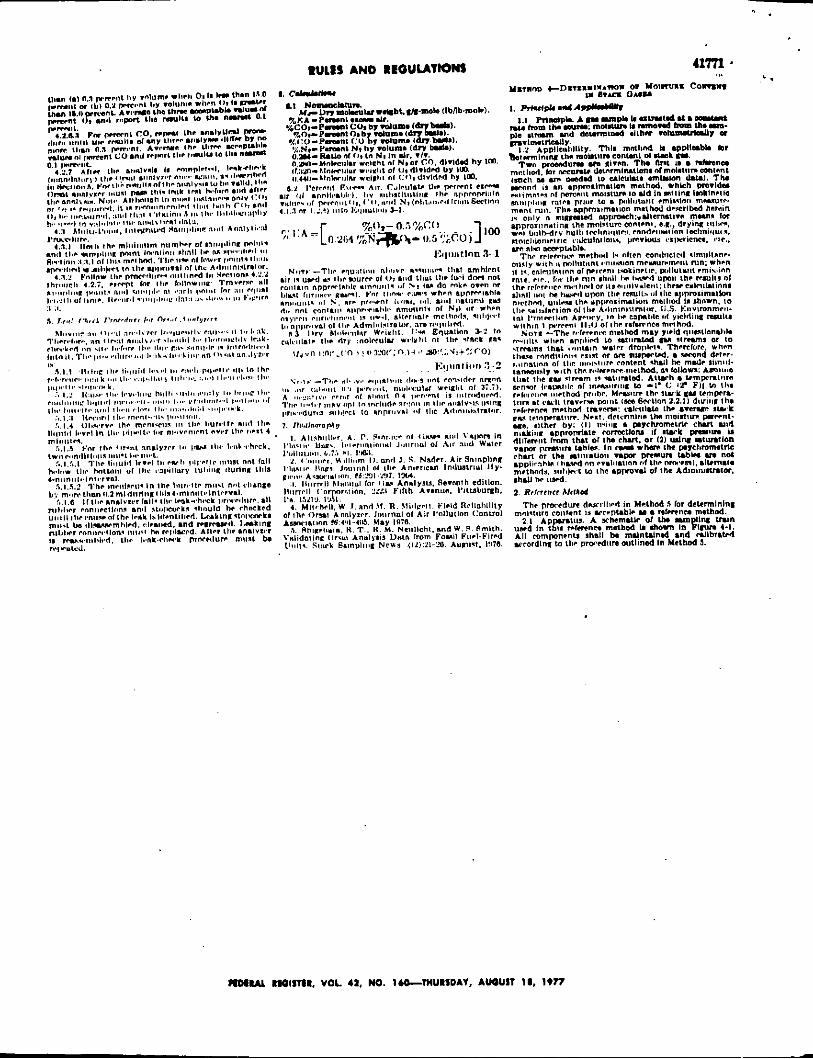
Figure 4.1. Moisture sampling train-reference method
H D I l A l LIQISlIl. VOL 4% NO. 1 6 0 - M S D A T . A l D U S I I D . I W J
IIULIS AND REGULATIONS
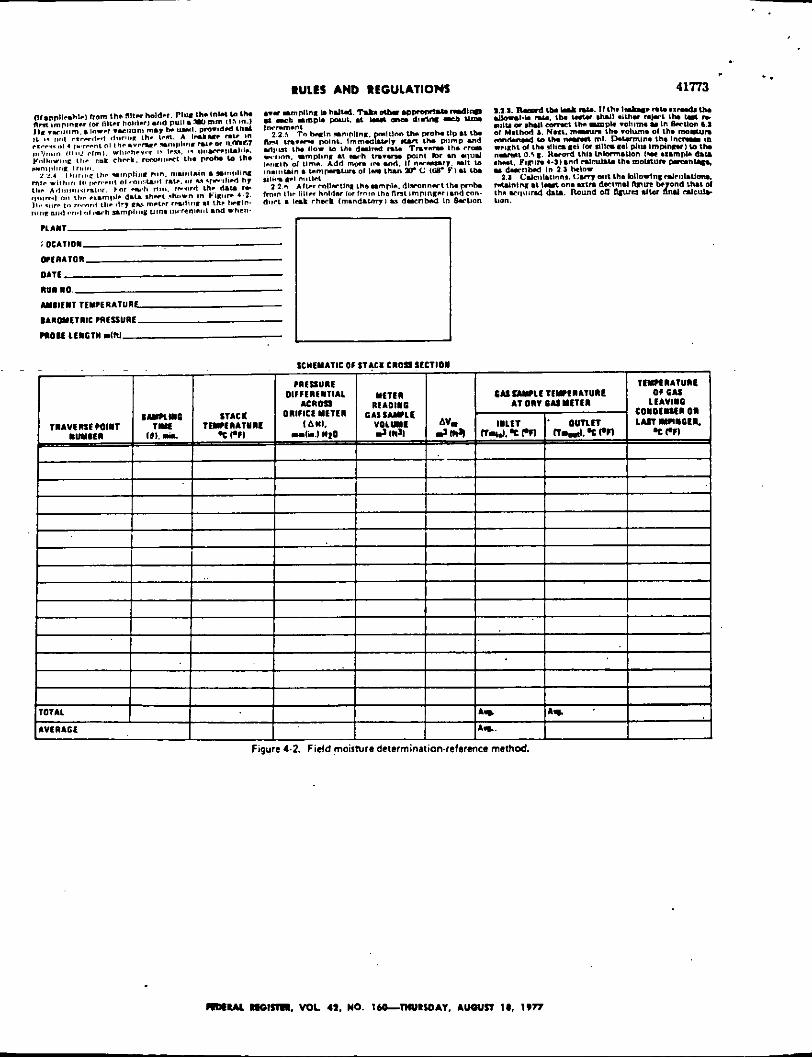
Figure 4.2. Field moisture determination-refarmce method.
. .' 41774
RDIIBAL I M l S l I I . VOL. 41, NO. I 6 L l H U I S D A V . AUQUll la, le77
41776
Equstion 4-7 4. C.l,lhl,m
4-5
4-6
WlU RICUUTIOIIS urn
IMPINGER TRAIN 0PTIONAL.YAY BE REPLACE0 BY AN EPUIVALENT CONDENSER
CHECK VALVE
VACUUM LINE
REVERSE.TYPE PITOTTUBE
THERMOMETERS
ORY GASMETER PUMP
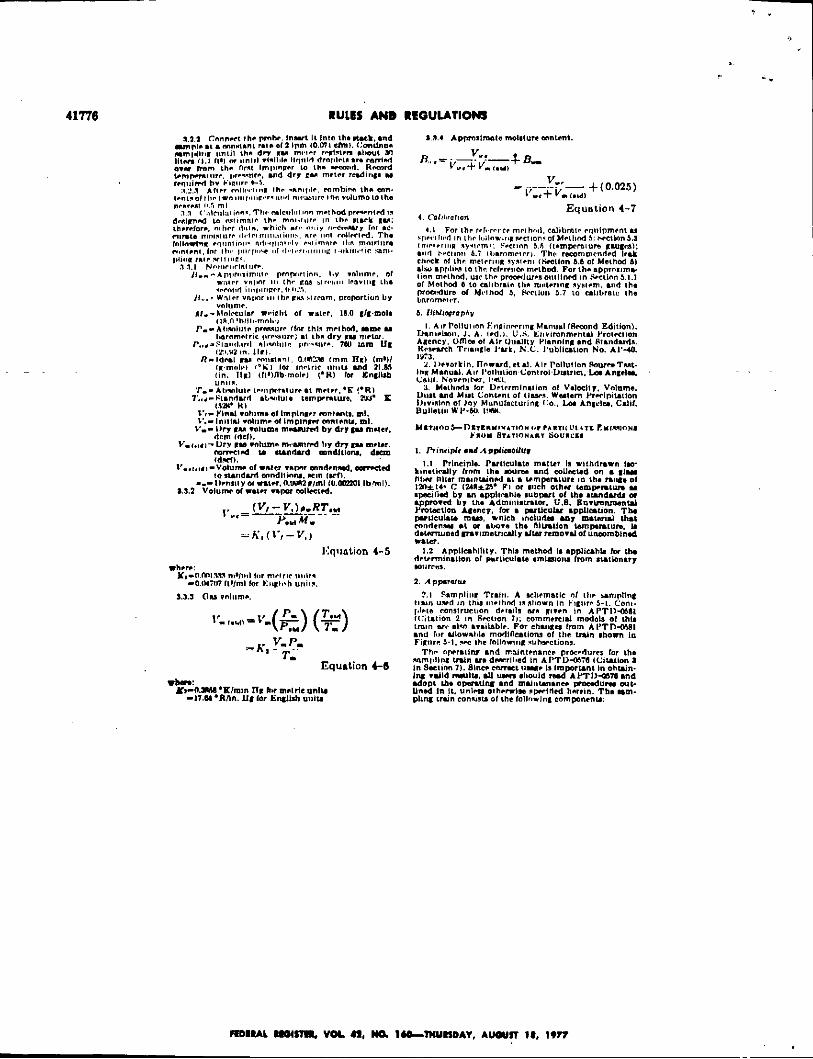
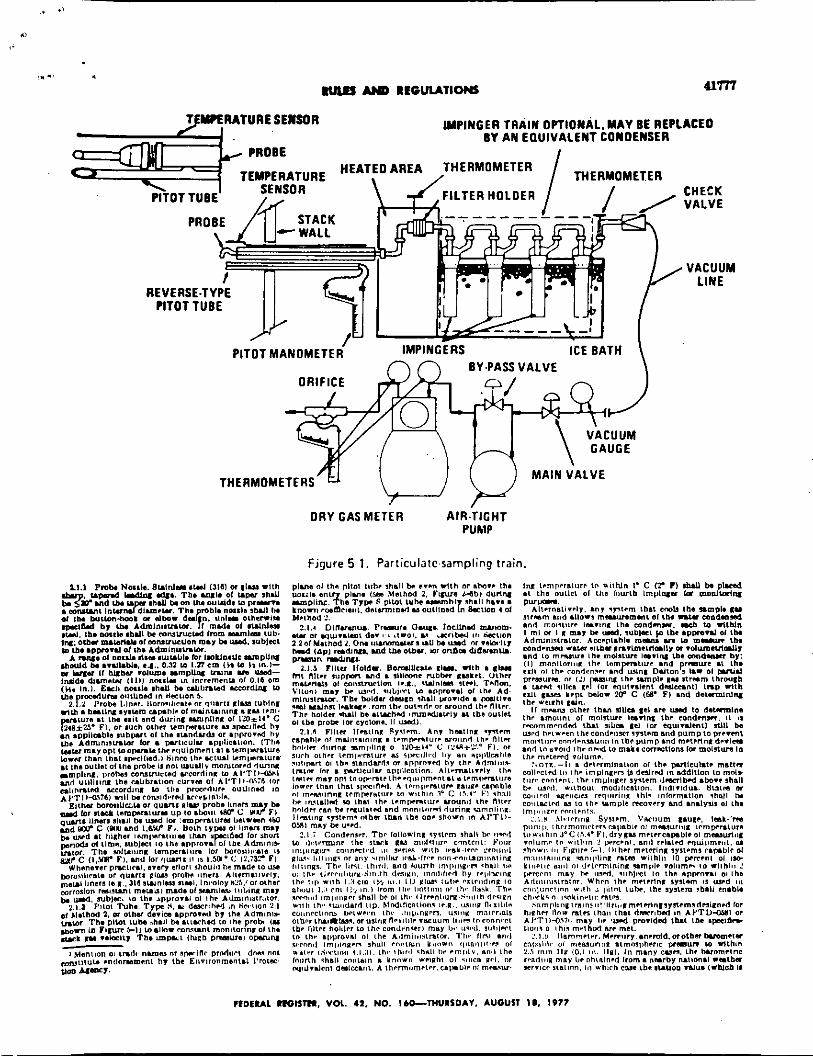
Figure 5 1. Particulafc.sarnpling train.
I ID IRAL mlSm, VOL. 41, NO. lLO--TwvISDAV. AUOUII l@, 1977
4 1778 RULES AND RtOUUllONS
RULES AND REOUU~ONS 41718
P L A N 1
L O L A I l O N
or in&ion
nuu NO. D A l l
SAMPLI IOXNO.
M l l E R 101 NO.
M E T i R A H @
C fACTOR
P l l O T T U I t EOlffICIENT,Cp-
.. . AVEIAGE I I I I
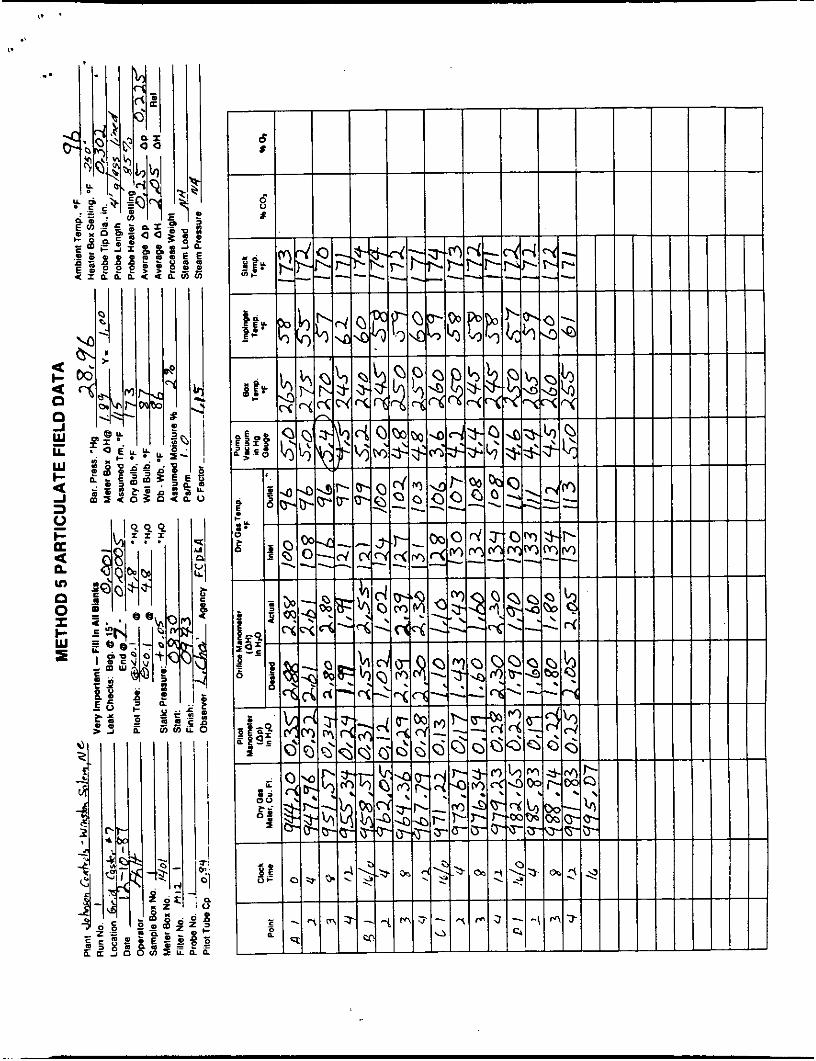
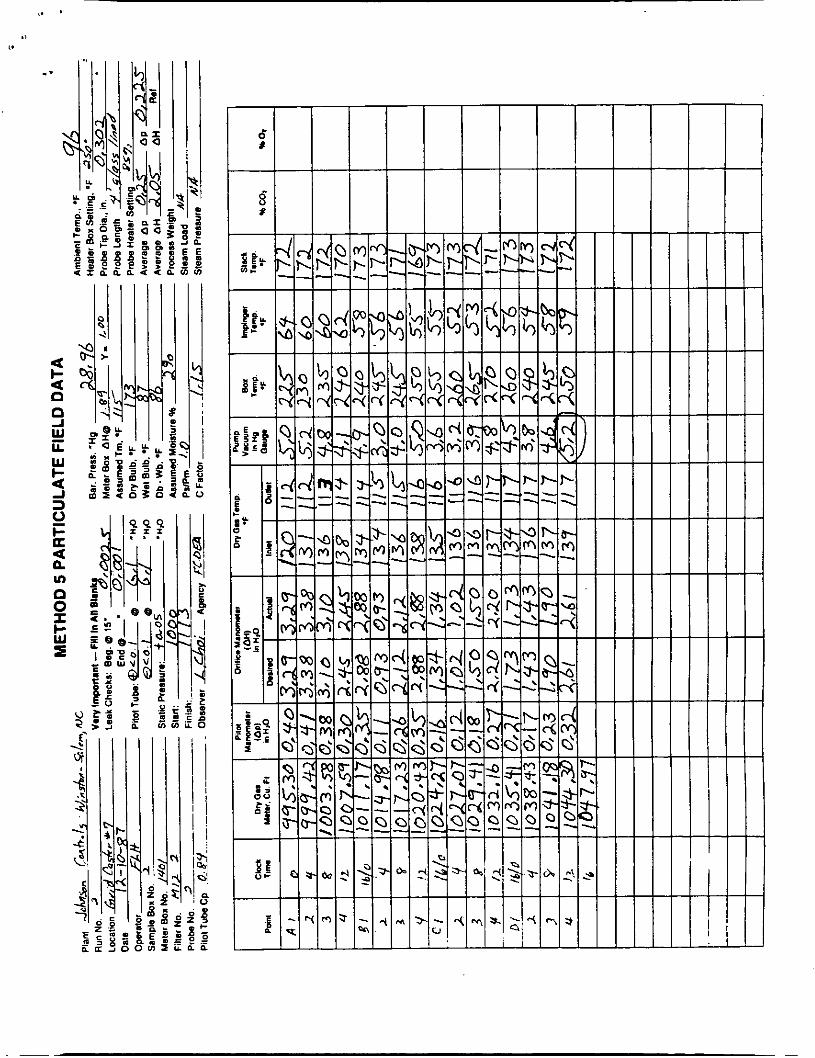
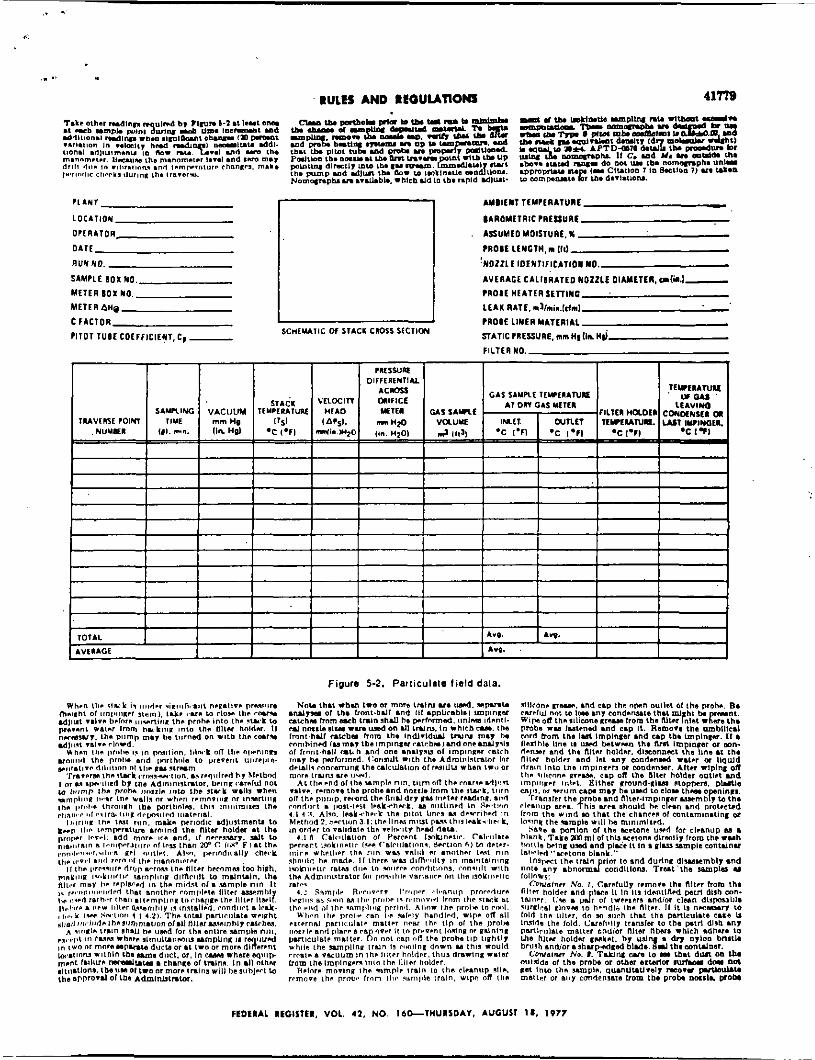
Figure 5-2. Parliculalo field dala.
FtDfRAL REGISlE1, VOL. 41, NO. I b ~ l H U R I O A Y . AUGUSI I#. 1977
41780 HwtJ *I1D I t e u U T ~
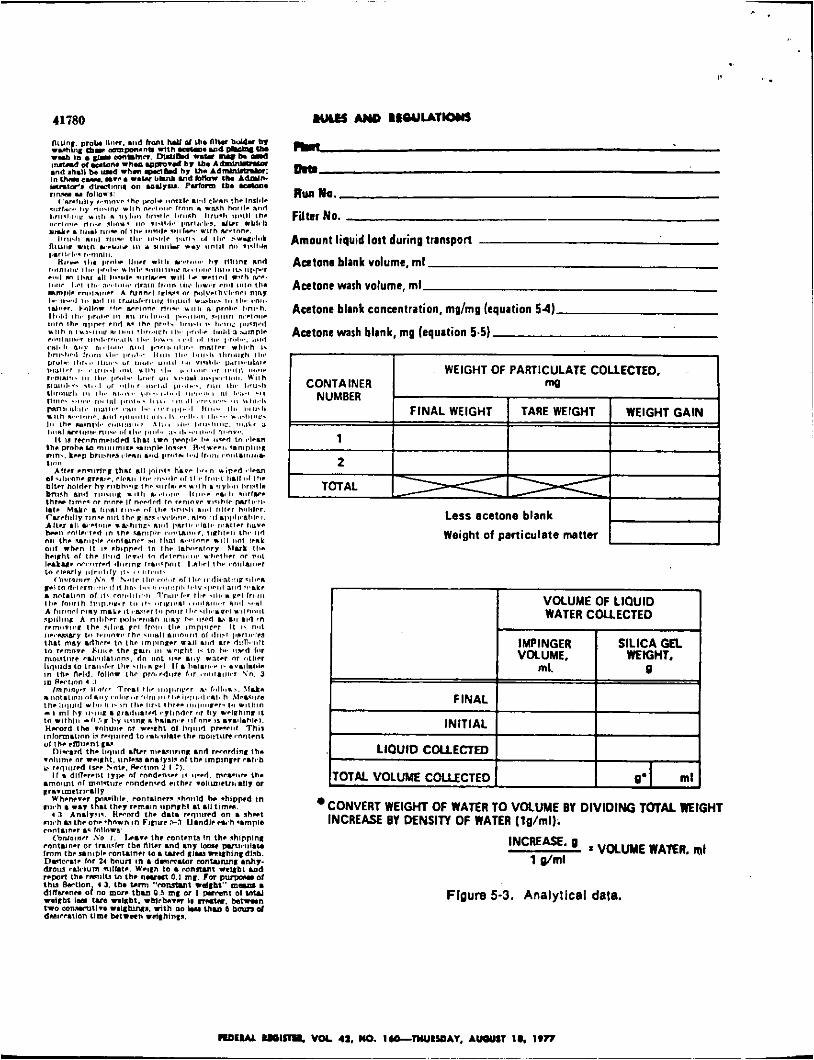
LlOUlD COLLECTED I I TOTAL VOLLIME COLLECTED 9. ml
CONVERT WEIGHT OF WATER TO VOLUME BY DIVIDING TOTAL WIGHT INCREASE BY DENSITY OF WATER llg/ml).
1 o/ml INCREASE* g
a VOLUME WATER, mi
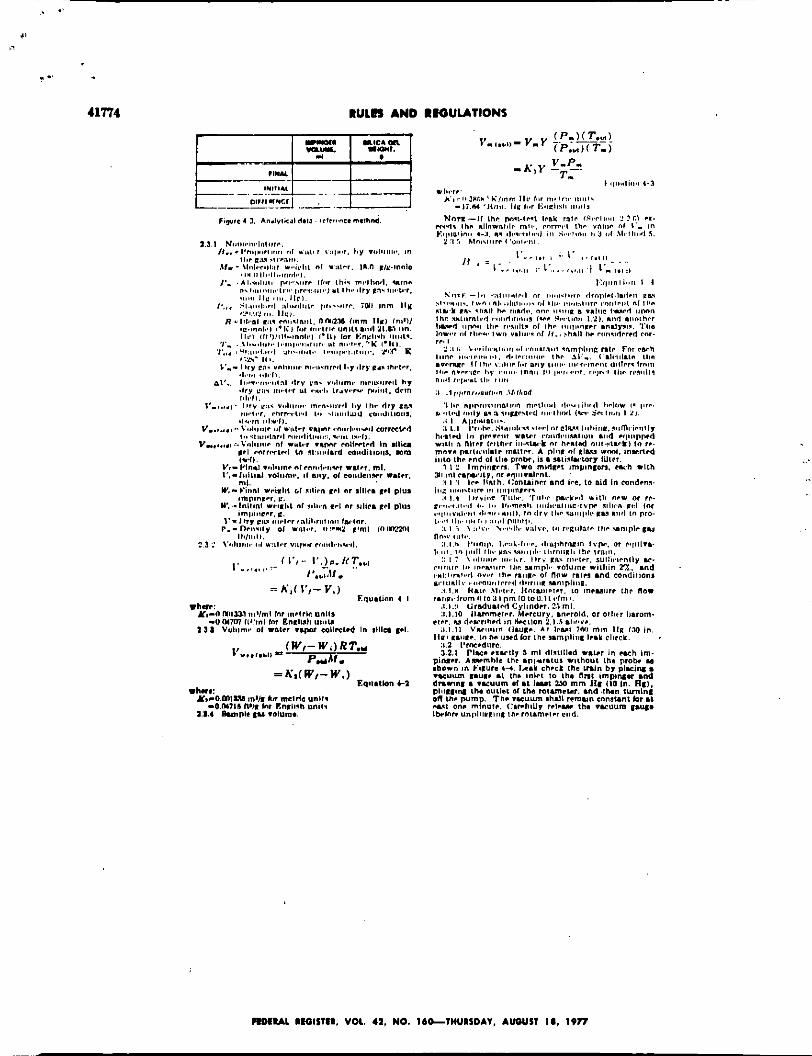
Flgum 5-3. Analytical data.
. .
RULES AND REGUUTIONS 41781
VACUUM -
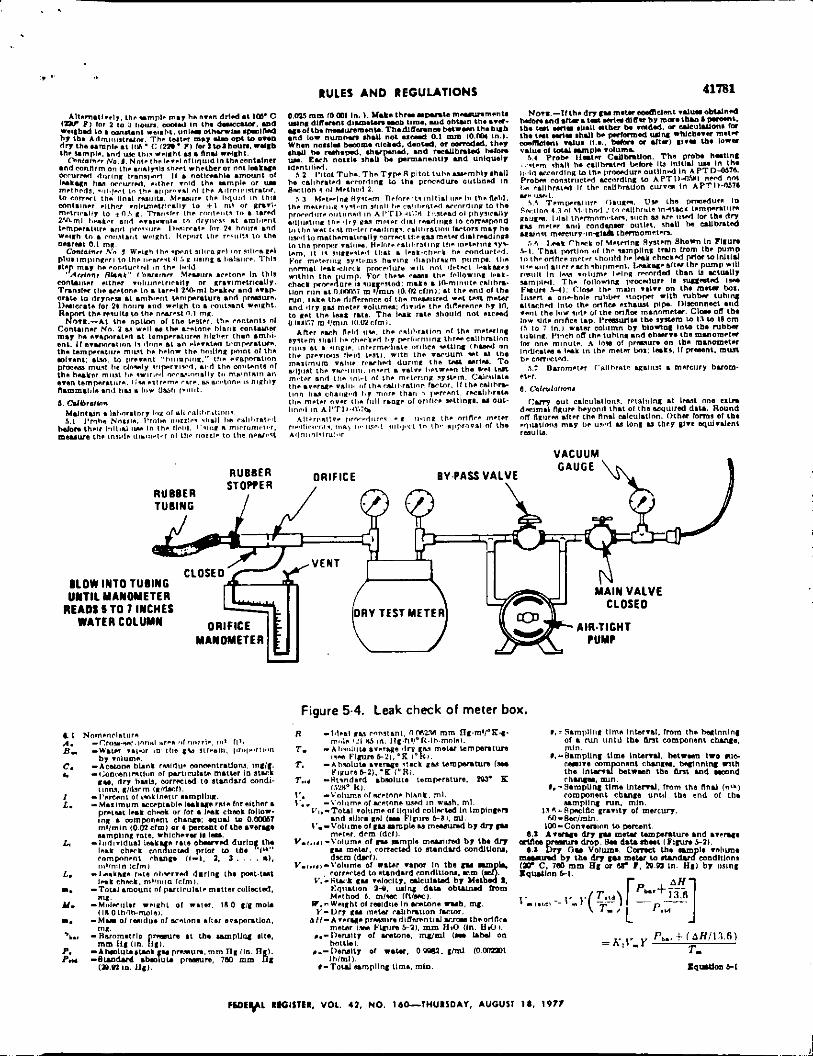
BLOW INTO TUBING UNTIL MANOMETER
READS S TO I INCHES WATER COLUMN
Figure 5.4. Leak check of meter box.
I L.
L. ..
w€rL I K i l l T E I . VOL. 41. NO. 1bD-TNUISOAV, AUGUST 18. 1977
RULES AND PEGUUTIONS Ulg
R D E U L tCOlSIH. VOL. 11. NO. I 6 L T H U I S O A V . AUGUST I n , 1977
c
I ,.'
i I
i
"
euired by standard, of .
F$Sy, stater are free under Section of the ACI to establish even more
e6 emission limits than those sy$l,shed rc under Section 111 or those yocssary to attain or maintalt the $.,Qs under Section 110. Accordingly.
*' s o m e s ma,: h oome cases be D&a 10 limitations more stringent
WA'I standards ofperformanw *" Section 111, and prospective
$tern and operalon of new IOU~G?.~ ov]d be aware of this possibility hl Zsaning for such facilities. .p mylation will be reviewed 4 an from the date of promulgation M I+ iired by the Clean Air Act. This
WiU include an assessment of si factors as che need for integration ,;bother programs. the existence of ,!,ematire methodo. enforceability. .*ppmvements in emission contml - u ~ n o l ~ g y . and reporting requirement#. ne reporting requirements in the
Istion ujil be revicwed as requimd rrF: Gder EPA'S sunset policy for rep0do.q ,puirements in r e & d i O N .
under Executive Order lueL EPA judge whether a regulation &.
%!ajar- and therefore subject to the ,.+rement o fa Regulatory Impact Lqalysis, n is rcgulation is not Major b a u s r (I) 'Ibe national annualized com:Iisnce costs. including capital c\oqes resuliing h u m rhe standard, @:a1 less than sloo million: (2) the s:nndardr do not cause a major lnwcese
prices or production costs; and I31 the strndards do not muse signifcant adverse ellects on domestic competition employmeol investmen!. p d u c t i dty. hovet ion or eom etition in foreign ma:Lets. 'Ibis ati ion WaS N b d t t e d to the Once ofManagement and Budget (OMB) for review as requirsd by . . EiecutiveOrderl228L ' . . :
kct ion s17 of the Qean Ab Act tequhs the Adrninislrator to prepam an . eccnomic impact assessment for any
new SOLVU standard ofperformanw prozulgeled under Section lll(b) of the Act. An rconomic impact assessmenl was prepared for the mmulgated
dttrnativea. All aspects ofths suessment wrre considered & the ffirmulation of the promulgated slrndards to Insure that the standard, nmld represent the best system of rzirsion reduction considering costa. 7ht economic impact assessmen1 is hc!uded in the bacLgnund Wormation dmmenL , ,
for new sources.
.
Icguletions and foro If er replatoy
of Subjects tn 40 CFR Part W Air pollution control. Aluqinum
kT.monium sulfate plants. a m e n t t b t r ) . . coal. copper. Electric power-
. .
47. No. 74 I Friday. April 16, 1982
. plants. Clans and glass'products. Grains. lntergovernmcntal relationo. Iron. Lead Metals. Motor vehicles. Nitric add plants. Paper and paper producta industry. Pe l rohm. Phosphate. Sewage disposal. Steel. Sulfuric acid p l a n k ~ ' a s t e treatment and disposal. Z i n ~
Dated: April 9.1082 Nok.-Thc rr IaUod does not involve
-mllcction of in P ~nnntion' as defied under the p~pnrork Redudon A d dlnw. 'Ihcrefom. the pmvlsions of the P a p w o r k Reduction A d applicable to conutions d Wonnation do not apply b this mgdatioa Ame M. Gonu& Admi~'~lrolor.
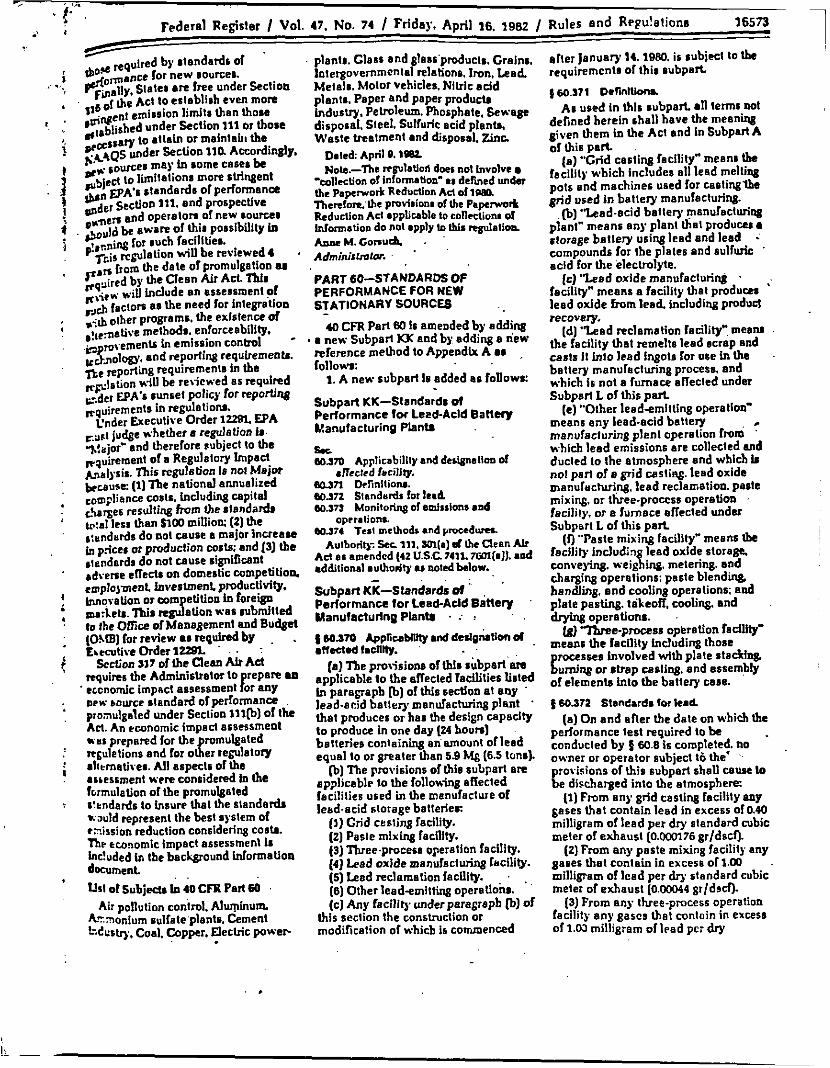
PART 60-STANDARDS OF PERFORMANCE FOR NEW STATIONARY SOURCES -
UI CFR Part 80 Is amended by adding . a new Subpart KK and by adding a new , reference method to Appendix A as
follomr:
Subparl KK-Standards of Performance for Lead-Acld Banmy Manufacturing Piantr
%e. 0370 Applicability and designallon d
anecled f&cillly. (ywn DcfintlioN. W O J ~ Siandards for Icab ao.373 Monitoring of amis~lons nod
a0374 t e s t mclhods andyroccdum Authorit): Ser 111. s01(.) d the Clean Air
Ad as amendcd 142 UB.C 741L7Un(s]). and additional aulhodv u noledbelow.
Sobparl Kii-Standards of ' Performance for Lead-Add Batlev '
HanufacturlnpPlsntl . : : 8 60370 Applicablttly and de.lg&tIa d atlw2t.d tacnw.
[a) The proRsionn of thls subpafl'sre applicable to the allected facilities l is ted In paragraph [b] of this sectton at any . lead-acid battery manufacturing plant '
chat produces or has the design capadty to produce in one day (24 hours1 batteries containing an'amount of lead equal to or greater than 5.9 hQ (6.5 tons).
[b) The provisions of thio subpart are applicable to the follon* afiected facilities used in the manufacture of 1ead.acid storage batteries:
(I) Grid crsting facility. (2) Paste mlxing facility. f3) Three-procesa operation facility. (4) L a d oxide manufacluing facility.
(e) Other leadsmitting operations. (c) Any facility under paragraph Ib) Of
this section the construction or modification of which is commenced
1. A new subpart Is added an follow%
oprratiom.
(5) Lead reclamationfacility. . .
Rules e n d Rrgu!alions 16573
after January 14.1980. is subject to the requiremcnts of thia subpart. # 60371 Dcnntthns
As used in this subparL d l terms 001 defined herein shall have the meaning oiven them in the Act and in Subpan A of this part.
(a) "Grid casting facility" meanl Lbe facility which includes all lend melting pots and machines used for caitinglbe &d used in battery manufacturing.
[b] "Lead-acid battery manufacturiq plant" means any plant that produces a itorage battery using lead and lead -'
compounds for the plates and sulfuric . acid for the eleclmlyte.
facility" means a facility that produces lead oxide from l e a d including product recovery.
(dl "Lead reclamation facility" meatu the facility that remelts lead scrap and casts it into lead ingots for ure in the battery manufacturing process. and which is not a fumaco affected undw Subpart L of this p a h
(e) "Other lead+mitting operation' means any lead-acid battery . manufacturing plent operation from '
which lead emissions are collected and ducted to the atmosphere and which I# noi par^ of a grid casting,. lead oxide manufnchuing. lead reclamation. paste mixing. or three-proccss operation facilily. or a furnace affected under Subpbrt L of this parL
facility including lead oxide storage. conveying. weighing. metering. and charging operations: paste blending. handling. and cooling operations: a d plate q tine. takeoff, coolins. and
IC) ' b a d oxide manufacturing ' ;
.
(r) "Paste mixing facility" means tbe
operitioru. IS) %e-prucess opkration fadity"
means the facility including those mcesses involved with plate stacH~k
Euming or r h p casting. and assembly of elements into (be battery case. 8 60372 StanZards for kad.
performance test required to be conducted by 8 60.8 is completed. no owner or operator subject tb the'
ro\isions of this subpart shall CBW IO !e dischaged into the atmosphere:
(I) From any grid casting facility any gases that contain lead in excess of 0.60 milligram of lead per dry standard cubic meter of exhaust [0.000176 gr/dscfl.
(2) From any paste mixing facilit) any gases that contain in excess 01 1.00 milligram of Iced per dry standard cubic meter of exhaust (0.00044 gr/dscf).
(3) From any three-process operation facility any gasca that contain in excess of 1.03 miliigram of lead per dry
(a) On and after the date on which &e
Y 6574 Federal Register / Vol. 47. No. 74 / Friday. April 16. 1982 / Rules and Rrpulations
#&ad cubic meter ofrahaust (0.mrCr wldrd). I
(4) Fmm mny lead oxide manufacturing facility any gases that contain in excess of 6.0 milligrams of lead per k i l rgam of lead feed (Om0 b/- Ion). . (5) Fmm any lead redamslion fa&W any gases that contain in excess of430 millirems of lead per dry standard cubic meter of exhaust (0.cOISe gr/dB4.
[E] From any otherleed-emitting '.
operation anyganes that contain In excess of 1.00 milligram per dry '
ttandard cubic mete? of exhaust [O.CCCM
(7) From any aflected facility o t b o lhan a lead reclamation facility any gases with greater than 0 p e r m 1 opacity (measured aceording IO hielhod 0 and rounded to the nearest wbok percentage).
(e] From any lead reclamation facility any gases witb greater tban 5 percent opacity (measumd according to Method g and rounded to the nearest.whole percentage)
[b) Wten two or more facilities at the same Iant (except the lead oxide manuPechlring facility] are ducted loa common control device. an equivalent standard for the total exhautl from tbe mmmonly controlled facilities shall k determined as foUowx
rpldscr).
. . _ .
a-1 -. . . Whem
exhaust stre- .. 4- Is the 8aU.I stsnded far eacb exbaVa
stream ducted lo he c o n d d 4 Q NPk the told number of e&Ut sln.101.
ducted to the wnlrd d n l a Q*= is the
rate of the effluent gar s b r m Imm each facili~y ducld to the cosbo1 devia.
&,=is the total h a:andard volumcbie
ducted la the control deviea.
s-1, ths qUlv .knt s1.nd.d h lhe Id
stsndnrd volumevic Pow
now rate o~ an emumi ma-
f w.sn Monlloc i fq d emissions ud opeI.tlonr
The nwner or operator of any l e a d a d d batter). maaufactwingfacilltp subject to the provisions of this subpar( and controUed by a scrubbing syalem[s) &all install, calibrate. maintain. and operate a monitoring deviceIs1 that . measures and recurdd (bo'pressun amss &e scrubbing systtemls) at least once every 15 minutes. Ibe monitoring device shaU have an accuracy of '6 percent over Its operating ranp. '
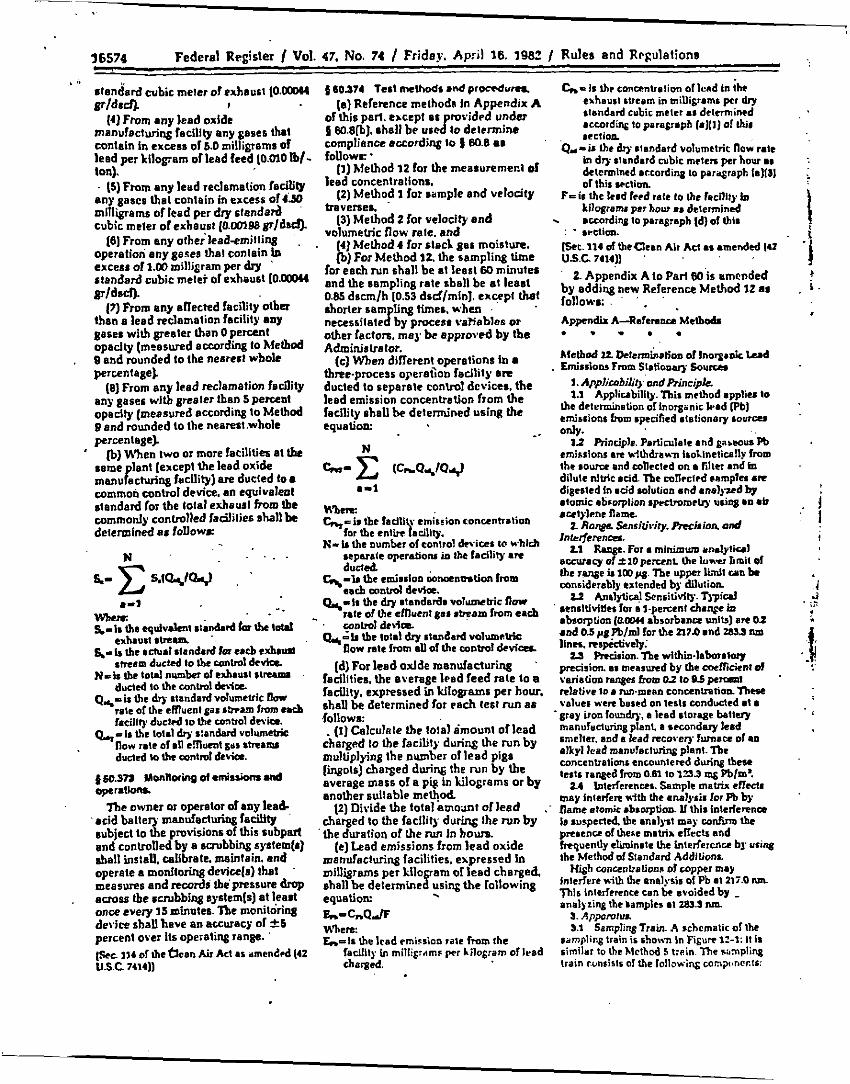
8 60.374 lest melhodr and procrdum [a) Reference melhodr In Appendix A
of this pan. except ac mvided under eo.e@]. shall be urdto determine
compliance accordins to 8 60.8 as f o u o w ~ : ~
(Y] Method 32 for the measuremen1 d lead concentrations.
(2) Method 1 for sample and velodty traverses. .
(3) Method 2 for velocifj and volumetric flow rate. and
(4) Method 4 for rtach gar moisture. [b) For Method 12 the sampling time
for each run shall be at leas1 60 minUte8 and the sampling rate sball be at least 0.85 dsun/h (0.53 dsd/min]. except that shorter sampling times. when necessitated by process ratiableo nr other factors. may be approved by !be Adminit (rator.
(c) When different operations in a threeprocess operation fadlity am ducted to separate c o n h l devices. the lead emission concenkalion from the fadlity shall be determined using the equation:
.
_. U
m-1
N-b the number of control devices to which separate operations in the ladlit). ate ducted
K-L (be emimsion wwtnnmtion rrom ea& mnlrd dcvia.
%-is the dry standards volumetric Pow rate of the emuent ens s*.m from each
&,Gb (be total dry standad volvmelrk " contmlder4s
Pow rate Irom dl of the wnbol devices Id] For l eadodde manufacturing '
facilities, the average lead feed rate to a facility. expressed in kilograms per hour. shall be determined for rach test run 81 .follow.: . (11 Calculate the total amount of lead
ch&& to the facilitr during the run by multiplying the number of lead pigs (ingots] charged d u r i q the run by the average mass of a pip in lilograms or by another suitable m e @ d
(2) Divide the total emomt of lead charged to the fadlit). during the run by the duration of Lhe run in houn.
(e) L a d emissions from lead oxide manufacturing facilities, expressed in milligrams per kilo am of lead c h a g e d shall be determine fusing the following equation: . Em-CmQJF Whh'heTC: L-ts the lcsd rrnirsion rate from the
facility in millig;.+mr per kilogram of lead charged.
&-is Ihr concentration ollund in tk eihaust stream in milligrams pcr dry standad cubic meter .I detennincd accord= to paragraph lallr) of chis ~. ~
acclion &-is the &y stmdard volumclrit Pow rate
in dm standard cubic mcten ~ l r how ms dele&ined according to par&ph In]fS] of this stction
kilogrnmr per how as determined according to parqraph Id] of this
F= it the Irad lerd rate to the lacnity Im
: . srctirm. .
1%~. 114 ofthcQean Air Act as amended 142 USC 7414)) .
2. Appendix A to Part W'is amended by adding new Reference Method 12 as followl: . ' ' . '
Appendix A-Rsfennrs Melbod.
AIetbod U. Detcrm~ahm nf Inorpnic L.d Lmission4 Tmm Stationu). S o u ~
I. Applcabilify 'ond Principle. 1.1
. . . . . Applicability. This method a p p l i to
the determination of lnogmiclrad Vbl cmir6ions from spedlird stationary sources
I 2 Rinciplr. Parlimlale nnd pasWu6'Pb erniasions o n michdraum Iiohlneticslly from the s o m and mncctrd on m filter and (n dilute nlwic acib Ibe mnrclrd rampln are digested In add solution m d analped by atomic ntirorption sprctromrlr)' using an ab autylme f l a w
Inlrrferenar
acnutcy of *IOperscnr the lunw t m i t 01 the rpnee ia im M. Ibe upper I W t ran be mnridcrsbly extended b j dilution U AnJytical knritivlty'. Typical
' srnrltivlnts lor n 1-percent c h a p in mbsorption ( a m absorbnoa unltr) a n 01 and 0.5 p a %/ml for the n7a mnd YUJ nm lines. m5piciively:
w R+dtion.ne withi.kbmntary p d s i o n . as measumd by the OaefTicient ob variation "npr from 02 to p6 perant mlative~oarun.memconcentrationThw valuer wen bsstd on tests conducted at a
.gray iron fo~dry. s lead storage battery msnufactwirg plant. n secondary lend smelter. and s lead =covey I ~ D W 01 an alkyl lcsd manulacluring plant. n e wncenlntimnr encountered during lbcu le616 ranged from 0.61 to 125.3 q ?/m?
2 4 lnterfcermces. Ssmple malm enccu may interfern with the analysis lor Pb b name atomic absorption. U this inledererue 1s suspected the nnalyrt may c o h the pnaence of those matrir ellecb and IrequenUy eliminate the interference bj using the Method of blandnrd Addltionr
High wncenlraliom of wpper may interfere with thc analysis oi Pb nt ni.0 m. This interference can be .voided by
onb.
2 R O W . SnSilh'ily. h k ; M Ond
I1 -e. For a mi&w m d y l i o l
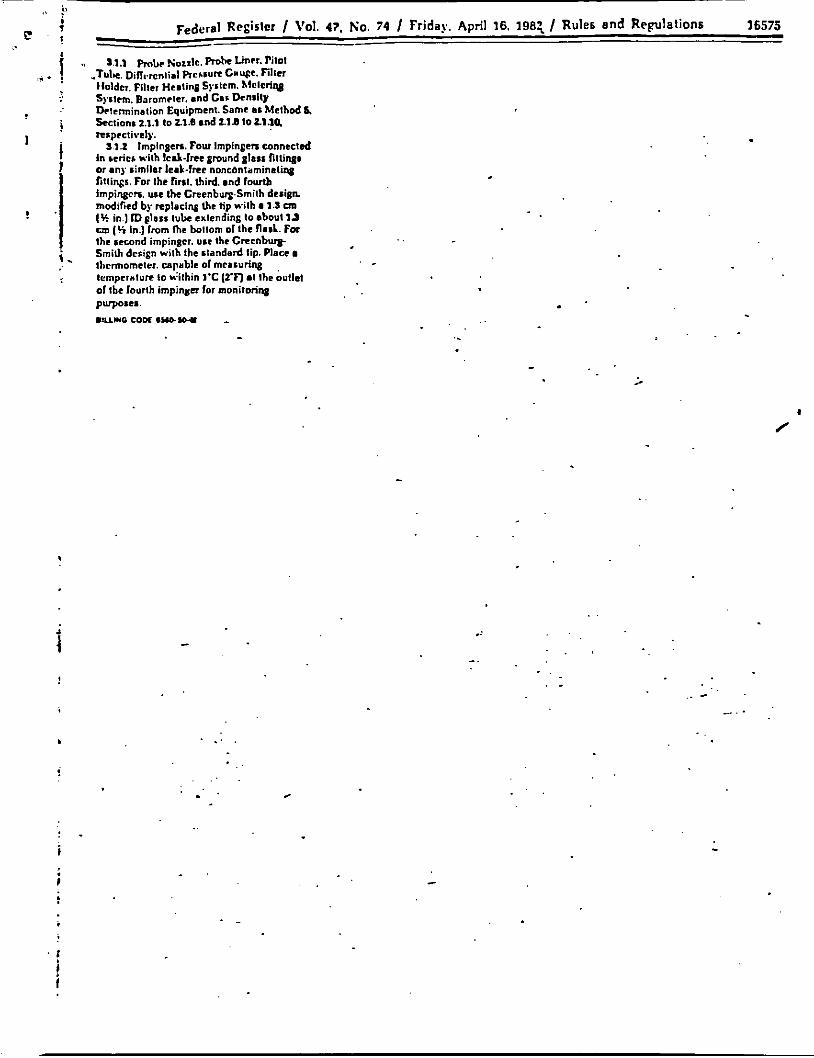
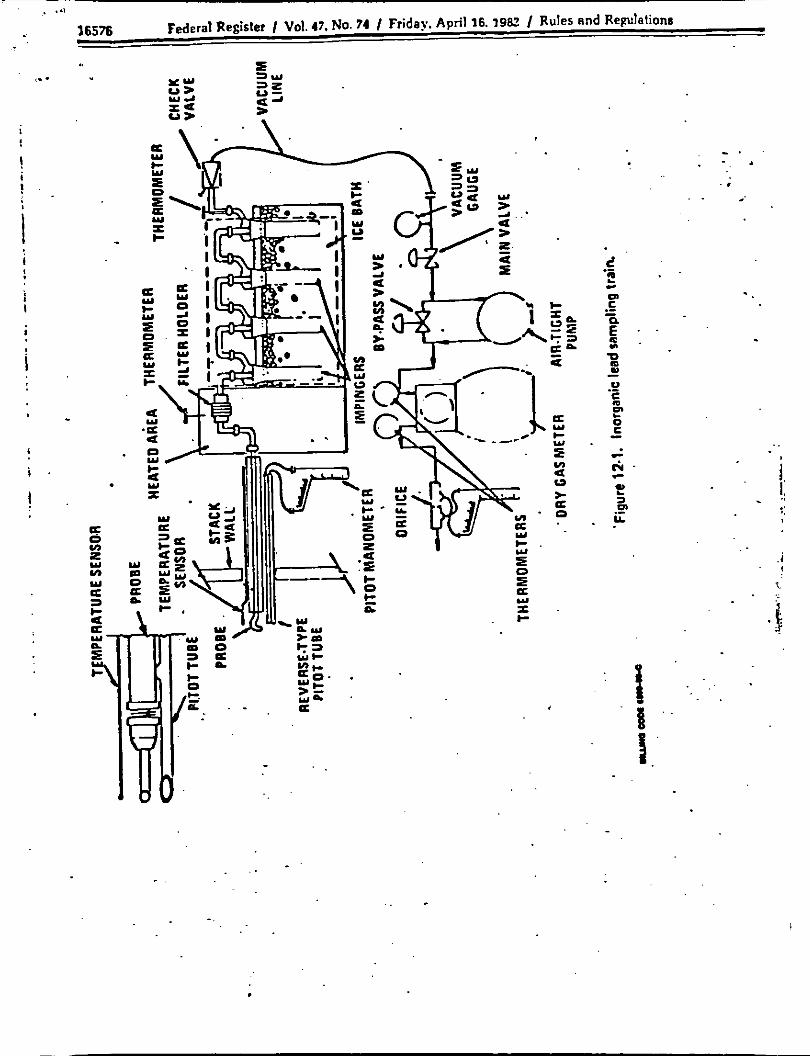
f 1 ' H;rnpIq Tram A schematic of the smq4mg train I ) shown in Figure 12-1. It is similar lo the Mrthod 5 t x m The ruapl.ng train rmtiilr 01 the lollanans con?+nrrls
t -1 4
i.
' I
! .I t .
f
respectively.
In rcrier. with IcJ.lrec ground 81ass fittings or any similar Ie&free noncontaminatitq fillings. For the finl. third. and fourth impingcn. we the Greenburp-Smith design, modified by replacing the tip wilh a 1.1 cm 1% in.) ID elarr lube exlending lo about 13 cm 1% in.) lrom (he bottom of the l l d . For the second impinger. use the Greenbug- Smilh dcrign wilh the standard lip. Place a Ilicnnomclrr. capable of mclruring temprrrture lo d h i n 1'C [rn at Ihr oullst of !be fourth impinlla for monito"tq pVp0.ts.
s 12 Implngen. Four lmpingen connected
.(U*10 corn ssM.IQI - -
..
. ..
. . i
i
' I i i
.
.. - __ . .
. . .1 16576 Federal Regisler / Vol. 47. No. 74 / Friday. April 16. 1982 / Rules Rnd Repletions
2
!
! ! I
I i
i I
I
i
6
i
!
. . . - .
.i
.;: . .
. . -.
,. .' ,
t
!
t krsprooe loleal.gs) . - S a 4 Graduated Cylinder andfor Balanh.
To meiswe condemned walw Io Vllhio 2 d or I 8. UH a p n b a t c d cylinder that h u minimum upoty of 5a) r d and aubditirionr no pester than SA. Not I b b o m U q balances am capable of re&- h ~ t h e n c a r e i t R S g o r k ~ . ) .. . . .
S- F u n d Clash lo aid in umpb r e m v y . u MpL. n e roUo&g equipment L
Ilerded. SS.1 A t d d c Absorptim ~
Specbopbolomelcr. With lead hollow o thode lamp mad burnu for dr / ace lyku
._
. .
4 u W d n g L a d Standnrds. Pi I on la. LO. S.o.4.a and 5.0 ml or the aloci%sd standud solution 14.4.41 Lnto 254d rolvmelric nasks. Add S ml of soncentratad HNO, IO esFb Oaik and dilule to volume witb deionized dlstllled w . 1 ~ . l h e s e workiq s l roduds conlatn 00. 4.0.0 0.lZO.lLO. and ID0 )rg pb/Id. d \ C ! Y hCpUC. needed additionafkdsrbs at otha mncentrslloni In a s M a r manner.
abmrptim mdysll. 4.4.0 &. Sl;ltable qidlty lor a t o d e
4.4.7 Awlylene. Suilnble guaUly far alomic absorption mnalysk
4 4.8 Hydrogen PemLide. 1 perram Dilute IO ml ol 30 percent H.0. to 100 ml with dciodrrddntil lrd new. .,
6. P m d u m 6.1 Sampljng. 'Ibe complexltx of &b
mctbod is such thaL in order lo obtain klicble rqulIs. trslen should be trained and e rp r i ens rd uilh the lesr pmccdurrr
6.1.1 R c l c s t hrparat ion. Follow the sa- gosera1 p r o c r d w given in M e U d % Sctim 4.1.1. e i u p l the fillu need not be welgbed LIJ Rcl lmina~ Delerslinatiosr. Follow
tbr same p e d procedum given in Method bscctioo4.lz
Follow the sumo general p m c e d m $veri in Metbod 6. Secuon 4.13. except place imml ofa,KNO.ineachof(brlirctlwo . . L m p ~ n . leavo tbc Ib M l m p b u empty. and transfer appmxlmmtcly 2113 IO Sm g d m*rl&+d sflio pl born Ita sonlainn to tk fourth Lmpiqpar. Set up UU train as show br Fqum l2-l.
6.3.4 LeakEhed: Rocedms.~Follou thr pntral Ieakd~eck p r o o c d w s b v e o io Mcthod b Sections 4.1.4.1. (Rctcsl Leak. . ~ ~ 1 . 4 . l A 2 & . e & ~ e ~ s D w i n g L h e Sample Run1 and 4.1.w Ipost-Trsl Led.
s . u Repin t ion o f ~ o n e a i o n ' ~ h k
QlcJ;). 6.15 Samplirq Train Operation. Follow
the u m c =nerd p r o d a r c given in Metbod S Srctlun 4.13. For each nm mod (be data
/ Rules snd Rrguulelionn 16577
II cooliw down as this would matr VaNum in the fillor holder. thus dnminp liquid lrom the implnpcra Into the Wm.
Before mo- the sampling b i n to tk . cleanup dte. mmm- the pmbe from the sapling trdn wipe off the sniwne gmase. and u p the open outlet of the p m k . Be o m f d no1 tolmr any mndens.!c that mlght bo present. Wipe off the stliwnc lp~ame from ch. gIass*v~m Idel where the pmbe was fastened and cap the Wrt. Remove the umblliul cord horn the lac1 implngcr and u p the impinga. me tester mar use gmund.glasa stoppers, plasfic Sap% Or l e N m ceps I o done thew oprninpt.
Transfer the pmbt and filter-lmpinger , . mssrmbly l o a cleanup area. which Is clean ~
and protected fmm Ihc r i n d so that tb. chances of contamlnaling or losing Q umple are mlnimired, .
hpect Ibe traln prlor to and d d q . , disassembly and nok any abnormal mndilio~u. Tmal (be sampler as followr:
621 Conloimrh'a I pller& C.mfuUy remove the !idler Imm the filter holder and place it in Ita Idenlllied pelrl disb wnlnincr. II It Is necessary lo fold the filler. do so rucb tbal lhe rample~sposcd side 18 inside tbe fold. b r e l d r Iranskr io the pefn' dish MY visible sample matter and/or !idler fiben that adhere to the B l t u bolde: garhel by luiq a dr). tiylon bristle brush and/or a sharp+dged blade. Srd the container.
62.2 Conloiner Ala 2 probe). Taking o m that dust on the outride of the pmbe or o t h a erlerior surfaces dnrs not gel inlo tbe umple. quantitatir.ely RCOVU sample maltu OT any condensate lmm tbe probe n o d e probe fittiinf pmbe lincr. and fmnt hall of the filter bolder bx washing these componenll mi& a1 N HNO. bnd ,lac- tbc wush inlo glass sarnplr storam wnliiner. Measure and m o r d (to the neanst 2.d) the lola1 amout 010.1 N M O , used lo: ea& riole. Perform the a1 ti HNO'rinrcs si follow Carem remove thc pmbe o o d r and
rinse the inside surfaces wi th 0.1 ti H?JO* fmm a wash bot* while brus stainless SI& Nylon-brirULb2mi% until the a1 N I+" rinse shows no visible . partidm then make a . T d rirue olthc h i d e '
*Brush knd &e nitb b N "a &e inside perb of the Swagclol fitting h a similar way until no vislble purlides mmah
Rinse the p m h t i e r witb 0.1 N "0; While ro1sIin.g the pmbe so thai a 1 imide surfaces will h rinsed witb 0.1 NHNO. tilt the probe and squirt a1 N HNO. into i l l uppu end. Let the 0.1 ti HVO. drain t o m tho lower end Into pc samiple wntainer. 'Ibs tester may use a glass h e l to aid h t ranslemq liquld washes to the cmlaimr. Follor the rinre m i l b a pmbe brush. Hold uI+ pmbc in an inclinrd position, rquirlo.1 N HNO, into the upper m d ol the pmbe as (be pmbe brush is being pushed r i l h a histiq adion through h e p m k , bold the sample container undemeetb the lower end of Ih. p m k and catch any 0.1 N "0, and sample matler that is brushrd fmm the probe. R u the brush through Ihr pmbe three times m . more until no visible r a i p l e mnt!er h urricd out milt, the 0.1 N HNO. and none remi:inr 011 the proht liner on visual inspection, With
.
.
~
& O S
'
- /
47. No. 74 / Friday. April 16. 19E /
.
Rules and Repulelions
ba th add 1s ml of 50prrunl m0, and 1rc.t ss drsczibrd in Srdion S.3.3 using IO ml Of S percent H.O. and 50 ml of hor deionized distilled w.ter. Dilute to told volume O f l m ml us@ deionized distilled w@tP.
5 1 Analysis. 6.4.1 kmd Dcterminstim C.lihrste OK
specuophotometer ss demibcd in Section B.2 and drtermlnc the a b s o r b n u lor esrh so- sample. the filter blank. snd 0.1 N "0. blsnh.'Anal)xe each umple three times in this manner. Make sppmprisle dilutions. ss required to bring mnccntrstiona Into the linear sbaorbance rasge 01 the spectmpholomlcn. u the ~b concentration or s sample 1s i t ~hc low end of the calibration m e snd hioh accuracy i a required the .ample can be taken IO dynes, on a hot plate and the resldue diarolved in the appropriate volume of wale? to bring it into the oprimum nnge of the . . olibrstion cwve.
6.42 Mandatory C h d for Matria EffeN on the L a d Rcmults. n e analysia lor W by atomic absorption b scndtive Io the chcmiul comporiion m d to the physical p m p f i i n (viscosity. PW) of the s a m p I e ( m a ~ ~ f f ~ ~ t f l . Since the Pb p r a c d v n d c s & e d here will k applied to many dillertnt s-. many sample matricea will &encountered. Thus. check [mandatory) st least one sample lmm each so- using the Method of Additions IO aaccr~ain that the chemical wmposiiion and physical properties of the sample did Dol cause emneoys analytical mulu.
'Rvcr scccptable "Mrthod of Additions" p-dures arc dermibrd in the General Rocedurc Seclion,of Ibe Pcrhin Elmn Corporation Manual (we Cilatim 9.11. U e results of the Me$od of A d d i l i a pt+%srdum on thc s o m e sample do not y m wilhln 6 p c m n t of the value obtained by the conventional atomic absolption analyair. then the tester must r e a n a l ~ ~ c m I I s i m p l n from thr source using the MeLhod of '
Addiiions pioccdw. fhdoiner& 3 (si!iu GI). n l h r
tester may conduct this Oep in the field. '
Webb the spent a n i o g d lor silica Sel plvl
sample Pb
6.43
hpingrr) to be I,~.IUI as m r d Ibis W j & L
aCofibmlion . . . Maintain a laboraloy log of 9
4ibr.tionr 61 Sampling Train C.libra(ion. Wibra l e
the impling bain components according 10 the indicated sections of Method 5: Robe N o d e [Section 6.1): At01 Tube lSeclion 51): Metering System (Section 5J): Robe Heat- (Section 5.41: Temperatun GSWs [section 65): Irak.Che& of the Mrterlw System (Scclion 5.8); and Bammrler [Srction 6.7).
02 Spectmpholomclu. Measure the absortmu of the standard solutions using the ifislrammt settings recommended by the spctmphotomeier m a n d a c t w . Repeal until good agreemen l (~5 pcfMI1 LI obtained betseen hso wr.srcutivc readings. Plot the absorbance (y-aual VM~D
concentration In pg Pb/d ( i -n~js]. Draw 01 wmpvtc s straight line Uvough the linear portion of the w e . Do not force the olibrstion curve h o q h tern. but if the cyrye doer not psis lhmqh the oripin or m I leaat lie closer to the oripin than i 0 . W
.
.
I
.
a h o t b n p un~ls. for in cod^ "Prepamd r l anda rb and for NtduRIn lbe ulibration m a . To delemine stability of the UlfiraliOa
m e , IWI bl& and a a t a n d d .her e\'- 6ve stnplc. and nulibrate. as n n e u u y .
1.1 ~y cas Volume. U s l q the data tram . Ihis icsk ulculate V.w the Iota1 rolume ol dry gas metered comcled to atandud .:, condilioru 1m.C and 7W mm H8). b using Equation 6-1 of Method 6. Uneceslyr. adjust VmU, lw lestyes ss ouUined in Section 03 dMethod 5. See the field data shm la &e average & gas meter temperature and , average o r i h preriurr drop ' .
7; Volume of Water Vapor and Moinhm ContenL Us- data obtained in thlr test a d Quation* S 2 and SJ of Method 5. CAICUIDIC he o l water vaporV.4 mnd the m + m content B., of the s l n d car * IJ Total L a d in Source Sample. F a e.&
source sample correa the average abrorbano lor the conlriiutian dthe f i l l s . blank and the 0.1 N "4 blank. Use the calibration c w e and thh curutcd absorbance lo determine the @ Pb ConCentrstion in the sample aspirated Into 9
the speclropholomelcr. Calculate Ih told Pb content C, (in pg) in the oriaind some sample: comcl f o r d the dilutions h a t were msde lo bring the Pb conccntrationof lk sample into the linear r q e of Lk spectmphotomeler.
1. C O ~ C U h f h W .
glass-lined prubc and at leas1 two Impinpen. each conlairing IW ml of 0.1 N "0.. aIlU the in.sla& filter and (21 he R W F C ~ and an.l,zes the probe and impinper conlcnts la fb. uccarer .mrnp!c from the nozzle with aoctone If a pmrticulate mnalysis i s to be made.
hkthods for A l m i c Absorption Spectmpholomelry. Norwalk. ConneclicuL September 1976
Mate~als , h v a l Book of ASTM Standard.. Pan n: Water. Atmospheric Ann.lpia.
PI Kkin. R. and C Hscb. Standard
,
aBib1; mfiy 91 d i n a m c r a r p o r s t i o n A O ~ I ~ Y ~ I
92 American Society lor Tesiing and
-Philadelphia. Pa. 1874. p. 404L - e . Addilionr-Uses and Umilalions In
Spclropholornetric h d p i k . Amer. Lob 0,1-P.l*77. . II4 Milcbell W.J. and M.R. Midgcn
Dclennining lnoganic mnd Alkyl L a d Emissions from Stalionay Sources. US. Envimmcncal Rotection Agency. Emission %!onitom and Support laboratory. Rcuarrb Triangli Park. t4.C presented at Nallonal Apc4 A l e c l i . Houston. lune 26.1978).
03 Same as Method 5. Citations 2 lo 6 and 7 of Seclion 1.
. .
\
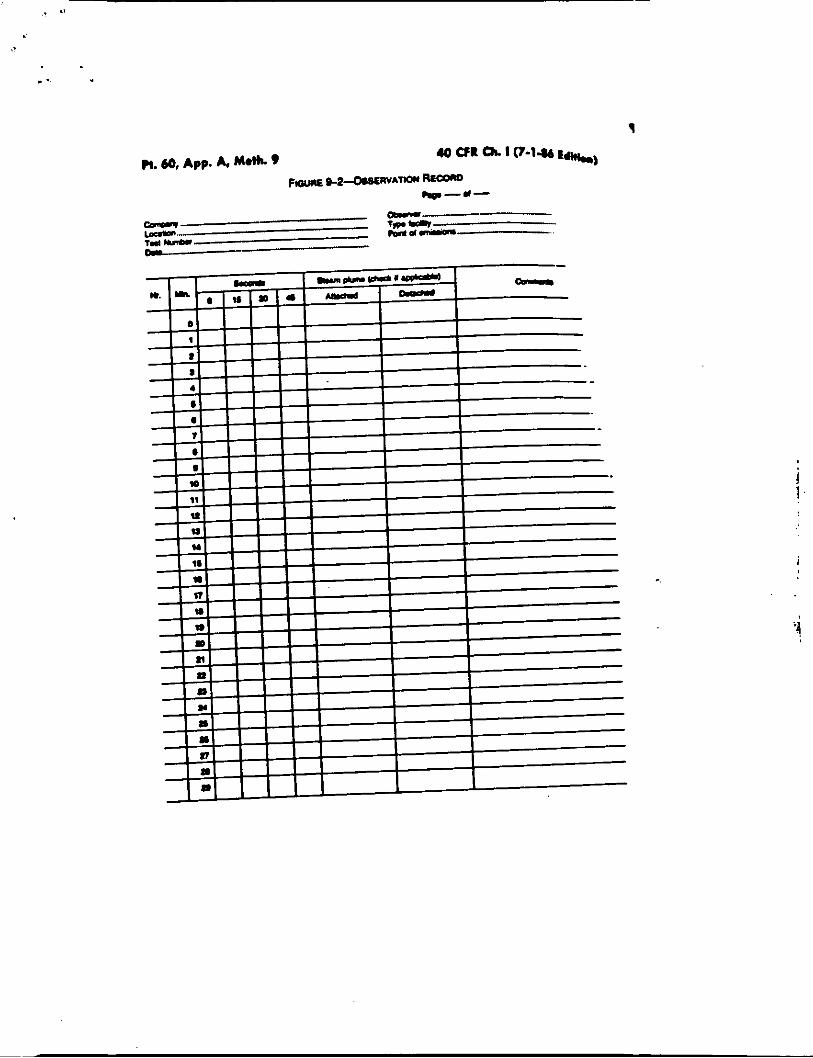
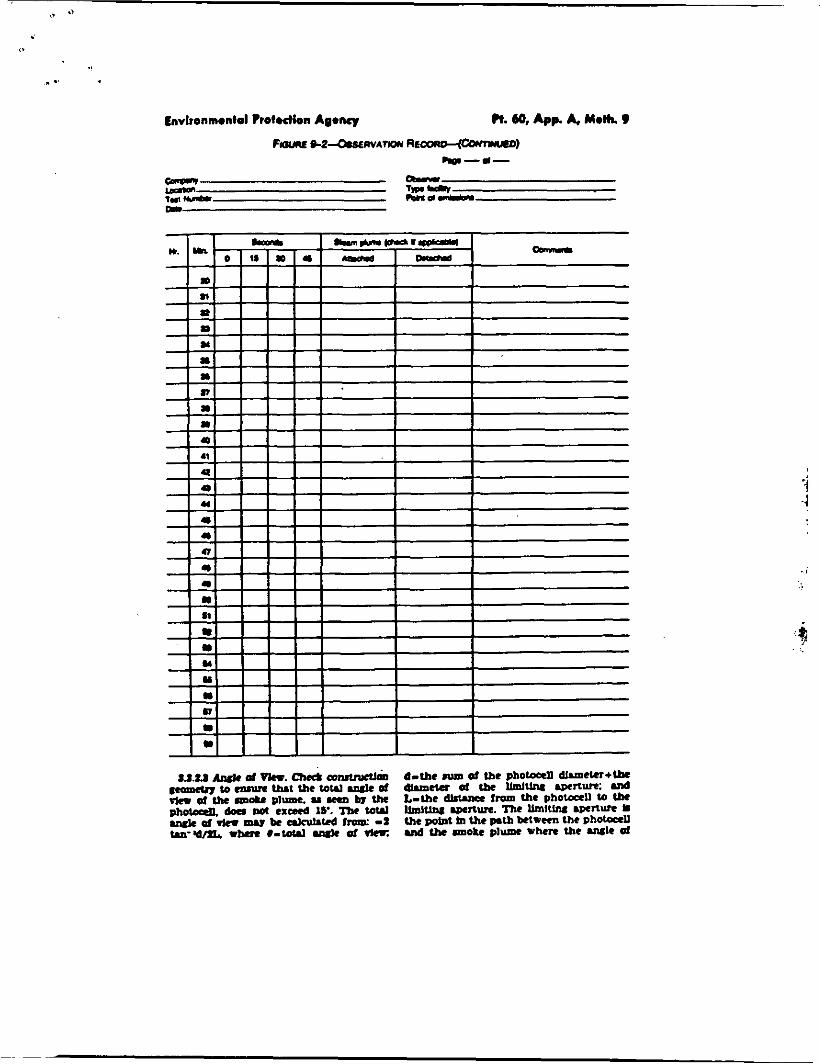
I3ETHOO 9--VISUAL DETERMINATION OF THE OPACITY OF EMISSIONS FROM STATIONARY SOURCES
i
I
I tnvlronmonld Pro9oc)ion Agenry
I
h. bo, App. A, M A 9 40 CFR h I (7.166 Edition)
€7
I z
1 9
. a
. .'
7
Is1 I I I Irl I I I In1 I I I I
I
i
q
W
n P
n Y
I I n I
I I I I am 1 1 1 1 I
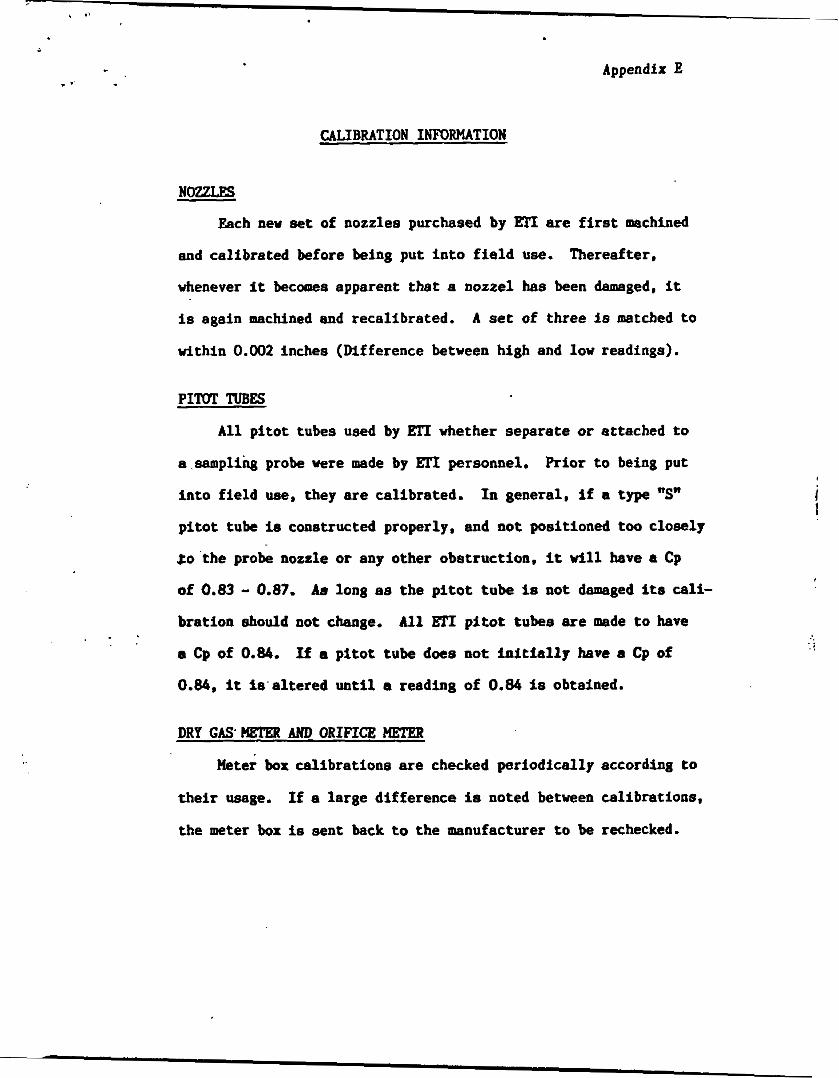
. .. Appendix E
CALIBRATION INFORMATION
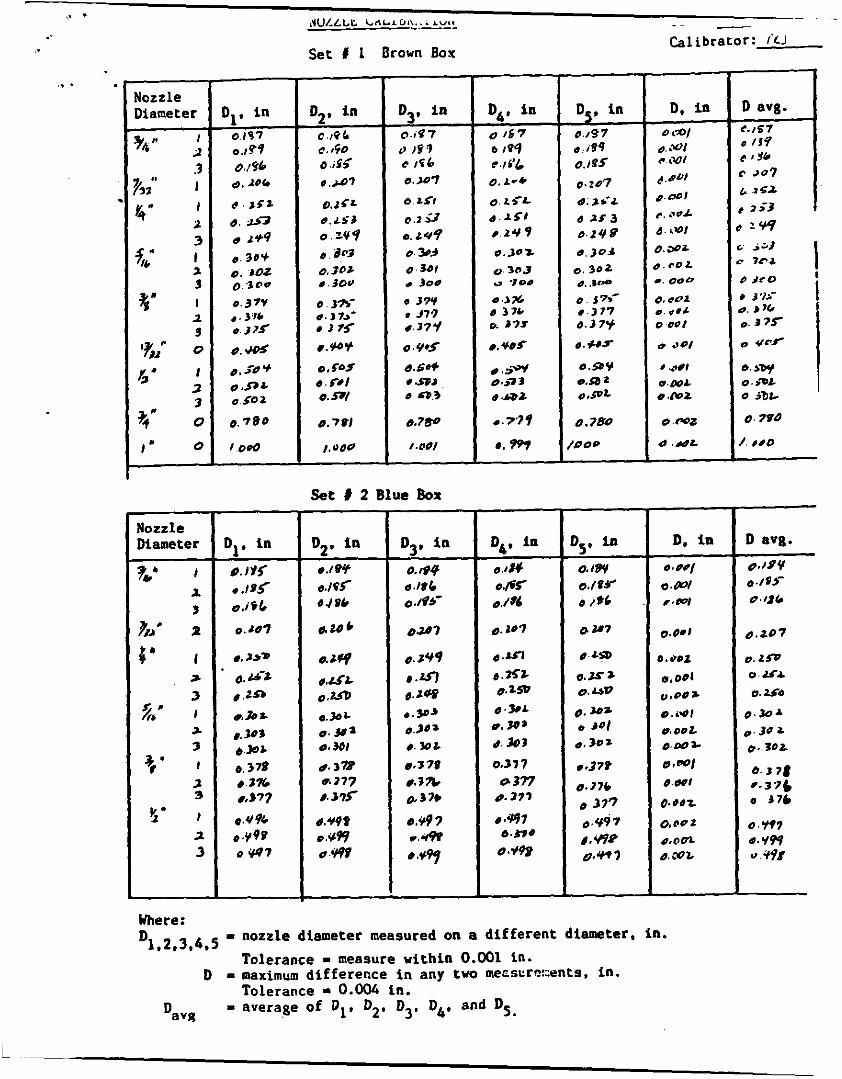
NOZUeS
Each new Bet of nozzles purchased by ETI are first machined
and ca l ib ra t ed before being put i n t o f i e l d use.
whenever it becomes apparent t h a t a aozzel has been damaged, it
Thereaf ter ,
is again machined and r eca l ib ra t ed .
within 0.002 inches (Mfference between high and low readings).
A set of t h r e e is matched to
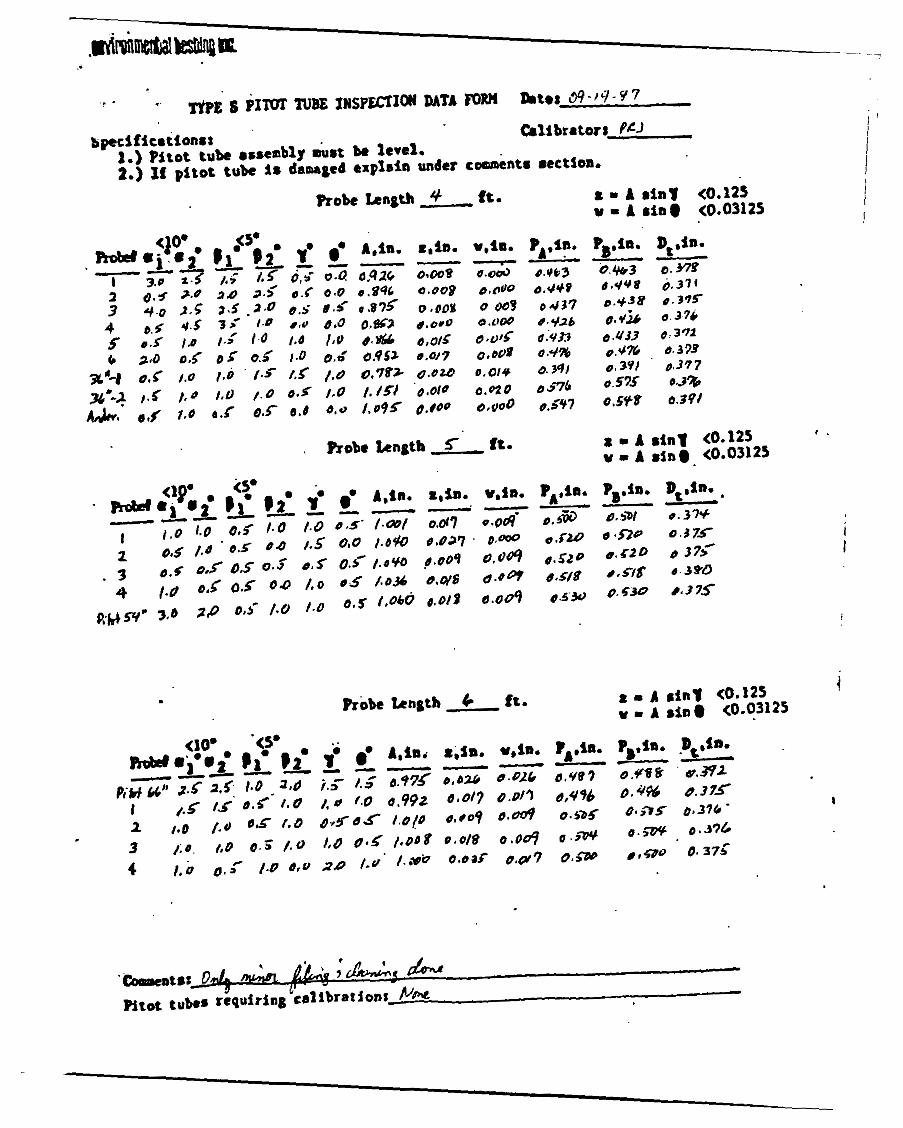
PITOT mEs
A l l p i t o t tubes used by ElT whether separate or at tached t o
Prior t o being put a sampling probe were made by El'I personnel.
into f i e l d use, they are ca l ib ra t ed .
pitot tube is constructed properly, and n o t posi t ioned too c loee ly
$0 t h e probe nozzle or any o the r obs t ruc t ion . it wil l have a Cp
of 0.83 - 0.87. A8 long as t h e p i to t tube is not damaged i t a cali-
b ra t ion should not change. A l l ETI p i t o t t ubes are made t o have
a Cp of 0.84.
0.84, it i a a l t e r e d u n t i l a reading of 0.84 is obtained.
I n genera l , i f a type "S"
. . If a p i t o t t u b e does n o t i n i t i a l l y have a Cp of
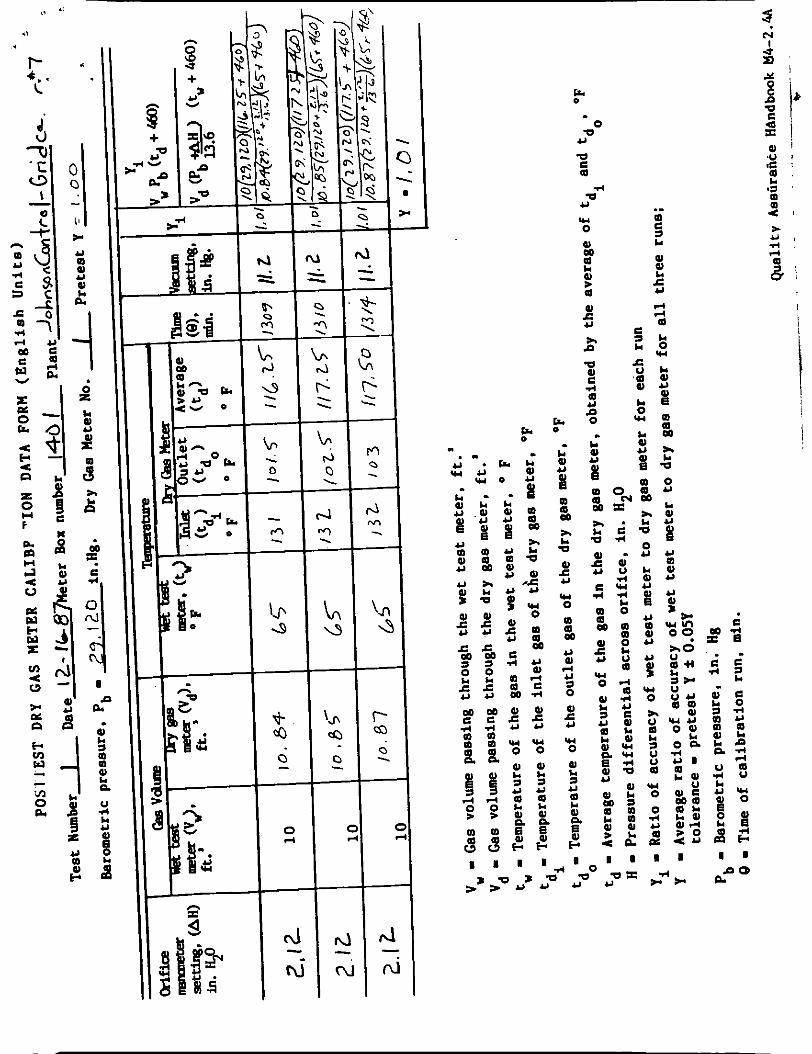
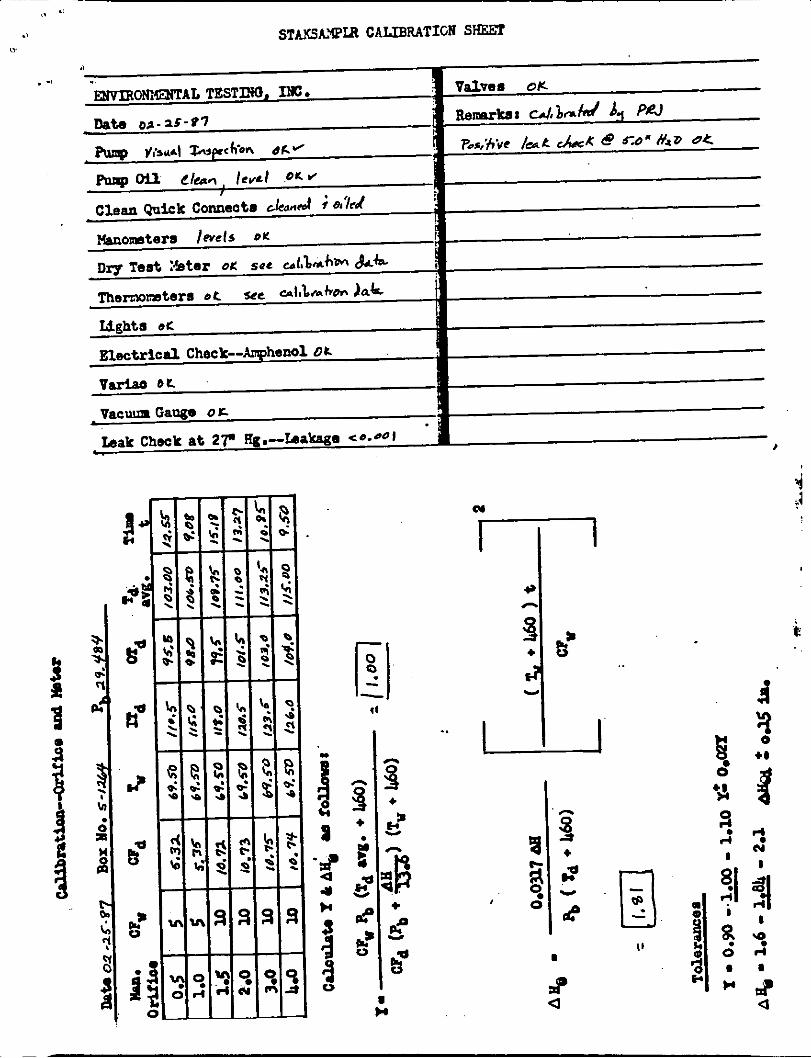
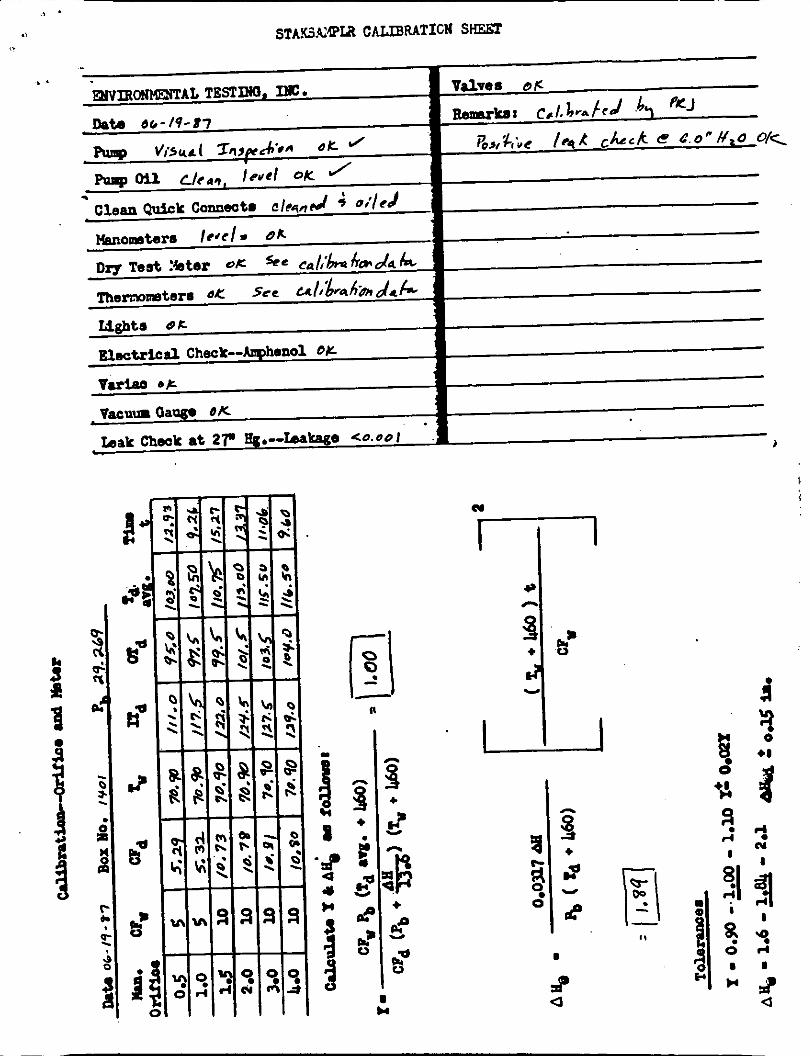
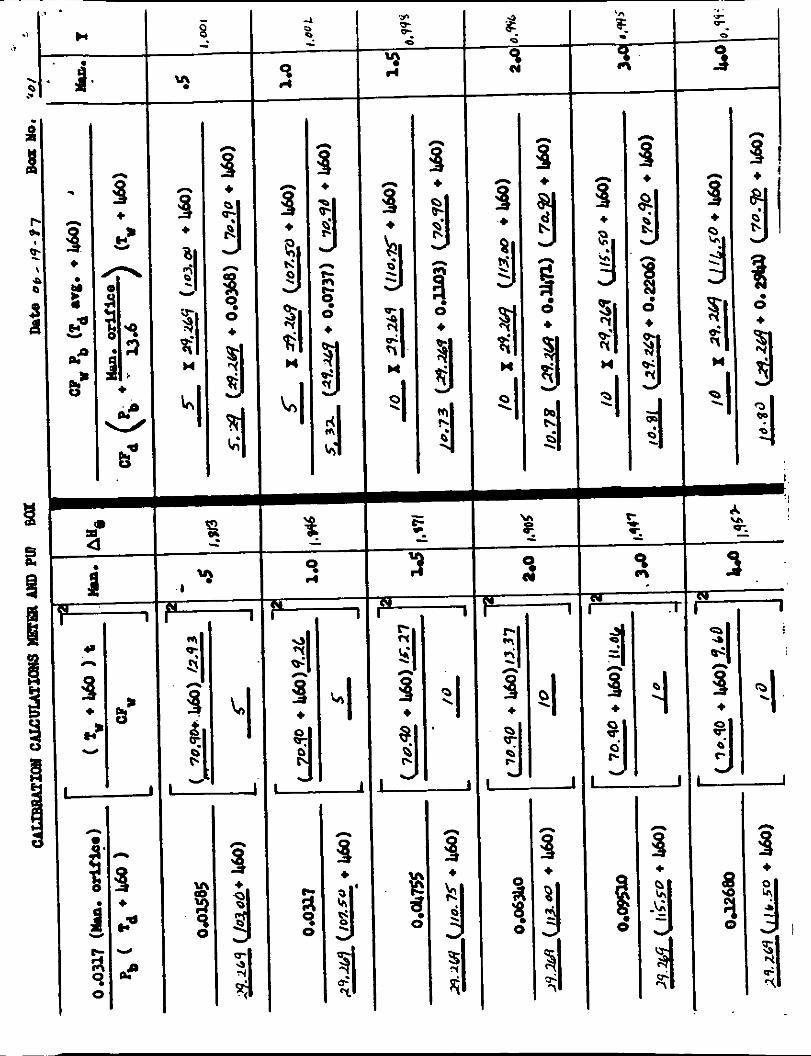
DRY GAS' UEl'ER t&D ORIFICE HETER
Heter box c a l i b r a t i o n s are checked p e r i o d i c a l l y according t o
If a l a r g e d i f f e r e n c e is noted between ca l ibra t ions . t h e i r usage.
t h e meter box is s e n t back to t h e manufacturer t o be rechecked.
'MERpKlNETERS. FYRITFS. ORSAT, ORSAT BAGS
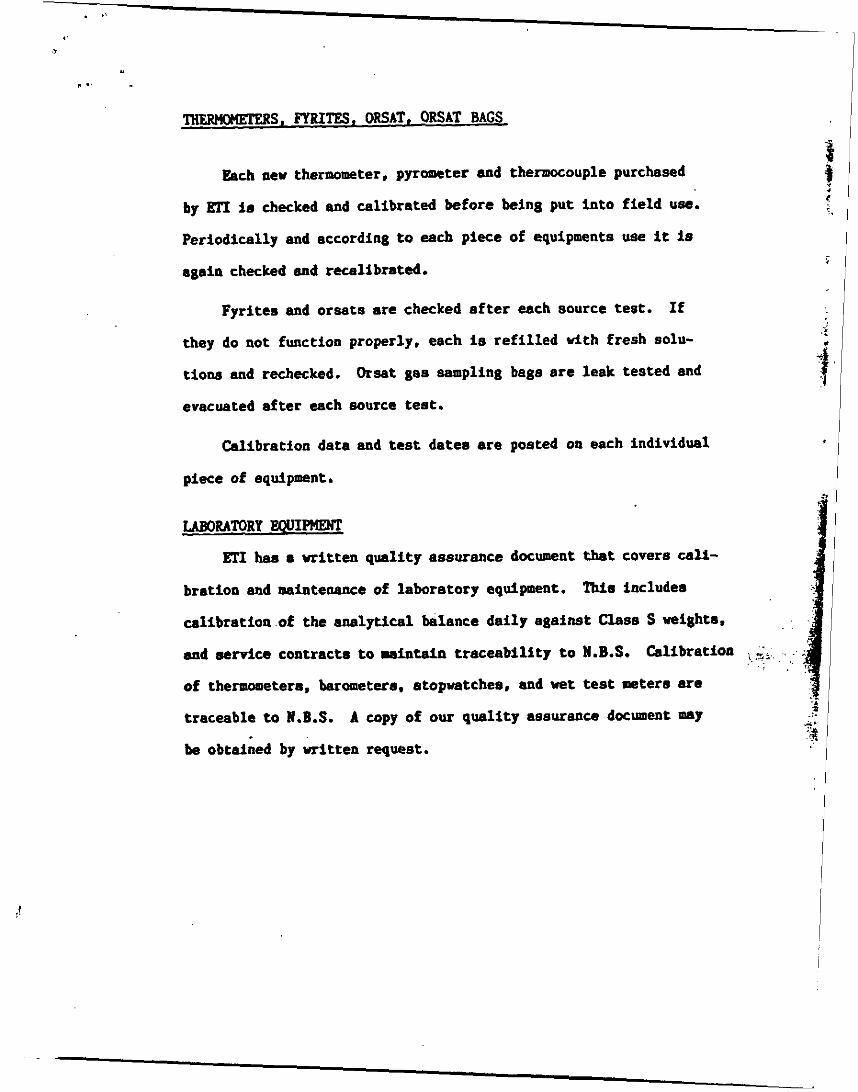
Each new thermometer, pyrometer and thermocouple purchased
by ETI is checked and calibrated before bein8 put i n t o f i e l d use.
Periodically and according to each piece of equipments use it is
again checked and recalibratcd.
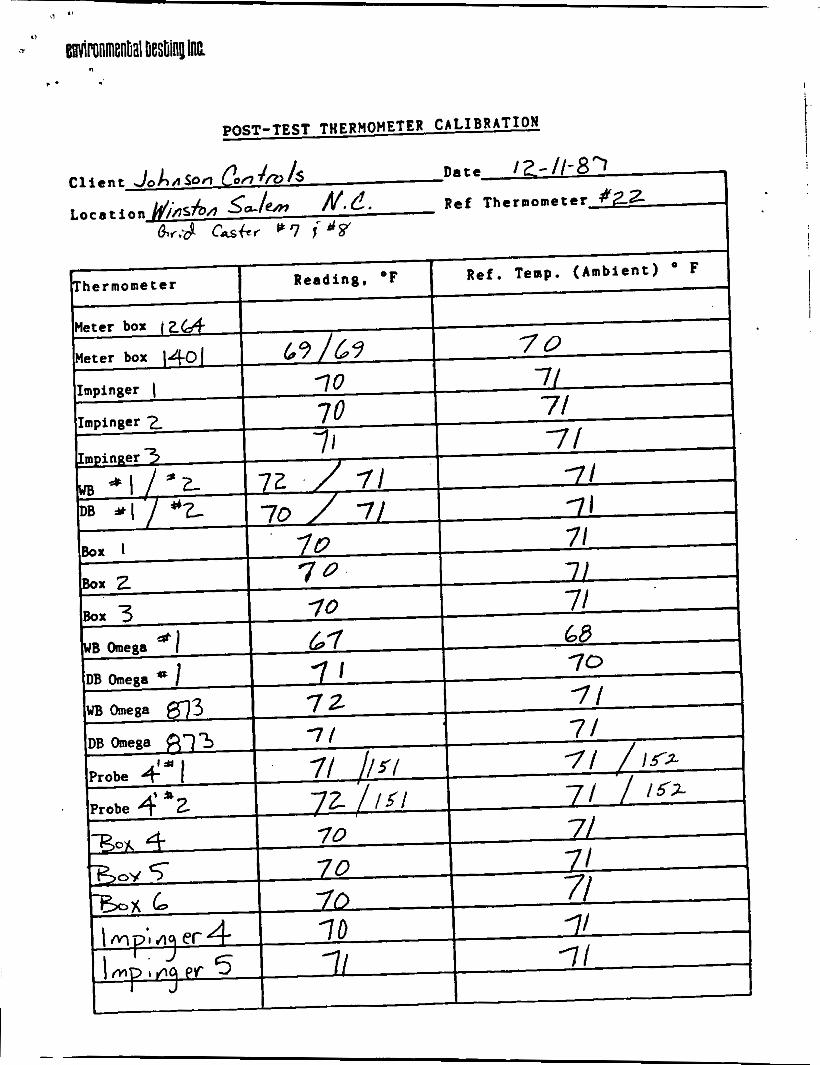
Fyr l tes and orsa ts are checked after each source test.
they do not function properly, each is r e f i l l e d v i th fresh solu-
t ions and rechecked.
If
Orsat gas sampling bags arc l e& tested and
..
f , evacuated after each source test. I
Calibration data and test da tes are posted on each individual
piece of equipment.
LABORATORY WIUI PPiwT
ETI haa n written qual i ty assurance document that covers cali-
brntion and maintenance of laboratory equipment.
cal ibrat ion of the ana ly t ica l balance da i ly against Uses S wights .
and eervice cmtractn t o mintala t r aceab i l i t y t o N.B.S. Calibration \,G2
of thermometers, barometers. stopwatches, and wet test meters are
traceable to N.B.S.
be obtaiied by writ ten request.
Tbis includes
A copy of our qual i ty assurance document
. .)
Sec t ion No. 3 . 4
Date January 15, 1980 - Revision f :o. 0
.. ?age 9 o f i5
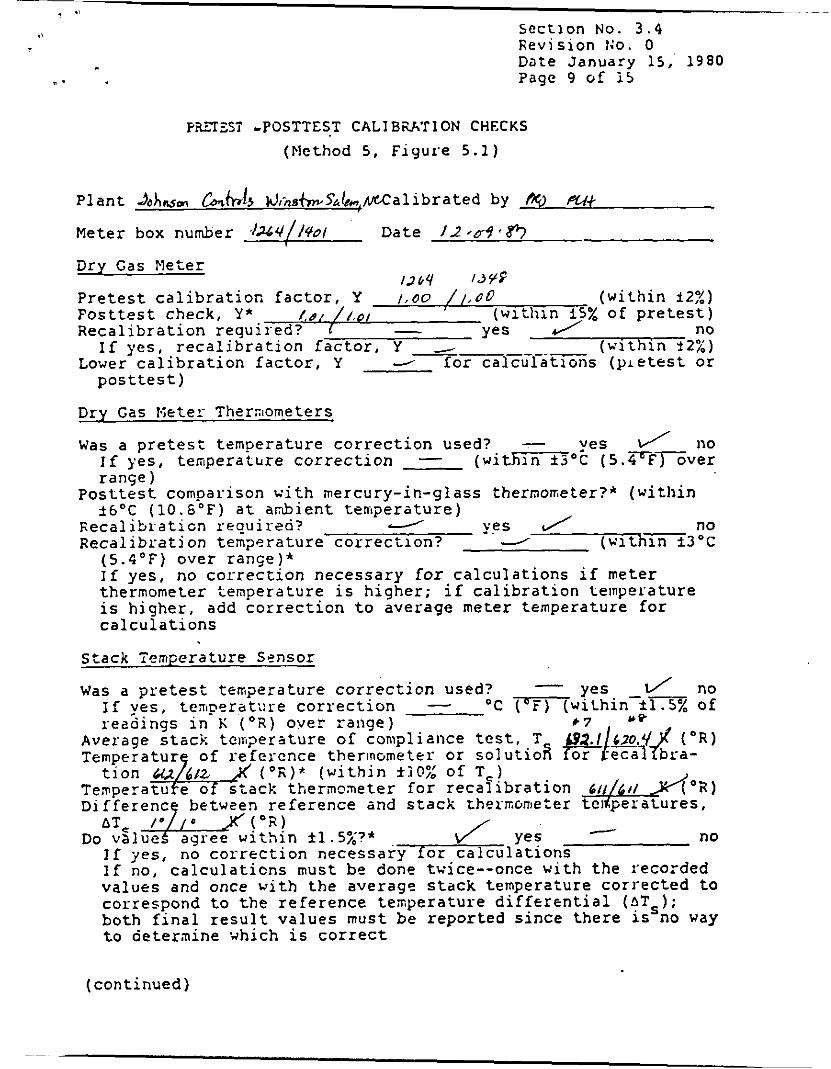
PiCXSSS -POSTTEST CALIB-&hkTION CHECKS
(Method 5 , F i g u r e 5 . 1 )
P l a n t Johnsrn &h& kJIhs&S&,/CCalibrated by &
Meter box number 'h&[/40l Date 12 ,ofl*8'?
D r y C a s Meter i t b y IJ,Yf
P r e t e s t c a l i b r a t i o n f a c t o r , Y I , O O / / . a 0 ( w i t h i n i2:i) ( w i t h i n is% of p r e t e s t )
I no ( w i t h i n t27:)
Fost tes t check , Y* 481 / L o / R e c a l i b r a t i o n r e q u i r e d ? Yes
Lower c a l i b r a t i o n f a c t o r , Y J i o r c a l c u l a t i o n s ( p e t e s t or
a+
- - / I f yes, r e c a l i b r a t i o n f a c t o r , Y ----_. - p o s t t e s t )
Dry Gas I.;eter Thernometers
Was a p r e t e s t t empera tu re c o r r e c t i o n u s e d ? - y e s / 110 If yes , t empera tu re correction - ( w i t h i n ' C ( 5 . F F F v e r r a n q e )
i b D C (10.6'F) at ambient t e m p e r a t u r e )
( 5 . 4 " F ) over r a n q e ) * I f y e s , no c o r r e c t i o n n e c e s s a r y f o r c a l c u l a t i o n s i f meter thermometer t empera tu re i s h i g h e r ; i f c a l i b r a t i o n t empera tu re i s h i g h e r , add c o r r e c t i o n t o a v e r a g e meter tempera ture f o r c a l c u l a t i o n s
P o s t t s s t comparison w i t h mercury- in-g lass thermometer?* ( w i t h i n
E e c a l i b r a t i c n required? / y e s J no R e c a l i b r a t j o n t empera tu re c o r r e c t i o n ? / ( W i t h i n 3 OC
Stack Temperature Sensor
yes 1/ no Was a p r e t e s t t empera tu re c o r r e c t i o n used? 1 f y e s , temperat;:re c o r r e c t i o n - 'C ( O F ) ( w i t h i n il.5% of
Average s t a c k t c m > e r i t u r e o r compliance t e s t , T ~ . / [ t2o ,y f ( O R )
Temperatur of r e f e r e n c e therinometer o r so lu t io? i f o r - e c a j b ra -
$/6d d ' 8 ) Tenpera tu e o s t a c k thermometer f o r r e c a l i b r a t i o n 6 i
no ~f yes , no c o r r e c t i o n n e c e s s a r y f o r c a l c u l a t i o n s I f no, c a l c u l a t i o n s must be done tu i ce - -once wi th t h e recorded v a l u e s and once wi th t h e ave rage s t a c k tempera ture c o r r e c t e d t o co r re spond t o t h e r e f e r e n c e t e m p e r a t u r e d i f f e r e n t i a l (ATS); bo th f i n a l r e s u l t v a l u e s m u s t be r e p o r t e d s i n c e t h e r e i s no way t o de t e rmine which is c o r r e c t
- UP r e a d i n g s i n K ( O R ) o v e r r a n g e ) e 7
t i o n U.2 bLz ( O R ) * ( w i t h i n i i @ X of T,)
+
P and s t a c k thexmometer t c l p e r a t u r e s ,
J yes
( c o n t i n u e d )
. u a c c d a i i u a r j ~ a , L Z D U
Page 10 o f 15 .
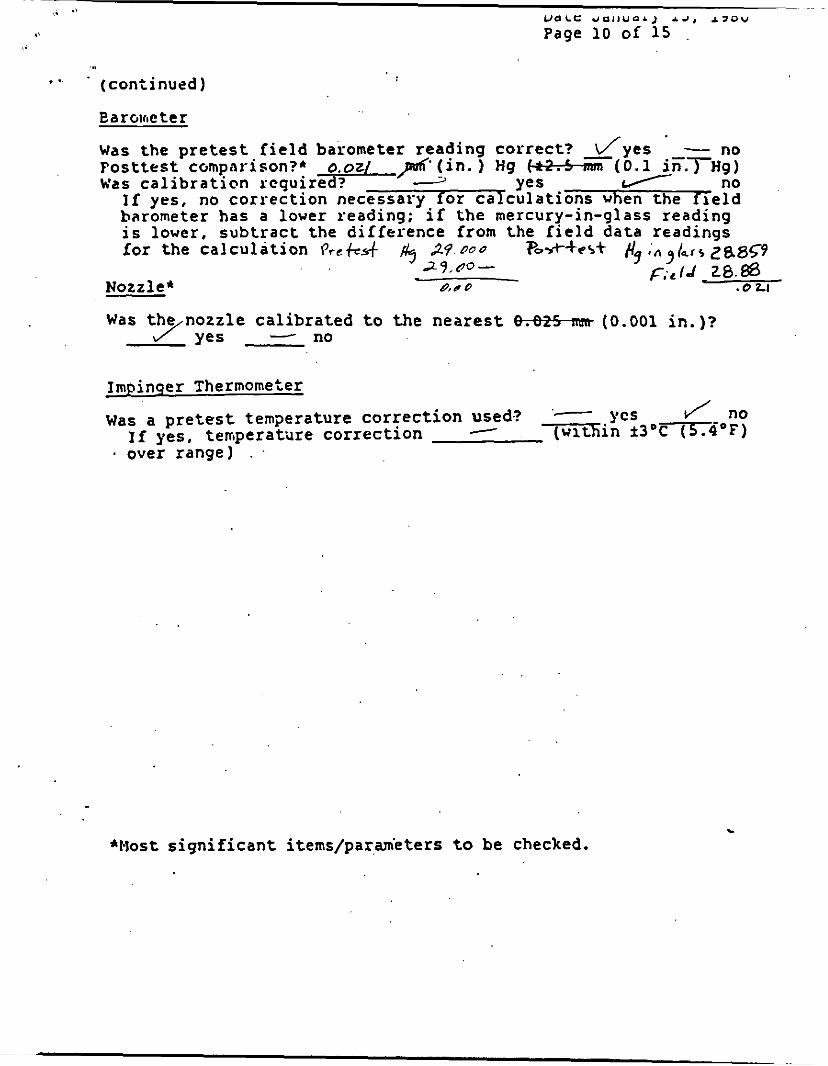
.. . ( c o n t i n u e d )
Ea rcire t e r
Was t h e p r e t e s t f i e l d barometer r e a d i n g correct? - d y e s ' - no p o s t t e s t comparison?* o,ozi pu6 ( i n . 1 ng (0.1 i i i . T H g ) wss c a l i b r a t i o n r e q u i r e d ? J Yes / no
I f y e s , no c o r r e c t i o n n e c e s s a r y for c a l c u l a t i o n s when t h e f ie ld barometer h a s a lower r e a d i n g ; i f t h e mercury-in-glass r e a d i n g i s lower, s u b t r a c t t h e d i f f e r e n c e from t h e f i e ld d a t a r e a d i n g s for t h e c a l c u l a t i o n & 2 9 o o a & # f i q/ars ZasS9
Nozzle*
Was t h e n o z z l e c a l i b r a t e d t o t h e n e a r e s t fkW5-m (0.001 i n . ) ? no /' y e s -
Impinger Thermometer , ycs J no '-
I f yes, t empera tu re c o r r e c t i o n / -in i3'-4'F) Was a p r e t e s t t empera tu re correction used?
1 over r a n g e ) - . .
. fl-lost s i g n i f i c a n t i t ems /pa rm 'e t e r s to be checked.
. I . 0 -- 8
*
r* 0 .
0 0
Y
0 e m
d 0
Y
w 0 al
* al >
0) c Y
x
0 9) C 4
Y
m m
m
e
m 4
L O
. * 0 Y
8 % 0
R I 4 0
0 c Y
w 0
m m m Y 0 4 Y a 0 0) c Y
W 0
0 * Y 6 * al
a
E 8
L 0
0 0
U
0 c m d
0 .- U
0 W m
I Y , 0
0 c Q z
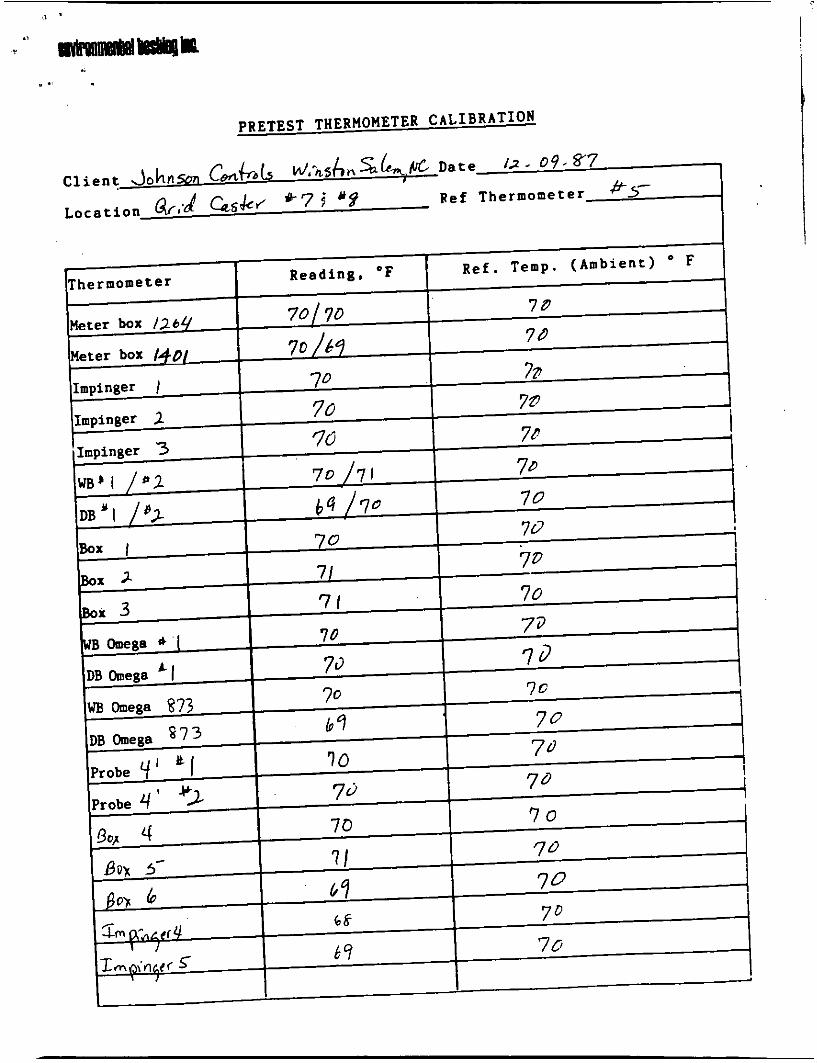
PRETEST THERMOMETER CALIBRATION
I
,-
POST-TEST THERMOMETER CALIBRATION
. -'
3 B p!

r -
E 6
Y
0 0 9 ---e- (Y
3 +
3 "I fl 0'
M
.
0 0 a -
3
- 0 3 -
3 .
fl
I
4
3
3
+ g
g 4
? 0 +
5 +
bpccificmtionrr 1.) Pjtot tube assembly &rt ba level.
.
Nozzle Diane ter
I 3 3 I I 1 3 I a J I 1. I 0
I 3 3 0
0
3 3'' I
a 3
'I' I
a 4
4 - I
1 3
I D2. i n 1 . . i f f
I
I
I here: D1,2,3,4.5
=nozz le diameter measured on a di f fe ren t diameter, in. Tolerance - measure within 0.001 i n .
I maximum difference in any two merscrnr:ents. i n . Tolerance - 0.004 I n .
= average of D1, D2, D3, D4, and Dg
D
'ava
./
. DATE: 12-10-85
CERTIFICATE OF CALIBRATION
- CUSTOMER: ENVIRONMENTAL TESTING INCCustomer Purchase Order: 2861PO .
1 7 0 0 UNIV COPMERICAL PL OMEGA Work Order NO: SO 51126876.0
’ CHARLOTTE N C 28213 MODEL: “-2
SERIAL NO: 14403
OMEGA ENGINEERING c e r t i f i e s t h a t ‘ t h e above ins t rumenta t ion has been c a l i b r a t e d end tes ted t o meet o r exceed t h e pub l ished spec i f i ca- t ions. This c a l i b r a t i o n and t e s t i n g was performed us ing ins t rumenta t ion and standards t h a t e r e t raceab le t o t h e U.S. Nat iona l Bureau o f Standards.
Reference: NATIONAL BUREAU OF STANDARDS TEST NO(s): 3 6 3 2 0 . I 1
, Ins t rumenta t ion . #
CAL-3
. . -
.# . L 1
I hop. this w i l l satisfy your inquiry. pl- contact us at your c o n v d e n a .
I f y. can tm o f any further sud-.
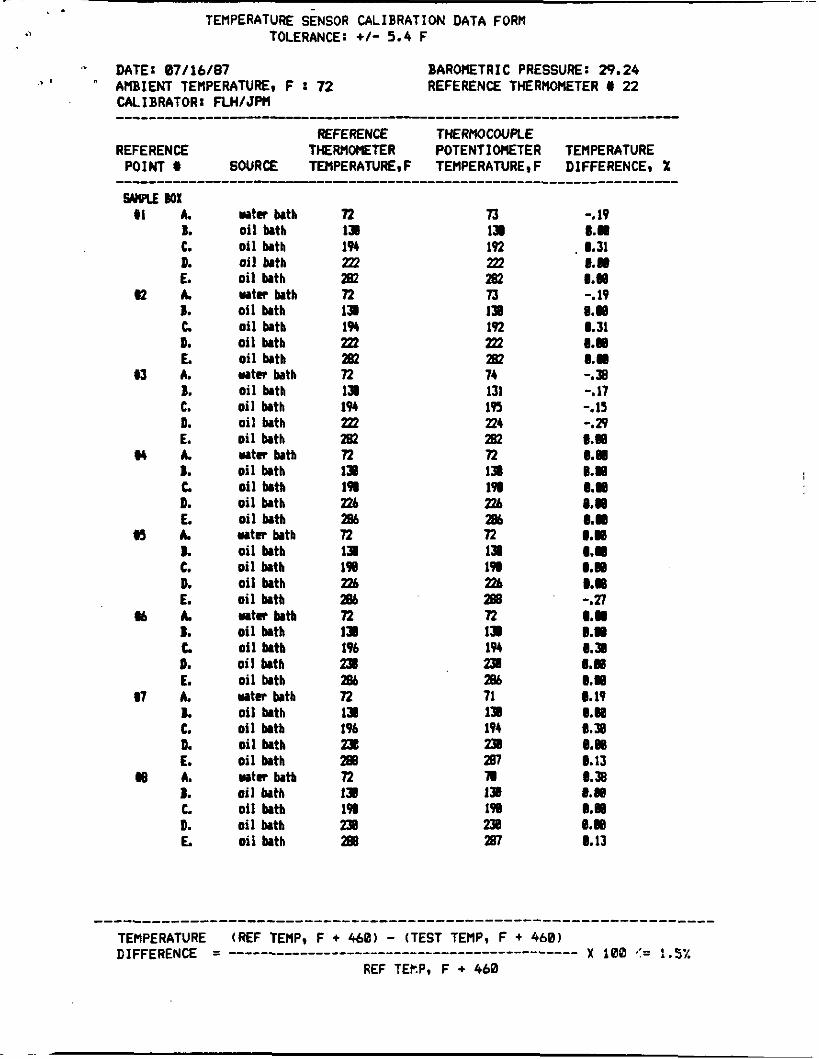
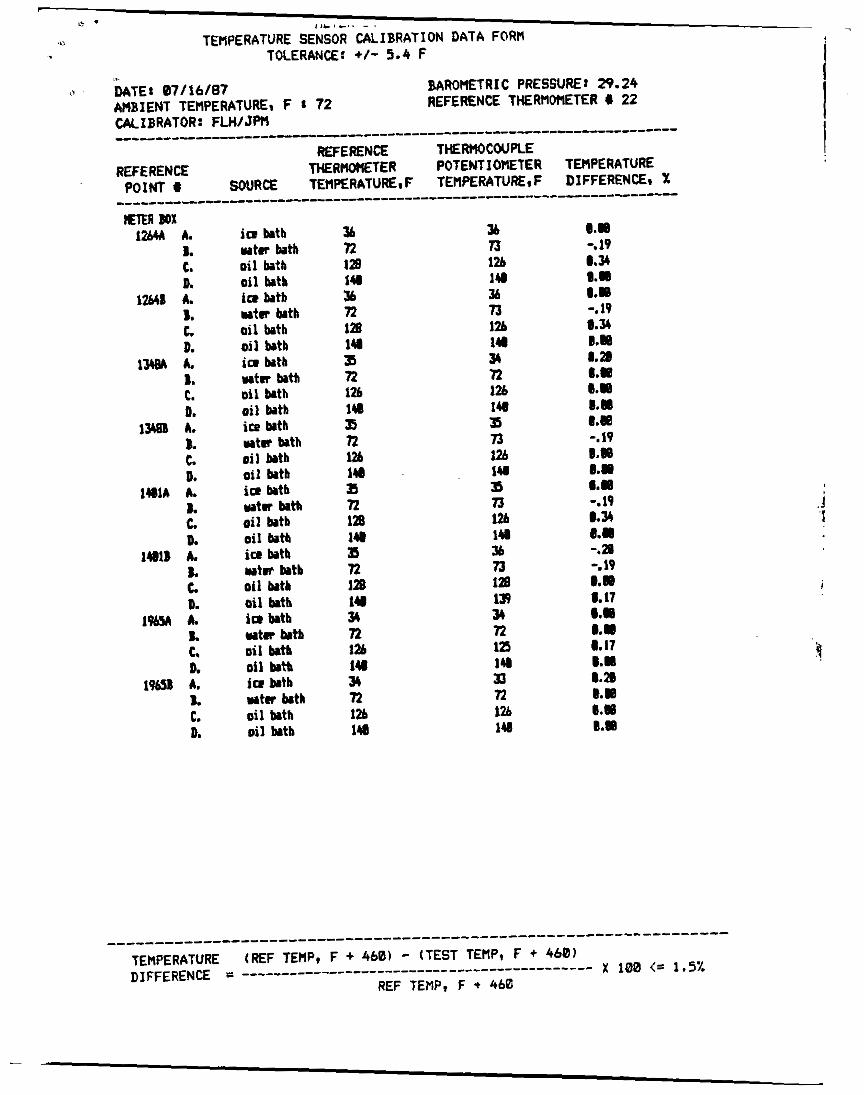
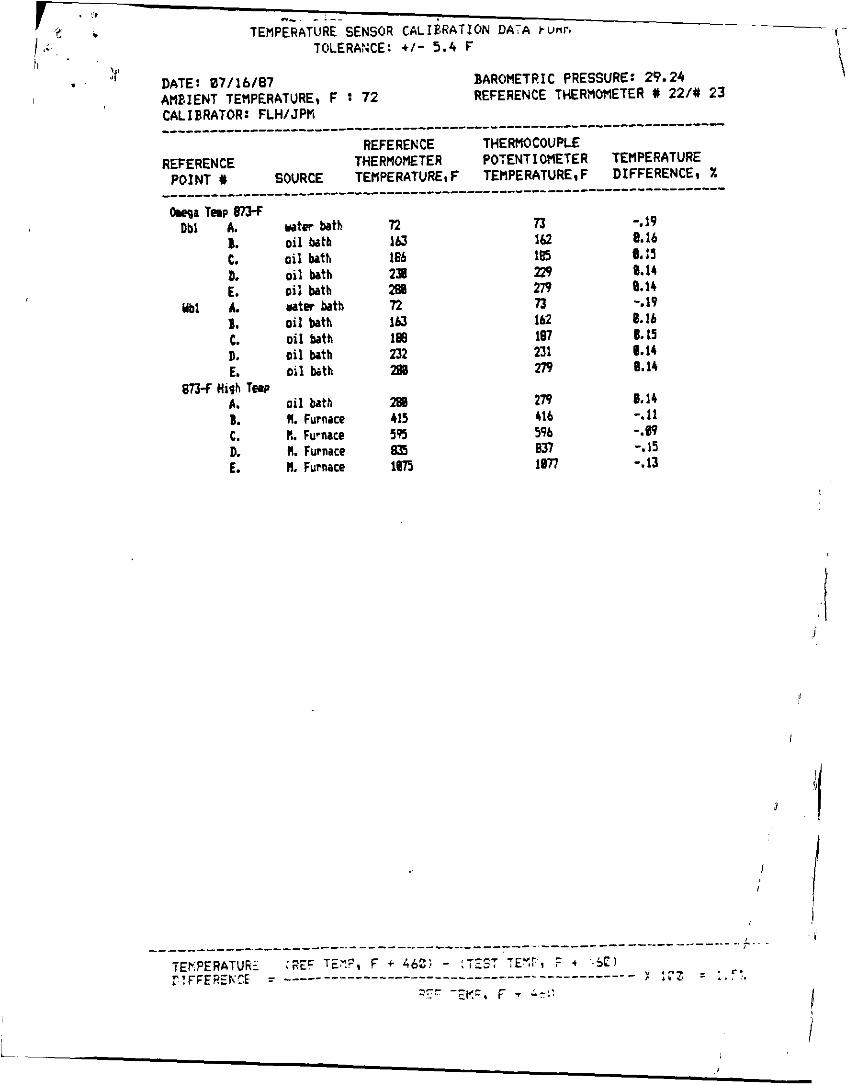
~- . . TERPERATURE SENSOR CALIBRATION DATA FORH
.> TOLERANCE: +/- 5.4 F
SMPlE Box #I
m2
U
W
n
w
87
me
A.
C. D. E. A.
L D. E. A.
C. D. E. A.
L D. E. A. 1. C. D. E. A. I. c. 0. E. A. a. C. D. E. A. I. C. D. E.
a.
a.
a.
a.
w t r bath oil bath Oil bath oil bath oil bath m a t r bath oil bath oil bath oil h t b oil bath w t r bath oil bath oil bath oil bath oil bath uta batb oil bath Oil batb oil bath oil bath mater batb oil bath oil bath oil bath oil batb mtr bath oil bath oil bath oil bath oil bath w t r bath oil h t h oil h t h oil batb oil bath w t r bath oil bath oil batb oil bath oil bath
72 73 131 11 194 192 m m 202 202 72 73 131 I 1 1% 192 m m 202 202 72 74 11 131 194 lprr m 221 202 202 R 72 1JB I31 1% 1- 726 22h 28b 286 72 72 131 1 1 198 lsl ab 226 266 288
11 I I 1% I94 P P 28b 28b 72 71 1 3 131 196 I94 pd 28 288 a7
131 130 1% 198 258 258 288 a7
72 n
72 n
-. 19 0.31
0.00 -. 19 0.80
0.W
-. JB -. 17 -.15 -.29
0.m
0.W 8.W
0.m
e. m
m.31
8.m
e.w
e.w
e.w m a m.m m.m m.m
1.1) -.n 0.W 0.38 0.08 0.W 0.19 0.60 8.38
0.13 0.5
0.00 0.00 0.13
0.m
8. m
Mretrllic
E. WOI Flask
A. B. e. D. E.
Hot bl A. B. c. D. E.
Dbl
llbl
DU
w
A. B. C. 0. E. A. 1. C. D. E. A. B. C. D. E. A. B. c. D.
wtw bath o i l bath o i l bath o i l bath o i l brth mater bath o i l bath o i l bath o i l bath o i l bath w t e r bath oil bath o i l brth oil bath oil bath uts bath oil bath o i l bath oil bath oil bath
iQ bath iQ bath r t r bath rts b t b oil bath
oil bath oil batb oil &tb oil bath
WtR b t b
73 13l I92
2Bb 73 159 226 194 aBb l3 13 193 226 ah 73 1s 193
a88
34
73 89 115 75 138 194 219 m
zie
218
n
74 134 196 Pl 2%l 14 1 9 228 194 2eh 73 132 193
286 72 133 19l 218 287
5)
n 89 114 75 135 191 218 267
m
n
-. 19 -.a -A1 -.u -. 13 -. 19 -A -29 8.M 8, W 8.M -3 8.m -.u 8.W 8.19 -.51 8.46 8-W 8.13
8.00 8.M 8.80 8.M 8. 17 8.W -*m 8.46 8.M 8.41
I I L I - . . - . ,I ~
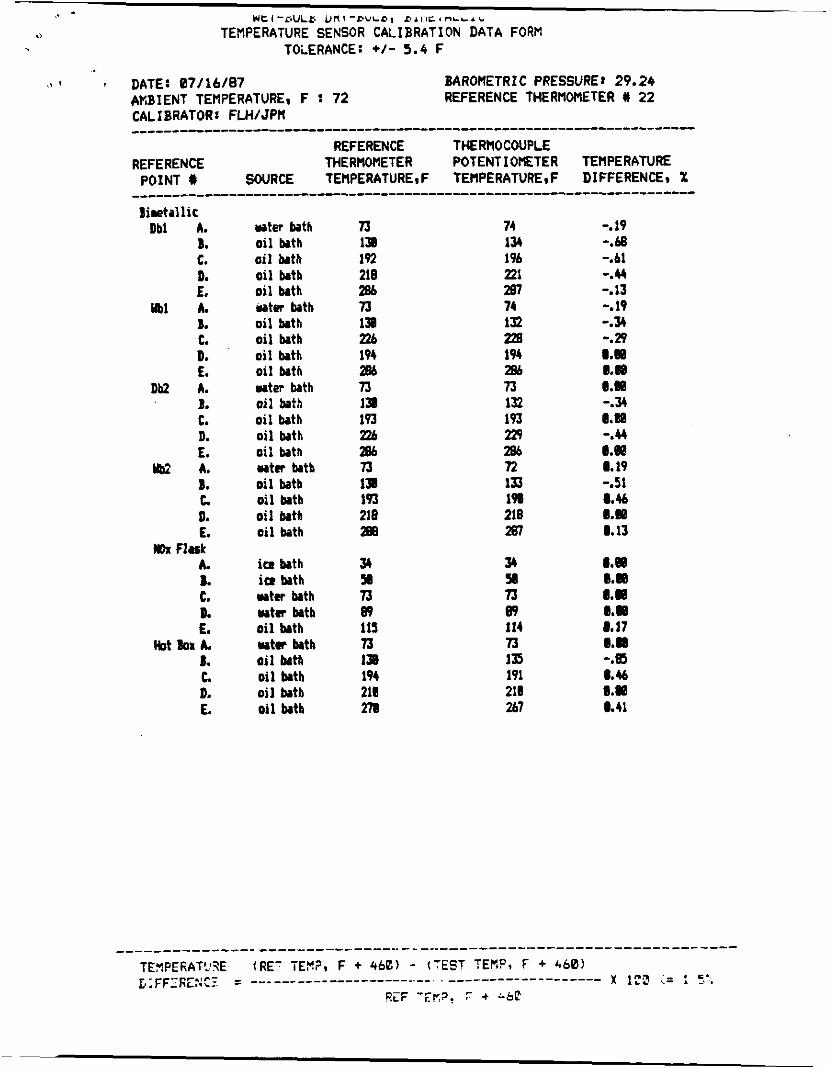
TEMPERATURE SENSOR CALIBRATION DATA FORM TOLERANCE: +/- 5.4 F
mn MX 1% A.
I. C. D.
12641 A. I. L D.
1- A. I. C. D.
1 w A. 1. c. D.
lUlA A. I. c. 0.
IUD A. I. c. D.
19611A A. I. C. D.
1 w A. I. C. D.
iQ bath w t u bra oil bath oil bath iQ batb w t r bath oil btb oil btb iff bath utrr batb oil bath oil bath ice bath utr bath oil bath oil batb io bath u t r bath oil bath oil bath ice batb u t r batb oil bath oil bath
wtw bath oil bath oil batb ice bath uta batk oil bath oil bath
iR bath
36 n 128 1u Jb n 128 14 J5 72 126 1Y J5
126 IU a R 11B 148 a 72
14 34 R 126 1U 34 R 126 1 U
n
im
3h 73 126 1u 36 73 126 140 34 n 126 148 Js 73 12h 148 J5 73 126 111 36 73 128 15) 34 n 125 1 u 33
1% 148
n
0.W -. 19 8.34 0.W 8.W -. 19 0.34
1.a 0.m 030
0.80 -. 19 o m 6 . 1
-. 19 c34
-.a -. 19
0.17 0.W #.I 8. I7 8.W
o m
a. m
8.m
a m
o. m
a.a a. w o.m 0.w
i
r
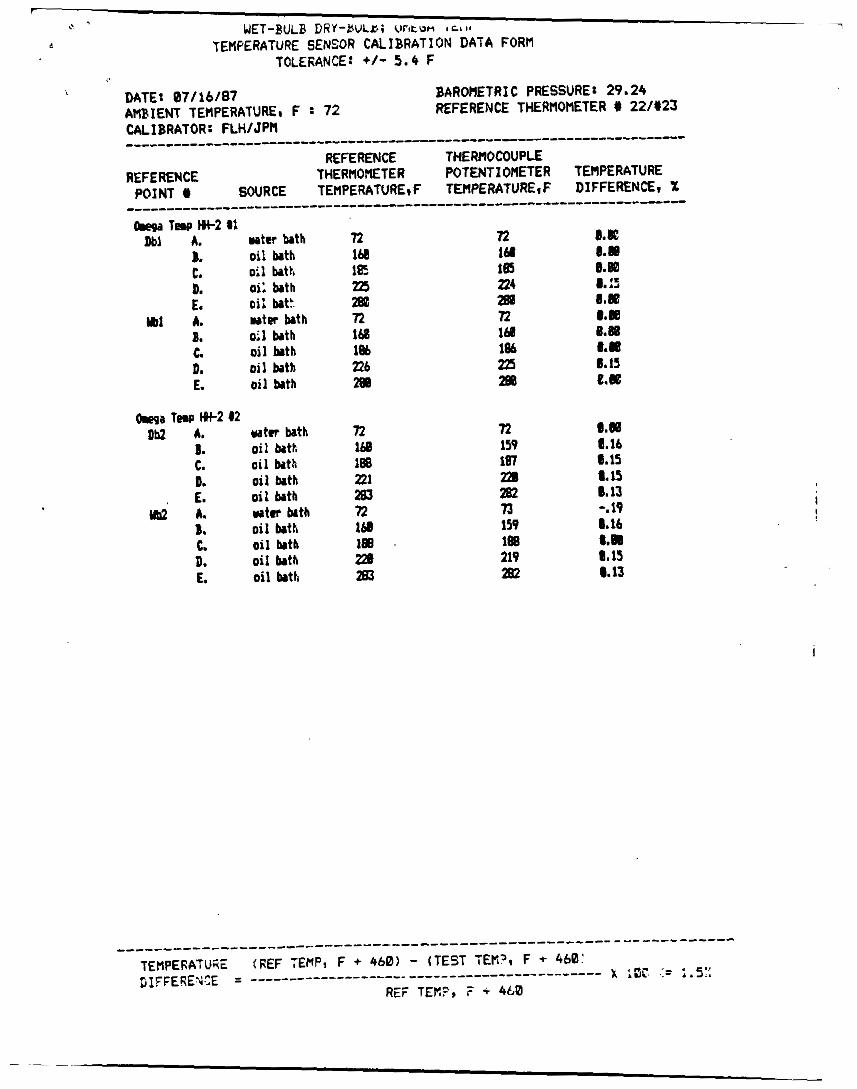
UET-BULB DRY-LWLai w t u w I ci II -1 .. d TEMPERATURE SENSOR CALIBRATION DATA FORM
ma Tew w-2 #2 nu A.
B. C. D. E.
w A. B. C. D. E.
w t a bath oil ktk oil bath oil bath oil bath uta bath oil bath oil bath oil bath oil bath
n 160 188 221 28) 72 I#
22% 203
im
n 159 181 2a 282 75 159 188 219 283
8.m 0.16 0.1s a. 15 8.13 -. 19 8.16
0.15 8.13
8.m
i
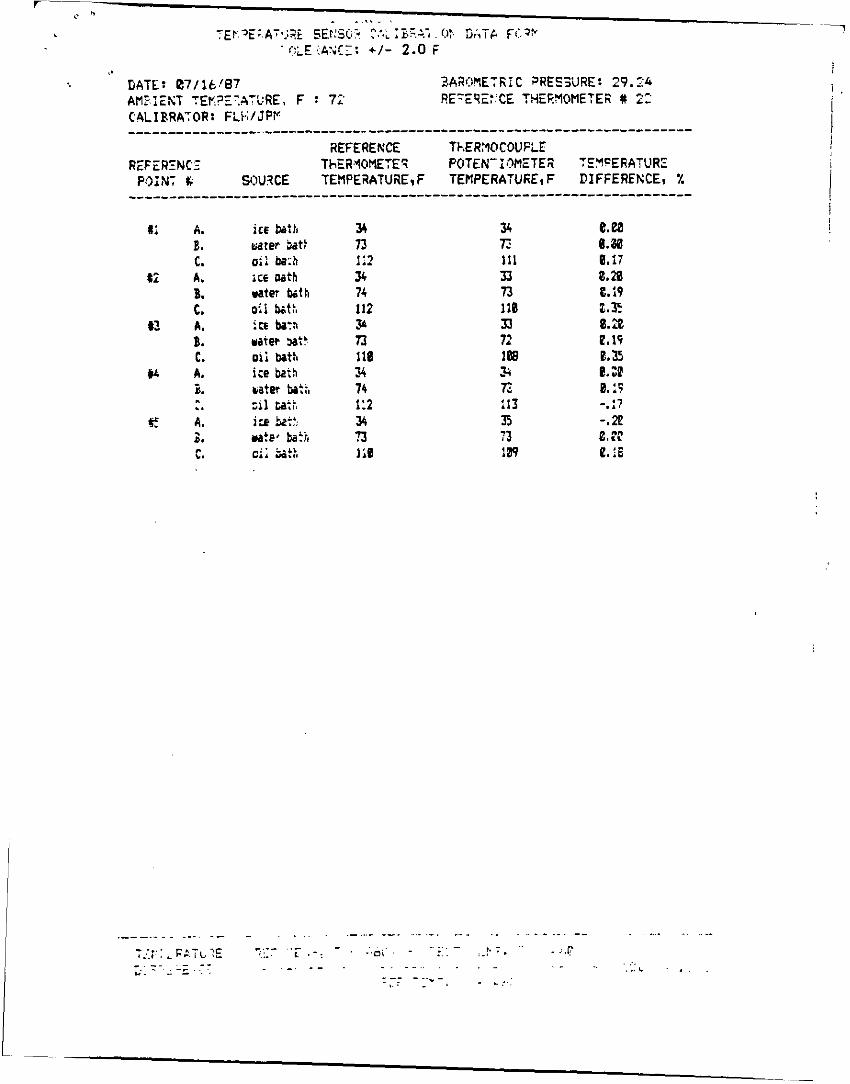
A. B. c. A. B. C. A. B. C.
(c A.
a;
Ci
12
- #, .. .. A. 3. c.
I%
24 73 1 :2 34 14 112 30 l3 118 34 14 ::2 34 75 1;e
34 E l i l ?3 73 118 n 12 188 3 72 :13 35 73 :as
. . . . . ._ - - -. .- . . . . . . . . . . __ ... .... . . . . . . . . . . - ... .- - - -
< n r
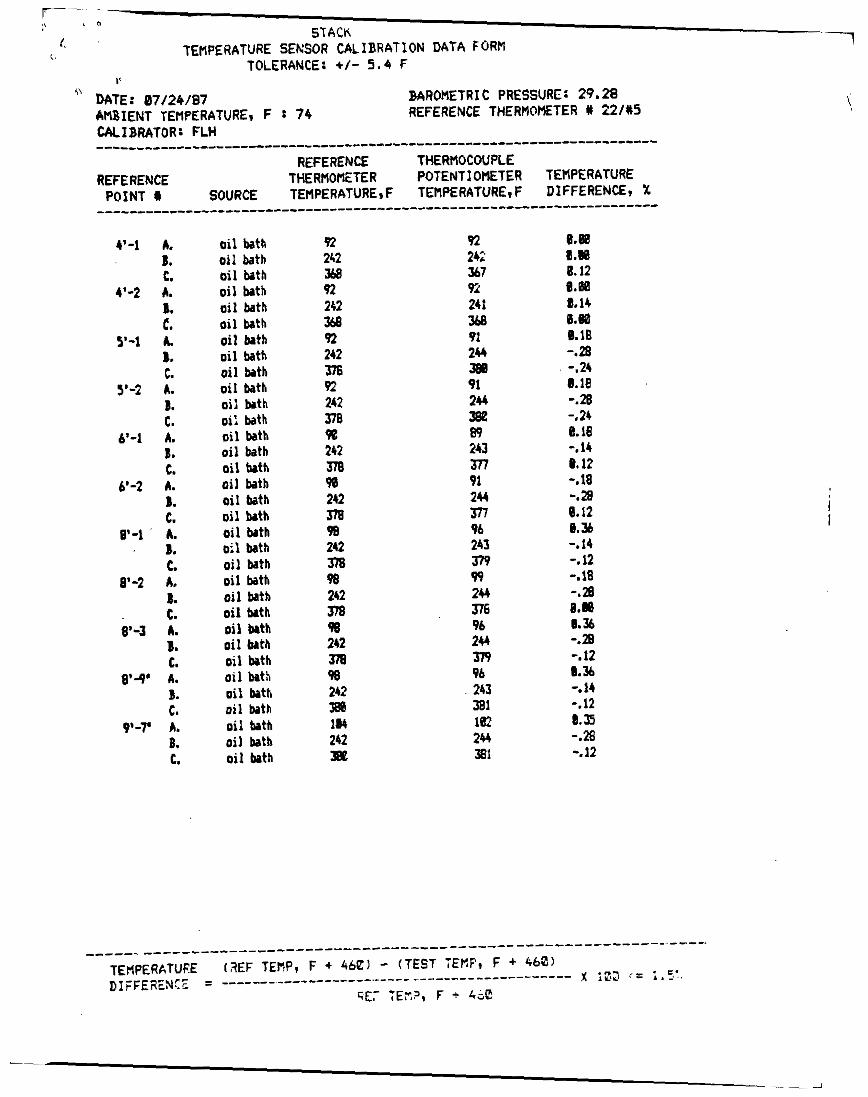
1. STACK
TEMPERATURE SENSOR CALIBRATION DATA FORM 1
4 ' 4 A. B. C.
4'-2 A. E. C.
5 '4 A. B. C.
51-2 A. B. C.
6'-l A. S. t.
6'-2 A. B. C.
#'-I ' A. ' B.
C. 8'-2 A.
B. C.
8 ' 4 A. B. t.
8l-V A. B. C.
9'-1' A. 8. C.
oil bath oil bath oil bath oil bath oil bath ail bath oil bath oil bath ail bath oil bath oil bath oi: bath oil bath ail bath oil bath oil bath oil bath oil bath oil bath oil bath oil bath oil bath oil bath oil bath oil bath o i l b t h ail bath ail bath oil bath oil bath oil bath oil bath oil bath
92 2k2 368 92 242 368 92 242 376 n 242 378 9e 242 JIB 98 242 m 98 242 JIB 98 242 3m ?d 212 rn 98 242 WB 1M 242 m
92 242 367 n 241 368 91 244 388 91 244 JBe
243 377 91 244 277 96 243 m 99 2k4 376 96 244 m? 96 243 381 182 244 301
m
8.80 6.80 8.12 #.ea 6-14 8.W 8.18 -.a -.24
-.a -.24
-, 14 8.12 -.la -.a e.. 12 0.36 -. 14 -. 12 -.la -.a 9-36 -,a -. 12 0.36 -. 14 -.12 0. 35 -.28 -. 12
0. ia
e. ia
0.m
nL , , e . TENPERATLIRE SENSOR CALIERATION DA-A kunr, 1 -
,: TCILERAKCE: +/- 5.4 F 1,
)I' il
'1 DATE: 07J16107 BAROMETRIC PRESSURE: 29.24 , ANP.IENT TEMPERATURE, F : 72 REFERENCE THER?IONETER W 22/# 23
CALIBRATOR: FLHJJPN ..................................................................... REFERENCE THERHOMETER POTENTIOHETER TEMPERCITURE
POINT tl SOURCE TEMPERATURE, F TEHPERATUREgF DIFFERENCE, X ____________________^___________________------------------------------
REFERENCE THERHOCOUPLE
h a TRP BRF n 73 -.19 Dbl A. wtw bath oil bath lb3 162 0.16 oil bath 186 165 e. :5
oil bath 288 279 8.14
oil bath lb3 lbz e. 16
B. C.
oil bath 298 229 0.14 D. E. n 73 -.19 B.
oil bath 188 187 E. 15 C. D. oil bath 232 231 0.14
oil bath ?Ea 279 0.14 E. oil bath 288 279 0.14 A.
B. H. Furnace C. R. Fumce D. H. Furnace E. H, Furnace
all A. rater bath
873-F High TeW
415 416 -.11 595 596 -.89 835 857 -. 15 1975 inn -. 13
I
, ' 1 I I
I