Embed Size (px)
Citation preview

OWN MOUNTAIN TRADING COMPANY PRESENTS
BackTesting Report Helping Busy Traders Choose Better Strategies
MACD HistogrAM’s
Multiple Identities
Exposed
© 2009 by Own Mountain Trading Company. All Rights Reserved.
www.backtestingreport.com 2
Letter from the Editor May 2009 Dear Reader- These excerpts are from the first BackTesting Report in a series about Moving Average Convergence-Divergence or MACD. The MACD exists to give you a jump on the moving average crossover by tracking how two moving averages come together (converge) and drift apart (diverge). While researching the topic, I found widespread confusion about how to calculate the MACD Histogram as well as how to use it. In fact, it seems like a full-blown identity crisis and nobody is talking about it! In this document, you’ll learn the two main ways to draw the MACD Histogram. This excerpt gives you a detailed briefing so that, when you see a MACD on a chart, you can tell at a glance how it was made, and pick out the potential signals. After reading this, you’ll not only be in a better position to use MACD to understand the markets, you will also see how many experts refer to them interchangeably when in fact they are quite different. A couple posts on www.backtestingblog.com call out sites (like Yahoo) and well-known experts who add to the confusion. As you find more cases of mistaken identity with MACD Histogram, please leave your comments on the blog as well. This document is just a sample. The actual BackTesting Reports show data on the various MACD lines and histogram signals, giving insight into what it says about the market, and most importantly, how much to count on MACD based on its track record. This gives you solid information you need to decide if you want to use MACD and the best way to apply it to fit your style. To make it easier to apply what you learn in the reports, the MACD Sell Signal BackTesting Report also includes Stockfinder® layouts which illustrate selected MACD buy and sell signals. Whether or not you decide to subscribe to BackTesting Report, the following few pages will give you a deeper understanding of the MACD Histogram. Read on and enjoy! Sincerely,
Jackie Ann Patterson Editor, BackTesting Report Director, Own Mountain Trading Company
www.backtestingreport.com 3
MACD Overview The first thing to know about MACD is how to say it. All the letters in its name are usually spoken – “M-A-C-D”. The acronym stands for Moving Average Convergence Divergence, which is too much of a mouthful for polite company so let’s just use MACD.
The Intention of the MACD
The basic idea to keep in mind about the MACD is that it evolved as a way to anticipate a moving average (MA) crossover and jump ahead of other traders waiting for the MA crossover signal. MACD anticipates MAs crossovers by tracking how the two moving averages come together (converge) and drift apart (diverge).
The Parts of the MACD
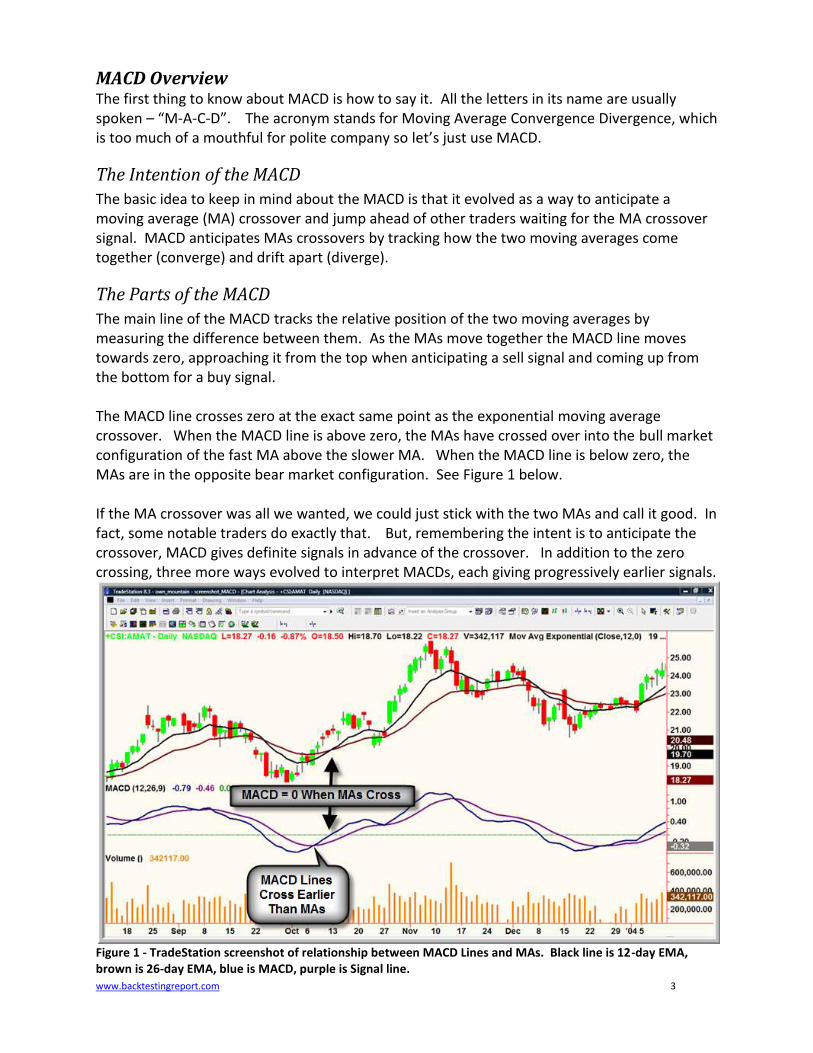
The main line of the MACD tracks the relative position of the two moving averages by measuring the difference between them. As the MAs move together the MACD line moves towards zero, approaching it from the top when anticipating a sell signal and coming up from the bottom for a buy signal. The MACD line crosses zero at the exact same point as the exponential moving average crossover. When the MACD line is above zero, the MAs have crossed over into the bull market configuration of the fast MA above the slower MA. When the MACD line is below zero, the MAs are in the opposite bear market configuration. See Figure 1 below. If the MA crossover was all we wanted, we could just stick with the two MAs and call it good. In fact, some notable traders do exactly that. But, remembering the intent is to anticipate the crossover, MACD gives definite signals in advance of the crossover. In addition to the zero crossing, three more ways evolved to interpret MACDs, each giving progressively earlier signals.
Figure 1 - TradeStation screenshot of relationship between MACD Lines and MAs. Black line is 12-day EMA, brown is 26-day EMA, blue is MACD, purple is Signal line.

www.backtestingreport.com 4
The most well-known MACD signal is called, appropriately enough, the MACD Signal Line. This is an exponential moving average of the MACD itself. When the MACD crosses up through its signal line, it indicates a buying opportunity. It’s considered especially strong if the MACD is below zero (indicating an oversold market) at the time of the crossover. When the MACD crosses down through its signal line, it’s a sell signal, especially if it happens above the zero line to indicate an overbought market. The crossing of the signal line gives you some advance notice of a moving average crossover as illustrated in Figure 1. To back up in time to catch an even earlier signal, you use the same methods on the MACD that went into its creation. That is, look to see when the line turns. With the naked eye, it’s easier to see the turning point if the MACD is drawn as a histogram. Then you simply compare the height of the current bar to the previous bar. If the current bar is below zero but dropping less low than the previous one, it’s a buy signal. If the current bar is above zero and shorter than the previous, it signals a sell. Figure 2 shows the histogram and highlights the uptick before the lines signal on the same chart as Figure 1.
Figure 2 -- TradeStation screenshot of Appel's MACD Histogram. Arrow points to a buy signal as the histogram ticks up from below zero.
Histogram, Smistogram – What’s the Difference?
Here’s where things get a little murky. Two different MACD histograms float around in the world. Gerald Appel, money manager, trader and the inventor of the MACD thinks it started with the original monograph on MACD he wrote decades ago. He says, “Everybody who has written about MACD, I think, has taken what they wrote from that monograph, which I [now] think was inaccurate. “¹

www.backtestingreport.com 5
Mr. Appel draws a histogram under the MACD line representing the difference between the two moving averages. From here forward, let’s call this Appel’s histogram. Most texts describe the MACD Histogram in this manner. However, most chart packages and texts actually calculate the MACD Histogram another way. They plot the histogram as the difference between the MACD and its signal line. Let’s continue to refer to this as the MACD Histogram, a.k.a. MACDH. See Figure 3 below for a graphic comparison of the two histograms.
Figure 3 - TradeStation screenshot comparing the two types of MACD Histogram. Appel's Histogram is on the bottom. The commonly drawn MACDH is in the middle of the screen.
You can tell which kind of histogram you have on any chart by looking at how the zero crossings of the histogram relate to the zero crossings of the MACD lines. If the bars in the histogram cross zero at the same time as the lines cross zero, it is Appel’s histogram. If, however, the bars cross zero when the MACD lines cross each other, then it is the MACDH. The MACDH uptick or downtick is the earliest signal. It is the first to detect when price is moving in the direction that will cause a moving average crossover. The MACDH is the most sensitive signal and that means it may also be prone to having the most false signals. When you see a histogram on a chart, take a quick moment to check what type, so you know if
you’re getting the early signal or the later one. You can use the results from this report to see the performance track record of both types of histogram.
Where do you look on the MACD to find the most promising buy signal?

www.backtestingreport.com 6
Advanced MACD Signals
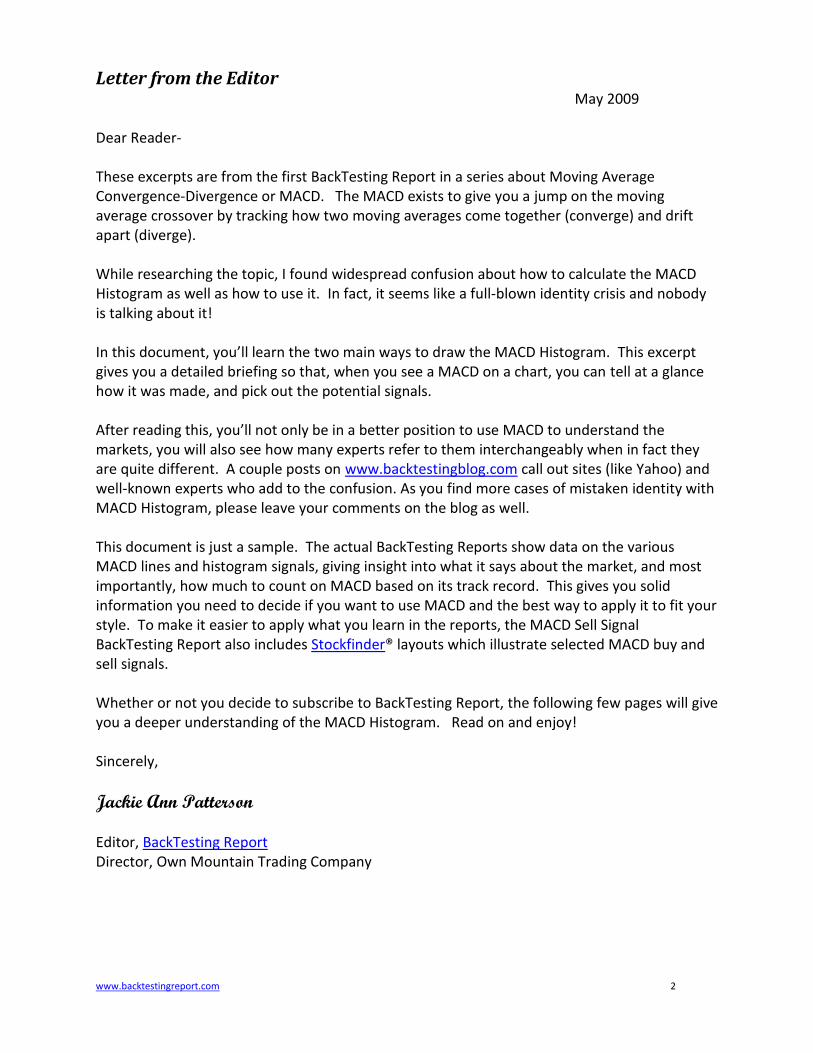
No discussion of MACD would be complete without mentioning divergences. These important signals occur when price hits a new extreme while the indicator is actually showing that it’s a less powerful move. See Figure 4 for a triple bullish divergence on both the MACD lines and histogram. In a triple divergence, price makes a low three times, and at each low, the MACD reading is successively higher. Backtesting any indicator divergence is challenging and comes with its own set of parameters to tweak. We will explore MACD divergences in a dedicated issue of BackTesting Report.
Figure 4 - TradeStation screenshot of a MACD and MACDH bullish divergence.

www.backtestingreport.com 7
Contents of BTR5-MACD Buy Signals
This report builds upon Issue1 Download Issue1 – Baseline (it’s free) from http://www.backtestingreport.com/BackTestingReportBaseline.pdf

www.backtestingreport.com 9
Resources
Bibliography
¹Appel, Gerald. Master Class with Gerald Appel, Financial Trading Seminars, 2003. ²Appel, Gerald. Technical Analysis: Power Tools for Active Investors, FT Press, 2005. Aronson, David. Evidence-Based Technical Analysis: Applying the Scientific Method and Statistical Inference to Trading Signals, Wiley, 2007. ⁴Elder, Alexander. Trading for a Living, Wiley, 1993. Elder, Alexander, Trading Room Video Course, Financial Trading Seminars, 2003. Chuck LeBeau and David Lucas. Technical Traders Guide To Computer Analysis of the Futures Market, The Book Press, 1992. D.R Barton, Chuck LeBeau. Class notes of The Systems Development Workshop. Offered by Van Tharps Institute, http://www.vantharp.com, 2007. Tharp, Van. Trade Your Way to Financial Freedom, 2nd edition, McGraw Hill, 2007. 1 Richard L. Wiessman. Mechanical Trading Systems: Pairing Trader Psychology with Technical Analysis, Wiley Trading, 2005.
Software
Stockfinder® – fast stock screener to apply your strategies (by Worden Brothers Inc)
TradeStation® – the backtesting engine used in this report
Elder-Disk for Trade-Station – implements assorted strategies and indicators from Elder’s books
Web Sites
BackTestingBlog.com – background information on backtesting, including glossary BestFreeCharts.com - free interactive charts made with BATS real-time data
Yahoo.com – free, online stock charts made with CSI Data for historical charts

www.backtestingreport.com 10
Disclaimer By purchasing this report, you are agreeing to the following disclaimer:
Own Mountain Trading Company, its owners, directors, managers and officers, (“Own Mountain”), are not responsible for the success or failure of your decisions relating to any information presented in this report. The information presented in this report should be carefully considered and evaluated, before reaching a decision, on whether to use them.
This report contains comparisons, assertions, and conclusions regarding performance based on backtesting. Backtesting is the process of testing a trading strategy on prior time periods. When you backtest, the results achieved are highly dependent on the movements of the tested period. One should not assume that what happens in the past will happen in the future, and this assumption can cause potential risks for the strategy. Back-testing is not identical to live trading. As such the backtesting performance may differ from the actual performance. Markets are always changing and evolving. The market today can be very different from the market last year. The past performance does not equal future results.
There can be no assurance that any prior successes, or past results can be used as an indication of your future success or results. Results are based on many factors. Own Mountain has no way of knowing how well you will do, as we do not know you, your background, your work ethic, or your skills or practices. Therefore Own Mountain does not guarantee or imply that you will get rich, that you will do as well, or make any money at all. There is no assurance you will do as well. If you rely upon the information presented in this report; you must accept the risk of not doing as well. Any earnings or income statements, or earnings or income examples, are only estimates of what we think you could earn.
You are advised to do your own due diligence when it comes to making business decisions and all information should be independently verified by your own qualified professionals.
All businesses have unknown risks involved, and are not suitable for everyone. You could experience significant losses, or make no money at all. Use caution and seek the advice of qualified professionals. Check with your accountant, lawyer or professional advisor, before acting on this or any information
Own Mountain makes no express or implied claims that you will make money as a result of purchasing this report and using the information presented in this report.
You agree that Own Mountain is not responsible for any success or failure that you or your business may experience as a result of using the information presented in this report. You freely and of your own will risk any and all capital you may choose to spend in using the information. You will do so with skill and common sense. You will not hold Own Mountain Trading Company accountable in any way for any failure of the information to live up to your expectations.
In no event shall Own Mountain have any liability for any special, punitive, indirect, or consequential damages (including lost profits), even if notified of the possibility of such damages. Own Mountain is an independent corporation which is an Amazon Associate and a Worden Brothers affiliate. Own Mountain may receive compensation from the links in this report.
TeleChart2007 and Stockfinder are trademarks of Worden Brothers, Inc. TradeStation is a trademark of TradeStation Group, Inc.