Embed Size (px)
Citation preview
HAL Id: hal-01905508https://hal.archives-ouvertes.fr/hal-01905508
Submitted on 25 Oct 2018
HAL is a multi-disciplinary open accessarchive for the deposit and dissemination of sci-entific research documents, whether they are pub-lished or not. The documents may come fromteaching and research institutions in France orabroad, or from public or private research centers.
L’archive ouverte pluridisciplinaire HAL, estdestinée au dépôt et à la diffusion de documentsscientifiques de niveau recherche, publiés ou non,émanant des établissements d’enseignement et derecherche français ou étrangers, des laboratoirespublics ou privés.
Distributed under a Creative Commons Attribution| 4.0 International License
Bacteriocyte Reprogramming to Cope With NutritionalStress in a Phloem Sap Feeding Hemipteran, the Pea
Aphid Acyrthosiphon pisumStefano Colella, Nicolas Parisot, Pierre Simonet, Karen Gaget, Gabrielle
Duport, Patrice Baa-Puyoulet, Yvan Rahbé, Hubert Charles, Gérard Febvay,Patrick Callaerts, et al.
To cite this version:Stefano Colella, Nicolas Parisot, Pierre Simonet, Karen Gaget, Gabrielle Duport, et al.. Bacte-riocyte Reprogramming to Cope With Nutritional Stress in a Phloem Sap Feeding Hemipteran,the Pea Aphid Acyrthosiphon pisum. Frontiers in Physiology, Frontiers, 2018, 9, pp.1498.�10.3389/fphys.2018.01498�. �hal-01905508�
fphys-09-01498 October 23, 2018 Time: 14:25 # 1
ORIGINAL RESEARCHpublished: 25 October 2018
doi: 10.3389/fphys.2018.01498
Edited by:Su Wang,
Beijing Academy of Agricultureand Forestry Sciences, China
Reviewed by:Christen Kerry Mirth,
Monash University, AustraliaAngelique Christine Paulk,
Harvard Medical School,United States
*Correspondence:Federica Calevro
[email protected] Colella
†These authors are joint first authors
‡‡‡Present address:Stefano Colella,
LSTM, Laboratoire des SymbiosesTropicales et Méditerranéennes,
INRA, IRD, CIRAD, SupAgro,Université de Montpellier, Montpellier,
FranceYvan Rahbé,
UMR5240, Microbiologie, Adaptationet Pathogénie, Université de Lyon
CNRS, Villeurbanne, France
Specialty section:This article was submitted to
Invertebrate Physiology,a section of the journalFrontiers in Physiology
Received: 23 May 2018Accepted: 04 October 2018Published: 25 October 2018
Citation:Colella S, Parisot N, Simonet P,
Gaget K, Duport G, Baa-Puyoulet P,Rahbé Y, Charles H, Febvay G,
Callaerts P and Calevro F (2018)Bacteriocyte Reprogramming to Cope
With Nutritional Stress in a PhloemSap Feeding Hemipteran, the Pea
Aphid Acyrthosiphon pisum.Front. Physiol. 9:1498.
doi: 10.3389/fphys.2018.01498
Bacteriocyte Reprogramming toCope With Nutritional Stress in aPhloem Sap Feeding Hemipteran, thePea Aphid Acyrthosiphon pisumStefano Colella1*†‡, Nicolas Parisot1†, Pierre Simonet1, Karen Gaget1, Gabrielle Duport1,Patrice Baa-Puyoulet1, Yvan Rahbé1‡, Hubert Charles1, Gérard Febvay1,Patrick Callaerts2 and Federica Calevro1*
1 Univ Lyon, INSA-Lyon, INRA, BF2I, UMR0203, F-69621, Villeurbanne, France, 2 Laboratory of Behavioraland Developmental Genetics, Department of Human Genetics, KU Leuven, Leuven, Belgium
Nutritional symbioses play a central role in the ability of insects to thrive onunbalanced diets and in ensuring their evolutionary success. A genomic modelfor nutritional symbiosis comprises the hemipteran Acyrthosiphon pisum, and thegamma-3-proteobacterium, Buchnera aphidicola, with genomes encoding highlyintegrated metabolic pathways. A. pisum feeds exclusively on plant phloem sap, anutritionally unbalanced diet highly variable in composition, thus raising the questionof how this symbiotic system responds to nutritional stress. We addressed this bycombining transcriptomic, phenotypic and life history trait analyses to determine theorganismal impact of deprivation of tyrosine and phenylalanine. These two aromaticamino acids are essential for aphid development, are synthesized in a metabolicpathway for which the aphid host and the endosymbiont are interdependent, andtheir concentration can be highly variable in plant phloem sap. We found that thisnutritional challenge does not have major phenotypic effects on the pea aphid,except for a limited weight reduction and a 2-day delay in onset of nymph laying.Transcriptomic analyses through aphid development showed a prominent response inbacteriocytes (the core symbiotic tissue which houses the symbionts), but not in gut,thus highlighting the role of bacteriocytes as major modulators of this homeostasis. Thisresponse does not involve a direct regulation of tyrosine and phenylalanine biosyntheticpathway and transporter genes. Instead, we observed an extensive transcriptionalreprogramming of the bacteriocyte with a rapid down-regulation of genes encodingsugar transporters and genes required for sugar metabolism. Consistently, we observedcontinued overexpression of the A. pisum homolog of RRAD, a small GTPase implicatedin repressing aerobic glycolysis. In addition, we found increased transcription of genesinvolved in proliferation, cell size control and signaling. We experimentally confirmed thesignificance of these gene expression changes detecting an increase in bacteriocytenumber and cell size in vivo under tyrosine and phenylalanine depletion. Our results
Frontiers in Physiology | www.frontiersin.org 1 October 2018 | Volume 9 | Article 1498
fphys-09-01498 October 23, 2018 Time: 14:25 # 2
Colella et al. Nutritional Stress Response in the Pea Aphid
support a central role of bacteriocytes in the aphid response to amino acid deprivation:their transcriptional and cellular responses fine-tune host physiology providing the hostinsect with an effective way to cope with the challenges posed by the variability incomposition of phloem sap.
Keywords: pea aphid, symbiosis, bacteriocyte, amino acid stress, phenylalanine and tyrosine pathway,transcriptome profiling
INTRODUCTION
Hemiptera are a major group of insects occupying a diverse rangeof ecological niches. Phloem-feeding hemipterans are amongthe most destructive insect pests of agriculture and forest cropsdue to their wide host range, rapid reproduction and ability tovector numerous phytopathogens (Girousse et al., 2005; Braultet al., 2010; Perilla-Henao and Casteel, 2016). These insects arethe only group of animals using phloem sap, a nutritionallyunbalanced diet rich in carbohydrates (e.g., sucrose) but poorin essential amino acids (Hayashi and Chino, 1986; Douglas,1993; Sandström and Pettersson, 1994; Karley et al., 2002; Dinantet al., 2010), as their predominant or sole food source (Douglas,2006). All phloem-feeding hemipterans are capable of utilizingphloem sap thanks to their intimate association with symbioticbacteria which furnish them with (or cooperate with them for theproduction of) vitamins and/or amino acids otherwise lacking inthis food source (Akman Gündüz and Douglas, 2009). In additionto being nutritionally unbalanced, plant phloem sap showsconsiderable spatial and temporal variability in compositiondependent on, e.g., plant species, environment, age of the plantand position of the insect on the plant, all making this achallenging food source for these insects (Sharkey and Pate, 1976;Smith and Milburn, 1980; Hayashi and Chino, 1990; Winteret al., 1992; Corbesier et al., 2001; Douglas, 2003, 2006; Gholami,2004). Despite their ecological and agronomical importance, howhemipterans and their symbiotic bacteria cope with changesin phloem sap composition and the nature of the molecularresponses to these changes are poorly understood.
The pea aphid Acyrthosiphon pisum is an excellent hemipteranmodel to study the interactions between animals and theirresident microorganisms. First, its parthenogenetic reproductionallows studying large numbers of individuals of a singlegenotype. Furthermore, the pea aphid primary symbiont,the gamma-3-proteobacterium, Buchnera aphidicola, which hascoevolved with its host for over 150 million years, is one of thebest characterized symbiotic bacteria (Moran et al., 1993; Moranand Baumann, 1994; Von Dohlen and Moran, 2000; Tagu et al.,2010).
The genomes of the pea aphid and its primary symbiont haveboth been sequenced and their analysis revealed that these twoobligate mutualists are fully interdependent for the biosynthesisof amino acids with the two genomes forming a highly integratedmetabolic network (Shigenobu et al., 2000; International AphidGenomics Consortium, 2010). The amino acid biosyntheticpathways illustrate the metabolic interdependence of host andendosymbionts. Both partners participate in the biosynthesisof the 10 amino acids: arginine, cysteine, glycine, isoleucine,
leucine, lysine, methionine, phenylalanine, threonine, andvaline. Histidine and tryptophan are synthesized exclusively byBuchnera, which in turn is auxotrophic for the biosynthesisof alanine, asparagine, aspartate, glutamine, glutamate, proline,serine, and tyrosine (Wilson et al., 2010; Hansen and Moran,2011; Poliakov et al., 2011; Wilson, 2011; Wilson and Duncan,2015).
The tyrosine (Tyr) and phenylalanine (Phe) biosyntheticpathway is one of the most integrated, consisting of a networkof genes encoded by the genomes of host and primary symbiont.B. aphidicola produces all the necessary precursors to synthesizePhe and Tyr, but has lost the terminal biosynthetic enzymesof the pathway and fully relies on the host insect for theirbiosynthesis (International Aphid Genomics Consortium, 2010;Wilson et al., 2010). The exchange of precursors and terminalproducts between the host and the symbiont is often referredto as the aromatic shuttle (Rahbé et al., 2002), where (i)the endosymbiont provides the host with phenylpyruvate thedirect precursor of Phe, (ii) the aphid synthesizes Phe fromthis precursor, and subsequently Tyr from Phe, and (iii) theaphid supplies both its own cells and B. aphidicola with Pheand Tyr (Wilson et al., 2010; Simonet et al., 2016b). Severalstudies have demonstrated the importance of Tyr and Phefor aphid performance, and embryonic development (Douglas,1996; Wilkinson and Ishikawa, 1999, 2000; Berminghamand Wilkinson, 2010). The Tyr/Phe pathway is activatedduring pea aphid parthenogenetic development, with severalenzyme-encoding genes being up-regulated in the late phasesof embryonic development and at the beginning of nymphaldevelopment (Rabatel et al., 2013). Recently, Simonet et al.(2016b) confirmed the functional importance of this pathwayin aphid development through the disruption of phenylalaninehydroxylase (ApPAH, EC:1.14.16.1). This enzyme catalyzes theconversion of Phe to Tyr, and is only encoded by the host genome.ApPAH gene inactivation shortened the adult aphid lifespan andconsiderably affected fecundity by diminishing the number ofproduced nymphs and impairing embryonic development, withsevere morphological defects in the progeny.
In apparent contrast to the fact that these aromatic aminoacids are important for aphid development and growth, Tyrand Phe have been reported to be in low abundance in plantsap (from trace amounts to 0.5–4%) (Hayashi and Chino, 1990;Karley et al., 2002; Douglas, 2006). This thus raises the importantquestion of how this symbiotic system copes with fluctuations inthe concentrations of these two amino acids.
Organisms facing environmental constraints often displayextensive transcriptional plasticity (modulation of geneexpression). However, similar to other symbiotic bacteria,
Frontiers in Physiology | www.frontiersin.org 2 October 2018 | Volume 9 | Article 1498
fphys-09-01498 October 23, 2018 Time: 14:25 # 3
Colella et al. Nutritional Stress Response in the Pea Aphid
the B. aphidicola genome has undergone drastic size reduction(Gil et al., 2002) and most of the classical bacterial geneexpression regulatory networks are missing [reviewed in Brinzaet al. (2009)]. Several studies have indicated the lack of a strongand specific transcriptional response of this bacterium followinga stress applied to the aphid host (Moran et al., 2005; Wilsonet al., 2006). Furthermore, Reymond et al. (2006) demonstratedthat the transcriptional response of B. aphidicola from aphidsreared on a Tyr/Phe depleted diet was not specifically orientedtoward aphid needs. These results led us to hypothesize that thehost regulates the response to nutrient stress.
To test this hypothesis and uncover the aphid response at themolecular level we used a chemically defined artificial diet tocharacterize the impact of deprivation of Tyr and Phe onA. pisumtranscriptome and life history traits. The complete control diet(AP3) supports normal development, feeding and reproduction(Febvay et al., 1988). Selective removal of Tyr and Phe (YFØ diet)has the advantage to create a framework to identify the cellularand molecular basis of the response of A. pisum/B. aphidicola tonaturally occurring fluctuations in phloem sap composition. Wefocused on gut and bacteriocytes because the gut epithelium isknown to act as a regulatory hub in insect nutrition (Huang et al.,2015) while bacteriocytes represent the core symbiotic tissue, asthey house the symbiotic bacteria (Buchner, 1965; Baumann et al.,1995). Our analysis revealed that the pea aphid does not showmajor phenotypic differences under this nutritional challenge.Moreover, the gut transcriptome is not significantly altered undernutrient stress. By contrast, the major response to this nutritionalconstraint occurs at the level of the bacteriocyte cell. Surprisingly,these alterations do not involve a modulation of the tyrosineand phenylalanine biosynthetic pathways to directly compensatefor the depletion of these two amino acids from the aphiddiet. Instead, we discovered a transcriptional reprogramming ofbacteriocyte cells including a reduction in expression of genesrequired for sugar metabolism, a modulation of the transportfunction, and increased transcription of genes related to cellgrowth, proliferation and associated signaling pathways. Weexperimentally validated these observations in vivo detecting asignificant increase in bacteriocyte number and size. Our findingsare indicative of the transcriptional and phenotypic plasticity ofbacteriocyte cells. Given the universal presence of bacteriocytesin hemipterans and other symbiotic insects, and their centralrole in the interactions of these insects with their symbionts,we anticipate that equivalent mechanisms may be present inother symbiotic systems that live and reproduce on nutritionallyunbalanced diets.
MATERIALS AND METHODS
Aphid Rearing and PerformanceMeasuresA long-established parthenogenetic clone (LL01) of A. pisum(Harris), devoid of secondary symbionts, was maintained onyoung broad bean plants (Vicia faba, L. cv. Aquadulce), at21◦C, with a 16 h photoperiod. In order to obtain a sourceof synchronized apterous parthenogenetic aphids, winged adults
were left on seedlings, to allow them to produce nymphs, andwere removed after 24 h. Synchronized N1 nymphal instars werethen transferred to two artificial diets differing only in theiramino acid composition: the AP3 and the YFØ diets (see section“Artificial Diets” for details). N1 nymphs (30 for the AP3 and 30for the YFØ diets, respectively) were left to develop for 30 daysand were checked daily for survival and the presence of possibledifferent phenotypic effects. Aphids were weighed at Day 7, thetime point of transition to adulthood in aphids reared on plants.Ten aphids per diet were isolated and followed individually forfecundity: the number of newborn nymphs was counted, theirsize measured with a Leica MZFLIII (Leica, Wetzlar, Germany)microscope using an F-view camera link to the CellF software(Soft Imaging 197 System, Tokyo, Japan) and they were checkedfor any visible morphological phenotype.
Artificial DietsThe composition of the artificial diet (AP3) was as originallydefined by us combining data on the amino acid compositionin both the phloem sap of leguminous plants and aphidhemolymph (Febvay et al., 1988). The YFØ diet is the same asAP3 minus tyrosine (Y) and phenylalanine (F). Following thepreparation of new aliquots of the artificial diets, actual aminoacid concentrations are determined by HPLC analysis (Febvayet al., 1999). Furthermore, for the AP3 control diet, aphid lifehistory traits, survival and honeydew production are measuredprior to use in experiments (see also the section “Results”). Onthis diet, aphid survival is standardly comparable to that of aphidsreared on plants.
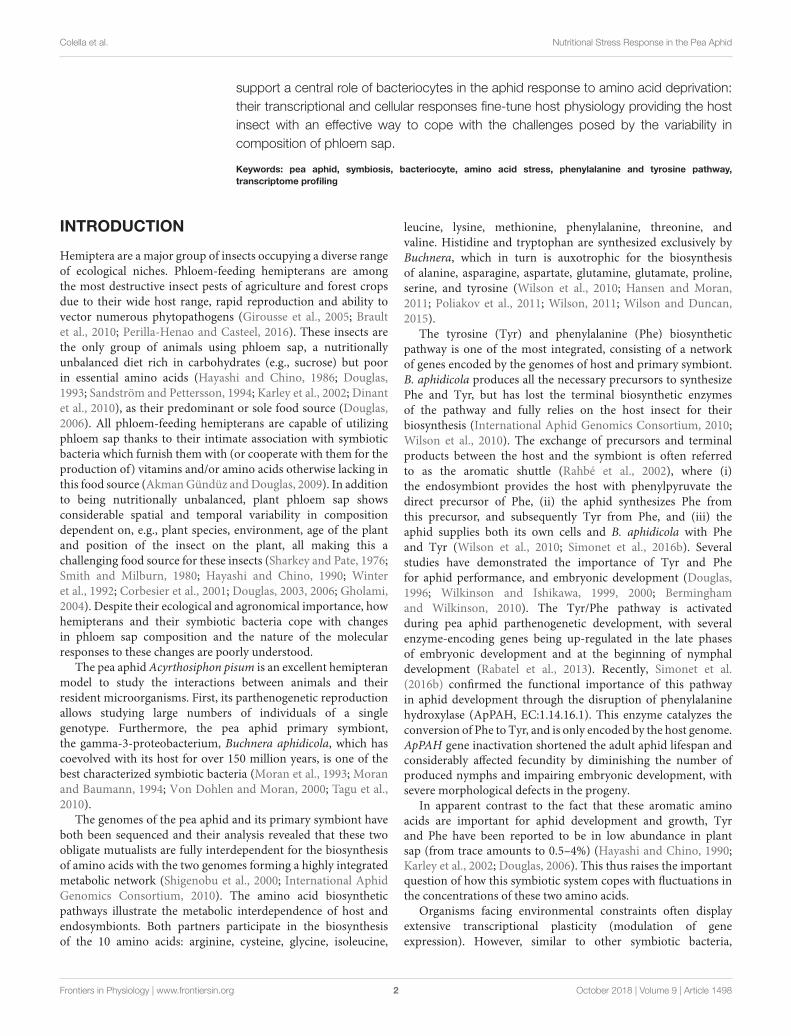
Sampling of Aphid Tissues for RNAExtractionThis study represents the first time-course analysis of A. pisumgene expression on a genome-wide scale (see Figure 1 for theexperimental design). Aphids were dissected in ice-cold iso-osmotic buffer A (pH 7.5, 0.025 M KCl, 0.01 M MgCl2, 0.25 MSucrose, and 0.035 M Tris–HCl) under 25–40× magnificationwith an MDG-17 stereomicroscope (Leica) and two tissues wereisolated: the gut and the bacteriocytes. All collected nymphs wererandomly selected from the synchronized source population. Gutsamples were isolated at seven distinct time points following thetransfer on the two artificial diets after 12 h (D0), 1 day (D1),2 days (D2), 3 days (D3), 4 days (D4), 5 days (D5), and 7 days(D7) (Figure 1 and Supplementary Table S1). Three biologicalreplicates were collected per time point (seven) and per diet(two), with each biological replicate consisting of 30 guts. Thetotal number of sample replicates for the gut was 42. Bacteriocytesamples were collected at D3, D4, D5, and D7. Earlier stagesdid not yield sufficient RNA for subsequent processing andmicroarrays. Three biological replicates were collected per timepoint (four) and per diet (two) with each biological replicatecontaining between 800 and 1000 bacteriocytes. The total numberof sample replicates for the bacteriocytes was 24 (Figure 1 andSupplementary Table S1). All dissected tissues were placed inRNAlater R© (Thermo Fisher Scientific, Waltham, MA, United
Frontiers in Physiology | www.frontiersin.org 3 October 2018 | Volume 9 | Article 1498
fphys-09-01498 October 23, 2018 Time: 14:25 # 4
Colella et al. Nutritional Stress Response in the Pea Aphid
FIGURE 1 | (A) Experimental design for the overall assessment of the Acyrthosiphon pisum performance and tissue-specific gene expression changes underlyingthe response to a tyrosine and phenylalanine depleted diet. (B) Schematic illustration of the artificial diet feeding chamber.
States) and stored at −80◦C. Further details on sample numbersand size are provided in Supplementary Table S1.
RNA ExtractionTotal RNA was prepared using the RNeasy Mini kit (Qiagen,Hilden, Germany). Total RNA concentration and qualitywere initially checked using the NanoDrop R© ND-1000Spectrophotometer (Nanodrop Technologies, Wilmington,DE, United States) and samples had to meet the following qualityparameters: A260/A280 ≥ 1.8 and A260/A230 ≥ 1.8, in orderto be used in the subsequent analysis. The integrity of the RNAsamples was checked using the Agilent RNA 6000 Nano Kit andthe Agilent 2100 Bioanalyzer (Agilent Technologies, Santa Clara,CA, United States). Only good quality samples responding to thedescribed criteria were used for subsequent analyses.
Amplification of mRNA and cDNASynthesisMicroarrays require RNA quantities that exceed what can beisolated from 30 guts or 800–1000 bacteriocytes. Therefore, weapplied a commonly used preparatory step for microarrays,i.e., linear amplification of RNA. Linear amplification maintains
the relative amounts of existing mRNAs in a cell or tissuewithout skewing the representation of individual mRNAs in acomplex mixture (Schneider et al., 2004). The MessageAmpTM
II aRNA Amplification kit (Thermo Fisher Scientific) wasused following the manufacturer’s instructions. Based onthe total RNA quantification profiles, amplifications of thebacteriocyte samples were conducted on RNA quantities twotimes greater than for gut samples (0.5 µg) to compensatefor the twofold higher prokaryotic rRNA concentrations(16S/23S rRNA peaks) relative to eukaryotic rRNA (18S/28S) inbacteriocytes.
The amplified RNA (aRNA) was used to prepare doublestranded cDNA with the Superscript II kit (ThermoFisher Scientific), as recommended by NimbleGen in theNimbleChipTM Arrays User’s Guide for gene expressionanalysis. Starting with 5 µg of aRNA, the samples were processedaccording to the manufacturer’s instructions, including thesefour steps: (i) initial cDNA synthesis using random primers,(ii) second strand synthesis, (iii) RNase A clean-up, and (iv)cDNA precipitation. For each sample, the integrity of the aRNAand cDNA was checked for possible degradation using theAgilent RNA 6000 Nano Kit on the Agilent 2100 Bioanalyzer.Only good quality samples were retained for the microarray
Frontiers in Physiology | www.frontiersin.org 4 October 2018 | Volume 9 | Article 1498
fphys-09-01498 October 23, 2018 Time: 14:25 # 5
Colella et al. Nutritional Stress Response in the Pea Aphid
experiments performed by Roche NimbleGen (Madison, WI,United States).
Microarray Experiments and DataCollectionThe “INRA-BF2I_A.pisum_Nimblegen-ACYPI_4x72k_v1” mic-roarray for the pea aphid was developed in collaboration withRoche NimbleGen using the pea aphid genome v1.0 assembly(International Aphid Genomics Consortium, 2010). ThisNimbleGen 385K 4-plex (4 × 72 000 probes) high-density arraycan accommodate 4 samples that are hybridized onto a sectionof the array containing 72 000 60-mers oligonucleotide probes,representing 24 011 pea aphid transcripts (corresponding to23855 genes) as described in Rabatel et al. (2013). The microarraydesign can be found in the ArrayExpress database (AccessionNo. A-MEXP-1999). Labeling (using the NimbleGen One-ColorDNA Labeling Kits and Cy3 Random Nonamers), hybridizationon the arrays (at 42◦C for 16–20 h) and scanning (using MS 200Microarray Scanner and the MS 200 Data Collection Software)were carried out by Roche NimbleGen, as described in theNimbleGen arrays user’s guide for gene expression arrays. All thetranscriptomic data obtained are available in the ArrayExpressdatabase (Accession No. E-MTAB-4456).
Microarray Data Analysis: Quality ControlA first global data analysis using principal component analysis(PCA) revealed that one of the three gut replicates from aphidsreared on the AP3 diet for 3 days (Gut-AP3_D3-1) was aberrant(Supplementary Figure S1). This replicate did not clusterwith either gut or bacteriocyte samples, and is most likely anincorrectly isolated tissue or a contaminant. It was thereforeremoved from the subsequent analyses. In order to keep asymmetric design for analysis purposes, one replicate at the sametime point from gut in aphids reared on YFØ diet was alsoremoved (Gut-YFØ_D3-1). Note that this sample did cluster withother gut samples (Supplementary Figure S1). Thus, in the finaldifferential expression analysis for the time-point D3, for gutsamples, two replicates were used both on the control (AP3) andTyr/Phe depleted diet (YFØ) samples. 40 gut samples and 24bacteriocyte samples (total 64) were used for further analyses.
Microarray Data Analysis: DifferentialExpressionMicroarray data were normalized, using the RMA method(Irizarry et al., 2003), and then transformed into log2 forsubsequent analyses. Differentially expressed genes (DEGs) werepredicted using one-way between groups ANOVA analyses[Limma package (Ritchie et al., 2015) from the R Bioconductorproject v3.2]. Moderated t-test P-values were adjusted using afalse discovery rate [FDR, (Dudoit et al., 2003)] threshold of 0.05.Tissue-enriched genes were detected using the control diet (AP3)samples and only the genes harboring a |log2(Fold-Change)| > 2were kept for further analyses. Pairwise comparisons betweenthe two diets at each time point and for each tissue werealso performed to identify the DEGs in response to a Tyr andPhe depleted diet. For this contrast, no additional filtering was
performed. Interactive graphs were obtained through Cytoscapev3.5.0 (Shannon et al., 2003). All PCA were performed using theR ADE4 package (Dray and Dufour, 2007).
Microarray Data Analysis: FunctionalAnnotation AnalysisAs the microarray was originally designed on the v1.0 of thepea aphid A. pisum genome, we filtered the dataset basedon the recently released pea aphid genome v2.0 assembly toexclude both outdated genes and genes with cross-hybridizingprobes using PatMaN (Prüfer et al., 2008) with a threshold ofthree mismatches. Using this filter, 13 668 genes were excludedamong which 13 646 (99.8%) that were unannotated. Onlythe remaining genes (10 343) were taken into account forthe functional annotation analysis. The Gene Ontology (GO)analysis was first performed using the pea aphid annotationv2.1b. In order to have more detailed results and given themore extensive functional annotation of genes in Drosophilamelanogaster, we decided to perform a second GO analysis usingthe corresponding D. melanogaster genes for each differentiallyexpressed A. pisum gene. For simplicity’s sake, we refer to thesegenes as “putative homologs” throughout the text. To performthis analysis, we retrieved putative D. melanogaster homologsfor each differentially expressed A. pisum gene using BLASTP(Altschul et al., 1990) and we carried out a GO analysis basedon the annotations collected in FlyBase version FB2017_01(Gramates et al., 2017). Enrichment analysis of the DEG sets wasperformed using BINGO v3.0.3 (Maere et al., 2005) with an FDRthreshold of 0.01. Lists of enriched GO terms were further refinedusing REVIGO (Supek et al., 2011) with a similarity threshold of0.5 and the D. melanogaster database.
Microarray Data ValidationTo validate the transcriptional differences identified withthe microarray analyses, we conducted quantitative reversetranscription-PCR (qRT-PCR) experiments for a selection ofgenes (seven) corresponding to different functional classesand spanning a broad range of expression differences asdetermined with the microarrays. Three genes were differentiallyexpressed in the gut samples (ACYPI000653, ACYPI001701, andACYPI010105), three genes were differentially expressed in thebacteriocytes (ACYPI003338, ACYPI004647, and ACYPI006800),and one gene was differentially expressed in both tissues(ACYPI001281). Expression of these seven genes was assessedfor all the time points used in the microarray experiment (atotal number of 35 sample replicates for the guts and 16 samplereplicates for the bacteriocytes). Primers to target transcripts(Supplementary Table S2) were designed with the Oligo6software (Rychlik, 2007). For data normalization, two genes weretested in the different tissues and time-points analyzed: rpl7(ACYPI010200) and rpl32 (ACYPI000074). Real-time RT-PCRdata were analyzed using the BestKeeper© software tool (Pfafflet al., 2004) and the rpl7 gene was retained as the best candidatefor data normalization.
Internal standard curves were generated for each gene usingserial dilutions (from 2000 to 0.002 fg/µl) of purified PCR
Frontiers in Physiology | www.frontiersin.org 5 October 2018 | Volume 9 | Article 1498
fphys-09-01498 October 23, 2018 Time: 14:25 # 6
Colella et al. Nutritional Stress Response in the Pea Aphid
products amplified from a pool of cDNA. The PCR reaction toprepare the control sample for the standard curve was carriedout starting from 1 µl of reverse transcription product usingUptiTherm DNA Polymerase (Interchim, Montluçon, France),according to the manufacturer’s instructions.
qRT-PCR analyses were done following essentially the samestrategy described in Dallas et al. (2005). aRNA samples weretreated with DNase I (Promega, Madison, WI, United States)and reverse-transcribed in cDNA using the SuperScriptTM IIIFirst-Strand Synthesis System for RT-PCR (Thermo FisherScientific), with random primers and oligodT, according tothe manufacturer’s instructions. RT-PCR was performed witha LightCycler 480 Instrument (Roche Diagnostics, Basel,Switzerland) using either 2.5 µl of cDNA (at around 1.5 µg/µl),diluted at 1/5, or water (for negative control reactions) in a totalPCR reaction final volume of 10 µl. Quantitative RT-PCR datawere analyzed using the REST software1 (Pfaffl et al., 2002).
The correlation analysis between microarray and qRT-PCRdata was done with (i) a regression analysis using a linear model(R-squared of 0.8299; F = 210.8; d.f. = 42; P < 2.2 × 10⁻¹⁶), and(ii) a Pearson’s coefficient of determination.
Counting and Size Determination ofAphid BacteriocytesFor cell counting, bacteriocytes were surgically isolated fromthe abdomen of each individual aphid and counted at 25–40×
magnification with an MDG-17 stereomicroscope (Leica). Foreach time point and each artificial diet, a total number of 10aphids were analyzed. To determine their size, bacteriocyteswere collected with a micropipette and mounted on glassslides. Double spacers made from microscope coverslips, witha thickness of 170 µm each, were used to mount bacteriocytesfollowing the procedure we recently developed (Simonet et al.,2016a; 2018). The total space of 340 µm between microscopeslides and the coverslip covering the preparation exceeds themaximal diameter of bacteriocytes (ranging from 40 to 120 µm)thereby preventing any physical damage or deformation ofbacteriocytes. Bacteriocyte images were acquired and volumeswere calculated as previously described (Simonet et al., 2016a).At least seven aphids were analyzed for each time point andeach artificial diet. A total of 700 bacteriocytes were analyzed.To avoid bias, bacteriocyte counting and size determination wereperformed by three researchers in a blinded fashion.
RESULTS
Life History Traits of Aphids Reared on aTyr/Phe Depleted Artificial DietDifferent parameters of A. pisum performance were recorded asmetrics of aphid fitness: survival, adult weight and morphology,number of nymphs produced by the treated parthenogeneticmothers, timing of nymph production and nymph length andmorphology. Despite slight differences, aphid survival was not
1http://rest.gene-quantification.info/
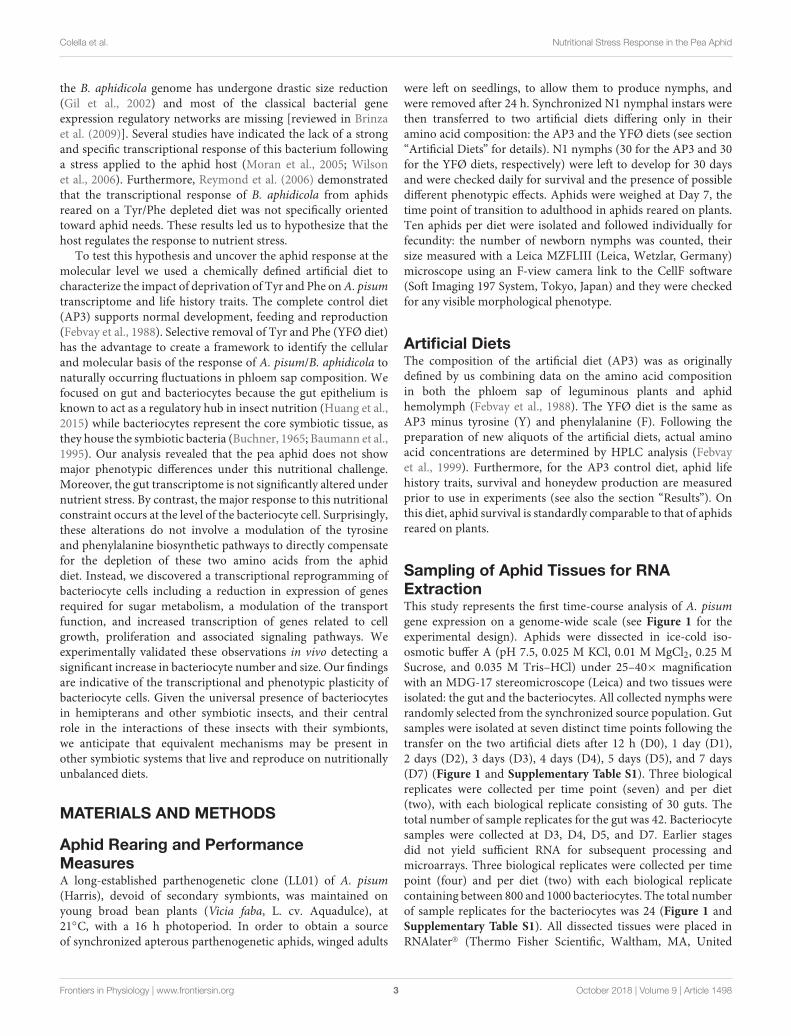
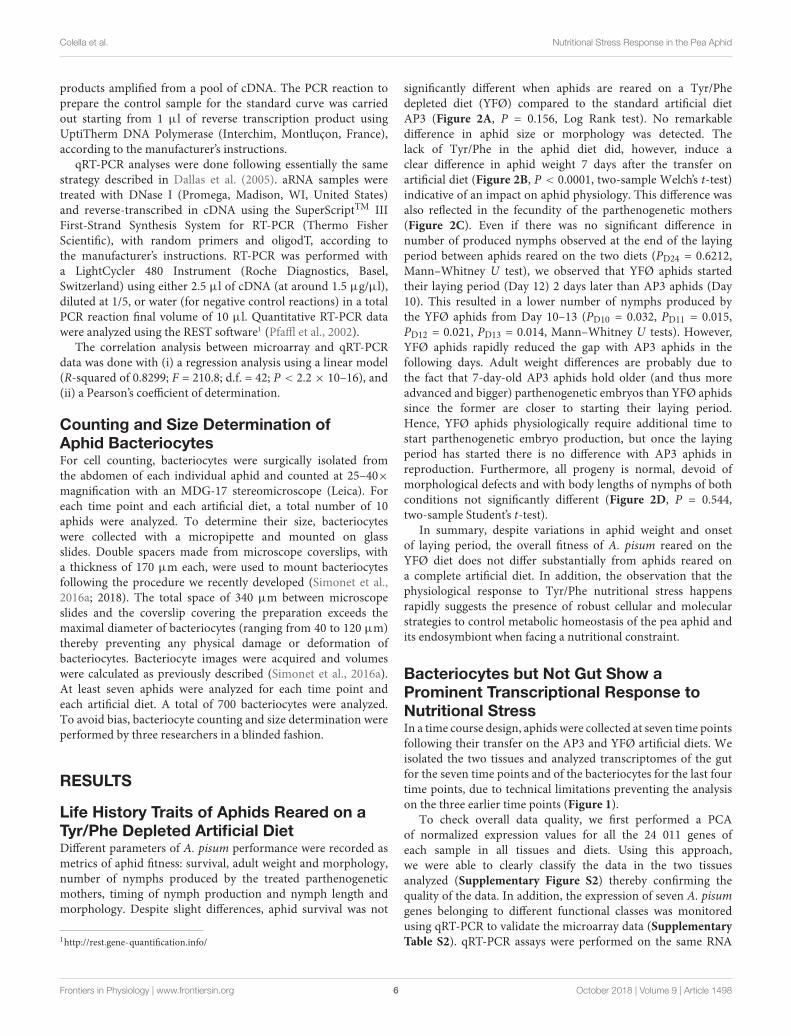
significantly different when aphids are reared on a Tyr/Phedepleted diet (YFØ) compared to the standard artificial dietAP3 (Figure 2A, P = 0.156, Log Rank test). No remarkabledifference in aphid size or morphology was detected. Thelack of Tyr/Phe in the aphid diet did, however, induce aclear difference in aphid weight 7 days after the transfer onartificial diet (Figure 2B, P < 0.0001, two-sample Welch’s t-test)indicative of an impact on aphid physiology. This difference wasalso reflected in the fecundity of the parthenogenetic mothers(Figure 2C). Even if there was no significant difference innumber of produced nymphs observed at the end of the layingperiod between aphids reared on the two diets (PD24 = 0.6212,Mann–Whitney U test), we observed that YFØ aphids startedtheir laying period (Day 12) 2 days later than AP3 aphids (Day10). This resulted in a lower number of nymphs produced bythe YFØ aphids from Day 10–13 (PD10 = 0.032, PD11 = 0.015,PD12 = 0.021, PD13 = 0.014, Mann–Whitney U tests). However,YFØ aphids rapidly reduced the gap with AP3 aphids in thefollowing days. Adult weight differences are probably due tothe fact that 7-day-old AP3 aphids hold older (and thus moreadvanced and bigger) parthenogenetic embryos than YFØ aphidssince the former are closer to starting their laying period.Hence, YFØ aphids physiologically require additional time tostart parthenogenetic embryo production, but once the layingperiod has started there is no difference with AP3 aphids inreproduction. Furthermore, all progeny is normal, devoid ofmorphological defects and with body lengths of nymphs of bothconditions not significantly different (Figure 2D, P = 0.544,two-sample Student’s t-test).
In summary, despite variations in aphid weight and onsetof laying period, the overall fitness of A. pisum reared on theYFØ diet does not differ substantially from aphids reared ona complete artificial diet. In addition, the observation that thephysiological response to Tyr/Phe nutritional stress happensrapidly suggests the presence of robust cellular and molecularstrategies to control metabolic homeostasis of the pea aphid andits endosymbiont when facing a nutritional constraint.
Bacteriocytes but Not Gut Show aProminent Transcriptional Response toNutritional StressIn a time course design, aphids were collected at seven time pointsfollowing their transfer on the AP3 and YFØ artificial diets. Weisolated the two tissues and analyzed transcriptomes of the gutfor the seven time points and of the bacteriocytes for the last fourtime points, due to technical limitations preventing the analysison the three earlier time points (Figure 1).
To check overall data quality, we first performed a PCAof normalized expression values for all the 24 011 genes ofeach sample in all tissues and diets. Using this approach,we were able to clearly classify the data in the two tissuesanalyzed (Supplementary Figure S2) thereby confirming thequality of the data. In addition, the expression of seven A. pisumgenes belonging to different functional classes was monitoredusing qRT-PCR to validate the microarray data (SupplementaryTable S2). qRT-PCR assays were performed on the same RNA
Frontiers in Physiology | www.frontiersin.org 6 October 2018 | Volume 9 | Article 1498
fphys-09-01498 October 23, 2018 Time: 14:25 # 7
Colella et al. Nutritional Stress Response in the Pea Aphid
FIGURE 2 | Impact of the tyrosine and phenylalanine depleted diet on aphid performances. (A) Survival analysis of A. pisum reared on two artificial diets: a completediet (AP3, blue) and a Tyr/Phe depleted diet (YFØ, yellow). Each diet group was composed of 30 aphids. Data were analyzed using Log Rank Test. (B) Effects of theYFØ diet on aphid weight 7 days after the transfer on artificial diets. Each diet group was composed of 30 aphids. Data were analyzed using Welch’s t-test andsignificant differences are indicated with asterisks (∗∗∗∗P ≤ 0.0001). (C) Cumulative number of progeny laid per aphid reared on the YFØ and AP3 diets. Results arereported as means (±SD) of 10 isolated individuals per diet. Data were analyzed by a Welch’s t-test and significant differences are indicated with asterisks(∗P ≤ 0.05). (D) Effects of the YFØ diet on the size of produced nymphs. A total of 43 and 29 nymphs were measured for the AP3 and YFØ diet, respectively. Datawere analyzed using Student’s t-test (ns, not significant).
samples used for the microarray experiment (all time pointsfrom the gut and bacteriocytes tissues of AP3 and YFØ aphids).A Pearson’s coefficient of determination of 0.91 (P< 2.2 × 10⁻¹⁶)was observed between the qRT-PCR and microarray datasetsshowing a high degree of reliability for the microarray results(Supplementary Figure S3 and Supplementary Table S3).
We next identified gut- and bacteriocyte-enriched genes usingdata from all time points of aphid samples reared on the completeAP3 artificial diet. Genes were considered tissue-enriched using
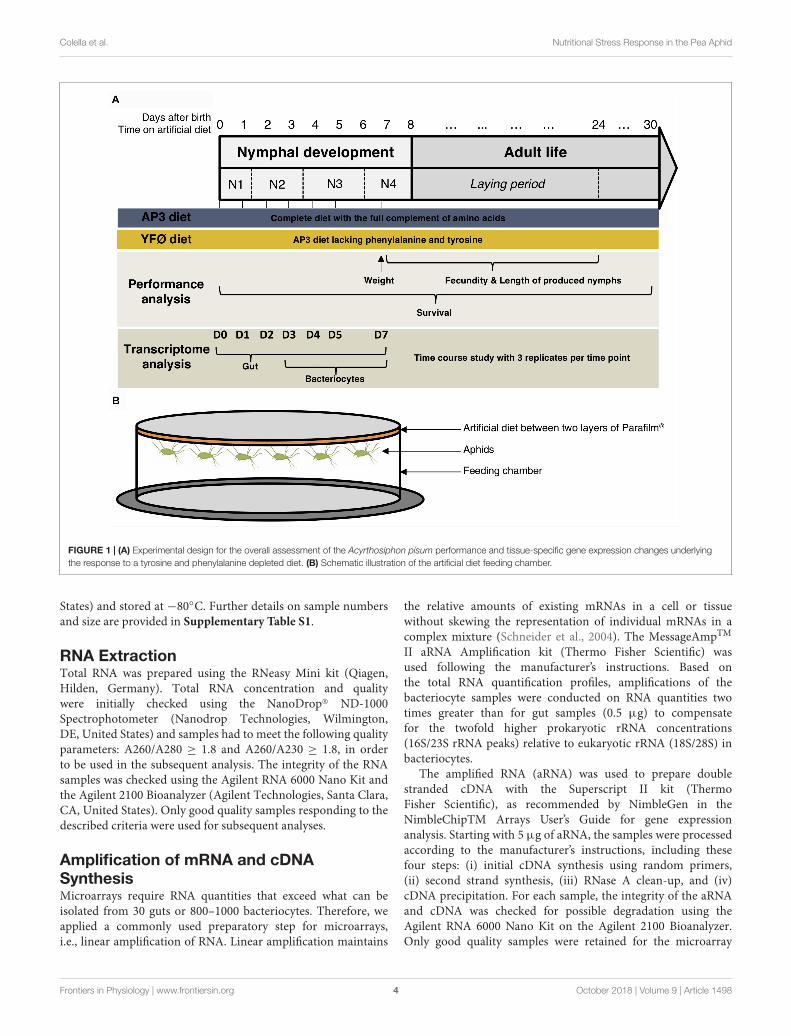
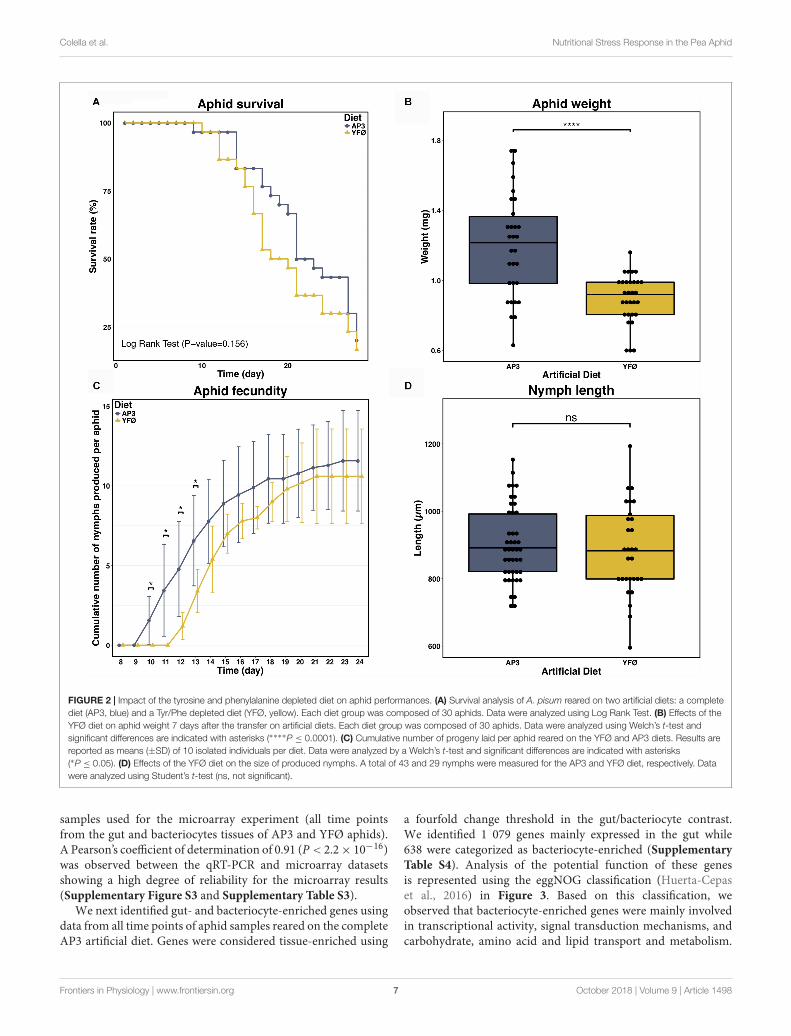
a fourfold change threshold in the gut/bacteriocyte contrast.We identified 1 079 genes mainly expressed in the gut while638 were categorized as bacteriocyte-enriched (SupplementaryTable S4). Analysis of the potential function of these genesis represented using the eggNOG classification (Huerta-Cepaset al., 2016) in Figure 3. Based on this classification, weobserved that bacteriocyte-enriched genes were mainly involvedin transcriptional activity, signal transduction mechanisms, andcarbohydrate, amino acid and lipid transport and metabolism.
Frontiers in Physiology | www.frontiersin.org 7 October 2018 | Volume 9 | Article 1498
fphys-09-01498 October 23, 2018 Time: 14:25 # 8
Colella et al. Nutritional Stress Response in the Pea Aphid
FIGURE 3 | eggNOG classification of the tissue-enriched genes. Genes were defined as being tissue-enriched using a fourfold change threshold in thegut/bacteriocyte contrast. 1 079 and 638 genes were categorized as tissue specific in aphid gut and bacteriocytes, respectively.
The latter highlighting the pivotal role of the bacteriocytesin the symbiotic relationship between pea aphids and theirendosymbiotic bacteria Buchnera. Transcriptional profiling ofaphid gut identified genes associated with energy production andconversion, cytoskeleton, intracellular trafficking, secretion andvesicular transport are in line with its role in nutrient absorption.Note that a large proportion of genes for the two tissues arepoorly annotated and were therefore categorized in a class named“function unknown.”
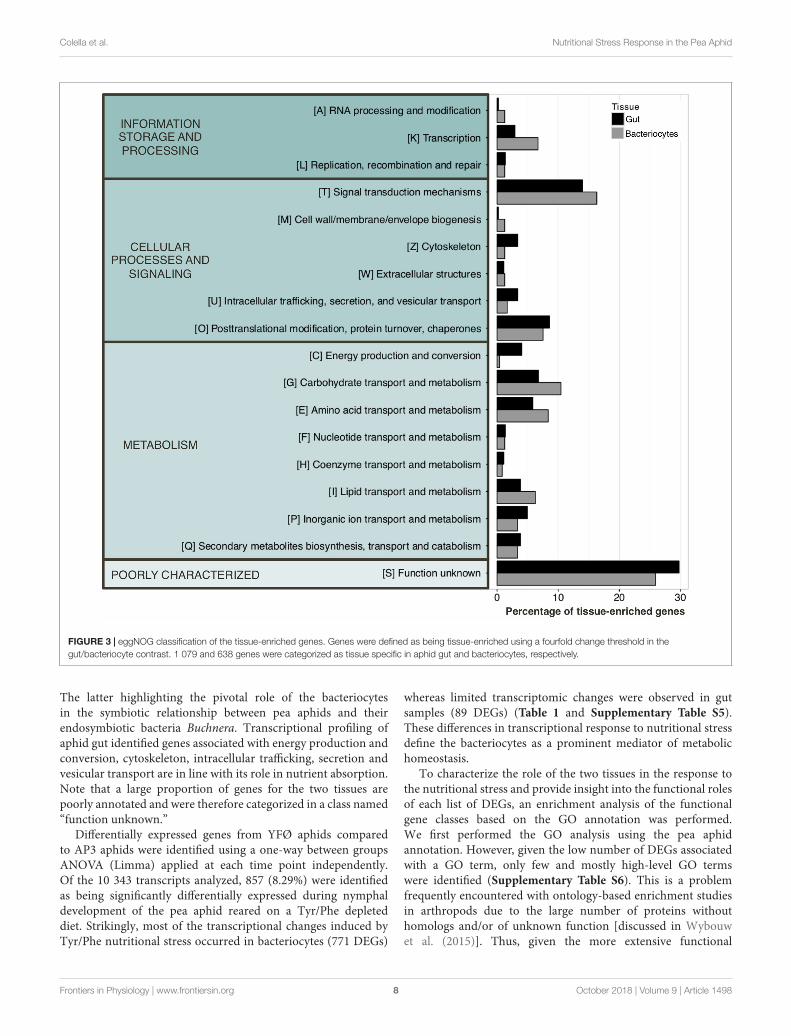
Differentially expressed genes from YFØ aphids comparedto AP3 aphids were identified using a one-way between groupsANOVA (Limma) applied at each time point independently.Of the 10 343 transcripts analyzed, 857 (8.29%) were identifiedas being significantly differentially expressed during nymphaldevelopment of the pea aphid reared on a Tyr/Phe depleteddiet. Strikingly, most of the transcriptional changes induced byTyr/Phe nutritional stress occurred in bacteriocytes (771 DEGs)
whereas limited transcriptomic changes were observed in gutsamples (89 DEGs) (Table 1 and Supplementary Table S5).These differences in transcriptional response to nutritional stressdefine the bacteriocytes as a prominent mediator of metabolichomeostasis.
To characterize the role of the two tissues in the response tothe nutritional stress and provide insight into the functional rolesof each list of DEGs, an enrichment analysis of the functionalgene classes based on the GO annotation was performed.We first performed the GO analysis using the pea aphidannotation. However, given the low number of DEGs associatedwith a GO term, only few and mostly high-level GO termswere identified (Supplementary Table S6). This is a problemfrequently encountered with ontology-based enrichment studiesin arthropods due to the large number of proteins withouthomologs and/or of unknown function [discussed in Wybouwet al. (2015)]. Thus, given the more extensive functional
Frontiers in Physiology | www.frontiersin.org 8 October 2018 | Volume 9 | Article 1498
fphys-09-01498 October 23, 2018 Time: 14:25 # 9
Colella et al. Nutritional Stress Response in the Pea Aphid
TABLE 1 | Number of differentially expressed genes in aphids reared on a Tyr/Phe depleted diet (YFØ), in comparison to the control diet (AP3), for each tissue and eachtime-point.
Day of collection D0 D1 D2 D3 D4 D5 D7
Time on artificial diet 12 h 1 day 2 days 3 days 4 days 5 days 7 days
Gut Down-regulated genes 1 2 55 1 6 3 1
Up-regulated genes 3 0 8 0 1 4 8
Bacteriocytes Down-regulated genes 312 3 48 50
Up-regulated genes 262 3 114 14
annotation of genes in D. melanogaster, the GO analysis wascarried out using the putative D. melanogaster homologs for eachdifferentially expressed A. pisum gene (Supplementary TablesS7, S8). While the GO analysis on the pea aphid annotationretrieved only 372 unique GO terms from the 857 differentDEGs, the D. melanogaster GO analysis encompassed 1 978unique GO terms. This analysis of the functional gene classesrevealed that no significant GO term related to biological process,molecular function or cellular component was enriched for anyof the time points sampled from the gut tissue (SupplementaryTable S8) thus confirming the limited role of this tissue underTyr/Phe nutritional stress. Conversely, this analysis showed theimportance of the bacteriocytes with a total of 98 significantlyenriched GO terms (Supplementary Table S8).
Tyr/Phe Biosynthesis Is Not Regulated inthe BacteriocytesGiven that bacteriocytes together with B. aphidicola are essentialfor the production of tyrosine and phenylalanine, we firsthypothesized that the expression of the genes involved in theirbiosynthesis would be altered to accommodate for the lack of theamino acids. To test this hypothesis, we analyzed all identifiedbacteriocyte DEGs using the functional annotation available inthe ArthropodaCyc database (Baa-Puyoulet et al., 2016), whichalso contains the global reconstruction of the metabolic networkof the pea aphid.
The most striking result was the absence of genes related toTyr and Phe biosynthesis among the bacteriocyte DEGs (Table 2),despite the tyrosine biosynthetic pathway being crucial for thesymbiotic metabolism of the pea aphid and B. aphidicola (Wilsonet al., 2010) and for normal parthenogenetic development ofA. pisum (Rabatel et al., 2013; Simonet et al., 2016b). Additionally,none of the amino acid transporters expected to have animportant functional role in bacteriocytes (Price et al., 2014)was differentially regulated (Table 2). The fact that none of thegenes encoding for the Tyr/Phe biosynthetic enzymes and aminoacid transporters was differentially expressed in the bacteriocytes,suggests that A. pisum uses an alternative strategy to adapt itsphysiology to this nutritional constraint.
Transcriptional Reprogramming of theBacteriocytesIn bacteriocytes, the main transcriptional changes (574 DEGs,74.4%) were observed 3 days after the transfer on the artificialdiet whereas only 6 (0.78%), 164 (21.3%), and 65 (8.43%) were
detected at Day 4, 5, and 7, respectively (Table 1). Amongthese DEGs, only 34 were shared between two or three timepoints, whereas no DEG was shared between all four time points(Supplementary Table S5).
Interestingly, the GO enrichment analysis of the bacteriocyteDEGs revealed a temporal sequence of transcriptional eventsallowing theA. pisum/B. aphidicola symbiotic system to cope withTyr/Phe deprivation in the food.
The large proportion (28.6%) of up-regulated genesrelated to “chromatin remodeling,” “histone modifications,”and “transcription factors” at Day 3 is consistent with thelarge number of DEGs at this time point (Figure 4A andSupplementary Tables S7, S8). Chromatin remodelers areknown to regulate nucleosome dynamics to gate access tothe underlying DNA for replication, repair and transcription(Petty and Pillus, 2013). Among the up-regulated genesinvolved in chromatin remodeling, putative A. pisum homologs(ACYPI004047 and ACYPI008655) of the ISWI D. melanogastergene were identified as well as of the maleless (ACYPI002202) andmsl-3 (ACYPI000966) genes (Table 3). The ISWI gene encodes asubunit of the nucleosome remodeling factor (Tsukiyama et al.,1995). The maleless and msl-3 genes were first characterizedas core members of the chromatin remodeling male specificlethal (MSL) complex (Kuroda et al., 1991; Sural et al., 2008),but maleless is also known to play a role in other chromatinremodeling pathways (Cugusi et al., 2015). Consistent withchromatin remodeling, several “histone modification”-relatedgenes were up-regulated at Day 3 (Table 3) among whichthree putative homologs (ACYPI003204, ACYPI006180, andACYPI007884) of the histone deacetylase 1 (HDAC1). Histoneacetylation and deacetylation are dynamic processes with a keyrole in gene expression regulation by relaxing or compactingchromatin structure (Haberland et al., 2009). Together withchromatin remodeling and histone modification-associatedgenes, 23 transcription factors were differentially expressed atDay 3 (Table 3) suggesting that distinct transcriptional programsare activated following Tyr/Phe stress.
Aphids Cope With Tyr/Phe Deprivation byIncreasing Bacteriocyte Number andChanging Their PhenotypeAmong the differentially expressed transcription factors,three putative homologs (ACYPI008477, ACYPI009169, andACYPI39352) of the putzig D. melanogaster gene were identified(Table 3). The putzig gene encodes a Zn-finger protein
Frontiers in Physiology | www.frontiersin.org 9 October 2018 | Volume 9 | Article 1498
fphys-09-01498 October 23, 2018 Time: 14:25 # 10
Colella et al. Nutritional Stress Response in the Pea Aphid
TABLE 2 | Differential expression in bacteriocytes of selected genes involved in Tyr/Phe biosynthesis and amino acids transport between aphids reared on a depletedTyr/Phe artificial diet (YFØ) and aphids reared on a complete artificial diet (AP3).
Transcript name Description D3 D4 D5 D7
log2FC adj. P-value log2FC adj. P-value log2FC adj. P-value log2FC adj. P-value
Tyr/Phe biosynthesis
ACYPI000044-RA Aspartate transaminase −0.1033 0.7988 −0.1562 0.9998 0.2319 0.6522 −0.0141 0.9940
ACYPI003009-RA Aspartate transaminase −0.0697 0.9197 −0.1016 0.9998 0.2219 0.8255 0.0262 0.9930
ACYPI004243-RA Aspartate transaminase 0.3700 0.8505 0.7712 0.9998 −1.8012 0.2973 −1.6571 0.5150
ACYPI006213-RA Aspartate transaminase −0.1955 0.6242 −0.0210 0.9998 0.2946 0.5891 −0.3008 0.7465
ACYPI007803-RA Phenylalaninehydroxylase
−0.3444 0.4518 0.3296 0.9998 0.2917 0.7089 0.0855 0.9830
Amino acid transport
ACYPI000536-RA Bacteriocyte aminoacid transporter
−0.3052 0.5917 0.0228 0.9998 0.2186 0.8535 −0.0973 0.9830
ACYPI000550-RA Bacteriocyte aminoacid transporter
−0.2062 0.6387 −0.0122 0.9998 −0.0181 0.9927 −0.1004 0.9779
ACYPI001018-RA Bacteriocyte aminoacid transporter
−0.1246 0.6685 −0.0154 0.9998 0.1390 0.7791 −0.0383 0.9865
ACYPI008904-RA Bacteriocyte aminoacid transporter
−0.9696 0.4189 −0.2541 0.9998 1.3752 0.3617 −0.2160 0.9839
ACYPI008971-RA Bacteriocyte aminoacid transporter
0.3717 0.4871 −0.2028 0.9998 0.7704 0.1819 0.0784 0.9861
The full list of differentially expressed genes can be retrieved from Supplementary Table S5.
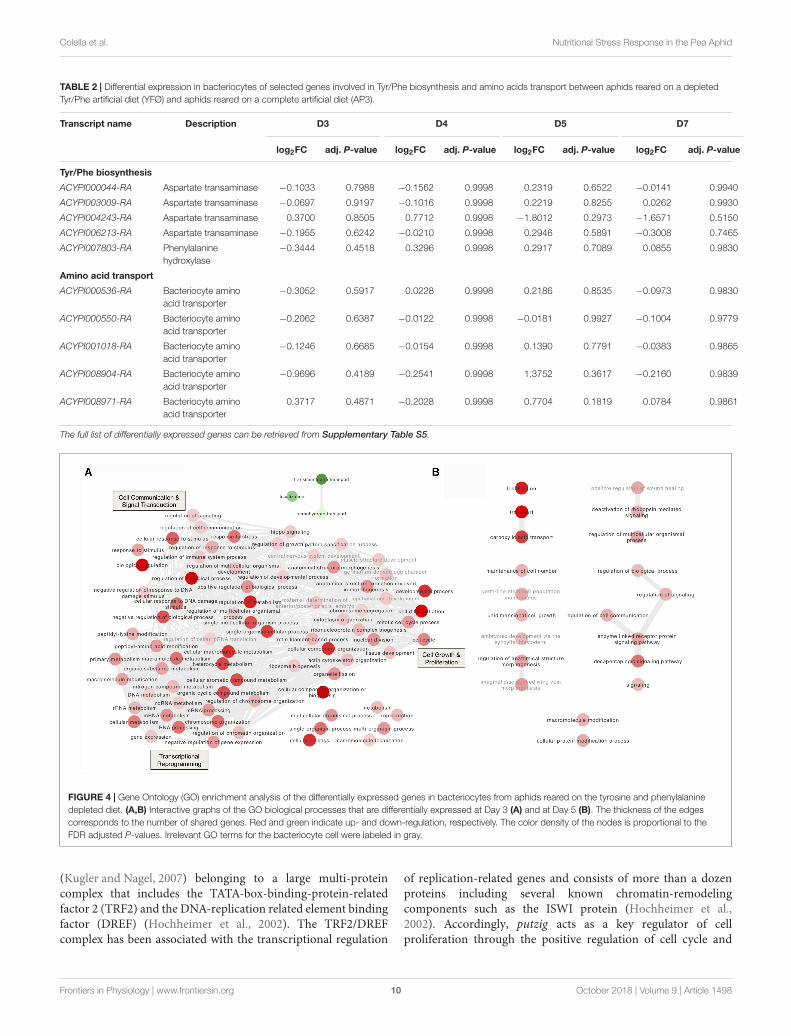
FIGURE 4 | Gene Ontology (GO) enrichment analysis of the differentially expressed genes in bacteriocytes from aphids reared on the tyrosine and phenylalaninedepleted diet. (A,B) Interactive graphs of the GO biological processes that are differentially expressed at Day 3 (A) and at Day 5 (B). The thickness of the edgescorresponds to the number of shared genes. Red and green indicate up- and down-regulation, respectively. The color density of the nodes is proportional to theFDR adjusted P-values. Irrelevant GO terms for the bacteriocyte cell were labeled in gray.
(Kugler and Nagel, 2007) belonging to a large multi-proteincomplex that includes the TATA-box-binding-protein-relatedfactor 2 (TRF2) and the DNA-replication related element bindingfactor (DREF) (Hochheimer et al., 2002). The TRF2/DREFcomplex has been associated with the transcriptional regulation
of replication-related genes and consists of more than a dozenproteins including several known chromatin-remodelingcomponents such as the ISWI protein (Hochheimer et al.,2002). Accordingly, putzig acts as a key regulator of cellproliferation through the positive regulation of cell cycle and
Frontiers in Physiology | www.frontiersin.org 10 October 2018 | Volume 9 | Article 1498
fphys-09-01498 October 23, 2018 Time: 14:25 # 11
Colella et al. Nutritional Stress Response in the Pea Aphid
TABLE 3 | Differential expression in bacteriocytes at Day 3 of selected genes likely involved in chromatin remodeling, histone modifications, and regulation of geneexpression.
Transcript name Drosophilamelanogaster
gene name
D. melanogastergene ID
Description log2FC adj. P-value
Chromatin remodeling
ACYPI004047-RA ISWI FBgn0011604 Chromatin-remodeling complexATPase chain ISWI
0.9220 0.0140
ACYPI008655-RA ISWI FBgn0011604 Chromatin-remodeling complexATPase chain ISWI
1.2261 0.0457
ACYPI002202-RA mle FBgn0002774 ATP-dependent RNA helicase A 1.8789 0.0313
ACYPI000966-RA msl-3 FBgn0002775 Male-specific lethal 0.6669 0.0254
Histone modifications
ACYPI003204-RA HDAC1 FBgn0015805 Histone deacetylase 0.7026 0.0460
ACYPI006180-RA HDAC1 FBgn0015805 Histone deacetylase 0.9776 0.0105
ACYPI007884-RA HDAC1 FBgn0015805 Histone deacetylase 0.9957 0.0075
Transcription factors
ACYPI20040-RA CG4050 FBgn0020312 Smile protein −1.0657 0.0300
ACYPI006800-RA CG4328 FBgn0036274 Homeobox domain; Zinc finger −1.1680 0.0380
ACYPI008133-RA fd64A FBgn0004895 Forkhead domain 64A −1.2241 0.0339
ACYPI38042-RA grau FBgn0001133 Grauzone −0.6974 0.0488
ACYPI25052-RA ham FBgn0045852 Hamlet −1.4526 0.0255
ACYPI48767-RA hng1 FBgn0034599 Hinge1 −0.9515 0.0320
ACYPI41460-RA nab FBgn0259986 NAB domain −1.7592 0.0138
ACYPI005162-RA pnr FBgn0003117 Pannier −1.2368 0.0125
ACYPI000963-RA rx FBgn0020617 Retinal homeobox −1.4330 0.0408
ACYPI005588-RA TH1 FBgn0039298 Negative elongation factor C/D −0.7142 0.0295
ACYPI003817-RA aatf FBgn0031851 Apoptosis antagonizing TF 0.9469 0.0125
ACYPI008254-RA alh FBgn0261238 Alhambra 0.7815 0.0112
ACYPI001952-RA atf6 FBgn0033010 Basic-leucine zipper TF-like 1.5478 0.0245
ACYPI39596-RA atf6 FBgn0033010 Basic-leucine zipper TF-like 1.6757 0.0041
ACYPI47906-RA atf6 FBgn0033010 Basic-leucine zipper TF-like 0.6290 0.0338
ACYPI46438-RA CG32813 FBgn0052813 Myb/SANT-like DNA-bindingdomain
1.0965 0.0240
ACYPI003796-RA da FBgn0267821 Daughterless 1.3464 0.0458
ACYPI51211-RA GATAd FBgn0032223 GATA transcription factor 0.7572 0.0082
ACYPI30875-RA onecut FBgn0028996 Onecut 0.8380 0.0245
ACYPI008477-RA pzg FBgn0259785 putzig-like 1.2298 0.0116
ACYPI009169-RA pzg FBgn0259785 putzig-like 1.4285 0.0055
ACYPI39352-RA pzg FBgn0259785 putzig-like 1.3891 0.0272
ACYPI008724-RA rept FBgn0040075 Reptin 0.8225 0.0281
The full list of differentially expressed genes can be retrieved from Supplementary Tables S7, S8.
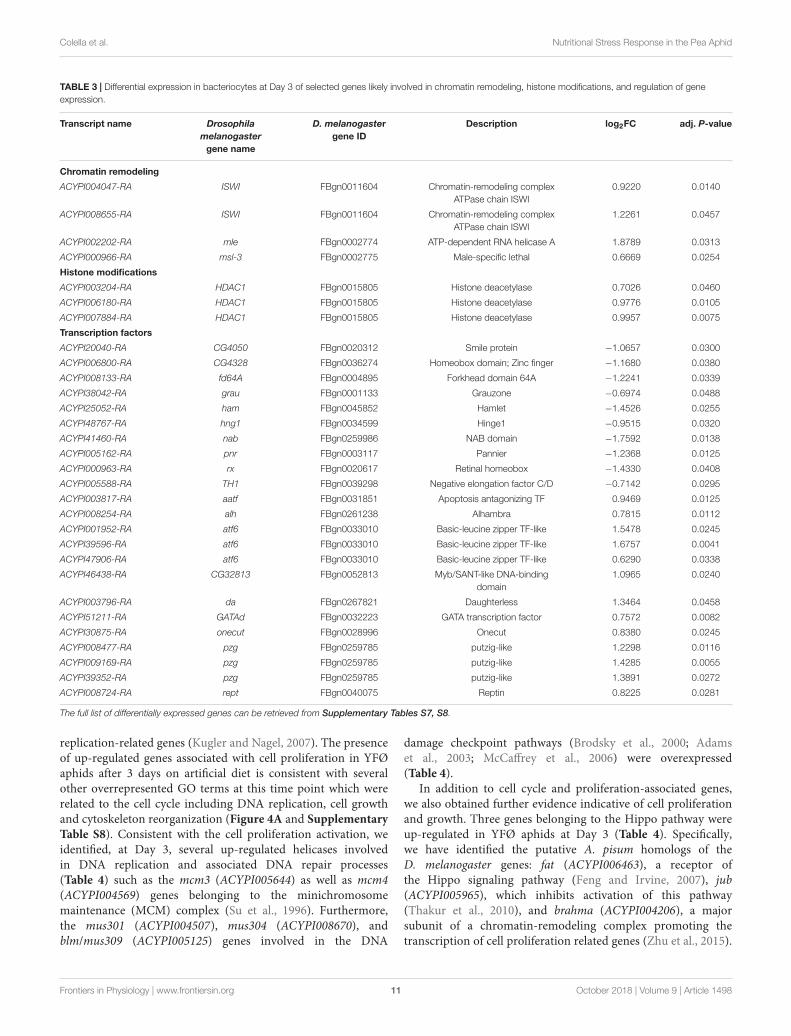
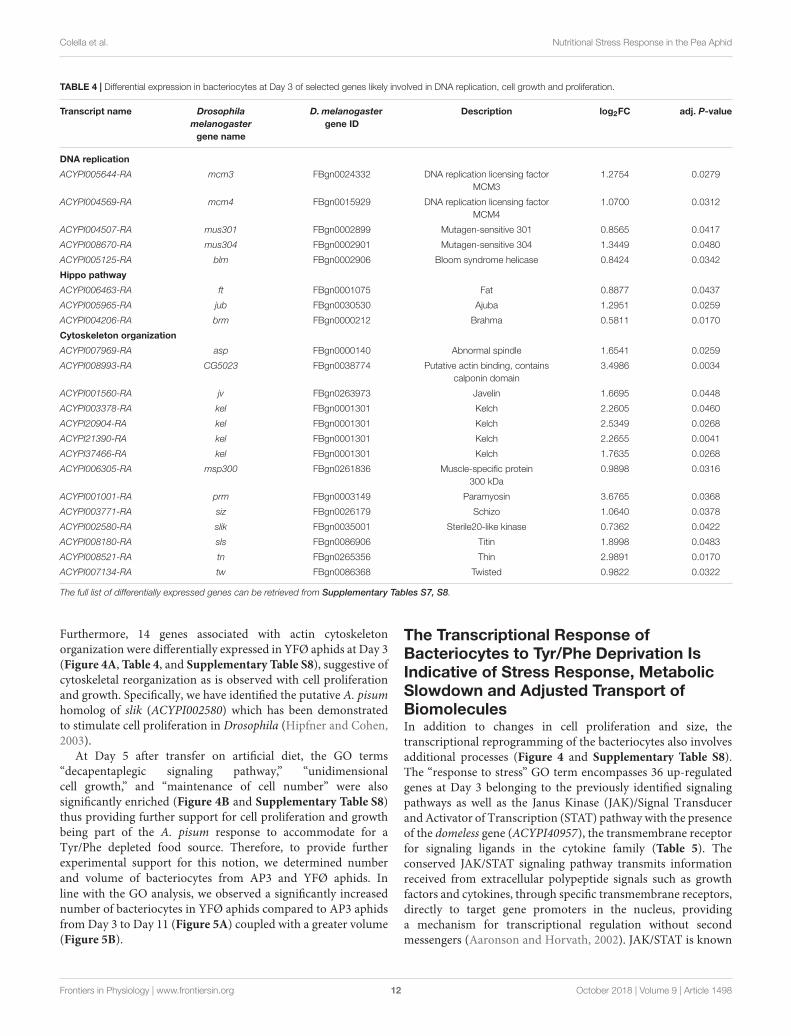
replication-related genes (Kugler and Nagel, 2007). The presenceof up-regulated genes associated with cell proliferation in YFØaphids after 3 days on artificial diet is consistent with severalother overrepresented GO terms at this time point which wererelated to the cell cycle including DNA replication, cell growthand cytoskeleton reorganization (Figure 4A and SupplementaryTable S8). Consistent with the cell proliferation activation, weidentified, at Day 3, several up-regulated helicases involvedin DNA replication and associated DNA repair processes(Table 4) such as the mcm3 (ACYPI005644) as well as mcm4(ACYPI004569) genes belonging to the minichromosomemaintenance (MCM) complex (Su et al., 1996). Furthermore,the mus301 (ACYPI004507), mus304 (ACYPI008670), andblm/mus309 (ACYPI005125) genes involved in the DNA
damage checkpoint pathways (Brodsky et al., 2000; Adamset al., 2003; McCaffrey et al., 2006) were overexpressed(Table 4).
In addition to cell cycle and proliferation-associated genes,we also obtained further evidence indicative of cell proliferationand growth. Three genes belonging to the Hippo pathway wereup-regulated in YFØ aphids at Day 3 (Table 4). Specifically,we have identified the putative A. pisum homologs of theD. melanogaster genes: fat (ACYPI006463), a receptor ofthe Hippo signaling pathway (Feng and Irvine, 2007), jub(ACYPI005965), which inhibits activation of this pathway(Thakur et al., 2010), and brahma (ACYPI004206), a majorsubunit of a chromatin-remodeling complex promoting thetranscription of cell proliferation related genes (Zhu et al., 2015).
Frontiers in Physiology | www.frontiersin.org 11 October 2018 | Volume 9 | Article 1498
fphys-09-01498 October 23, 2018 Time: 14:25 # 12
Colella et al. Nutritional Stress Response in the Pea Aphid
TABLE 4 | Differential expression in bacteriocytes at Day 3 of selected genes likely involved in DNA replication, cell growth and proliferation.
Transcript name Drosophilamelanogaster
gene name
D. melanogastergene ID
Description log2FC adj. P-value
DNA replication
ACYPI005644-RA mcm3 FBgn0024332 DNA replication licensing factorMCM3
1.2754 0.0279
ACYPI004569-RA mcm4 FBgn0015929 DNA replication licensing factorMCM4
1.0700 0.0312
ACYPI004507-RA mus301 FBgn0002899 Mutagen-sensitive 301 0.8565 0.0417
ACYPI008670-RA mus304 FBgn0002901 Mutagen-sensitive 304 1.3449 0.0480
ACYPI005125-RA blm FBgn0002906 Bloom syndrome helicase 0.8424 0.0342
Hippo pathway
ACYPI006463-RA ft FBgn0001075 Fat 0.8877 0.0437
ACYPI005965-RA jub FBgn0030530 Ajuba 1.2951 0.0259
ACYPI004206-RA brm FBgn0000212 Brahma 0.5811 0.0170
Cytoskeleton organization
ACYPI007969-RA asp FBgn0000140 Abnormal spindle 1.6541 0.0259
ACYPI008993-RA CG5023 FBgn0038774 Putative actin binding, containscalponin domain
3.4986 0.0034
ACYPI001560-RA jv FBgn0263973 Javelin 1.6695 0.0448
ACYPI003378-RA kel FBgn0001301 Kelch 2.2605 0.0460
ACYPI20904-RA kel FBgn0001301 Kelch 2.5349 0.0268
ACYPI21390-RA kel FBgn0001301 Kelch 2.2655 0.0041
ACYPI37466-RA kel FBgn0001301 Kelch 1.7635 0.0268
ACYPI006305-RA msp300 FBgn0261836 Muscle-specific protein300 kDa
0.9898 0.0316
ACYPI001001-RA prm FBgn0003149 Paramyosin 3.6765 0.0368
ACYPI003771-RA siz FBgn0026179 Schizo 1.0640 0.0378
ACYPI002580-RA slik FBgn0035001 Sterile20-like kinase 0.7362 0.0422
ACYPI008180-RA sls FBgn0086906 Titin 1.8998 0.0483
ACYPI008521-RA tn FBgn0265356 Thin 2.9891 0.0170
ACYPI007134-RA tw FBgn0086368 Twisted 0.9822 0.0322
The full list of differentially expressed genes can be retrieved from Supplementary Tables S7, S8.
Furthermore, 14 genes associated with actin cytoskeletonorganization were differentially expressed in YFØ aphids at Day 3(Figure 4A, Table 4, and Supplementary Table S8), suggestive ofcytoskeletal reorganization as is observed with cell proliferationand growth. Specifically, we have identified the putative A. pisumhomolog of slik (ACYPI002580) which has been demonstratedto stimulate cell proliferation in Drosophila (Hipfner and Cohen,2003).
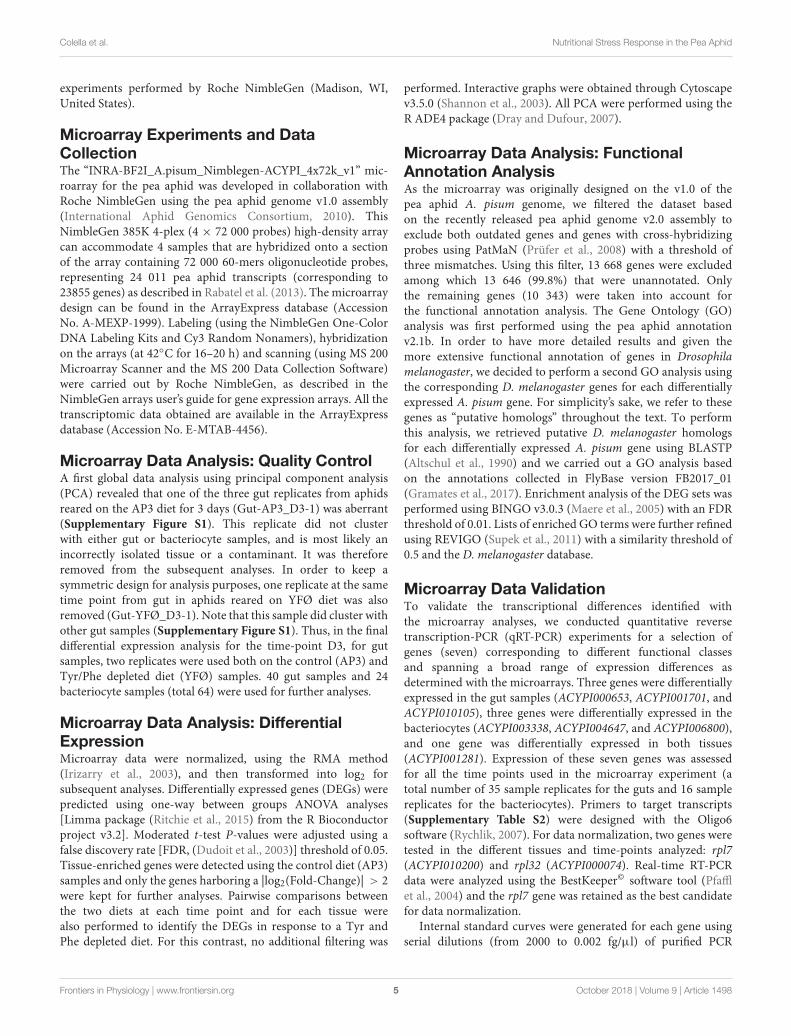
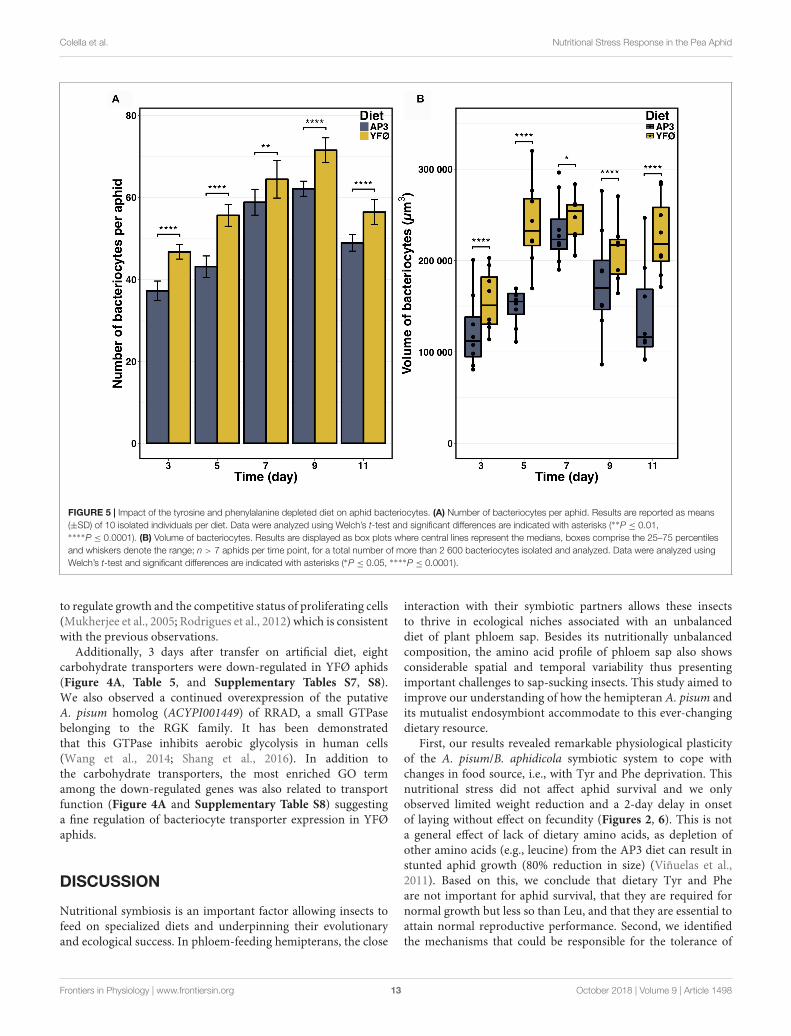
At Day 5 after transfer on artificial diet, the GO terms“decapentaplegic signaling pathway,” “unidimensionalcell growth,” and “maintenance of cell number” were alsosignificantly enriched (Figure 4B and Supplementary Table S8)thus providing further support for cell proliferation and growthbeing part of the A. pisum response to accommodate for aTyr/Phe depleted food source. Therefore, to provide furtherexperimental support for this notion, we determined numberand volume of bacteriocytes from AP3 and YFØ aphids. Inline with the GO analysis, we observed a significantly increasednumber of bacteriocytes in YFØ aphids compared to AP3 aphidsfrom Day 3 to Day 11 (Figure 5A) coupled with a greater volume(Figure 5B).
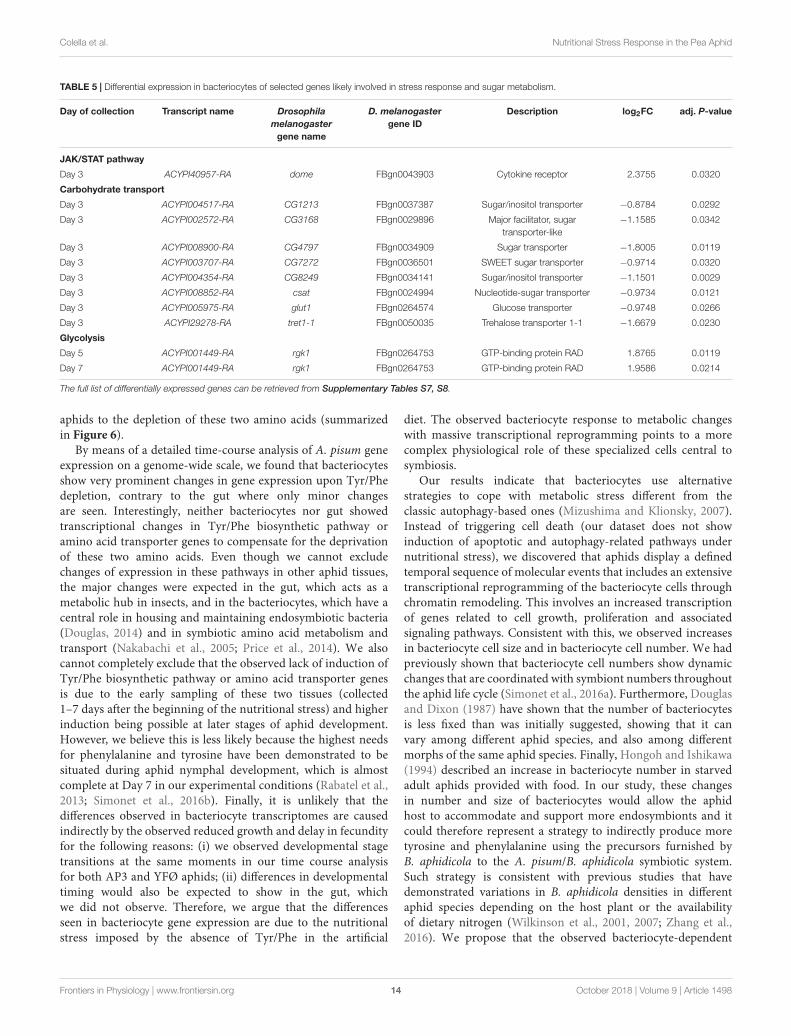
The Transcriptional Response ofBacteriocytes to Tyr/Phe Deprivation IsIndicative of Stress Response, MetabolicSlowdown and Adjusted Transport ofBiomoleculesIn addition to changes in cell proliferation and size, thetranscriptional reprogramming of the bacteriocytes also involvesadditional processes (Figure 4 and Supplementary Table S8).The “response to stress” GO term encompasses 36 up-regulatedgenes at Day 3 belonging to the previously identified signalingpathways as well as the Janus Kinase (JAK)/Signal Transducerand Activator of Transcription (STAT) pathway with the presenceof the domeless gene (ACYPI40957), the transmembrane receptorfor signaling ligands in the cytokine family (Table 5). Theconserved JAK/STAT signaling pathway transmits informationreceived from extracellular polypeptide signals such as growthfactors and cytokines, through specific transmembrane receptors,directly to target gene promoters in the nucleus, providinga mechanism for transcriptional regulation without secondmessengers (Aaronson and Horvath, 2002). JAK/STAT is known
Frontiers in Physiology | www.frontiersin.org 12 October 2018 | Volume 9 | Article 1498
fphys-09-01498 October 23, 2018 Time: 14:25 # 13
Colella et al. Nutritional Stress Response in the Pea Aphid
FIGURE 5 | Impact of the tyrosine and phenylalanine depleted diet on aphid bacteriocytes. (A) Number of bacteriocytes per aphid. Results are reported as means(±SD) of 10 isolated individuals per diet. Data were analyzed using Welch’s t-test and significant differences are indicated with asterisks (∗∗P ≤ 0.01,∗∗∗∗P ≤ 0.0001). (B) Volume of bacteriocytes. Results are displayed as box plots where central lines represent the medians, boxes comprise the 25–75 percentilesand whiskers denote the range; n > 7 aphids per time point, for a total number of more than 2 600 bacteriocytes isolated and analyzed. Data were analyzed usingWelch’s t-test and significant differences are indicated with asterisks (∗P ≤ 0.05, ∗∗∗∗P ≤ 0.0001).
to regulate growth and the competitive status of proliferating cells(Mukherjee et al., 2005; Rodrigues et al., 2012) which is consistentwith the previous observations.
Additionally, 3 days after transfer on artificial diet, eightcarbohydrate transporters were down-regulated in YFØ aphids(Figure 4A, Table 5, and Supplementary Tables S7, S8).We also observed a continued overexpression of the putativeA. pisum homolog (ACYPI001449) of RRAD, a small GTPasebelonging to the RGK family. It has been demonstratedthat this GTPase inhibits aerobic glycolysis in human cells(Wang et al., 2014; Shang et al., 2016). In addition tothe carbohydrate transporters, the most enriched GO termamong the down-regulated genes was also related to transportfunction (Figure 4A and Supplementary Table S8) suggestinga fine regulation of bacteriocyte transporter expression in YFØaphids.
DISCUSSION
Nutritional symbiosis is an important factor allowing insects tofeed on specialized diets and underpinning their evolutionaryand ecological success. In phloem-feeding hemipterans, the close
interaction with their symbiotic partners allows these insectsto thrive in ecological niches associated with an unbalanceddiet of plant phloem sap. Besides its nutritionally unbalancedcomposition, the amino acid profile of phloem sap also showsconsiderable spatial and temporal variability thus presentingimportant challenges to sap-sucking insects. This study aimed toimprove our understanding of how the hemipteran A. pisum andits mutualist endosymbiont accommodate to this ever-changingdietary resource.
First, our results revealed remarkable physiological plasticityof the A. pisum/B. aphidicola symbiotic system to cope withchanges in food source, i.e., with Tyr and Phe deprivation. Thisnutritional stress did not affect aphid survival and we onlyobserved limited weight reduction and a 2-day delay in onsetof laying without effect on fecundity (Figures 2, 6). This is nota general effect of lack of dietary amino acids, as depletion ofother amino acids (e.g., leucine) from the AP3 diet can result instunted aphid growth (80% reduction in size) (Viñuelas et al.,2011). Based on this, we conclude that dietary Tyr and Pheare not important for aphid survival, that they are required fornormal growth but less so than Leu, and that they are essential toattain normal reproductive performance. Second, we identifiedthe mechanisms that could be responsible for the tolerance of
Frontiers in Physiology | www.frontiersin.org 13 October 2018 | Volume 9 | Article 1498
fphys-09-01498 October 23, 2018 Time: 14:25 # 14
Colella et al. Nutritional Stress Response in the Pea Aphid
TABLE 5 | Differential expression in bacteriocytes of selected genes likely involved in stress response and sugar metabolism.
Day of collection Transcript name Drosophilamelanogaster
gene name
D. melanogastergene ID
Description log2FC adj. P-value
JAK/STAT pathway
Day 3 ACYPI40957-RA dome FBgn0043903 Cytokine receptor 2.3755 0.0320
Carbohydrate transport
Day 3 ACYPI004517-RA CG1213 FBgn0037387 Sugar/inositol transporter −0.8784 0.0292
Day 3 ACYPI002572-RA CG3168 FBgn0029896 Major facilitator, sugartransporter-like
−1.1585 0.0342
Day 3 ACYPI008900-RA CG4797 FBgn0034909 Sugar transporter −1.8005 0.0119
Day 3 ACYPI003707-RA CG7272 FBgn0036501 SWEET sugar transporter −0.9714 0.0320
Day 3 ACYPI004354-RA CG8249 FBgn0034141 Sugar/inositol transporter −1.1501 0.0029
Day 3 ACYPI008852-RA csat FBgn0024994 Nucleotide-sugar transporter −0.9734 0.0121
Day 3 ACYPI005975-RA glut1 FBgn0264574 Glucose transporter −0.9748 0.0266
Day 3 ACYPI29278-RA tret1-1 FBgn0050035 Trehalose transporter 1-1 −1.6679 0.0230
Glycolysis
Day 5 ACYPI001449-RA rgk1 FBgn0264753 GTP-binding protein RAD 1.8765 0.0119
Day 7 ACYPI001449-RA rgk1 FBgn0264753 GTP-binding protein RAD 1.9586 0.0214
The full list of differentially expressed genes can be retrieved from Supplementary Tables S7, S8.
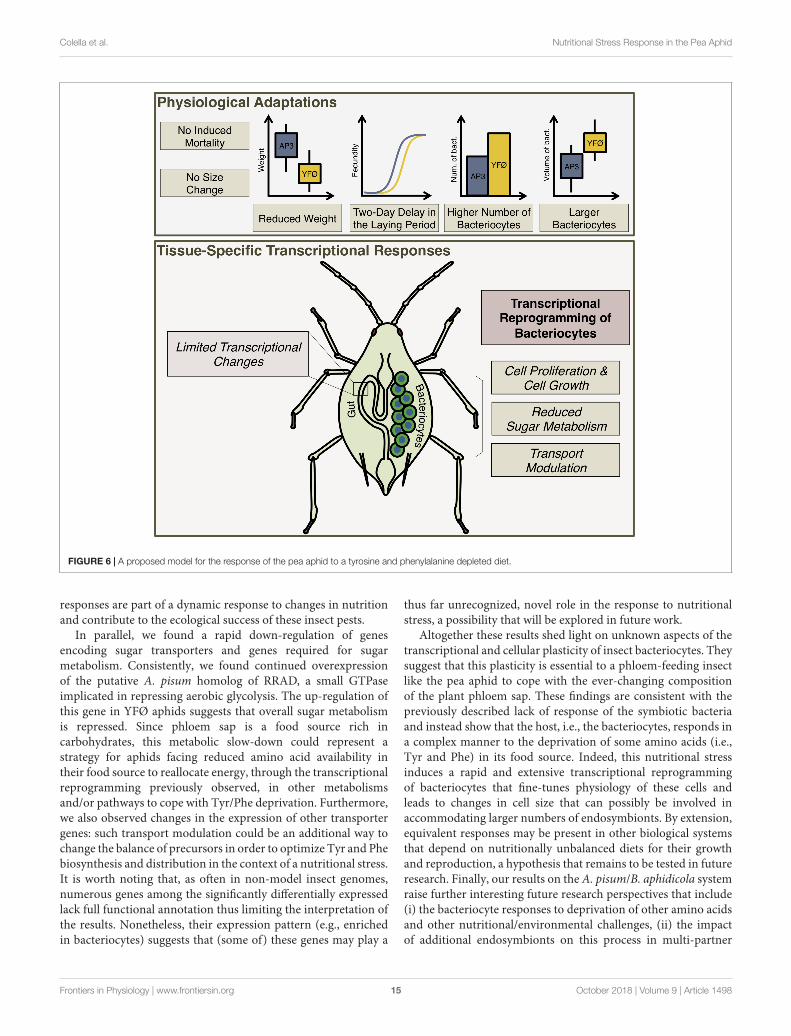
aphids to the depletion of these two amino acids (summarizedin Figure 6).
By means of a detailed time-course analysis of A. pisum geneexpression on a genome-wide scale, we found that bacteriocytesshow very prominent changes in gene expression upon Tyr/Phedepletion, contrary to the gut where only minor changesare seen. Interestingly, neither bacteriocytes nor gut showedtranscriptional changes in Tyr/Phe biosynthetic pathway oramino acid transporter genes to compensate for the deprivationof these two amino acids. Even though we cannot excludechanges of expression in these pathways in other aphid tissues,the major changes were expected in the gut, which acts as ametabolic hub in insects, and in the bacteriocytes, which have acentral role in housing and maintaining endosymbiotic bacteria(Douglas, 2014) and in symbiotic amino acid metabolism andtransport (Nakabachi et al., 2005; Price et al., 2014). We alsocannot completely exclude that the observed lack of induction ofTyr/Phe biosynthetic pathway or amino acid transporter genesis due to the early sampling of these two tissues (collected1–7 days after the beginning of the nutritional stress) and higherinduction being possible at later stages of aphid development.However, we believe this is less likely because the highest needsfor phenylalanine and tyrosine have been demonstrated to besituated during aphid nymphal development, which is almostcomplete at Day 7 in our experimental conditions (Rabatel et al.,2013; Simonet et al., 2016b). Finally, it is unlikely that thedifferences observed in bacteriocyte transcriptomes are causedindirectly by the observed reduced growth and delay in fecundityfor the following reasons: (i) we observed developmental stagetransitions at the same moments in our time course analysisfor both AP3 and YFØ aphids; (ii) differences in developmentaltiming would also be expected to show in the gut, whichwe did not observe. Therefore, we argue that the differencesseen in bacteriocyte gene expression are due to the nutritionalstress imposed by the absence of Tyr/Phe in the artificial
diet. The observed bacteriocyte response to metabolic changeswith massive transcriptional reprogramming points to a morecomplex physiological role of these specialized cells central tosymbiosis.
Our results indicate that bacteriocytes use alternativestrategies to cope with metabolic stress different from theclassic autophagy-based ones (Mizushima and Klionsky, 2007).Instead of triggering cell death (our dataset does not showinduction of apoptotic and autophagy-related pathways undernutritional stress), we discovered that aphids display a definedtemporal sequence of molecular events that includes an extensivetranscriptional reprogramming of the bacteriocyte cells throughchromatin remodeling. This involves an increased transcriptionof genes related to cell growth, proliferation and associatedsignaling pathways. Consistent with this, we observed increasesin bacteriocyte cell size and in bacteriocyte cell number. We hadpreviously shown that bacteriocyte cell numbers show dynamicchanges that are coordinated with symbiont numbers throughoutthe aphid life cycle (Simonet et al., 2016a). Furthermore, Douglasand Dixon (1987) have shown that the number of bacteriocytesis less fixed than was initially suggested, showing that it canvary among different aphid species, and also among differentmorphs of the same aphid species. Finally, Hongoh and Ishikawa(1994) described an increase in bacteriocyte number in starvedadult aphids provided with food. In our study, these changesin number and size of bacteriocytes would allow the aphidhost to accommodate and support more endosymbionts and itcould therefore represent a strategy to indirectly produce moretyrosine and phenylalanine using the precursors furnished byB. aphidicola to the A. pisum/B. aphidicola symbiotic system.Such strategy is consistent with previous studies that havedemonstrated variations in B. aphidicola densities in differentaphid species depending on the host plant or the availabilityof dietary nitrogen (Wilkinson et al., 2001, 2007; Zhang et al.,2016). We propose that the observed bacteriocyte-dependent
Frontiers in Physiology | www.frontiersin.org 14 October 2018 | Volume 9 | Article 1498
fphys-09-01498 October 23, 2018 Time: 14:25 # 15
Colella et al. Nutritional Stress Response in the Pea Aphid
FIGURE 6 | A proposed model for the response of the pea aphid to a tyrosine and phenylalanine depleted diet.
responses are part of a dynamic response to changes in nutritionand contribute to the ecological success of these insect pests.
In parallel, we found a rapid down-regulation of genesencoding sugar transporters and genes required for sugarmetabolism. Consistently, we found continued overexpressionof the putative A. pisum homolog of RRAD, a small GTPaseimplicated in repressing aerobic glycolysis. The up-regulation ofthis gene in YFØ aphids suggests that overall sugar metabolismis repressed. Since phloem sap is a food source rich incarbohydrates, this metabolic slow-down could represent astrategy for aphids facing reduced amino acid availability intheir food source to reallocate energy, through the transcriptionalreprogramming previously observed, in other metabolismsand/or pathways to cope with Tyr/Phe deprivation. Furthermore,we also observed changes in the expression of other transportergenes: such transport modulation could be an additional way tochange the balance of precursors in order to optimize Tyr and Phebiosynthesis and distribution in the context of a nutritional stress.It is worth noting that, as often in non-model insect genomes,numerous genes among the significantly differentially expressedlack full functional annotation thus limiting the interpretation ofthe results. Nonetheless, their expression pattern (e.g., enrichedin bacteriocytes) suggests that (some of) these genes may play a
thus far unrecognized, novel role in the response to nutritionalstress, a possibility that will be explored in future work.
Altogether these results shed light on unknown aspects of thetranscriptional and cellular plasticity of insect bacteriocytes. Theysuggest that this plasticity is essential to a phloem-feeding insectlike the pea aphid to cope with the ever-changing compositionof the plant phloem sap. These findings are consistent with thepreviously described lack of response of the symbiotic bacteriaand instead show that the host, i.e., the bacteriocytes, responds ina complex manner to the deprivation of some amino acids (i.e.,Tyr and Phe) in its food source. Indeed, this nutritional stressinduces a rapid and extensive transcriptional reprogrammingof bacteriocytes that fine-tunes physiology of these cells andleads to changes in cell size that can possibly be involved inaccommodating larger numbers of endosymbionts. By extension,equivalent responses may be present in other biological systemsthat depend on nutritionally unbalanced diets for their growthand reproduction, a hypothesis that remains to be tested in futureresearch. Finally, our results on the A. pisum/B. aphidicola systemraise further interesting future research perspectives that include(i) the bacteriocyte responses to deprivation of other amino acidsand other nutritional/environmental challenges, (ii) the impactof additional endosymbionts on this process in multi-partner
Frontiers in Physiology | www.frontiersin.org 15 October 2018 | Volume 9 | Article 1498
fphys-09-01498 October 23, 2018 Time: 14:25 # 16
Colella et al. Nutritional Stress Response in the Pea Aphid
symbiotic relationships widely found in nature, and (iii) the roleof bacteriocytes in nutritional homeostasis mechanisms in otheraphids feeding on different host plants, in other hemipteranspecies (e.g., whiteflies and psyllids), and finally in symbiosis inother insect orders.
DATA AVAILABILITY
The datasets generated for this study can be found in theArrayExpress database (Accession No. E-MTAB-4456).
AUTHOR CONTRIBUTIONS
SC, YR, HC, GF, and FC conceived and designed the study. SC,PS, KG, GD, and FC performed the experiments. SC, NP, PS,PB-P, PC, and FC performed the data analysis. SC, NP, PS, GF,PC, and FC interpreted the results. SC, NP, PC, and FC wrotethe paper with contributions from KG. All authors revised andapproved the manuscript.
FUNDING
This work was supported by INRA, INSA-Lyon, INSA-LyonBQR program grant to SC, the French ANR-13-BSV7-0016-03(IMetSym) program grant, and the French Ministry of Researchthat awarded a Ph.D. fellowship to PS. PC was supported by anInvited Professor Grant of INSA-Lyon.
ACKNOWLEDGMENTS
RT-qPCR analyses were carried out in the DTAMB (Universityof Lyon). The authors would like to thank Julia Gilhodes for herhelp at the beginning of the project.
SUPPLEMENTARY MATERIAL
The Supplementary Material for this article can be foundonline at: https://www.frontiersin.org/articles/10.3389/fphys.2018.01498/full#supplementary-material
REFERENCESAaronson, D. S., and Horvath, C. M. (2002). A road map for those who don’t know
JAK-STAT. Science 296, 1653–1655. doi: 10.1126/science.1071545Adams, M. D., McVey, M., and Sekelsky, J. J. (2003). Drosophila BLM in double-
strand break repair by synthesis-dependent strand annealing. Science 299,265–267. doi: 10.1126/science.1077198
Akman Gündüz, E., and Douglas, A. E. (2009). Symbiotic bacteria enable insectto use a nutritionally inadequate diet. Proc. R. Soc. Lond. B 276, 987–991.doi: 10.1098/rspb.2008.1476
Altschul, S. F., Gish, W., Miller, W., Myers, E. W., and Lipman, D. J. (1990). Basiclocal alignment search tool. J. Mol. Biol. 215, 403–410. doi: 10.1016/S0022-2836(05)80360-2
Baa-Puyoulet, P., Parisot, N., Febvay, G., Huerta-Cepas, J., Vellozo, A. F.,Gabaldón, T., et al. (2016). ArthropodaCyc: a CycADS powered collection ofBioCyc databases to analyse and compare metabolism of arthropods. Database2016:baw081. doi: 10.1093/database/baw081
Baumann, P., Baumann, L., Lai, C. Y., Rouhbakhsh, D., Moran, N. A., and Clark,M. A. (1995). Genetics, physiology, and evolutionary relationships of the genusBuchnera: intracellular symbionts of aphids. Annu. Rev. Microbiol. 49, 55–94.doi: 10.1146/annurev.mi.49.100195.000415
Bermingham, J., and Wilkinson, T. L. (2010). The role of intracellular symbioticbacteria in the amino acid nutrition of embryos from the black bean aphid,Aphis fabae. Entomol. Exp. Appl. 134, 272–279. doi: 10.1111/j.1570-7458.2009.00953.x
Brault, V., Uzest, M., Monsion, B., Jacquot, E., and Blanc, S. (2010). Aphids astransport devices for plant viruses. C. R. Biol. 333, 524–538. doi: 10.1016/j.crvi.2010.04.001
Brinza, L., Viñuelas, J., Cottret, L., Calevro, F., Rahbé, Y., Febvay, G., et al. (2009).Systemic analysis of the symbiotic function of Buchnera aphidicola, the primaryendosymbiont of the pea aphidAcyrthosiphon pisum.C. R. Biol. 332, 1034–1049.doi: 10.1016/j.crvi.2009.09.007
Brodsky, M. H., Sekelsky, J. J., Tsang, G., Hawley, R. S., and Rubin, G. M. (2000).mus304 encodes a novel DNA damage checkpoint protein required duringDrosophila development. Genes Dev. 14, 666–678.
Buchner, P. (1965). Endosymbiosis of Animals with Plant Microorganisms. New-York, NY: John Wiley & Sons.
Corbesier, L., Havelange, A., Lejeune, P., Bernier, G., and Périlleux, C. (2001).N content of phloem and xylem exudates during the transition to floweringin Sinapis alba and Arabidopsis thaliana. Plant Cell Environ. 24, 367–375.doi: 10.1046/j.1365-3040.2001.00683.x
Cugusi, S., Kallappagoudar, S., Ling, H., and Lucchesi, J. C. (2015). The Drosophilahelicase maleless (MLE) is implicated in functions distinct from its role indosage compensation. Mol. Cell. Proteom. 14, 1478–1488. doi: 10.1074/mcp.M114.040667
Dallas, P. B., Gottardo, N. G., Firth, M. J., Beesley, A. H., Hoffmann, K., Terry, P. A.,et al. (2005). Gene expression levels assessed by oligonucleotide microarrayanalysis and quantitative real-time RT-PCR – how well do they correlate? BMCGenomics 6:59. doi: 10.1186/1471-2164-6-59
Dinant, S., Bonnemain, J.-L., Girousse, C., and Kehr, J. (2010). Phloem sap intricacyand interplay with aphid feeding. C. R. Biol. 333, 504–515. doi: 10.1016/j.crvi.2010.03.008
Douglas, A. E. (1993). The nutritional quality of phloem sap utilized by naturalaphid populations. Ecol. Entomol. 18, 31–38. doi: 10.1111/j.1365-2311.1993.tb01076.x
Douglas, A. E. (1996). Reproductive failure and the free amino acid pools in peaaphids (Acyrthosiphon pisum) lacking symbiotic bacteria. J. Insect Physiol. 42,247–255. doi: 10.1016/0022-1910(95)00105-0
Douglas, A. E. (2003). The nutritional physiology of aphids. Adv. Insect Physiol. 31,73–140.
Douglas, A. E. (2006). Phloem-sap feeding by animals: problems and solutions.J. Exp. Bot. 57, 747–754. doi: 10.1093/jxb/erj067
Douglas, A. E. (2014). The molecular basis of bacterial-insect symbiosis. J. Mol.Biol. 426, 3830–3837. doi: 10.1016/j.jmb.2014.04.005
Douglas, A. E., and Dixon, A. F. G. (1987). The mycetocyte symbiosis ofaphids: variation with age and morph in virginoparae of Megoura viciae andAcyrthosiphon pisum. J. Insect Physiol. 33, 109–113. doi: 10.1016/0022-1910(87)90082-5
Dray, S., and Dufour, A.-B. (2007). The ade4 package: implementing the dualitydiagram for ecologists. J. Stat. Softw. 22, 1–20.
Dudoit, S., Shaffer, J. P., and Boldrick, J. C. (2003). Multiple hypothesis testing inmicroarray experiments. Stat. Sci. 18, 71–103. doi: 10.2307/3182872
Febvay, G., Delobel, B., and Rahbé, Y. (1988). Influence of the amino-acid balanceon the improvement of an artificial diet for a biotype of Acyrthosiphon pisum(Homoptera, Aphididae). Can. J. Zool. 66, 2449–2453. doi: 10.1139/z88-362
Febvay, G., Rahbé, Y., Rynkiewicz, M., Guillaud, J., and Bonnot, G. (1999).Fate of dietary sucrose and neosynthesis of amino acids in the pea aphid,Acyrthosiphon pisum, reared on different diets. J. Exp. Biol. 202(Pt 19),2639–2652.
Feng, Y., and Irvine, K. D. (2007). Fat and expanded act in parallel to regulategrowth through warts. Proc. Natl. Acad. Sci. U.S.A. 104, 20362–20367.doi: 10.1073/pnas.0706722105
Frontiers in Physiology | www.frontiersin.org 16 October 2018 | Volume 9 | Article 1498
fphys-09-01498 October 23, 2018 Time: 14:25 # 17
Colella et al. Nutritional Stress Response in the Pea Aphid
Gholami, M. (2004). Grapevine phloem sap analysis: 1- sucrose, amino acids,potassium concentrations, seasonal and diurnal patterns. Acta Hortic. 640,143–153.
Gil, R., Sabater-Munoz, B., Latorre, A., Silva, F. J., and Moya, A. (2002). Extremegenome reduction in Buchnera spp.: toward the minimal genome needed forsymbiotic life. Proc. Natl. Acad. Sci. U.S.A. 99, 4454–4458. doi: 10.1073/pnas.062067299
Girousse, C., Moulia, B., Silk, W., and Bonnemain, J.-L. (2005). Aphid infestationcauses different changes in carbon and nitrogen allocation in alfalfa stems aswell as different inhibitions of longitudinal and radial expansion. Plant Physiol.137, 1474–1484. doi: 10.1104/pp.104.057430
Gramates, L. S., Marygold, S. J., Santos, G. D., Urbano, J.-M., Antonazzo, G.,Matthews, B. B., et al. (2017). FlyBase at 25: looking to the future. Nucleic AcidsRes. 45, D663–D671. doi: 10.1093/nar/gkw1016
Haberland, M., Montgomery, R. L., and Olson, E. N. (2009). The many roles ofhistone deacetylases in development and physiology: implications for diseaseand therapy. Nat. Rev. Genet. 10, 32–42. doi: 10.1038/nrg2485
Hansen, A. K., and Moran, N. A. (2011). Aphid genome expression reveals host-symbiont cooperation in the production of amino acids. Proc. Natl. Acad. Sci.U.S.A. 108, 2849–2854. doi: 10.1073/pnas.1013465108
Hayashi, H., and Chino, M. (1986). Collection of pure phloem sap from wheat andits chemical composition. Plant Cell Physiol. 27, 1387–1393.
Hayashi, H., and Chino, M. (1990). Chemical composition of phloem sap fromthe uppermost internode of the rice plant. Plant Cell Physiol. 31, 247–251.doi: 10.1093/oxfordjournals.pcp.a077899
Hipfner, D. R., and Cohen, S. M. (2003). The Drosophila sterile-20 kinase slikcontrols cell proliferation and apoptosis during imaginal disc development.PLoS Biol. 1:E35. doi: 10.1371/journal.pbio.0000035
Hochheimer, A., Zhou, S., Zheng, S., Holmes, M. C., and Tjian, R. (2002).TRF2 associates with DREF and directs promoter-selective gene expression inDrosophila. Nature 420, 439–445. doi: 10.1038/nature01167
Hongoh, Y., and Ishikawa, H. (1994). Changes of mycetocyte symbiosis in responseto flying behavior of alatiform aphid (Acyrthosiphon pisum). Zool. Sci. 11,731–735.
Huang, J.-H., Jing, X., and Douglas, A. E. (2015). The multi-tasking gut epitheliumof insects. Insect Biochem. Mol. Biol. 67, 15–20. doi: 10.1016/j.ibmb.2015.05.004
Huerta-Cepas, J., Szklarczyk, D., Forslund, K., Cook, H., Heller, D., Walter, M. C.,et al. (2016). eggNOG 4.5: a hierarchical orthology framework with improvedfunctional annotations for eukaryotic, prokaryotic and viral sequences. NucleicAcids Res. 44, D286–D293. doi: 10.1093/nar/gkv1248
International Aphid Genomics Consortium (2010). Genome sequence of the peaaphid Acyrthosiphon pisum. PLoS Biol. 8:e1000313. doi: 10.1371/journal.pbio.1000313
Irizarry, R. A., Hobbs, B., Collin, F., Beazer-Barclay, Y. D., Antonellis, K. J.,Scherf, U., et al. (2003). Exploration, normalization, and summaries ofhigh density oligonucleotide array probe level data. Biostatistics 4, 249–264.doi: 10.1093/biostatistics/4.2.249
Karley, A. J., Douglas, A. E., and Parker, W. E. (2002). Amino acid compositionand nutritional quality of potato leaf phloem sap for aphids. J. Exp. Biol. 205,3009–3018.
Kugler, S. J., and Nagel, A. C. (2007). putzig is required for cell proliferationand regulates notch activity in Drosophila. Mol. Biol. Cell 18, 3733–3740.doi: 10.1091/mbc.E07-03-0263
Kuroda, M. I., Kernan, M. J., Kreber, R., Ganetzky, B., and Baker, B. S. (1991).The maleless protein associates with the X chromosome to regulate dosagecompensation in Drosophila. Cell 66, 935–947.
Maere, S., Heymans, K., and Kuiper, M. (2005). BiNGO: a Cytoscape pluginto assess overrepresentation of gene ontology categories in biologicalnetworks. Bioinformatics 21, 3448–3449. doi: 10.1093/bioinformatics/bti551
McCaffrey, R., St Johnston, D., and González-Reyes, A. (2006). Drosophilamus301/spindle-C encodes a helicase with an essential role in double-strandDNA break repair and meiotic progression. Genetics 174, 1273–1285. doi: 10.1534/genetics.106.058289
Mizushima, N., and Klionsky, D. J. (2007). Protein turnover via autophagy:implications for metabolism. Annu. Rev. Nutr. 27, 19–40. doi: 10.1146/annurev.nutr.27.061406.093749
Moran, N., and Baumann, P. (1994). Phylogenetics of cytoplasmically inheritedmicroorganisms of arthropods. Trends Ecol. Evol. 9, 15–20. doi: 10.1016/0169-5347(94)90226-7
Moran, N. A., Dunbar, H. E., and Wilcox, J. L. (2005). Regulation of transcriptionin a reduced bacterial genome: nutrient-provisioning genes of the obligatesymbiont Buchnera aphidicola. J. Bacteriol. 187, 4229–4237. doi: 10.1128/JB.187.12.4229-4237.2005
Moran, N. A., Munson, M. A., Baumann, P., and Ishikawa, H. (1993). A molecularclock in endosymbiotic bacteria is calibrated using the insect hosts. Proc. R. Soc.Lond. B 253, 167–171. doi: 10.1098/rspb.1993.0098
Mukherjee, T., Hombría, J. C.-G., and Zeidler, M. P. (2005). Opposing roles forDrosophila JAK/STAT signalling during cellular proliferation. Oncogene 24,2503–2511. doi: 10.1038/sj.onc.1208487
Nakabachi, A., Sakazume, N., Shiraki, T., Hayashizaki, Y., Carninci, P.,Ishikawa, H., et al. (2005). Transcriptome analysis of the aphid bacteriocyte,the symbiotic host cell that harbors an endocellular mutualistic bacterium,Buchnera. Proc. Natl. Acad. Sci. U.S.A. 102, 5477–5482. doi: 10.1073/pnas.0409034102
Perilla-Henao, L. M., and Casteel, C. L. (2016). Vector-borne bacterial plantpathogens: interactions with hemipteran insects and plants. Front. Plant Sci.7:1163. doi: 10.3389/fpls.2016.01163
Petty, E., and Pillus, L. (2013). Balancing chromatin remodeling and histonemodifications in transcription. Trends Genet. 29, 621–629. doi: 10.1016/j.tig.2013.06.006
Pfaffl, M. W., Horgan, G. W., and Dempfle, L. (2002). Relative expression softwaretool (REST) for group-wise comparison and statistical analysis of relativeexpression results in real-time PCR. Nucleic Acids Res. 30:e36.
Pfaffl, M. W., Tichopad, A., Prgomet, C., and Neuvians, T. P. (2004). Determinationof stable housekeeping genes, differentially regulated target genes and sampleintegrity: BestKeeper–Excel-based tool using pair-wise correlations. Biotechnol.Lett. 26, 509–515.
Poliakov, A., Russell, C. W., Ponnala, L., Hoops, H. J., Sun, Q., Douglas, A. E.,et al. (2011). Large-scale label-free quantitative proteomics of the pea aphid-Buchnera symbiosis. Mol. Cell. Proteomics 10:M110.007039. doi: 10.1074/mcp.M110.007039
Price, D. R. G., Feng, H., Baker, J. D., Bavan, S., Luetje, C. W., and Wilson,A. C. C. (2014). Aphid amino acid transporter regulates glutamine supply tointracellular bacterial symbionts. Proc. Natl. Acad. Sci. U.S.A. 111, 320–325.doi: 10.1073/pnas.1306068111
Prüfer, K., Stenzel, U., Dannemann, M., Green, R. E., Lachmann, M., andKelso, J. (2008). PatMaN: rapid alignment of short sequences to large databases.Bioinformatics 24, 1530–1531. doi: 10.1093/bioinformatics/btn223
Rabatel, A., Febvay, G., Gaget, K., Duport, G., Baa-Puyoulet, P., Sapountzis, P.,et al. (2013). Tyrosine pathway regulation is host-mediated in the pea aphidsymbiosis during late embryonic and early larval development. BMC Genomics14:235. doi: 10.1186/1471-2164-14-235
Rahbé, Y., Digilio, M. C., Febvay, G., Guillaud, J., Fanti, P., and Pennacchio, F.(2002). Metabolic and symbiotic interactions in amino acid pools of the peaaphid, Acyrthosiphon pisum, parasitized by the braconid Aphidius ervi. J. InsectPhysiol. 48, 507–516. doi: 10.1016/S0022-1910(02)00053-7
Reymond, N., Calevro, F., Viñuelas, J., Morin, N., Rahbé, Y., Febvay, G., et al.(2006). Different levels of transcriptional regulation due to trophic constraintsin the reduced genome of Buchnera aphidicola APS. Appl. Environ. Microbiol.72, 7760–7766. doi: 10.1128/AEM.01118-06
Ritchie, M. E., Phipson, B., Wu, D., Hu, Y., Law, C. W., Shi, W., et al. (2015). limmapowers differential expression analyses for RNA-sequencing and microarraystudies. Nucleic Acids Res. 43:e47. doi: 10.1093/nar/gkv007
Rodrigues, A. B., Zoranovic, T., Ayala-Camargo, A., Grewal, S., Reyes-Robles, T.,Krasny, M., et al. (2012). Activated STAT regulates growth and inducescompetitive interactions independently of Myc, Yorkie, Wingless and ribosomebiogenesis. Development 139, 4051–4061. doi: 10.1242/dev.076760
Rychlik, W. (2007). OLIGO 7 primer analysis software. Methods Mol. Biol. 402,35–60. doi: 10.1007/978-1-59745-528-2_2
Sandström, J., and Pettersson, J. (1994). Amino acid composition of phloem sapand the relation to intraspecific variation in pea aphid (Acyrthosiphon pisum)performance. J. Insect Physiol. 40, 947–955. doi: 10.1016/0022-1910(94)90133-3
Schneider, J., Buness, A., Huber, W., Volz, J., Kioschis, P., Hafner, M., et al.(2004). Systematic analysis of T7 RNA polymerase based in vitro linear
Frontiers in Physiology | www.frontiersin.org 17 October 2018 | Volume 9 | Article 1498
fphys-09-01498 October 23, 2018 Time: 14:25 # 18
Colella et al. Nutritional Stress Response in the Pea Aphid
RNA amplification for use in microarray experiments. BMC Genomics 5:29.doi: 10.1186/1471-2164-5-29
Shang, R., Wang, J., Sun, W., Dai, B., Ruan, B., Zhang, Z., et al. (2016). RRADinhibits aerobic glycolysis, invasion, and migration and is associated with poorprognosis in hepatocellular carcinoma. Tumour Biol. 37, 5097–5105. doi: 10.1007/s13277-015-4329-7
Shannon, P., Markiel, A., Ozier, O., Baliga, N. S., Wang, J. T., Ramage, D.,et al. (2003). Cytoscape: a software environment for integrated models ofbiomolecular interaction networks. Genome Res. 13, 2498–2504. doi: 10.1101/gr.1239303
Sharkey, P. J., and Pate, J. S. (1976). Translocation from leaves to fruits of alegume, studied by a phloem bleeding technique: diurnal changes and effectsof continuous darkness. Planta 128, 63–72. doi: 10.1007/BF00397180
Shigenobu, S., Watanabe, H., Hattori, M., Sakaki, Y., and Ishikawa, H. (2000).Genome sequence of the endocellular bacterial symbiont of aphids Buchnerasp. APS. Nature 407, 81–86. doi: 10.1038/35024074
Simonet, P., Duport, G., Gaget, K., Weiss-Gayet, M., Colella, S., Febvay, G., et al.(2016a). Direct flow cytometry measurements reveal a fine-tuning of symbioticcell dynamics according to the host developmental needs in aphid symbiosis.Sci. Rep. 6:19967. doi: 10.1038/srep19967
Simonet, P., Gaget, K., Parisot, N., Duport, G., Rey, M., Febvay, G., et al. (2016b).Disruption of phenylalanine hydroxylase reduces adult lifespan and fecundity,and impairs embryonic development in parthenogenetic pea aphids. Sci. Rep.6:34321. doi: 10.1038/srep34321
Simonet, P., Gaget, K., Balmand, S., Ribeiro Lopes, M., Parisot, N., Buhler, K., et al.(2018). Bacteriocyte cell death in the pea aphid/Buchnera symbiotic system.Proc. Natl. Acad. Sci. U.S.A. 115, E1819–E1828. doi: 10.1073/pnas.1720237115
Smith, J. A. C., and Milburn, J. A. (1980). Phloem transport, solute flux andthe kinetics of sap exudation in Ricinus communis L. Planta 148, 35–41.doi: 10.1007/BF00385439
Su, T. T., Feger, G., and O’Farrell, P. H. (1996). Drosophila MCM proteincomplexes. Mol. Biol. Cell 7, 319–329.
Supek, F., Bošnjak, M., Škunca, N., and Šmuc, T. (2011). REVIGO summarizes andvisualizes long lists of gene ontology terms. PLoS One 6:e21800. doi: 10.1371/journal.pone.0021800
Sural, T. H., Peng, S., Li, B., Workman, J. L., Park, P. J., and Kuroda, M. I. (2008).The MSL3 chromodomain directs a key targeting step for dosage compensationof the Drosophila melanogaster X chromosome. Nat. Struct. Mol. Biol. 15,1318–1325. doi: 10.1038/nsmb.1520
Tagu, D., Dugravot, S., Outreman, Y., Rispe, C., Simon, J.-C., and Colella, S. (2010).The anatomy of an aphid genome: from sequence to biology. C. R. Biol. 333,464–473. doi: 10.1016/j.crvi.2010.03.006
Thakur, D. M., Feng, Y., Jagannathan, R., Seppa, M. J., Skeath, J. B., and Longmore,G. D. (2010). Ajuba LIM proteins are negative regulators of the Hippo signalingpathway. Curr. Biol. 20, 657–662. doi: 10.1016/j.cub.2010.02.035
Tsukiyama, T., Daniel, C., Tamkun, J., and Wu, C. (1995). ISWI, a member of theSWI2/SNF2 ATPase family, encodes the 140 kDa subunit of the nucleosomeremodeling factor. Cell 83, 1021–1026. doi: 10.1016/0092-8674(95)90217-1
Viñuelas, J., Febvay, G., Duport, G., Colella, S., Fayard, J.-M., Charles, H., et al.(2011). Multimodal dynamic response of the Buchnera aphidicola pLeu plasmidto variations in leucine demand of its host, the pea aphid Acyrthosiphon pisum.Mol. Microbiol. 81, 1271–1285. doi: 10.1111/j.1365-2958.2011.07760.x
Von Dohlen, C. D., and Moran, N. A. (2000). Molecular data support a rapidradiation of aphids in the Cretaceous and multiple origins of host alternation.Biol. J. Linn. Soc. 71, 689–717. doi: 10.1006/bijl.2000.0470
Wang, Y., Li, G., Mao, F., Li, X., Liu, Q., Chen, L., et al. (2014). Ras-inducedepigenetic inactivation of the RRAD (Ras-related associated with diabetes) gene
promotes glucose uptake in a human ovarian cancer model. J. Biol. Chem. 289,14225–14238. doi: 10.1074/jbc.M113.527671
Wilkinson, T. L., Adams, D., Minto, L. B., and Douglas, A. E. (2001). The impactof host plant on the abundance and function of symbiotic bacteria in an aphid.J. Exp. Biol. 204, 3027–3038. doi: 10.1007/s004420050190
Wilkinson, T. L., and Ishikawa, H. (1999). The assimilation and allocationof nutrients by symbiotic and aposymbiotic pea aphids, Acyrthosiphonpisum. Entomol. Exp. Appl. 91, 195–201. doi: 10.1046/j.1570-7458.1999.00484.x
Wilkinson, T. L., and Ishikawa, H. (2000). Injection of essential amino acidssubstitutes for bacterial supply in aposymbiotic pea aphids (Acyrthosiphonpisum). Entomol. Exp. Appl. 94, 85–91. doi: 10.1023/A:1003909127158
Wilkinson, T. L., Koga, R., and Fukatsu, T. (2007). Role of host nutrition insymbiont regulation: impact of dietary nitrogen on proliferation of obligate andfacultative bacterial endosymbionts of the pea aphidAcyrthosiphon pisum.Appl.Environ. Microbiol. 73, 1362–1366. doi: 10.1128/AEM.01211-06
Wilson, A. C. C. (2011). Genomic revelations of a mutualism: the pea aphid andits obligate bacterial symbiont. Cell Mol. Life Sci. 68, 1297–1309. doi: 10.1007/s00018-011-0645-2
Wilson, A. C. C., Ashton, P. D., Calevro, F., Charles, H., Colella, S., Febvay, G.,et al. (2010). Genomic insight into the amino acid relations of the pea aphid,Acyrthosiphon pisum, with its symbiotic bacterium Buchnera aphidicola. InsectMol. Biol. 19(Suppl. 2), 249–258. doi: 10.1111/j.1365-2583.2009.00942.x
Wilson, A. C. C., Dunbar, H. E., Davis, G. K., Hunter, W. B., Stern, D. L.,and Moran, N. A. (2006). A dual-genome microarray for the pea aphid,Acyrthosiphon pisum, and its obligate bacterial symbiont, Buchnera aphidicola.BMC Genomics 7:50. doi: 10.1186/1471-2164-7-50
Wilson, A. C. C., and Duncan, R. P. (2015). Signatures of host/symbiont genomecoevolution in insect nutritional endosymbioses. Proc. Natl. Acad. Sci. U.S.A.112, 10255–10261. doi: 10.1073/pnas.1423305112
Winter, H., Lohaus, G., and Heldt, H. W. (1992). Phloem transport of amino acidsin relation to their cytosolic levels in barley leaves. Plant Physiol. 99, 996–1004.doi: 10.1104/pp.99.3.996
Wybouw, N., Zhurov, V., Martel, C., Bruinsma, K. A., Hendrickx, F., Grbiæ, V.,et al. (2015). Adaptation of a polyphagous herbivore to a novel host plantextensively shapes the transcriptome of herbivore and host. Mol. Ecol. 24,4647–4663. doi: 10.1111/mec.13330
Zhang, Y.-C., Cao, W.-J., Zhong, L.-R., Godfray, H. C. J., and Liu, X.-D. (2016).Host plant determines the population size of an obligate symbiont (Buchneraaphidicola) in aphids. Appl. Environ. Microbiol. 82, 2336–2346. doi: 10.1128/AEM.04131-15
Zhu, Y., Li, D., Wang, Y., Pei, C., Liu, S., Zhang, L., et al. (2015). Brahmaregulates the Hippo pathway activity through forming complex with Yki-Sd andregulating the transcription of Crumbs. Cell Signal. 27, 606–613. doi: 10.1016/j.cellsig.2014.12.002
Conflict of Interest Statement: The authors declare that the research wasconducted in the absence of any commercial or financial relationships that couldbe construed as a potential conflict of interest.
Copyright © 2018 Colella, Parisot, Simonet, Gaget, Duport, Baa-Puyoulet, Rahbé,Charles, Febvay, Callaerts and Calevro. This is an open-access article distributedunder the terms of the Creative Commons Attribution License (CC BY). The use,distribution or reproduction in other forums is permitted, provided the originalauthor(s) and the copyright owner(s) are credited and that the original publicationin this journal is cited, in accordance with accepted academic practice. No use,distribution or reproduction is permitted which does not comply with these terms.
Frontiers in Physiology | www.frontiersin.org 18 October 2018 | Volume 9 | Article 1498