Embed Size (px)
Citation preview
Bacterioplankton groups involved in the uptake ofphosphate and dissolved organic phosphorus in amesocosm experiment with P-starved Mediterraneanwatersemi_2772 2334..2347
Marta Sebastián,1* Paraskevi Pitta,2
José M. González,3 T. Frede Thingstad4 andJosep M. Gasol11Departament de Biologia Marina i Oceanografia, Institutde Ciències del Mar, CSIC, Pg Marítim de laBarceloneta 37-49, E08003 Barcelona, Catalunya,Spain.2Hellenic Centre for Marine Research, OceanographyInstitute, P.O. Box 2214, 71003 Heraklion, Crete,Greece.3Department of Microbiology, University of La Laguna,ES-38206 La Laguna, Tenerife, Spain.4Department of Biology, University of Bergen, P.O. Box7803, 5020 Bergen, Norway.
Summary
The use of inorganic phosphate (Pi) and dissolvedorganic phosphorus (DOP) by different bacterialgroups was studied in experimental mesocosms ofP-starved eastern Mediterranean waters in theabsence (control mesocosms) and presence of addi-tional Pi (P-amended mesocosms). The low Pi turn-over times in the control mesocosms and theincrease in heterotrophic prokaryotic abundance andproduction upon Pi addition confirmed that the bac-terial community was originally P-limited. The bacte-rioplankton groups taking up Pi and DOP wereidentified by means of microautoradiography com-bined with catalysed reporter deposition fluores-cence in situ hybridization. Incubations with leucinewere also performed for comparative purposes. Allthe probe-identified groups showed a high percent-age of cells taking up Pi and DOP in the control,P-limited, mesocosms throughout the experiment.However, in response to Pi addition two contrastingscenarios in Pi use were observed: (i) on day 1 ofthe experiment Pi addition caused a clear reductionin the percentage of SAR11 cells taking up Pi,
whereas Gammaproteobacteria, Roseobacter andBacteroidetes showed similar percentages to theones in the control mesocosms and (ii) on day 4 of theexperiment, probably when the bacterial communityhad fully responded to the P input, all the probe-identified groups showed low percentages of cellstaking up the substrate as compared with the controlmesocosms. These differences are likely related todifferent P requirements among the bacterial groupsand point out to the existence of two contrastingstrategies in P use.
Introduction
Phosphorus (P) limits microbial growth and production inseveral areas of the ocean, at least during part of the year(Cotner et al., 1997; Rivkin and Anderson, 1997; Caronet al., 2000; Pinhassi et al., 2006). This limitation appearsto be particularly pronounced in the Mediterranean Sea(Krom et al., 1991; van Wambeke et al., 2002; Thingstadet al., 2005; Pinhassi et al., 2006), where inorganic phos-phate (Pi) concentrations are usually in the low nanomolarrange (Krom et al., 2005; Pulido-Villena et al., 2010).
When Pi is depleted, both phytoplankton and bacteriacan meet their phosphorus demand using dissolvedorganic compounds (Bentzen et al., 1992), as long asthey are able to split off the phosphate moiety (Lugten-berg, 1987; Lovdal et al., 2007). Although Pi is the pre-ferred source of P, previous studies have demonstratedthat the available fraction of the dissolved organic phos-phorus (DOP) pool is also actively utilized (e.g. Bentzenet al., 1992; Lovdal et al., 2007; Casey et al., 2009; Mich-elou et al., 2011).
The contribution of the components of the microbialcommunity to Pi and DOP uptake has traditionally beenevaluated in size-fractionation studies (Currie and Kalff,1984; Bentzen et al., 1992; Thingstad et al., 1993; Lovdalet al., 2007). These studies have indicated that underP-limiting conditions bacteria are superior competitors forPi and DOP uptake, whereas large phytoplankton cantake advantage of sudden pulses of nutrients (e.g. Suttleet al., 1990; Thingstad et al., 1993; Zohary and Robarts,1998; Lovdal et al., 2007). Nevertheless, in this approach
Received 9 September, 2011; revised 28 March, 2012; accepted 11April, 2012. *For correspondence. E-mail: [email protected];Tel. +34 93 2309500; Fax +34 93 2309555.
bs_bs_banner
Environmental Microbiology (2012) 14(9), 2334–2347 doi:10.1111/j.1462-2920.2012.02772.x
© 2012 Society for Applied Microbiology and Blackwell Publishing Ltd
the contribution of heterotrophic bacteria is commonlyestimated as the fraction of radiolabelled substrate takenup by the plankton fraction that passes through filters witha pore size � 1 mm, which also includes picocyanobacte-ria. On the other hand, the fraction 0.6 to 2 mm is fre-quently attributed to Synechococcus (e.g. Moutin et al.,2002) but the majority of picoeukaryotes are smaller than2 mm (Vaulot et al., 1996). Furthermore, the most activefraction of heterotrophic bacterial biomass is often largerthan 0.6 mm (Thingstad et al., 1996).
The problems of the size fractionation approach havebeen circumvented in recent years by flow cytometricsorting of microbial populations after incubation withradiolabelled P (Zubkov et al., 2007; Larsen et al., 2008;Michelou et al., 2011). These studies confirmed thatthe heterotrophic component of the bacterioplanktonplays a major role in P cycling, accounting for 45% oftotal Pi uptake in north-eastern Atlantic (Zubkov et al.,2007) and > 90% of total Pi and ATP uptake in north-western Atlantic (Michelou et al., 2011). However,whereas this approach allows distinction between differ-ent picoplankton groups, it still considers heterotrophicbacteria as a homogeneous black box. In the last fewyears single-cell methods like microautoradiographycombined with fluorescence in situ hybridization(MARFISH) or halogen in situ hybridization-secondaryion mass spectroscopy (HISH-SIMS) are revealing highheterogeneity in the uptake of various organic substratesby different bacterial phylogenetic groups (Cottrell andKirchman, 2003; Alonso-Sáez and Gasol, 2007; delGiorgio and Gasol, 2008; Musat et al., 2008). Likewise,the number of heterotrophic bacterial cells actively par-ticipating in the uptake of Pi and organic phosphorussubstrates may vary markedly between phylogeneticgroups, depending on their uptake capacities and theirnutrient quotas.
The eastern Mediterranean is considered one of themost oligotrophic and P-starved marine systems on earth(e.g. Tanaka et al., 2007), where P limitation of bacteri-oplankton has been shown to be a generalized phenom-enon (van Wambeke et al., 2002; Thingstad et al., 2005),with few exceptions (Tanaka et al., 2011). This systemwas the site for CYCLOPS, a large-scale Pi-additionexperiment, in which the phytoplankton community wasfound to be N- and P-co-limited, and the heterotrophiccommunity P-limited (Krom et al., 2005; Thingstad et al.,2005). However, many questions remained unansweredafter this experiment: did P equally stimulate all the com-ponents of the bacterial community? Which phylogeneticgroups contributed to Pi uptake? In phosphate depletedwaters the majority (> 80%) of total dissolved P exists asDOP (Ammerman et al., 2003; Lomas et al., 2010; Lagh-dass et al., 2011; Tanaka et al., 2011). Hence, DOP likelyplays an important role in supplying P to satisfy bacterial
cell quotas in this oligotrophic system. But, do all thebacterioplankton groups use DOP?
In this study a mesocosm experiment was carried out toconfirm the results obtained during CYCLOPS. Thisexperiment consisted of three parallel controls and threeP-amended bags as experimental units. We used thatsetup to answer the aforementioned questions by charac-terizing the bacterial community taking up 33P-Pi andAT-33P (as a model molecule for bioavailable low molecu-lar weight DOP) using MARFISH. For comparison, wealso studied the uptake of 3H-leucine, which is used as auniversal substrate to estimate bacterial production. Todate there is only one marine study using MARFISH with33P-Pi as tracer, which showed that there is large variabil-ity in the uptake of this substrate by different bacterialgroups (Longnecker et al., 2010). Our mesocosm experi-ment constitutes one step forward because it provides aunique framework to investigate the effect of Pi additionon Pi and DOP use by the different components ofthe bacterial community in a system likely limited byP-availability.
Results
Turnover time of phosphate (Pi) and ATP, andprokaryotic heterotrophic abundance and production
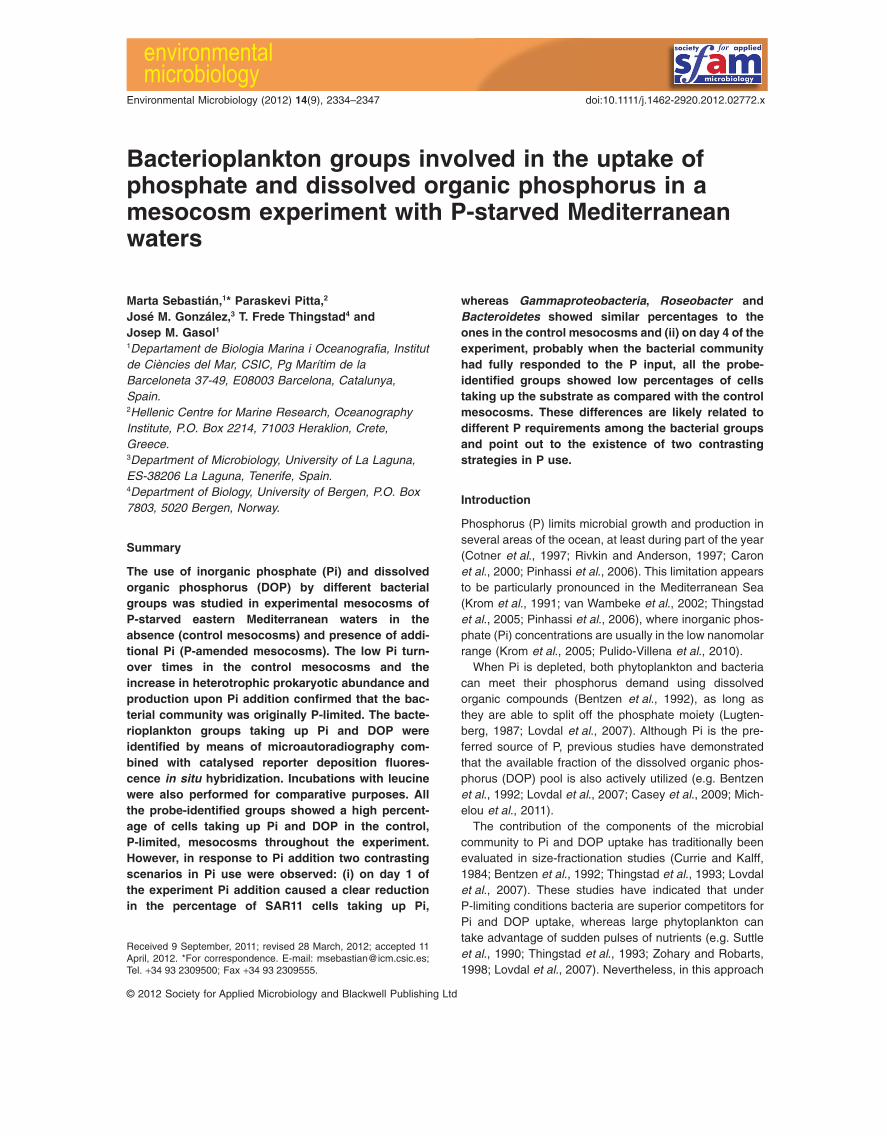
Pi turnover times in the control mesocosms were around1 h throughout the experiment. On the contrary, theP-amended mesocosms displayed a pronouncedincrease in Pi turnover times (Fig. 1), which went from 1 to2 h before Pi addition to around 60 h on day 1 andincreased along the experiment reaching values up to twoorders of magnitude higher than in the control meso-cosms. ATP turnover time in the control mesocosms was~ 6 h on day 0, decreased to 3 h on day 1 and remainedconstant throughout the experiment. In the P-amendedmesocosms the turnover time of ATP increased when
Pi
Pi
ATP
ATP
Tur
nove
r tim
e (h
)
0.1
1
10
100
1000
0 2 4 6 8
day
Fig. 1. Turnover times of phosphate (Pi, circles) and ATP (squares)in the control (open symbols) and P-amended mesocosms (filledsymbols). Each data point represents the average of twomesocosms with two independent measurements for eachmesocosm. Error bars represent the standard deviation.
Bacterioplankton groups using Pi and DOP 2335
© 2012 Society for Applied Microbiology and Blackwell Publishing Ltd, Environmental Microbiology, 14, 2334–2347
compared with the control reaching a maximum of 40 h,which was one order of magnitude lower than the corre-sponding increase in Pi turnover times (Fig. 1).
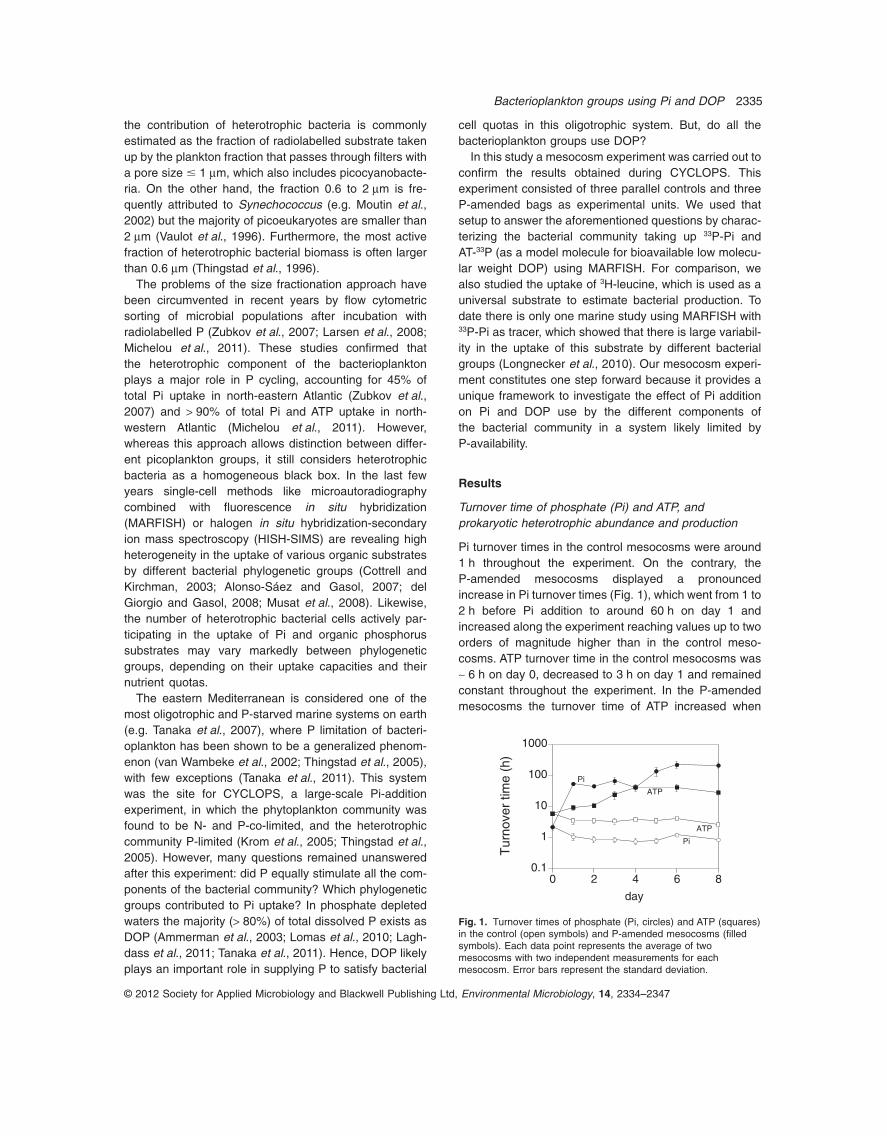
Initial prokaryotic abundance was on average5.9 ¥ 105 cells ml-1. Pi addition caused an increase inabundance, which reached values threefold higher than inthe control mesocosms at the end of the experiment(Fig. 2A). Eubacterial cell numbers (estimated by cataly-sed reporter deposition fluorescence in situ hybridization,CARDFISH) accounted for ~ 70% of the prokaryotic cellcounts throughout the experiment. Considering thealmost complete coverage of all the bacterial groups withthe EUB338 probe mix (Amann and Fuchs, 2008), and thelow abundance of Archaea in Mediterranean surfacewaters (Alonso-Sáez et al. 2007, De Corte et al., 2008)
the remaining cells probably represent a variable contri-bution of non-nucleoid containing bacteria (Zweifel andHagstrom, 1995) or decaying cells still stainable withDAPI but lacking sufficient RNA (del Giorgio and Gasol,2008). The increase in prokaryotic abundance was mir-rored by an increase in prokaryotic heterotrophic produc-tion, with values 1.5-fold to twofold higher in theP-amended mesocosms than in the controls (Fig. 2B).
Percentage of total bacterial cells taking up Pi, ATPand leucine
Based on the Pi turnover time results, three time pointswere chosen for MARFISH analyses: day 0, before Piaddition; day 1, when the most drastic change in Pi turn-over time was observed in the P-amended mesocosms inrelation to the controls, and day 4, when we expected thebacterial assemblage to have fully responded to the Piinput. On average around 60% of the eubacterial cellstook up Pi and ATP in the control mesocosms (Fig. 3),whereas ~ 50% of the cells took up leucine at the concen-tration used (0.5 nM). The percentage of cells taking upPi in the P-amended mesocosms decreased along theexperiment, reaching a value of 26% on day 4. In contrast,the percentage of cells taking up ATP dropped to 26% onday 1 of the experiment but increased back to 40% on day4. On the other hand, there was no difference in thepercentage of cells taking up leucine in the control and theP-amended mesocosms (ANOVA test, P = 0.86, Fig. 3).
Community structure
The percent contribution of the different groups to theprokaryotic assemblage did not change after Pi additionand remained stable throughout the experiment (Fig. 4).In this study we did not quantify the abundance ofAlphaproteobacteria but, instead, focused on two relevantalphaproteobacterial subgroups, SAR11 and Roseo-bacter, which show contrasting life styles and are presentin significant numbers in diverse marine habitats (Morriset al., 2002; Buchan et al., 2005). SAR11 cells were themost abundant, comprising 40% and 48% of the DAPI
ce
ll m
l–1
A
B
BP
(μg
C l
–1 d
ay
–1)
105
106
107
0
2
4
6
8
10
0 2 4 6 8
day
Fig. 2. Time course of (A) prokaryotic abundance estimated byflow cytometry (circles) and eubacterial cell numbers estimated byCARDFISH (bars), and (B) prokaryotic heterotrophic production, inboth the control (open symbols) and P-amended mesocosm (filledsymbols).
Fig. 3. Percentage of eubacterial cellsactively taking up phosphate (33P-Pi), AT33Pand 3H-leucine in the control (open bars) andP-amended mesocosms (filled bars). Eachdata point represents the average of twomesocosms. Error bars represent thestandard deviation.
Phosphate
0
20
40
60
80
100
0 1 4day
0 1 4day
0 1 4day
% a
ctiv
e E
ubac
teria
(MA
R+
)
ATP Leucine
C
+P
2336 M. Sebastián et al.
© 2012 Society for Applied Microbiology and Blackwell Publishing Ltd, Environmental Microbiology, 14, 2334–2347
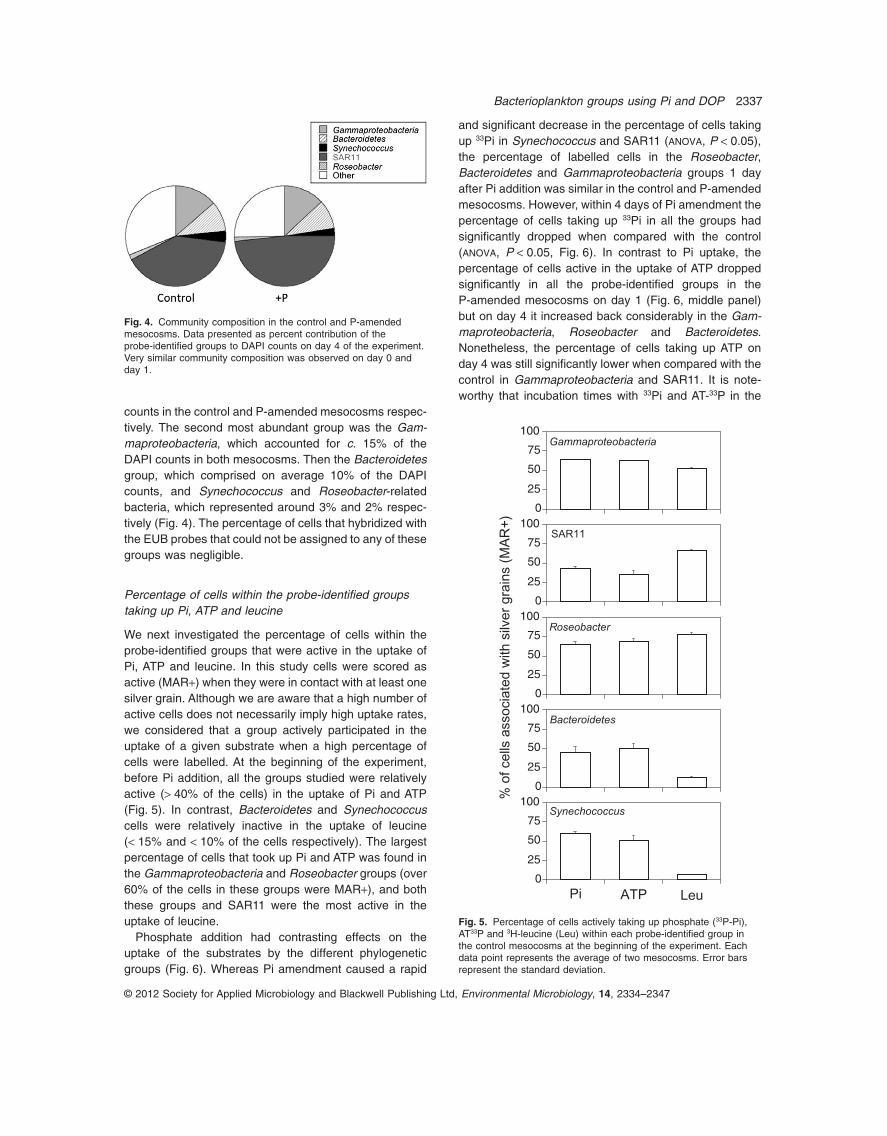
counts in the control and P-amended mesocosms respec-tively. The second most abundant group was the Gam-maproteobacteria, which accounted for c. 15% of theDAPI counts in both mesocosms. Then the Bacteroidetesgroup, which comprised on average 10% of the DAPIcounts, and Synechococcus and Roseobacter-relatedbacteria, which represented around 3% and 2% respec-tively (Fig. 4). The percentage of cells that hybridized withthe EUB probes that could not be assigned to any of thesegroups was negligible.
Percentage of cells within the probe-identified groupstaking up Pi, ATP and leucine
We next investigated the percentage of cells within theprobe-identified groups that were active in the uptake ofPi, ATP and leucine. In this study cells were scored asactive (MAR+) when they were in contact with at least onesilver grain. Although we are aware that a high number ofactive cells does not necessarily imply high uptake rates,we considered that a group actively participated in theuptake of a given substrate when a high percentage ofcells were labelled. At the beginning of the experiment,before Pi addition, all the groups studied were relativelyactive (> 40% of the cells) in the uptake of Pi and ATP(Fig. 5). In contrast, Bacteroidetes and Synechococcuscells were relatively inactive in the uptake of leucine(< 15% and < 10% of the cells respectively). The largestpercentage of cells that took up Pi and ATP was found inthe Gammaproteobacteria and Roseobacter groups (over60% of the cells in these groups were MAR+), and boththese groups and SAR11 were the most active in theuptake of leucine.
Phosphate addition had contrasting effects on theuptake of the substrates by the different phylogeneticgroups (Fig. 6). Whereas Pi amendment caused a rapid
and significant decrease in the percentage of cells takingup 33Pi in Synechococcus and SAR11 (ANOVA, P < 0.05),the percentage of labelled cells in the Roseobacter,Bacteroidetes and Gammaproteobacteria groups 1 dayafter Pi addition was similar in the control and P-amendedmesocosms. However, within 4 days of Pi amendment thepercentage of cells taking up 33Pi in all the groups hadsignificantly dropped when compared with the control(ANOVA, P < 0.05, Fig. 6). In contrast to Pi uptake, thepercentage of cells active in the uptake of ATP droppedsignificantly in all the probe-identified groups in theP-amended mesocosms on day 1 (Fig. 6, middle panel)but on day 4 it increased back considerably in the Gam-maproteobacteria, Roseobacter and Bacteroidetes.Nonetheless, the percentage of cells taking up ATP onday 4 was still significantly lower when compared with thecontrol in Gammaproteobacteria and SAR11. It is note-worthy that incubation times with 33Pi and AT-33P in the
Fig. 4. Community composition in the control and P-amendedmesocosms. Data presented as percent contribution of theprobe-identified groups to DAPI counts on day 4 of the experiment.Very similar community composition was observed on day 0 andday 1.
0
25
50
75
100Gammaproteobacteria
0
25
50
75
100SAR11
0
25
50
75
100Roseobacter
0
25
50
75
100Bacteroidetes
Synechococcus
0
25
50
75
100
Pi ATP Leu
% o
f ce
lls a
sso
cia
ted
with
silv
er
gra
ins (
MA
R+
)
Fig. 5. Percentage of cells actively taking up phosphate (33P-Pi),AT33P and 3H-leucine (Leu) within each probe-identified group inthe control mesocosms at the beginning of the experiment. Eachdata point represents the average of two mesocosms. Error barsrepresent the standard deviation.
Bacterioplankton groups using Pi and DOP 2337
© 2012 Society for Applied Microbiology and Blackwell Publishing Ltd, Environmental Microbiology, 14, 2334–2347
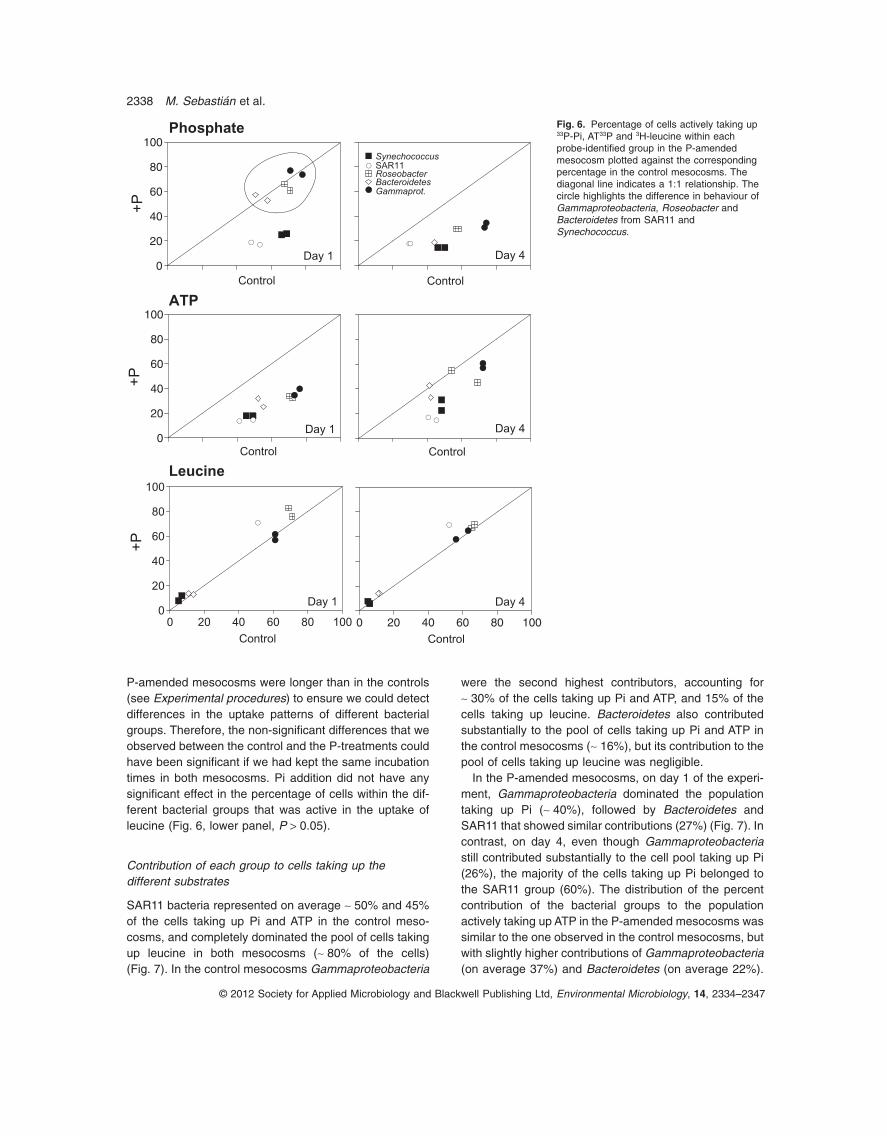
P-amended mesocosms were longer than in the controls(see Experimental procedures) to ensure we could detectdifferences in the uptake patterns of different bacterialgroups. Therefore, the non-significant differences that weobserved between the control and the P-treatments couldhave been significant if we had kept the same incubationtimes in both mesocosms. Pi addition did not have anysignificant effect in the percentage of cells within the dif-ferent bacterial groups that was active in the uptake ofleucine (Fig. 6, lower panel, P > 0.05).
Contribution of each group to cells taking up thedifferent substrates
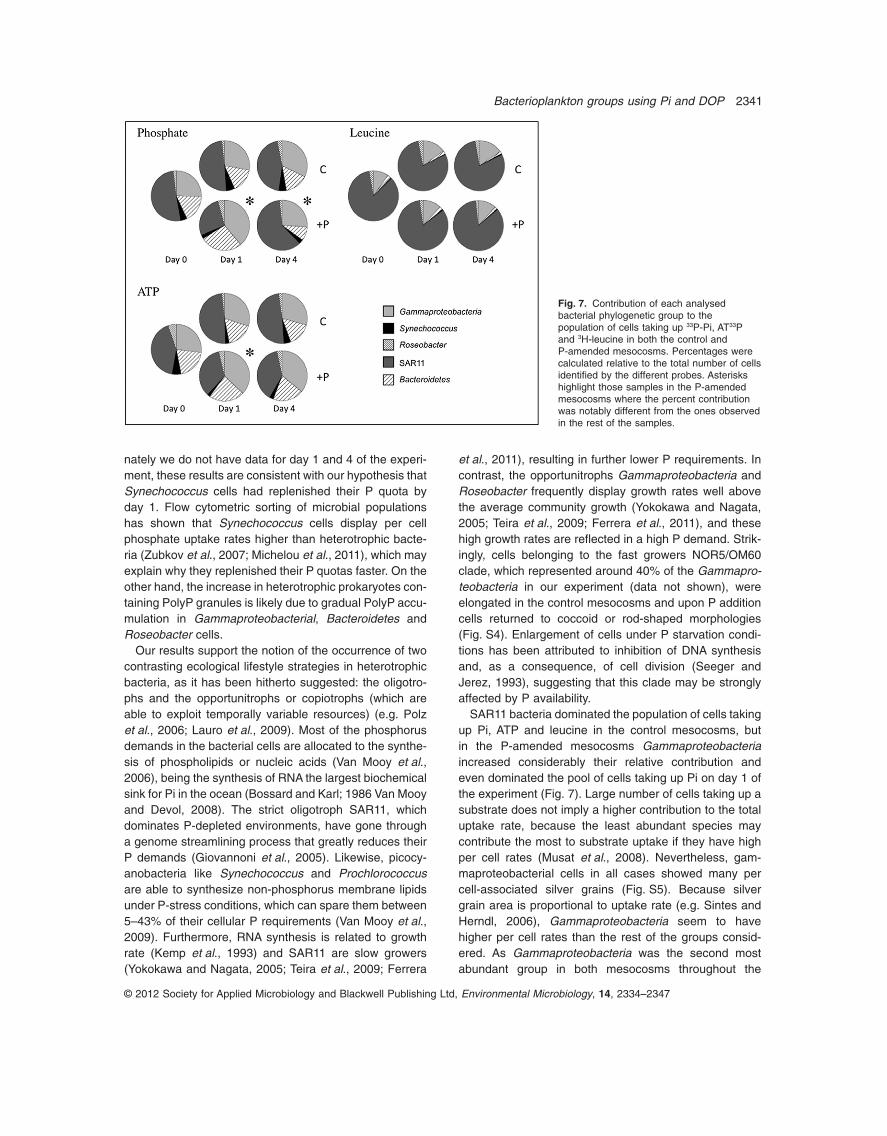
SAR11 bacteria represented on average ~ 50% and 45%of the cells taking up Pi and ATP in the control meso-cosms, and completely dominated the pool of cells takingup leucine in both mesocosms (~ 80% of the cells)(Fig. 7). In the control mesocosms Gammaproteobacteria
were the second highest contributors, accounting for~ 30% of the cells taking up Pi and ATP, and 15% of thecells taking up leucine. Bacteroidetes also contributedsubstantially to the pool of cells taking up Pi and ATP inthe control mesocosms (~ 16%), but its contribution to thepool of cells taking up leucine was negligible.
In the P-amended mesocosms, on day 1 of the experi-ment, Gammaproteobacteria dominated the populationtaking up Pi (~ 40%), followed by Bacteroidetes andSAR11 that showed similar contributions (27%) (Fig. 7). Incontrast, on day 4, even though Gammaproteobacteriastill contributed substantially to the cell pool taking up Pi(26%), the majority of the cells taking up Pi belonged tothe SAR11 group (60%). The distribution of the percentcontribution of the bacterial groups to the populationactively taking up ATP in the P-amended mesocosms wassimilar to the one observed in the control mesocosms, butwith slightly higher contributions of Gammaproteobacteria(on average 37%) and Bacteroidetes (on average 22%).
Fig. 6. Percentage of cells actively taking up33P-Pi, AT33P and 3H-leucine within eachprobe-identified group in the P-amendedmesocosm plotted against the correspondingpercentage in the control mesocosms. Thediagonal line indicates a 1:1 relationship. Thecircle highlights the difference in behaviour ofGammaproteobacteria, Roseobacter andBacteroidetes from SAR11 andSynechococcus.
0
20
40
60
80
100
Day 1
0
20
40
60
80
100
0
20
40
60
80
100
0 20 40 60 80 100
Control
0 20 40 60 80 100Control
Day 4
+P
+P
+P
Phosphate
ATP
Leucine
Day 1 Day 4
Day 1 Day 4
SynechococcusSAR11RoseobacterBacteroidetesGammaprot.
Control Control
Control Control
2338 M. Sebastián et al.
© 2012 Society for Applied Microbiology and Blackwell Publishing Ltd, Environmental Microbiology, 14, 2334–2347
SAR11 represented on average 37% of the ATP-consuming bacteria in these mesocosms.
Even though the percent contribution of the bacterialgroups to the pool of cells taking up leucine was unaf-fected by Pi addition, the total abundance of SAR11 cellstaking up leucine did increase in the P-amended meso-cosms in relation to the control mesocosms (Fig. S1).
Discussion
Turnover times of Pi and ATP, and prokaryoticheterotrophic abundance and production
To evaluate the P-status of the initial seawater, we firstmeasured the turnover times of Pi and ATP, which indicatehow fast these substrates are being utilized. Pi turnovertimes in the control bags were in the lower range of thoseobserved in eastern Mediterranean waters (1–28 h,Tanaka et al., 2007). Zohary and Robarts (1998) estab-lished that Pi turnover times < 7 h in the eastern Mediter-ranean were indicative of P-deficiency, suggesting that themicrobial community in our control bags was very likelyP-starved. Indeed, our observed Pi turnover time valueswere similar to those measured in the western Mediterra-nean when both phytoplankton and bacteria were P-limited(Thingstad et al., 1998) and similar to the values observedduring the CYCLOPS experiment before addition of Pi(2–4 h) (Fonnes Flaten et al., 2005), when the bacterialcommunity was P-limited. In these studies P-limitation wasdefined as the limitation of the rates of heterotrophicprokaryotic activity. In our study, the observed increase inheterotrophic prokaryotic abundance and production in theP-amended mesocosm supports the hypothesis that themicrobial community was originally limited by P availability.An increase in heterotrophic prokaryotic production uponPi supply was also observed during the CYCLOPS experi-ment, but in contrast to what we observe here, prokaryoticnumbers were unaffected by the increase in P (Pitta et al.,2005). In the P-amended mesocosms Pi turnover timeincreased, as it has been observed in other studies when Piwas added (Thingstad et al., 2005; Tanaka et al., 2011) orwhen there is an injection of Pi in the system due to wintermixing (Tanaka et al., 2004) or due to local convectivemixing events, as it occurs in the Rhodes Gyre (Zohary andRobarts, 1998).
Pi is the preferred source of P for the microbial commu-nity. When Pi is not sufficient to meet their requirements,bacteria induce the Pho regulon, a suite of genes thatcode for proteins required for scavenging Pi and the useof DOP compounds, like ATP (Wanner, 1996; Sebastianand Ammerman, 2009). The turnover times of ATP in thecontrol mesocosms were longer than the Pi turnovertimes (Fig. 1) because ATP needs to be hydrolysed priorto uptake by the cell (Bengis-Garber and Kushner, 1982;
Lugtenberg, 1987; Sebastian and Ammerman, 2011). Ourvalues in the control mesocosms were one to two ordersof magnitude lower than other ATP turnover time valuesmeasured also in the summer in the eastern Mediterra-nean Sea (Tanaka et al., 2011), indicating that ATP wasbeing rapidly utilized in our system. ATP has been used inseveral studies as a model molecule to assess thedynamics of bioavailable low molecular weight DOP(Lovdal et al., 2007; Zubkov et al., 2007; Casey et al.,2009; Michelou et al., 2011) because it is ubiquitouslyfound in seawater and its uptake is inhibited by a widevariety of organic P compounds (Azam and Hodson,1977). In our study, the ratio between the ATP and Piturnover rates in the control mesocosms throughout theexperiment indicated that ATP uptake was ~ 30% of Piuptake (details not shown), suggesting DOP played asubstantial role in supplying P to satisfy the P require-ments of the microbial cells in these P-starved waters.
The fact that ATP turnover time in the P-amended meso-cosms did not increase as much as the turnover time of Pi(Fig. 1) might seem intriguing, since in the presence ofsufficient Pi we would not expect bacteria to use ATP as asource of P, which would result in longer ATP turnovertimes. However, similar patterns were obtained in a recentstudy in the Mediterranean Sea (Tanaka et al., 2011). ATPis mainly hydrolysed by two types of enzymes: alkalinephosphatases (APases) and 5′-nucleotidases (5PN)(Ammerman and Azam, 1991). APases are non-specificphosphomonoesterases that recognize terminal phos-phates of many phosphomonoesters and even short poly-phosphate chains (McComb et al., 1979) whereas 5PNrecognizes the carbon moiety of 5′-nucleotides (Bengis-Garber and Kushner, 1982). APases are induced upon Pstress (e.g. Ammerman and Azam, 1991; Sebastian andAmmerman, 2009), but in contrast, 5PN are not regulatedby Pi concentration (Ammerman and Azam, 1985; 1991;Tamminen, 1989). Therefore, 5PN were probably respon-sible for most of ATP hydrolysis in the P-amended meso-cosms, although it is also possible that the concentration ofPi was not enough to completely shut down APase activityand both enzymes were contributing to the hydrolysis ofATP. The reason we observed uptake of the hydrolysed PifromATP in the P-amended mesocosms might be that 5PNandAPases are membrane bound or periplasmic enzymes(e.g. Bengis-Garber and Kushner, 1982; Martinez andAzam, 1993) and therefore the Pi released upon hydrolysiscould be taken up directly without intermediate mixing withthe pool of ambient Pi (Tamminen, 1989; Ammerman andAzam, 1991; Thingstad et al., 1993).
Single cell analyses
MARFISH has been used in environmental studies in anattempt to understand the ecophysiological roles that
Bacterioplankton groups using Pi and DOP 2339
© 2012 Society for Applied Microbiology and Blackwell Publishing Ltd, Environmental Microbiology, 14, 2334–2347
microbes play in complex natural systems (e.g. Cottrelland Kirchman, 2000; Vila-Costa et al., 2007; Salcheret al., 2011). This technique provides qualitative informa-tion about the amount of cells in a probe-identified groupthat is actively taking up a radiolabelled substrate (e.g. delGiorgio and Gasol, 2008). Because of the fact that largersilver grain clusters corresponds to higher uptake percell than smaller clusters (Nielsen et al., 2003), someresearchers have quantified the uptake by different bac-terial groups by measuring the silver grain area aroundthe cells (e.g. Cottrell and Kirchman, 2003; Sintes andHerndl, 2006). However, relative grain densities aroundorganisms depend not only on the cell but also on theenergy of the tracer and the thickness and sensitivity ofthe photographic emulsion (Perry, 1964). High energyisotopes like 33P provide high sensitivity but also the highenergy particles produced during decay of the isotopetravel further through the autoradiographic emulsion andproduce a wide scatter of silver grains, and therefore, lessresolution (Okabe et al., 2004).
Due to difficulties in accurately estimating the silvergrain area when using 33P, in this study cells were scoredas active (MAR+) when they were in contact with at leastone silver grain. Even though the scattering of silvergrains could yield errors in the quantification of MAR+cells, we obtained very consistent results even when rep-licates were processed separately, in different hybridiza-tions and microautoradiography batches. All the bacterialphylogenetic groups contributed to the uptake of both Piand ATP in the P-starved waters of the control meso-cosms (Fig. 5). Despite the MARFISH approach does notenable us estimating uptake rates, we can make someinferences based on our observations and knowledge of Pmetabolism. When phytoplankton and bacterial cells areP-starved, a sudden supply of phosphate results in surgeuptake, followed by lower uptake rates as the internal cellquotas get filled up (Jansson, 1993; Ducobu et al., 1998).This observation has been made with cultures but is sup-ported by field observations. For instance, higher uptakerates are observed under P stress in aquatic systems (e.g.Vadstein and Olsen, 1989; Fonnes Flaten et al., 2005)and Suttle and colleagues (1988) observed that Pi addi-tion to P-starved waters resulted in rapid Pi uptake, butthe uptake rates gradually declined when followed duringa time course. In our experiment, the percentage of cellstaking up leucine was similar between the P-amendedand the control mesocosms throughout the experiment(Fig. 6), thereby indicating that the cells were similarlyactive. Therefore, we posit that the decrease in the per-centage of 33P-labelled cells in the P-amended meso-cosms is mainly due to a reduction in Pi uptake rates(Fig. 3 and Fig. 6, upper panels). A lower percentage oflabelled cells does not imply that non-labelled cellsstopped completely the uptake of Pi, because in the
P-amended mesocosm the radiolabelled Pi was dilutedmore than 300-fold with ambient Pi (Fig. S2).
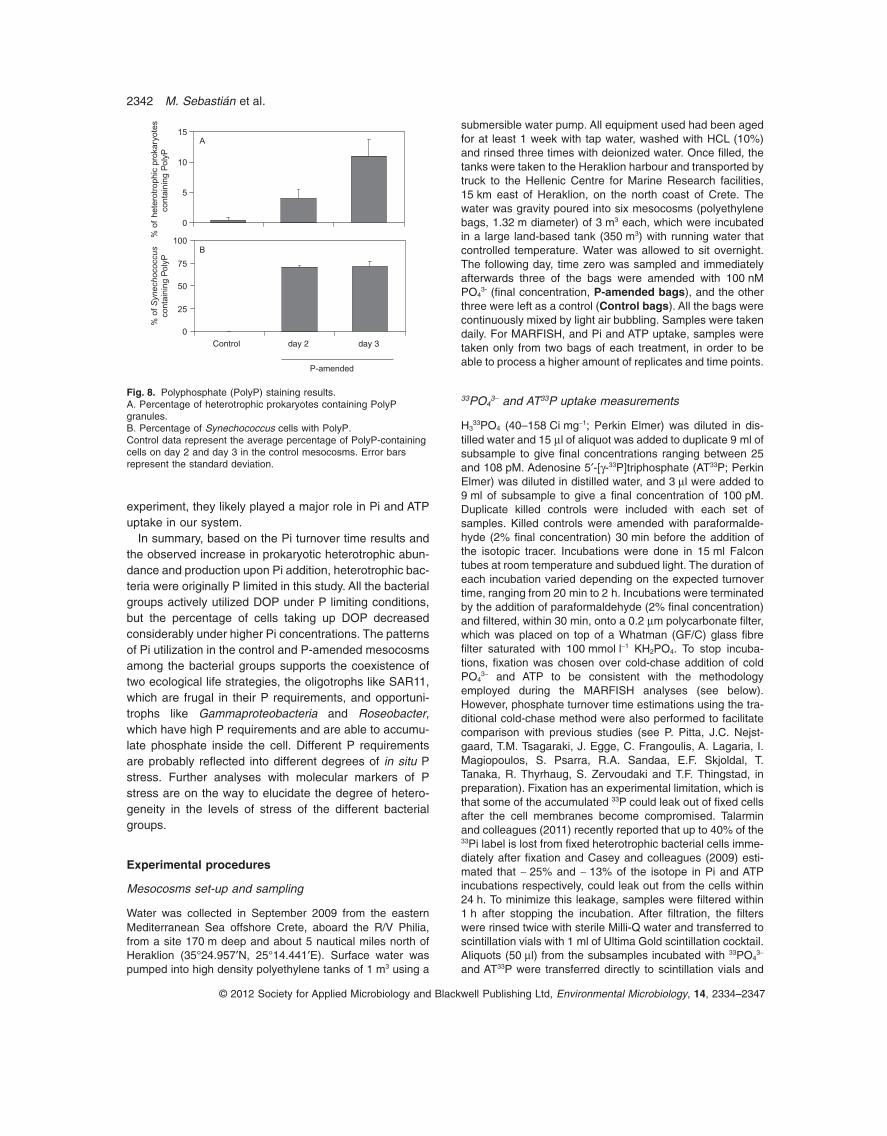
There might be considerable heterogeneity in the actual‘stress’ different bacteria experience under the same envi-ronmental conditions, depending on their different cellularquotas, nutrient acquisition capacities and metabolism.Our results show that the percentage of cells takingup 33Pi in Gammaproteobacteria, Roseobacter andBacteroidetes in the P-amended mesocosm 1 day after Piaddition was similar to the ones observed in the controlmesocosms, whereas the percentages in SAR11 andSynechococcus had considerably decreased. This obser-vation suggests that Gammaproteobacteria, Roseobacterand Bacteroidetes cells by day 1 had not yet completelyreplenished their P quotas. However, on day 4 of theexperiment the percentage of cells taking up 33Pi in thesegroups decreased to values similar to the ones observedin SAR11 and Synechococcus, suggesting that all thegroups had by then filled up their internal cell quotas. Fastaccumulation of particulate phosphorus in the bacterialsize fraction due to luxury consumption (i.e. Pi uptake inexcess of the immediate requirement for growth) upon aPi pulse is a recurrent phenomenon in P-starved waters(Thingstad et al., 1993; 1996; 2005). Indeed, culturestudies have shown that one of the components of thePho-regulon is the enzyme polyphosphate kinase (Ppk)(Geissdorfer et al., 1998; Jahid et al., 2006), which cataly-ses the formation of polyphosphates (PolyP) in P-starvedcells in response to a sudden Pi supply. Despite theirpotential importance for survival in P-depleted systems,studies about the role of PolyP in oligotrophic marineenvironments are scarce, and limited only to Cyanobac-teria (Orchard et al., 2010) or to in silico studies (Temper-ton et al., 2011). By searching for the ppk gene in thegenomes of marine cultured representatives, we investi-gated whether the different probe-identified groups in thisstudy are potentially able to accumulate phosphorusinside the cells. We found that most of the cultured rep-resentatives in the Gammaproteobacteria, Roseobacter,Bacteroidetes and Synechococcus lineages are poten-tially able to form PolyP (Table S1). In contrast, only oneout of the five isolates of SAR11 sequenced to date pos-sesses this enzyme, indicating that this group likely playsa limited role in PolyP accumulation. Using staining pro-cedures (see Experimental procedures) we confirmedthat Synechococcus and some heterotrophic bacterialcells accumulated PolyP in the P-amended mesocosms,while PolyP formation did not occur in the control meso-cosms (Fig. 8 and Fig. S3). We found that the percentageof PolyP-accumulating heterotrophic bacterial cells in theP-amended mesocosms increased from day 2 to day 3,whereas the percentage of Synechococcus cells contain-ing PolyP was already notably high on day 2 andremained constant on day 3 (Fig. 8). Although unfortu-
2340 M. Sebastián et al.
© 2012 Society for Applied Microbiology and Blackwell Publishing Ltd, Environmental Microbiology, 14, 2334–2347
nately we do not have data for day 1 and 4 of the experi-ment, these results are consistent with our hypothesis thatSynechococcus cells had replenished their P quota byday 1. Flow cytometric sorting of microbial populationshas shown that Synechococcus cells display per cellphosphate uptake rates higher than heterotrophic bacte-ria (Zubkov et al., 2007; Michelou et al., 2011), which mayexplain why they replenished their P quotas faster. On theother hand, the increase in heterotrophic prokaryotes con-taining PolyP granules is likely due to gradual PolyP accu-mulation in Gammaproteobacterial, Bacteroidetes andRoseobacter cells.
Our results support the notion of the occurrence of twocontrasting ecological lifestyle strategies in heterotrophicbacteria, as it has been hitherto suggested: the oligotro-phs and the opportunitrophs or copiotrophs (which areable to exploit temporally variable resources) (e.g. Polzet al., 2006; Lauro et al., 2009). Most of the phosphorusdemands in the bacterial cells are allocated to the synthe-sis of phospholipids or nucleic acids (Van Mooy et al.,2006), being the synthesis of RNA the largest biochemicalsink for Pi in the ocean (Bossard and Karl; 1986 Van Mooyand Devol, 2008). The strict oligotroph SAR11, whichdominates P-depleted environments, have gone througha genome streamlining process that greatly reduces theirP demands (Giovannoni et al., 2005). Likewise, picocy-anobacteria like Synechococcus and Prochlorococcusare able to synthesize non-phosphorus membrane lipidsunder P-stress conditions, which can spare them between5–43% of their cellular P requirements (Van Mooy et al.,2009). Furthermore, RNA synthesis is related to growthrate (Kemp et al., 1993) and SAR11 are slow growers(Yokokawa and Nagata, 2005; Teira et al., 2009; Ferrera
et al., 2011), resulting in further lower P requirements. Incontrast, the opportunitrophs Gammaproteobacteria andRoseobacter frequently display growth rates well abovethe average community growth (Yokokawa and Nagata,2005; Teira et al., 2009; Ferrera et al., 2011), and thesehigh growth rates are reflected in a high P demand. Strik-ingly, cells belonging to the fast growers NOR5/OM60clade, which represented around 40% of the Gammapro-teobacteria in our experiment (data not shown), wereelongated in the control mesocosms and upon P additioncells returned to coccoid or rod-shaped morphologies(Fig. S4). Enlargement of cells under P starvation condi-tions has been attributed to inhibition of DNA synthesisand, as a consequence, of cell division (Seeger andJerez, 1993), suggesting that this clade may be stronglyaffected by P availability.
SAR11 bacteria dominated the population of cells takingup Pi, ATP and leucine in the control mesocosms, butin the P-amended mesocosms Gammaproteobacteriaincreased considerably their relative contribution andeven dominated the pool of cells taking up Pi on day 1 ofthe experiment (Fig. 7). Large number of cells taking up asubstrate does not imply a higher contribution to the totaluptake rate, because the least abundant species maycontribute the most to substrate uptake if they have highper cell rates (Musat et al., 2008). Nevertheless, gam-maproteobacterial cells in all cases showed many percell-associated silver grains (Fig. S5). Because silvergrain area is proportional to uptake rate (e.g. Sintes andHerndl, 2006), Gammaproteobacteria seem to havehigher per cell rates than the rest of the groups consid-ered. As Gammaproteobacteria was the second mostabundant group in both mesocosms throughout the
Fig. 7. Contribution of each analysedbacterial phylogenetic group to thepopulation of cells taking up 33P-Pi, AT33Pand 3H-leucine in both the control andP-amended mesocosms. Percentages werecalculated relative to the total number of cellsidentified by the different probes. Asteriskshighlight those samples in the P-amendedmesocosms where the percent contributionwas notably different from the ones observedin the rest of the samples.
Bacterioplankton groups using Pi and DOP 2341
© 2012 Society for Applied Microbiology and Blackwell Publishing Ltd, Environmental Microbiology, 14, 2334–2347
experiment, they likely played a major role in Pi and ATPuptake in our system.
In summary, based on the Pi turnover time results andthe observed increase in prokaryotic heterotrophic abun-dance and production upon Pi addition, heterotrophic bac-teria were originally P limited in this study. All the bacterialgroups actively utilized DOP under P limiting conditions,but the percentage of cells taking up DOP decreasedconsiderably under higher Pi concentrations. The patternsof Pi utilization in the control and P-amended mesocosmsamong the bacterial groups supports the coexistence oftwo ecological life strategies, the oligotrophs like SAR11,which are frugal in their P requirements, and opportuni-trophs like Gammaproteobacteria and Roseobacter,which have high P requirements and are able to accumu-late phosphate inside the cell. Different P requirementsare probably reflected into different degrees of in situ Pstress. Further analyses with molecular markers of Pstress are on the way to elucidate the degree of hetero-geneity in the levels of stress of the different bacterialgroups.
Experimental procedures
Mesocosms set-up and sampling
Water was collected in September 2009 from the easternMediterranean Sea offshore Crete, aboard the R/V Philia,from a site 170 m deep and about 5 nautical miles north ofHeraklion (35°24.957′N, 25°14.441′E). Surface water waspumped into high density polyethylene tanks of 1 m3 using a
submersible water pump. All equipment used had been agedfor at least 1 week with tap water, washed with HCL (10%)and rinsed three times with deionized water. Once filled, thetanks were taken to the Heraklion harbour and transported bytruck to the Hellenic Centre for Marine Research facilities,15 km east of Heraklion, on the north coast of Crete. Thewater was gravity poured into six mesocosms (polyethylenebags, 1.32 m diameter) of 3 m3 each, which were incubatedin a large land-based tank (350 m3) with running water thatcontrolled temperature. Water was allowed to sit overnight.The following day, time zero was sampled and immediatelyafterwards three of the bags were amended with 100 nMPO4
3- (final concentration, P-amended bags), and the otherthree were left as a control (Control bags). All the bags werecontinuously mixed by light air bubbling. Samples were takendaily. For MARFISH, and Pi and ATP uptake, samples weretaken only from two bags of each treatment, in order to beable to process a higher amount of replicates and time points.
33PO43- and AT33P uptake measurements
H333PO4 (40–158 Ci mg-1; Perkin Elmer) was diluted in dis-
tilled water and 15 ml of aliquot was added to duplicate 9 ml ofsubsample to give final concentrations ranging between 25and 108 pM. Adenosine 5′-[g-33P]triphosphate (AT33P; PerkinElmer) was diluted in distilled water, and 3 ml were added to9 ml of subsample to give a final concentration of 100 pM.Duplicate killed controls were included with each set ofsamples. Killed controls were amended with paraformalde-hyde (2% final concentration) 30 min before the addition ofthe isotopic tracer. Incubations were done in 15 ml Falcontubes at room temperature and subdued light. The duration ofeach incubation varied depending on the expected turnovertime, ranging from 20 min to 2 h. Incubations were terminatedby the addition of paraformaldehyde (2% final concentration)and filtered, within 30 min, onto a 0.2 mm polycarbonate filter,which was placed on top of a Whatman (GF/C) glass fibrefilter saturated with 100 mmol l-1 KH2PO4. To stop incuba-tions, fixation was chosen over cold-chase addition of coldPO4
3- and ATP to be consistent with the methodologyemployed during the MARFISH analyses (see below).However, phosphate turnover time estimations using the tra-ditional cold-chase method were also performed to facilitatecomparison with previous studies (see P. Pitta, J.C. Nejst-gaard, T.M. Tsagaraki, J. Egge, C. Frangoulis, A. Lagaria, I.Magiopoulos, S. Psarra, R.A. Sandaa, E.F. Skjoldal, T.Tanaka, R. Thyrhaug, S. Zervoudaki and T.F. Thingstad, inpreparation). Fixation has an experimental limitation, which isthat some of the accumulated 33P could leak out of fixed cellsafter the cell membranes become compromised. Talarminand colleagues (2011) recently reported that up to 40% of the33Pi label is lost from fixed heterotrophic bacterial cells imme-diately after fixation and Casey and colleagues (2009) esti-mated that ~ 25% and ~ 13% of the isotope in Pi and ATPincubations respectively, could leak out from the cells within24 h. To minimize this leakage, samples were filtered within1 h after stopping the incubation. After filtration, the filterswere rinsed twice with sterile Milli-Q water and transferred toscintillation vials with 1 ml of Ultima Gold scintillation cocktail.Aliquots (50 ml) from the subsamples incubated with 33PO4
3-
and AT33P were transferred directly to scintillation vials and
% o
f hete
rotr
ophic
pro
kary
ote
s
conta
inin
g P
oly
P
0
25
50
75
100
Control day 2 day 3
0
5
10
15A
B
% o
f Syn
echo
cocc
usconta
inin
g P
oly
P
P-amended
Fig. 8. Polyphosphate (PolyP) staining results.A. Percentage of heterotrophic prokaryotes containing PolyPgranules.B. Percentage of Synechococcus cells with PolyP.Control data represent the average percentage of PolyP-containingcells on day 2 and day 3 in the control mesocosms. Error barsrepresent the standard deviation.
2342 M. Sebastián et al.
© 2012 Society for Applied Microbiology and Blackwell Publishing Ltd, Environmental Microbiology, 14, 2334–2347
mixed with 1 ml of scintillation cocktail to measure the totaladded radioactivity. Samples were radioassayed in a PackardTri-Carb 4000 scintillation counter. Turnover times were cal-culated using the equation T = t/[-ln (1 - R)], wheret = incubation time and R = consumed fraction of addedtracer (Thingstad et al., 1993). Killed controls were sub-tracted prior to the calculations.
Prokaryotic abundance
Samples for prokaryotic abundance determination (2 ml)were fixed with a 0.2 mm filtered 25% glutaraldehyde solution,to give a final concentration of 0.5%. After fixation (20 min,4°C), the samples were fast frozen in liquid nitrogen andfinally stored in -80°C. Once in the laboratory, the sampleswere thawed at room temperature, stained with SYBRGreenI (final dilution: 4 ¥ 10-4 of the commercial dilution) and incu-bated for 10 min in the dark. Prokaryotic abundance wasdetermined on a daily basis with a Becton-Dickinson FACS-Calibur flow cytometer using Milli-Q water as sheath fluid.Abundances were calculated from the measured flow rate.Flow cytometry data were acquired with the CellQuestand analysed with the Paint-A-Gate software packages(Becton-Dickinson).
Prokaryotic heterotrophic production
Prokaryotic heterotrophic production was determined in allmesocosms every day by uptake of tritium-labelled leucine(Kirchman et al., 1985) using the centrifugation procedure.Triplicate samples and one prefixed control sample wereincubated with 3H-Leucine (4.27 TBq mmol-1, Perkin Elmer,Boston, USA) at a final concentration of 60 nM. Incubationwas performed in the dark at in situ temperature for 1 h andstopped with 5% TCA, final concentration. The samples werethen centrifuged at 16 000 g for 10 min before removal of thesupernatant. Then the samples were washed twice by adding5% TCA, vortexed, centrifuged and the supernatant removed.Counting cocktail (Ecoscint A, National Diagnostics, Atlanta,USA) was added and the uptake of radioactive leucine mea-sured by liquid scintillation counting. Conversion of leucineto carbon units was done with the theoretical factor1.5 kg C mol Leu-1.
MAR-(CARD)-FISH
Incubations for microautoradiography were similar to those tomeasure bulk uptake rates. Samples (30 ml) were spikedwith H3
33PO4, AT33P and 3H-leucine (Perkin Elmer) to yield25–108 pM, 100 pM and 0.5 nM respectively. The sampleswere incubated for 1 h (H3
33PO4) and 3 h (AT33P) in thecontrol mesocosms and 4 h (H3
33PO4, AT33P) in theP-amended mesocosms. Incubations with 3H-leucine alwayslasted 2.5 h. Because of the expected decrease in the uptakeof Pi and ATP in the P-amended mesocosms due to substratedilution with ambient phosphate, longer incubations werecarried out to ensure detection. Uptake of Pi and ATP is welldescribed by the theoretical equation R(t) = (1 - e-t/T) (e.g.Thingstad et al., 1993), where R(t) is the fraction of addedlabel consumed after incubation time t and T is the turnover
time. This equation follows an asymptotic curve, and incuba-tion times were always chosen so that the uptake of thesubstrate was well in the linear phase, but long enough to beable to appreciate differences between phylogenetic groups.One replicate (for each substrate and treatment) was killedwith formaldehyde before the addition of the radiolabelledsubstrates and was used as a control. At the end of theincubation, samples were fixed with paraformaldehyde,allowed to sit in the dark for at least 1 h, and then portions of10 ml were filtered onto three different 0.2 mm polycarbonatefilters. Filters were washed twice with sterile Milli-Q water andfrozen at -80°C until processing in the lab. Filters were thenhybridized following the CARDFISH protocol (Pernthaleret al., 2002) to identify the different bacterial groups. Afterthawing, the filters were dipped in 0.1% agarose, dried at37°C, and then dehydrated with 95% ethanol. This allowedattachment of the cells to the filters. Then, cell walls werepermeabilized with lysozyme (1 h) and achromopeptidase(30 min) at 37°C. Filters were cut into multiple pieces andhybridized with one of six horseradish peroxidase (HRP)-labelled probes: EUB338 I-II and –III (targets most Eubacte-ria, Daims et al., 1999), GAM42a together with its unlabelledcompetitor probe (targets most Gammaproteobacteria, Manzet al., 1992), CF319a (targets many members of theBacteroidetes group, Manz et al., 1996), ROS537 (targetsmembers of the Alphaproteobacteria Roseobacter-Sulfitobacter-Silicibacter group, Eilers et al., 2000), SYN405(targets Synechococcus, West et al., 2001), SAR11-441R(targets the Alphaproteobacteria SAR11, Morris et al., 2002).Specific hybridization conditions were established by additionof formamide to the hybridization buffers (45% formamide forthe SAR11 probe, 60% for the SYN405 probe, 55% for theother probes). Hybridization was performed overnight at35°C. For amplification, we used tyramide labelled with Alexa488. After processing, a small portion of the filter was cut andstained with DAPI (final concentration 1 mg ml-1) to quantifythe abundance of the different phylogenetic groups in relationto total prokaryotic counts. The rest of the filter was gluedonto a glass slide and subsequently processed for microau-toradiography as described in detail in Alonso-Sáez andGasol (2007), which is a modification of the protocoldescribed by Alonso and Pernthaler (2005). Exposure timeswere determined empirically for each compound by followingchanges in number of cells taking up the substrate over time.Optimal exposure times were selected once the number ofcells taking up the substrate reached a plateau but accumu-lation of silver grains still allowed visualization of the cellsassociated to them. Cells were counted in an Olympus BX61epifluorescence microscope. Cells touching or overlappingsilver grains after developing of the emulsion were consid-ered as active cells or MAR+ cells. For abundance of probe-positive cells, between 500 and 1000 DAPI-positive cellswere counted manually in a minimum of 10 fields. Killedcontrols were evaluated with the probe EUB338 I-II and –III.The proportion of labelled cells in the killed controls was 6%for H3
33PO4, 4% for AT33P and 2% for 3H-leucine. This propor-tion was not subtracted from the percent of cells taking up thesubstrates in the live incubations. Even though Synechococ-cus is not a heterotroph we included it in our analysesbecause it had been hypothesized to be the major player in Piuptake in eastern Mediterranean (Moutin et al., 2002).
Bacterioplankton groups using Pi and DOP 2343
© 2012 Society for Applied Microbiology and Blackwell Publishing Ltd, Environmental Microbiology, 14, 2334–2347
Polyphosphate staining
Polyphosphate (PolyP) granules were stained with DAPI.This stain is commonly used for DNA detection but it alsointeracts with PolyP. When excited at 360 nm DAPI-DNAfluorescence is blue-white, but DAPI-PolyP emits a typicalgreen yellow fluorescence signal in organisms that are ableto accumulate high levels of PolyP (Tijssen et al., 1982).Paraformaldehyde-fixed cells, collected onto 0.2 mm polycar-bonate filters were stored frozen at -80°C until analyses. Forthe staining, filters were submerged in 5 ml of PBS and 50 mlof DAPI solution (0.5 mg ml-1) were added. After incubatingfor 3 min in the dark, filters were washed shortly with distilledwater and dried at room temperature. Cells were counted inan Olympus BX61 epifluorescence microscope. For thedetermination of PolyP-accumulating heterotrophic bacteria,PolyP granules associated to pigmented picoplankton weresubstracted from each frame (see Fig. S3).
Acknowledgements
The mesocosm experiment in the Cretacosmos facility wasarranged in cooperation by project Nutritunnel financed bythe Research Council of Norway and the MESOAQUA EUnetwork. The processing of the samples was supportedby the grants FOSMICRO (CTM2009-07679-E), STORM(CTM2009-09352/MAR), SUMMER (CTM2008-03309/MAR)and MALASPINA (CSD2008 – 00077) funded by the SpanishMinistry of Science and Innovation. We thank Irene Forn andClara Ruiz for their help with the CARDFISH and MARFISHtechniques, Iordanis Magiopoulos for performing the flowcytometer analyses and Tatiana Tsagaraki for performing theinorganic nutrient analyses. Marta Sebastián was supportedby the Spanish Ministry of Science and Innovation through a‘Juan de la Cierva’ award.
References
Alonso, C., and Pernthaler, J. (2005) Incorporation of glucoseunder anoxic conditions by bacterioplankton from coastalNorth Sea surface waters. Appl Environ Microbiol 71:1709–1716.
Alonso-Sáez, L., and Gasol, J.M. (2007) Seasonal variationin the contribution of different bacterial groups to theuptake of low molecular weight-compounds in NW Medi-terranean coastal waters. Appl Environ Microbiol 73:3528–3535.
Alonso-Sáez, L., Balague, V., Sa, E., Sanchez, O., Gonzalez,J.M., Pinhassi, J., et al. (2007) Seasonality in bacterialdiversity in north-west Mediterranean coastal waters:assessment through clone libraries, fingerprinting andFISH. FEMS Microbiol Ecol 60: 98–112.
Amann, R., and Fuchs, B.M. (2008) Single-cell identificationin microbial communities by improved fluorescence in situhybridization techniques. Nat Rev Microbiol 6: 339–348.
Ammerman, J.W., and Azam, F. (1985) Bacterial5-nucleotidase in aquatic ecosystems: a novel mechanismof phosphorus regeneration. Science 227: 1338–1340.
Ammerman, J.W., and Azam, F. (1991) Bacterial5′-nucleotidase activity in estuarine and coastal marine
waters: characterization of enzyme activity. Limnol Ocean-ogr 36: 1427–1436.
Ammerman, J.W., Hood, R.R., Case, D.A., and Cotner, J.B.(2003) Phosphorus deficiency in the Atlantic: an emergingparadigm in oceanography. Eos 84: 165–170.
Azam, F., and Hodson, R.E. (1977) Size distribution andactivity of marine microheterotrophs. Limnol Oceanogr 22:492–501.
Bengis-Garber, C., and Kushner, D.J. (1982) Role ofmembrane-bound 5′-nucleotidase in nucleotide uptake bythe moderate halophile Vibrio costicola. J Bacteriol 149:808–815.
Bentzen, E., Taylor, W.D., and Millard, E.S. (1992) The impor-tance of dissolved organic phosphorus to phosphorusuptake by limnetic plankton. Limnol Oceanogr 37: 217–231.
Bossard, P., and Karl, D.M. (1986) The direct measurementof ATP and adenine nucleotide pool turnover in microor-ganisms: a new method for environmental assessment ofmetabolism, energy flux and phosphorus dynamics.J Plankton Res 8: 1–13.
Buchan, A., Gonzalez, J.M., and Moran, M.A. (2005) Over-view of the marine Roseobacter lineage. Appl EnvironMicrobiol 71: 5665–5677.
Caron, D.A., Lim, E.L., Sanders, R.W., Dennett, M.R., andBerninger, U.G. (2000) Responses of bacterioplankton andphytoplankton to organic carbon and inorganic nutrientadditions in contrasting oceanic ecosystems. Aquat MicrobEcol 22: 175–184.
Casey, J.R., Lomas, M.W., Michelou, V.K., Dyhrman, S.T.,Orchard, E.D., Ammerman, J.W., and Sylvan, J.B. (2009)Phytoplankton taxon-specific orthophosphate (Pi) and ATPutilization in the western subtropical North Atlantic. AquatMicrob Ecol 58: 31–44.
Cotner, J.B., Ammerman, J.W., Peele, E.R., and Bentzen, E.(1997) Phosphorus-limited bacterioplankton growth in theSargasso Sea. Aquat Microb Ecol 13: 141–149.
Cottrell, M.T., and Kirchman, D.L. (2000) Natural assem-blages of marine proteobacteria and members of theCytophaga-Flavobacter cluster consuming low-and high-molecular-weight dissolved organic matter. Appl EnvironMicrobiol 66: 1692–1697.
Cottrell, M.T., and Kirchman, D.L. (2003) Contribution ofmajor bacterial groups to bacterial biomass production(thymidine and leucine incorporation) in the Delawareestuary. Limnol Oceanogr 48: 168–178.
Currie, D.J., and Kalff, J. (1984) The relative importance ofphytoplankton and bacterioplankton in phosphorus uptakein freshwater. Limnol Oceanogr 29: 311–321.
Daims, H., Brühl, A., Amann, R., Schleifer, K.H., and Wagner,M. (1999) The domain-specific probe EUB338 is insuffi-cient for the detection of all bacteria: development andevaluation of a more comprehensive probe set. Syst ApplMicrobiol 22: 434–444.
De Corte, D., Yokokawa, T., Varela, M.M., Agogué, H., andHerndl, G.J. (2008) Spatial distribution of Bacteria andArchaea and amoA gene copy numbers throughout thewater column of the Eastern Mediterranean Sea. ISME J 3:147–158.
Ducobu, H., Huisman, J., Jonker, R.R., and Mur, L.R. (1998)Competition between a prochlorophyte and a cyanobacte-
2344 M. Sebastián et al.
© 2012 Society for Applied Microbiology and Blackwell Publishing Ltd, Environmental Microbiology, 14, 2334–2347
rium under various phosphorus regimes: comparison withthe Droop model. J Phycol 34: 467–476.
Eilers, H., Pernthaler, J., Glockner, F.O., and Amann, R.(2000) Culturability and in situ abundance of pelagic bac-teria from the North Sea. Appl Environ Microbiol 66: 3044.
Ferrera, I., Gasol, J.M., Sebastián, M., Hojerová, E., andKoblí\vzek, M. (2011) Comparison of growth rates ofaerobic anoxygenic phototrophic bacteria and other bacte-rioplankton groups in coastal Mediterranean waters. ApplEnviron Microbiol 77: 7451–7458.
Fonnes Flaten, G.A., Skjoldal, E.F., Krom, M.D., Law, C.S.,Mantoura, R.F.C., Pitta, P., et al. (2005) Studies of themicrobial P-cycle during a Lagrangian phosphate-additionexperiment in the Eastern Mediterranean. Deep Sea ResPart II Top Stud Oceanogr 52: 2928–2943.
Geissdorfer, W., Ratajczak, A., and Hillen, W. (1998) Tran-scription of ppk from Acinetobacter sp. strain ADP1, encod-ing a putative polyphosphate kinase, is induced byphosphate starvation. Appl Environ Microbiol 64: 896.
del Giorgio, P.A., and Gasol, J.M. (2008) Physiological struc-ture and single-cell activity in marine bacterioplankton. InMicrobial Ecology of the Oceans, Second Edition. Kirch-man, D.L. (ed.). Hoboken, NJ, USA: John Wiley & Sons,pp. 243–298.
Giovannoni, S.J., Tripp, H.J., Givan, S., Podar, M., Vergin,K.L., Baptista, D., et al. (2005) Genome streamlining in acosmopolitan oceanic bacterium. Science 309: 1242.
Jahid, I.K., Silva, A.J., and Benitez, J.A. (2006) Polyphos-phate stores enhance the ability of Vibrio cholerae to over-come environmental stresses in a low-phosphateenvironment. Appl Environ Microbiol 72: 7043.
Jansson, M. (1993) Uptake, exchange, and excretion oforthophosphate in phosphate-starved Scenedesmus quad-ricauda and Pseudomonas K7. Limnol Oceanogr 38:1162–1178.
Kemp, P.F., Lee, S., and LaRoche, J. (1993) Estimating thegrowth rate of slowly growing marine bacteria from RNAcontent. Appl Environ Microbiol 59: 2594–2601.
Kirchman, D., K’nees, E., and Hodson, R. (1985) Leucineincorporation and its potential as a measure of proteinsynthesis by bacteria in natural aquatic systems. ApplEnviron Microbiol 49: 599.
Krom, M.D., Kress, N., Brenner, S., and Gordon, L.I. (1991)Phosphorus limitation of primary productivity in the easternMediterranean Sea. Limnol Oceanogr 36: 424–432.
Krom, M.D., Thingstad, T.F., Brenner, S., Carbo, P., Drako-poulos, P., Fileman, T.W., et al. (2005) Summary and over-view of the CYCLOPS P addition Lagrangian experiment inthe Eastern Mediterranean. Deep Sea Res Part II Top StudOceanogr 52: 3090–3108.
Laghdass, M., Catala, P., Caparros, J., Oriol, L., Lebaron, P.,and Obernosterer, I. (2011) High Contribution of SAR11to Microbial Activity in the North West MediterraneanSea. Microb Ecol 63: 1–10. DOI: 10.1007/s00248-011-9915-7.
Larsen, A., Tanaka, T., Zubkov, M.V., and Thingstad, T.F.(2008) P-affinity measurements of specific osmotrophpopulations using cell-sorting flow cytometry. LimnolOceanogr Methods 6: 355–363.
Lauro, F.M., McDougald, D., Thomas, T., Williams, T.J., Egan,S., Rice, S., et al. (2009) The genomic basis of trophic
strategy in marine bacteria. Proc Natl Acad Sci USA 106:15527.
Lomas, M.W., Burke, A.L., Lomas, D.A., Bell, D.W., Shen, C.,Dyhrman, S.T., and Ammerman, J.W. (2010) SargassoSea phosphorus biogeochemistry: an important role fordissolved organic phosphorus (DOP). Biogeosciences 7:695–710.
Longnecker, K., Lomas, M.W., and Van Mooy, B.A.S. (2010)Abundance and diversity of heterotrophic bacterial cellsassimilating phosphate in the subtropical North AtlanticOcean. Environ Microbiol 12: 2773–2782.
Lovdal, T., Tanaka, T., and Thingstad, T.F. (2007) Algal-bacterial competition for phosphorus from dissolved DNA,ATP, and orthophosphate in a mesocosm experiment.Limnol Oceanogr 52: 1407–1419.
Lugtenberg, B. (1987) The pho regulon in Escherichia coli. InPhosphate Metabolism and Cellular Regulation in Microor-ganisms. Torriani-Gorini, A., Rothman, F.G., Silver, S.,Wright, A., and Yagil, E. (eds). Washington, DC, USA: Am.Soc. Microbiol., pp. 1–2.
McComb, R.B., Bowers, G.N., and Posen, S. (1979) AlkalinePhosphatase. New York, NY, USA: Plenum Publishing Cor-poration.
Manz, W., Amann, R., Ludwig, W., Wagner, M., and Schleifer,K.H. (1992) Phylogenetic oligodeoxynucleotide probes forthe major subclasses of proteobacteria: problems andsolutions. Syst Appl Microbiol 15: 593–600.
Manz, W., Amann, R., Ludwig, W., Vancanneyt, M., andSchleifer, K.H. (1996) Application of a suite of 16S rRNA-specific oligonucleotide probes designed to investigatebacteria of the phylum Cytophaga-Flavobacter-Bacteroides in the natural environment. Microbiology 142:1097–1106.
Martinez, J., and Azam, F. (1993) Periplasmic aminopepti-dase and alkaline phosphatase activities in a marine bac-terium: implications for substrate processing in the sea.Mar Ecol Prog Ser 92: 89–89.
Michelou, V.K., Lomas, M.W., and Kirchman, D.L. (2011)Phosphate and adenosine-5′-triphosphate uptake bycyanobacteria and heterotrophic bacteria in the SargassoSea. Limnol Oceanogr 56: 323–332.
Morris, R.M., Rappé, M.S., Connon, S.A., Vergin, K.L.,Siebold, W.A., Carlson, C.A., and Giovannoni, S.J. (2002)SAR11 clade dominates ocean surface bacterioplanktoncommunities. Nature 420: 806–810.
Moutin, T., Thingstad, T.F., Van Wambeke, F., Marie, D.,Slawyk, G., Raimbault, P., and Claustre, H. (2002) Doescompetition for nanomolar phosphate supply explain thepredominance of the cyanobacterium Synechococcus?Limnol Oceanogr 47: 1562–1567.
Musat, N., Halm, H., Winterholler, B., Hoppe, P., Peduzzi, S.,Hillion, F., et al. (2008) A single-cell view on the ecophysi-ology of anaerobic phototrophic bacteria. Proc Natl AcadSci USA 105: 17861.
Nielsen, J.L., Christensen, D., Kloppenborg, M., and Nielsen,P.H. (2003) Quantification of cell-specific substrate uptakeby probe-defined bacteria under in situ conditions bymicroautoradiography and fluorescence in situ hybridiza-tion. Environ Microbiol 5: 202–211.
Okabe, S., Kindaichi, T., and Ito, T. (2004) MAR-FISH – anecophysiological approach to link phylogenetic affiliation
Bacterioplankton groups using Pi and DOP 2345
© 2012 Society for Applied Microbiology and Blackwell Publishing Ltd, Environmental Microbiology, 14, 2334–2347
and in situ metabolic activity of microorganisms at a single-cell resolution. Microbes Environ 19: 83–98.
Orchard, E.D., Benitez-Nelson, C.R., Pellechia, P.J., Lomas,M.W., and Dyhrmane, S.T. (2010) Polyphosphate in Tri-chodesmium from the low-phosphorus Sargasso Sea.Limnol Oceanogr 55: 2161–2169.
Pernthaler, A., Pernthaler, J., and Amann, R. (2002) Fluores-cence in situ hybridization and catalyzed reporter deposi-tion for the identification of marine bacteria. Appl EnvironMicrobiol 68: 3094–3101.
Perry, R.P. (1964) Quantitative autoradiography. In Methodsin Cell Physiology. Prescott, D.M. (ed.). New York, NY,USA: Academic Press, pp. 305–326.
Pinhassi, J., Gómez-Consarnau, L., Alonso-Sáez, L., Sala,M.M., Vidal, M., Pedrós-Alió, C., and Gasol, J.M. (2006)Seasonal changes in bacterioplankton nutrient limitationand their effects on bacterial community composition in theNW Mediterranean Sea. Aquat Microb Ecol 44: 241–252.
Pitta, P., Stambler, N., Tanaka, T., Zohary, T., Tselepides, A.,and Rassoulzadegan, F. (2005) Biological response to Paddition in the Eastern Mediterranean Sea. The microbialrace against time. Deep Sea Res Part II Top Stud Ocean-ogr 52: 2961–2974.
Polz, M.F., Hunt, D.E., Preheim, S.P., and Weinreich, D.M.(2006) Patterns and mechanisms of genetic and pheno-typic differentiation in marine microbes. Philos Trans R SocLond B Biol Sci 361: 2009–2021.
Pulido-Villena, E., Rérolle, V., and Guieu, C. (2010) Transientfertilizing effect of dust in P-deficient LNLC surface ocean.Geophys Res Lett 37: L01603.
Rivkin, R.B., and Anderson, M.R. (1997) Inorganic nutrientlimitation of oceanic bacterioplankton. Limnol Oceanogr42: 730–740.
Salcher, M.M., Pernthaler, J., and Posch, T. (2011) Seasonalbloom dynamics and ecophysiology of the freshwater sisterclade of SAR11 bacteria ‘that rule the waves’ (LD12). ISMEJ 5: 1242–1252.
Sebastian, M., and Ammerman, J.W. (2009) The alkalinephosphatase PhoX is more widely distributed in marinebacteria than the classical PhoA. ISME J 3: 563–572.
Sebastian, M., and Ammerman, J.W. (2011) Role of the phos-phatase PhoX in the phosphorus metabolism of the marinebacterium Ruegeria pomeroyi DSS-3. Environ MicrobiolRep 3: 535–542. DOI:10.1111/j.1758-2229.2011.00253.x.
Seeger, M., and Jerez, C.A. (1993) Phosphate-starvationinduced changes in Thiobacillus ferrooxidans. FEMSMicrobiol Lett 108: 35–41.
Sintes, E., and Herndl, G.J. (2006) Quantifying substrateuptake by individual cells of marine bacterioplankton bycatalyzed reporter deposition fluorescence in situ hybrid-ization combined with microautoradiography. Appl EnvironMicrobiol 72: 7022–7028.
Strickland, J.D., and Parsons, T.R. (1972) A Practical Hand-book of Seawater Analysis, Bulletin 167. Ottawa, ON,Canada: Fisheries Research Board of Canada, p. 310.
Suttle, C.A., Stockner, J.G., Shortreed, K.S., and Harrison,P.J. (1988) Time-courses of size-fractionated phosphateuptake: are larger cells better competitors for pulses ofphosphate than smaller cells? Oecologia 74: 571–576.
Suttle, C.A., Fuhrman, J.A., and Capone, D.G. (1990) Rapidammonium cycling and concentration-dependent partition-
ing of ammonium and phosphate: implications for carbontransfer in planktonic communities. Limnol Oceanogr 35:424–433.
Talarmin, A., Van Wambeke, F., Duhamel, S., Catala, P.,Moutin, T., and Lebaron, P. (2011) Improved methodologyto measure taxon-specific phosphate uptake in live andunfiltered samples. Limnol Oceanogr Methods 9: 443–453.
Tamminen, T. (1989) Dissolved organic phosphorus regen-eration by bacterioplankton: 5′-nucleotidase activity andsubsequent phosphate uptake in a mesocosm enrichmentexperiment. Mar Ecol Prog Ser 58: 89–100.
Tanaka, T., Rassoulzadegan, F., and Thingstad, T.F. (2004)Orthophosphate uptake by heterotrophic bacteria, cyano-bacteria, and autotrophic nanoflagellates in VillefrancheBay, northwestern Mediterranean: Vertical, seasonal, andshort-term variations of the competitive relationship forphosphorus. Limnol Oceanogr 49: 1063–1072.
Tanaka, T., Zohary, T., Krom, M.D., Law, C.S., Pitta, P.,Psarra, S., et al. (2007) Microbial community structure andfunction in the Levantine Basin of the eastern Mediterra-nean. Deep Sea Res A 54: 1721–1743.
Tanaka, T., Thingstad, T.F., Christaki, U., Colombet, J.,Cornet-Barthaux, V., Courties, C., et al. (2011) Lack ofP-limitation of phytoplankton and heterotrophic prokary-otes in surface waters of three anticyclonic eddies in thestratified Mediterranean Sea. Biogeosciences 8: 525–538.
Teira, E., Martínez-García, S., Lønborg, C., and Álvarez-Salgado, X.A. (2009) Growth rates of different phylogeneticbacterioplankton groups in a coastal upwelling system.Environ Microbiol Rep 1: 545–554.
Temperton, B., Gilbert, J.A., Quinn, J.P., McGrath, J.W., andFriedberg, I. (2011) Novel analysis of oceanic surfacewater metagenomes suggests importance of polyphos-phate metabolism in oligotrophic environments. PLoS ONE6: e16499.
Thingstad, T.F., Skjoldal, E.F., and Bohne, R.A. (1993) Phos-phorus cycling and algal-bacterial competition in Sandsf-jord, western Norway. Mar Ecol Prog Ser 99: 239–239.
Thingstad, T.F., Dolan, J.R., and Fuhrman, J.A. (1996) Lossrate of an oligotrophic bacterial assemblage as measuredby 3H-thymidine and 32P04: good agreement and near-balance with production. Aquat Microb Ecol 10: 29–36.
Thingstad, T.F., Zweifel, U.L., and Rassoulzadegan, F. (1998)P limitation of heterotrophic bacteria and phytoplankton inthe northwest Mediterranean. Limnol Oceanogr 43: 88–94.
Thingstad, T.F., Krom, M.D., Mantoura, R.F.C., Flaten, G.A.F.,Groom, S., Herut, B., et al. (2005) Nature of phosphoruslimitation in the ultraoligotrophic eastern Mediterranean.Science 309: 1068–1071.
Tijssen, J.P., Beekes, H.W., and Van, S.J. (1982) Localizationof polyphosphates in Saccharomyces fragilis, as revealedby 4′,6-diamidino-2-phenylindole fluorescence. BiochimBiophys Acta 721: 394–398.
Vadstein, O., and Olsen, Y. (1989) Chemical compositon andphosphate uptake kinetics of limnetic bacterial communi-ties cultured in chemostats under phosphorus limitation.Limnol Oceanogr 34: 939–946.
Van Mooy, B.A.S., and Devol, A.H. (2008) Assessing nutrientlimitation of Prochlorococcus in the North Pacific subtropi-cal gyre by using an RNA capture method. Limnol Ocean-ogr 53: 78–88.
2346 M. Sebastián et al.
© 2012 Society for Applied Microbiology and Blackwell Publishing Ltd, Environmental Microbiology, 14, 2334–2347
Van Mooy, B.A.S., Rocap, G., Fredricks, H.F., Evans, C.T.,and Devol, A.H. (2006) Sulfolipids dramatically decreasephosphorus demand by picocyanobacteria in oligotrophicmarine environments. Proc Natl Acad Sci USA 103: 8607.
Van Mooy, B.A.S., Fredricks, H.F., Pedler, B.E., Dyhrman,S.T., Karl, D.M., Koblízek, M., et al (2009) Phytoplankton inthe ocean use non-phosphorus lipids in response to phos-phorus scarcity. Nature 458: 69–72.
Van Wambeke, F., Christaki, U., Giannakourou, A., Moutin,T., and Souvemerzoglou, K. (2002) Longitudinal and verti-cal trends of bacterial limitation by phosphorus and carbonin the Mediterranean Sea. Microb Ecol 43: 119–133.
Vaulot, D., LeBot, N., Marie, D., and Fukai, E. (1996) Effect ofphosphorus on the Synechococcus cell cycle in surfaceMediterranean waters during summer. Appl Environ Micro-biol 62: 2527–2533.
Vila-Costa, M., Pinhassi, J., Alonso, C., Pernthaler, J.,and Simó, R. (2007) An annual cycle ofdimethylsulfoniopropionate-sulfur and leucine assimilatingbacterioplankton in the coastal NW Mediterranean. EnvironMicrobiol 9: 2451–2463.
Wanner, B.L. (1996) Phosphorus assimilation and control ofthe phosphate regulon. In Escherichia and Salmonella:Cellular and Molecular Biology. Neidhardt, F.C. (ed.).Washington, DC, USA: ASM Press, pp. 1357–1381.
West, N.J., Schonhuber, W.A., Fuller, N.J., Amann, R.I.,Rippka, R., Post, A.F., and Scanlan, D.J. (2001) Closelyrelated Prochlorococcus genotypes show remarkably dif-ferent depth distributions in two oceanic regions asrevealed by in situ hybridization using 16S rRNA-targetedoligonucleotides. Microbiology 147: 1731.
Yokokawa, T., and Nagata, T. (2005) Growth and grazingmortality rates of phylogenetic groups of bacterioplanktonin coastal marine environments. Appl Environ Microbiol 71:6799–6807.
Zohary, T., and Robarts, R.D. (1998) Experimental study ofmicrobial P limitation in the eastern Mediterranean. LimnolOceanogr 43: 387–395.
Zubkov, M.V., Mary, I., Woodward, E.M., Warwick, P.E.,Fuchs, B.M., Scanlan, D.J., and Burkill, P.H. (2007) Micro-bial control of phosphate in the nutrient-depleted NorthAtlantic subtropical gyre. Environ Microbiol 9: 2079–2089.
Zweifel, U.L., and Hagstrom, A. (1995) Total counts of marinebacteria include a large fraction of non-nucleoid-containingbacteria (ghosts). Appl Environ Microbiol 61: 2180.
Supporting information
Additional Supporting Information may be found in the onlineversion of this article:
Fig. S1. Abundance of cells within each probe-identifiedgroup actively incorporating 33P-Pi, AT33P and 3H-leucine inthe control (left panel) and P-amended mesocosms (rightpanel).Fig. S2. Phosphate (Pi) concentration estimated by conven-tional methods (Strickland and Parsons, 1972) in the control(open symbols) and P-amended mesocosms (filled symbols).Pi concentration in the P-amended mesocosms immediatelyafter Pi addition was not measured, so the theoretical con-centration (sum of existing Pi + 100 nM added Pi) is plottedinstead. The 33P-Pi added ranged between 25 and 108 pM.Fig. S3. Epifluorescence microscopy images of (A) DAPI-stained cells showing the presence of polyphosphates(yellow granules) on day 3 of the experiment in theP-amended mesocosm; (B) same field of view showing autof-luorescence of cyanobacterial cells. Note that heterotrophicbacterial cells also contain polyphosphate granules. No poly-phosphate granules were observed in the control mesocosm,where microbial cells where limited by phosphorusavailability.Fig. S4. Morphology of NOR5/OM60 cells on day 4 of theexperiment in (A) the control mesocosm, (B) P-amendedmesocosm. NOR5/OM60 cells in the control mesocosm areelongated probably as a response to phosphorus stress. Fourdays after P addition NOR5/OM60 cells had decreased con-siderably in size. This phenomenon was not observed withother Gammaproteobacteria like Alteromonadales. Otherelongated non-NOR5/OM60 cells can as well be seen in thecontrol mesocosms, but we were not able to identify themwith any of the probes used in this study. Abundance of theNOR5/OM60 clade was determined with the probes NOR5-730, as described elsewhere (Ferrera et al., 2011).Fig. S5. Microautoradiogram showing uptake of 33P-phosphate by Gammaproteobacteria cells in the controlmesocosms. Blue dots represent DAPI-stained bacteria.Green dots represent gammaproteobacterial cells hybridizedwith the CARD-FISH Gam42a probe. Black spots are silvergrains deposited in the photographic emulsion. Cells werescored as active (MAR+) when they were in contact with atleast one silver grain.Table S1. Presence of homologues to the ppk gene ingenomes of cultured marine bacteria that belong to the phy-logenetic groups investigated in this study.
Please note: Wiley-Blackwell are not responsible for thecontent or functionality of any supporting materials suppliedby the authors. Any queries (other than missing material)should be directed to the corresponding author for the article.
Bacterioplankton groups using Pi and DOP 2347
© 2012 Society for Applied Microbiology and Blackwell Publishing Ltd, Environmental Microbiology, 14, 2334–2347
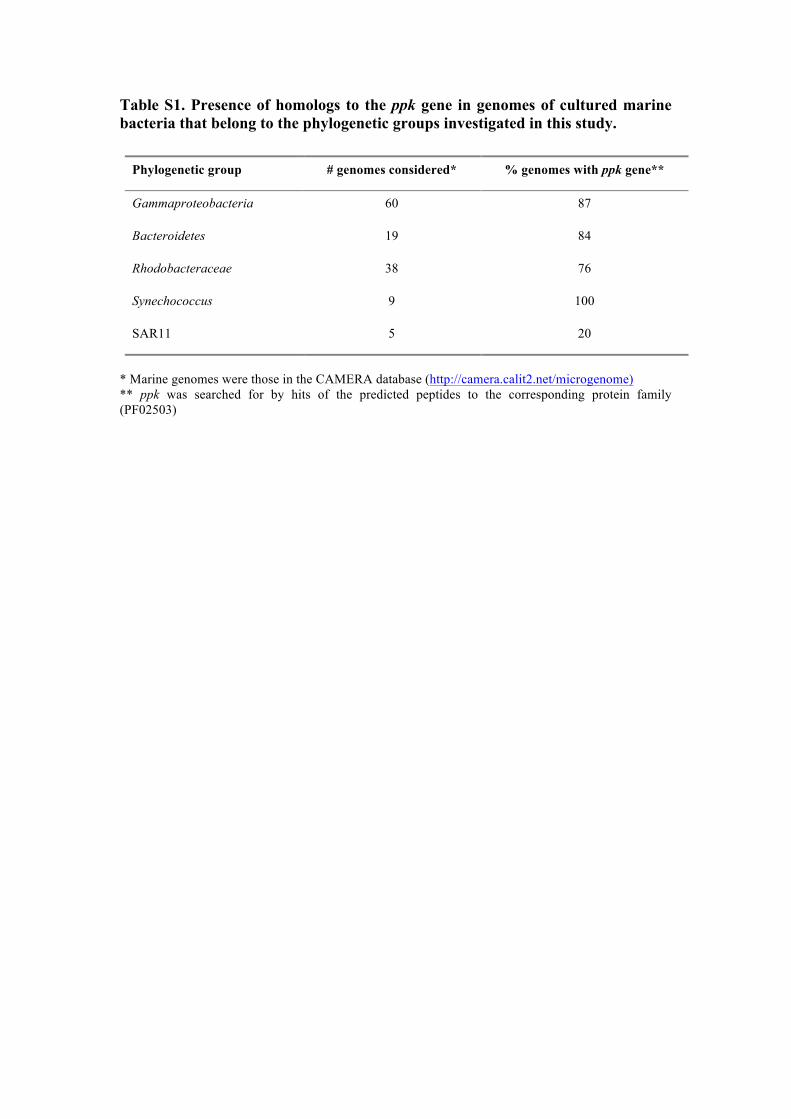
Table S1. Presence of homologs to the ppk gene in genomes of cultured marine bacteria that belong to the phylogenetic groups investigated in this study.
* Marine genomes were those in the CAMERA database (http://camera.calit2.net/microgenome) ** ppk was searched for by hits of the predicted peptides to the corresponding protein family (PF02503)
Phylogenetic group # genomes considered* % genomes with ppk gene**
Gammaproteobacteria 60 87
Bacteroidetes 19 84
Rhodobacteraceae 38 76
Synechococcus 9 100
SAR11 5 20
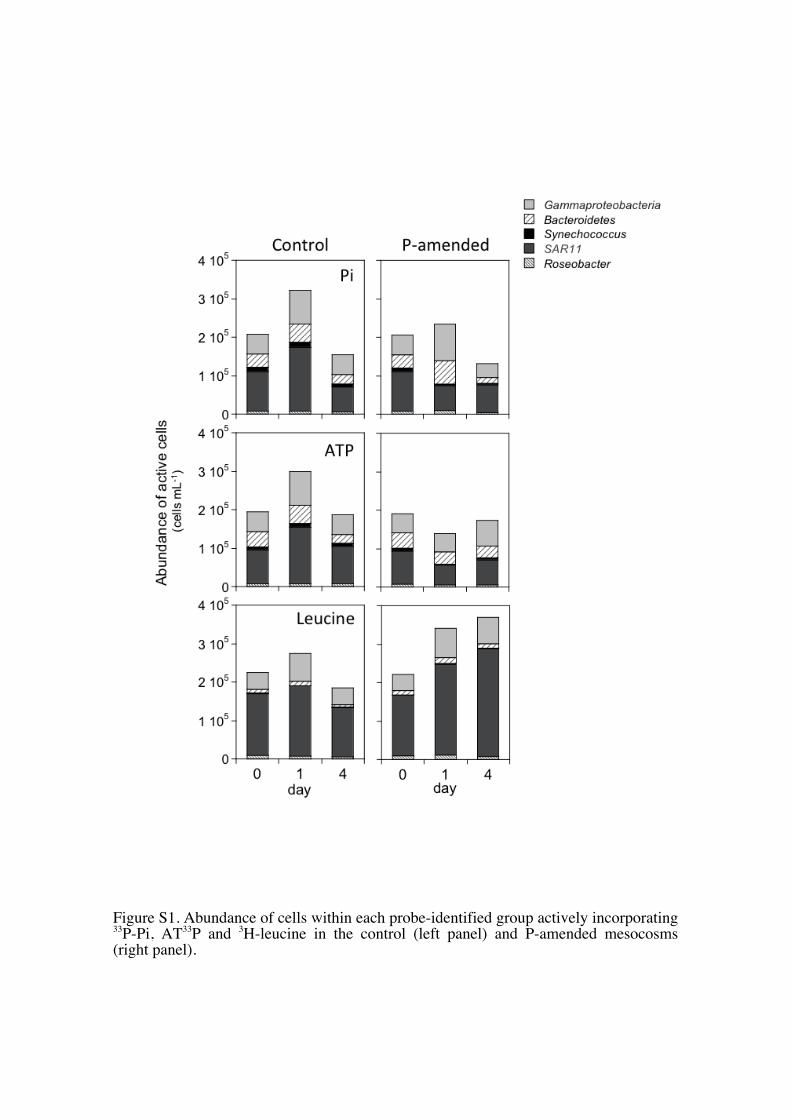
Figure S1. Abundance of cells within each probe-identified group actively incorporating 33P-Pi, AT33P and 3H-leucine in the control (left panel) and P-amended mesocosms (right panel).
Pi (µ
M)
0
0.04
0.08
0.12
0 2 4 6 8Day
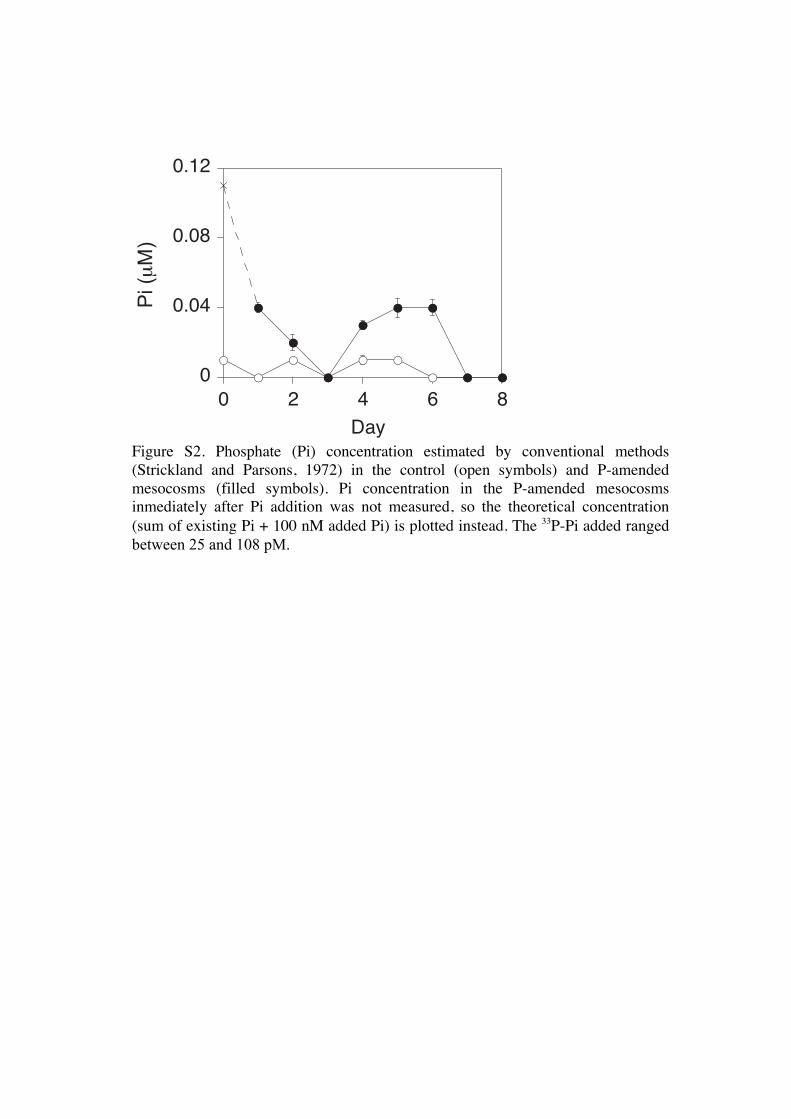
Figure S2. Phosphate (Pi) concentration estimated by conventional methods (Strickland and Parsons, 1972) in the control (open symbols) and P-amended mesocosms (filled symbols). Pi concentration in the P-amended mesocosms inmediately after Pi addition was not measured, so the theoretical concentration (sum of existing Pi + 100 nM added Pi) is plotted instead. The 33P-Pi added ranged between 25 and 108 pM.
20 µm
20 µm
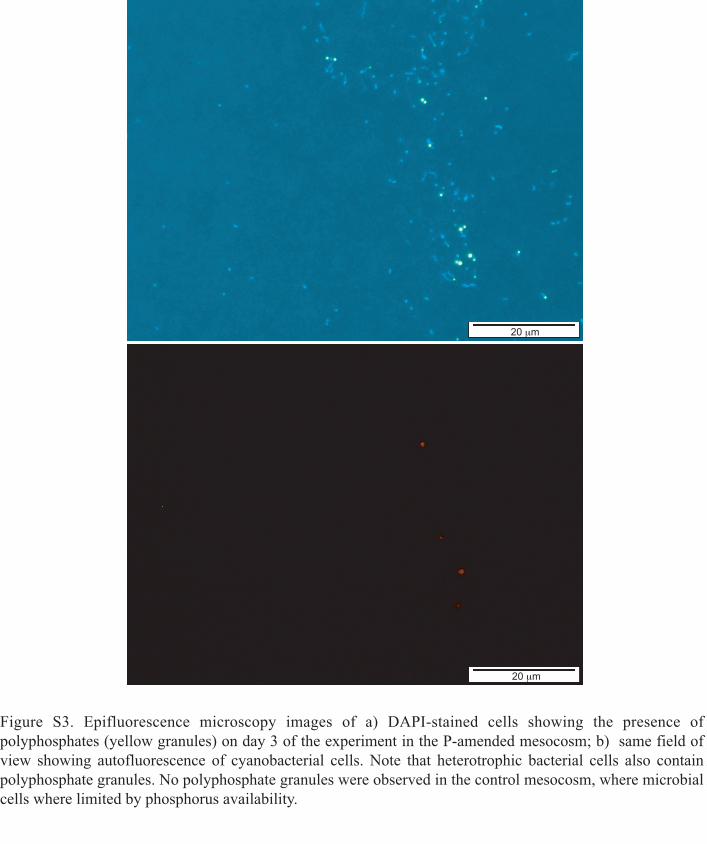
Figure S3. Epifluorescence microscopy images of a) DAPI-stained cells showing the presence of
polyphosphates (yellow granules) on day 3 of the experiment in the P-amended mesocosm; b) same field of
view showing autofluorescence of cyanobacterial cells. Note that heterotrophic bacterial cells also contain
polyphosphate granules. No polyphosphate granules were observed in the control mesocosm, where microbial
cells where limited by phosphorus availability.
a)
b)
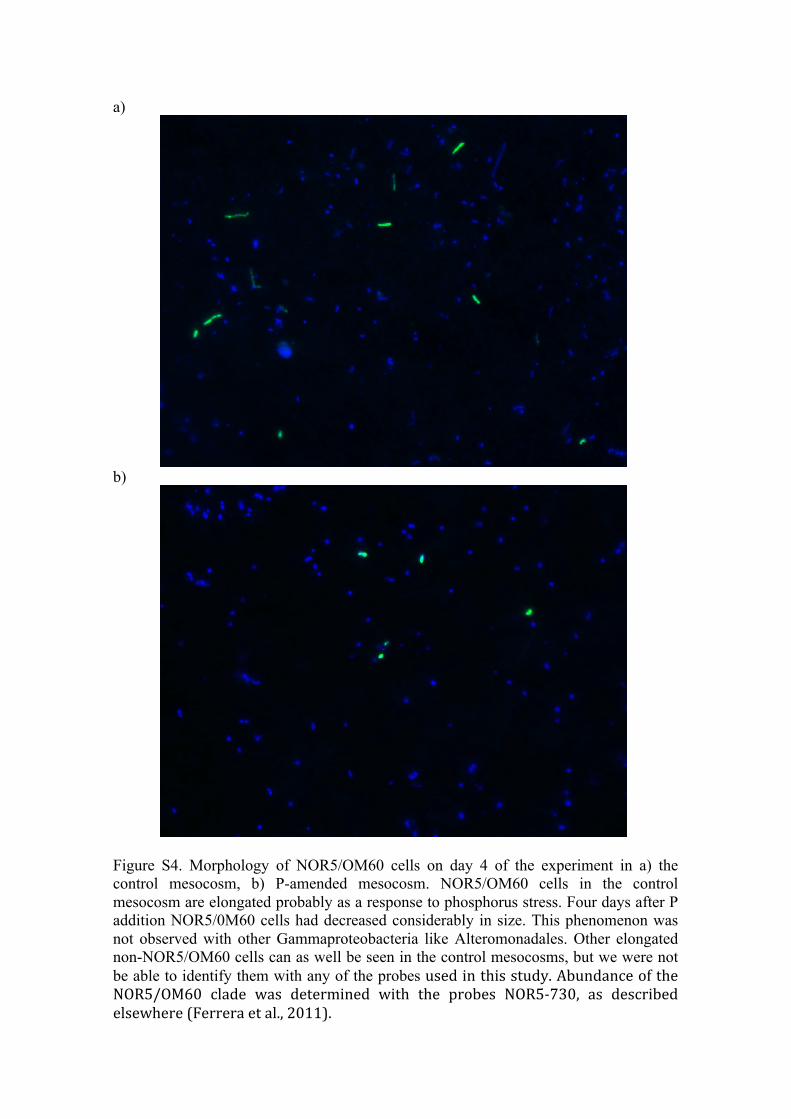
Figure S4. Morphology of NOR5/OM60 cells on day 4 of the experiment in a) the control mesocosm, b) P-amended mesocosm. NOR5/OM60 cells in the control mesocosm are elongated probably as a response to phosphorus stress. Four days after P addition NOR5/0M60 cells had decreased considerably in size. This phenomenon was not observed with other Gammaproteobacteria like Alteromonadales. Other elongated non-NOR5/OM60 cells can as well be seen in the control mesocosms, but we were not be able to identify them with any of the probes used in this study. Abundance of the NOR5/OM60 clade was determined with the probes NOR5-‐730, as described elsewhere (Ferrera et al., 2011).
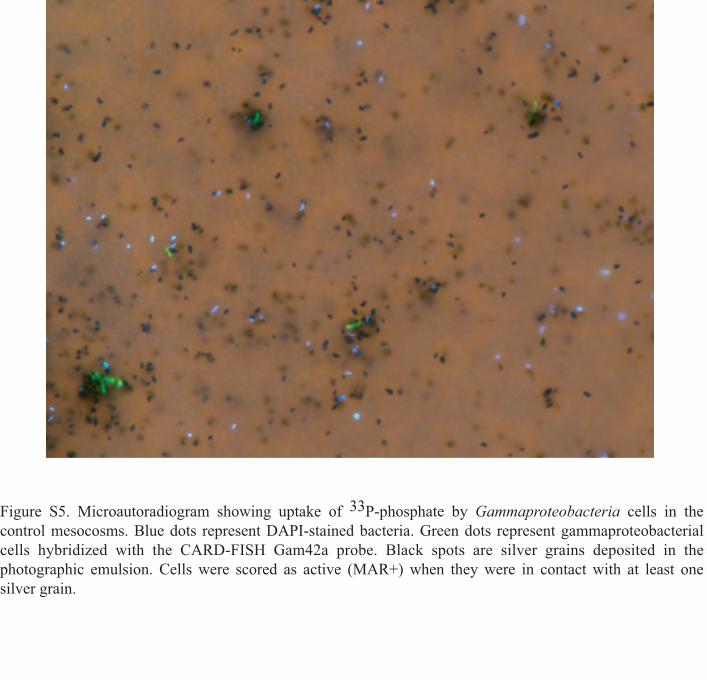
Figure S5. Microautoradiogram showing uptake of 33P-phosphate by Gammaproteobacteria cells in the
control mesocosms. Blue dots represent DAPI-stained bacteria. Green dots represent gammaproteobacterial
cells hybridized with the CARD-FISH Gam42a probe. Black spots are silver grains deposited in the
photographic emulsion. Cells were scored as active (MAR+) when they were in contact with at least one
silver grain.