Embed Size (px)
Citation preview

Badger Elementary 2013-14 Continuous School Improvement Findings
Badger Accomplishments: DPI Wisconsin PBIS School of Distinction
DPI Bronze Wisconsin School Health Award
Economics Wisconsin Stock Market Simulation State Champions Professional Learning Communities met and used Data Wall
Students participated in numerous club activities: Walking Club, Yearbook, Art, Musical-Tom Sawyer, Safety Patrol, Leadership, Service Club, Lunchtime Leaders
Family Nights held on literacy, math, PBIS, Progress Reports
SAGE GOALS: Reading: 11/13 goals met, Math 11/14 goals met
ELA Lab Classrooms: Four classroom teachers learned teaching strategies from our district reading coaches which increased teaching collaboration throughout the building.
Late Start Dates: These were utilized to develop better collaboration between grade level teachers, and provide additional staff development in the areas of math, technology, literacy, RtI.
School Improvement Goals Badger Reading Goal 2013-14: Using the guiding principles of the PBIS approach implemented with fidelity, the use of RTI, and a collaborative culture, student reading achievement will increase at Badger Elementary by May 2014:
Kindergarten
master SAGE Goals
Grade 1-3
master SAGE Goals
reach proficiency, advanced proficiency or targeted growth on spring MAP test
Grade 4 reach May instructional benchmark goal (Level S) or advance 3 benchmark levels
reach proficiency or advanced proficiency on the Spring MAP test or reach targeted growth on Spring MAP test
Grade 5
reach May instructional benchmark goal (Level V) or advance 3 benchmark levels
reach proficiency or advanced proficiency on the Spring MAP test or reach targeted growth on Spring MAP test
Grade 6
reach May instructional benchmark goal (Level Y) or advance 3 benchmark levels reach proficiency or advanced proficiency on the Spring MAP test or reach targeted growth on
Spring MAP test

RESULTS:
Percentage of students at Grade Level expected RIT or meeting RIT MAP Target Growth within 3
points in reading:
Grade 1 –72% ; Grade 2 –68% ; Grade 3--75% ; Grade 4 – 63% ; Grade 5 – 66% ; Grade 6 - 76%
Percentage of students at grade level benchmark or advancing 3 benchmark levels:
Grade 1 –79% ; Grade 2 –97% ; Grade 3 –97% ; Grade 4 –97% ; Grade 5 –90% ; Grade 6 - 67%
Kindergarten SAGE ELA Goals (4/5 Goals Met) Students will identify (name) uppercase and lowercase letters. (require 90% meeting) 98%-yes
Students will identify Book Awareness concepts. (require 90% meeting) 96%--yes
Students will develop an understanding of phonetic principles (letter-sound relationship). (require 90% meeting)
96%-yes
Students will identify (name) words on the Fountas and Pinnell kindergarten High Frequency Word list. (require 90% meeting)
94%-yes
Students will reach a level “C” or higher benchmark (require 90% meeting) 77%-no
.
Grade 1 SAGE ELA Goals (3/4 Goals Met – 1 missed goal was at 89% and goal was 90%)
Students will identify (name) words on the Fountas and Pinnell grade 1 High Frequency Word list. (require 90% meeting)
95%-yes
Students will correctly spell the words on the Fountas and Pinnell grade 1 High Frequency Word list. (require 90% meeting)
89% -no
Students will improve their writing skills. (require 90% meeting) 100%-yes
Students will increase their reading level as determined through guided reading practices and assessments. (require 90% meeting)
82%-yes
Grade 2 SAGE ELA Goals (2/2 Goals Met) Students will increase their reading level as determined through guided reading practices and assessments. 100%-yes
Students will demonstrate their writing proficiency through the district writing assessment and/or their
placement on the AASD Writing Continuum
94%-yes
Grade 3 SAGE ELA Goals (2/2 Goals Met)
Students will increase their reading levels as determined through guided reading practices and assessments. 97%-yes
Students will demonstrate their writing proficiency through their placement on the AASD Writing Continuum 92%-yes
0 20 40 60 80 100
1234567
Percent of Students
Gra
de
Le
vel
RIT MAP GROWTH

Badger Math Goal: With Badger staff improving instruction of math strategies and practices, improve instruction of computation and
problem solving skills and by using the guiding principles of the PBIS approach implemented with fidelity, the use
of RTI, and a collaborative culture, student math achievement will increase at Badger Elementary. Students will
achieve the following goals by May 2014:
90% of students in Grades K-3 students will master SAGE goals (see attached)
80% of students in grades 1-6 will score at least 70 % on district math assessments/or meet MAP target
growth within 3 points
RESULTS:
No District Math Assessment Data
Percentage of students meeting RIT MAP Target Growth within 3 points in math:
Grade 1 – 66% Grade 2 – 62% ; Grade 3 –68% ; Grade 4 – 62% ; Grade 5 – 76% ; Grade 6 - 82%
Kindergarten SAGE Math Goals (3/4 Goals Met)
Students will identify common 2 dimensional and 3 dimensional geometric shapes. 85%-no
Students will rote count to 100. 88%-yes
Students will write numbers from 0-20. 100%-yes
Students will be able to identify the number partner that makes “10” when added to a number
from 1 to 9.
96%-yes
Grade 1 SAGE Math Goals (4/4 Goals Met) Students will rote count and write numbers to 120. 89% yes
Students will solve basic addition facts to 20. 91%-yes
Students will solve basic subtraction facts to 20. 89%--yes
Students will understand that the two digits of a two-digit number represent amounts of tens and
ones.
93%-yes
Grade 2 SAGE Math Goals (1/4 Goals Met)
Students will demonstrate basic addition math facts to 20. 91%-yes
Students will demonstrate basic subtraction facts to 20. 79%-no
Students will solve two and three digit addition problems with sums to 1000. 88%-no
Students will solve two and three digit subtraction problems. 82%-no
Grade 3 SAGE Math Goals (2/2 Goals Met) Students will demonstrate an understanding of multiplication concepts. (require 90%) 95%-yes
Students will demonstrate an understanding of division concepts. (require 90%) 92%-yes
0 20 40 60 80 100
123456
Percent of Students
Gra
de
Le
vel
RIT MAP Growth Math

Data and Findings:
11/14 SAGE Goals Met – 3 missed goals were writing-related at grades K-3.
The commitment to implementing our PBIS approach with fidelity demonstrated improvements by reducing ODRs and increasing student learning time and administrative leadership.
Summary of Findings:
3rd year of implementation of block scheduling, practice/intervention/enrichment time, and PLC/Progress Monitoring time has positively affected the collaborative culture and RtI practices at Badger.
Regular PLC/Progress Monitoring meetings have increased the effective use of data and understanding of curricular connections to the Common Core Standards by teachers.
Special Education, ELL, and low-income students still not closing the achievement gap.
Badger is recognized as a PBIS School of Merit and a Bronze Wisconsin School of Health
What are 1-3 things to be considered as you develop CSIP plans for 2014-15 based upon this year’s experiences?
Innovative thinking and deeper collaboration will be required to close the learning gaps for our student subgroup populations. For example, an LD/EBD cross-categorical approach will be used next year to connect Special Education teachers and their students more closely to the grade level curriculum.
Continued professional development in best instructional practices and classroom interventions in the new ELA curriculum will be critical in improving student performance.
Create more effective Professional Learning Communities (PLC’s) to analyze data from formative assessments and create specific learning objectives and teaching strategies that ultimately lead to increased student achievement.

20132014 Site Continuous School Improvement Findings School: Janet Berry Elementary School Improvement Goal(s): Math All teaching and support staff at Janet Berry will improve students achievement in Maths so that 80% of all students in grades 16 will meet their individual projected growth (+/ 3) from fall to spring on the MAP Math assessment. Data and Findings:
Berry Elementary: 80% of students show one year’s growth
Students Hit Target Spring MAP Score
First Grade 50%
Second Grade 58%
Third Grade 64%
Fourth Grade 47%
Fifth Grade 66%
Sixth Grade 80%
School 59.5%
b. Describe your takeaways from the data; i.e. what does the data illustrate. Summary of Findings: Based upon your 201314 data, what are 35 key learnings/celebrations?
The fourth grade geometry unit is currently covered in May yet 4th grade takes the Spring MAP test in late April. We are looking at moving this unit of instruction for a better measurement as geometry is 25% of the Spring MAP test in fourth grade.
Students perform better as they progress through school so this could be indicative of learning how to take tests over time as well as learning to apply the math practices
We need to have more assessments in our portfolio to measure or growth beyond just the Spring MAP

What are 13 things to be considered as you develop CSIP plans for 201415 based upon this year’s experiences?
Our goal of 80% for the entire school grades 16, was a lofty goal. Only one of the student groups tested reached the goal. We need to think about making our goal more achievable.
We need to make Math more of a focus for our PLCs and targeted use of data to inform our practices during WIN time.
Continue to analyze our use of resources, especially human resources, so we can have as many “hands on deck” during our WIN time.

20132014 Site Continuous School Improvement Findings School: Janet Berry Elementary School School Improvement Goal(s): Literacy All Berry Elementary Staff will improve universal instruction in literacy so that 90% of all students will show at least one year’s growth during the 20132014 school year. This will be measured by Fall to Spring MAP growth scores in Reading (2 point variance) using Targeted RIT Growth and/or district benchmarking grade level goals. Note: Our targeted sub populations are Low SES, Autism Spectrum, and SLD students. Data and Findings:
Berry Elementary: 90% of students show one year’s growth
Indicator 1: Spring Benchmark Target
Indicator 2: Students Hit Target Spring MAP Score
Grade Level: Benchmark Fall Spring Spring
Kindergarten: Level C 55% 84% N/A
First Grade: Level I 77% 92% 56%
Second Grade: Level M 66% 89.5% 60%
Third Grade: Level P 71% 85% 59%
Fourth Grade: Level T 67.5% 80% 53%
Fifth Grade: Level W 78% 77% 66%
Sixth Grade: Level Y 66% 73% 47%
School 68.5% 82.4% 55%
Summary of Findings: Based upon your 201314 data, what are 35 key learnings/celebrations?
A large number of students who were at the basic or minimal benchmarks in fall made gains throughout the year advancing to at least the proficient level as measured by benchmarking targets.

By midyear, the following number of students made it to proficient, advanced proficient
1st grade, 45 out of 52 2nd grade, 43 out of 57 3rd grade, 45 out of 60 4th grade, 69 out of 82 5th grade, 62 out of 76 6th grade, 46 out of 65
Strong Tier 2 and 3 supports were implemented this year including the use
of a data wall to track student progress. Students targeted for intervention made strong gains. Gains were also noted in classrooms where the literacy coach worked annually with the classroom teacher to focus on literacy instruction.
The following lists highlights work completed based on our CSIP framework in literacy RtI
Identify and provide Tier 2 and 3 interventions, data wall meetings, summer literacy institute Collaborative Culture of Improvement
PLC meetings and set agendas, target lists of students with greatest need with focus on identified subgroups, development of data wall with CSIP goal posted on or near wall create student cards to include data, OEU 14 skill trace, book study “Interventions that Work” Family and Community Partnerships
School and Classroom Newsletters to provide information to parents about literacy, Reading Superstars TRats What are 13 things to be considered as you develop CSIP plans for 201415 based upon this year’s experiences?
Creation of common assessments to measure growth/understanding of CCSS, as well as, grade level specific measures to identify areas of need. Increase parental involvement based on parent surveyOrientation meeting to address helping their children at home with their education.

2013-2014 Site Continuous School Improvement Findings
School: Columbus Elementary School Improvement Goal(s): 85% of all Full Academic Year Columbus students grades 1 through 6 will demonstrate proficiency or above in at least 1 of the following assessment measures: Meet individual target RIT score or grade level
proficiency using MAP assessment and/or district Benchmarking by June, 2014. 85% of all Full Academic Year Columbus kindergarten students will benchmark at a level C or higher
and/or be able to associate 24/26 letter sounds. The performance of at-risk readers will be to meet the MAP Individual Target RIT goal and 1 of the
following:
Benchmark Level G in grade 1; Level L in grade 2; Level O in grade 3; Level R in grade 4; Level U in grade 5; Level X in grade 6 or an Increase 1 year’s growth in MAP RIT score
Data and Findings:
Assessment Wall Data 2013-2014 Minimal Partial Proficient Adv. Prof.
Kindergarten
Oct-13 21% 46% 21% 13%
Jan-14 15% 38% 35% 12%
Apr-14 4% 33% 29% 33%
May-14 13% 21% 33% 33%
Grade 1
Oct-13 17% 39% 22% 22%
Jan-14 5% 53% 16% 26%
Apr-14 23% 11% 37% 26%
May-14 11% 17% 33% 33%
Grade 2
Oct-13 23% 45% 23% 9%
Jan-14 14% 36% 27% 23%
Apr-14 18% 27% 23% 32%
May-14 9% 22% 43% 26%
Grade 3
Oct-13 22% 30% 35% 13%
Jan-14 9% 18% 55% 18%
Apr-14 14% 14% 50% 23%
May-14 9% 14% 55% 27%
Grade 4 Oct-13 38% 27% 35% 0%
Jan-14 32% 32% 24% 12%

Apr-14 16% 32% 36% 16%
May-14 20% 16% 44% 20%
Grade 5
Oct-13 43% 13% 23% 20%
Jan-14 41% 10% 28% 21%
Apr-14 22% 22% 33% 22%
May-14 37% 11% 33% 19%
Grade 6
Oct-13 35% 29% 29% 6%
Jan-14 31% 25% 31% 13%
Apr-14 18% 29% 35% 18%
14-May 29% 12% 41% 18%

0%
5%
10%
15%
20%
25%
30%
35%
40%
45%
50%
Minimal Partial Proficient Adv. Prof.
Kindergarten Reading Proficiency
Oct-13
Jan-14
Apr-14
0%
10%
20%
30%
40%
50%
60%
Minimal Partial Proficient Adv. Prof.
1st Grade Reading Proficiency
Oct-13
Jan-14
Apr-14

0%
5%
10%
15%
20%
25%
30%
35%
40%
45%
50%
Minimal Partial Proficient Adv. Prof.
2nd Grade Reading Proficiency
Oct-13
Jan-14
Apr-14
0%
10%
20%
30%
40%
50%
60%
Minimal Partial Proficient Adv. Prof.
3rd Grade Reading Proficiency
Oct-13
Jan-14
Apr-14

0%
5%
10%
15%
20%
25%
30%
35%
40%
45%
Minimal Partial Proficient Adv. Prof.
4th Grade Reading Proficiency
Oct-13
Jan-14
Apr-14
0%
5%
10%
15%
20%
25%
30%
35%
40%
45%
50%
Minimal Partial Proficient Adv. Prof.
5th Grade Reading Proficiency
Oct-13
Jan-14
Apr-14

a. Focusing mainly on the categories of “Proficient and Above” we can see (from the graphs above) that:
a. All Students: i. 62% of students reached this goal in Kindergarten ii. 63% of students reached this goal in Grade 1
iii. 55% of students reached this goal in Grade 2 iv. 73% of students reached this goal in Grade 3 v. 52% of students reached this goal in Grade 4
vi. 55% of students reached this goal in Grade 5 vii. 53% of students reached this goal in Grade 6
b. CSIP All Students that were at Columbus for a Full Academic Year
i. 95% kindergarten met goal ii. 83% 1-6 met goal
iii. 84% 1-3 met goal iv. 82% 4-6 met goal
v. 38% boys 1-6 met goal vi. 62% girls 1-6 met goal
c. At-Risk Goal – 40 At Risk Students – 26% of students Grades 1-6
i. 38% Made Benchmark ii. 38% Made Map Individual Target
iii. .05% made both Benchmark and MAP Target
0%
5%
10%
15%
20%
25%
30%
35%
40%
Minimal Partial Proficient Adv. Prof.
6th Grade Reading Proficiency
Oct-13
Jan-14
Apr-14

b. Although as a school Columbus Elementary School did not meet its CSIP goal (85% proficiency and above) in literacy: Important Note: Columbus Elementary School averaged 175 students and had a total of 155 move-ins and move-outs for the 2013-14 school year.
i. There was improvement made at all grade levels from fall to spring regarding percentage of students considered “proficient and above”. The only exception was at 2nd grade where the number of “proficient” students stayed the same from the fall to the spring.
ii. Kindergarten exceeded goal (95%) iii. With the exception of 1st grade, there was a significant improvement in the
percentage of students that moved above the “minimal” category from Fall to Spring. Almost every grade level cut this number in half from fall to spring.
iv. Only 38% of boys in grades 1-6 met goal.
Summary of Findings: Based upon your 2013-14 data, what are 3-5 key learnings/celebrations?
Our school has made leaps during the 2013-14 school year toward establishing more effective structures to address the needs of all students:
o We have established consistent SST (Student Support Team) protocols and are implementation-ready for 2014-15
o We have identified key community resources and have partnered with them to
provide additional support to our students. We have also created a viable and executable plan to build our parent involvement for the 2014-15 school year. In
fact, we estimate that we will double our parent participation in all school events
(academic and social) by the 2015-16 school year. For example, we have worked
with the Neighborhood Voice (Neighborhood Partners) as well as our PTA to “marry” academic events with PTA-sponsored events to build more capacity at all
school functions. We believe, and research supports, that more involvement from
families will have a positive and direct impact on student performance. o Our staff is ready to launch into our second year of “Late Start Collaboration” in
addition to taking our PLC process to a new level. Throughout the 2013-14 school
year we recorded observations and reflected frequently upon the use and value of
our Professional Learning Community practices and accomplishments. We are positioned to implement several key changes (improvements) to this critically
important practice and we expect student outcomes to reflect these changes.
What are 1-3 things to be considered as you develop CSIP plans for 2014-15 based upon this
year’s experiences?
o Our 2014-15 CSIP Goals will reflect high academic standards for ALL students
(those that are present for a full academic year and those that are present for a partial year). We will address the needs of boys (grades 1-6) specifically due to the percentage of boys NOT meeting goal.

o Our CSIP plan will reflect the objectives of Response to Instruction, Collaborative Culture of Improvement, and Family and Community Partnerships as common
threads throughout every academic goal. This will be different than in years past because they will no longer be separate goals/entities/efforts or separate
committees and/or responsibilities. o Progress monitoring will occur at a higher frequency than in years past. Our
minimum rate for progress monitoring per academic goal area will be monthly
(rather than tri-annually).

13-14 Site Continuous School Improvement Findings
School: Edison Elementary School
Edison School Improvement Goal(s):
Literacy Goals
All Edison Staff will be responsible for improving students’ performance on the following assessments
by June of 2014:
In Grades 1-3, increase from 57% to 85% the number of students meeting their end of the year RIT score on their MAP reading test
In Grades 4-6, increase from 43% to 85% the number of students meeting their end of the year RIT score on their MAP reading test
In Grades 1-2, all students will go up four levels or reach their instructional reading level using the Fountas and Pinnell Benchmark Kit
In Grades 3-6, all students will go up three levels or reach their instructional reading level using the Fountas and Pinnell Benchmark Kit
All Kindergarten students will reach Reading Level D by the end of the year. (one year earlier than AASD Goal)
In Grades K-3, 100% of the students will achieve their respective SAGE reading goals.
In Grades 1-6, 30% of students identified ELL, SWD, and EcD, will achieve their target RIT score.
In Grades 3-6, increase from 36% to 50% the number of students that achieve proficient or advanced proficient on the WKCE.
All students identified with General Intellectual Ability will exceed their reading target RIT score
All Kindergarten and First Grade students will show growth on the PALS Assessment.
Math Goals
All Edison Staff/Community will be responsible for: improving all students’ performance, with special attention to those students identified at the June 2013 data dig, by June of 2014
Grade K-3 – 95% of students will achieve Math SAGE Goals
Grades 1-6 – increase from 60% to 75% of students will achieve or exceed their target RIT Score
on either their MAP Math test in winter or spring.
Grades K-6 – 80% of students will achieve 80% or higher on district assessments
Grades 3 – 6 – 50% of students identified ELL and SWD, will achieve proficient on their WKCE
score.
PBIS
All Edison Staff/Community will be responsible for: improving all students’ performance, with special attention to those students identified at the June 2013 data dig, by June of 2014.
Grades K-6 will decrease the average number of major referrals per day per month from between 2 & 5 to 1 or less.
Decrease the amount of referrals during transition times from a total of 120 to 130 referrals at 12:15, 2:00 and 3:15 to 80 or less.
Grades K-6 will decrease disrespect from 42% to 30% of percent of the total major referrals.

Increase parent and family involvement from 53% in place to 75% in place as recorded on the SAS.
Education for Healthy Kids (EHK) Goal
All Edison Staff/Community will be responsible for: improving general student wellness & utilizing physical activity to improve student academic growth & student behavior, with special attention focused on active family involvement.
The Edison EHK Team will raise funds to start phase I of a student / family wellness room
Initiate phase I of Edison Student / Family Wellness Plan as funding permits
o Fitness Intern to lead students and families in increasing their personal fitness levels and
increase in their knowledge base of nutritional eating.
o Increase student activity time
o Support student academic growth by offering brain breaks prior to academic testing.
a. Display tables, graphs, or spreadsheets to visually illustrate end of year student outcomes based upon
the data set(s) identified in the above BOARD goal statement(s). Make sure to disaggregate the data to
highlight the growth of the students who were a focus in each of your CSIP goals.
Data and Findings:
Reading Data Tables
In Grades 1-6, 85% of the students will achieve or exceed their target RIT score on their
MAP reading test
Grade # Tested # Achieved Goal # not achieved % Achieved +/- from previous
Yr.
1 40 20 20 50.0% NA- were K students
2 37 22 15 59.4% + 7.2
3 38 25 13 65.7% +11.5
4 42 28 14 66.7% 0.0
5 30 14 16 46.6% +12.2
6 28 16 12 57.1% +18.2
In Grades 3-6, 87% of the student will be proficient or advanced proficient on the WKCE
reading performance level
Grade # Tested # Achieved Goal # not achieved % Achieved
3 38 14 16 36.8%
4 42 15 27 35.7%
5 30 7 23 23.3%
6 28 9 19 32.1%

In Grades K-3, 100% of the students will achieve their respective SAGE reading goals. In
addition, Kindergarten students will reach a benchmark level C by June of 2014
Grade # Tested # Achieved Goal # not
achieved
%
Achieved
SAGE
Goal
Achieved
K 49 Upper & Lower Case Letters
Book Awareness
Letter Sound Relationship
Identify High Frequency Words
Reading Level C
1
0
2
2
1
98%
100%
96%
96%
98%
Yes
Yes
Yes
Yes
Yes
1 40 Identify High Frequency Words
Spell High Frequency Word
Improve Writing Skills
Read Level I
1
3
0
1
98%
93%
100%
98%
Yes
Yes
Yes
Yes
2 36 Read Level M
3 or 4 on Dist. Writing Assessment
4
4
89%
89%
Yes
Yes
3 38 Level P 2 95% Yes
Notes:
Edison CSIP Goals exceed the district SAGE Goals in student expectation
Math Data Tables
Grade K-3 – 95% of students will achieve Math SAGE Goals
Grade # Tested # Achieved Goal # not achieved %
Achieved
SAGE
Goal
Achieved
K 49 Geometric Shapes
Count to 100
Write Numbers 0-20
Number Partners to 10
2
1
0
1
96%
98%
100%
98%
Yes
Yes
Yes
Yes
1 40 Count/ write #’s to 120
Addition facts to 20
Subtraction facts to 20
2 digits = 10’s & 1”s
2
2
5
2
95%
95%
88%
95%
Yes
Yes
Yes
Yes
2 36 Addition facts to 20
Subtraction facts to 20
2 Digit Addition
2 Digit Subtraction
0
1
2
2
100%
97%
94%
94%
Yes
Yes
Yes
Yes
3 38 Multiplication concepts
Division concepts
2
2
95%
95%
Yes
Yes

Grades 1-6 – Increase from 60% to 75% of students will achieve or exceed their target RIT
score on their MAP Math test in winter or spring (spring scores reported below).
Grade # Tested # Achieved Goal # not achieved Notes
1 37 28 9 76%
2 36 18 18 50%
3 38 29 9 76%
4 40 18 22 45%
5 32 21 11 67%
6 29 19 10 66%
Grades K-6 – 80% of students will achieve 80% or higher on district assessments (data not yet
compiled)
Grades 3 – 6 – 50% of students identified ELL and SWD, will achieve proficient on their WKCE
score.
Grade # Tested
ELL, SWD
# Achieved Goal
ELL, SWD
# not achieved
ELL, SWD
% Achieved
ELL, SWD
1 NA NA NA NA
2 NA NA NA NA
3 2 ELL, 7 SWD 0 ELL, 5 SWD 2 ELL, 2 SWD O% ELL, 71% SWD
4 3 ELL, 6 SWD 0 ELL, 1 SWD 3 ELL, 5 SWD O% ELL, 17% SWD
5 2 ELL, 6 SWD 0 ELL, 3 SWD 2 ELL, 3 SWD 0% ELL, 50% SWD
6 2 ELL, 5 SWD 0 ELL, 0 SWD 2 ELL, 5 SWD 0% ELL, 0% SWD
Totals 9 ELL, 24 SWD 0 WLL, 9 SWD 9 ELL, 15 SWD 0% ELL, 38% SWD
PBIS Data Tables


b. Describe your take-aways from the data; i.e. what does the data illustrate.
Reading/Literacy & Math
The data continues to indicate the need to increase our student’s academic achievement through
“Universal” classroom instruction, particularly for our English Language Learner (ELL) & Students
with Disabilities (SwD) children. In practice, the 2013-14 school year marks our second full year of
implementing the new ELA model. We feel we have increased fidelity with its implementation and
classroom observations reveal universal instruction is more consistent from classroom to classroom.
Late Start days and fully implementing PLC’s has helped in this effort. We meet monthly to review our
data wall.
Our scores dipped on the WKCE in reading while they improved in math. We expect the reading scores
to rebound as our ELA model becomes even more established. Our primary teacher’s report “amazing”
reading and writing accomplishments compared to past expectations. As we move to the Smarter
Balance Assessment next year we will understand that the data will not have longitudinal value and
challenge us to determine trends by use of other assessments.
PBIS
We learned many things from the School-wide Information System (SWIS) data we looked
at. We noticed that although we did not meet our data point for the reduction of referrals,
we had four months with an average of less than two referrals per day. This is a change
from having no months with an average less than two the previous year. We looked at the
months with fewest referrals and noticed that there was a decrease when we had a monthly
incentive. Our goal of 120-130 referrals during peak times was not met, but we had only 90
referrals during these times. This year in SWIS, disrespect was separated from defiance.
Defiance became our top problem behavior, disrespect accounted for about 15% of all major
referrals. Something we celebrated was the fact that 80% of our students had 0 or 1 referral.
Of the students receiving 6 or more referrals, many were receiving services such as check-in
and check-out or special education.
We also looked at Benchmarks of Quality (BOQ) and Self-Assessment Survey (SAS) results. We did
well on the BOQ, scoring at 96%. We have been focusing on implementing with fidelity. On the SAS
71% of staff reported that parent/family and community involvement was in place.
Summary of Findings:
Based upon your 2012-13 data, what are 3-5 key learnings/celebrations? Consider progress in addressing the objectives of RtI, Collaborative Culture of Improvement, and
Family and Community Partnerships and its effect on student achievement.
Literacy
We saw a drop in our literacy scores on our WKCE that was administered in November, 2013. Our
teachers, particularly at the primary level, report dramatic growth in their students reading and writing
skills by the end the school year when compare to past years. We attribute the drop in WKCE scores this
year with the transition to the new ELA Model and anticipate the performance reported by teachers will
result in better scores on the Smarter Balance assessment that will be administered in April of 2015.

Math
Our students showed significant growth in their math performance. We are hopeful the trend will
continue as we are now seeing nearly all of our students have been exposed to Math Expressions for the
majority of their school years.
PBIS
Our PBIS SWISS Data shows a cause for celebration. By analyzing our SWISS data we
learned that the majority of our student body is doing what they are supposed to be. They
are model students! We saw positive trends with our at-risk students that received check-
in/check-out through our first year as Tier II. We focused on developing incentives that
students would be motivated to receive. Our 6th
grade leadership team helped with
implementation. Another focus was on improving family involvement. We hosted a movie
night along with our PTA that highlighted some key points.
EHK
What a great year for our Education for Healthy Kids initiatives. We took a huge step forward by
implementing phase I of our Edison Wellness Program by winning $25,000 from US Cellular and
opening a Wellness Room for students, families and staff.
SAGE Note
As mentioned in the past, the impact of being a SAGE School can not be underestimated. SAGE has
numerous benefits that help our students learn socially, emotionally & academically.
What are 1-3 things to be considered as you develop CSIP plans for 2012-13 based upon this
year’s experiences?
Literacy & Math
We will continue to focus on our literacy skill development and further implementation of the new ELA
model. We hope to take our PLC and Late Start Collaboration time to a new level of data use and focus
on students not meeting proficiency levels.
PBIS
In the PBIS area Edison plans includes the following.
Continuing Tier II implementation to develop SAIG groups and behavior plans for
those students that need more than we have provided universally.
Delivering cool tool lessons imbedded into our curriculum which focus on defiance
and classroom behavior, developing plans for those that disrupt the learning of others
Teaming with parents and strengthening relationships that help them be more
involved is another focus we want to have this year.
EHK
Our Student and Family Wellness initiative was very well received by our community. We intend to
continue expansion of the program by moving it to a larger space that is more accessible in the evenings
for our families. We will continue to work with our partners in higher education as we provide
opportunities for University students to intern at the Edison Wellness Room.

Continuous School Improvement Process (CSIP)
School: Edna Ferber Elementary Year: 2013 – 2014
School Improvement Goal #1:
Reading:
All Ferber Elementary School staff will improve universal instruction in reading so that 75% of
all students will meet the year-end Instructional Level Expectations for Reading as measured
by the Fountas and Pinnell Benchmark Assessment (fluency, comprehension, and decoding) by
May 2014 (Baseline 2012-2013 school year: 67% average).
Data and Findings:
Reading (2013) Reading (2014) % Change
KDGN 52/84 62% 53/61 87%
1st Grade 62/82 77% 68/83 82% +20
2nd
Grade 55/76 72% 68/89 76% -1
3rd
Grade 71/87 82% 63/78 81% +9
4th
Grade 61/81 75% 62/81 77% -5
5th
Grade 43/83 52% 62/92 71% -4
6th
Grade 56/104 54% 55/88 63% +12
Overall Total: 67% 75% +8
In our review of the data from the past school year we found that our school had an overall
increase in the percentage of students reading at grade level (67% to 75%), that is an 8% increase
from the previous year of students reading at grade level. Digging deeper, we found that we had
more students reading at grade level than the previous year (400 to 431). Additionally, we found
that in all but one grade level the number of students reading at grade level increased as
compared to their previous grade. The arrows show percentage of students from last year to this
year and the corresponding change. We know that we have students that move in and out at each
grade level and that is a factor in our consideration when comparing two school years.

School Improvement Goal #2: Writing:
All Ferber Elementary School staff will improve universal instruction (Purpose and Stamina) in
writing so that 50% of students in grades 2 & 5 will be at grade level or higher as measured
by the district writing assessment. (Baseline 2012-2013 school year: Gr. 2: 28% Gr. 5: 45%)
Data and Findings:
Writing 2013 Writing 2014
Grade 2 23/78 29% Grade 2 32/87 37%
Grade 5 38/84 45% Grade 5 37/94 40%
In our review of the writing data we found that our 2nd
grade students performed better, 37% to
29% in meeting their district goals in writing. Our 5th
grade students performed slightly lower,
40% to 45% in meeting their district writing goals. Our data cannot show growth from year to
year due to the assessment only being given in these two grade levels.
Summary of Findings:
When our CSIP team looked at the data from our goals, we were very pleased with the progress
our school is making in Reading. Our school has added Reading Recovery and team teaching
with our ELL and SLD departments to our repertoire of strategies that we can use to help
students become better readers. We continue to look for more ways to reach the students who
are struggling in reading. Staff has used their PLC time to meet and discuss student’s reading
and writing needs. They have developed interventions that they have implemented during their
WIN time to help improve student reading skills. Additionally, we have used our late start time
and lunch hours to provide staff development for teachers to improve their skills in teaching
Reading and Writing. Below are a few of the ideas that we will be implementing in the fall as we
continue to grow in our skills…
1. Our reading specialists/coaches will focus their time on working with our Kindergarten
and 1st grade staff on improving their reading skills.
2. Our staff will be developing an electronic data wall that they will be able to use at their
weekly PLC meetings to look at student data to help plan instruction for students
struggling in Reading.
3. Finally, we have added in a Math goal this year focusing on improving our students skills
in Math as measured by the NWEA Map testing.

2013-2014 STEPHEN FOSTER ELEMENTARY CHARTER SCHOOL CONTINUOUS SCHOOL
IMPROVEMENT REPORT
FOSTER SCHOOL IMPROVEMENT GOALS
Literacy:
All staff at Stephen Foster Elementary Charter School will work to improve student understanding of academic
vocabulary so that by June 1, 2014; 90% of students who attend Stephen Foster Elementary Charter School for the entire
academic year will meet 2 of the following criteria/benchmarks:
1. Score Proficient/Advanced on WKCE Reading
2. Meet Spring Reading MAP Target Score
3. Meet Spring benchmark goal or move up 4 benchmark reading levels
4. Meet IEP Goals
5. Show 1 year of growth (.4 points or more) as measured by ACCESS Testing
AND
The percentage of students identified as English Language Learners, scoring proficient or advanced on the WKCE
Reading Section, will increase from 0% to 10%.
Math:
All staff at Stephen Foster Elementary Charter School will work to improve student understanding of academic
vocabulary so that by June 1, 2014; 85% of students who attend Stephen Foster Elementary Charter School for the entire
academic year will meet 2 of the following criteria/benchmarks:
1. Score Proficient/Advanced on WKCE Math
2. Meet Spring Math MAP Target Score
3. Score 80% or higher on 80% of End of Unit Math Assessments
4. Meet all SAGE Math Goals (K-3)
5. Meet IEP Goals
AND
The percentage of students identified as English Language Learners, scoring proficient or advanced on the WKCE Math
Section, will increase from 0% to 10%.
DATA AND FINDINGS
At the end of the 2012-13 school year, the Foster Elementary Charter School CSIP team decided that they wanted to raise
the bar in terms of the growth students were making academically. In the past the Foster CSIP goal required students to
meet their Spring MAP target score within 2 RIT points or meat their reading benchmark or score proficient/advanced on
WKCE. For 2013-14 the Foster team determined that they wanted students to show their performance by meeting 2 of the
criteria listed above. The plan was to get a baseline of how students performed under the new goal this year and adjust for
further years. Foster fell far short of reaching their goal this year, but the work that was done and the data collected,
provides a solid baseline from which to grow, utilizing the same data points in future years.
41 54 58
100 88
63
CSIP MATH
Percentage ofStudents MeetingTarget
27
58 73
100
57 53
0
20
40
60
80
100
CSIP LITERACY
Percentage ofStudents MeetingTarget
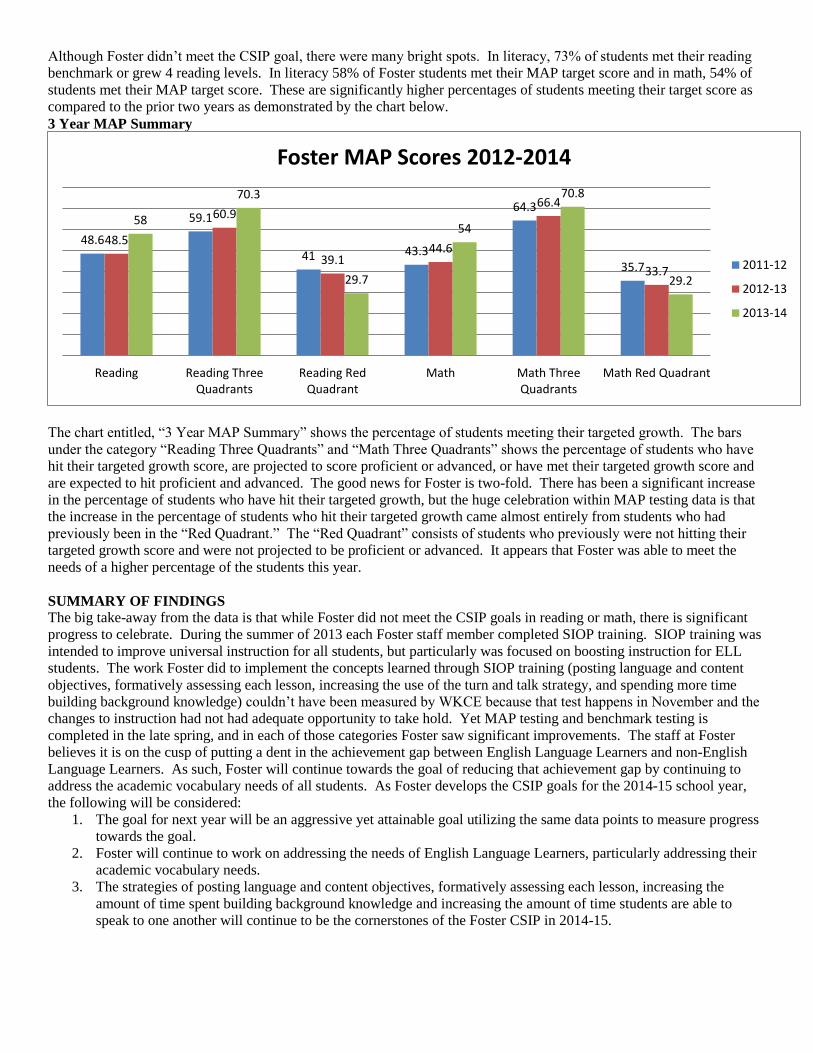
Although Foster didn’t meet the CSIP goal, there were many bright spots. In literacy, 73% of students met their reading
benchmark or grew 4 reading levels. In literacy 58% of Foster students met their MAP target score and in math, 54% of
students met their MAP target score. These are significantly higher percentages of students meeting their target score as
compared to the prior two years as demonstrated by the chart below.
3 Year MAP Summary
The chart entitled, “3 Year MAP Summary” shows the percentage of students meeting their targeted growth. The bars
under the category “Reading Three Quadrants” and “Math Three Quadrants” shows the percentage of students who have
hit their targeted growth score, are projected to score proficient or advanced, or have met their targeted growth score and
are expected to hit proficient and advanced. The good news for Foster is two-fold. There has been a significant increase
in the percentage of students who have hit their targeted growth, but the huge celebration within MAP testing data is that
the increase in the percentage of students who hit their targeted growth came almost entirely from students who had
previously been in the “Red Quadrant.” The “Red Quadrant” consists of students who previously were not hitting their
targeted growth score and were not projected to be proficient or advanced. It appears that Foster was able to meet the
needs of a higher percentage of the students this year.
SUMMARY OF FINDINGS
The big take-away from the data is that while Foster did not meet the CSIP goals in reading or math, there is significant
progress to celebrate. During the summer of 2013 each Foster staff member completed SIOP training. SIOP training was
intended to improve universal instruction for all students, but particularly was focused on boosting instruction for ELL
students. The work Foster did to implement the concepts learned through SIOP training (posting language and content
objectives, formatively assessing each lesson, increasing the use of the turn and talk strategy, and spending more time
building background knowledge) couldn’t have been measured by WKCE because that test happens in November and the
changes to instruction had not had adequate opportunity to take hold. Yet MAP testing and benchmark testing is
completed in the late spring, and in each of those categories Foster saw significant improvements. The staff at Foster
believes it is on the cusp of putting a dent in the achievement gap between English Language Learners and non-English
Language Learners. As such, Foster will continue towards the goal of reducing that achievement gap by continuing to
address the academic vocabulary needs of all students. As Foster develops the CSIP goals for the 2014-15 school year,
the following will be considered:
1. The goal for next year will be an aggressive yet attainable goal utilizing the same data points to measure progress
towards the goal.
2. Foster will continue to work on addressing the needs of English Language Learners, particularly addressing their
academic vocabulary needs.
3. The strategies of posting language and content objectives, formatively assessing each lesson, increasing the
amount of time spent building background knowledge and increasing the amount of time students are able to
speak to one another will continue to be the cornerstones of the Foster CSIP in 2014-15.
48.6
59.1
41 43.3
64.3
35.7
48.5
60.9
39.1 44.6
66.4
33.7
58
70.3
29.7
54
70.8
29.2
Reading Reading ThreeQuadrants
Reading RedQuadrant
Math Math ThreeQuadrants
Math Red Quadrant
Foster MAP Scores 2012-2014
2011-12
2012-13
2013-14

Franklin Elementary School -Responsible, Respectful, and Safe
2212 N. Jarchow St., Appleton, WI 54911 ◊ Phone: (920) 832 – 6246 ◊ Fax: (920) 832 – 4464
Carrie Willer, PhD, Principal
2013-2014 School Improvement Goals in Literacy and Math Literacy- As a community of learners (staff, students, and parents) will collaborate and monitor student achievement in literacy so that 90 % of all students will show at least one year’s growth during the 2013-2014 school year. This will be measured by Fall to Spring MAP scores in reading using: individual student target RIT growth scores(or 5 point variance for students that have exceeded the grade level target score in fall) OR grade level target MAP score OR district benchmarking grade level goals. 90% of Kindergarten students will reach level C reading benchmark by spring. Students with Special Education needs, ELL students and TAG Students will be targeted for interventions or enrichment. Math- As a community of learners, staff, students, and parents will collaborate and monitor student achievement to align to the Common Core State Standards and Math practices to ensure that the level of math learning will be accelerated for each student so that 85% of kindergarten students will show proficiency on the end of year assessment and 85% of all gr. 1-6th graders will meet their individual RIT or grade level target score. Site Focus: with an emphasis on monitoring student achievement and collaboration, all staff will utilize peer coaching (late starts) and implement parent involvement (i.e Parent Chat, Families 4 Franklin Goal, ELL Family Nights, Family Satisfaction Survey) to support student learning through the crucial questions from DuFour:
1. What do we want students to learn? 2. How will we know when each student has learned it? 3. How will we respond when a student experiences difficulty in learning? 4. What will we do if the student already knows it?
Data and Findings Our changing student profile:
Franklin’s total K-6 student body includes 382 students. We added another special education program, Integrated Kindergarten (IK) and we saw an increase in our free/reduced population.
Free and reduced Learners: 44% of student population English Language Learners: 1 student per 5 receives ELL instruction Special Education Learners: 1 student per 3 has an IEP (EBD, SPL, IK, SLD, - ECH not included)
Kindergarten (60 students) 78% met the reading goal 85 % met the math goal
The 13% that did not included 7 IK students, 4 ELL and 2 reg. education students with Tier 2 support
N/A- goal writte
First Grade (59 students) 90% met the reading goal 88% met the math goal
Second Grade (58 students) 97% met the reading goal 85% met the math goal
Third Grade (56 students) 82% met the reading goal 79% met the math goal
77% of students (43 total) made level P benchmark
Fourth Grade (65 students) 82% met the reading goal 80% met the math goal
Fifth Grade (50 students) 92% met the reading goal 90% met the math goal
Franklin Elementary School -Responsible, Respectful, and Safe
2212 N. Jarchow St., Appleton, WI 54911 ◊ Phone: (920) 832 – 6246 ◊ Fax: (920) 832 – 4464
Carrie Willer, PhD, Principal
Sixth Grade (38 students) 73% met the reading goal 74% met the math goal
Though not all the grade levels met the reading or math goal, Franklin students made significant gains in literacy and math, based on MAP test scores. Our ELL and special education students continued to show gains, albeit some performance lag behind peers.
Summary of Findings
As we reviewed the above data, we see higher student achievement scores in reading and math than in the past three years at Franklin. We continued our reading goal of 90% and continue to add more grade levels in meeting that goal and increased our CSIP math cut score to 85%, from last year’s 80%. Grade level teams continued to meet and used late start to progress monitor and continue ELA lesson planning. Our parent collaboration efforts increased this year with a fall Parent Chat event that was well received, a Families 4 Franklin (each family was asked to volunteer or participate in 4 ways this year for their child and receive a star on our bulletin board), having parents sign a Safety Pledge (to slow down and follow traffic laws in our pick up line) and our principal distributed a schoolwide parent satisfaction survey. 100 surveys were completed, with a response rate of 27% (1 in 4 families participated). Parents indicated 98% satisfaction or highly satisfied with their experience at Franklin school and listed staff and principal satisfaction, school-home communication, and feelings of being welcomed and listened to as their highest praise. Areas identified for continued improvement include: school website needs clarity/updating; more technology in the hands of children; challenge students more (comment from K-2 parents); and more communication with staff (comment from 3-6 parents). We celebrated in hearing such positive feedback from our parents and parents commented that they appreciated being asked. Our community collaboration included: partnership with our neighbor Grace Christian Fellowship, who donated new plants for a teacher memorial on our school grounds, a granite monument for a student that was killed several years, and a $100 gift certificate for a graduating 6th grader; our ongoing partnership with the Fox Valley Humane Association’s Reading to Canines; partnering with the Lions Club to have all students participate in the vision screening, partnering with the Tri County Dental clinic to not only screen teeth but come almost biweekly to perform extractions, fillings, and other dental care for needy children. Our PTO was particularly strong this year, working with us to create a Staff Wishing Wall where parents could purchase supplies for classrooms, as well as organizing parents to donate new classroom rugs and staff incentives to help with low morale. Our staff efforts included better progress monitoring that aligned more clearly with tier two invention documentation and ongoing formative data collection. We will continue this work as we set our data rules. For PBIS, we instituted a monthly student recognition called “Fox Salutes” that was well received by parents including a special feature article in the January Post Crescent, a tier two plan called Check in and Check out, along with a new Gotcha menu. We were again recognized as a school of merit for our efforts! What are 1-3 things to be considered as you develop CSIP plans for 2014-15 based upon this year’s experiences? Using the survey results and our student data, we will:
1. Parent collaboration- a. We will add a “Parent Question” section- Ask Dr. Willer- to the newsletter with box in the office to
answer parent questions in the newsletter. This is similar to the student question box that our principal uses each day in morning announcements.

Franklin Elementary School -Responsible, Respectful, and Safe
2212 N. Jarchow St., Appleton, WI 54911 ◊ Phone: (920) 832 – 6246 ◊ Fax: (920) 832 – 4464
Carrie Willer, PhD, Principal
b. Continue our Families 4 Franklin, and add a Family goal called AIM (academics- homework support and completion; involvement- talking to students about their day, volunteering at Franklin; and medical- keeping students well fed, well rested, good oral hygiene and current on immunizations).
2. Student achievement- a. We will write our CSIP goal in the form of both a Student Learning Outcome (SLO), keeping the 90% in reading and moving to 90% in math, and write a Professional Practice Goal (PPG) that focuses on collaboration and comprehension in ELA and the math practice of student talk. Instead of using just one data point (MAP test scores) we will use multiple assessment points and students will need to show proficiency in at least three of five data points (MAP Rit or grade level bands, reading benchmarks, PALS scores for K-2 students, quarterly progress reports based on the elementary progress reports, and formative data (multiple running records, word sort tests, etc). b. We will create PLC meeting agendas that include some team business but focus on student tier two reports and kid talk with resource staff, and change our monthly BCT meetings to weekly student service team meetings over the noon hour to help teachers with the RTI process and setting up intervention plans. c. Our late starts and monthly staff meetings will focus on professional practice- for math we will examine our student talk and math practice, Construct viable arguments, and we will examine our universal ELA instruction for fidelity. We will have time at least twice a month to work as a team and our agendas will be driven by those two goals. d. We will establish a formalized peer coaching program where staff would work with staff and be given release time to observe peers. Money from our building budget would be used to fund this. In addition, two ‘peer mentors’ will be used- one at the primary level and another at the intermediate level- to peer coach ELA along with our reading specialist. e. Our PBIS and Healthy Kids efforts will continue to support student achievement. We had a classroom attendance incentive that we will continue, along with our Snack Attack drills to promote healthy eating. We will partner with our PTO to bring Steve Carrier in for a PBIS Anti Bullying presentation in the fall (we used Dome Theater this past year from a NASA grant to incorporate science education), and our principal worked with our PTO to have a family goal of raising $15,000 to enhance our playground equipment for all children, including our Early Childhood and Integrated Kindergarteners. To support mental health of children, we will initiate a Tier Two mentoring program along with SAIG (Social Academic Intervention Groups). 3. Support our staff As we move into the era of Educator Effectiveness, new technology, increased school safety, Common Core, increasingly challenging student populations the research continues to point to staff as having the number one impact on student achievement. School culture and climate, including staff morale, is important to pay attention to and celebrate in an effort to bring cohesiveness and collegiality. We will continue the monthly staff meeting gift card give aways, the staff ‘Snack Attack’ (principal brings a beverage cart service to each staff member), the “Caught in the Act” when staff are seen doing great work, the Candy Jar Pick Me Ups, and the Fox Pride Award at the beginning of the year to a staff member that showed PRIDE (Personal Responsibility in Developing Excellence). Please join me in celebrating a great year at Franklin Elementary School- Home of the Foxes! We look forward to a wonderful 2014-2015 school year.

Franklin Elementary School -Responsible, Respectful, and Safe
2212 N. Jarchow St., Appleton, WI 54911 ◊ Phone: (920) 832 – 6246 ◊ Fax: (920) 832 – 4464
Carrie Willer, PhD, Principal

Due June 27,2014 Submit electronically to Chris Webster
2013-2014 Site Continuous School Improvement Findings School: Highlands School Improvement Goal(s): All staff at Highlands Elementary School will improve students’ skills in reading so
that at least 80% of all students will achieve two of the following: Kindergarten:
Reach May 2014 benchmark goal (level C)
Achieve 80% combined score on PALS assessment areas of Group beginning sound,
Lowercase recognition (capital recognition) and letter sounds. (71 out of 88 points)
Score 80% or more on PALS Spelling (16 out of 20 points)
1st Grade:
Reach May 2014 benchmark goal (level I)
Advance 6 benchmark levels
Score 80% on Fountas and Pinnell 100 word list at end of year
2nd Grade:
Reach May 2014 benchmark goal (level M)
Advance 5 benchmark levels
Reach targeted growth on Spring 2014 MAP test
3rd Grade:
Reach May 2014 benchmark goal (level P)
Advance 4 benchmark levels
Reach targeted growth on Spring 2014 MAP test
4th grade:
Reach May 2014 benchmark goal (level S)
Advance 4 benchmark levels
Reach targeted growth on Spring 2014 MAP test
5th grade:
Reach May 2014 benchmark goal (level v)
Advance 4 benchmark levels for selected students
Reach targeted growth on Spring 2014 MAP test
6th grade:
Reach May 2014 benchmark goal (level y )
Advance 4 benchmark levels for selected students
Reach targeted growth on Spring 2014 MAP test
*Benchmark is determined by student’s instructional level.
Or 80% of students receiving special education services in the area of literacy will meet their
annual IEP reading and/or writing goals.
*Benchmark is determined by student’s instructional level.

Data and Findings: .
The above graph shows students in grades K, 1 and 5 met two of the targeted goals. When we looked at our subgroups we saw that there was growth, but not the growth needed to close the achievement gap. We see that our ELL population was more successful in the primary grades vs. the intermediate grades.
Summary of Findings: Based upon your 2013-2014 data, what are 3-5 key learnings/celebrations?
We reflected that this year we required students to meet 2 of the proficiency expectations instead of one from the previous year. This was challenging for staff as they saw significant growth in students, but the students were not at proficiency yet.
We need to continue to analyze data and determine the appropriate intervention for students and have increased the staffs’ capacity of writing targeted goals this past year, but can continue to grow.
We have continued to face the challenge of thinking differently and being creative on universal and tiered services for students.
The staff has focused on collaboration and that was evident through the creation and success of RtI lunches.
What are 1-3 things to be considered as you develop CSIP plans for 2013-14 based upon this year’s experiences? For the 2014-15 school year we are going develop a consistent common language for ELA terminology, focus on decoding strategies in grades K-3 and comprehension in grades 3-6. We will also be adapting our schedule to allow for grade level sharing of students for intervention/enrichment. The final goal is to continue staff development that supports our CSIP plan. We have topics of effective collaboration, differentiation, and assessment.

Due June 27, 2014
2013-2014 Site Continuous School Improvement Findings School: Highlands School Improvement Goal(s):
Math Goal: All staff at Highlands Elementary School will improve students' Math Practice Skills so that at least 80% of all students will achieve a level 3 or 4 on their report card in the area of MP5-
Attends to Precision
Data and Findings:
The above graph shows that Kindergarten met the goal set this year. The graph shows the percentage of students who received a 3 or 4 on their report card in the area of Math Practice 5 – Attends to Precision.
When we created the plan for this year we needed to change the way we measured students’ proficiency as we moved into the Standards Based Grading.
Summary of Findings: Based upon your 2013-14 data, what are 3-5 key learnings/celebrations?
We have reflected on the SIR (School-wide Implementation Review) data and have determined that we need to develop our infrastructure of our Universal and Tiered levels of math support.
We have created a math common language that will be present in each classroom to increase consistency and clarity for our students for the 2014-15 school year.
The parents who attended the Parent Involvement Day enjoyed the day and found the math resources valuable.

What are 1-3 things to be considered as you develop CSIP plans for 2013-14 based upon this year’s experiences? For the 2014-15 school year we are going to focus on building the staff’s capacity in pre/post assessments, triangulation of data and implementing student plans with fidelity. We will also be adjusting our schedule for flexible grouping during our WIN time to ensure intervention and enrichment. We will be progress monitoring student growth monthly and creating plans to meet the students needs.

June 24, 2014 2013-2014 Horizons Elementary School Continuous School Improvement Findings
School Improvement Goal: Through our Professional Learning Community, all staff will grow and develop their skills in delivering high quality instruction through the implementation of best instructional practices that are responsive to student needs which will positively influence student achievement and engagement in the area of literacy resulting in an increased number of students demonstrating proficiency as measured by the indicators listed below. Growth Goal: We will increase by 7% annually the number of students in grades 3-6 who score proficient or advanced proficient in the areas of reading on the WKCE. Proficiency Goal: 80 % of students in grades K-6 will meet grade level and end of year reading benchmark target and or MAP target RIT score or demonstrate one year academic growth.
Data and Findings: Display tables, graphs, or spreadsheets to visually illustrate end of year student outcomes based upon the data set(s) identified in the above goal statement(s). Make sure to disaggregate the data to highlight the growth of the students who were a focus in each of your CSIP goals.
The information in the graphs below is based on May 2014 Data Wall Placement. The assessments used to determine placement include: May Benchmark, Spring MAP and WKCE.

b. Describe your take-aways from the data; i.e. what does the data illustrate.
We increased our students who scored proficient or advanced proficient on the WKCE by 6% in the area of reading. Our results for proficiency were very close to 2012-13. We continue to see the percentage of students demonstrating proficiency decline as they progress through the years. We have identified our students who did not meet proficiency expectations, while there is no single factor that we are able to pinpoint, it is evident that there is a gap between our Students with Disabilities (SwD) and non-SwD as well as our English Language Learners and non-English Language Learners. There is a gap between our economically and non-economically students. We will continue to monitor progress of targeted students and provide interventions to support their continued growth and development.
Summary of Findings: Based upon your 2012-13 data, what are 3-5 key learnings/celebrations?
1. Although we fell short of our goal our students demonstrated evidence of growth and learning through the 13-14 school year.
2. Take a Book, Leave a Book was a successful initiative for encouraging students to take books home to read and/or share with family members.
3. Kindergarten and First Grade data has supported our use of small group instruction for each student on a daily basis. Reading Recovery and Ell support to build in vocabulary building at an early age also benefited students in these grades.
4. We continue to struggle with our sub populations, particularly English Language Learners and Students with Disabilities (CD).
5. Authentic assessments or performance tasks were a positive this year as staff collaborated to plan for successful implementations of the standards with each grade level.
6. Our Spanish speaking families were more involved in school activities during the 2013-14 school year than in prior years.

What are 1-3 things to be considered as you develop CSIP plans for 2014-15 based upon this year’s experiences?
We will continue to build a culture of collaboration as we strengthen our capacity to provide instruction
and interventions to support all learners.
In the fall, we had a high number of students who spent little time reading over the summer. Our
literacy and ELL staff implemented a Summer Reading Bridge to include Library Check-out Days
and Book Sharing sessions in one of our high poverty neighborhood as well as a Take a Book, Leave
a Book program.
We will give students 4-6 weeks of reading and instruction before completing fall benchmarks.
We will closely monitor student attendance and work with families to ensure that students are
available to learn.
Provide professional learning for all staff, including Professional Conferences, Book Studies and
Standards Skills Traces with an emphasis on working with students in poverty.
Develop systems for more effective use of PIE time to meet student needs.
We will build meaningful Family and Community Partnerships that will support our students in a positive
way. We need to share this journey with families and build their capacity to be actively engaged in their
children’s education and value their contributions.
Increase our Home-School Communication and contacts.
Invite parents to participate on CSIP Teams.
Provide opportunities for parents to support school initiatives in a variety of capacities.
Summer Bridge Reading and
Take a Book, Leave a Book

Houdini 2013-2014 Continuous School Improvement Findings
Literacy Houdini Improvement Goals: As a community of learners (all staff, students and parents) at
Houdini, we will utilize individual goal setting and best practices in literacy instruction to improve individual reading growth. ELA Growth goal: In May 2014, growth will be measured for all students attending for the full 2013-2014 academic year ending June 7, 2014 in the following manner: 85% of students will make one year’s progress on the Benchmark Growth Chart or will meet their MAP Target Growth in either Winter or Spring.
ELA Proficiency goal: By May 2014, proficiency will be measured for all students attending for the full 2013-2014 academic year in the following manner: 85% of students will make grade level proficiency on spring Fountas and Pinnell benchmark or achieve grade level proficiency as measured by the MAP spring RIT score.
Grade Level # Growth
Reading
% Growth
Reading
# Proficiency
Reading
% Proficiency
Reading
Kindergarten 78/81 96% 73/81 90%
1 97/102 95% 91/102 89%
2 67/77 87% 66/77 86%
3 69/74 93% 66/74 89%
4 72/75 96% 71/75 95%
5 76/82 93% 65/82 79%
6 79/94 84% 71/92 77%
Growth Goal Findings: As shown above, Kindergarten through 5th grade students exceeded the 85% Reading goal
for growth. The sixth graders came very close to our goal with 84% of the students meeting their growth goal. This lead to many conversations about “finishing the year strong” and endurance with our 6
th grade students during the last quarter of
the year. We will be looking at creative ways to more actively engage our sixth grade student Proficiency Data Findings: Marked progress is noted moving students toward greater literacy proficiencies.
Assessment wall data uses multiple sources of information and includes benchmark assessment, MAP findings, writing proficiency, quality of Reading Response Journal entries, and other data. Assessment wall data this year did tend to be higher than the MAP testing in the spring indicated.
12% 20%
0% 21% 21%
9% 19% 13% 12% 9% 8% 8% 8% 8% 4%
15% 9% 19%
29% 29% 16%
31%
42%
13%
13% 2%
8%
12% 5% 4% 9% 13%
4% 13%
5% 3%
15% 23% 11%
32% 31%
17%
56% 20%
39% 16%
18% 15%
12% 17% 29% 26% 20%
26% 28%
28% 21%
19%
36% 26%
13% 15%
29%
3% 16%
48% 50% 61%
70% 57% 64%
55% 58% 59% 61% 49%
59% 73%
51% 30%
44% 26% 26%
38%
2013-2014 Assessment Wall percentages
Minimal Partial Proficient Adv. Prof.

Summary of Findings: The collaborative culture of our building has a very solid foundation. Houdini’s PLC’s have run
very efficiently this year while they continued to perfect their lesson plans aligned to the OEU’s. However, next year at the request of staff, we are going to provide a more structured agenda for these meetings. The teachers have requested to utilize this time to discuss where students are excelling and struggling and device plans to meet their needs on both ends of the spectrum. They are also asking literacy coaches to provide staff development to assist in guiding their instruction during this time once a month. One discrepancy we identified when assessing our data was the vast difference in students benchmark scores compared to the spring MAP data. Many of the students met their growth goal on the benchmark testing, yet failed to meet their proficiency goal on MAP. In an attempt to remedy this concern, we are beginning the year with a review benchmark testing and utilizing these scores to guide instruction for individual students. We will be having three “refreshers” on this throughout the year. Mary Schmidt from the Reading Recovery Consortium will be assisting Houdini on this goal through the year with periodic benchmark and running record reviews.
By combining our efforts between PBIS, math and literacy into one evening instead of three separate occasions gave parents a better overview of work at Houdini. We found that our Veteran Recognition night drew a very different audience of parents and grandparents than the PBIS/math/literacy night. By diversifying our evening events we were able to engage more of our families.
Houdini Math CSIP Outcomes Houdini’s math goal is built to follow students on their grade level journey through Houdini. For instance, the
growth goal percentage for 4th
grade was 48% of students meeting their growth goal according to Measures of
Academic Progress (MAP) test. That 48% was five percent more than what those same students achieved the
year before. So looking at fourth grade, the group as a whole did meet their growth goal because 51% of the
students met their individual growth goal. The growth goal is important because MAP statistically sets a
growth goal for each student. The growth goal for those students not meeting proficient represents a target that,
if met for three years, will result in the student becoming proficient in that third year. The growth goal for those
under achieving students will be more than the typical growth for a student achieving proficiency. Our
intermediate students met the math growth goal targets. Our primary students did not.
Math Growth
Math Proficiency
Growth Goal
% Meeting Growth
Goal Grade
Grade Proficiency
Target* %
Proficient
Kdg.
Kdg.
100%
72% 52% 1
1 179 76% 77% 38% 2
2 192 46%
57% 43% 3
3 204 71% 48% 51% 4
4 213 56%
51% 55% 5
5 221 63% 51% 54% 6
6 226 65%
Schoolwide 52%
Schoolwide
69%
* Kdg. based on End of Year Test
*Grades 1-6 based on MAP RIT Proficiency
While we are concerned with growth, we also want our students to meet proficiency levels set by MAP as well.
The chart below does indicate that more students are proficient than met their targeted growth goals. Our
assessments also indicate that 20% of our students meeting proficiency are not meeting their individual targeted
growth. We know from this relatively high percentage that our universal instruction does need to be elevated so
that students learn as much as they possibly can. Our data suggests that 12% of our students who did not meet
grade level proficiency did meet their individual targeted growth goal which is very positive. If they continue to
meet their growth goal they will be proficient given a bit more time.

Some of our other math activities included an evening for parents about our math series. The multiple ways that
students are taught to solve math problems are very different than the way parents were taught. By having our
teachers explain some of the new procedures, explain the concept of math talk, and discuss the math practices,
not just math content, is very beneficial for parents. It is surprising to hear how many parents are cautious about
helping their child because they do not think they should be sharing how they learned to do the work. Parents
are reassured that it is indeed all right to show their child the way they were taught to think through or work out
a problem—it is yet another way to solve a problem.
For staff we instituted a twice a month “drop in” time during the noon hour to consult with a couple of our
teachers who are our math gurus, so to speak. It is an informal time, which staff likes, where they can
brainstorm ways to reach certain students or ways to motivate or ideas for interventions that could be used for
extra help for students. Two of our staff will be trained this summer in a “math recovery” program that is strong
in diagnostic procedures to determine just where the conceptual breakdown occurs. Knowing at what point the
student does not understand will help to target instruction so that the student can move forward.
Continuing challenges include finding time for targeted interventions, ensuring that our universal instruction is
broadened so that more of our already proficient students meet their individual target growth goals, and to
become more expert in pinpointing where the breakdown is for a struggling student in order to target
interventions.
Considerations for 2014 -2015 CSIP plan:
1. Our grade level teams have identified grade level literacy goal and as a building our focus is to go deeper and get better at what we are already doing. In addition, when looking at the differences between benchmark and MAP results, our focus needs to be teaching students to be flexible with what they learn and know. That translates to being able to transfer skills from one situation, task, or type of reading to another. Mary Schmidt will be assisting Houdini by teaching how to test students on benchmarks and running records with fidelity and utilizing this information to guide instruction.
2. Houdini will continue monthly collaborative CSIP meetings during the 2014-2015 school year. During these meetings we will:
a. Continue to share monthly PBIS precision statements (combining CICO and SWIS Big Five Data) with staff.
b. Included a Houdini “Spotlight” in each staff meeting highlighting routines and procedures to save instructional minutes throughout the day.
3. Continue our twice a month Math assistance support.
1
2
3
4
5
6
52%
38%
43%
51%
55%
54%
76%
46%
71%
56%
63%
65%
Math Outcomes
% Meeting Proficiency 100% % Meeting Growth Goal

Huntley Elementary School
End of Year CSIP Report – 2013/2014
Based upon the 2013-2014 data, key learnings/celebrations are… We had 10 non-WKCE goals on our CSIP this school year. Of those:
o We met 5 of them and showed growth over last year’s scores on 3 of them. o We were 1% away on one of them that we didn’t have previous data for. We will continue
this goal for next year now that we have baseline data. o We went down on one of them targeting our Students with Disabilities (SwD) in the area of
math. We will continue this goal for next year with specific plans to increase in this area.
WKCE scores went down state-wide and Huntley reflected the same trend. We look forward to Smarter Balanced results at the end of next school year to help us in planning goals for the 2015-2016 school year.
We effectively put into place our CSIP action plan and will consider similar actions, with additional items, for next school year.
88% of Huntley students received one or fewer ODR’s (Office Discipline Referrals) this school year. According to the district PBIS Coordinator, this data indicates we are implementing PBIS with fidelity and that the vast majority of students are responding positively to Tier 1 PBIS initiatives.
Based upon the 2013-2014 experiences, next year we plan to consider… We would like to become more responsive to our students various cultural needs including ethnicity,
home make up, religion, etc. We have begun brainstorming ways to incorporate CSIP next year.
We are currently meeting our Kindergarten benchmark levels but are concerned with the new expectation of students reaching a Level D by the end of the school year. Our CSIP will need to target this goal with creative ways to support a successful outcome.
We continue to demonstrate growth for our ELL students, but we don’t appear to be closing the achievement gap. This will be a special focus for next school year.
Literacy Goals
At least 85% of Kindergarten students will be reading at level C or higher by May 2014.
At least 72% of students in grades 1-6 will meet one of the following goals:
o Will be reading at end of year benchmark by May 2014. o Will meet or exceed end of year proficiency score as measured by MAP.
Increase the percentage of students in grades 3-6 who are Proficient or Advanced on WKCE from
41% in Fall 2012 to 45% in Fall 2013. (2012 State average was 36%)
84%
86%
Huntley 2012-2013
Huntley 2013-2014
Kindergarten Reading Level C or Higher
72% Huntley
End of Year Benchmark and/or Proficient on Reading MAP
34%
37%
39%
State
District
Huntley
Proficient or Advanced - WKCE Reading
At least 80% of students in grades 1-6 will meet one of the following goals: o Will make one year’s growth or more on their reading benchmark. o Will meet or exceed their targeted growth in reading as measured by MAP.
Literacy Sub-Goals Increase the percentage of low socio-economic students in grades 3-6 who are Proficient or
Advanced on WKCE from 25% in Fall of 2012 to 27% in Fall 2013 (2012 State average was 21%)
At least 65% of students with low socioeconomic status in grades K-6 will be reading at or above end
of year benchmark by May 2014.
At least 36% of students with disabilities in grades 1-6 will meet their targeted growth on MAP.
Increase the percentage of students with disabilities who are Proficient or Advanced on WKCE from
21% in Fall 2012 to 23% in Fall 2013. (2012 State average was 15%)
Increase the percentage of ELL students who are Proficient or Advanced on WKCE from 8% in Fall
2012 to 10% in Fall 2013. (2012 State average was 8%)
Math Goals
At least 70% of students in Grades 1-6 will meet or exceed end of year proficiency score on MAP.
79% Huntley
Benchmark and/or MAP - 1 year's growth
19% 21%
20%
State
Huntley
Proficient or Advanced - Low SES - WKCE Reading
63%
64%
Huntley 2012-2013
Huntley 2013-2014
Reading at End of Year Benchmark or Above - Low SES
34%
54%
Huntley 2012-2013
Huntley 2013-2014
Reached their Targeted Growth - SwD - MAP Reading
10%
11%
10%
State
District
Huntley
Proficent or Advanced - SwD - WKCE Reading
7%
3%
24%
State
District
Huntley
Proficient or Advanced - ELL - WKCE Reading
65%
69%
Huntley 2012-13
Huntley 2013-14
Met or Exceeded End of Year Proficiency - MAP Math

Increase the number of students in grades 3-6 scoring Proficient or Advanced on WKCE from 60% in Fall 2012 to 62% in Fall 2013. (2012 State average was 48%)
68% of students in grades 1-6 will meet their targeted math growth on the MAP.
Math Sub-Goals
At least 65% of students with low socio-economic status in grades 1-6 will meet their targeted math growth on the MAP.
The number of students with low socio-economic status scoring Proficient or Advanced on the
WKCE will increase from 40% in Fall 2012 to 42% in Fall 2013 (2012 State average was 31%)
At least 75% of students with disabilities in Grades 1-6 will meet their targeted growth on the MAP.
The number of students with disabilities scoring Proficient or Advanced on the WKCE will increase
from 40% in Fall 2012 to 42% in Fall 2013. (2012 State average was 22%)
50%
52%
57%
State
District
Huntley
Proficent or Advanced - WKCE Math
65%
70%
Huntley 2012-13
Huntley 2013-14
Met Targeted Growth - MAP Math
62%
63%
Huntley 2012-13
Huntley 2013-14
Targeted Growth MAP Math - Low SES
31%
33%
32%
State
District
Huntley
Proficent or Advanced - WKCE Math Low SES
64%
73%
61%
Huntley 2011-12
Huntley 2012-13
Huntley 2013-14
Targeted Growth MAP Math - SwD
21%
19%
22%
State
District
Huntley
Proficent or Advanced - SwD WKCE Math

Jefferson Elementary Continuous School Improvement Findings
2013-2014 CSIP Goals and data breakdown
Goal: We will increase proficiency as measured on the WKCE test by 5% annually in grades 3-6. 2012-13 we
ranked 34.6% in reading proficiency and 52.2% in math.
o Reading: 30.8% of students in proficient or advanced proficient.
o Math: 53.2% of students in proficient or advanced proficient.
Goal: 90% of students (FAY) in grades 1-6 will meet their achievement targeted growth in math and reading on
their MAP assessment.
o Reading: 55% of students in 1-6 met their targeted growth.
o Math: 66% of students in 1-6 met their targeted growth.
Goal: 80% of students grades 1-6 will obtain the spring median MAP RIT score or higher in math and reading.
o Reading: 62% of students in grades 1-6 met the spring median MAP RIT or higher.
o Math: 65% of students in 1-6 met the spring median MAP RIT or higher.
Goal: 90% of our students K-6 (FAY) will reach their instructional reading level (K-2,1st – I, 2nd – M, 3rd – P, 4th – S,
5th – V, 6th – Y
o Reading: 79% of students in grades K-6 were reading at their instructional level or higher.
Reading-MAP Targeted Growth % Met Targeted Growth Achievement % Met Achievement Total
Grade 1 22 52% 29 69% 42
Grade 2 32 63% 36 71% 51
Grade 3 28 64% 25 57% 44
Grade 4 33 54% 34 56% 61
Grade 5 24 59% 27 66% 41
Grade 6 17 39% 25 57% 44
Total 156 55% 176 62% 283
Math-MAP Targeted Growth % Met Targeted Growth Achievement % Met Achievement Total
Grade 1 40 95% 35 83% 42
Grade 2 31 61% 35 69% 51
Grade 3 26 59% 32 73% 44
Grade 4 33 54% 28 46% 61
Grade 5 26 63% 27 66% 41
Grade 6 32 73% 27 61% 44
Total 188 66% 184 65% 283
The above two MAP tables indicate the number or students who met their targeted growth by number and percentage as well as those who met their achievement growth and their percentage. The final column indicates the total number of students in that grade
Reading Benchmark Achievement % Achievement Total

Kindergarten 68 93% 73
Grade 1 35 83% 42
Grade 2 43 84% 51
Grade 3 33 75% 44
Grade 4 41 67% 61
Grade 5 34 83% 41
Grade 6 28 64% 44
Total 282 79% 356
Reading Minimal or Basic - MAP
American Indian Asian Black Hispanic White ELL Male Female SwD
EcD 100 100 100 93.8 72.3 100 85.8 61.5 90.5
Non Ecd 0 80 0 100 52.8 100 65.8 47.5 100
Math Minimal or Basic - MAP
American Indian Asian Black Hispanic White ELL Male Female SwD
EcD 100 50 100 37.5 59.6 50 59 56.4 76.2
Non Ecd 0 100 0 100 28.5 100 39.5 32.5 100
MAP Reading Total Advanced Proficient # MetTargeted Growth % Met Targeted Growth
1st 19 8 42
2nd 24 15 63
3rd 8 3 38
4th 20 6 30
5th 9 7 8
6th 9 0 0
Total 89 39 44
MAP Math Total Advanced Proficient # MetTargeted Growth % Met Targeted Growth
1st 13 13 100
2nd 14 7 50
3rd 9 3 33
4th 9 4 44
5th 15 9 60
6th 6 4 67
The above two tables looked at our students who started the year with adv. Proficient scores with their fall MAP test. We
were curious to see how well they achieved their achievement growth.
Summary, Findings and Celebrations
73% of our economically disadvantaged students reached their literacy bench mark goal and
81% of our non economically disadvantaged met their goal. Our goal was and remains 90%.

Though WKCE scores statewide are down we did make a minor math increase of 1%. Our reading
percentage goal followed the state trend and dropped 3.8% which was very disappointing.
83% of our students had 0-1 ODR. 71% had zero ODR’s. 11% of our students had 2-5 ODR’s and 6%
had 6 or more. 77% of our African American students had ODR’s (27 of 35 students) as compared
to 24% of our Latino, 25% Asian and 26% white. Referrals are mostly for defiance, disrespect and
disruption. With our SWIS data we were able to focus in on these struggling students and provide
SAIG support groups this year.
Our minority group that struggles the most are our African American students who also happen to
all be economically disadvantage. 100% of these students rank minimal or basic on their MAP
scores
When we did our data dig this spring we were also interested in the growth achievement of
students who started the year already advanced proficient. The scores were very poor for growth
so not only do we need to work with our most disadvantaged minority students but also some of
our more gifted.
Goal Considerations for 2014-15 MAP/Bench scores
We are going to continue to strive for 90% growth and proficiency for our school as a whole in
MAP and literacy benchmarks for both reading and math though we will move at a 5%
increment per year to get there. The district growth average is 57% for math and reading (50%
national). For math we were at 55% and for math 66%.
Because our reading scores are not moving up we are putting a focus on coaching our primary
grade teachers more intensely as well as ensuring that guided reading and assisted writing
practices are performed with fidelity with all grade level teachers.
Our reading coach/interventionist and Title one teacher are both going to be trained in Reading
Recovery over the next year. This will not only help our grade 1 students who primarily receive this
support but will also improve the literacy teaching skills of all of our teachers since instruction
received by our coach and Title one teacher will translate over to supports that they can provide
for all of our teachers as a whole.
Though our math scores are slowly going up we are going add a math assessment wall system to
our literacy wall so that we can put as much of an emphasis on math as we do on reading.
One of our 3rd grade teachers is going to be our Math lead teacher in the building. She is taking
the AVMR training in July and has also been accepted to the test group with the Harvard study.
Her newfound knowledge will be shared with our staff through a coaching model approach.
We have 6 teachers total who are attending the AVMR math training institute in July, two of
whom are our LD and EBD teachers.
Three of our teachers are attending a one day math workshop with me June 25th in Pewaukee
titled “The CCSS-M as a Catalyst for Change: Designing and Sustaining A Coherent Vision for
Mathematics Instruction and Assessment in your School and District.” This is the 4th day of 4 day
series workshop that I have attended this past school year. This workshop was designed for
administrators which is called the Wisconsin Administrators Math Initiative.
Because our high achieving students are not making significant academic growth we are going
to work with the gifted and talented teacher to consider options for how the TAG program can
assist our teachers in meeting the needs of these students.
“Bring your Parent to School Day” – a new way to bring parents in to the school to see how we do
things.
Goal Considerations for 2014-2015 for our behavior and attendance
Two years ago a grant was written to buy indoor recreational supplies so that we could have an
indoor recess option for our students who struggle in unstructured settings. Our ODR’s dropped
considerably. Last year FTE was dropped so we no longer could provide supervision and our
ODR’s went back up by 5%. Next year we are going to pay to have one parent help us with
recess supervision so that we can bring back this option for at least one day per week.
Our new Healthy Kids/PBI subcommittee is going to meet this summer to consider additional
means to provide options for recess either through structured game play outside or indoor
alternative clubs.
We will continue to use the services of TRAC to provide counseling for our parents who have
trouble getting their students to school on time. 8.6% of our students were habitually truant (32 of
371 students)
Presentation to teachers “To close the Achievement Gap – a social justice framework.”
Evening parent meetings by experts sponsored by PTA – i.e. 1-2-3 Magic, Love and Logic.


2013-14 Johnston Elementary Continuous School Improvement Plan Outcomes
Reading Goal:
We will improve reading comprehension skills so that at least 75% of all students will achieve one of the following:
Kindergarten: Goal Met – 95% of students at Benchmark Goal
reach May 2014 benchmark goal
25/25 sight words from Fountas and Pinnell Phonics
1st - 2nd grade: Goal Met – 83% of students at Benchmark Goal
reach May 2014 benchmark goal
reach proficiency or advanced proficiency on the Spring 2014 MAP Test
attain targeted MAP growth within 3 points
3rd – 6th grade: Goal Met – 76% of students at Benchmark Goal
reach proficiency or advanced proficiency on the Reading portion of the WKCE exam
reach May 2014 benchmark goal
reach proficiency or advanced proficiency on the Spring 2014 MAP Test
attain targeted MAP growth within 3 points
In addition, 60% of students in grades 1-6 will reach targeted growth on the Spring 2014 MAP test. Goal Not Met –
45%
Specific students targeted in this goal:
49% of ELL students will achieve proficiency with the above goal. Goal Not Met – 46%
48% of SwD students will achieve proficiency with the above goal. Goal Not Met (with Severe Autism
data) – 47%; Goal Met (without Severe Autism data) – 51%
50% of EcD students will achieve proficiency with the above goal. Goal Not Met – 46%
Math Goal:
We will improve math achievement skills so that all students achieve the following:
75% of all students will achieve proficient or higher on at least 50% of AASD unit math assessments. Goal
Met – 78%
at least 62% of all students will score proficient (or higher) or reach targeted growth within 3 points on the
Spring 2014 MAP Test. Goal Met – 81%
Specific students targeted in this goal:
35% of ELL students will achieve proficiency with one of the above goals. Goal Met – 69%
40% of SwD students will achieve proficiency with one of the above goals. Goal Met – 54%
50 % of EcD will achieve proficiency with one of the above goals. Goal Met 74%
PBIS/EHK Goal:
By reviewing data monthly, 90% of students, staff and families at Johnston will know and demonstrate our three
behavior expectations as measured by one or fewer office discipline referrals during the 2013-2014 school year; while
meeting overall academic achievement as measured by our CSIP reading and writing goals.
Goal Met - The data showed that we are at fidelity with 92% of our students receiving 0-1 office referrals this school
year as measured by SWIS data. It was determined that we are moving forward as represented by the SAS that 94%
of staff is knowledgeable and supportive of the PBIS framework; as well as the BOQ at 97%. We are a PBIS School
of Merit for the second straight year. Johnston is a GOLD Level Wisconsin Healthy School and we will continue to
improve our efforts in this area to maintain or improve upon that standing.
Summary of Findings:
Based upon your 2013-14 data, what are 3-5 key learnings/celebrations?
A cross-categorical special education program is being used at Johnston to create more opportunities for
inclusion for our students with disabilities along with times for targeted pull-out instruction. This allows
our special education teachers to become more proficient at two grade levels of curriculum rather than six
grade levels in a traditional special education service model. It also allows for closer communication and
collaboration for the regular and special education teachers. Cross categorical programming at Johnston is

clearly closing the gap in learning and achievement among special education students as seen in the data
that shows our 5th and 6th grade special education students exceeding our MAP Reading targeted growth
goal at 67% - well above our school average of 45%. Furthermore, a clear trend is noticeable from our 1st and
2nd grade MAP targeted growth achievement of only 18% and our 3rd and 4th grade MAP targeted growth
achievement of 60%.
This is Johnston’s third year of block scheduling, and teachers understand the importance and utility of
providing long, uninterrupted learning periods for academic instruction as well as scheduled time to
collaborate. Professional Learning Communities (PLCs) organized by grade level and/or departments are
becoming the preferred method of reflecting upon and improving instructional practice, and PLC meeting
time along with district monthly late start times have increased the opportunities to improve professional
practices of collaboration, collecting and analyzing data, and improving instruction.
All grade levels utilized Response to Instruction (RTI) times to better organize and implement interventions
for all students. Additionally, our PBIS Tier 1 and Tier 2 teams along with our Student Services RtI team
have increasingly implemented RtI practices throughout our school to improve student learning and reduce
special education referrals.
What are 1-3 things to be considered as you develop CSIP plans for 2014-15 based upon this year’s
experiences?
Despite the successes and student growth listed above, a sobering fact remains: Johnston students achieving
Proficiency on the Wisconsin statewide assessment for Reading and Math (WKCE) in grades 3 through 6 has
dropped or remained stagnant over the past five years as one can see in the data that concludes this report.
Therefore:
Johnston Elementary School will be simplifying our CSIP math and reading goals next year so that we can
a) use one consistent, objective assessment measure for end-of-year reporting and b) have clear, fair data
that will allow us to have honest, meaningful conversations about what we as a staff, including building
leadership, need to get better at in order to support improved student learning outcomes and professional
development efforts on improving our reading and math achievement.
Johnston will intensify our on-site literacy coaching in both universal instructional practices and in-class
intervention strategies. Our coaches will help create an environment of honest reflection, collaboration, and
trust to move our literacy instructional practices forward.
Utilizing new district technology and technological support as provided in the recent referendum, Johnston
will pilot a blended learning approach in Math instruction. This approach will include the district Math
Expressions curriculum in combination with DreamBox Learning Math. DreamBox Math is an online
adaptive learning program that is aligned with Common Core State Standards and is tailored to each
student’s unique learning needs. DreamBox Math will be used during parts of our RtI periods during the
school day, will be a cornerstone of our 21st Century Community Learning Center after school program, and
can be used at home for further practice and enrichment.
Our Student Services Team and PBIS team will continue to implement systemic and systematic culturally
responsive practices following RtI principles that allow all students to succeed academically and socially,
including practices that improve family/school communication and participation.


We made many positive strides at Lincoln this year. Our parent involvement continues to grow. We
have reached out to parents through phone calls, newsletters, the school website and created a Lincoln
Facebook page. We provided many successful and fun learning opportunities for our families including:
two reading nights, two math events, an ELL night and numerous family fun activities. These events
were well received and well attended. This being our second year as a Focus School we adopted the
targeted AMOs for the WKCE exam as main school goals. Below is a snap shot of the data based on
these goals. We also added some additional goals with more local assessments to contrast the WKCE
goals. As you can see our students are more successful in reaching benchmark and MAP goals than the
WKCE goals. With the Smarter Balanced Assessment taking over for the WKCE we are waiting for
guidance from DPI on how they will be measuring growth over the next two years. This information will
help drive our CSIP plans moving forward. We are proud of the many wonderful things that happened
at Lincoln this year. We are also focused on the growth that still needs to take place. The first chart
below lists some of the positive things that happened at Lincoln this year.
Lincoln’s Year in Review
Wisconsin PBIS School of Distinction Second Consecutive Year
We created in depth plans for three Indistar Indicators
We are in the process of creating a PBIS video library for 25 different building expectations
We established a Parent Leadership Team with monthly meetings (in addition to monthly PTA meetings)
Completed a book study on Comprehension Through Conversations…Each teacher developed a plan for
implementing rich conversations in their classrooms
We created a conversation continuum to track each child’s growth in speaking and listening
Successfully met all of the SAGE goals in grades K-3
Teamed up with the Appleton Fire Fighters Union to provide 90 plus coats to needy students
Professional Learning Communities met weekly
Students participated in numerous club activities including: Math Club, Chess Club, Running Club, Play 60 Club,
Reading Recess, Walking Club and Battle of the Books
Our ODRs were reduced significantly
WSAS Trends Data for Reading and Math

Reading 2013/14 WKCE
Grades Goal Results
3-6 Grades 3-6 from 19.1% advanced or proficient on the WKCE to 42.7%
advanced or proficient on the WKCE
25.3 % No
3-6 Grades 3-6 Asian students from 6.9% advanced or proficient on the
WKCE to 40.1% advanced or proficient on the WKCE
7.9% No
3-6 Grades 3-6 White students from 25.8% advanced or proficient on the
WKCE to 45.8% advanced or proficient on the WKCE
35.5% No
3-6 Grades 3-6 Economically Disadvantaged students from 16.5% advanced or proficient on the WKCE to 34.8% advanced or proficient on
the WKCE
20.2% No
3-6 Grades 3-6 English Language Learners from 0% advanced or
proficient on the WKCE to 29.7% advanced or proficient on the WKCE
10.5% No
Reading 13/14 MAP/Reading Levels
Grade Goal Results
K 85% of Kindergarten students will reach the benchmark goal 92% Yes
1 Increase from 79 % of the students to 85% of the students meeting their end of the year benchmark; or a year’s growth; or meeting their end of year target RIT goal within two points
90% Yes
2 Increase from 97 % of the students to 100% of the students meeting their end of the year benchmark; or a year’s growth; or meeting their end of year target RIT goal within two points
92% No
3 Increase from 90 % of the students to 96% of the students meeting their end of the year benchmark; or a year’s growth; or meeting their end of year target RIT goal within two points
96% Yes
4 Increase from 87 % of the students to 93% of the students meeting their end of the year benchmark; or a year’s growth; or meeting their end of year target RIT goal within two points
96% Yes
5 Increase from 85 % of the students to 91% of the students meeting their end of the year benchmark; or a year’s growth; or meeting their end of year target RIT goal within two points
91% Yes
6 Increase from 59 % of the students to 65% of the students meeting their end of the year benchmark; or a year’s growth; or meeting their end of year target RIT goal within two points
97% Yes

Math 13/14
Group Goal Results
All K-2 95% of students will master the SAGE goals
96.5% Yes
3-6 from 33.2% advanced or proficient on the WKCE to 56% advanced or proficient on the WKCE
33.4% No
3-6 Asian students from 20.7% advanced or proficient on the WKCE to 56.8% advanced or proficient on the WKCE
18.4% No
3-6 White students from 42.7% advanced or proficient on the WKCE to 59.5% advanced or proficient on the WKCE
43% No
3-6 Economically Disadvantaged students from 34.8% advanced or proficient on the WKCE to 47.4% advanced or proficient on the WKCE
26% No
3-6 English Language Learners from 12.5% advanced or proficient on the WKCE to 44.7% advanced or proficient on the WKCE
21.1% No
Although we made nice progress toward our goals, this success did not transfer over to the WKCE
results. We did not successfully meet our Target AMO as defined by our Focus School Designation. We
know the WKCE is just one data point that makes up the entire child. During the upcoming CSIP retreats
we will develop our plan on reaching the AMO for the four category groups in which we were identified
(Asian, White, Economically Disadvantaged and English Language Learners).

By increasing intervention time and conducting regular progress monitoring 60% of our student cohort groups will
demonstrate one year’s growth through MAP and/or each grade level will increase by 3% in the area of Math.


0%
20%
40%
60%
80%
100%
96%
83% 90%
83%
72% 71% 66%
82%
% Students Reaching Grade Level Benchmark in Reading
0%
10%
20%
30%
40%
50%
60%
70%
80%
1stGrade
2ndGrade
3rdGrade
4thGrade
5thGrade
6thGrade
GrandTotal
YES 45% 79% 73% 78% 67% 80% 70%
45%
79% 73% 78% 67%
80% 70%
% of Students Reaching MAP Goal
2013-14 Site Continuous School Improvement Findings
School: Richmond Elementary School
85% of all students at Richmond will be at or above the grade level reading benchmark by June 2014.
70% of students in grade 1st – 6
th grade will reach their MAP reading goal within 2 points AND/OR be in the
upper 25 percentile of the MAP testing. (61% Reached the goal in 2012-13)
We will increase the percentage of proficient students (on WKCE) who are economically disadvantaged by 20%.
For 2012-13, we want at least 20% of students (EcD) measuring proficient advanced on the WKCE. Last year
only 16% of our economically disadvantaged students scored proficient or advanced.
Data and Findings:
As we are in the first full year of utilizing
benchmarking for all the grade levels, we decided
to make 85% the pillar goal at Richmond. As
you can see from the data chart below, we had
some great successes and near misses when it
comes to reaching that goal. We are three
percentage points below the goal. As you can
see, a couple grade levels surpassed the goal set
by our school. With our vigilance on literacy, I
would hope to continue to see growth in the % of
intermediate students reaching their benchmark.
For our first sub-goal, we utilized our MAP data.
We want all students to reach their growth and/or be
in the 75th percentile on the MAP test. We kept the
70% goal for this year as we missed it by 9% last
year. I am proud to say that our school hit our goal
of 70%. You can see that multiple grade levels are
getting into the surpass the testing. Again as
looking at last year, our first graders do not hit the
expected growth. If you compare it to last year’s
first graders, we had a vast improvement on those
kids reaching the goal. Last year, only 26% of our
first graders reached the school goal. I always
question the first grade MAP growth expectations
because so many of our students don’t reach it. Here
is what I wrote at the end of last year: I will make
the “Joe Namath” guarantee that as 2nd
graders,
you will see the percentage of students reaching this
goal increase. When you look at that class as
second graders, 79% reached the goal this year.
That is a great improvement from last year and I
would expect the same with this year’s 1st graders
going into 2014-15.

Our second sub-goal was to analyze and
improve on the students who are
economically disadvantaged. On the WKCE
test, we wanted to improve their of
proficiency by 20%. We wanted to at least
hit 20%. Last year, we only had 16% score
proficient or advanced and it was the third
year in a row where our proficiency declined
for students economically disadvantaged.
As you can see, we have the highest
percentage of economically disadvantaged
students in four years getting a proficient
score on the WKCE. We have a lot great
deal of work ahead of us. Currently, 39% of
our students who are not economically
disadvantaged were proficient/advanced on
the state test. That represents an
achievement gap of 14%. Compare that to
last year’s 21% achievement gap and you
can see we really went in the right direction.
I hope we are able to see a gradual increase
on the new balanced assessment and look to
shrink the skills deficit between students
who are economically disadvantaged and
those who are not.
Summary of Findings:
Based upon your 2013-14 data, what are 3-5 key learnings/celebrations? * We are only a few percentage points away from reaching the 85% goal for reading level benchmark. I think this is an excellent kick off goal for benchmarks. We have done a great deal of work to help students and I think it shows in this number. * We hit our goal for MAP testing. We did change how first graders completed the test and we found a great improvement in getting them to reach their goals. I would like to highlight one class to tell the story of our improvement. Only 55% of last year’s 5th graders reached their goal. This year, that same group of students had 80% of the students reach the goal. *Although it will be the last year of the WKCE, Richmond stopped a downward trend that started four years ago with students economically disadvantaged. We had an all-time low last year and saw great improvements in that proficiency number this year. What are 1-3 things to be considered as you develop CSIP plans for 2013-14 based upon this year’s experiences? *I interpret this year’s data as confirming that we are on the right track. Multiple data points tell us that we were able to see improvements in proficiency and growth over the 2013-14 year. We will continue to solidify the knowledge of our curriculum, continue to find interventions to help students grow and we will continue to utilize the PLC to work through this important work.
This graph shows the proficiency level for reading of
economically disadvantaged students on the WKCE test from
2009-2014. Richmond Elementary

2013-2014 Continuous School Improvement Findings
School: Wisconsin Connections Academy
School Improvement Goal(s): As a community of learners, WCA staff, learning coaches, and students
will improve student achievement in the areas of math and reading. Benchmark measures include:
65% of students in grades K-3 will meet or exceed AASD Board of Education instructional
reading level expectations
The percentage of students in grades 3-8, and 10, scoring advance or proficient in math and
reading on the WKCE will meet or exceed the AASD averages.
Data and Findings:
The following tables represent reading benchmarking results using Fountas and Pinnell benchmarking
system. Numbers indicate students who reached grade level proficiency for both new and returning
students.
Instructional Reading Levels
Grade K 1 2 3 Overall Average
% of students who reached goal
65% 65% 64% 51% 61%
% of returning students who reached goal
56% 54% 58% 56%
% of new students who reached goal
71% 78% 38% 62%
The following tables represent WKCE proficiency scores for returning students.
Math WKCE proficiency
Grade 3 4 5 6 7 8 10 Overall Average
WCA 55% 48% 58% 43% 43% 46% 33% 47% AASD 45% 51% 52% 47% 49% 54% 51% 50%
Reading WKCE proficiency
Grade 3 4 5 6 7 8 10 Overall Average
WCA 48% 49% 46% 42% 47% 43% 53% 47% AASD 36% 34% 36% 36% 42% 35% 46% 38%
Summary of Findings:
WCA met one out of three goals for the 2013-2014 school year. WCA did not achieve the reading
benchmark goal. The goal was that 65% of students in grades K-3 will meet or exceed AASD Board of
Education instructional reading level expectations. Sixty-one percent of K-3 students exceeded the
instructional reading level expectations. The WKCE goal for math and reading was to exceed the
district’s percentage of students who scored advance or proficient. WCA did not meet the goal in the
area of math. Forty-seven percent of the students scored proficient or higher on the math portion,
while the district’s average was 50%. WCA did meet the goal in the area of reading. Forty-seven
percent of students in grades 3-8 and 10 scored proficient or higher on the WKCE, while the district’s
average was 38% of students.
Based upon your 2012-2013 data, what are 3-5 key learnings/celebrations?
Math: While overall WCA did not meet the goal, students in grades three and five did exceed the district
averages. When comparing WCA’s results over the last two years, this year’s overall average was higher.
Therefore, the instructional changes that have been made are having an impact.
Reading: On the WKCE, WCA met the goal. WCA students scored 9% higher than the district. When
looking at the individual grades, all grades met the goal. Last year’s fourth grade class was an outlier
(25% scored proficient or higher) and showed improvement this school year.
When looking at benchmarking, kindergartners and first graders achieved the goal. Second graders
missed it by one percentage point. The third grade level struggled to meet the goal.
What are 1-3 things to be considered as you develop CSIP plans for 2014-2015 based upon this year’s
experience?
Math: WCA will continue to add benchmark assessments at selected grades with the intention to
expand this assessment plan to all grade levels. WCA teachers will also continue to focus on targeting
skills individual students need to work on by creating lessons around these skills.
Reading: The plan is to look at the benchmarking reading data more closely to determine the focus for
WCA’s 2014-2015 CSIP plan. WCA will continue to have reading groups for students reading below
grade level. In addition, WCA will expand the students being benchmarked mid-year.