Embed Size (px)
Citation preview
BAE Systems
2011 Preliminary Results
16 February 2012
1© BAE Systems 2012
Ian King
2© BAE Systems 2012
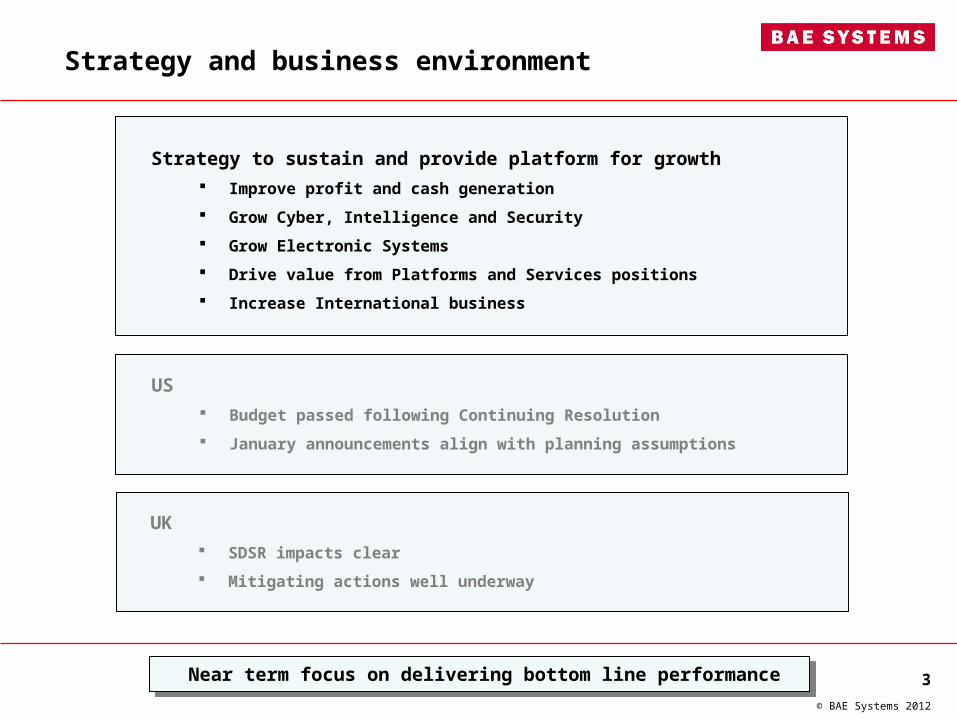
Strategy and business environment
Near term focus on delivering bottom line performance
Strategy to sustain and provide platform for growth
Improve profit and cash generation
Grow Cyber, Intelligence and Security
Grow Electronic Systems
Drive value from Platforms and Services positions
Increase International business
US
Budget passed following Continuing Resolution
January announcements align with planning assumptions
UK
SDSR impacts clear
Mitigating actions well underway
3© BAE Systems 2012
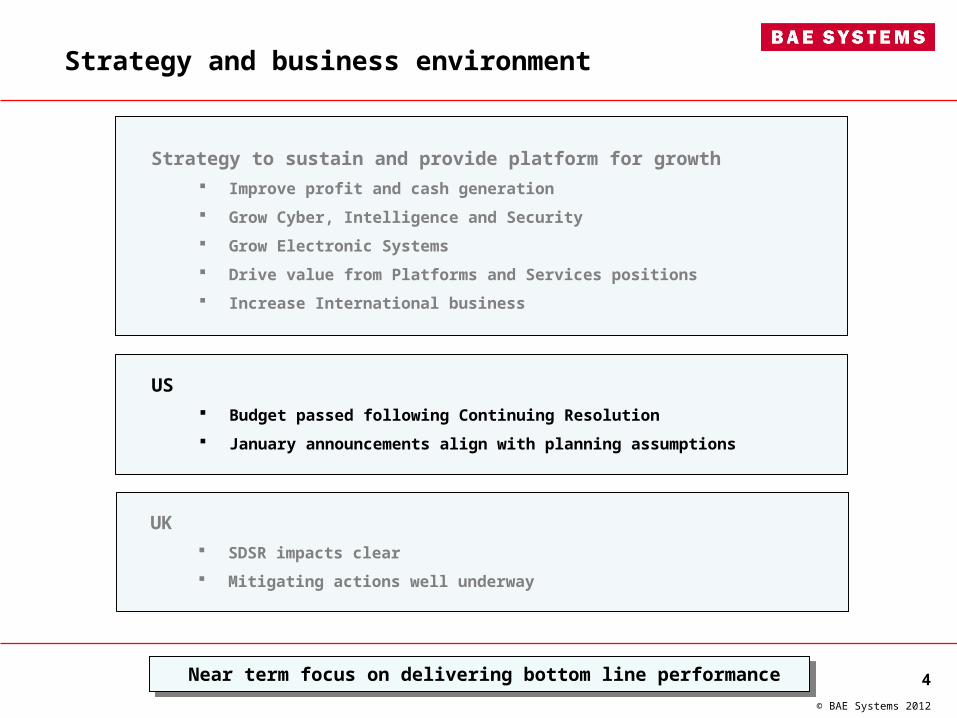
Strategy and business environment
Near term focus on delivering bottom line performance
Strategy to sustain and provide platform for growth
Improve profit and cash generation
Grow Cyber, Intelligence and Security
Grow Electronic Systems
Drive value from Platforms and Services positions
Increase International business
US
Budget passed following Continuing Resolution
January announcements align with planning assumptions
UK
SDSR impacts clear
Mitigating actions well underway
4© BAE Systems 2012
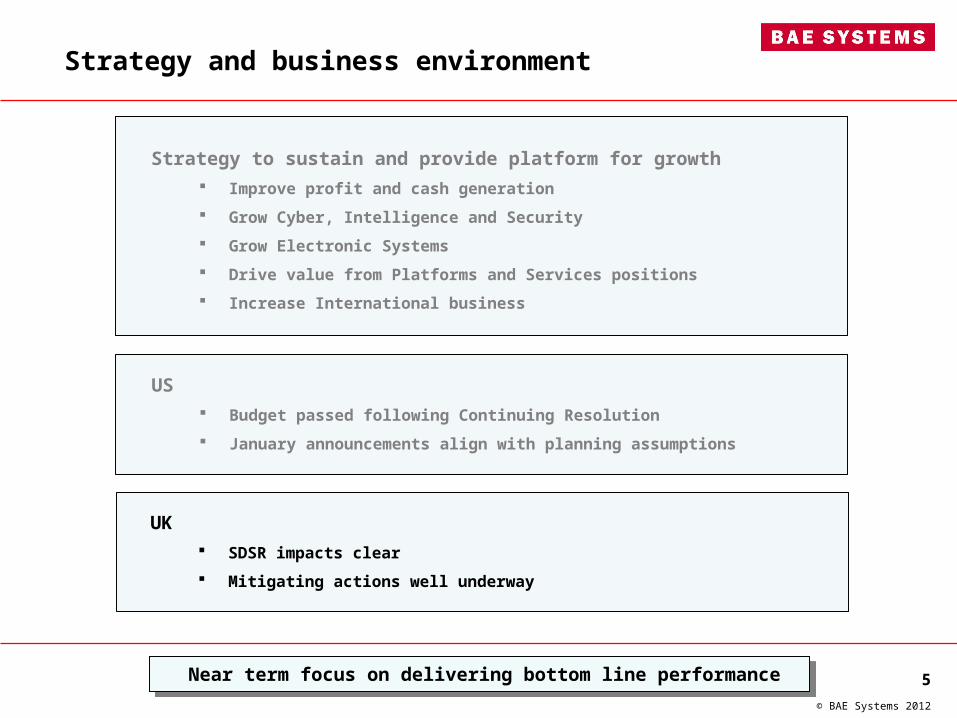
Strategy and business environment
Near term focus on delivering bottom line performance
Strategy to sustain and provide platform for growth
Improve profit and cash generation
Grow Cyber, Intelligence and Security
Grow Electronic Systems
Drive value from Platforms and Services positions
Increase International business
US
Budget passed following Continuing Resolution
January announcements align with planning assumptions
UK
SDSR impacts clear
Mitigating actions well underway
5© BAE Systems 2012
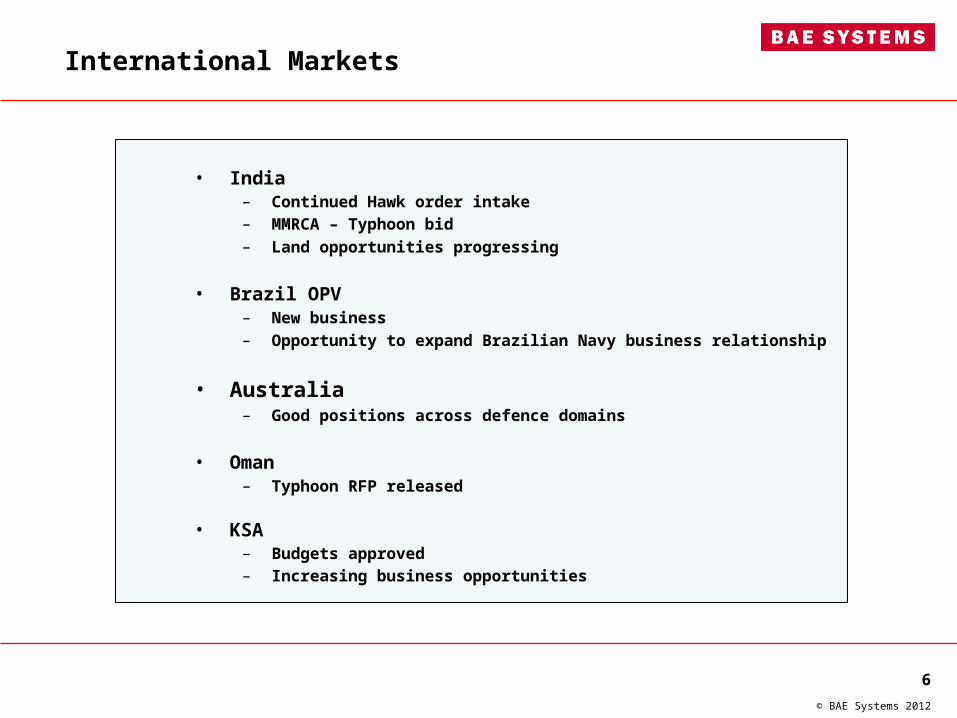
International Markets
• India – Continued Hawk order intake– MMRCA – Typhoon bid– Land opportunities progressing
• Brazil OPV– New business– Opportunity to expand Brazilian Navy business relationship
• Australia– Good positions across defence domains
• Oman – Typhoon RFP released
• KSA– Budgets approved– Increasing business opportunities
6© BAE Systems 2012
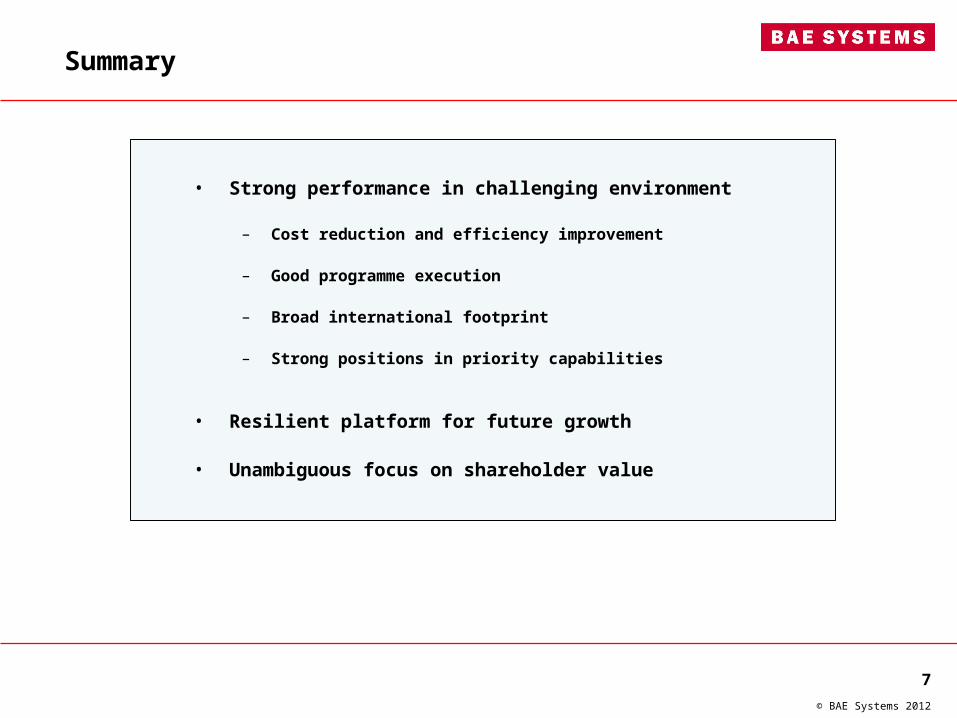
Summary
• Strong performance in challenging environment
– Cost reduction and efficiency improvement
– Good programme execution
– Broad international footprint
– Strong positions in priority capabilities
• Resilient platform for future growth
• Unambiguous focus on shareholder value
7© BAE Systems 2012

Peter Lynas
8© BAE Systems 2012
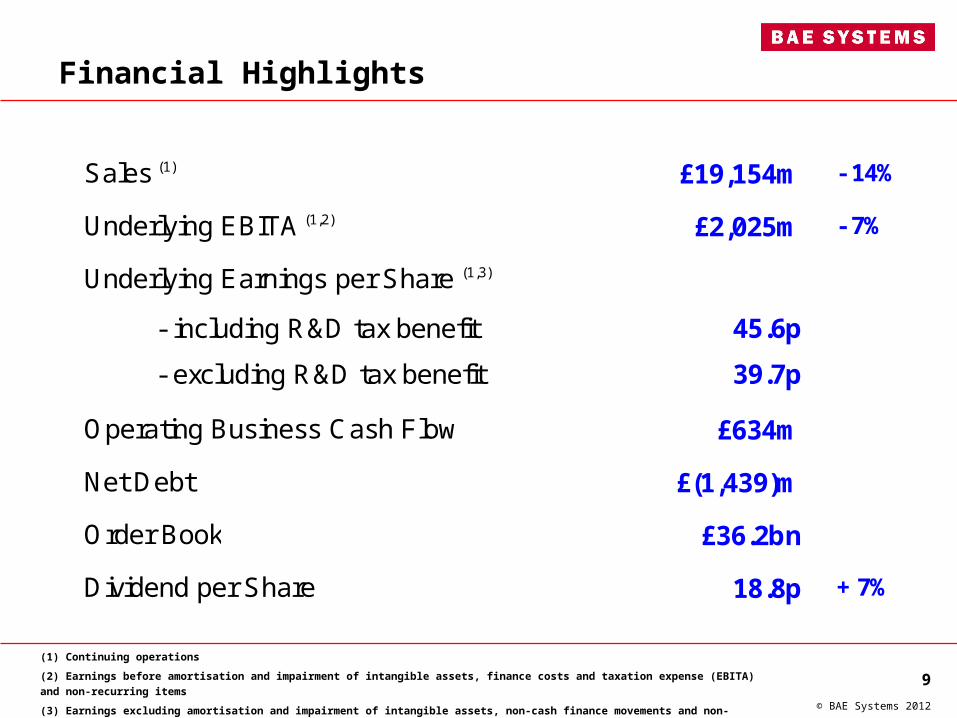
Financial Highlights
(1) Continuing operations
(2) Earnings before amortisation and impairment of intangible assets, finance costs and taxation expense (EBITA) and non-recurring items
(3) Earnings excluding amortisation and impairment of intangible assets, non-cash finance movements and non-recurring items
Sales (1) £19,154m - 14%
Underlying EBITA (1,2) £2,025m - 7%
Underlying Earnings per Share (1,3)
- including R&D tax benefit 45.6p
- excluding R&D tax benefit 39.7p
Operating Business Cash Flow £634m
Net Debt £(1,439)m
Order Book £36.2bn
Dividend per Share 18.8p + 7%
9© BAE Systems 2012
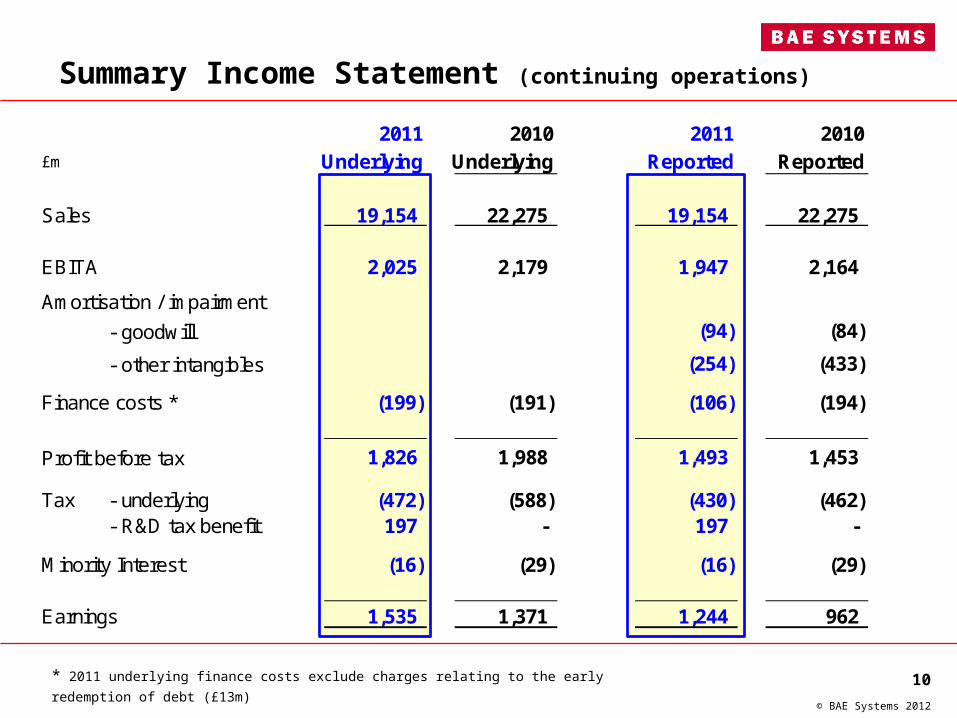
Summary Income Statement (continuing operations)
10© BAE Systems 2012
* 2011 underlying finance costs exclude charges relating to the early redemption of debt (£13m)
2011 2010 2011 2010£m Underlying Underlying Reported Reported
Sales 19,154 22,275 19,154 22,275
EBITA 2,025 2,179 1,947 2,164
Amortisation / impairment
- goodwill (94) (84)
- other intangibles (254) (433)
Finance costs * (199) (191) (106) (194)
Profit before tax 1,826 1,988 1,493 1,453
Tax - underlying (472) (588) (430) (462)- R&D tax benefit 197 - 197 -
Minority Interest (16) (29) (16) (29)
Earnings 1,535 1,371 1,244 962
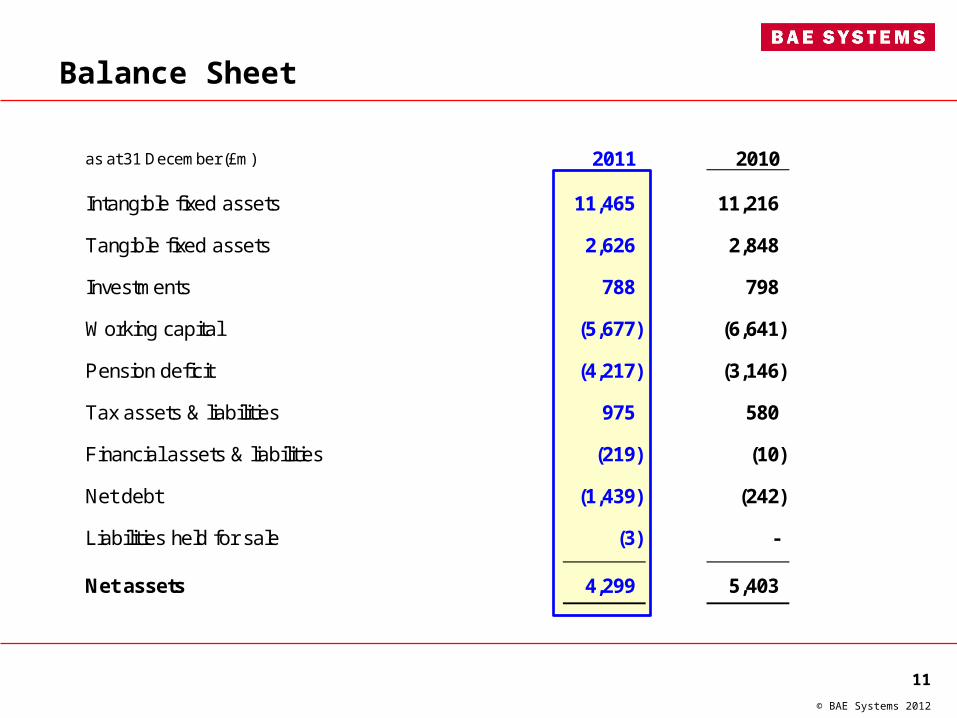
Balance Sheet
11© BAE Systems 2012
as at 31 December (£m) 2011 2010
Intangible fixed assets 11,465 11,216
Tangible fixed assets 2,626 2,848
Investments 788 798
Working capital (5,677) (6,641)
Pension deficit (4,217) (3,146)
Tax assets & liabilities 975 580
Financial assets & liabilities (219) (10)
Net debt (1,439) (242)
Liabilities held for sale (3) -
Net assets 4,299 5,403
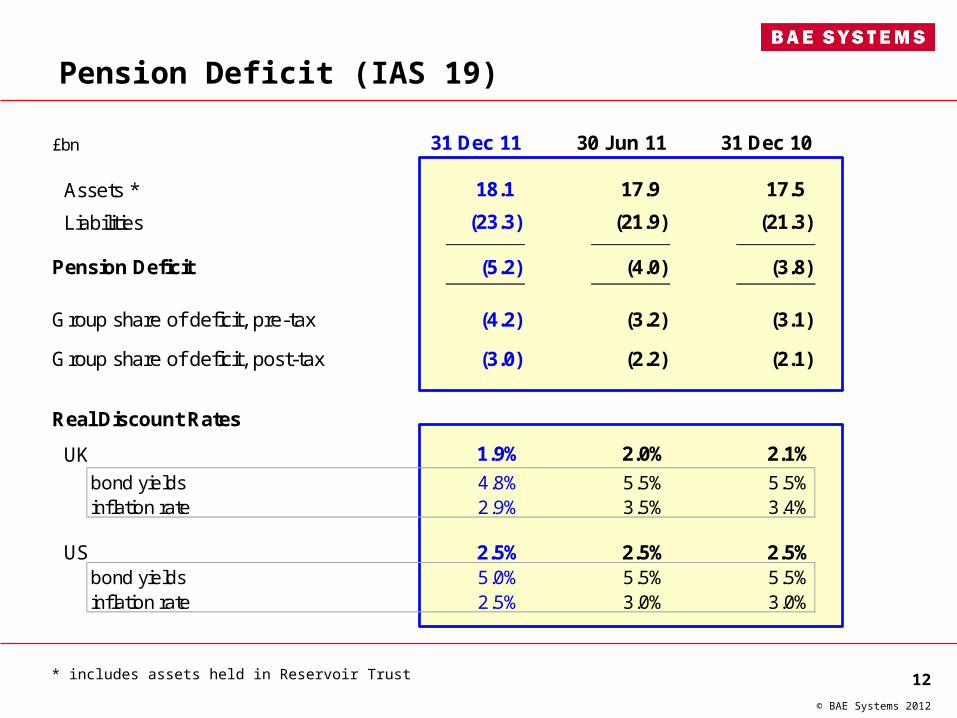
Pension Deficit (IAS 19)
* includes assets held in Reservoir Trust
£bn
Assets * 18.1 17.9 17.5
Liabilities (23.3) (21.9) (21.3)
Pension Deficit (5.2) (4.0) (3.8)
Group share of deficit, pre-tax (4.2) (3.2) (3.1)
Group share of deficit, post-tax (3.0) (2.2) (2.1)
Real Discount Rates
UK 1.9% 2.0% 2.1%
bond yields 4.8% 5.5% 5.5%inflation rate 2.9% 3.5% 3.4%
US 2.5% 2.5% 2.5%bond yields 5.0% 5.5% 5.5%inflation rate 2.5% 3.0% 3.0%
31 Dec 11 30 Jun 11 31 Dec 10
12© BAE Systems 2012
-
1.0
2.0
3.0
4.0
PreviousDeficit
CurrentDeficit
£bn
Deficit (recovery profile) Deficit (latest estimate)
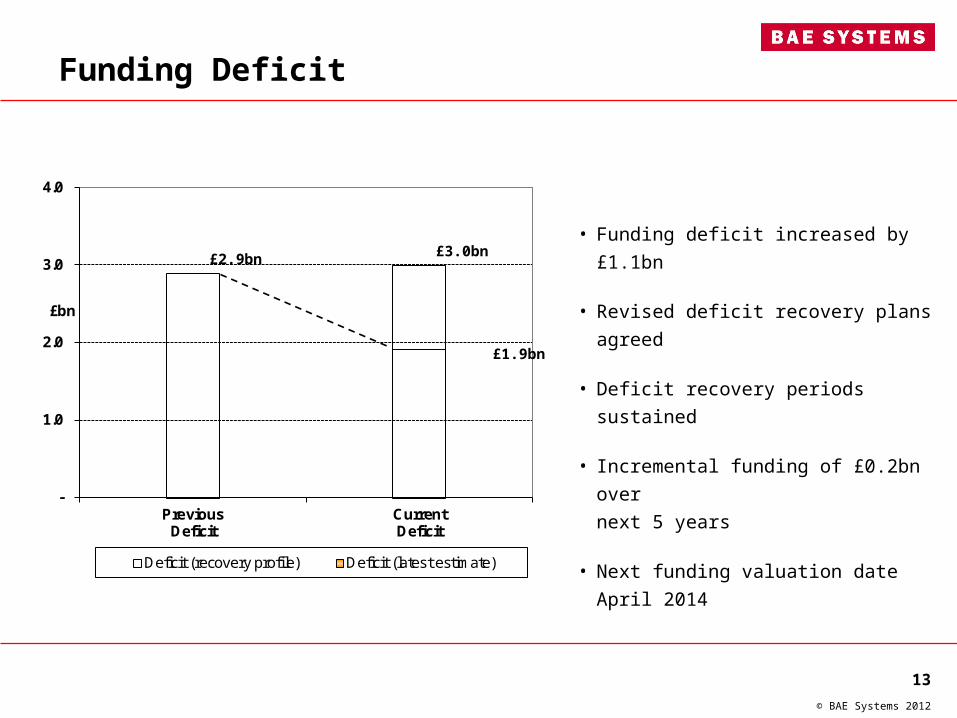
Funding Deficit
£2.9bn £3.0bn
£1.9bn
• Funding deficit increased by £1.1bn
• Revised deficit recovery plans agreed
• Deficit recovery periods sustained
• Incremental funding of £0.2bn over
next 5 years
• Next funding valuation date April 2014
13© BAE Systems 2012
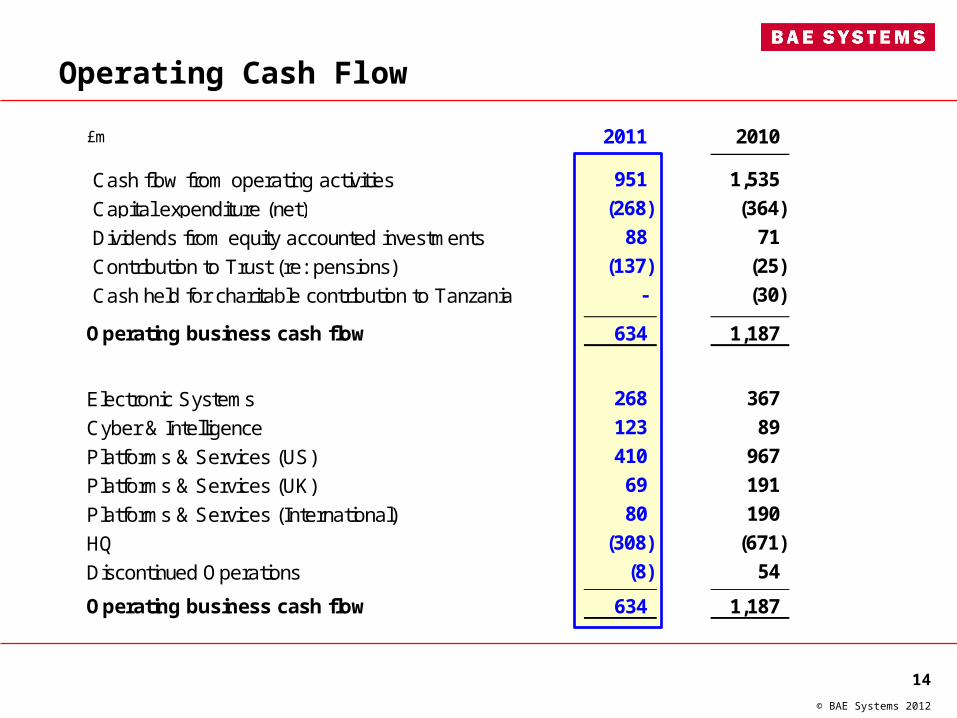
Operating Cash Flow
14© BAE Systems 2012
£m 2011 2010
Cash flow from operating activities 951 1,535
Capital expenditure (net) (268) (364)
Dividends from equity accounted investments 88 71
Contribution to Trust (re: pensions) (137) (25)
Cash held for charitable contribution to Tanzania - (30)
Operating business cash flow 634 1,187
Electronic Systems 268 367
Cyber & Intelligence 123 89
Platforms & Services (US) 410 967
Platforms & Services (UK) 69 191
Platforms & Services (International) 80 190
HQ (308) (671)
Discontinued Operations (8) 54
Operating business cash flow 634 1,187
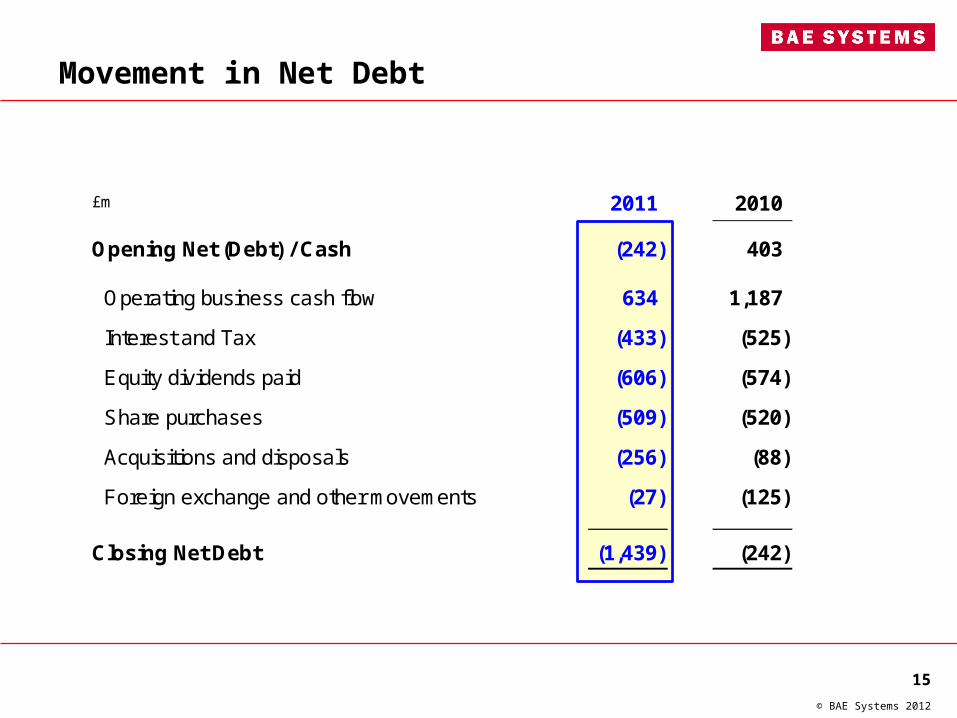
Movement in Net Debt
15© BAE Systems 2012
£m 2011 2010
Opening Net (Debt) / Cash (242) 403
Operating business cash flow 634 1,187
Interest and Tax (433) (525)
Equity dividends paid (606) (574)
Share purchases (509) (520)
Acquisitions and disposals (256) (88)
Foreign exchange and other movements (27) (125)
Closing Net Debt (1,439) (242)
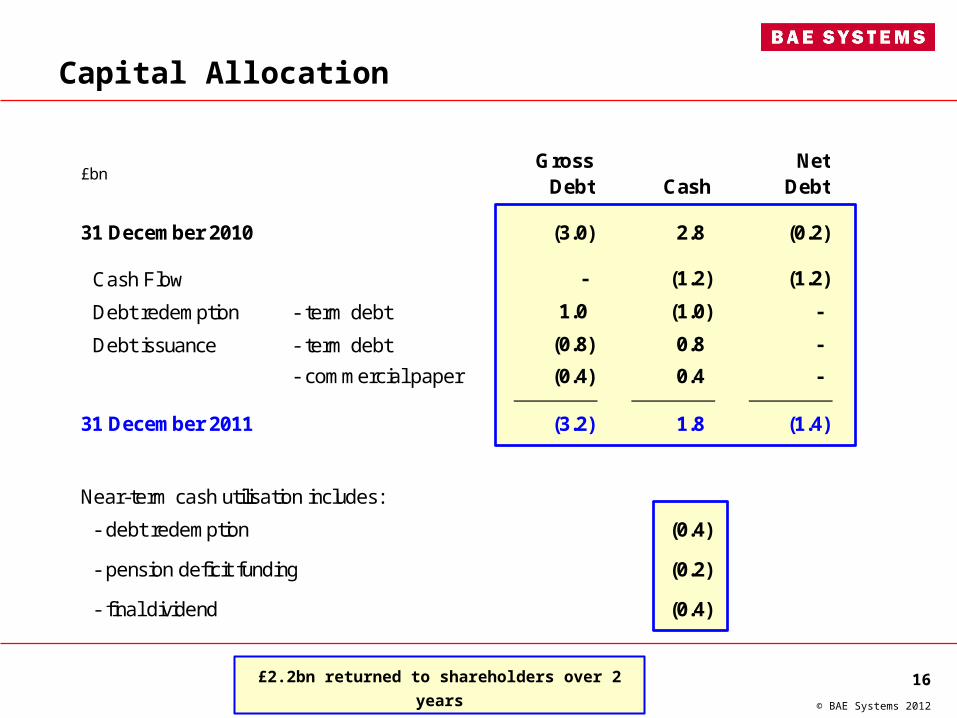
Capital Allocation
£2.2bn returned to shareholders over 2 years 16© BAE Systems 2012
£bnGross
Debt CashNet
Debt
31 December 2010 (3.0) 2.8 (0.2)
Cash Flow - (1.2) (1.2)
Debt redemption - term debt 1.0 (1.0) -
Debt issuance - term debt (0.8) 0.8 -
- commercial paper (0.4) 0.4 -
31 December 2011 (3.2) 1.8 (1.4)
Near-term cash utilisation includes:
- debt redemption (0.4)
- pension deficit funding (0.2)
- final dividend (0.4)
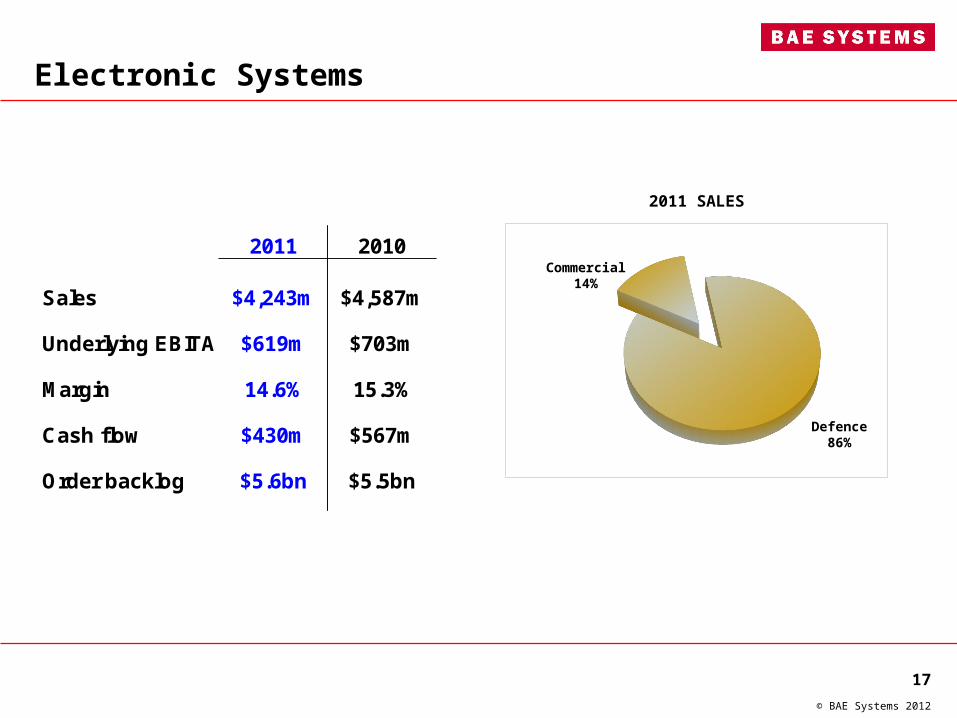
Electronic Systems
Defence86%
2011 SALES
2011 2010
Sales $4,243m $4,587m
Underlying EBITA $619m $703m
Margin 14.6% 15.3%
Cash flow $430m $567m
Order backlog $5.6bn $5.5bn
Commercial14%
17© BAE Systems 2012
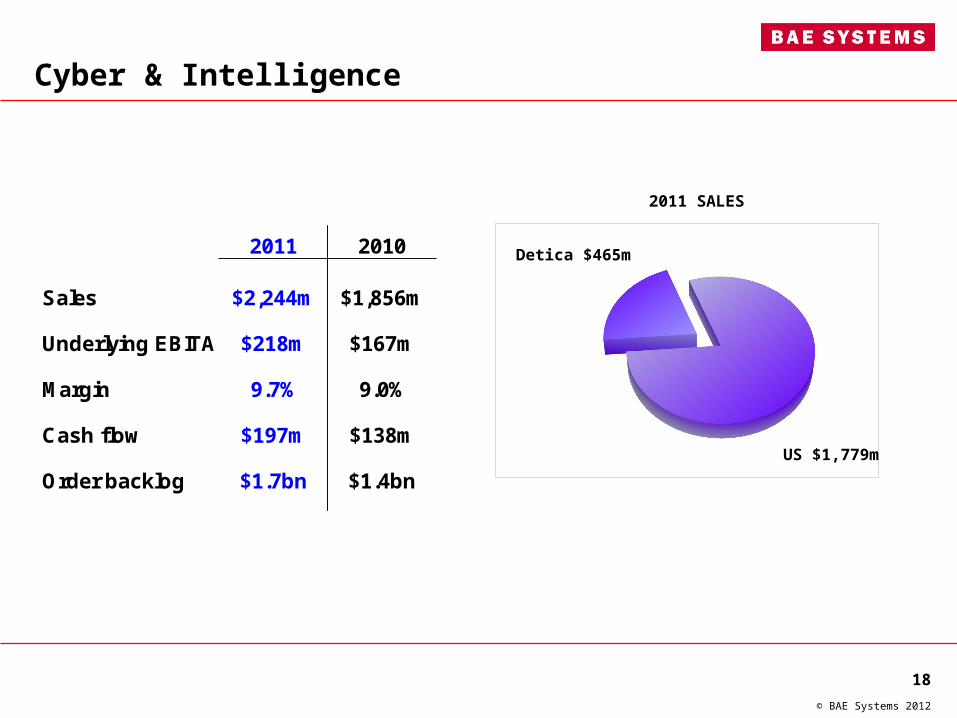
Cyber & Intelligence
2011 SALES
2011 2010
Sales $2,244m $1,856m
Underlying EBITA $218m $167m
Margin 9.7% 9.0%
Cash flow $197m $138m
Order backlog $1.7bn $1.4bnUS $1,779m
Detica $465m
18© BAE Systems 2012
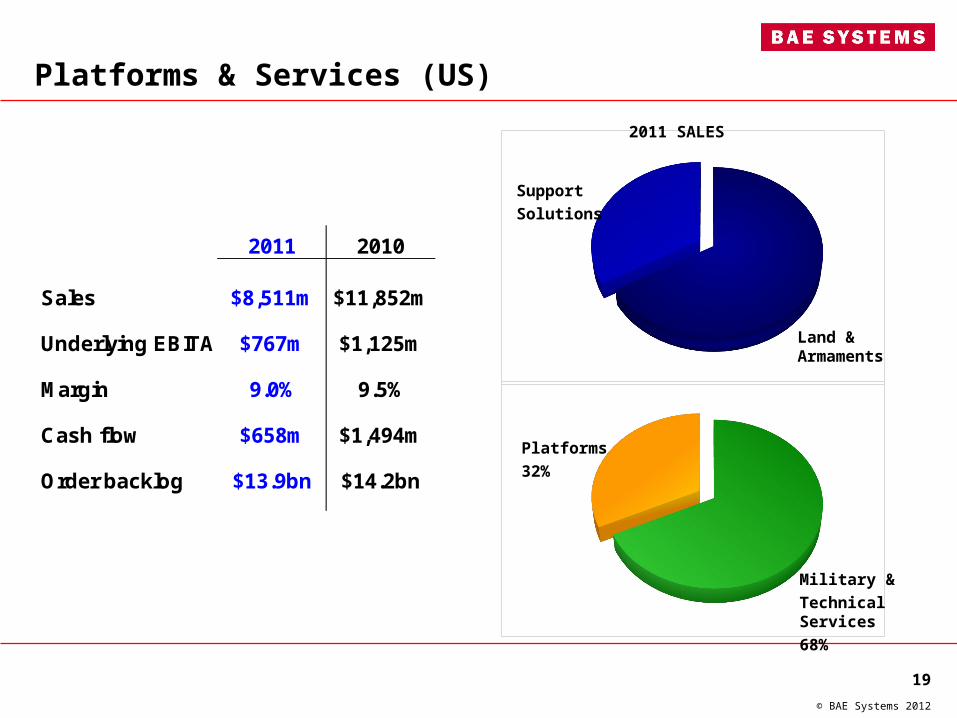
Platforms & Services (US)
2011 2010
Sales $8,511m $11,852m
Underlying EBITA $767m $1,125m
Margin 9.0% 9.5%
Cash flow $658m $1,494m
Order backlog $13.9bn $14.2bn
2011 SALES
Support
Solutions
Land & Armaments
Platforms
32%
Military &
Technical Services
68%
19© BAE Systems 2012
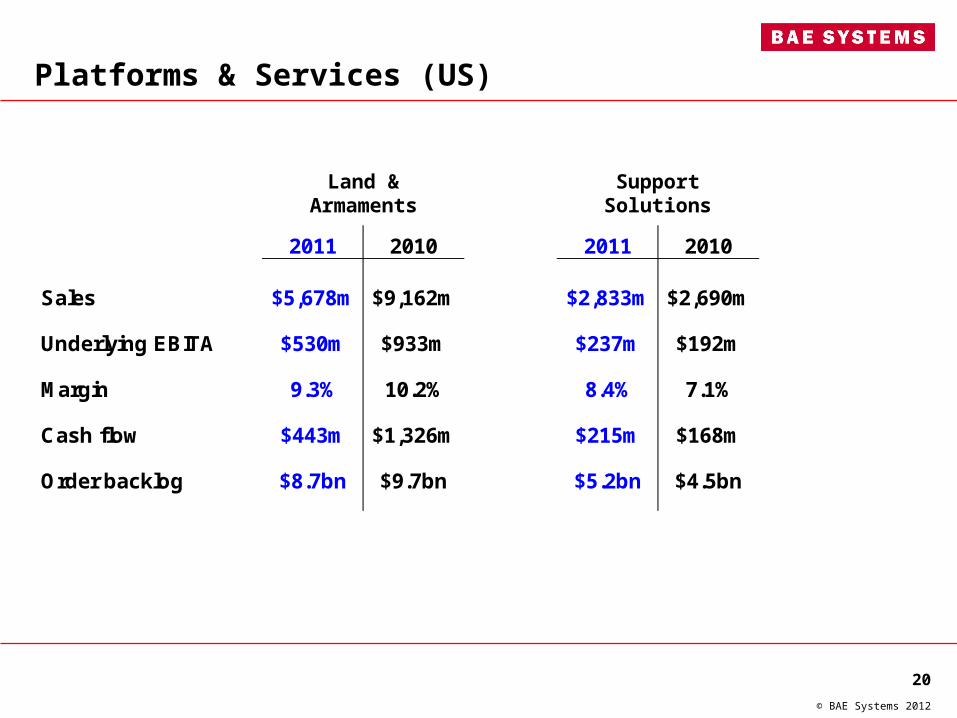
Platforms & Services (US)
2011 2010 2011 2010
Sales $5,678m $9,162m $2,833m $2,690m
Underlying EBITA $530m $933m $237m $192m
Margin 9.3% 10.2% 8.4% 7.1%
Cash flow $443m $1,326m $215m $168m
Order backlog $8.7bn $9.7bn $5.2bn $4.5bn
Land & Armaments
SupportSolutions
20© BAE Systems 2012
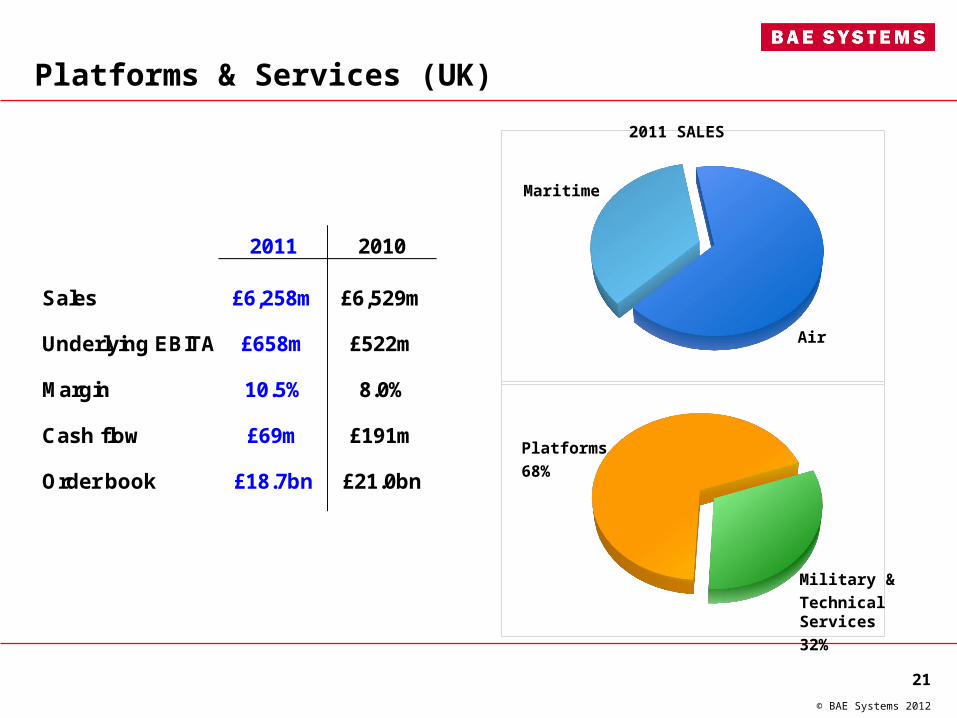
Platforms & Services (UK)
2011 2010
Sales £6,258m £6,529m
Underlying EBITA £658m £522m
Margin 10.5% 8.0%
Cash flow £69m £191m
Order book £18.7bn £21.0bn
2011 SALES
Maritime
Air
Platforms
68%
Military &
Technical Services
32%
21© BAE Systems 2012
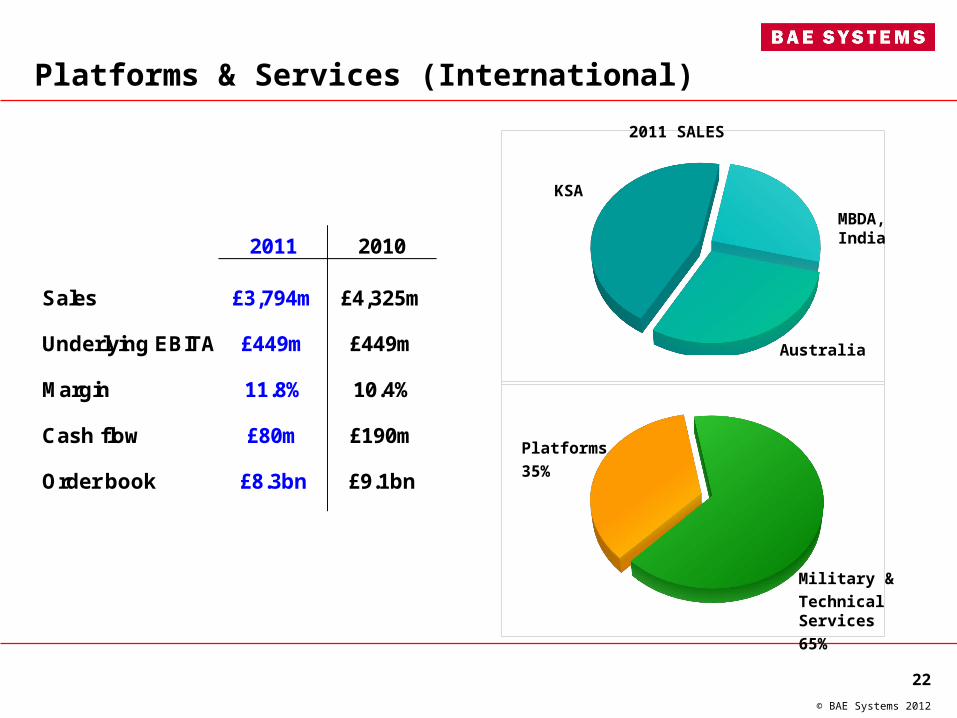
Platforms & Services (International)
2011 2010
Sales £3,794m £4,325m
Underlying EBITA £449m £449m
Margin 11.8% 10.4%
Cash flow £80m £190m
Order book £8.3bn £9.1bn
2011 SALES
KSA
Australia
Platforms
35%
Military &
Technical Services
65%
MBDA, India
22© BAE Systems 2012
2010
Resta
ted Lan
d
Export
OPV
char
ge (n
et)
Ratex
reco
very
T&T OPV
writ
e-up
Other
per
form
ance
Currency
transl
atio
n Tax
Rate
Share
Base 20
110
10
20
30
40
50
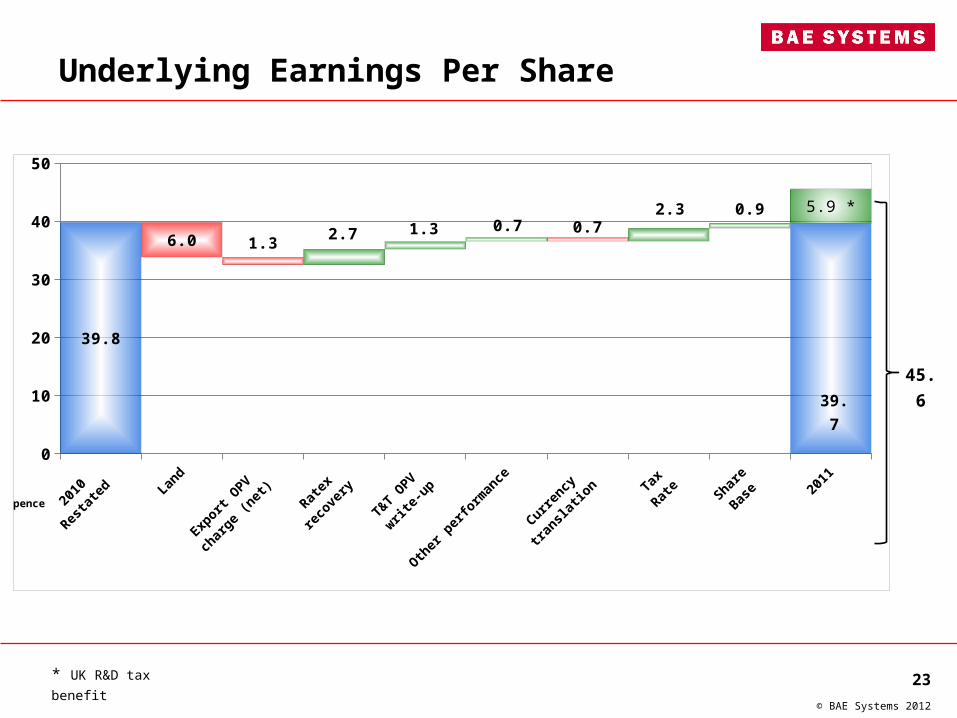
39.8
6.0 1.32.7 1.3 0.7 0.7
2.3 0.9 5.9 *
Underlying Earnings Per Share
23© BAE Systems 2012
39.7
45.6
* UK R&D tax benefit
pence

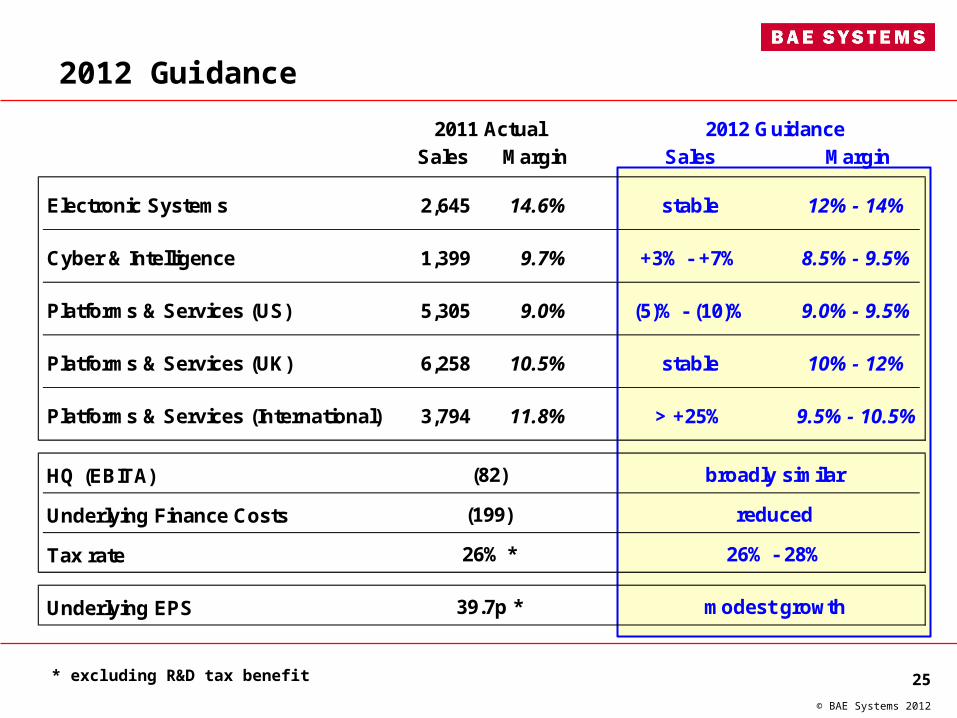
2012 Guidance
Sales Margin Sales Margin
Electronic Systems 2,645 14.6% stable 12% - 14%
Cyber & Intelligence 1,399 9.7% +3% - +7% 8.5% - 9.5%
Platforms & Services (US) 5,305 9.0% (5)% - (10)% 9.0% - 9.5%
Platforms & Services (UK) 6,258 10.5% stable 10% - 12%
Platforms & Services (International) 3,794 11.8% > +25% 9.5% - 10.5%
HQ (EBITA)
Underlying Finance Costs
Tax rate
Underlying EPS 39.7p * modest growth
2011 Actual 2012 Guidance
broadly similar
26% - 28%
(82)
26% *
(199) reduced
* excluding R&D tax benefit 24© BAE Systems 2012
2012 Guidance
Sales Margin Sales Margin
Electronic Systems 2,645 14.6% stable 12% - 14%
Cyber & Intelligence 1,399 9.7% +3% - +7% 8.5% - 9.5%
Platforms & Services (US) 5,305 9.0% (5)% - (10)% 9.0% - 9.5%
Platforms & Services (UK) 6,258 10.5% stable 10% - 12%
Platforms & Services (International) 3,794 11.8% > +25% 9.5% - 10.5%
HQ (EBITA)
Underlying Finance Costs
Tax rate
Underlying EPS 39.7p * modest growth
2011 Actual 2012 Guidance
broadly similar
26% - 28%
(82)
26% *
(199) reduced
* excluding R&D tax benefit 25© BAE Systems 2012

Summary
• Strong performance in challenging environment
– Cost reduction and efficiency improvement
– Good programme execution
– Broad international footprint
– Strong positions in priority capabilities
• Resilient platform for future growth
• Unambiguous focus on shareholder value
26© BAE Systems 2012
BAE Systems
2011 Preliminary Results
16 February 2012
27© BAE Systems 2012