Embed Size (px)
Citation preview
1 / 8
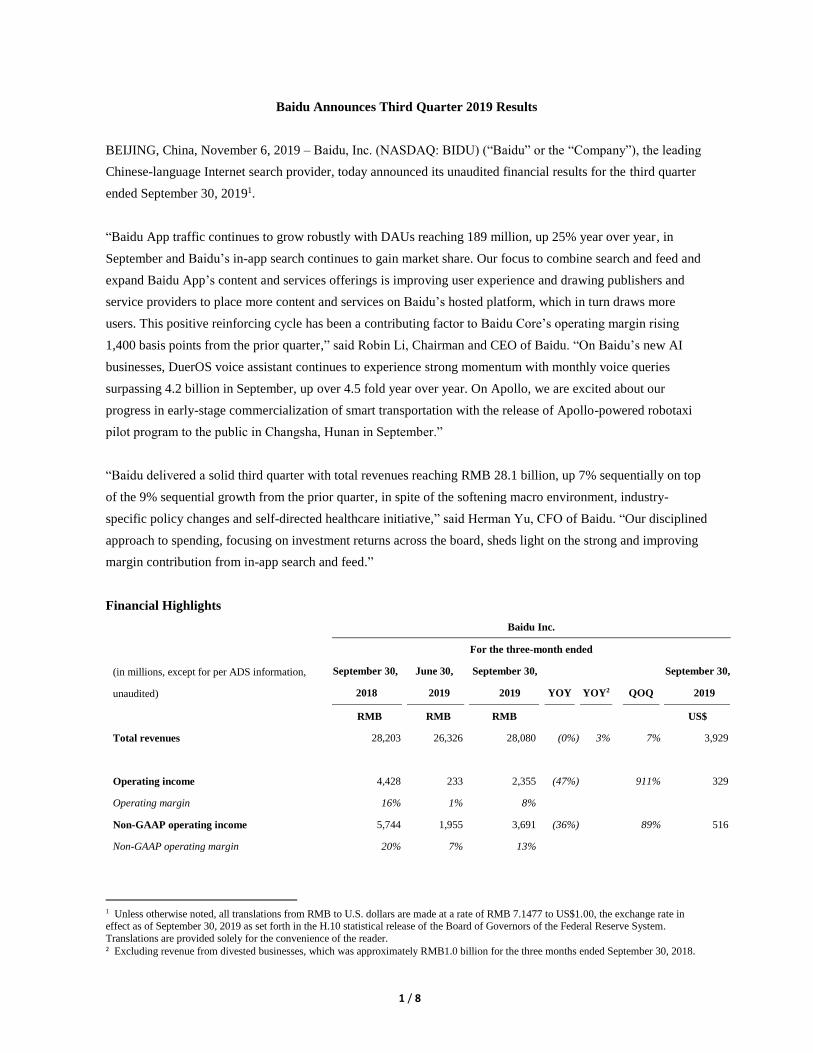
Baidu Announces Third Quarter 2019 Results
BEIJING, China, November 6, 2019 – Baidu, Inc. (NASDAQ: BIDU) (“Baidu” or the “Company”), the leading
Chinese-language Internet search provider, today announced its unaudited financial results for the third quarter
ended September 30, 20191.
“Baidu App traffic continues to grow robustly with DAUs reaching 189 million, up 25% year over year, in
September and Baidu’s in-app search continues to gain market share. Our focus to combine search and feed and
expand Baidu App’s content and services offerings is improving user experience and drawing publishers and
service providers to place more content and services on Baidu’s hosted platform, which in turn draws more
users. This positive reinforcing cycle has been a contributing factor to Baidu Core’s operating margin rising
1,400 basis points from the prior quarter,” said Robin Li, Chairman and CEO of Baidu. “On Baidu’s new AI
businesses, DuerOS voice assistant continues to experience strong momentum with monthly voice queries
surpassing 4.2 billion in September, up over 4.5 fold year over year. On Apollo, we are excited about our
progress in early-stage commercialization of smart transportation with the release of Apollo-powered robotaxi
pilot program to the public in Changsha, Hunan in September.”
“Baidu delivered a solid third quarter with total revenues reaching RMB 28.1 billion, up 7% sequentially on top
of the 9% sequential growth from the prior quarter, in spite of the softening macro environment, industry-
specific policy changes and self-directed healthcare initiative,” said Herman Yu, CFO of Baidu. “Our disciplined
approach to spending, focusing on investment returns across the board, sheds light on the strong and improving
margin contribution from in-app search and feed.”
Financial Highlights
Baidu Inc.
For the three-month ended
(in millions, except for per ADS information,
unaudited)
September 30,
2018
June 30,
2019
September 30,
2019 YOY YOY2 QOQ
September 30,
2019
RMB RMB RMB US$
Total revenues 28,203 26,326 28,080 (0%) 3% 7% 3,929
Operating income 4,428 233 2,355 (47%) 911% 329
Operating margin 16% 1% 8%
Non-GAAP operating income 5,744 1,955 3,691 (36%) 89% 516
Non-GAAP operating margin 20% 7% 13%
1 Unless otherwise noted, all translations from RMB to U.S. dollars are made at a rate of RMB 7.1477 to US$1.00, the exchange rate in effect as of September 30, 2019 as set forth in the H.10 statistical release of the Board of Governors of the Federal Reserve System.
Translations are provided solely for the convenience of the reader. 2 Excluding revenue from divested businesses, which was approximately RMB1.0 billion for the three months ended September 30, 2018.
2 / 8
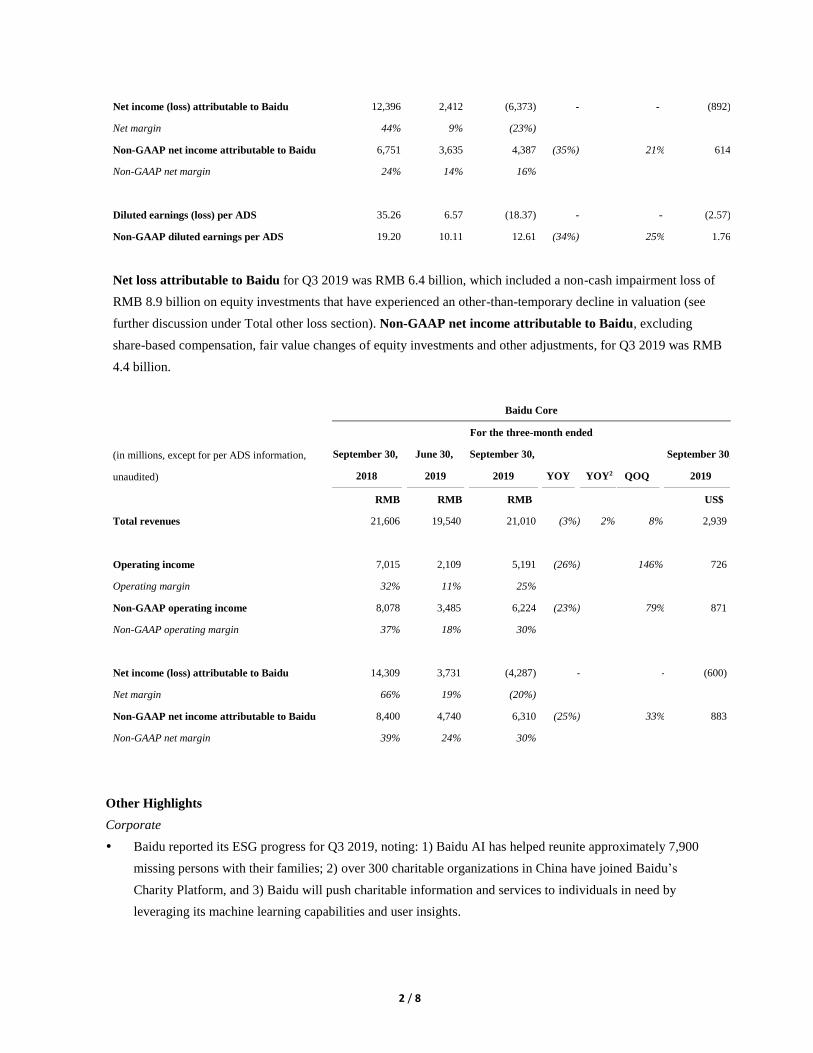
Net income (loss) attributable to Baidu 12,396 2,412 (6,373) - - (892)
Net margin 44% 9% (23%)
Non-GAAP net income attributable to Baidu 6,751 3,635 4,387 (35%) 21% 614
Non-GAAP net margin 24% 14% 16%
Diluted earnings (loss) per ADS 35.26 6.57 (18.37) - - (2.57)
Non-GAAP diluted earnings per ADS 19.20 10.11 12.61 (34%) 25% 1.76
Net loss attributable to Baidu for Q3 2019 was RMB 6.4 billion, which included a non-cash impairment loss of
RMB 8.9 billion on equity investments that have experienced an other-than-temporary decline in valuation (see
further discussion under Total other loss section). Non-GAAP net income attributable to Baidu, excluding
share-based compensation, fair value changes of equity investments and other adjustments, for Q3 2019 was RMB
4.4 billion.
Baidu Core
For the three-month ended
(in millions, except for per ADS information,
unaudited)
September 30,
2018
June 30,
2019
September 30,
2019 YOY YOY2 QOQ
September 30,
2019
RMB RMB RMB US$
Total revenues 21,606 19,540 21,010 (3%) 2% 8% 2,939
Operating income 7,015 2,109 5,191 (26%) 146% 726
Operating margin 32% 11% 25%
Non-GAAP operating income 8,078 3,485 6,224 (23%) 79% 871
Non-GAAP operating margin 37% 18% 30%
Net income (loss) attributable to Baidu 14,309 3,731 (4,287) - - (600)
Net margin 66% 19% (20%)
Non-GAAP net income attributable to Baidu 8,400 4,740 6,310 (25%) 33% 883
Non-GAAP net margin 39% 24% 30%
Other Highlights
Corporate
Baidu reported its ESG progress for Q3 2019, noting: 1) Baidu AI has helped reunite approximately 7,900
missing persons with their families; 2) over 300 charitable organizations in China have joined Baidu’s
Charity Platform, and 3) Baidu will push charitable information and services to individuals in need by
leveraging its machine learning capabilities and user insights.
3 / 8
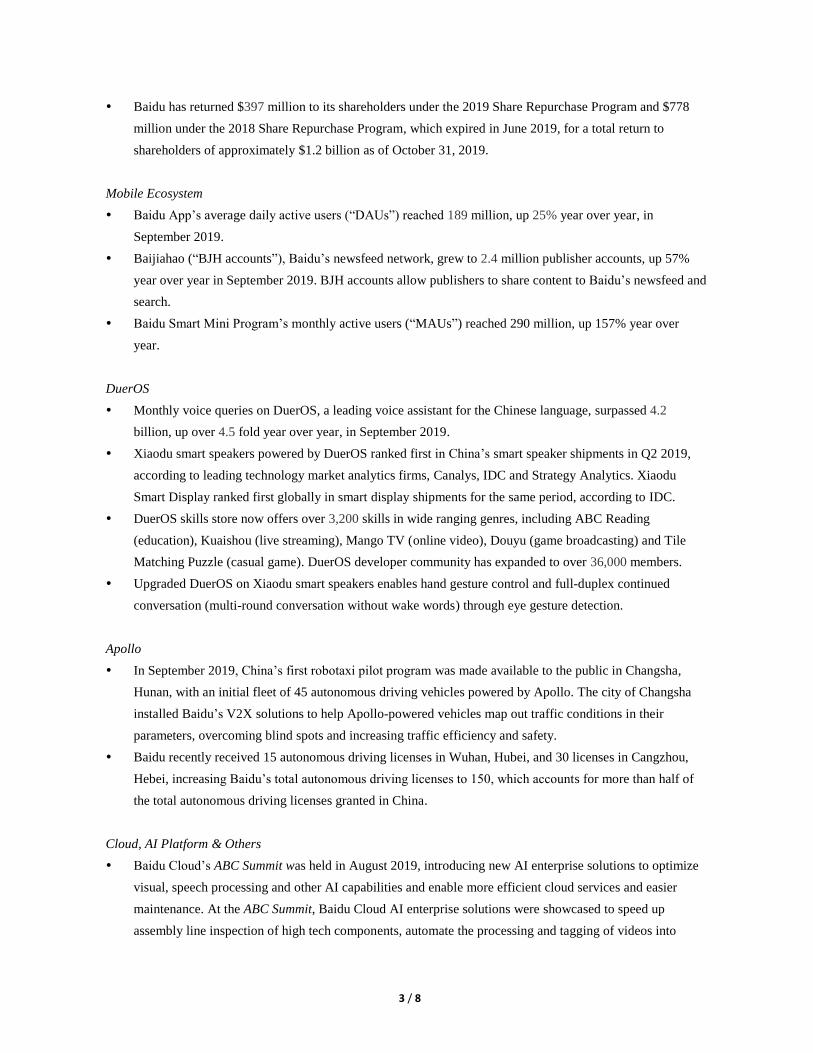
Baidu has returned $397 million to its shareholders under the 2019 Share Repurchase Program and $778
million under the 2018 Share Repurchase Program, which expired in June 2019, for a total return to
shareholders of approximately $1.2 billion as of October 31, 2019.
Mobile Ecosystem
Baidu App’s average daily active users (“DAUs”) reached 189 million, up 25% year over year, in
September 2019.
Baijiahao (“BJH accounts”), Baidu’s newsfeed network, grew to 2.4 million publisher accounts, up 57%
year over year in September 2019. BJH accounts allow publishers to share content to Baidu’s newsfeed and
search.
Baidu Smart Mini Program’s monthly active users (“MAUs”) reached 290 million, up 157% year over
year.
DuerOS
Monthly voice queries on DuerOS, a leading voice assistant for the Chinese language, surpassed 4.2
billion, up over 4.5 fold year over year, in September 2019.
Xiaodu smart speakers powered by DuerOS ranked first in China’s smart speaker shipments in Q2 2019,
according to leading technology market analytics firms, Canalys, IDC and Strategy Analytics. Xiaodu
Smart Display ranked first globally in smart display shipments for the same period, according to IDC.
DuerOS skills store now offers over 3,200 skills in wide ranging genres, including ABC Reading
(education), Kuaishou (live streaming), Mango TV (online video), Douyu (game broadcasting) and Tile
Matching Puzzle (casual game). DuerOS developer community has expanded to over 36,000 members.
Upgraded DuerOS on Xiaodu smart speakers enables hand gesture control and full-duplex continued
conversation (multi-round conversation without wake words) through eye gesture detection.
Apollo
In September 2019, China’s first robotaxi pilot program was made available to the public in Changsha,
Hunan, with an initial fleet of 45 autonomous driving vehicles powered by Apollo. The city of Changsha
installed Baidu’s V2X solutions to help Apollo-powered vehicles map out traffic conditions in their
parameters, overcoming blind spots and increasing traffic efficiency and safety.
Baidu recently received 15 autonomous driving licenses in Wuhan, Hubei, and 30 licenses in Cangzhou,
Hebei, increasing Baidu’s total autonomous driving licenses to 150, which accounts for more than half of
the total autonomous driving licenses granted in China.
Cloud, AI Platform & Others
Baidu Cloud’s ABC Summit was held in August 2019, introducing new AI enterprise solutions to optimize
visual, speech processing and other AI capabilities and enable more efficient cloud services and easier
maintenance. At the ABC Summit, Baidu Cloud AI enterprise solutions were showcased to speed up
assembly line inspection of high tech components, automate the processing and tagging of videos into
4 / 8
video clips, and improve customer service with “digital” employee in the mobile app of a local commercial
bank.
Baidu’s AI Open Platform is seeing strong adoption with over 1.5 million developer base in September,
more than doubling from last year. Through Baidu’s AI Open Platform on Baidu Cloud, developers can
utilize Baidu’s comprehensive AI capabilities, including speech recognition, natural language processing
and computer vision, as well as gain access to Baidu’s open-sourced deep learning platform PaddlePaddle.
In September 2019, Baidu Maps enhanced its voice feature, allowing users to customize Baidu Maps’ voice
with their own voice by recording 20 sentences. Over 280 million Baidu users have used Baidu Maps’
voice feature as of September 2019, doubling from the previous year.
iQIYI
iQIYI subscribers reached 105.8 million, up 31% year over year, in September 2019, further strengthening
iQIYI’s foundation to produce entertainment-based blockbuster originals.
Third Quarter 2019 Results
Total revenues reached RMB 28.1 billion ($3.93 billion), flat from last year and up 3% year over year,
excluding the impact of announced divestures2, and increasing 7% quarter over quarter. Online marketing
revenues were RMB20.4 billion ($2.86 billion), decreasing 9% year over year and increasing 6% quarter over
quarter. Other revenues were RMB 7.6 billion ($1.07 billion), increasing 34% year over year, driven mainly by
the strong growth in iQIYI membership, cloud services and smart devices.
Revenue from Baidu Core reached RMB 21.0 billion ($2.94 billion), decreasing 3% year over year, or
increasing 2% year over year, excluding the impact of announced divestures2, and increasing 8% quarter over
quarter. Revenue from iQIYI reached RMB 7.4 billion ($1.04 billion), up 7% year over year. iQIYI
membership revenue grew 30% year over year, offset by online advertising revenue declining 14% year over
year.
Content costs were RMB 7.0 billion ($985 million), increasing 4% year over year. iQIYI’s content costs
increased 3% year over year, which rose slower than iQIYI’s revenue growth.
Traffic acquisition costs were RMB 3.2 billion ($453 million), increasing 5% year over year, as a result of
increasing TAC prices and expansion into connected offline screens and other areas.
Bandwidth costs were RMB 2.0 billion ($284 million), increasing 20% year over year, mainly due to increasing
demand from newsfeed, video and cloud services.
Other cost of revenues, which includes depreciation, cost of goods sold, sales taxes and surcharges, share-based
compensation and other costs, was RMB 4.1 billion ($570 million), increasing 51% year over year, mainly due
to higher cost of goods sold and depreciation expense.
5 / 8
Selling, general and administrative expenses were RMB 4.7 billion ($652 million), decreasing 17% year over
year, primarily due to decreased investment in channel and promotional marketing.
Research and development expenses were RMB 4.7 billion ($656 million), increasing 20% year over year,
primarily due to an increase in personnel related expenses.
Operating income was RMB 2.4 billion ($329 million) and operating margin was 8%. Baidu Core operating
income was RMB 5.2 billion ($726 million), and Baidu Core operating margin was 25%.
Non-GAAP operating income was RMB 3.7 billion ($516 million), and non-GAAP operating margin was
13%. Non-GAAP Baidu Core operating income was RMB 6.2 billion ($871 million), and non-GAAP Baidu
Core operating margin was 30%.
Total other loss was RMB 9.5 billion ($1.33 billion), mainly due to loss from equity investments that have
experienced an other-than-temporary decline in valuation, compared to total other income of RMB 9.0 billion
for Q3 2018, which was mainly due to disposal gains from Du Xiaoman and Global DU businesses. In Q4 2015,
following a transaction where the Company exchanged shares of its majority-owned subsidiary Qunar for a
minority investment in Trip.com, the Company deconsolidated Qunar, recorded its investment in Trip.com at the
closing-date market value and recognized a non-cash accounting gain of RMB 24.4 billion. Since then, the
market value of Trip.com shares has declined, and the continued low market price has caused the Company to
recognize a non-cash impairment loss of RMB 8.9 billion in Q3 2019. In October 2019, the Company sold down
the holding in Trip.com, which decreased from approximately 19% of their outstanding shares to 12% of the
Trip.com’s outstanding shares.
Income tax expense was RMB 934 million ($131 million), which included a tax withholding for potential
dividend distribution to offshore entities, compared to RMB 2.1 billion in Q3 2018.
Net loss attributable to Baidu was RMB 6.4 billion ($ 892 million), and diluted losses per ADS was RMB 18
($2.57). Net loss attributable to Baidu Core was RMB 4.3 billion ($600 million). Non-GAAP net income
attributable to Baidu was RMB 4.4 billion ($614 million), and non-GAAP net margin was 16%. Non-GAAP
diluted earnings per ADS amounted to RMB 13 ($1.76). Non-GAAP net income attributable to Baidu Core
was RMB 6.3 billion ($883 million), and non-GAAP net margin for Baidu Core was 30%.
Adjusted EBITDA was RMB 5.1 billion ($716 million) and adjusted EBITDA margin was 18%. Adjusted
EBITDA to Baidu Core was RMB 7.5 billion ($1.05 billion) and adjusted EBITDA margin for Baidu Core
was 36%.
6 / 8
As of September 30, 2019, cash, cash equivalents, restricted cash and short-term investments were RMB
137.4 billion ($19.22 billion), and cash, cash equivalents, restricted cash and short-term investments
excluding iQIYI were RMB 123.5 billion ($17.27 billion). Free cash flow was RMB 7.6 billion ($1.06 billion).
Free cash flow excluding iQIYI was RMB 7.5 billion ($1.05 billion).
Financial Guidance
For the fourth quarter of 2019, Baidu expects revenues to be between RMB 27.1 billion ($3.78 billion) and RMB
28.7 billion ($4.02 billion), representing -1% to 6% increase year over year, which assumes that Baidu Core
revenue will grow between 0% to 6% year over year. This forecast reflects Baidu’s current and preliminary
view, which is subject to substantial uncertainty.
Conference Call Information
Baidu's management will hold an earnings conference call at 8:15 PM on November 6, 2019, U.S. Eastern Time
(9:15 AM on November 7, 2019, Beijing/Hong Kong Time). Dial-in details for the earnings conference call are
as follows:
International: +65 67135090
China 4006208038
US: +1 8456750437
UK: +44 2036214779
Hong Kong: +852 30186771
Passcode for all regions: 6438309
A replay of the conference call may be accessed by phone at the following number until November 14, 2019:
International: +61 2 8199 0299
Passcode: 6438309
Additionally, a live and archived webcast of this conference call will be available at http://ir.baidu.com.
About Baidu
Baidu, Inc. is the leading Chinese language Internet search provider. Baidu aims to make the complicated world
simpler through technology. Baidu's ADSs trade on the NASDAQ Global Select Market under the symbol
"BIDU". Currently, ten ADSs represent one Class A ordinary share.
Contacts
7 / 8
Investors Relations, Baidu, Inc.
Tel: +86-10-5992-8888
Email: [email protected]
Safe Harbor Statement
This announcement contains forward-looking statements. These statements are made under the "safe harbor"
provisions of the U.S. Private Securities Litigation Reform Act of 1995. These forward-looking statements can
be identified by terminology such as "will," "expects," "anticipates," "future," "intends," "plans," "believes,"
"estimates," "confident" and similar statements. Among other things, the outlook for the fourth quarter of 2019,
quotations from management in this announcement, as well as Baidu's and other parties' strategic and
operational plans, contain forward-looking statements. Baidu may also make written or oral forward-looking
statements in its periodic reports to the U.S. Securities and Exchange Commission, in its annual report to
shareholders, in press releases and other written materials and in oral statements made by its officers, directors
or employees to third parties. Statements that are not historical facts, including but not limited to statements
about Baidu's beliefs and expectations, are forward-looking statements. Forward-looking statements involve
inherent risks and uncertainties. A number of factors could cause actual results to differ materially from those
contained in any forward-looking statement, including but not limited to the following: Baidu’s growth
strategies; its future business development, including development of new products and services; its ability to
attract and retain users and customers; competition in the Chinese Internet search and newsfeed market;
competition for online marketing customers; changes in the Company’s revenues and certain cost or expense
items as a percentage of its revenues; the outcome of ongoing, or any future, litigation or arbitration, including
those relating to intellectual property rights; the expected growth of the Chinese-language Internet search and
newsfeed market and the number of Internet and broadband users in China; Chinese governmental policies
relating to the Internet and Internet search providers, and general economic conditions in China and elsewhere.
Further information regarding these and other risks is included in the Company’s annual report on Form 20-F
and other documents filed with the Securities and Exchange Commission. Baidu does not undertake any
obligation to update any forward-looking statement, except as required under applicable law. All information
provided in this press release and in the attachments is as of the date of the press release, and Baidu undertakes
no duty to update such information, except as required under applicable law.
Non-GAAP Financial Measures
To supplement Baidu’s consolidated financial results presented in accordance with GAAP, Baidu uses the
following non-GAAP financial measures: non-GAAP operating income (loss), non-GAAP operating margin,
non-GAAP net income (loss) attributable to Baidu, non-GAAP net margin, non-GAAP diluted earnings per
ADS, adjusted EBITDA, adjusted EBITDA margin and free cash flow. The presentation of these non-GAAP
financial measures is not intended to be considered in isolation or as a substitute for the financial information
prepared and presented in accordance with GAAP.
8 / 8
Baidu believes that these non-GAAP financial measures provide meaningful supplemental information regarding
its performance and liquidity by excluding certain items that may not be indicative of its recurring core business
operating results, such as operating performance excluding not only non-cash charges, but also other items that
are infrequent or unusual in nature. The Company believes that both management and investors benefit from
referring to these non-GAAP financial measures in assessing its performance and when planning and forecasting
future periods. These non-GAAP financial measures also facilitate management’s internal comparisons to
Baidu’s historical performance and liquidity. The Company believes these non-GAAP financial measures are
useful to investors in allowing for greater transparency with respect to supplemental information used by
management in its financial and operational decision making. A limitation of using these non-GAAP financial
measures is that these non-GAAP measures exclude certain items that have been and will continue to be for the
foreseeable future a significant component in the Company’s results of operations. These non-GAAP financial
measures presented here may not be comparable to similarly titled measures presented by other companies.
Other companies may calculate similarly titled measures differently, limiting their usefulness as comparative
measures to the Company’s data.
Non-GAAP operating income represents operating income excluding share-based compensation expenses and
amortization of intangible assets resulting from business combinations.
Non-GAAP net income attributable to Baidu represents net income attributable to Baidu excluding share-based
compensation expenses, amortization of intangible assets resulting from business combinations, disposal gain or
loss, impairment of long-term investments, fair value change of long-term investments, adjusted for related
income tax effects. Baidu’s share of equity method investments for these non-GAAP reconciling items,
amortization of intangible assets not on the investees’ books, accretion of their redeemable noncontrolling
interests, and the gain or loss associated with the issuance of shares by the investees at a price higher or lower
than the carrying value per shares, adjusted for related income tax effects, are also excluded.
Non-GAAP diluted earnings per ADS represents diluted earnings per ADS calculated by dividing non-GAAP
net income attributable to Baidu, which is adjusted for accretion for the redeemable noncontrolling interests, by
the weighted average number of ordinary shares expressed in ADS. Adjusted EBITDA represents operating
income excluding depreciation, amortization of intangible assets resulting from business combinations, and
share-based compensation expenses. Free cash flow represents net cash provided by operating activities less
capital expenditures.
For more information on non-GAAP financial measures, please see the tables captioned “Reconciliations of non-
GAAP financial measures to the nearest comparable GAAP measures.”
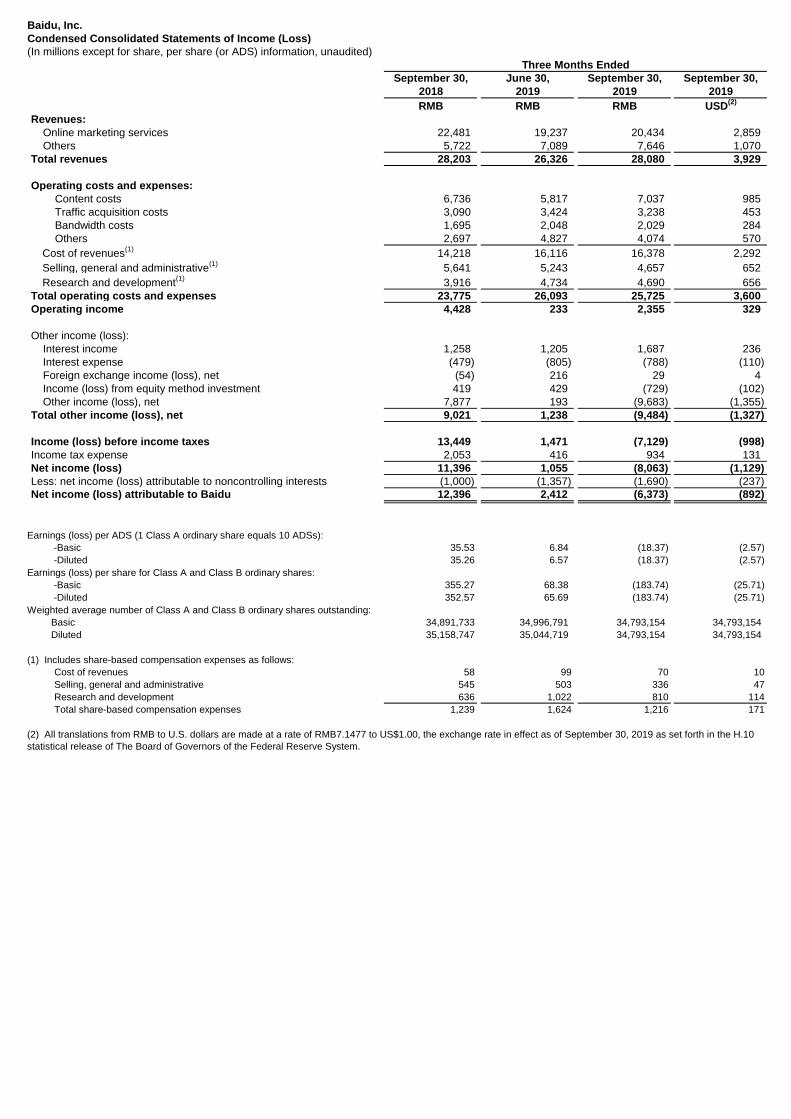
Baidu, Inc.
Condensed Consolidated Statements of Income (Loss)
(In millions except for share, per share (or ADS) information, unaudited)
September 30, June 30, September 30, September 30,
2018 2019 2019 2019
RMB RMB RMB USD(2)
Revenues:
Online marketing services 22,481 19,237 20,434 2,859
Others 5,722 7,089 7,646 1,070
Total revenues 28,203 26,326 28,080 3,929
Operating costs and expenses:
Content costs 6,736 5,817 7,037 985
Traffic acquisition costs 3,090 3,424 3,238 453
Bandwidth costs 1,695 2,048 2,029 284
Others 2,697 4,827 4,074 570
Cost of revenues(1)
14,218 16,116 16,378 2,292
Selling, general and administrative(1)
5,641 5,243 4,657 652
Research and development(1)
3,916 4,734 4,690 656
Total operating costs and expenses 23,775 26,093 25,725 3,600
Operating income 4,428 233 2,355 329
Other income (loss):
Interest income 1,258 1,205 1,687 236
Interest expense (479) (805) (788) (110)
Foreign exchange income (loss), net (54) 216 29 4
Income (loss) from equity method investment 419 429 (729) (102)
Other income (loss), net 7,877 193 (9,683) (1,355)
Total other income (loss), net 9,021 1,238 (9,484) (1,327)
Income (loss) before income taxes 13,449 1,471 (7,129) (998)
Income tax expense 2,053 416 934 131
Net income (loss) 11,396 1,055 (8,063) (1,129)
Less: net income (loss) attributable to noncontrolling interests (1,000) (1,357) (1,690) (237)
Net income (loss) attributable to Baidu 12,396 2,412 (6,373) (892)
Earnings (loss) per ADS (1 Class A ordinary share equals 10 ADSs):
-Basic 35.53 6.84 (18.37) (2.57)
-Diluted 35.26 6.57 (18.37) (2.57)
Earnings (loss) per share for Class A and Class B ordinary shares:
-Basic 355.27 68.38 (183.74) (25.71)
-Diluted 352.57 65.69 (183.74) (25.71)
Weighted average number of Class A and Class B ordinary shares outstanding:
Basic 34,891,733 34,996,791 34,793,154 34,793,154
Diluted 35,158,747 35,044,719 34,793,154 34,793,154
(1) Includes share-based compensation expenses as follows:
Cost of revenues 58 99 70 10
Selling, general and administrative 545 503 336 47
Research and development 636 1,022 810 114
Total share-based compensation expenses 1,239 1,624 1,216 171
Three Months Ended
(2) All translations from RMB to U.S. dollars are made at a rate of RMB7.1477 to US$1.00, the exchange rate in effect as of September 30, 2019 as set forth in the H.10
statistical release of The Board of Governors of the Federal Reserve System.
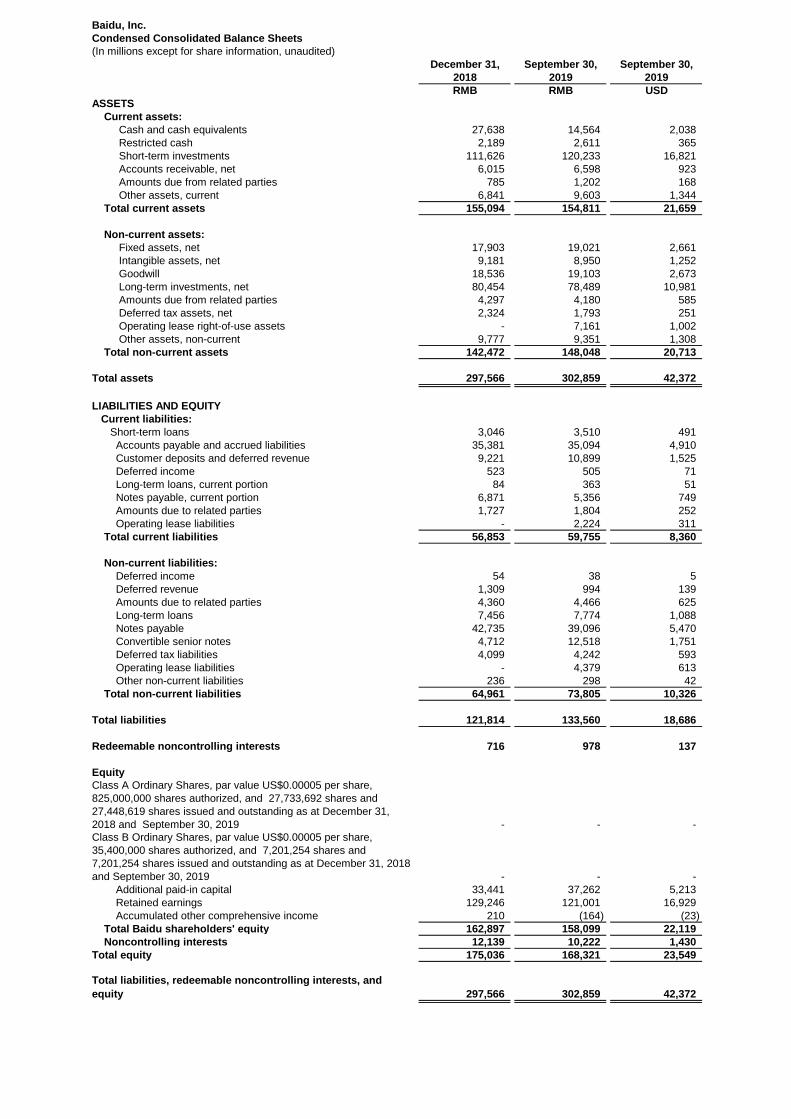
Baidu, Inc.
Condensed Consolidated Balance Sheets
(In millions except for share information, unaudited)
December 31, September 30, September 30,
2018 2019 2019
RMB RMB USD
ASSETS
Current assets:
Cash and cash equivalents 27,638 14,564 2,038
Restricted cash 2,189 2,611 365
Short-term investments 111,626 120,233 16,821
Accounts receivable, net 6,015 6,598 923
Amounts due from related parties 785 1,202 168
Other assets, current 6,841 9,603 1,344
Total current assets 155,094 154,811 21,659
Non-current assets:
Fixed assets, net 17,903 19,021 2,661
Intangible assets, net 9,181 8,950 1,252
Goodwill 18,536 19,103 2,673
Long-term investments, net 80,454 78,489 10,981
Amounts due from related parties 4,297 4,180 585
Deferred tax assets, net 2,324 1,793 251
Operating lease right-of-use assets - 7,161 1,002
Other assets, non-current 9,777 9,351 1,308
Total non-current assets 142,472 148,048 20,713
Total assets 297,566 302,859 42,372
LIABILITIES AND EQUITY
Current liabilities:
Short-term loans 3,046 3,510 491
Accounts payable and accrued liabilities 35,381 35,094 4,910
Customer deposits and deferred revenue 9,221 10,899 1,525
Deferred income 523 505 71
Long-term loans, current portion 84 363 51
Notes payable, current portion 6,871 5,356 749
Amounts due to related parties 1,727 1,804 252
Operating lease liabilities - 2,224 311
Total current liabilities 56,853 59,755 8,360
Non-current liabilities:
Deferred income 54 38 5
Deferred revenue 1,309 994 139
Amounts due to related parties 4,360 4,466 625
Long-term loans 7,456 7,774 1,088
Notes payable 42,735 39,096 5,470
Convertible senior notes 4,712 12,518 1,751
Deferred tax liabilities 4,099 4,242 593
Operating lease liabilities - 4,379 613
Other non-current liabilities 236 298 42
Total non-current liabilities 64,961 73,805 10,326
Total liabilities 121,814 133,560 18,686
Redeemable noncontrolling interests 716 978 137
Equity
Class A Ordinary Shares, par value US$0.00005 per share,
825,000,000 shares authorized, and 27,733,692 shares and
27,448,619 shares issued and outstanding as at December 31,
2018 and September 30, 2019 - - -
Class B Ordinary Shares, par value US$0.00005 per share,
35,400,000 shares authorized, and 7,201,254 shares and
7,201,254 shares issued and outstanding as at December 31, 2018
and September 30, 2019 - - -
Additional paid-in capital 33,441 37,262 5,213
Retained earnings 129,246 121,001 16,929
Accumulated other comprehensive income 210 (164) (23)
Total Baidu shareholders' equity 162,897 158,099 22,119
Noncontrolling interests 12,139 10,222 1,430
Total equity 175,036 168,321 23,549
Total liabilities, redeemable noncontrolling interests, and
equity 297,566 302,859 42,372
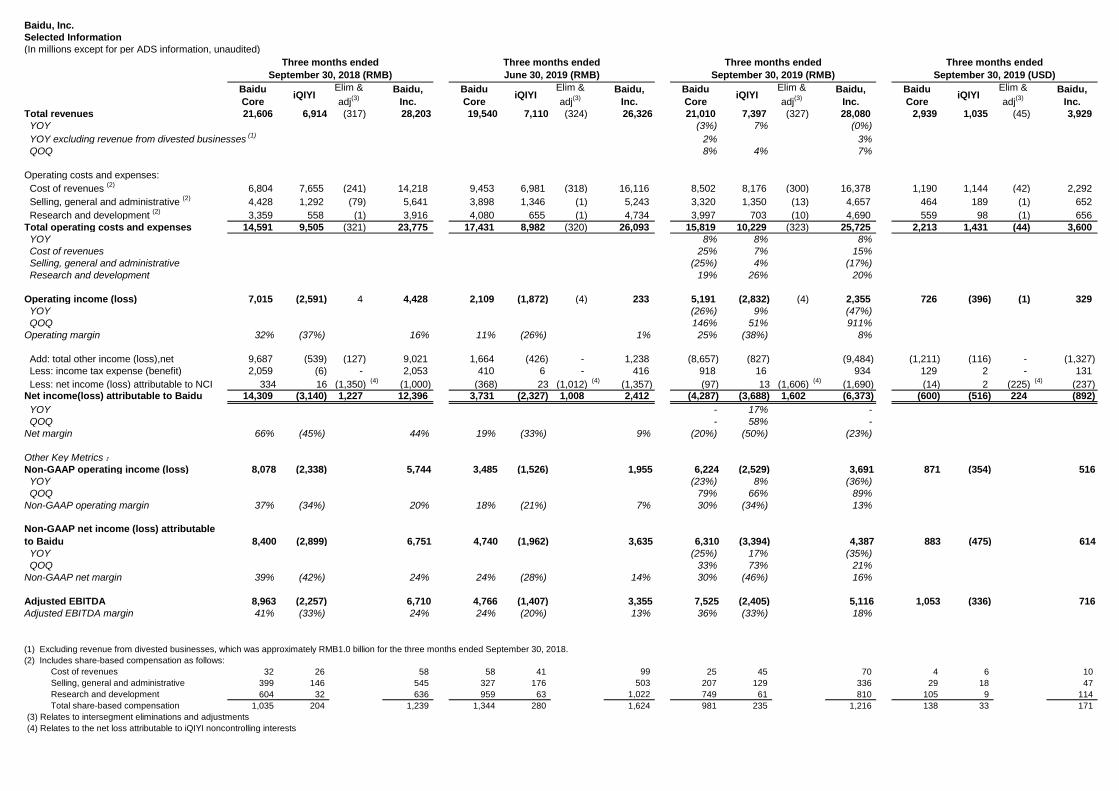
Baidu, Inc.
Selected Information
(In millions except for per ADS information, unaudited)
Baidu
CoreiQIYI
Elim &
adj(3)
Baidu,
Inc.
Baidu
CoreiQIYI
Elim &
adj(3)
Baidu,
Inc.
Baidu
CoreiQIYI
Elim &
adj(3)
Baidu,
Inc.
Baidu
CoreiQIYI
Elim &
adj(3)
Baidu,
Inc.
Total revenues 21,606 6,914 (317) 28,203 19,540 7,110 (324) 26,326 21,010 7,397 (327) 28,080 2,939 1,035 (45) 3,929
YOY (3%) 7% (0%)
YOY excluding revenue from divested businesses(1)
2% 3%
QOQ 8% 4% 7%
Operating costs and expenses:
Cost of revenues (2)
6,804 7,655 (241) 14,218 9,453 6,981 (318) 16,116 8,502 8,176 (300) 16,378 1,190 1,144 (42) 2,292
Selling, general and administrative (2)
4,428 1,292 (79) 5,641 3,898 1,346 (1) 5,243 3,320 1,350 (13) 4,657 464 189 (1) 652
Research and development (2)
3,359 558 (1) 3,916 4,080 655 (1) 4,734 3,997 703 (10) 4,690 559 98 (1) 656
Total operating costs and expenses 14,591 9,505 (321) 23,775 17,431 8,982 (320) 26,093 15,819 10,229 (323) 25,725 2,213 1,431 (44) 3,600
YOY 8% 8% 8%
Cost of revenues 25% 7% 15%
Selling, general and administrative (25%) 4% (17%)
Research and development 19% 26% 20%
Operating income (loss) 7,015 (2,591) 4 4,428 2,109 (1,872) (4) 233 5,191 (2,832) (4) 2,355 726 (396) (1) 329
YOY (26%) 9% (47%)
QOQ 146% 51% 911%
Operating margin 32% (37%) 16% 11% (26%) 1% 25% (38%) 8%
Add: total other income (loss),net 9,687 (539) (127) 9,021 1,664 (426) - 1,238 (8,657) (827) (9,484) (1,211) (116) - (1,327)
Less: income tax expense (benefit) 2,059 (6) - 2,053 410 6 - 416 918 16 934 129 2 - 131
Less: net income (loss) attributable to NCI 334 16 (1,350) (4)
(1,000) (368) 23 (1,012)(4)
(1,357) (97) 13 (1,606)(4)
(1,690) (14) 2 (225) (4)
(237) Net income(loss) attributable to Baidu 14,309 (3,140) 1,227 12,396 3,731 (2,327) 1,008 2,412 (4,287) (3,688) 1,602 (6,373) (600) (516) 224 (892)
YOY - 17% -
QOQ - 58% -
Net margin 66% (45%) 44% 19% (33%) 9% (20%) (50%) (23%)
Other Key Metrics:Non-GAAP operating income (loss) 8,078 (2,338) 5,744 3,485 (1,526) 1,955 6,224 (2,529) 3,691 871 (354) 516
YOY (23%) 8% (36%)
QOQ 79% 66% 89%
Non-GAAP operating margin 37% (34%) 20% 18% (21%) 7% 30% (34%) 13%
Non-GAAP net income (loss) attributable
to Baidu 8,400 (2,899) 6,751 4,740 (1,962) 3,635 6,310 (3,394) 4,387 883 (475) 614
YOY (25%) 17% (35%)
QOQ 33% 73% 21%
Non-GAAP net margin 39% (42%) 24% 24% (28%) 14% 30% (46%) 16%
Adjusted EBITDA 8,963 (2,257) 6,710 4,766 (1,407) 3,355 7,525 (2,405) 5,116 1,053 (336) 716
Adjusted EBITDA margin 41% (33%) 24% 24% (20%) 13% 36% (33%) 18%
(1) Excluding revenue from divested businesses, which was approximately RMB1.0 billion for the three months ended September 30, 2018.
(2) Includes share-based compensation as follows:
Cost of revenues 32 26 58 58 41 99 25 45 70 4 6 10
Selling, general and administrative 399 146 545 327 176 503 207 129 336 29 18 47
Research and development 604 32 636 959 63 1,022 749 61 810 105 9 114
Total share-based compensation 1,035 204 1,239 1,344 280 1,624 981 235 1,216 138 33 171
(3) Relates to intersegment eliminations and adjustments
(4) Relates to the net loss attributable to iQIYI noncontrolling interests
Three months ended
September 30, 2018 (RMB)
Three months ended
June 30, 2019 (RMB)
Three months ended
September 30, 2019 (RMB)
Three months ended
September 30, 2019 (USD)
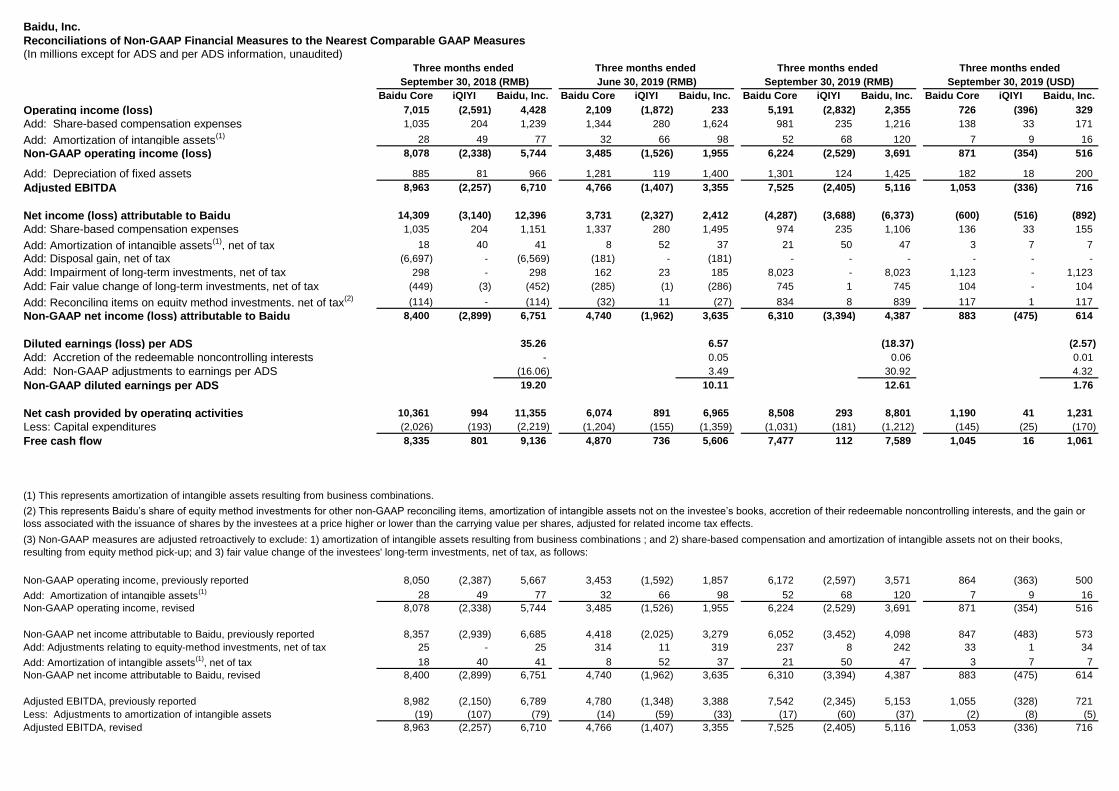
Baidu, Inc.
Reconciliations of Non-GAAP Financial Measures to the Nearest Comparable GAAP Measures
(In millions except for ADS and per ADS information, unaudited)
Baidu Core iQIYI Baidu, Inc. Baidu Core iQIYI Baidu, Inc. Baidu Core iQIYI Baidu, Inc. Baidu Core iQIYI Baidu, Inc.
Operating income (loss) 7,015 (2,591) 4,428 2,109 (1,872) 233 5,191 (2,832) 2,355 726 (396) 329
Add: Share-based compensation expenses 1,035 204 1,239 1,344 280 1,624 981 235 1,216 138 33 171
Add: Amortization of intangible assets(1) 28 49 77 32 66 98 52 68 120 7 9 16
Non-GAAP operating income (loss) 8,078 (2,338) 5,744 3,485 (1,526) 1,955 6,224 (2,529) 3,691 871 (354) 516
Add: Depreciation of fixed assets 885 81 966 1,281 119 1,400 1,301 124 1,425 182 18 200
Adjusted EBITDA 8,963 (2,257) 6,710 4,766 (1,407) 3,355 7,525 (2,405) 5,116 1,053 (336) 716
Net income (loss) attributable to Baidu 14,309 (3,140) 12,396 3,731 (2,327) 2,412 (4,287) (3,688) (6,373) (600) (516) (892)
Add: Share-based compensation expenses 1,035 204 1,151 1,337 280 1,495 974 235 1,106 136 33 155
Add: Amortization of intangible assets(1)
, net of tax 18 40 41 8 52 37 21 50 47 3 7 7
Add: Disposal gain, net of tax (6,697) - (6,569) (181) - (181) - - - - - -
Add: Impairment of long-term investments, net of tax 298 - 298 162 23 185 8,023 - 8,023 1,123 - 1,123
Add: Fair value change of long-term investments, net of tax (449) (3) (452) (285) (1) (286) 745 1 745 104 - 104
Add: Reconciling items on equity method investments, net of tax(2) (114) - (114) (32) 11 (27) 834 8 839 117 1 117
Non-GAAP net income (loss) attributable to Baidu 8,400 (2,899) 6,751 4,740 (1,962) 3,635 6,310 (3,394) 4,387 883 (475) 614
Diluted earnings (loss) per ADS 35.26 6.57 (18.37) (2.57)
Add: Accretion of the redeemable noncontrolling interests - 0.05 0.06 0.01
Add: Non-GAAP adjustments to earnings per ADS (16.06) 3.49 30.92 4.32
Non-GAAP diluted earnings per ADS 19.20 10.11 12.61 1.76
Net cash provided by operating activities 10,361 994 11,355 6,074 891 6,965 8,508 293 8,801 1,190 41 1,231
Less: Capital expenditures (2,026) (193) (2,219) (1,204) (155) (1,359) (1,031) (181) (1,212) (145) (25) (170)
Free cash flow 8,335 801 9,136 4,870 736 5,606 7,477 112 7,589 1,045 16 1,061
Non-GAAP operating income, previously reported 8,050 (2,387) 5,667 3,453 (1,592) 1,857 6,172 (2,597) 3,571 864 (363) 500
Add: Amortization of intangible assets(1) 28 49 77 32 66 98 52 68 120 7 9 16
Non-GAAP operating income, revised 8,078 (2,338) 5,744 3,485 (1,526) 1,955 6,224 (2,529) 3,691 871 (354) 516
Non-GAAP net income attributable to Baidu, previously reported 8,357 (2,939) 6,685 4,418 (2,025) 3,279 6,052 (3,452) 4,098 847 (483) 573
Add: Adjustments relating to equity-method investments, net of tax 25 - 25 314 11 319 237 8 242 33 1 34
Add: Amortization of intangible assets(1)
, net of tax 18 40 41 8 52 37 21 50 47 3 7 7
Non-GAAP net income attributable to Baidu, revised 8,400 (2,899) 6,751 4,740 (1,962) 3,635 6,310 (3,394) 4,387 883 (475) 614
Adjusted EBITDA, previously reported 8,982 (2,150) 6,789 4,780 (1,348) 3,388 7,542 (2,345) 5,153 1,055 (328) 721
Less: Adjustments to amortization of intangible assets (19) (107) (79) (14) (59) (33) (17) (60) (37) (2) (8) (5)
Adjusted EBITDA, revised 8,963 (2,257) 6,710 4,766 (1,407) 3,355 7,525 (2,405) 5,116 1,053 (336) 716
Three months ended Three months ended Three months ended Three months ended
(3) Non-GAAP measures are adjusted retroactively to exclude: 1) amortization of intangible assets resulting from business combinations ; and 2) share-based compensation and amortization of intangible assets not on their books,
resulting from equity method pick-up; and 3) fair value change of the investees' long-term investments, net of tax, as follows:
September 30, 2018 (RMB) June 30, 2019 (RMB) September 30, 2019 (USD)September 30, 2019 (RMB)
(2) This represents Baidu’s share of equity method investments for other non-GAAP reconciling items, amortization of intangible assets not on the investee’s books, accretion of their redeemable noncontrolling interests, and the gain or
loss associated with the issuance of shares by the investees at a price higher or lower than the carrying value per shares, adjusted for related income tax effects.
(1) This represents amortization of intangible assets resulting from business combinations.