Embed Size (px)
Citation preview

Balance.
2010 annual report
Building upon our heritage of innovation and quality, together we will elevate the everyday experience by making Hormel Foods the favorite part of any eating occasion.Mission: Hormel Foods is a leading branded food company with a focus on profitable growth. Inspired by our founder’s
charge to “originate, don’t imitate,” we market a balanced portfolio of highly differentiated quality products. We engage our
employees by creating an environment where careers are fostered, people make a difference and integrity is absolute.
To learn more about Our Way, visit www.HormelFoods.com
Printedonrecycledpaper.Pleaserecycle.This report was printed using soy-based inks. Cover and pages 1-12 contain 10% total recovered fiber/all post-consumer waste, FSC Certified Fiber. Pages 13-60 contain 30% total recovered fiber/all post-consumer waste, FSC Certified Fiber.
Hormel Foods Corporation 1 Hormel Place Austin, MN 55912-3680 10%

A balanced business modelThe balanced business model at Hormel Foods is a key driver for our annual growth. Through five segments — Grocery Products, Refrigerated Foods, Jennie-O Turkey Store, Specialty Foods and All Other — we insulate ourselves from ever-changing market forces. The diversity of these different businesses allow us to be successful in a variety of economic conditions.
Table of conTenTs
1 Letter to shareholders 4 At-a-glance 5 Balance 10 Corporate responsibility 12 Financial section
58 Shareholder information 60 Corporate officers 61 Board of directors
segment operating profit: 2005 - 2010
● Year-over-Year growth ● Year-over-Year decline
-8% 16%3% 6%13% 69%
-5%4% 5% 71%8% 78%
-17%
-27%
-2%
-5%
3%
5%
9% 7% 2%
5%
6%
7%
19% -4% 18%
17%
22%
22% 65%
11%
26%
14% 17%
33%
fY 2005
fY 2006
fY 2007
fY 2008
fY 2009
fY 2010
grocerY products
refrigerated foods
jennie-o turkeY store
specialtY foods
all other
total segment
Board of Directors
terrell k. crewsRetired as Executive Vice President,Chief Financial Officer and VegetableBusiness CEO of Monsanto Company in November 2009
Director since October 2007
jeffrey m. ettingerChairman of the Board,President and Chief Executive Officer
Director since May 2004
jody h. feragenExecutive Vice Presidentand Chief Financial Officer
Director since October 2007
susan i. marvinPresident,Marvin Windows and Doors
Director since July 2002
john l. morrisonManaging Director,Goldner Hawn Johnson &Morrison Incorporated
Director since November 2003
elsa a. murano, ph.d.Professor of Nutrition and Food Science,Texas A&M University
Director since September 2006
robert c. nakasoneChief Executive Officer,NAK Enterprises, LLC
Director since September 2006
susan k. nestegardPresident,Global Healthcare Sector,Ecolab Inc.
Director since October 2009
ronald d. pearsonChairman Emeritus,Hy-Vee, Inc.
Director since October 2007
dakota a. pippinsPresident and Chief Executive Officer,Pippins Strategies, LLC
Director since January 2001
hugh c. smith, m.d.Professor of Medicine,Mayo Clinic College of Medicine
Director since September 2006
john g. turnerChairman,Hillcrest Capital Partners
Director since March 2000
Front Row, from left: john turner, jeffrey ettinger, susan marvin
Back Row, from left: terrell crews, john morrison, ronald pearson, hugh smith, elsa murano, susan nestegard, dakota pippins, robert nakasone, jody feragen

Our Company also was recognized for other important measures of leadership, as demonstrated by some of the awards we received. In April 2010, we were named one of the 100 Most Trustworthy Companies by Forbes magazine. In September 2010, we were added to the Dow Jones Sustainability World Index. We also were recognized for the Packaging Line of the Year at our Progressive Process- ing (Dubuque, Iowa) facility by Packaging Machinery Technology magazine, R&D Team of the Year by Food Processing magazine and among the Best Places to Work for Recent Grads by Experience Inc.
Balanced model Our balanced business model was a key to our success this year. Strong results by our Refrigerated Foods and Jennie-O Turkey Store segments led the way, and Specialty Foods registered solid growth. Our deep supply chains in pork and turkey provided us with further balance in comparison to the outside purchase of raw materials by our other businesses, while our conservative financial philosophy provided balance for our innovative culture.
2010 operating highlights In our Grocery Products segment, continued growth of our Hormel® chili and Hormel® Mary Kitchen® hash helped sales overall. Margins were hindered, however, by higher raw material input costs, particularly pork costs for our SPAM® family of products. Progressive Processing started production in January and is now manufacturing both microwave and canned meat products. This facility was awarded LEED (Leadership in Energy and Environmental Design) Gold and is one of the first manufacturing plants to receive such an award. Heading into 2011, our MegaMex Foods joint venture will be strengthened by the recent acquisition of Don Miguel Foods, a leading provider of branded frozen and fresh authentic Mexican appetizers, snacks and hand-held items.
Our Refrigerated Foods segment delivered excellent earnings, aided by strong pork operating profits. Retail sales were solid, as we were successful in providing products that met a variety of consumer needs. These included Hormel® pepperoni and party trays and Hormel® Natural Choice® products, all of which posted notable sales growth during the year. Our recently acquired Country Crock® chilled side dishes are a nice complement to our Hormel® refrigerated entree and Lloyd’s® barbeque product lines.
Dear fellow shareholders:
Fiscal 2010 represented another excellent year for Hormel Foods, as we achieved a
sales increase of 10.5% and strong, double-digit earnings growth. It was an outstanding
effort by our team in a difficult consumer environment.
ShareholDerS letter
jeffrey m. ettinger
Chairman of the Board, President
and Chief Executive Officer
1
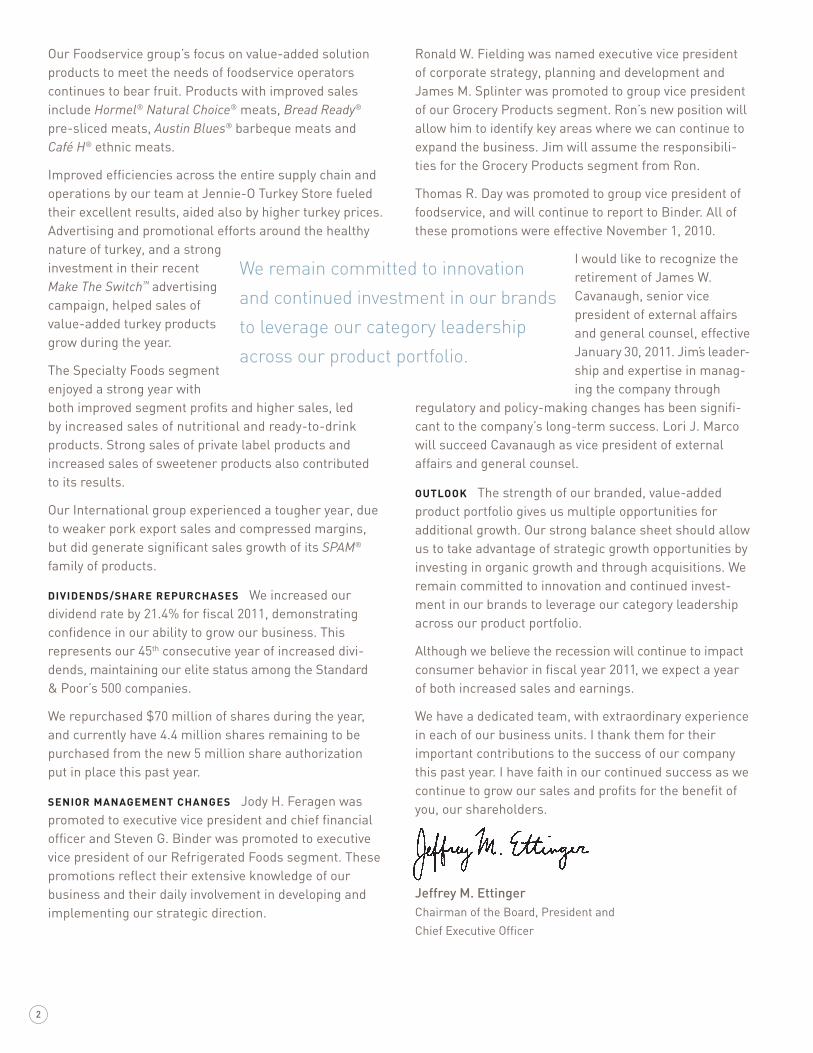
Our Foodservice group’s focus on value-added solution products to meet the needs of foodservice operators continues to bear fruit. Products with improved sales include Hormel® Natural Choice® meats, Bread Ready® pre-sliced meats, Austin Blues® barbeque meats and Café H® ethnic meats.
Improved efficiencies across the entire supply chain and operations by our team at Jennie-O Turkey Store fueled their excellent results, aided also by higher turkey prices. Advertising and promotional efforts around the healthy nature of turkey, and a strong investment in their recent Make The Switch™ advertising campaign, helped sales of value-added turkey products grow during the year.
The Specialty Foods segment enjoyed a strong year with both improved segment profits and higher sales, led by increased sales of nutritional and ready-to-drink products. Strong sales of private label products and increased sales of sweetener products also contributed to its results.
Our International group experienced a tougher year, due to weaker pork export sales and compressed margins, but did generate significant sales growth of its SPAM® family of products.
dividends/share repurchases We increased our dividend rate by 21.4% for fiscal 2011, demonstrating confidence in our ability to grow our business. This represents our 45th consecutive year of increased divi-dends, maintaining our elite status among the Standard & Poor’s 500 companies.
We repurchased $70 million of shares during the year, and currently have 4.4 million shares remaining to be purchased from the new 5 million share authorization put in place this past year.
senior management changes Jody H. Feragen was promoted to executive vice president and chief financial officer and Steven G. Binder was promoted to executive vice president of our Refrigerated Foods segment. These promotions reflect their extensive knowledge of our business and their daily involvement in developing and implementing our strategic direction.
Ronald W. Fielding was named executive vice president of corporate strategy, planning and development and James M. Splinter was promoted to group vice president of our Grocery Products segment. Ron’s new position will allow him to identify key areas where we can continue to expand the business. Jim will assume the responsibili-ties for the Grocery Products segment from Ron.
Thomas R. Day was promoted to group vice president of foodservice, and will continue to report to Binder. All of these promotions were effective November 1, 2010.
I would like to recognize the retirement of James W. Cavanaugh, senior vice president of external affairs and general counsel, effective January 30, 2011. Jim’s leader- ship and expertise in manag-ing the company through
regulatory and policy-making changes has been signifi-cant to the company’s long-term success. Lori J. Marco will succeed Cavanaugh as vice president of external affairs and general counsel.
outlook The strength of our branded, value-added product portfolio gives us multiple opportunities for additional growth. Our strong balance sheet should allow us to take advantage of strategic growth opportunities by investing in organic growth and through acquisitions. We remain committed to innovation and continued invest-ment in our brands to leverage our category leadership across our product portfolio.
Although we believe the recession will continue to impact consumer behavior in fiscal year 2011, we expect a year of both increased sales and earnings.
We have a dedicated team, with extraordinary experience in each of our business units. I thank them for their important contributions to the success of our company this past year. I have faith in our continued success as we continue to grow our sales and profits for the benefit of you, our shareholders.
Jeffrey M. ettingerChairman of the Board, President and
Chief Executive Officer
We remain committed to innovation
and continued investment in our brands
to leverage our category leadership
across our product portfolio.
2
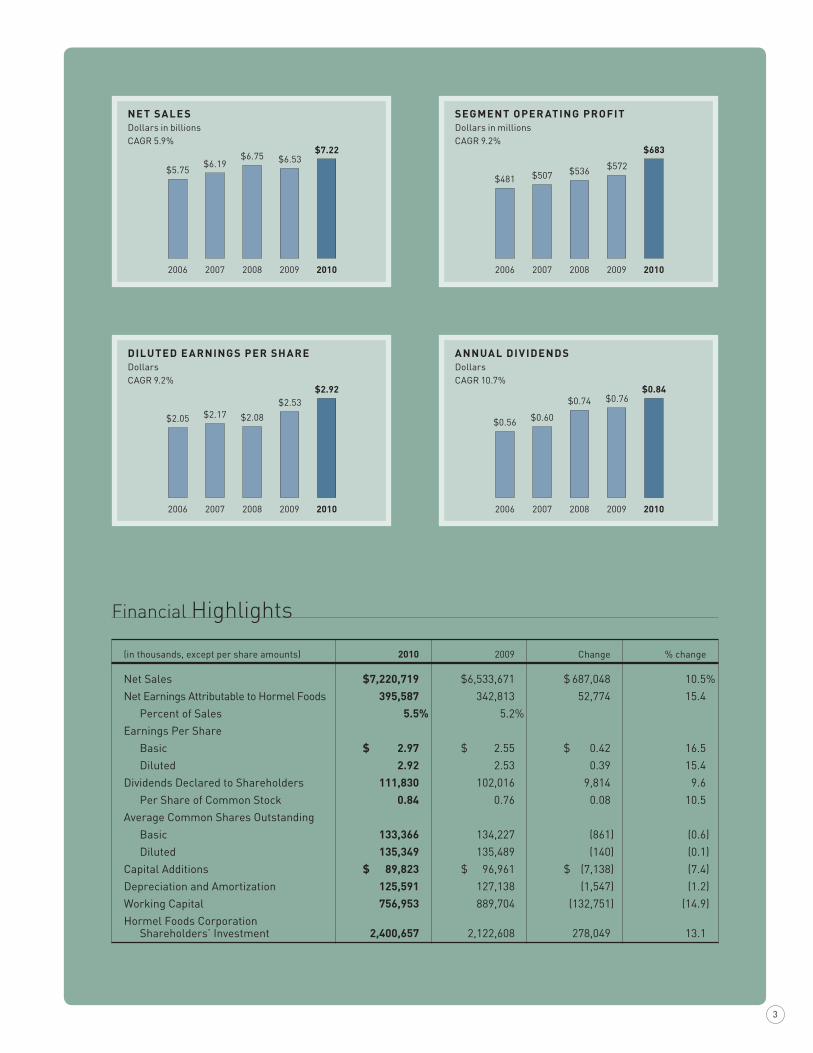
$536
2006 2007 2008 2009 2010
$683
$507 $481 $572
segment oper ating profitDollars in millionsCAGR 9.2%
$6.75
2006 2007 2008 2009 2010
$7.22$6.19
$5.75$6.53
net sale sDollars in billionsCAGR 5.9%
$2.08
2006 2007 2008 2009 2010
$2.92
$2.17$2.05
$2.53
diluted e arnings per shareDollarsCAGR 9.2%
$0.74
2006 2007 2008 2009 2010
$0.84
$0.60$0.56
$0.76
annual dividendsDollarsCAGR 10.7%
(in thousands, except per share amounts) 2010 2009 Change % change
Net Sales $7,220,719 $6,533,671 $ 687,048 10.5%
Net Earnings Attributable to Hormel Foods 395,587 342,813 52,774 15.4
Percent of Sales 5.5% 5.2%
Earnings Per Share
Basic $ 2.97 $ 2.55 $ 0.42 16.5
Diluted 2.92 2.53 0.39 15.4
Dividends Declared to Shareholders 111,830 102,016 9,814 9.6
Per Share of Common Stock 0.84 0.76 0.08 10.5
Average Common Shares Outstanding
Basic 133,366 134,227 (861) (0.6)
Diluted 135,349 135,489 (140) (0.1)
Capital Additions $ 89,823 $ 96,961 $ (7,138) (7.4)
Depreciation and Amortization 125,591 127,138 (1,547) (1.2)
Working Capital 756,953 889,704 (132,751) (14.9)
Hormel Foods Corporation Shareholders’ Investment 2,400,657 2,122,608 278,049 13.1
Financial Highlights
3
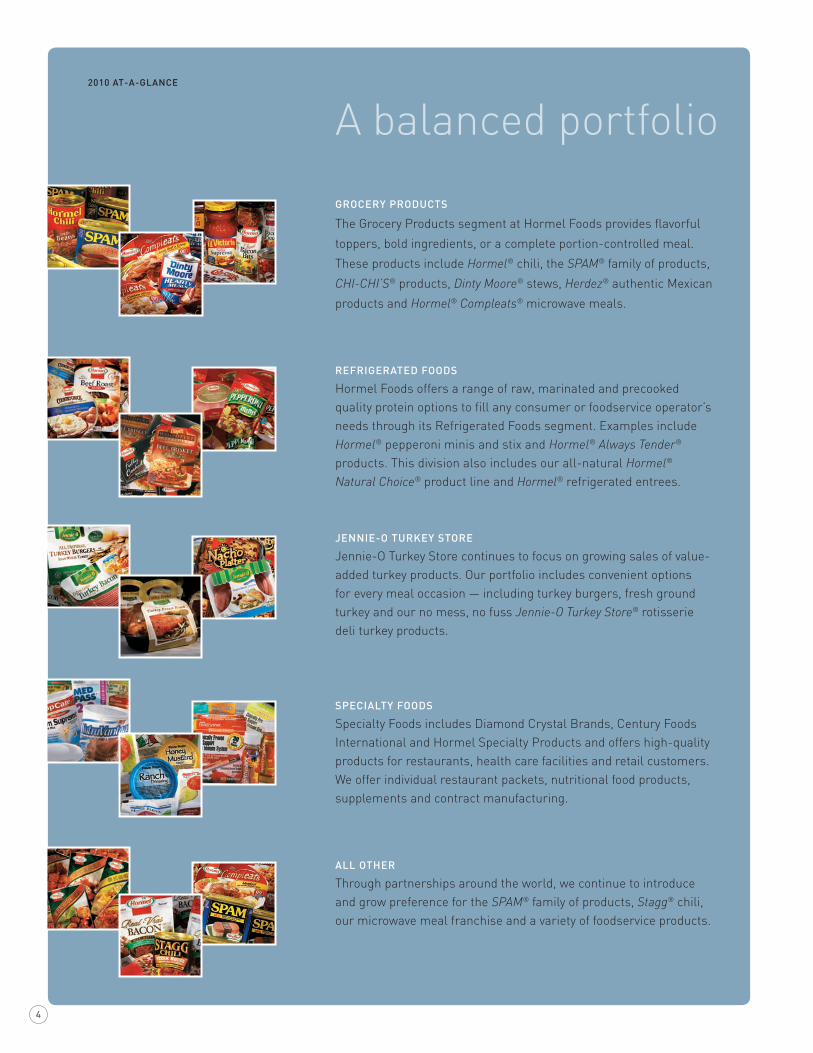
Grocery ProDuctS
The Grocery Products segment at Hormel Foods provides flavorful
toppers, bold ingredients, or a complete portion-controlled meal.
These products include Hormel® chili, the SPAM® family of products,
CHI-CHI’S® products, Dinty Moore® stews, Herdez® authentic Mexican
products and Hormel® Compleats® microwave meals.
refriGerateD fooDS
Hormel Foods offers a range of raw, marinated and precooked quality protein options to fill any consumer or foodservice operator’s needs through its Refrigerated Foods segment. Examples include Hormel® pepperoni minis and stix and Hormel® Always Tender® products. This division also includes our all-natural Hormel® Natural Choice® product line and Hormel® refrigerated entrees.
Jennie-o turkey Store
Jennie-O Turkey Store continues to focus on growing sales of value-added turkey products. Our portfolio includes convenient options for every meal occasion — including turkey burgers, fresh ground turkey and our no mess, no fuss Jennie-O Turkey Store® rotisserie deli turkey products.
SPecialty fooDS
Specialty Foods includes Diamond Crystal Brands, Century Foods International and Hormel Specialty Products and offers high-quality products for restaurants, health care facilities and retail customers. We offer individual restaurant packets, nutritional food products, supplements and contract manufacturing.
all other
Through partnerships around the world, we continue to introduce and grow preference for the SPAM® family of products, Stagg® chili, our microwave meal franchise and a variety of foodservice products.
A balanced portfolio2010 at-a-Glance
4
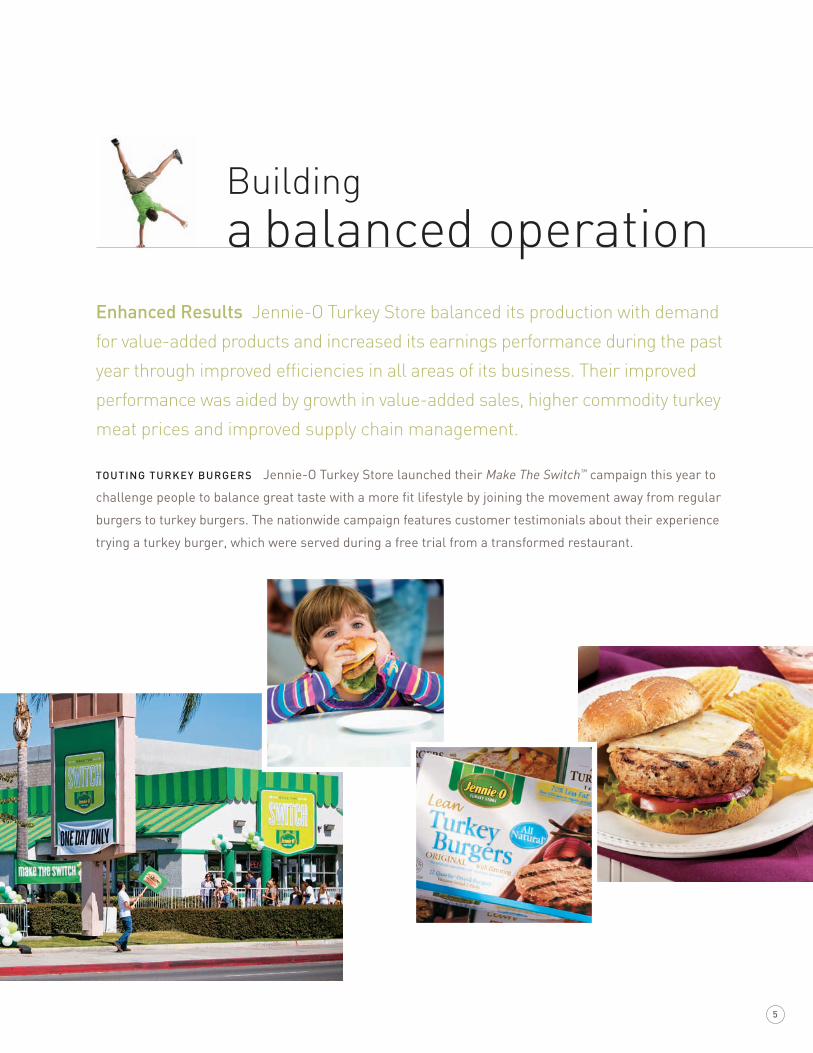
enhanced results Jennie-O Turkey Store balanced its production with demand
for value-added products and increased its earnings performance during the past
year through improved efficiencies in all areas of its business. Their improved
performance was aided by growth in value-added sales, higher commodity turkey
meat prices and improved supply chain management.
toutinG turkey BurGerS Jennie-O Turkey Store launched their Make The Switch™ campaign this year to
challenge people to balance great taste with a more fit lifestyle by joining the movement away from regular
burgers to turkey burgers. The nationwide campaign features customer testimonials about their experience
trying a turkey burger, which were served during a free trial from a transformed restaurant.
Building a balanced operation
5

While consumers are balancing their busy schedules and looking for ways
to make high-quality meals without the mess and fuss, we meet their needs
by offering our Hormel® refrigerated entrees, Hormel™ Country Crock® side
dishes and Hormel® Compleats® microwave meals.
Our leadership position in the convenience meals section of the grocery store has allowed us to bundle
our entrees with our recently acquired side dish items. The combination of these products gives consumers
a convenient hearty meal on their table in a matter of minutes. Available in a variety of potato- and pasta-
based side dishes, these products pair well with our new Lloyd’s Woodfire Barbeque™ products. These pork,
chicken and beef items are slow-smoked for hours using real hardwoods like hickory. After heating for two
minutes, they are ready for consumers to add their favorite sauce to create a taste that is all their own.
Life in balance
6

For special occasions, we offer a variety of products to satisfy any snacking
or party need. These items include Hormel® party trays, pepperoni minis and
pepperoni stix.
Hormel® pepperoni has been a household favorite for years, whether it is used as a topping for pizza
or a salad, and we continue to innovate within this category. In the past year, we launched Hormel® turkey
pepperoni minis, pepperoni stix and pepperoni stix and cheese. These items are popular, whether served
as an on-the-go snack or included within a family-favorite recipe. Including pepperoni with our Hormel®
party trays is another way we create a convenient way for consumers to share this product. The introduction
of our football-shaped party tray is an example of the creative designs we are developing to help celebrate
a variety of special occasions.
7
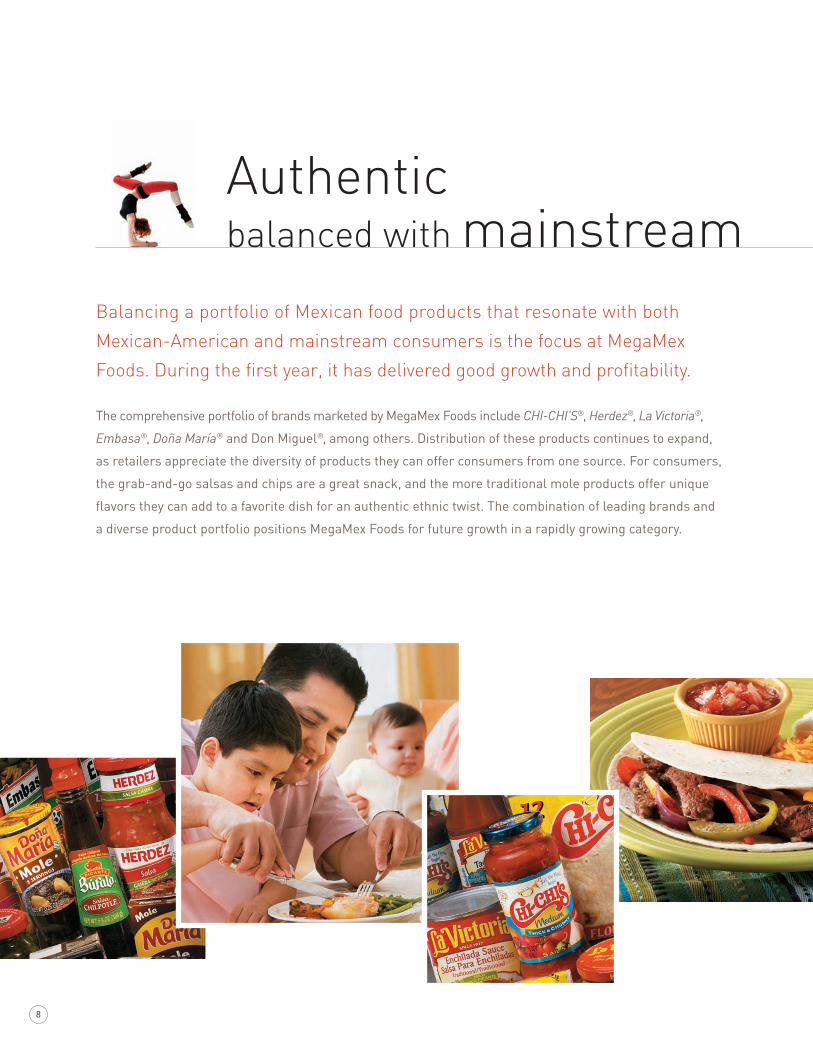
Balancing a portfolio of Mexican food products that resonate with both
Mexican-American and mainstream consumers is the focus at MegaMex
Foods. During the first year, it has delivered good growth and profitability.
The comprehensive portfolio of brands marketed by MegaMex Foods include CHI-CHI’S®, Herdez®, La Victoria®,
Embasa®, Doña María® and Don Miguel®, among others. Distribution of these products continues to expand,
as retailers appreciate the diversity of products they can offer consumers from one source. For consumers,
the grab-and-go salsas and chips are a great snack, and the more traditional mole products offer unique
flavors they can add to a favorite dish for an authentic ethnic twist. The combination of leading brands and
a diverse product portfolio positions MegaMex Foods for future growth in a rapidly growing category.
Authentic balanced with mainstream
8
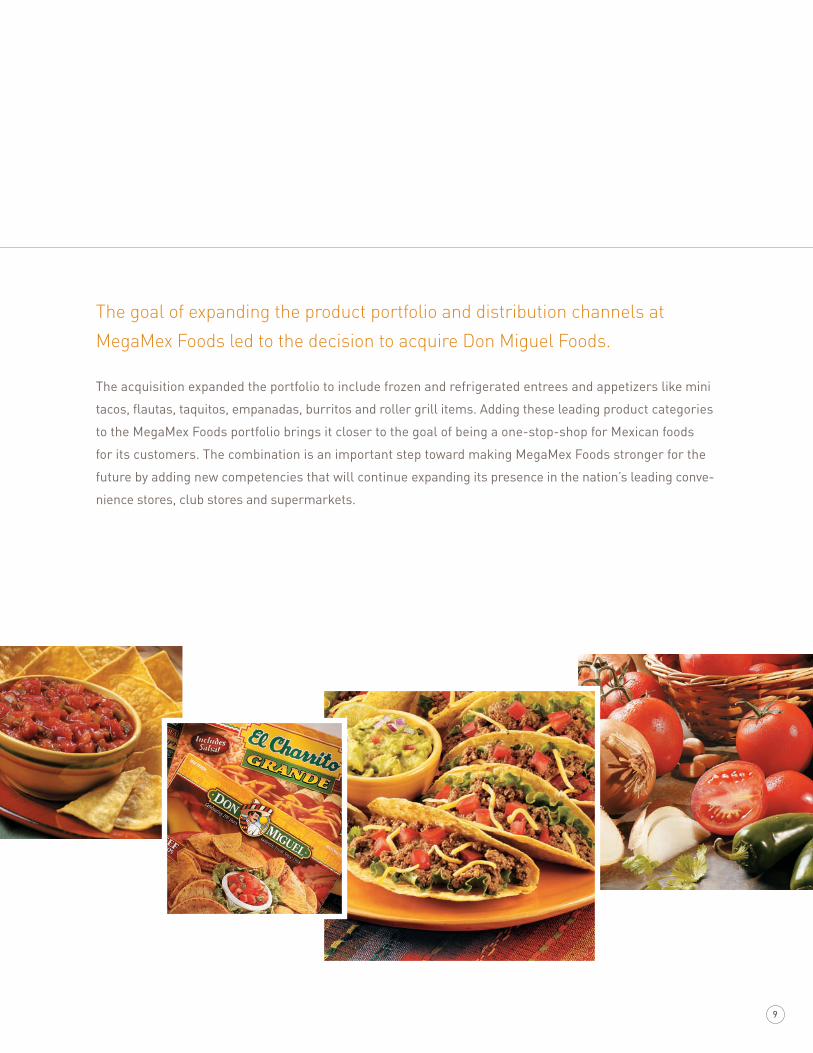
The goal of expanding the product portfolio and distribution channels at
MegaMex Foods led to the decision to acquire Don Miguel Foods.
The acquisition expanded the portfolio to include frozen and refrigerated entrees and appetizers like mini
tacos, flautas, taquitos, empanadas, burritos and roller grill items. Adding these leading product categories
to the MegaMex Foods portfolio brings it closer to the goal of being a one-stop-shop for Mexican foods
for its customers. The combination is an important step toward making MegaMex Foods stronger for the
future by adding new competencies that will continue expanding its presence in the nation’s leading conve-
nience stores, club stores and supermarkets.
9
Hormel Foods has a long-standing record of balancing success with respon-
sibility for all stakeholders, including shareholders, employees, customers
and consumers. To highlight our work, we have included examples related to
sustainability, environmental responsibility and philanthropy.
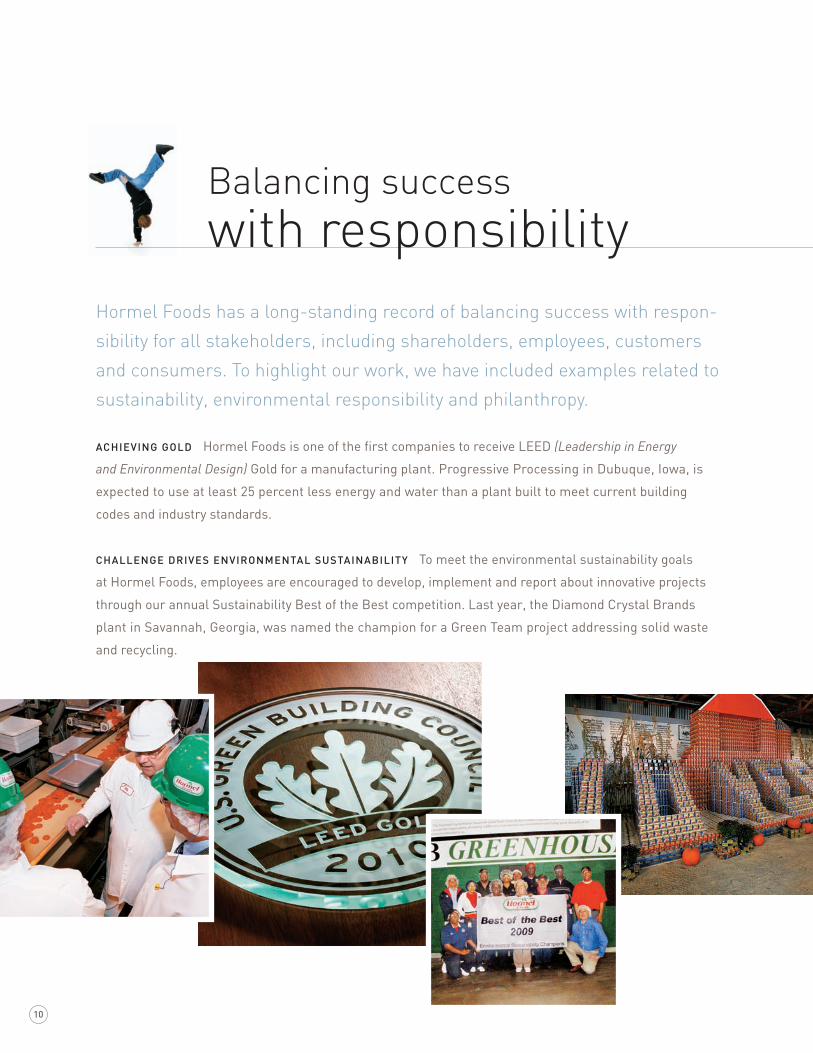
achievinG GolD Hormel Foods is one of the first companies to receive LEED (Leadership in Energy
and Environmental Design) Gold for a manufacturing plant. Progressive Processing in Dubuque, Iowa, is
expected to use at least 25 percent less energy and water than a plant built to meet current building
codes and industry standards.
challenGe DriveS environMental SuStainaBility To meet the environmental sustainability goals
at Hormel Foods, employees are encouraged to develop, implement and report about innovative projects
through our annual Sustainability Best of the Best competition. Last year, the Diamond Crystal Brands
plant in Savannah, Georgia, was named the champion for a Green Team project addressing solid waste
and recycling.
Balancing success with responsibility
10
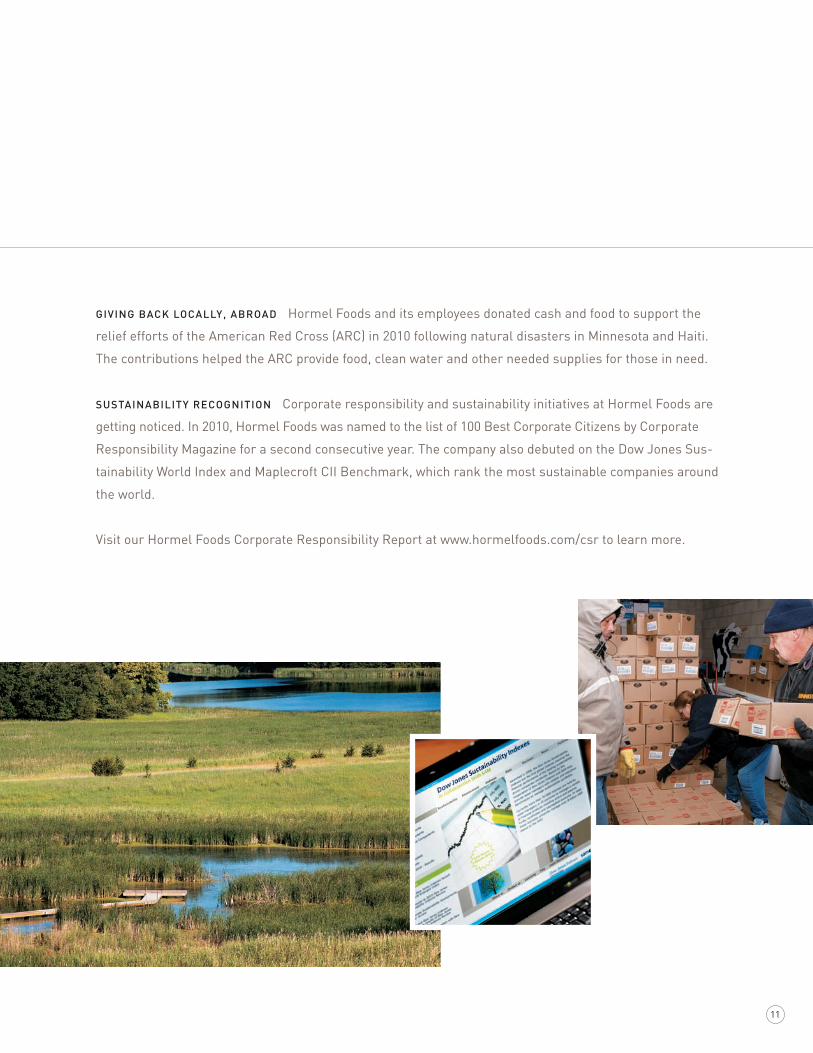
GivinG Back locally, aBroaD Hormel Foods and its employees donated cash and food to support the
relief efforts of the American Red Cross (ARC) in 2010 following natural disasters in Minnesota and Haiti.
The contributions helped the ARC provide food, clean water and other needed supplies for those in need.
SuStainaBility recoGnition Corporate responsibility and sustainability initiatives at Hormel Foods are
getting noticed. In 2010, Hormel Foods was named to the list of 100 Best Corporate Citizens by Corporate
Responsibility Magazine for a second consecutive year. The company also debuted on the Dow Jones Sus-
tainability World Index and Maplecroft CII Benchmark, which rank the most sustainable companies around
the world.
Visit our Hormel Foods Corporate Responsibility Report at www.hormelfoods.com/csr to learn more.
11
12
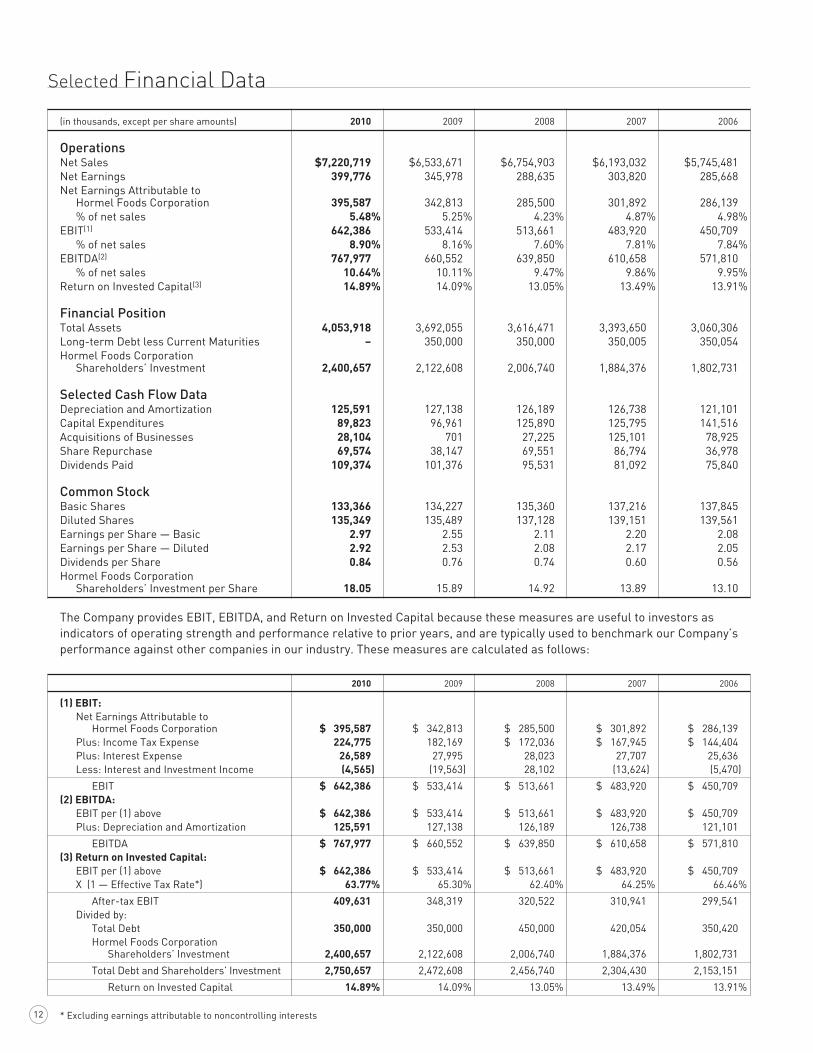
Selected Financial Data
(in thousands, except per share amounts) 2010 2009 2008 2007 2006
operationsNet Sales $7,220,719 $6,533,671 $6,754,903 $6,193,032 $5,745,481Net Earnings 399,776 345,978 288,635 303,820 285,668Net Earnings Attributable to Hormel Foods Corporation 395,587 342,813 285,500 301,892 286,139 % of net sales 5.48% 5.25% 4.23% 4.87% 4.98%EBIT(1) 642,386 533,414 513,661 483,920 450,709 % of net sales 8.90% 8.16% 7.60% 7.81% 7.84%EBITDA(2) 767,977 660,552 639,850 610,658 571,810 % of net sales 10.64% 10.11% 9.47% 9.86% 9.95%Return on Invested Capital(3) 14.89% 14.09% 13.05% 13.49% 13.91%
financial PositionTotal Assets 4,053,918 3,692,055 3,616,471 3,393,650 3,060,306Long-term Debt less Current Maturities – 350,000 350,000 350,005 350,054Hormel Foods Corporation Shareholders’ Investment 2,400,657 2,122,608 2,006,740 1,884,376 1,802,731
Selected cash flow DataDepreciation and Amortization 125,591 127,138 126,189 126,738 121,101Capital Expenditures 89,823 96,961 125,890 125,795 141,516Acquisitions of Businesses 28,104 701 27,225 125,101 78,925Share Repurchase 69,574 38,147 69,551 86,794 36,978Dividends Paid 109,374 101,376 95,531 81,092 75,840
common StockBasic Shares 133,366 134,227 135,360 137,216 137,845Diluted Shares 135,349 135,489 137,128 139,151 139,561Earnings per Share — Basic 2.97 2.55 2.11 2.20 2.08Earnings per Share — Diluted 2.92 2.53 2.08 2.17 2.05Dividends per Share 0.84 0.76 0.74 0.60 0.56Hormel Foods Corporation Shareholders’ Investment per Share 18.05 15.89 14.92 13.89 13.10
The Company provides EBIT, EBITDA, and Return on Invested Capital because these measures are useful to investors as indicators of operating strength and performance relative to prior years, and are typically used to benchmark our Company’s performance against other companies in our industry. These measures are calculated as follows:
2010 2009 2008 2007 2006
(1) eBit: Net Earnings Attributable to Hormel Foods Corporation $ 395,587 $ 342,813 $ 285,500 $ 301,892 $ 286,139 Plus: Income Tax Expense 224,775 182,169 $ 172,036 $ 167,945 $ 144,404 Plus: Interest Expense 26,589 27,995 28,023 27,707 25,636 Less: Interest and Investment Income (4,565) (19,563) 28,102 (13,624) (5,470)
EBIT $ 642,386 $ 533,414 $ 513,661 $ 483,920 $ 450,709(2) eBitda: EBIT per (1) above $ 642,386 $ 533,414 $ 513,661 $ 483,920 $ 450,709 Plus: Depreciation and Amortization 125,591 127,138 126,189 126,738 121,101
EBITDA $ 767,977 $ 660,552 $ 639,850 $ 610,658 $ 571,810(3) return on invested capital: EBIT per (1) above $ 642,386 $ 533,414 $ 513,661 $ 483,920 $ 450,709 X (1 — Effective Tax Rate*) 63.77% 65.30% 62.40% 64.25% 66.46%
After-tax EBIT 409,631 348,319 320,522 310,941 299,541 Divided by: Total Debt 350,000 350,000 450,000 420,054 350,420 Hormel Foods Corporation Shareholders’ Investment 2,400,657 2,122,608 2,006,740 1,884,376 1,802,731
Total Debt and Shareholders’ Investment 2,750,657 2,472,608 2,456,740 2,304,430 2,153,151
Return on Invested Capital 14.89% 14.09% 13.05% 13.49% 13.91%
* Excluding earnings attributable to noncontrolling interests
13
Executive OverviewFiscal 2010: Hormel Foods achieved record sales and earnings during fiscal 2010. Our focus on restoring top line growth drove our sales to over $7.2 billion, a 23 percent increase over last year, with all five segments contributing to the sales gains. Earnings for the year increased over 15 percent to $395.6 million. Both sales and earnings benefited from an additional week in 2010.
Despite continued economic uncertainty, our portfolio of branded, value-added products coupled with increased advertising spending resulted in our record sales. Sales were also augmented by the addition of new MegaMex joint venture products and sales of Country Crock® side dish items that were acquired in fiscal 2010. We also experienced higher commodity selling prices during the year. Our earnings ben-efited from our higher sales as well as operational efficiencies and historically high pork operating margins, which helped offset higher input costs and lower investment gains.
Our Jennie-O Turkey Store segment delivered spectacular earnings results, reflecting efficiencies throughout its sup-ply chain and plant operations, as well as strong commodity turkey meat prices and lower grain costs. Refrigerated Foods results were driven by strong pork operating margins, which more than offset softness in the retail and foodservice categories as a result of higher raw material costs. Specialty Foods had improved sales and segment profit results with all three operating segments contributing to the sales increase. Despite substantial headwinds in fiscal 2010 from higher raw material costs, our Grocery Products segment delivered year-over-year improved earnings on an adjusted basis.* Our International segment recorded double-digit sales growth, but higher export sales of our SPAM® family of products were unable to offset higher raw material costs, negatively impact-ing segment profits.
We generated strong cash flows which allowed us to repur-chase 1.7 million shares of common stock during fiscal 2010. We also announced a 21.4 percent increase in our annual dividend rate for fiscal 2011.
Fiscal 2011 Outlook: Our solid finish to fiscal 2010 provides good momentum as we start 2011. While we anticipate con-tinued economic uncertainty, we expect to deliver year-over-year improvements in both sales and earnings. We believe that our balanced portfolio of branded, value-added products allows us to meet the needs of our consumers by providing convenience and great taste as well as value. Our strong financial position should also enable us to take advantage of investments in our business, whether through internal expan-sion or through acquisitions.
* Grocery Products adjusted earnings for fiscal 2010 exclude a pretax charge of $9.7 million related to the closing of the Company’s Valley Fresh plant in Turlock, California.
Critical Accounting PoliciesThis discussion and analysis of financial condition and results of operations is based upon the consolidated financial statements of Hormel Foods Corporation (the Company), which have been prepared in accordance with U.S. generally accepted accounting principles (GAAP). The preparation of these financial statements requires the Company to make estimates and judgments that affect the reported amounts of assets, liabilities, revenues and expenses, and related disclo-sure of contingent assets and liabilities. The Company evalu-ates, on an ongoing basis, its estimates for reasonableness as changes occur in its business environment. The Company bases its estimates on experience, the use of independent third-party specialists, and various other assumptions that are believed to be reasonable under the circumstances, the results of which form the basis for making judgments about the carrying values of assets and liabilities that are not read-ily apparent from other sources. Actual results may differ materially from these estimates under different assumptions or conditions.
Critical accounting policies are defined as those that are reflective of significant judgments, estimates, and uncertain-ties, and potentially result in materially different results under different assumptions and conditions. The Company believes the following are its critical accounting policies:
Inventory Valuation: The Company values its pork inventories at the lower of cost or USDA market prices (primal values). When the carcasses are disassembled and transferred from primal processing to various manufacturing departments, the primal values, as adjusted by the Company for product specifications and further processing, become the basis for calculating inventory values. Turkey raw materials are repre-sented by the deboned meat quantities. The Company values these raw materials using a concept referred to as the “meat cost pool.” The meat cost pool is determined by combining the cost to grow turkeys with processing costs, less any net sales revenue from by-products created from the processing and not used in producing Company products. The Company has developed a series of ratios using historical data and cur-rent market conditions (which themselves involve estimates and judgment determinations by the Company) to allocate the meat cost pool to each meat component. Substantially all inventoriable expenses, meat, packaging, and supplies are valued by the average cost method.
Goodwill and Other Intangibles: The Company’s identifiable intangible assets are amortized over their useful life, unless the useful life is determined to be indefinite. The useful life of an identifiable intangible asset is based on an analysis of sev-eral factors including: contractual, regulatory, or legal obliga-tions, demand, competition, and industry trends. Goodwill and indefinite-lived intangible assets are not amortized, but are tested at least annually for impairment.
Management’s Discussion and Analysis of Financial Condition and Results of Operations
14
Intangible assets that are subject to amortization are evalu-ated for impairment using a process similar to that used to evaluate elements of long-lived assets. The remaining useful life of these assets is also evaluated at least annually during this process.
Accrued Promotional Expenses: Accrued promotional expenses are unpaid liabilities for customer promotional pro-grams in process or completed as of the end of the fiscal year. Promotional contractual accruals are based on agreements with customers for defined performance. The liability relating to these agreements is based on a review of the outstanding contracts on which performance has taken place but for which the promotional payments relating to such contracts remain unpaid as of the end of the fiscal year. The level of customer performance is a significant estimate used to determine these liabilities.
Employee Benefit Plans: The Company incurs expenses relat-ing to employee benefits, such as noncontributory defined benefit pension plans and post-retirement health care ben-efits. In accounting for these employment costs, management must make a variety of assumptions and estimates including mortality rates, discount rates, overall Company compensa-tion increases, expected return on plan assets, and health care cost trend rates. The Company considers historical data as well as current facts and circumstances when determining these estimates. The Company uses third-party specialists to assist management in the determination of these estimates and the calculation of certain employee benefit expenses.
Income Taxes: The Company records income taxes in accor-dance with the liability method of accounting. Deferred taxes are recognized for the estimated taxes ultimately payable or recoverable based on enacted tax law. Changes in enacted tax rates are reflected in the tax provision as they occur.
The Company computes its provision for income taxes based on the statutory tax rates and tax planning opportunities available to it in the various jurisdictions in which it operates. Significant judgment is required in evaluating the Company’s tax positions and determining its annual tax provision. While the Company considers all of its tax positions fully support-able, the Company is occasionally challenged by various tax authorities regarding the amount of taxes due. The Company recognizes a tax position in its financial statements when it is more likely than not that the position will be sustained upon examination, based on the technical merits of the posi-tion. That position is then measured at the largest amount of benefit that is greater than 50 percent likely of being realized upon ultimate settlement. A change in judgment related to the expected ultimate resolution of uncertain tax positions will be recognized in earnings in the quarter of such change.
The goodwill impairment test is a two-step process per-formed at the reporting unit level. The Company’s reporting units represent operating segments (aggregations of business units that have similar economic characteristics and share the same production facilities, raw materials, and labor force). First, the fair value of each reporting unit is compared to its corresponding carrying value, including goodwill. The fair value of each reporting unit is estimated using discounted cash flow valuations. The assumptions used in the estimate of fair value, including future growth rates, terminal values, and discount rates, require significant judgment. The estimates and assumptions used consider historical performance and are consistent with the assumptions used in determining future profit plans for each reporting unit, which are approved by the Company’s Board of Directors. The Company reviews product growth patterns, market share information, industry trends, peer group statistics, changes in distribution chan-nels, and economic indicators in determining the estimates and assumptions used to develop cash flow and profit plan assumptions. Additionally, the Company performs sensitivity testing of the profit plan assumptions and discount rate to assess the impact on the fair value for each reporting unit under various circumstances.
If the first step results in the carrying value exceeding the fair value of any reporting unit, then a second step must be completed in order to determine the amount of goodwill impairment that should be recorded. In the second step, the implied fair value of the reporting unit’s goodwill is deter-mined by allocating the reporting unit’s fair value to all of its assets and liabilities other than goodwill in a manner similar to a purchase price allocation. The resulting implied fair value of the goodwill that results from the application of this second step is then compared to the carrying amount of the goodwill and an impairment charge is recorded for the difference. Performance of the second step was not required for any of the Company’s reporting units for fiscal 2010, and no goodwill impairment charges were recorded.
Impairment testing for indefinite-lived intangible assets also compares the fair value and carrying value of the intangible asset. The fair value of indefinite-lived intangible assets is primarily determined on the basis of estimated discounted value, using the relief from royalty method. The assumptions used in the estimate of fair value, including future sales projections and discount rates, require significant judgment. The Company considers historical performance and various Company and industry factors when determining the assump-tions to use in estimating the fair value. If the carrying value exceeds fair value, the indefinite-lived intangible asset is considered impaired and an impairment charge is recorded for the difference. No material impairment charges were recorded for indefinite-lived intangible assets for fiscal 2010.

15
FISCAL YEARS 2010 AND 2009:
Consolidated Results
Net Earnings: Net earnings attributable to the Company for the fourth quarter of fiscal 2010 were $121.1 million, an increase of 16.6 percent compared to earnings of $103.9 million for the same quarter last year. Diluted earnings per share were $0.90 compared to $0.77 for the same quarter last year. On a U.S. GAAP basis, net earnings attributable to the Company for fiscal 2010 increased 15.4 percent to $395.6 million, from $342.8 million in fiscal 2009. U.S. GAAP diluted earnings per share for fiscal 2010 increased 15.4 percent to $2.92 compared to $2.53 last fiscal year. Adjusted net earn-ings attributable to the Company for fiscal 2010 increased 19.3 percent to $409.0 million, from $342.8 million in fiscal 2009. Adjusted diluted earnings per share for fiscal 2010 increased 19.4 percent to $3.02 compared to $2.53 last year.
The non-GAAP adjusted net earnings financial measurements are provided to assist investors and other readers of the Company’s financial statements in better understanding the Company’s operating performance by excluding the impact of certain non-recurring items affecting comparability. Non-GAAP measurements are not intended to be a substitute for U.S. GAAP measurements in analyzing financial performance. These non-GAAP measurements are not in accordance with any gen-erally accepted accounting principles and may be different from non-GAAP measurements used by other companies.
Adjusted net earnings for fiscal 2010 exclude charges of $6.3 million ($0.05 per diluted share) related to the closing of the Company’s Valley Fresh plant in Turlock, California, and an income tax charge of $7.1 million ($0.05 per diluted share) primarily from the change in tax treatment of Medicare Part D subsidies by new health care laws enacted in 2010. Both charges were incurred in the second quarter of fiscal 2010.
Results of Operations
OVERVIEW
The Company is a processor of branded and unbranded food products for retail, foodservice, and fresh product customers. The Company operates in the following five reportable segments:
Segment Business Conducted
Grocery Products
This segment consists primarily of the pro-cessing, marketing, and sale of shelf-stable food products sold predominantly in the retail market. This segment also includes the results from the Company’s MegaMex Foods, LLC (MegaMex) joint venture.
Refrigerated Foods
This segment includes the Hormel Refrigerated operating segment and the Affiliated Business Units. This segment con-sists primarily of the processing, marketing, and sale of branded and unbranded pork and beef products for retail, foodservice, and fresh product customers. The Affiliated Business Units include the Farmer John, Burke Corporation, Dan’s Prize, Saag’s Products, Inc., and Precept Foods businesses. Precept Foods, LLC, is a 50.01 percent owned joint ven-ture between Hormel Foods Corporation and Cargill Meat Solutions Corporation, a wholly-owned subsidiary of Cargill, Incorporated.
Jennie-O Turkey Store
This segment consists primarily of the pro-cessing, marketing, and sale of branded and unbranded turkey products for retail, food-service, and fresh product customers.
Specialty Foods
This segment includes the Diamond Crystal Brands (DCB), Century Foods International (CFI), and Hormel Specialty Products (HSP) operating segments. This segment consists of the packaging and sale of various sugar and sugar substitute products, salt and pepper products, liquid portion products, dessert mixes, ready-to-drink products, sports nutri-tion products, gelatin products, and private label canned meats to retail and foodservice customers. This segment also includes the processing, marketing, and sale of nutritional food products and supplements to hospitals, nursing homes, and other marketers of nutri-tional products.
All Other This segment includes the Hormel Foods International operating segment, which manufactures, markets, and sells Company products internationally. This segment also includes the results from the Company’s international joint ventures and miscella-neous corporate sales.
16
for much of the year. Shipping and handling expenses also increased compared to the prior year, primarily reflecting the increased tonnage over fiscal 2009. However, unusually favor-able cutout margins in the Company’s pork operations were able to offset the impact of these higher costs.
Entering fiscal 2011, the Company expects a continuation of high raw material costs. While the hog supply is expected to approximate current levels, the Company does not anticipate that pork operating margins will remain at the historically high levels that have been experienced recently. The recent rise in grain markets is also a concern, as significantly higher grain costs in fiscal 2011 may negatively impact margin results. The Company will continue to pursue modest price increases and additional operating efficiencies, where pos-sible, to maintain margins as the year progresses.
Selling, General and Administrative: Selling, general and administrative expenses for the fourth quarter and year were $166.5 million and $605.3 million, respectively, compared to $142.7 million and $567.1 million last year. As a percentage of net sales, selling, general and administrative expenses for the fourth quarter decreased to 8.1 percent of net sales compared to 8.5 percent of net sales in the prior year. For the fiscal year, the expenses decreased to 8.4 percent from 8.7 percent in fiscal 2009. Investments in media campaigns supporting the Hormel® and Jennie-O Turkey Store® brands were a key driver of the higher expense during both the fourth quarter and fiscal year, with total advertising expense up $18.7 million for the year compared to fiscal 2009. The Company also experienced increased expenses for compensation, travel, and profes-sional services during the current year. As a percentage of net sales, the Company expects selling, general and administra-tive expenses to approximate 8.5 percent in fiscal 2011.
Research and development expenses were $7.7 million and $27.6 million for the fourth quarter and year, respectively, compared to $6.5 million and $25.4 million in 2009. Research and development expenses are again expected to increase dur-ing fiscal 2011, due to the Company’s ongoing investments in product innovation and expansion of value-added product lines.
Net Sales: Net sales for the fourth quarter increased to $2.06 billion from $1.68 billion in 2009, an increase of 23.2 percent. Net sales for the twelve months of fiscal 2010 increased 10.5 percent to $7.22 billion compared to $6.53 billion in the prior year. Tonnage for the fourth quarter increased 13.8 percent to 1.34 billion lbs. compared to the prior year at 1.18 billion lbs. Tonnage for the fiscal year increased 5.2 percent to 4.80 billion lbs. from 4.56 billion lbs. in the prior year. Following top-line declines in fiscal 2009, sales momentum was restored during fiscal 2010, with all five segments reporting significant gains for both the fourth quarter and full year. The Company’s branded, value-added product portfolios showed particular strength in the latter half of fiscal 2010, attributable to successful new item introductions, distribution gains on key product lines, and substantial investments in advertising to support both the Hormel® and Jennie-O Turkey Store® brands. Sales from the Company’s MegaMex joint venture and the Country Crock® side dish acquisition also benefited top-line results compared to the prior year. Entering fiscal 2011, the Company expects to continue its strong top-line momentum.
Gross Profit: Gross profit was $355.0 million and $1.24 bil-lion for the 2010 fourth quarter and fiscal year, respectively, compared to $304.2 million and $1.10 billion last year. As a percentage of net sales, gross profit decreased to 17.2 per-cent for the fourth quarter compared to 18.2 percent in fiscal 2009, and increased to 17.2 percent for the year compared to 16.8 percent in fiscal 2009. Gross profit for fiscal 2010 includes a charge of $9.7 million incurred during the second quarter related to the closing of the Company’s Valley Fresh plant. Jennie-O Turkey Store experienced the most significant margin gains over the prior year, generated by efficiencies throughout their supply chain and operational improvements across the business. Lower feed costs, favorable commodity meat and whole bird pricing, and a larger than usual hedging gain on open positions during the fourth quarter, also con-tributed to the margin growth for this segment in fiscal 2010. Higher hog costs experienced throughout fiscal 2010 con-stricted margins in the Company’s value-added businesses
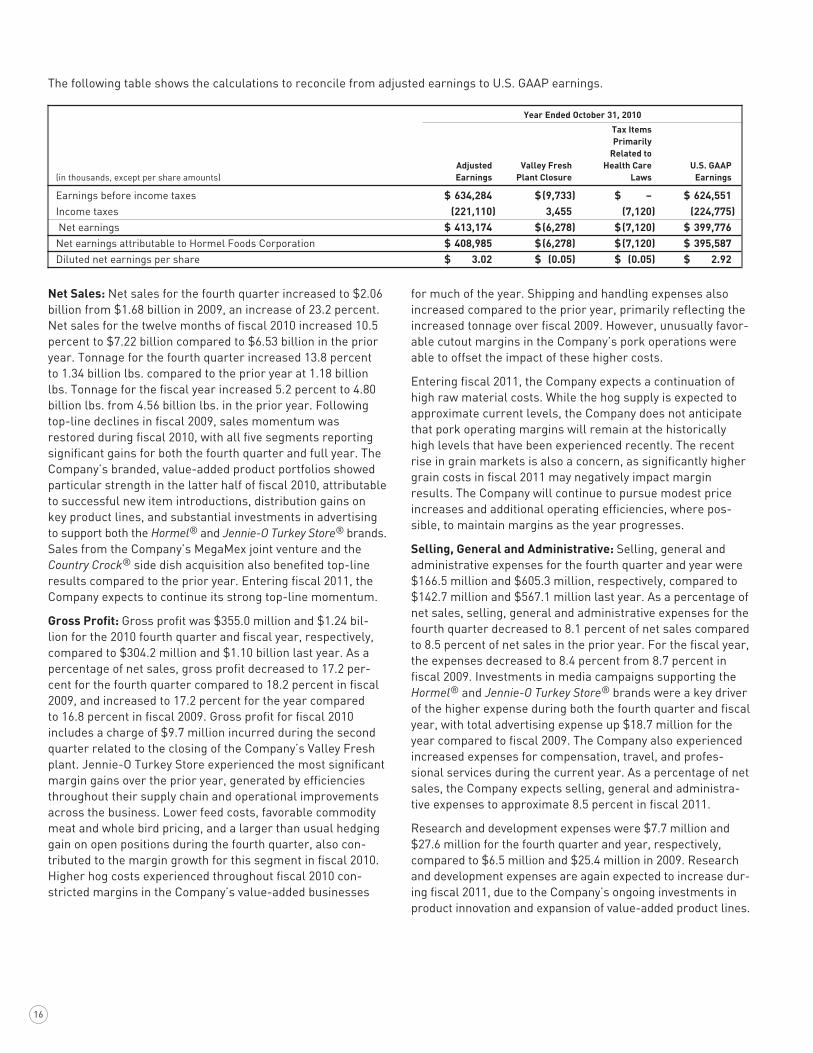
The following table shows the calculations to reconcile from adjusted earnings to U.S. GAAP earnings.
Year Ended October 31, 2010
Tax Items Primarily Related to Adjusted Valley Fresh Health Care U.S. GAAP (in thousands, except per share amounts) Earnings Plant Closure Laws Earnings
Earnings before income taxes $ 634,284 $ (9,733) $ – $ 624,551Income taxes (221,110) 3,455 (7,120) (224,775) Net earnings $ 413,174 $ (6,278) $ (7,120) $ 399,776Net earnings attributable to Hormel Foods Corporation $ 408,985 $ (6,278) $ (7,120) $ 395,587Diluted net earnings per share $ 3.02 $ (0.05) $ (0.05) $ 2.92
17
included in the Consolidated Statement of Financial Position as investments in and receivables from affiliates. The compo-sition of this line item at October 31, 2010, was as follows:
(in thousands) Country Investments/Receivables
United States $ 123,451Philippines 63,894Vietnam 20,501Mexico 4,931Japan 1,612Total $ 214,389
Income Taxes: The Company’s effective tax rate for the fourth quarter and year was 34.8 percent and 36.0 percent, respectively, in fiscal 2010 compared to 34.0 percent and 34.5 percent, respectively, for the quarter and year in fiscal 2009. The higher rate for fiscal 2010 primarily reflects a change in the tax treatment of Medicare Part D subsidies, resulting from new health care laws enacted in 2010. The lower rates in fiscal 2009 for both the fourth quarter and fiscal year are also due to significantly higher returns on the Company’s rabbi trust investments compared to the current year, which are not taxable. The Company expects the effective tax rate in fiscal 2011 to be between 35.0 and 36.0 percent.
Equity in Earnings of Affiliates: Equity in earnings of affiliates was $4.1 million and $13.1 million for the fourth quarter and year, respectively, compared to $1.4 million and $4.8 million last year. On October 26, 2009, the Company completed the formation of MegaMex Foods, LLC (MegaMex), a 50 percent owned joint venture which markets Mexican foods in the United States. Favorable results from this joint venture were the primary driver of the increased earnings for both the fourth quarter and fiscal year, offsetting slightly lower overall results from the Company’s other joint ventures.
During the Company’s fourth quarter, MegaMex also acquired Don Miguel Foods, a leading provider of branded frozen and fresh authentic Mexican appetizers, snacks, and hand-held items. As a result of this acquisition, as well as improved per-formance anticipated from the Company’s other joint venture operations, the Company expects equity in earnings of affili-ates to increase in fiscal 2011.
In conformity with U.S. GAAP, the Company accounts for its majority-owned operations under the consolidation method. Investments in which the Company owns a minority interest are accounted for under the equity or cost method. These investments, along with receivables from other affiliates, are
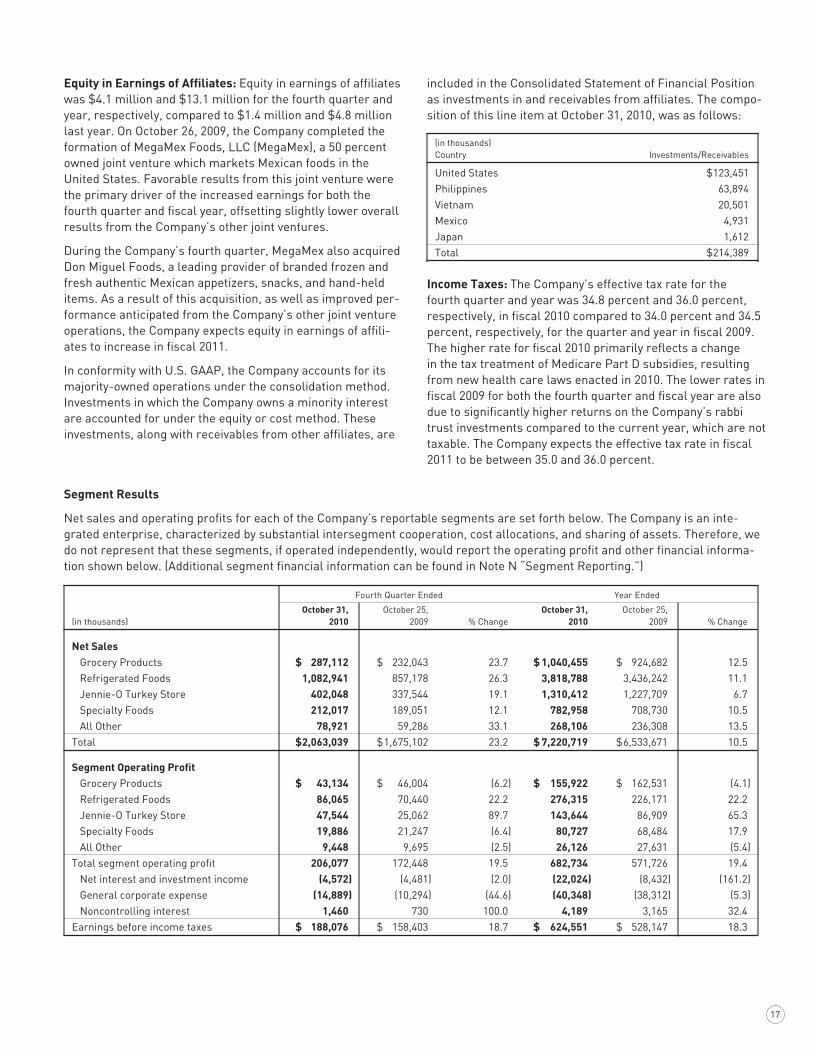
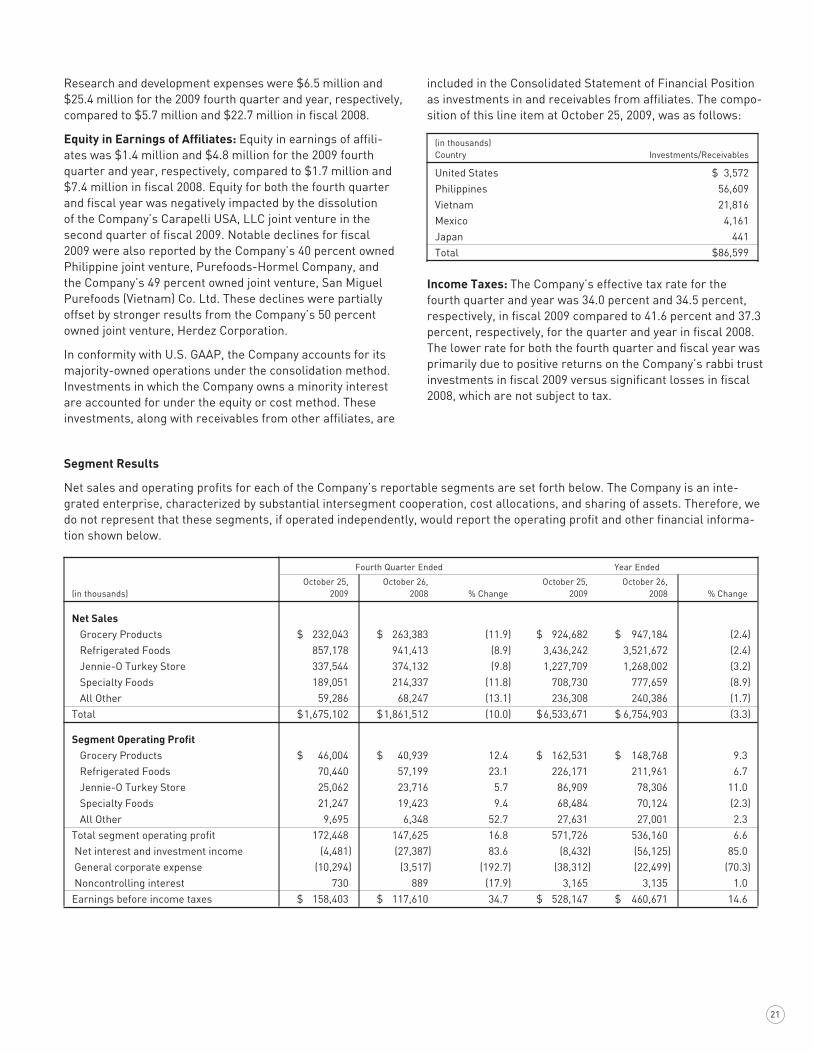
Segment Results
Net sales and operating profits for each of the Company’s reportable segments are set forth below. The Company is an inte-grated enterprise, characterized by substantial intersegment cooperation, cost allocations, and sharing of assets. Therefore, we do not represent that these segments, if operated independently, would report the operating profit and other financial informa-tion shown below. (Additional segment financial information can be found in Note N “Segment Reporting.”)
Fourth Quarter Ended Year Ended
October 31, October 25, October 31, October 25, (in thousands) 2010 2009 % Change 2010 2009 % Change
Net Sales Grocery Products $ 287,112 $ 232,043 23.7 $ 1,040,455 $ 924,682 12.5 Refrigerated Foods 1,082,941 857,178 26.3 3,818,788 3,436,242 11.1 Jennie-O Turkey Store 402,048 337,544 19.1 1,310,412 1,227,709 6.7 Specialty Foods 212,017 189,051 12.1 782,958 708,730 10.5 All Other 78,921 59,286 33.1 268,106 236,308 13.5Total $ 2,063,039 $ 1,675,102 23.2 $ 7,220,719 $ 6,533,671 10.5
Segment Operating Profit Grocery Products $ 43,134 $ 46,004 (6.2) $ 155,922 $ 162,531 (4.1) Refrigerated Foods 86,065 70,440 22.2 276,315 226,171 22.2 Jennie-O Turkey Store 47,544 25,062 89.7 143,644 86,909 65.3 Specialty Foods 19,886 21,247 (6.4) 80,727 68,484 17.9 All Other 9,448 9,695 (2.5) 26,126 27,631 (5.4)Total segment operating profit 206,077 172,448 19.5 682,734 571,726 19.4 Net interest and investment income (4,572) (4,481) (2.0) (22,024) (8,432) (161.2) General corporate expense (14,889) (10,294) (44.6) (40,348) (38,312) (5.3) Noncontrolling interest 1,460 730 100.0 4,189 3,165 32.4Earnings before income taxes $ 188,076 $ 158,403 18.7 $ 624,551 $ 528,147 18.3
18
Refrigerated Foods: Net sales for the Refrigerated Foods segment were up 26.3 percent for the fourth quarter and 11.1 percent for the twelve months compared to fiscal 2009. Tonnage increased 9.3 percent for the fourth quarter and 2.3 percent for the fiscal year as compared to the prior year. Both retail and foodservice sales improved throughout fiscal 2010, and were particularly strong during the fourth quarter. The Company’s Hormel® branded products have been supported by the “Life Better Served” advertising campaign, which began in the second quarter and continues to benefit top-line results.
Segment profit for Refrigerated Foods increased 22.2 percent in both the fourth quarter and the twelve months, compared to fiscal 2009. The Company processed 2.60 million hogs during the fourth quarter, increasing 8.1 percent from 2.40 million hogs in the comparable period last year. For the fiscal year, hog processing remained relatively flat at 9.50 million hogs versus 9.44 million hogs in fiscal 2009. Strong cutout margins have driven the profit increases for this segment throughout fiscal 2010, generating substantial gains for the Company’s pork operations compared to fiscal 2009. However, anticipated reductions in overall hog production resulted in a lower hog supply during the current year. This decline, combined with increased demand, kept pork primals at an elevated level and reduced margins in this segment’s value-added businesses. Price increases were able to recover a por-tion of these higher costs during the year, and the Company may consider additional actions entering the new fiscal year if costs remain at recent levels.
The Company’s focus on value-added growth was evident throughout fiscal 2010. The Meat Products business unit experienced double-digit sales gains for both the fourth quarter and fiscal year for Hormel® party trays and Hormel® retail pepperoni. New item introductions for both of these product lines have continued to grow the Company’s pres-ence in the home occasion and snack categories this past year. Natural Choice® deli meats also showed notable growth during the year in both the retail and foodservice businesses. Additionally, the Foodservice business unit was able to grow other key product lines, including Café H® ethnic meats and Austin Blues® barbeque products. The Affiliated Business Units also contributed to the improved sales results for the year.
Integration of the recently acquired Country Crock® chilled side dish business was also completed during fiscal 2010. Efforts to restore momentum to this product line by co-marketing the side dishes as a complement to the Company’s Hormel® refrigerated entrees and Lloyd’s® barbeque product lines have been successful, and should continued to enhance sales results for Refrigerated Foods in the future.
Pork operating margins remain strong entering fiscal 2011, but are not expected to remain at the unusually high levels that were experienced during fiscal 2010. Raw material values also remain at elevated levels but have trended lower recently, which is gradually reducing the margin pressure
Grocery Products: Grocery Products net sales increased 23.7 percent for the fourth quarter and 12.5 percent for the year compared to fiscal 2009. Tonnage increased 22.2 percent for the quarter and 14.4 percent for the year compared to prior year results. The incremental sales of Mexican products generated by the Company’s new MegaMex joint venture drove the substantial top-line growth for this segment throughout the fourth quarter and fiscal year. These sales have more than compensated for the sales of Carapelli® olive oil that were discontinued during fiscal 2009. Excluding both the new MegaMex sales and the discontinued Carapelli® sales, net sales for Grocery Products increased 12.6 percent and 4.3 percent for the fourth quarter and fiscal year, respectively, compared to the prior year.
Sales results for other core products within Grocery Products were also strong during fiscal 2010, including Hormel® chili and Hormel® Mary Kitchen® hash. Following declines earlier in the year, sales of the SPAM® family of products, Hormel® Compleats® microwave meals, and bacon toppings also regained momentum in the fourth quarter with notable increases over fiscal 2009.
Segment profit for Grocery Products decreased 6.2 percent for the fourth quarter and 4.1 percent for the year compared to fiscal 2009. Adjusted segment profit for Grocery Products for fiscal 2010 increased 1.9 percent compared to the prior year, which excludes a non-recurring charge of $9.7 million related to the closing of the Company’s Valley Fresh plant incurred during the second quarter (see table below). Profits throughout fiscal 2010 were negatively impacted by higher pork and beef raw material costs, most significantly in the lat-ter half of the year. Margins were constricted across several product lines, including the SPAM® family of products, bacon toppings, and hash and stew items. Improved profitability on chili and microwave meals, as well as favorable equity in earnings results from the MegaMex joint venture, were able to offset a portion of the declines experienced on these other core product lines.
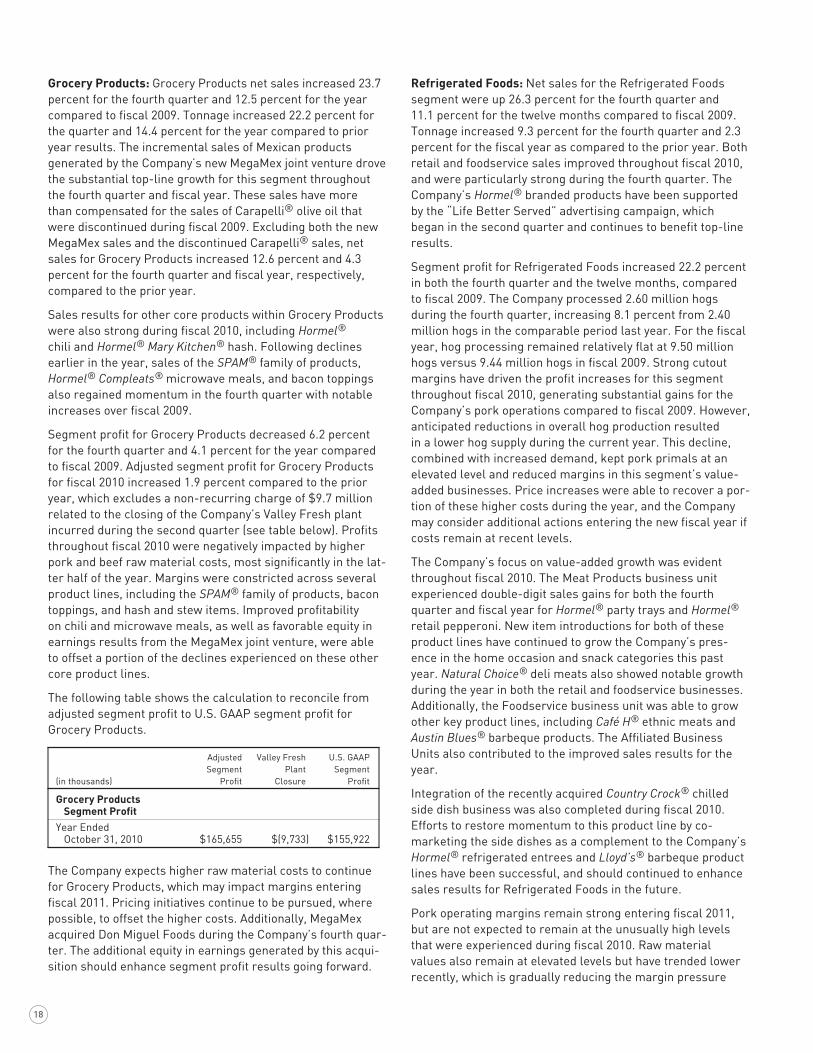
The following table shows the calculation to reconcile from adjusted segment profit to U.S. GAAP segment profit for Grocery Products.
Adjusted Valley Fresh U.S. GAAP Segment Plant Segment (in thousands) Profit Closure Profit
Grocery Products Segment Profit
Year Ended October 31, 2010 $165,655 $(9,733) $155,922
The Company expects higher raw material costs to continue for Grocery Products, which may impact margins entering fiscal 2011. Pricing initiatives continue to be pursued, where possible, to offset the higher costs. Additionally, MegaMex acquired Don Miguel Foods during the Company’s fourth quar-ter. The additional equity in earnings generated by this acqui-sition should enhance segment profit results going forward.
19
Specialty Foods segment profit decreased 6.4 percent for the fourth quarter but increased 17.9 percent for the year compared to fiscal 2009. All three operating segments also contributed to the profit gains for the year, but this segment faced a challenging fourth quarter. HSP reported strong sales growth in chili, hash, stew, and luncheon meat. However, high raw material costs negatively impacted the gross margins on these items, resulting in an overall profit decline. DCB reported a profit increase due to improved sales of sugar, sugar substitute, and dysphagia products. CFI experienced the largest profit gains throughout fiscal 2010. Fourth quarter results also exceeded the prior year, driven by contract pack-aging nutritional jar sales, which were able to offset declines in nutritional pouches and bulk blending.
Despite the lower results experienced late in fiscal 2010, the Company does expect additional growth from Specialty Foods in fiscal 2011. High raw material costs will continue to challenge this segment, at least through the first half of the upcoming year. The competitive pricing environment also remains a concern, but increases will be pursued on certain product lines where the higher input costs have had the most significant impact.
All Other: All Other net sales increased 33.1 percent for the fourth quarter and 13.5 percent for the year compared to fis-cal 2009. Strong export sales of the SPAM® family of products generated the largest gains for both the fourth quarter and fiscal year. Fresh pork exports were weak during much of fiscal 2010, but showed some improvement on a year-over-year basis in the fourth quarter due to the impact of the weak global economy in the prior year and bans in place related to the H1N1 flu virus during the 2009 fourth quarter.
Despite the strong top-line growth, All Other segment profit decreased 2.5 percent and 5.4 percent for the fourth quarter and year, respectively, compared to fiscal 2009. High raw material costs persisted throughout fiscal 2010, resulting in a significant reduction in export margins compared to the prior year. These market conditions are expected to continue into fiscal 2011, and will likely remain a challenge for the Company’s export businesses if pricing initiatives are unable to cover the higher input costs. Increased freight and marketing expenses were also incurred during fiscal 2010, but were partially offset by favorable currency rates and improved performance from the Company’s China operations. The Company’s international joint ventures also reported improved profit results overall, providing a benefit for the full year compared to fiscal 2009.
Unallocated Income and Expenses: The Company does not allocate investment income, interest expense, and interest income to its segments when measuring performance. The Company also retains various other income and unallocated expenses at corporate. Equity in earnings of affiliates is included in segment operating profit; however, earnings attributable to the Company’s noncontrolling interests are excluded. These items are included in the segment table for the purpose of reconciling segment results to earnings before income taxes.
on our value-added businesses. The foodservice industry is expected to have a relatively flat year in fiscal 2011, and the Company continues to pursue opportunities in the non-commercial sector to maintain growth in this business.
Jennie-O Turkey Store: Jennie-O Turkey Store (JOTS) net sales for the fourth quarter and year increased 19.1 percent and 6.7 percent, respectively, compared to fiscal 2009. Tonnage increased 19.3 percent for the fourth quarter and 5.1 percent for the twelve months, compared to prior year results. Improved value-added sales have driven the top-line increase for both the fourth quarter and fiscal year, increasing 18.2 percent and 8.7 percent, respectively. Retail whole bird sales were also particularly strong late in the year, offsetting declines in commodity meat sales.
JOTS experienced excellent profitability throughout fiscal 2010, with segment profit increasing 89.7 percent for the fourth quarter and 65.3 percent for the year, compared to fis-cal 2009. Efficiencies achieved throughout their supply chain and other operational improvements across the business have reduced production costs, resulting in these significant profit gains. Favorable commodity meat and whole bird pric-ing also contributed to margin improvement for this segment in fiscal 2010. JOTS further benefited from lower feed costs during the year, including an unusually large hedging gain on its open grain positions during the fourth quarter, amounting to an incremental $7.3 million over the prior year.
Value-added net sales for JOTS have benefited from sub-stantial investments in media campaigns to support the Jennie-O Turkey Store® brand, particularly in the latter half of fiscal 2010. These campaigns contributed to double-digit sales growth over the prior year across the retail, deli, and foodservice business units during the fourth quarter. Sales of Jennie-O Turkey Store® retail turkey burgers and tray pack products were particularly strong, and are expected to pro-vide incremental volume going forward.
Both JOTS and the turkey industry overall will begin fiscal 2011 well balanced between supply and demand. However, signs of increased production have been evidenced recently through greater poult placements. Grain prices also increased significantly during the fourth quarter of fiscal 2010 and futures markets indicate that costs in fiscal 2011 will be substantially higher. Although the Company’s hedging programs are expected to temper some of this increase, grain volatility will remain a concern as the year progresses. Based on these factors, the Company expects results for JOTS to increase slightly during the upcoming year, but it is unlikely that the growth rate in earnings will be as exceptional as what was reported during fiscal 2010.
Specialty Foods: Specialty Foods net sales increased 12.1 percent for the fourth quarter and 10.5 percent for the twelve months compared to fiscal 2009. Tonnage increased 12.2 percent for the quarter and 8.3 percent for the twelve months compared to the prior year. All three operating segments con-tributed to the top-line growth throughout fiscal 2010.

20
increase. The Company reported gains of $3.7 million and $15.3 million for the 2009 fourth quarter and fiscal year, respectively, compared to losses of $20.4 million and $29.0 million for the comparable periods of fiscal 2008.
Net Sales: Net sales for the fourth quarter of fiscal 2009 decreased to $1.68 billion from $1.86 billion in 2008, a decrease of 10.0 percent. Net sales for the twelve months of fiscal 2009 decreased 3.3 percent to $6.53 billion compared to $6.75 billion in fiscal 2008. Tonnage for the fourth quarter of fiscal 2009 decreased 3.2 percent to 1.18 billion lbs. compared to 1.21 billion lbs. in 2008. Tonnage for the year decreased 2.6 percent to 4.56 billion lbs. from 4.68 billion lbs. in 2008. Top-line results declined due to a combination of factors. A weak consumer environment resulted in softer sales throughout fiscal 2009, and continued to have a significant impact during the fourth quarter. Planned volume reductions at Jennie-O Turkey Store, the discontinuance of sales of Carapelli® olive oil, and product rationalizations during fiscal 2009 also contrib-uted to the decline for the year. Net sales decreases outpacing tonnage reductions for fiscal 2009 also reflected lower pricing in our pork and turkey complexes.
Gross Profit: Gross profit was $304.2 million and $1.10 billion for the fourth quarter and year, respectively, compared to $276.2 million and $1.06 billion in fiscal 2008. As a percent-age of net sales, gross profit increased to 18.2 percent for the fourth quarter compared to 14.8 percent in fiscal 2008, and increased to 16.8 percent for the year compared to 15.7 percent in fiscal 2008. The Refrigerated Foods segment real-ized margin gains throughout fiscal 2009 as reduced input costs were more than able to offset the impact of unfavorable cut-out margins in pork operations. These gains were most notable in the second half of the year, as a rapid increase in input costs in the latter half of fiscal 2008 had decreased margins in the Company’s value-added business units. Lower feed costs at Jennie-O Turkey Store also contributed to the margin improvement, resulting from a planned reduction in turkey production and a decreased cost per ton in fiscal 2009 compared to fiscal 2008. Significantly lower freight expense across most segments of the Company also benefited mar-gins for both the fourth quarter and fiscal year.
Selling, General and Administrative: Selling, general and administrative expenses for the fourth quarter and year were $142.7 million and $567.1 million, respectively, compared to $132.9 million and $552.5 million in fiscal 2008. As a percent-age of net sales, selling, general and administrative expenses for the fourth quarter increased to 8.5 percent of net sales compared to 7.1 percent of net sales in the same quarter of fiscal 2008. For the full fiscal year, these expenses increased to 8.7 percent from 8.2 percent in fiscal 2008. Increases for both the fourth quarter and fiscal year reflected higher employee incentive plan costs, increased pension and medical expenses, and additional charitable contributions compared to fiscal 2008. These increases offset reductions in travel and advertising expenses.
Net interest and investment income for the fourth quarter and year was a net expense of $4.6 million and $22.0 million, respectively, compared to a net expense of $4.5 million and $8.4 million for the comparable periods of fiscal 2009. Lower investment returns on the Company’s rabbi trust for supple-mental executive retirement plans and deferred income plans were the primary driver of the increased net expense in fiscal 2010, as the Company transitioned the majority of this portfo-lio to fixed return investments to reduce the exposure to vola-tility in equity markets. The Company also recorded increased amortization related to affordable housing investments during fiscal 2010. Additionally, fiscal 2009 results included a $3.6 million pretax gain recognized on the dissolution of the Company’s Carapelli USA, LLC joint venture. Interest expense was $26.6 million for fiscal 2010, decreasing from $28.0 million in fiscal 2009 due to outstanding borrowings against the Company’s line of credit in the prior year. The only debt balance remaining at the end of fiscal 2010 relates to the Company’s $350.0 million senior notes which mature in 2011. The Company expects interest expense to be approximately $20.0 to $23.0 million for fiscal 2011, as the Company may consider options to take advantage of the favorable interest rates currently available.
General corporate expense for the fourth quarter and year was $14.9 million and $40.3 million, respectively, compared to $10.3 million and $38.3 million for the prior year quarter and twelve months. The higher expense for both the fourth quarter and year reflects an increase in the lower of cost or market inventory reserve and higher pension expense compared to the prior year. These were partially offset by a reduction in expenses for medical benefits in the current year compared to fiscal 2009.
Net earnings attributable to the Company’s noncontrolling interests were $1.5 million and $4.2 million for the 2010 fourth quarter and fiscal year, respectively, compared to $0.7 million and $3.2 million for the comparable periods of fiscal 2009. The increases for fiscal 2010 primarily reflect improved performance from the Company’s Precept Foods business.
FISCAL YEARS 2009 AND 2008:
Consolidated Results
Net Earnings: Net earnings attributable to the Company for the fourth quarter of fiscal 2009 were $103.9 million, an increase of 53.2 percent compared to earnings of $67.8 mil-lion for the same quarter in fiscal 2008. Diluted earnings per share were $0.77 compared to $0.50 for the same period in 2008. Net earnings attributable to the Company for the year increased 20.1 percent to $342.8 million from $285.5 mil-lion in fiscal 2008. Diluted earnings per share for fiscal 2009 increased to $2.53 from $2.08 in 2008.
Gains on investments held in the Company’s rabbi trust for supplemental executive retirement plans and deferred income plans in fiscal 2009 were a key driver of the earnings
21
included in the Consolidated Statement of Financial Position as investments in and receivables from affiliates. The compo-sition of this line item at October 25, 2009, was as follows:
(in thousands) Country Investments/Receivables
United States $ 3,572Philippines 56,609Vietnam 21,816Mexico 4,161Japan 441Total $ 86,599
Income Taxes: The Company’s effective tax rate for the fourth quarter and year was 34.0 percent and 34.5 percent, respectively, in fiscal 2009 compared to 41.6 percent and 37.3 percent, respectively, for the quarter and year in fiscal 2008. The lower rate for both the fourth quarter and fiscal year was primarily due to positive returns on the Company’s rabbi trust investments in fiscal 2009 versus significant losses in fiscal 2008, which are not subject to tax.
Research and development expenses were $6.5 million and $25.4 million for the 2009 fourth quarter and year, respectively, compared to $5.7 million and $22.7 million in fiscal 2008.
Equity in Earnings of Affiliates: Equity in earnings of affili-ates was $1.4 million and $4.8 million for the 2009 fourth quarter and year, respectively, compared to $1.7 million and $7.4 million in fiscal 2008. Equity for both the fourth quarter and fiscal year was negatively impacted by the dissolution of the Company’s Carapelli USA, LLC joint venture in the second quarter of fiscal 2009. Notable declines for fiscal 2009 were also reported by the Company’s 40 percent owned Philippine joint venture, Purefoods-Hormel Company, and the Company’s 49 percent owned joint venture, San Miguel Purefoods (Vietnam) Co. Ltd. These declines were partially offset by stronger results from the Company’s 50 percent owned joint venture, Herdez Corporation.
In conformity with U.S. GAAP, the Company accounts for its majority-owned operations under the consolidation method. Investments in which the Company owns a minority interest are accounted for under the equity or cost method. These investments, along with receivables from other affiliates, are
Segment Results
Net sales and operating profits for each of the Company’s reportable segments are set forth below. The Company is an inte-grated enterprise, characterized by substantial intersegment cooperation, cost allocations, and sharing of assets. Therefore, we do not represent that these segments, if operated independently, would report the operating profit and other financial informa-tion shown below.
Fourth Quarter Ended Year Ended
October 25, October 26, October 25, October 26, (in thousands) 2009 2008 % Change 2009 2008 % Change
Net Sales Grocery Products $ 232,043 $ 263,383 (11.9) $ 924,682 $ 947,184 (2.4) Refrigerated Foods 857,178 941,413 (8.9) 3,436,242 3,521,672 (2.4) Jennie-O Turkey Store 337,544 374,132 (9.8) 1,227,709 1,268,002 (3.2) Specialty Foods 189,051 214,337 (11.8) 708,730 777,659 (8.9) All Other 59,286 68,247 (13.1) 236,308 240,386 (1.7)Total $ 1,675,102 $ 1,861,512 (10.0) $ 6,533,671 $ 6,754,903 (3.3)
Segment Operating Profit Grocery Products $ 46,004 $ 40,939 12.4 $ 162,531 $ 148,768 9.3 Refrigerated Foods 70,440 57,199 23.1 226,171 211,961 6.7 Jennie-O Turkey Store 25,062 23,716 5.7 86,909 78,306 11.0 Specialty Foods 21,247 19,423 9.4 68,484 70,124 (2.3) All Other 9,695 6,348 52.7 27,631 27,001 2.3Total segment operating profit 172,448 147,625 16.8 571,726 536,160 6.6 Net interest and investment income (4,481) (27,387) 83.6 (8,432) (56,125) 85.0 General corporate expense (10,294) (3,517) (192.7) (38,312) (22,499) (70.3) Noncontrolling interest 730 889 (17.9) 3,165 3,135 1.0Earnings before income taxes $ 158,403 $ 117,610 34.7 $ 528,147 $ 460,671 14.6
22
Although the Meat Products business unit experienced an overall sales decline in the fourth quarter of fiscal 2009, their results on key product lines remained strong. For the fourth quarter and fiscal year, double-digit sales growth was achieved for Hormel® retail pepperoni, Di Lusso® products, and prepared deli foods. Sales of Hormel® Natural Choice® lunchmeats and Hormel® party trays also showed notable gains for 2009 compared to the prior year. The Foodservice business unit reported an overall sales decline for the year, as they continued to experience decreased travel and restaurant business due to the economic conditions that existed through-out fiscal 2009.
Farmer John was challenged throughout fiscal 2009, as the lower hog markets generated significant losses for the Company’s live hog production operations.
Jennie-O Turkey Store: Jennie-O Turkey Store (JOTS) net sales for the fourth quarter and year decreased 9.8 percent and 3.2 percent, respectively, compared to fiscal 2008. Tonnage decreased 6.3 percent for the fourth quarter and 3.1 percent for the twelve months, compared to fiscal 2008 results. Lower commodity meat sales, due to overall lower market pricing compared to fiscal 2008, were the key driver of the sales decline. Planned volume reductions also impacted sales, and JOTS ended the year with significantly lower inven-tory levels compared to fiscal 2008. Value-added net sales also declined during the second half of the fiscal year, reflect-ing the ongoing impact of weak economic conditions.
Segment profit for JOTS increased 5.7 percent for the fourth quarter and 11.0 percent for the year compared to fiscal 2008. Lower feed costs, due to the planned reductions in turkey pro-duction and a decreased cost per ton, were the key driver of the improved profit results throughout fiscal 2009. Commodity markets were low as the industry experienced an oversupply of breast meat and whole birds during the majority of the fiscal year. Export markets were also volatile during 2009. The volume reductions noted above were able to reduce the Company’s exposure to the lower markets and allowed JOTS to avoid generating surplus breast meat. JOTS also benefited from significantly reduced freight expenses during fiscal 2009.
Value-added net sales for JOTS declined in the latter half of 2009, but maintained a slight increase for the fiscal year com-pared to fiscal 2008. Products such as Jennie-O Turkey Store® tray pack products, pan roasts, and franks ended the year with strong fourth quarter results, but were unable to offset decreases in other retail and deli product lines.
Specialty Foods: Specialty Foods net sales decreased 11.8 percent for the fourth quarter and 8.9 percent for fiscal year compared to fiscal 2008. Tonnage decreased 8.3 percent for the fourth quarter and 9.0 percent for fiscal 2009, compared to fiscal 2008 results. The Boca Grande Foods, Inc. (Boca Grande) acquisition contributed an incremental $13.8 million of net sales and 15.8 million lbs. of tonnage to the fiscal year 2009 results for this segment.
Grocery Products: Grocery Products net sales decreased 11.9 percent for the fourth quarter and 2.4 percent for the year compared to fiscal 2008. Tonnage decreased 6.9 percent for the fourth quarter and 2.6 percent for the year compared to fiscal 2008 results. Top-line results for both the fourth quarter and year were negatively impacted by the discontinu-ance of sales of Carapelli® olive oil at the end of the second quarter of fiscal 2009, as well as the rationalization of certain other non-strategic product lines. Increased promotional support also contributed to the sales decline. This segment experienced weakness in consumer spending, particularly in the microwave category, as sales of Hormel® Compleats® microwave meals declined compared to fiscal 2008 levels due to the ongoing economic trend away from convenience items. Sales of Hormel® chili remained strong, showing double-digit sales increases for both the fourth quarter and fiscal year compared to 2008.
Segment profit for Grocery Products increased 12.4 percent for the fourth quarter and 9.3 percent for the year compared to fiscal 2008. Lower pork input costs, product mix improve-ments, and pricing advances taken early in the year provided a substantial benefit throughout fiscal 2009. Increased sales of our SPAM® family of products and decreased expenses related to freight, warehousing, and packaging also contrib-uted to the improved profit results.
Refrigerated Foods: Net sales by the Refrigerated Foods segment were down 8.9 percent for the fourth quarter and 2.4 percent for fiscal 2009 compared to fiscal 2008. Tonnage increased 1.0 percent for the fourth quarter and decreased 1.0 percent for the fiscal year as compared to 2008. Weak economic conditions impacted sales results for this segment throughout fiscal 2009, most notably in the Foodservice business unit. Lower primal values also resulted in reduced prices for commodity pork, hams, and bacon.
Segment profit for Refrigerated Foods increased 23.1 percent in the fourth quarter and 6.7 percent for fiscal 2009 compared to fiscal 2008. The Company’s hog processing for the fourth quarter decreased 1.8 percent to 2.40 million hogs from 2.45 million hogs for the comparable period in 2008. For the fiscal year, hog processing decreased 1.1 percent to 9.44 million hogs from 9.55 million hogs in fiscal 2008. Lower input costs and a more favorable product mix for our value-added busi-nesses were the key drivers of the improved profit results compared to fiscal 2008. Sizable pork operating losses, generated by unfavorable cut-out margins compared to fiscal 2008 and reserve adjustments related to producer contracts, offset a portion of these gains. A significant reduction in freight expenses during fiscal 2009 also strengthened the profit results for this segment.
23
results, increasing $24.1 million and $44.2 million for the fourth quarter and fiscal year, respectively, compared to the losses that were incurred in fiscal 2008. Fiscal 2009 results also included a $3.6 million pretax gain recognized on the dissolution of the Company’s Carapelli USA, LLC joint venture. Additionally, the Company recorded a $2.4 million investment write-off in fiscal 2008. These investment gains were partially offset by $2.1 million of additional amortization expense related to the Company’s affordable housing investments during fiscal 2009. Interest expense of $28.0 million for fiscal 2009 was even with fiscal 2008. The only debt balance remain-ing at the end of fiscal 2009 related to the Company’s $350.0 million senior notes which mature in 2011.
General corporate expense for the fourth quarter and fis-cal year was $10.3 million and $38.3 million, respectively, compared to $3.5 million and $22.5 million for the fiscal 2008 fourth quarter and fiscal year. Increases for both the fourth quarter and year were primarily due to higher employee com-pensation plan costs and additional charitable contributions compared to fiscal 2008. The increased expense for the year also reflected higher medical and pension related expenses.
Net earnings attributable to the Company’s noncontrolling interests were $0.7 million and $3.2 million for the 2009 fourth quarter and fiscal year, respectively, compared to $0.9 million and $3.1 million for the comparable periods of fiscal 2008, reflecting the results of the Company’s Precept Foods business.
RELATED PARTY TRANSACTIONS
Certain employees of the Company provide administrative services to The Hormel Foundation, which beneficially owns more than five percent of the Company’s common stock. The Hormel Foundation reimburses the Company for its fully allo-cated cost for the employees’ time and expenses.
Liquidity and Capital ResourcesCash and cash equivalents were $467.8 million at the end of fiscal year 2010 compared to $385.3 million at the end of fis-cal year 2009.
During fiscal 2010, cash provided by operating activities was $485.5 million compared to $558.8 million in 2009. Increased earnings in fiscal 2010 generated significantly higher operat-ing cash flows compared to fiscal 2009. However, unfavorable changes in working capital balances, primarily increased accounts receivable and inventory balances compared to the prior year, have more than offset the cash provided by earnings. During fiscal 2010, the Company also made $70.3 million of discretionary contributions to fund its pension plans, compared to $100.0 million of discretionary funding during fiscal 2009.
Specialty Foods segment profit increased 9.4 percent for the fourth quarter but decreased 2.3 percent for the year compared to fiscal 2008. Results for the operating segments within Specialty Foods were mixed. The strong results for the fourth quarter and year were driven by improved sales and margins on HSP private label canned meats, which offset reductions in contract packaging sales. An overall reduction in freight and warehousing expenses also provided a benefit to this segment throughout fiscal 2009. For the full year, however, these gains were not enough to offset lower results at CFI due to decreased sales of nutritional powders, ready-to-drink products, and ingredient blends. Although results for DCB were relatively flat for the fourth quarter, product mix improvements resulting in increased sales of sugar substitutes, nutritional products, and liquid portion products contributed to profit increases for the full year compared to fiscal 2008.
All Other: All Other net sales decreased 13.1 percent for the fourth quarter and 1.7 percent for the year compared to fiscal 2008. Export sales of fresh pork were weak, most notably in the fourth quarter, due to the continuing weak global economy and certain bans still in place related to the H1N1 flu virus.
All Other segment profit increased 52.7 percent and 2.3 per-cent for the quarter and year, respectively, compared to fiscal 2008. The significant increase in the fourth quarter was due to lower raw material, freight, and advertising costs, which also provided some benefit on an annual basis. Currency exchange rates, which had been unfavorable throughout much of fiscal 2009, began to show some improvement late in the year and also contributed to the increased profits for this segment. The gains realized due to lower expenses for the year were partially offset by the Company’s international joint ventures, which reported a substantial profit decrease compared to fis-cal 2008 results.
Unallocated Income and Expenses: The Company does not allocate investment income, interest expense, and interest income to its segments when measuring performance. The Company also retains various other income and unallocated expenses at corporate. Equity in earnings of affiliates is included in segment operating profit; however, earnings attributable to the Company’s noncontrolling interests are excluded. These items are included in the segment table for the purpose of reconciling segment results to earnings before income taxes.
Net interest and investment income for the fiscal 2009 fourth quarter and year was a net expense of $4.5 million and $8.4 million, respectively, compared to a net expense of $27.4 million and $56.1 million for the comparable periods of fiscal 2008. Positive investment returns on the Company’s rabbi trust for supplemental executive retirement plans and deferred income plans was the key driver of the improved
24
The Company paid $109.4 million in dividends to shareholders in fiscal 2010, compared to $101.4 million in fiscal 2009. The dividend rate was $0.84 per share in 2010, which reflected a 10.5 percent increase over the fiscal 2009 rate. The Company has paid dividends for 329 consecutive quarters and expects to continue doing so in the future. The annual dividend rate for fiscal 2011 has been increased to $1.02 per share, represent-ing the 45th consecutive annual dividend increase.
The Company’s long-term debt balance of $350.0 million was reclassified to current maturities during fiscal 2010, and is scheduled to be repaid during the third quarter of fiscal 2011. The Company is investigating opportunities to replace a portion of the long-term debt that will mature. The Company is required, by certain covenants in its debt agreements, to maintain specified levels of financial ratios and financial posi-tion. At the end of fiscal 2010, the Company was in compliance with all of these debt covenants.
Cash flows from operating activities continue to provide the Company with its principal source of liquidity. The Company does not anticipate a significant risk to cash flows from this source in the foreseeable future because the Company oper-ates in a relatively stable industry and has strong products across many product lines.
The Company has consistently maintained a very strong cash balance, which positions it well to take advantage of strategic opportunities that may arise entering the new fiscal year. The Company’s priorities for uses of cash continue to remain investing in the business and returning value to its shareholders, as evidenced by the lengthy history of dividend increases. The Company expects to continue enhancing its operations through increased capital spending during fiscal 2011. Additional share repurchases and strategic acquisitions to complement existing product portfolios also remain as potential uses of free cash flows over the upcoming year.
Cash used in investing activities increased to $258.5 million in fiscal year 2010 from $85.2 million in fiscal year 2009. The Company’s investments in the formation of the MegaMex joint venture, and to facilitate the subsequent acquisition of Don Miguel Foods, were significant outflows for the Company during the year. Fiscal 2010 also includes a $50.0 million invest-ment in marketable securities during the second quarter, and the acquisition of the Country Crock® chilled side dish line. Expenditures on fixed assets in fiscal 2010 decreased to $89.8 million from $97.0 million in the prior year. The most significant project during 2010 was the completion of the Company’s new production facility in Dubuque, Iowa. For fiscal 2011, the Company expects capital expenditures to approximate $120.0 to $130.0 million, which exceeds estimated depreciation expense.
Cash used in financing activities was $144.5 million in fiscal 2010 compared to $243.1 million in fiscal 2009. The decrease in cash used in financing activities was primarily due to a $100.0 million payment on short-term debt and a distribution to the Company’s noncontrolling interest in fiscal 2009, both of which did not reoccur in fiscal 2010. Financing cash flows generated by exercises under the Company’s stock option plan also increased $29.5 million compared to the prior year.
Repurchases of common stock continue to be a significant financing activity for the Company, with $69.6 million and $38.1 million used for repurchases in fiscal 2010 and 2009, respec-tively. During the year, the Company repurchased 1.7 million shares of its common stock at an average price per share of $40.84. On October 2, 2002, the Company announced that its Board of Directors had authorized the Company to repurchase up to 10.0 million shares of common stock with no expiration date. During fiscal 2010, the 1.1 million shares remaining under this program were purchased, which fully depleted that 10.0 million share authorization. On May 26, 2010, the Company announced that its Board of Directors had authorized the Company to repurchase an additional 5.0 million shares of common stock with no expiration date. During fiscal 2010, 585,500 shares were purchased under this new authorization.
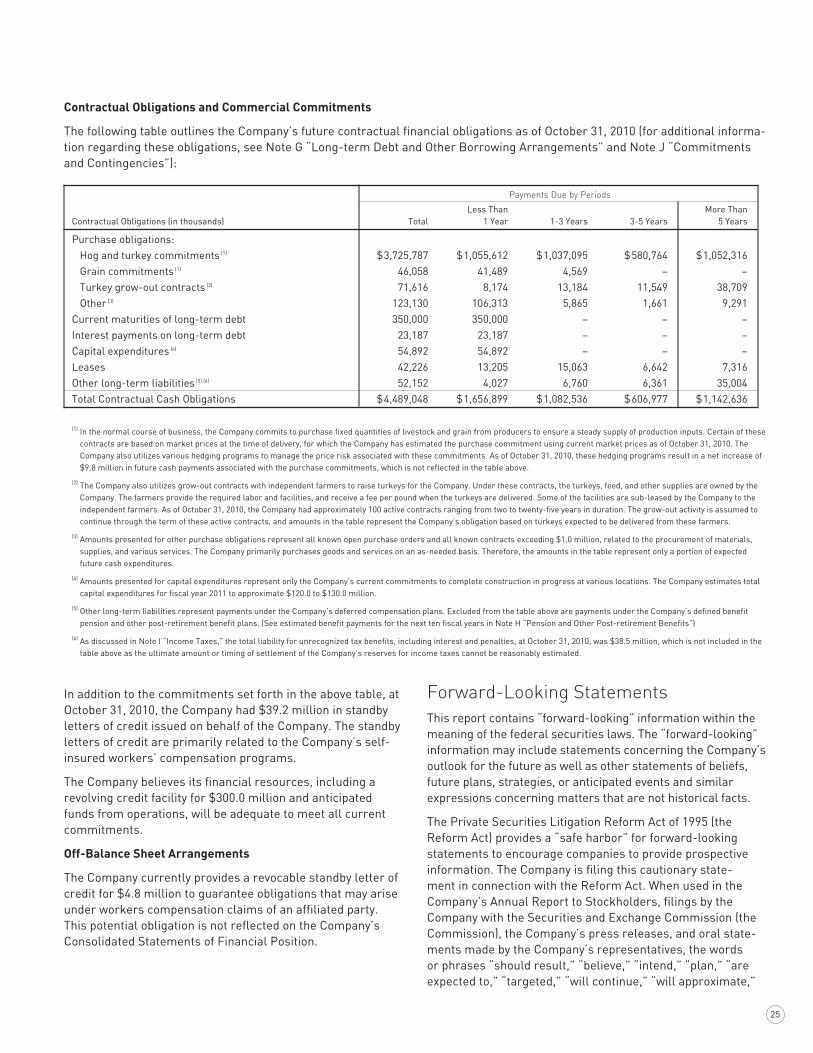
25
Forward-Looking StatementsThis report contains “forward-looking” information within the meaning of the federal securities laws. The “forward-looking” information may include statements concerning the Company’s outlook for the future as well as other statements of beliefs, future plans, strategies, or anticipated events and similar expressions concerning matters that are not historical facts.
The Private Securities Litigation Reform Act of 1995 (the Reform Act) provides a “safe harbor” for forward-looking statements to encourage companies to provide prospective information. The Company is filing this cautionary state-ment in connection with the Reform Act. When used in the Company’s Annual Report to Stockholders, filings by the Company with the Securities and Exchange Commission (the Commission), the Company’s press releases, and oral state-ments made by the Company’s representatives, the words or phrases “should result,” “believe,” “intend,” “plan,” “are expected to,” “targeted,” “will continue,” “will approximate,”
In addition to the commitments set forth in the above table, at October 31, 2010, the Company had $39.2 million in standby letters of credit issued on behalf of the Company. The standby letters of credit are primarily related to the Company’s self-insured workers’ compensation programs.
The Company believes its financial resources, including a revolving credit facility for $300.0 million and anticipated funds from operations, will be adequate to meet all current commitments.
Off-Balance Sheet Arrangements
The Company currently provides a revocable standby letter of credit for $4.8 million to guarantee obligations that may arise under workers compensation claims of an affiliated party. This potential obligation is not reflected on the Company’s Consolidated Statements of Financial Position.
Contractual Obligations and Commercial Commitments
The following table outlines the Company’s future contractual financial obligations as of October 31, 2010 (for additional informa-tion regarding these obligations, see Note G “Long-term Debt and Other Borrowing Arrangements” and Note J “Commitments and Contingencies”):
Payments Due by Periods
Less Than More Than Contractual Obligations (in thousands) Total 1 Year 1-3 Years 3-5 Years 5 Years
Purchase obligations: Hog and turkey commitments (1) $ 3,725,787 $ 1,055,612 $ 1,037,095 $ 580,764 $ 1,052,316 Grain commitments (1) 46,058 41,489 4,569 – – Turkey grow-out contracts (2) 71,616 8,174 13,184 11,549 38,709 Other (3) 123,130 106,313 5,865 1,661 9,291Current maturities of long-term debt 350,000 350,000 – – –Interest payments on long-term debt 23,187 23,187 – – –Capital expenditures (4) 54,892 54,892 – – –Leases 42,226 13,205 15,063 6,642 7,316Other long-term liabilities (5) (6) 52,152 4,027 6,760 6,361 35,004Total Contractual Cash Obligations $ 4,489,048 $ 1,656,899 $ 1,082,536 $ 606,977 $ 1,142,636
(1) In the normal course of business, the Company commits to purchase fixed quantities of livestock and grain from producers to ensure a steady supply of production inputs. Certain of these contracts are based on market prices at the time of delivery, for which the Company has estimated the purchase commitment using current market prices as of October 31, 2010. The Company also utilizes various hedging programs to manage the price risk associated with these commitments. As of October 31, 2010, these hedging programs result in a net increase of $9.8 million in future cash payments associated with the purchase commitments, which is not reflected in the table above.
(2) The Company also utilizes grow-out contracts with independent farmers to raise turkeys for the Company. Under these contracts, the turkeys, feed, and other supplies are owned by the Company. The farmers provide the required labor and facilities, and receive a fee per pound when the turkeys are delivered. Some of the facilities are sub-leased by the Company to the independent farmers. As of October 31, 2010, the Company had approximately 100 active contracts ranging from two to twenty-five years in duration. The grow-out activity is assumed to continue through the term of these active contracts, and amounts in the table represent the Company’s obligation based on turkeys expected to be delivered from these farmers.
(3) Amounts presented for other purchase obligations represent all known open purchase orders and all known contracts exceeding $1.0 million, related to the procurement of materials, supplies, and various services. The Company primarily purchases goods and services on an as-needed basis. Therefore, the amounts in the table represent only a portion of expected future cash expenditures.
(4) Amounts presented for capital expenditures represent only the Company’s current commitments to complete construction in progress at various locations. The Company estimates total capital expenditures for fiscal year 2011 to approximate $120.0 to $130.0 million.
(5) Other long-term liabilities represent payments under the Company’s deferred compensation plans. Excluded from the table above are payments under the Company’s defined benefit pension and other post-retirement benefit plans. (See estimated benefit payments for the next ten fiscal years in Note H “Pension and Other Post-retirement Benefits”)
(6) As discussed in Note I “Income Taxes,” the total liability for unrecognized tax benefits, including interest and penalties, at October 31, 2010, was $38.5 million, which is not included in the table above as the ultimate amount or timing of settlement of the Company’s reserves for income taxes cannot be reasonably estimated.

26
The pathogens which may cause food contamination are found generally in the environment and thus may be present in our products as a result of food processing. These pathogens also can be introduced to our products as a result of improper handling by customers or consumers. We do not have control over proper handling procedures once our products have been shipped for distribution. If one or more of these risks were to materialize, the Company’s brand and business reputation could be negatively impacted. In addition, revenues could decrease, costs of doing business could increase, and the Company’s operating results could be adversely affected.
Deterioration of economic conditions could harm the Company’s business. The Company’s business may be adversely affected by changes in national or global economic conditions, including inflation, interest rates, availability of capital markets, energy availability and costs (including fuel surcharges), and the effects of governmental initiatives to manage economic conditions. Decreases in consumer spend-ing rates and shifts in consumer product preferences could also negatively impact the Company.
The recent volatility in financial markets and the deterioration of national and global economic conditions could impact the Company’s operations as follows:• The financial stability of our customers and suppliers may
be compromised, which could result in additional bad debts for the Company or non-performance by suppliers;
• The value of our investments in debt and equity securities may decline, including most significantly the Company’s trading securities held in an investment portfolio and as part of a rabbi trust to fund supplemental executive retire-ment plans and deferred income plans, and the Company’s assets held in pension plans.
The Company also utilizes hedging programs to reduce its exposure to various commodity market risks, which qualify for hedge accounting for financial reporting purposes. Volatile fluctuations in market conditions could cause these instru-ments to become ineffective, which could require any gains or losses associated with these instruments to be reported in the Company’s earnings each period. These instruments may also limit the Company’s ability to benefit from market gains if commodity prices become more favorable than those that have been secured under the Company’s hedging programs.
Additionally, if a high pathogenic disease outbreak developed in the United States, it may negatively impact the national economy, demand for Company products, and/or the Company’s workforce availability, and the Company’s financial results could suffer. The Company has developed contin-gency plans to address infectious disease scenarios and the potential impact on its operations, and will continue to update these plans as necessary. There can be no assurance given, however, that these plans will be effective in eliminating the negative effects of any such diseases on the Company’s oper-ating results.
“is anticipated,” “estimate,” “project,” or similar expressions are intended to identify forward-looking statements within the mean-ing of the Reform Act. Such statements are subject to certain risks and uncertainties that could cause actual results to differ materi-ally from historical earnings and those anticipated or projected.
In connection with the “safe harbor” provisions of the Reform Act, the Company is identifying risk factors that could affect financial performance and cause the Company’s actual results to differ materially from opinions or statements expressed with respect to future periods. The following discussion of risk factors contains certain cautionary statements regarding the Company’s business, which should be considered by investors and others. The following risk factors should be considered in conjunction with any discussions of operations or results by the Company or its representatives, including any forward-looking discussion, as well as comments contained in press releases, presentations to securities analysts or investors, or other communications by the Company.
In making these statements, the Company is not undertak-ing, and specifically declines to undertake, any obligation to address or update each or any factor in future filings or com-munications regarding the Company’s business or results, and is not undertaking to address how any of these factors may have caused changes to discussions or information contained in previous filings or communications. Though the Company has attempted to list comprehensively these important cautionary risk factors, the Company wishes to caution investors and oth-ers that other factors may in the future prove to be important in affecting the Company’s business or results of operations.
The Company cautions readers not to place undue reliance on forward-looking statements, which represent current views as of the date made. Forward-looking statements are inher-ently at risk to any changes in the national and worldwide economic environment, which could include, among other things, economic conditions, political developments, currency exchange rates, interest and inflation rates, accounting stan-dards, taxes, and laws and regulations affecting the Company and its markets.
Risk Factors
The Company’s operations are subject to the general risks of the food industry. The food products manufacturing industry is subject to the risks posed by:• food spoilage;• food contamination caused by disease-producing organ-
ism or pathogens, such as Listeria monocytogenes, Salmonella, and pathogenic E coli.;
• food allergens;• nutritional and health-related concerns;• federal, state, and local food processing controls;• consumer product liability claims;• product tampering; and• the possible unavailability and/or expense of
liability insurance.

27
assurance given, however, that these plans will be effective in eliminating the negative effects of any such diseases on the Company’s operating results.
Market demand for the Company’s products may fluctuate due to competition from other producers. The Company faces competition from producers of alternative meats and protein sources, including beef, chicken, and fish. The bases on which the Company competes include:• price;• product quality;• brand identification;• breadth of product line; and• customer service.
Demand for the Company’s products is also affected by competitors’ promotional spending and the effectiveness of the Company’s advertising and marketing programs. The Company may be unable to compete successfully on any or all of these bases in the future.
The Company’s operations are subject to the general risks associated with acquisitions. The Company has made several acquisitions in recent years and regularly reviews opportuni-ties for strategic growth through acquisitions. Potential risks associated with acquisitions include the inability to integrate new operations successfully, the diversion of management’s attention from other business concerns, the potential loss of key employees and customers of the acquired companies, the possible assumption of unknown liabilities, potential disputes with the sellers, potential impairment charges if purchase assumptions are not achieved or market conditions decline, and the inherent risks in entering markets or lines of busi-ness in which the Company has limited or no prior experience. Any or all of these risks could impact the Company’s financial results and business reputation. In addition, acquisitions outside the United States may present unique challenges and increase the Company’s exposure to the risks associated with foreign operations.
The Company’s operations are subject to the general risks of litigation. The Company is involved on an ongoing basis in litigation arising in the ordinary course of business. Trends in litigation may include class actions involving competitors, consumers, shareholders, or injured persons, and claims relating to patent infringement, labor, employment, or environmental matters. Litigation trends and the outcome of litigation cannot be predicted with certainty and adverse litigation trends and outcomes could adversely affect the Company’s financial results.
Government regulation, present and future, exposes the Company to potential sanctions and compliance costs that could adversely affect the Company’s business. The Company’s operations are subject to extensive regula-tion by the U.S. Department of Homeland Security, the U.S. Department of Agriculture, the U.S. Food and Drug Administration, federal and state taxing authorities, and other state and local authorities that oversee workforce
Fluctuations in commodity prices of pork, poultry, and feed ingredients could harm the Company’s earnings. The Company’s results of operations and financial condition are largely dependent upon the cost and supply of pork, poultry, and feed grains as well as the selling prices for many of our products, which are determined by constantly changing mar-ket forces of supply and demand.
The live hog industry has evolved to very large, vertically inte-grated, year-round confinement operations operating under long-term supply agreements. This has resulted in fewer hogs being available on the cash spot market. Additionally, overall hog production in the U.S. has declined. The decrease in the supply of hogs could diminish the utilization of harvest and production facilities and increase the cost of the raw materials they produce. Consequently, the Company uses long-term supply contracts to ensure a stable supply of raw materials while minimizing extreme fluctuations in costs over the long term. This may result, in the short term, in costs for live hogs that are higher than the cash spot market depending on the relationship of the cash spot market to contract prices. Market-based pricing on certain product lines, and lead time required to implement pricing adjustments, may prevent these cost increases from being recovered, and these higher costs could adversely affect our short-term financial results.
Jennie-O Turkey Store raises turkeys and also contracts with turkey growers to meet its raw material requirements for whole birds and processed turkey products. Additionally, the Company owns various hog raising facilities that supplement its supply of raw materials. Results in these operations are affected by the cost and supply of feed grains, which fluctuate due to climate conditions, production forecasts, and sup-ply and demand conditions at local, regional, national, and worldwide levels. The Company attempts to manage some of its short-term exposure to fluctuations in feed prices by forward buying, using futures contracts, and pursuing pricing advances. However, these strategies may not be adequate to overcome sustained increases in market prices due to alternate uses for feed grains or other systemic changes in the industry.
Outbreaks of disease among livestock and poultry flocks could harm the Company’s revenues and operating margins. The Company is subject to risks associated with the outbreak of disease in pork and beef livestock, and poultry flocks, including Bovine Spongiform Encephalopathy (BSE), pneumo-virus, Porcine Circovirus 2 (PCV2), Porcine Reproduction & Respiratory Syndrome (PRRS), Foot-and-Mouth Disease (FMD), and Avian Influenza. The outbreak of disease could adversely affect the Company’s supply of raw materials, increase the cost of production, and reduce operating mar-gins. Additionally, the outbreak of disease may hinder the Company’s ability to market and sell products both domesti-cally and internationally. The Company has developed busi-ness continuity plans for various disease scenarios and will continue to update these plans as necessary. There can be no

28
Deterioration of labor relations or increases in labor costs could harm the Company’s business. The Company has approximately 19,300 domestic and foreign employees, of which approximately 5,500 are represented by labor unions, principally the United Food and Commercial Workers’ Union. A significant increase in labor costs or a deterioration of labor relations at any of the Company’s facilities that results in work slowdowns or stoppages could harm the Company’s financial results. Union contracts at the Company’s facilities in Algona, Iowa; Atlanta, Georgia; Austin, Minnesota; Beloit, Wisconsin; Fremont, Nebraska; and San Leandro, California, will expire during fiscal 2011, covering a combined total of approximately 3,300 employees. Negotiations at these facili-ties have not yet been initiated.
Quantitative and Qualitative Disclosure About Market RisksHog Markets: The Company’s earnings are affected by fluctuations in the live hog market. To minimize the impact on earnings, and to ensure a steady supply of quality hogs, the Company has entered into contracts with producers for the purchase of hogs at formula-based prices over periods up to 10 years. Purchased hogs under contract accounted for 94 percent and 93 percent of the total hogs purchased by the Company in fiscal years 2010 and 2009, respectively. The majority of these contracts use market-based formulas based on hog futures, hog primal values, or industry reported hog markets. Under normal, long-term market conditions, changes in the cash hog market are offset by proportional changes in primal values. Therefore, a hypothetical 10 percent change in the cash hog market would have had an immaterial effect on the Company’s results of operations.
Certain procurement contracts allow for future hog deliver-ies (firm commitments) to be forward priced. The Company generally hedges these firm commitments by using hog futures contracts. These futures contracts are designated and accounted for as fair value hedges. The change in the market value of such futures contracts is highly effective at offset-ting changes in price movements of the hedged item, and the Company evaluates the effectiveness of the contracts on a regular basis. Changes in the fair value of the futures con-tracts, along with the gain or loss on the firm commitment, are marked-to-market through earnings and are recorded on the Consolidated Statement of Financial Position as a current asset and liability, respectively. The fair value of the Company’s open futures contracts as of October 31, 2010, was $0.6 million compared to $(1.8) million as of October 25, 2009.
immigration laws, tax regulations, food safety standards, and the processing, packaging, storage, distribution, advertis-ing, and labeling of the Company’s products. The Company’s manufacturing facilities and products are subject to constant inspection by federal, state, and local authorities. Claims or enforcement proceedings could be brought against the Company in the future. Additionally, the Company is subject to new or modified laws, regulations, and accounting stan-dards. The Company’s failure or inability to comply with such requirements could subject the Company to civil remedies, including fines, injunctions, recalls, or seizures, as well as potential criminal sanctions.
The Company is subject to stringent environmental regula-tion and potentially subject to environmental litigation, proceedings, and investigations. The Company’s past and present business operations and ownership and operation of real property are subject to stringent federal, state, and local environmental laws and regulations pertaining to the discharge of materials into the environment, and the handling and disposition of wastes (including solid and hazardous wastes) or otherwise relating to protection of the environ-ment. Compliance with these laws and regulations, and the ability to comply with any modifications to these laws and regulations, is material to the Company’s business. New mat-ters or sites may be identified in the future that will require additional investigation, assessment, or expenditures. In addition, some of the Company’s facilities have been in opera-tion for many years and, over time, the Company and other prior operators of these facilities may have generated and disposed of wastes that now may be considered hazardous. Future discovery of contamination of property underlying or in the vicinity of the Company’s present or former properties or manufacturing facilities and/or waste disposal sites could require the Company to incur additional expenses. The occur-rence of any of these events, the implementation of new laws and regulations, or stricter interpretation of existing laws or regulations, could adversely affect the Company’s financial results.
The Company’s foreign operations pose additional risks to the Company’s business. The Company operates its business and markets its products internationally. The Company’s foreign operations are subject to the risks described above, as well as risks related to fluctuations in currency values, foreign currency exchange controls, compliance with for-eign laws, and other economic or political uncertainties. International sales are subject to risks related to general economic conditions, imposition of tariffs, quotas, trade barri-ers and other restrictions, enforcement of remedies in foreign jurisdictions and compliance with applicable foreign laws, and other economic and political uncertainties. All of these risks could result in increased costs or decreased revenues, which could adversely affect the Company’s financial results.
29
The Company measures its market risk exposure on its natu-ral gas contracts using a sensitivity analysis, which considers a hypothetical 10 percent change in the market prices for natural gas. A 10 percent decrease in the market price for natural gas would have negatively impacted the fair value of the Company’s October 31, 2010, open natural gas contracts by $0.7 million, which in turn would lower the Company’s future cost on natural gas purchases by a similar amount.
Long-Term Debt: A principal market risk affecting the Company is the exposure to changes in interest rates on the Company’s fixed-rate, long-term debt. Market risk for fixed-rate, long-term debt is estimated as the potential increase in fair value, resulting from a hypothetical 10 percent decrease in interest rates, and amounts to approximately $0.1 million. The fair value of the Company’s long-term debt (including current maturities) was estimated using discounted future cash flows based on the Company’s incremental borrowing rates for similar types of borrowing arrangements.
Investments: The Company holds trading securities as part of a rabbi trust to fund certain supplemental executive retirement plans and deferred income plans, and as part of an investment portfolio. As of October 31, 2010, the balance of these securities totaled $159.7 million. A portion of these securities represent fixed income funds. The Company is subject to market risk due to fluctuations in the value of the remaining investments, as unrealized gains and losses asso-ciated with these securities are included in the Company’s net earnings on a mark-to-market basis. A 10 percent decline in the value of the investments not held in fixed income funds would have a direct negative impact to the Company’s pretax earnings of approximately $10.0 million, while a 10 percent increase in value would have a positive impact of the same amount.
International: The fair values of certain Company assets are subject to fluctuations in foreign currencies. The Company’s net asset position in foreign currencies as of October 31, 2010, was $140.9 million, compared to $128.7 million as of October 25, 2009, with most of the exposure existing in Philippine pesos and Chinese yuan. Changes in currency exchange rates impact the fair values of Company assets either currently through the Consolidated Statement of Operations, as cur-rency gains/losses, or by affecting other comprehensive loss.
The Company measures its foreign currency exchange risk by using a 10 percent sensitivity analysis on the Company’s primary foreign net asset position, the Philippine peso, as of October 31, 2010. A 10 percent strengthening in the value of the peso relative to the U.S. dollar would result in other com-prehensive income of $6.4 million pretax. A 10 percent weak-ening in the value of the peso relative to the U.S. dollar would result in other comprehensive loss of the same amount.
The Company measures its market risk exposure on its hog futures contracts using a sensitivity analysis, which consid-ers a hypothetical 10 percent change in market prices. A 10 percent increase in market prices would have negatively impacted the fair value of the Company’s October 31, 2010, open contracts by $8.6 million, which in turn would lower the Company’s future cost of purchased hogs by a similar amount.
Turkey and Hog Production Costs: The Company raises or contracts for live turkeys and hogs to meet some of its raw material supply requirements. Production costs in raising turkeys and hogs are subject primarily to fluctuations in feed prices, and to a lesser extent, fuel costs. Under normal, long-term market conditions, changes in the cost to produce turkeys and hogs are offset by proportional changes in their respective markets.
To reduce the Company’s exposure to changes in grain prices, the Company utilizes a hedge program to offset the fluctua-tion in the Company’s future direct grain purchases. This program utilizes corn and soybean meal futures and swaps, and these contracts are accounted for under cash flow hedge accounting. The open contracts are reported at their fair value with an unrealized gain of $46.4 million, before tax, on the Consolidated Statement of Financial Position as of October 31, 2010, compared to an unrealized loss of $3.0 million, before tax, as of October 25, 2009.
The Company measures its market risk exposure on its grain futures contracts and swaps using a sensitivity analysis, which considers a hypothetical 10 percent change in the mar-ket prices for grain. A 10 percent decrease in the market price for grain would have negatively impacted the fair value of the Company’s October 31, 2010, open grain contracts by $18.4 million, which in turn would lower the Company’s future cost on purchased grain by a similar amount.
Natural Gas: Production costs at the Company’s plants and feed mills are also subject to fluctuations in fuel costs. To reduce the Company’s exposure to changes in natural gas prices, the Company utilizes a hedge program to offset the fluctuation in the Company’s future natural gas purchases. This program utilizes natural gas swaps, and these contracts are accounted for under cash flow hedge accounting. The open contracts are reported at their fair value with an unre-alized loss of $6.4 million, before tax, on the Consolidated Statement of Financial Position as of October 31, 2010, com-pared to an unrealized loss of $10.9 million, before tax, as of October 25, 2009.
30
Management’s Responsibility for Financial Statements
The accompanying financial statements were prepared by the management of Hormel Foods Corporation which is respon-sible for their integrity and objectivity. These statements have been prepared in accordance with U.S. generally accepted accounting principles appropriate in the circumstances and, as such, include amounts that are based on our best esti-mates and judgments.
Hormel Foods Corporation has developed a system of inter-nal controls designed to assure that the records reflect the transactions of the Company and that the established policies and procedures are adhered to. This system is augmented by well-communicated written policies and procedures, a strong program of internal audit, and well-qualified personnel.
These financial statements have been audited by Ernst & Young LLP, an independent registered public accounting firm, and their report is included herein. The audit was conducted in accordance with the Public Company Accounting Oversight Board (United States) and includes a review of the Company’s accounting and financial controls and tests of transactions.
The Audit Committee of the Board of Directors, composed solely of outside directors, meets periodically with the independent auditors, management, and the internal audi-tors to assure that each is carrying out its responsibilities. Both Ernst & Young LLP and our internal auditors have full and free access to the Audit Committee, with or without the presence of management, to discuss the results of their audit work and their opinions on the adequacy of internal controls and the quality of financial reporting.
Report of Management
Management’s Report on Internal Control Over Financial Reporting
Management of Hormel Foods Corporation is responsible for establishing and maintaining adequate internal control over financial reporting for the Company, as such term is defined in Exchange Act Rule 13a–15(f). The Company’s internal control system is designed to provide reasonable assur-ance regarding the reliability of financial reporting and the preparation of financial statements for external purposes in accordance with generally accepted accounting standards. Under the supervision, and with the participation of manage-ment, including the chief executive officer and chief financial officer, we conducted an evaluation of the effectiveness of our internal control over financial reporting based on the frame-work in Internal Control – Integrated Framework issued by the Committee of Sponsoring Organizations of the Treadway Commission.
Based on our evaluation under the framework in Internal Control – Integrated Framework, we concluded that our inter-nal control over financial reporting was effective as of October 31, 2010. Our internal control over financial reporting as of October 31, 2010, has been audited by Ernst & Young LLP, an independent registered public accounting firm, as stated in their report which is included herein.
Jeffrey M. Ettinger Chairman of the Board, President and Chief Executive Officer
Jody H. Feragen Executive Vice President and Chief Financial Officer

31
principles, and that receipts and expenditures of the company are being made only in accordance with authorizations of management and directors of the company; and (3) provide reasonable assurance regarding prevention or timely detec-tion of unauthorized acquisition, use or disposition of the company’s assets that could have a material effect on the financial statements.
Because of its inherent limitations, internal control over financial reporting may not prevent or detect misstatements. Also, projections of any evaluation of effectiveness to future periods are subject to the risk that controls may become inad-equate because of changes in conditions, or that the degree of compliance with the policies or procedures may deteriorate.
In our opinion, Hormel Foods Corporation maintained, in all material respects, effective internal control over financial reporting as of October 31, 2010, based on the COSO criteria.
We also have audited, in accordance with the standards of the Public Company Accounting Oversight Board (United States), the consolidated statements of financial position of Hormel Foods Corporation as of October 31, 2010, and October 25, 2009, and the related consolidated statements of operations, changes in shareholders’ investment, and cash flows for each of the three years in the period ended October 31, 2010, and our report dated December 21, 2010, expressed an unquali-fied opinion thereon.
Minneapolis, Minnesota December 21, 2010
To the Board of Directors and Shareholders Hormel Foods Corporation Austin, Minnesota
We have audited Hormel Foods Corporation’s internal control over financial reporting as of October 31, 2010, based on criteria established in Internal Control–Integrated Framework issued by the Committee of Sponsoring Organizations of the Treadway Commission (the COSO criteria). Hormel Foods Corporation’s management is responsible for maintaining effective internal control over financial reporting, and for its assessment of the effectiveness of internal control over financial reporting included in the accompanying Report of Management entitled Management’s Report on Internal Control Over Financial Reporting. Our responsibility is to express an opinion on the company’s internal control over financial reporting based on our audit.
We conducted our audit in accordance with the standards of the Public Company Accounting Oversight Board (United States). Those standards require that we plan and perform the audit to obtain reasonable assurance about whether effective internal control over financial reporting was maintained in all material respects. Our audit included obtaining an understand-ing of internal control over financial reporting, assessing the risk that a material weakness exists, testing and evaluating the design and operating effectiveness of internal control based on the assessed risk, and performing such other procedures as we considered necessary in the circumstances. We believe that our audit provides a reasonable basis for our opinion.
A company’s internal control over financial reporting is a process designed to provide reasonable assurance regard-ing the reliability of financial reporting and the preparation of financial statements for external purposes in accordance with generally accepted accounting principles. A company’s internal control over financial reporting includes those policies and procedures that (1) pertain to the maintenance of records that, in reasonable detail, accurately and fairly reflect the transactions and dispositions of the assets of the company; (2) provide reasonable assurance that transactions are recorded as necessary to permit preparation of financial statements in accordance with generally accepted accounting
Report of Independent Registered Public Accounting Firm
32
As discussed in Note H of the Notes to Consolidated Financial Statements, effective October 27, 2008, the Company adopted the measurement provisions of Statement of Financial Accounting Standard No. 158, “Employers’ Accounting for Defined Benefit Pension and Other Postretirement Plans – an amendment of FASB Statements No. 87, 88, 106 and 132(R)” (codified primarily in FASB ASC 715). As discussed in Note A of the Notes to Consolidated Financial Statements, effective October 26, 2009, the Company adopted new rules regarding the accounting for non-controlling interests (codified primar-ily in FASB ASC 810).
We also have audited, in accordance with the standards of the Public Company Accounting Oversight Board (United States), Hormel Foods Corporation’s internal control over financial reporting as of October 31, 2010, based on criteria established in Internal Control-Integrated Framework issued by the Committee of Sponsoring Organizations of the Treadway Commission and our report dated December 21, 2010, expressed an unqualified opinion thereon.
Minneapolis, Minnesota December 21, 2010
To the Board of Directors and Shareholders Hormel Foods Corporation Austin, Minnesota
We have audited the accompanying consolidated state-ments of financial position of Hormel Foods Corporation as of October 31, 2010, and October 25, 2009, and the related consolidated statements of operations, changes in sharehold-ers’ investment, and cash flows for each of the three years in the period ended October 31, 2010. These financial state-ments are the responsibility of the Company’s management. Our responsibility is to express an opinion on these financial statements based on our audits.
We conducted our audits in accordance with the standards of the Public Company Accounting Oversight Board (United States). Those standards require that we plan and perform the audit to obtain reasonable assurance about whether the finan-cial statements are free of material misstatement. An audit includes examining, on a test basis, evidence supporting the amounts and disclosures in the financial statements. An audit also includes assessing the accounting principles used and significant estimates made by management, as well as evalu-ating the overall financial statement presentation. We believe that our audits provide a reasonable basis for our opinion.
In our opinion, the financial statements referred to above present fairly, in all material respects, the consolidated financial position of Hormel Foods Corporation at October 31, 2010, and October 25, 2009, and the consolidated results of its operations and its cash flows for each of the three years in the period ended October 31, 2010, in conformity with U.S. gener-ally accepted accounting principles.
Report of Independent Registered Public Accounting Firm

33
Consolidated Statements of Financial Position
(in thousands) October 31, 2010 October 25, 2009
AssetsCurrent Assets Cash and cash equivalents $ 467,845 $ 385,252 Short-term marketable securities 50,595 0 Accounts receivable (net of allowance for doubtful accounts of $4,000 at October 31, 2010 and $4,064 at October 25, 2009) 430,939 372,292 Inventories 793,771 722,371 Income taxes receivable 8,525 0 Deferred income taxes 70,703 66,435 Prepaid expenses 12,153 9,130 Other current assets 23,635 19,253 Total Current Assets 1,858,166 1,574,733Deferred Income Taxes 72,426 122,007Goodwill 629,023 620,155Other Intangibles 141,522 140,854Pension Assets 61,272 29,663Investments in and Receivables from Affiliates 214,389 86,599Other Assets 155,017 165,331Property, Plant and Equipment Land 54,017 52,952 Buildings 729,718 723,553 Equipment 1,358,237 1,317,845 Construction in progress 45,283 41,722 2,187,255 2,136,072 Less allowance for depreciation (1,265,152) (1,183,359) 922,103 952,713Total Assets $ 4,053,918 $ 3,692,055
Liabilities and Shareholders’ InvestmentCurrent Liabilities Accounts payable $ 361,287 $ 313,258 Accrued expenses 46,408 40,289 Accrued workers compensation 33,022 29,421 Accrued marketing expenses 76,552 70,452 Employee related expenses 187,116 181,531 Taxes payable 9,339 15,127 Interest and dividends payable 37,489 34,951 Current maturities of long-term debt 350,000 0 Total Current Liabilities 1,101,213 685,029Long-Term Debt — less current maturities 0 350,000Pension and Post-Retirement Benefits 454,998 429,800Other Long-Term Liabilities 91,068 102,905Shareholders’ Investment Preferred stock, par value $.01 a share — authorized 80,000,000 shares; issued — none Common stock, nonvoting, par value $.01 a share — authorized 200,000,000 shares; issued — none Common stock, par value $.0586 a share — authorized 400,000,000 shares; issued 132,981,540 shares October 31, 2010 issued 133,593,719 shares October 25, 2009 7,793 7,828 Accumulated other comprehensive loss (175,910) (203,610) Retained earnings 2,568,774 2,318,390 Hormel Foods Corporation Shareholders’ Investment 2,400,657 2,122,608 Noncontrolling Interest 5,982 1,713 Total Shareholders’ Investment 2,406,639 2,124,321 Total Liabilities and Shareholders’ Investment $ 4,053,918 $ 3,692,055
See Notes to Consolidated Financial Statements.
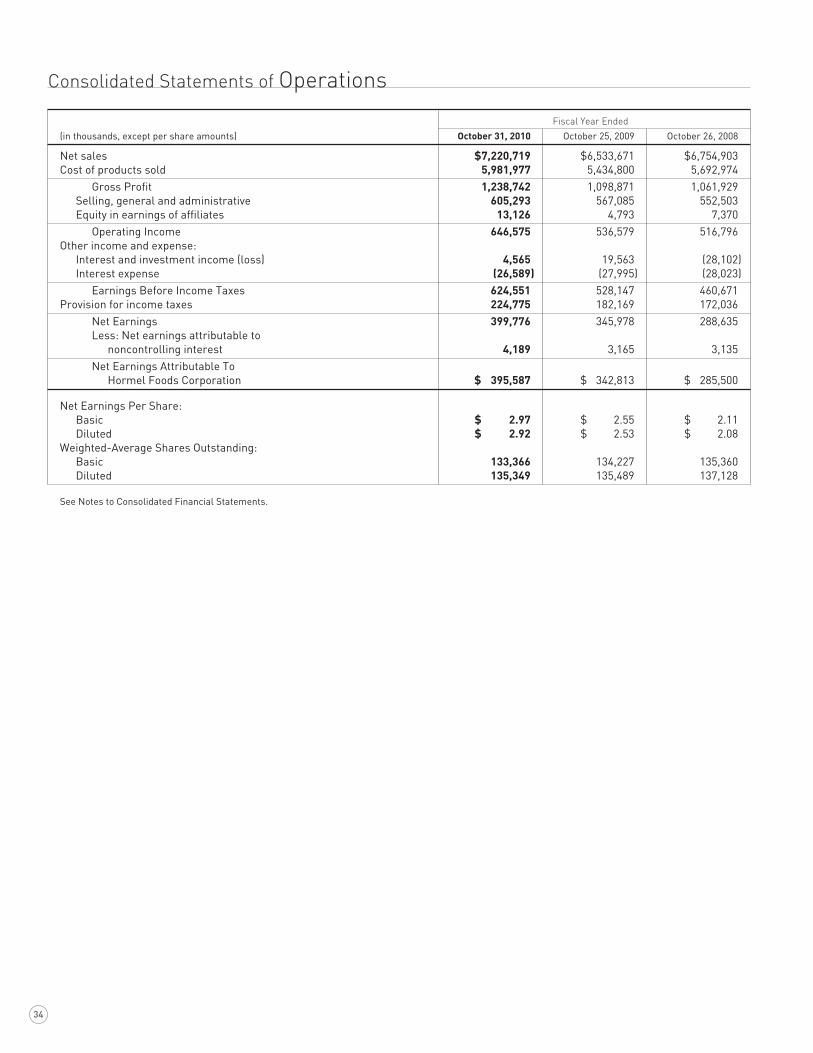
34
Consolidated Statements of Operations
Fiscal Year Ended
(in thousands, except per share amounts) October 31, 2010 October 25, 2009 October 26, 2008
Net sales $7,220,719 $6,533,671 $6,754,903Cost of products sold 5,981,977 5,434,800 5,692,974 Gross Profit 1,238,742 1,098,871 1,061,929 Selling, general and administrative 605,293 567,085 552,503 Equity in earnings of affiliates 13,126 4,793 7,370 Operating Income 646,575 536,579 516,796Other income and expense: Interest and investment income (loss) 4,565 19,563 (28,102) Interest expense (26,589) (27,995) (28,023) Earnings Before Income Taxes 624,551 528,147 460,671Provision for income taxes 224,775 182,169 172,036 Net Earnings 399,776 345,978 288,635 Less: Net earnings attributable to noncontrolling interest 4,189 3,165 3,135 Net Earnings Attributable To Hormel Foods Corporation $ 395,587 $ 342,813 $ 285,500
Net Earnings Per Share: Basic $ 2.97 $ 2.55 $ 2.11 Diluted $ 2.92 $ 2.53 $ 2.08Weighted-Average Shares Outstanding: Basic 133,366 134,227 135,360 Diluted 135,349 135,489 137,128
See Notes to Consolidated Financial Statements.
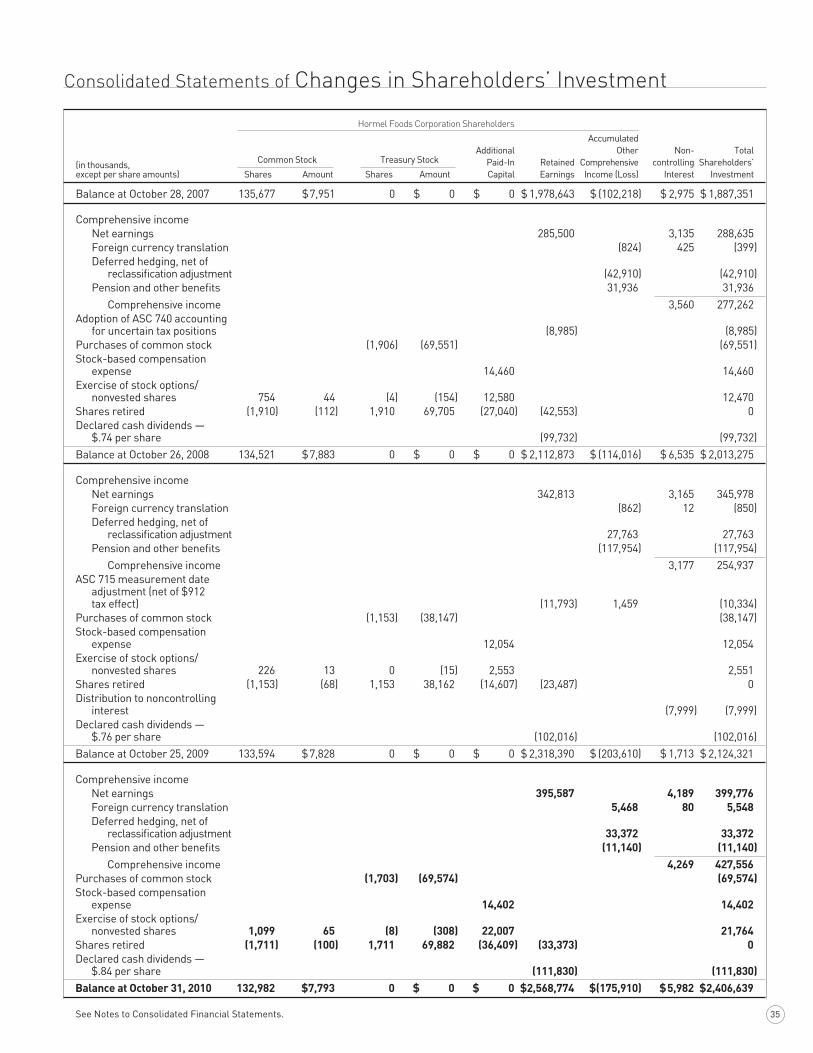
35
Consolidated Statements of Changes in Shareholders’ Investment
Hormel Foods Corporation Shareholders
Accumulated Additional Other Non- Total
(in thousands, Common Stock Treasury Stock Paid-In Retained Comprehensive controlling Shareholders’except per share amounts) Shares Amount Shares Amount Capital Earnings Income (Loss) Interest Investment
Balance at October 28, 2007 135,677 $ 7,951 0 $ 0 $ 0 $ 1,978,643 $ (102,218) $ 2,975 $ 1,887,351
Comprehensive income Net earnings 285,500 3,135 288,635 Foreign currency translation (824) 425 (399) Deferred hedging, net of reclassification adjustment (42,910) (42,910) Pension and other benefits 31,936 31,936 Comprehensive income 3,560 277,262Adoption of ASC 740 accounting for uncertain tax positions (8,985) (8,985)Purchases of common stock (1,906) (69,551) (69,551)Stock-based compensation expense 14,460 14,460Exercise of stock options/ nonvested shares 754 44 (4) (154) 12,580 12,470Shares retired (1,910) (112) 1,910 69,705 (27,040) (42,553) 0Declared cash dividends — $.74 per share (99,732) (99,732)Balance at October 26, 2008 134,521 $ 7,883 0 $ 0 $ 0 $ 2,112,873 $ (114,016) $ 6,535 $ 2,013,275
Comprehensive income Net earnings 342,813 3,165 345,978 Foreign currency translation (862) 12 (850) Deferred hedging, net of reclassification adjustment 27,763 27,763 Pension and other benefits (117,954) (117,954) Comprehensive income 3,177 254,937ASC 715 measurement date adjustment (net of $912 tax effect) (11,793) 1,459 (10,334)Purchases of common stock (1,153) (38,147) (38,147)Stock-based compensation expense 12,054 12,054Exercise of stock options/ nonvested shares 226 13 0 (15) 2,553 2,551Shares retired (1,153) (68) 1,153 38,162 (14,607) (23,487) 0Distribution to noncontrolling interest (7,999) (7,999)Declared cash dividends — $.76 per share (102,016) (102,016)Balance at October 25, 2009 133,594 $ 7,828 0 $ 0 $ 0 $ 2,318,390 $ (203,610) $ 1,713 $ 2,124,321
Comprehensive income Net earnings 395,587 4,189 399,776 Foreign currency translation 5,468 80 5,548 Deferred hedging, net of reclassification adjustment 33,372 33,372 Pension and other benefits (11,140) (11,140) Comprehensive income 4,269 427,556Purchases of common stock (1,703) (69,574) (69,574)Stock-based compensation expense 14,402 14,402Exercise of stock options/ nonvested shares 1,099 65 (8) (308) 22,007 21,764Shares retired (1,711) (100) 1,711 69,882 (36,409) (33,373) 0Declared cash dividends — $.84 per share (111,830) (111,830)Balance at October 31, 2010 132,982 $7,793 0 $ 0 $ 0 $2,568,774 $(175,910) $ 5,982 $2,406,639
See Notes to Consolidated Financial Statements.
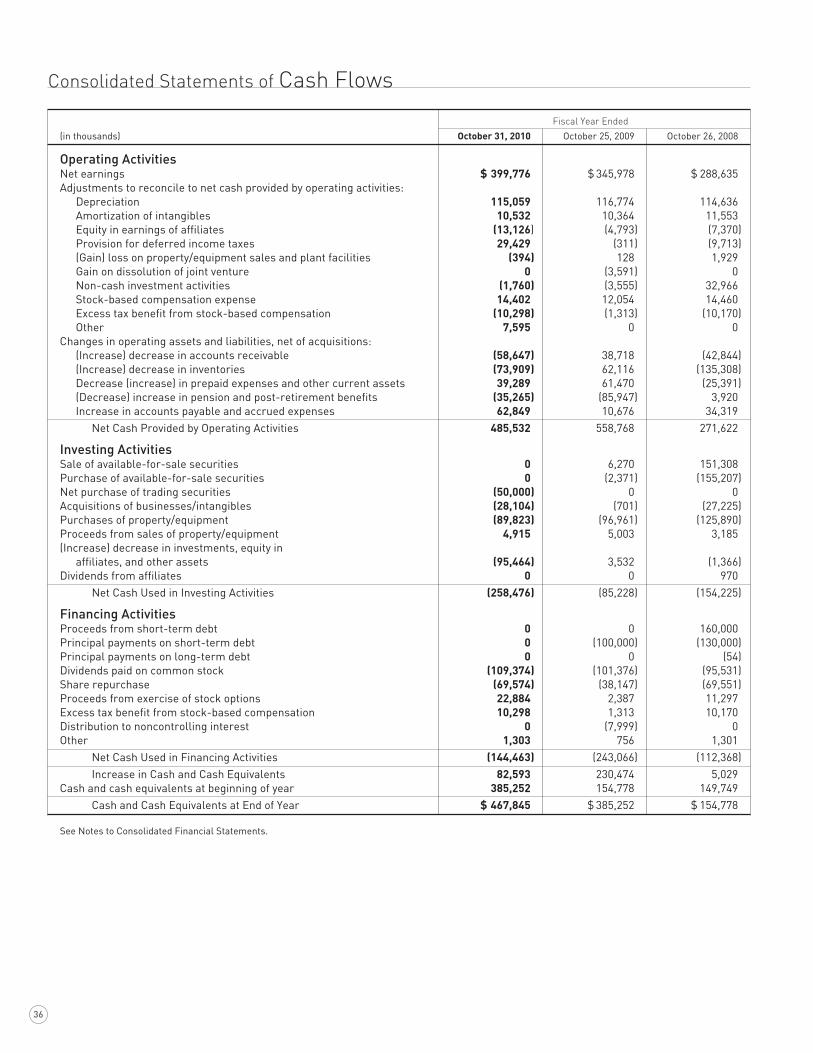
36
Consolidated Statements of Cash Flows
Fiscal Year Ended
(in thousands) October 31, 2010 October 25, 2009 October 26, 2008
Operating Activities Net earnings $ 399,776 $ 345,978 $ 288,635Adjustments to reconcile to net cash provided by operating activities: Depreciation 115,059 116,774 114,636 Amortization of intangibles 10,532 10,364 11,553 Equity in earnings of affiliates (13,126) (4,793) (7,370) Provision for deferred income taxes 29,429 (311) (9,713) (Gain) loss on property/equipment sales and plant facilities (394) 128 1,929 Gain on dissolution of joint venture 0 (3,591) 0 Non-cash investment activities (1,760) (3,555) 32,966 Stock-based compensation expense 14,402 12,054 14,460 Excess tax benefit from stock-based compensation (10,298) (1,313) (10,170) Other 7,595 0 0Changes in operating assets and liabilities, net of acquisitions: (Increase) decrease in accounts receivable (58,647) 38,718 (42,844) (Increase) decrease in inventories (73,909) 62,116 (135,308) Decrease (increase) in prepaid expenses and other current assets 39,289 61,470 (25,391) (Decrease) increase in pension and post-retirement benefits (35,265) (85,947) 3,920 Increase in accounts payable and accrued expenses 62,849 10,676 34,319 Net Cash Provided by Operating Activities 485,532 558,768 271,622
Investing Activities Sale of available-for-sale securities 0 6,270 151,308Purchase of available-for-sale securities 0 (2,371) (155,207)Net purchase of trading securities (50,000) 0 0Acquisitions of businesses/intangibles (28,104) (701) (27,225)Purchases of property/equipment (89,823) (96,961) (125,890)Proceeds from sales of property/equipment 4,915 5,003 3,185(Increase) decrease in investments, equity in affiliates, and other assets (95,464) 3,532 (1,366)Dividends from affiliates 0 0 970 Net Cash Used in Investing Activities (258,476) (85,228) (154,225)
Financing Activities Proceeds from short-term debt 0 0 160,000Principal payments on short-term debt 0 (100,000) (130,000)Principal payments on long-term debt 0 0 (54)Dividends paid on common stock (109,374) (101,376) (95,531)Share repurchase (69,574) (38,147) (69,551)Proceeds from exercise of stock options 22,884 2,387 11,297Excess tax benefit from stock-based compensation 10,298 1,313 10,170Distribution to noncontrolling interest 0 (7,999) 0Other 1,303 756 1,301 Net Cash Used in Financing Activities (144,463) (243,066) (112,368) Increase in Cash and Cash Equivalents 82,593 230,474 5,029Cash and cash equivalents at beginning of year 385,252 154,778 149,749 Cash and Cash Equivalents at End of Year $ 467,845 $ 385,252 $ 154,778
See Notes to Consolidated Financial Statements.
37
Note ASUMMARY OF SIGNIFICANT ACCOUNTING POLICIES
Principles of Consolidation: The consolidated financial state-ments include the accounts of Hormel Foods Corporation (the Company) and all of its majority-owned subsidiaries after elimination of intercompany accounts, transactions, and profits.
Reclassifications: Certain reclassifications of previously reported amounts have been made to conform to the current year presentation and to conform with recent accounting pro-nouncements and guidance. The impact of these reclassifica-tions on net earnings and operating cash flows are discussed below under “Accounting Changes and Recent Accounting Pronouncements.” The reclassifications had no impact on net earnings per share as previously reported.
Use of Estimates: The preparation of financial statements in conformity with U.S. generally accepted accounting principles requires management to make estimates and assumptions that affect the amounts reported in the financial statements and accompanying notes. Actual results could differ from those estimates.
Fiscal Year: The Company’s fiscal year ends on the last Sunday in October. Fiscal year 2010 consisted of 53 weeks and fiscal years 2009 and 2008 consisted of 52 weeks.
Cash and Cash Equivalents: The Company considers all investments with an original maturity of three months or less on their acquisition date to be cash equivalents. The Company’s cash equivalents as of October 31, 2010, and October 25, 2009, consisted entirely of money market funds rated AAA.
Fair Value Measurements: Pursuant to the provisions of Accounting Standards Codification (ASC) 820, Fair Value Measurements and Disclosures (ASC 820), the Company measures certain assets and liabilities at fair value or discloses the fair value of certain assets and liabilities recorded at cost in the consolidated financial statements. Fair value is calculated as the price that would be received to sell an asset or paid to transfer a liability in an orderly transaction between market participants at the measure-ment date (an exit price). ASC 820 establishes a fair value hierarchy which requires assets and liabilities measured at fair value to be categorized into one of three levels based on the inputs used in the valuation. The Company classifies assets and liabilities in their entirety based on the lowest level of input significant to the fair value measurement. The three levels are defined as follows:
Notes to Consolidated Financial Statements October 31, 2010
Level 1: Observable inputs based on quoted prices (unad-justed) in active markets for identical assets or liabilities.
Level 2: Observable inputs, other than those included in Level 1, based on quoted prices for similar assets and liabilities in active markets, or quoted prices for identical assets and liabilities in inactive markets.
Level 3: Unobservable inputs that reflect an entity’s own assumptions about what inputs a market participant would use in pricing the asset or liability based on the best infor-mation available in the circumstances.
See additional discussion regarding the Company’s fair value measurements in Notes H, L, and M.
Investments: The Company maintains a rabbi trust to fund certain supplemental executive retirement plans and deferred income plans, which is included in other assets on the Consolidated Statements of Financial Position. The securities held by the trust are classified as trading securi-ties. Therefore, unrealized gains and losses associated with these investments are included in the Company’s earnings. Gains related to securities still held by the trust were $5.4 million for the fiscal year ended October 31, 2010, compared to $15.3 million for the fiscal year ended October 25, 2009. The Company has transitioned the majority of this portfolio to more fixed return investments to reduce the exposure to volatility in equity markets going forward.
The Company also holds securities as part of an investment portfolio, which are classified as short-term marketable securities on the Consolidated Statements of Financial Position. These investments are also trading securities. Therefore, unrealized gains and losses are included in the Company’s earnings. The Company recorded a gain of $0.6 million related to these investments for the fiscal year ended October 31, 2010.
Inventories: Inventories are stated at the lower of cost or market. Cost is determined principally under the average cost method.
Property, Plant and Equipment: Property, plant and equip-ment are stated at cost. The Company generally uses the straight-line method in computing depreciation. The annual provisions for depreciation have been computed principally using the following ranges of asset lives: buildings 20 to 40 years, machinery and equipment 5 to 10 years.
Software development and implementation costs are expensed until the Company has determined that the software will result in probable future economic benefits, and manage-ment has committed to funding the project. Thereafter, all qualified external implementation costs and purchased soft-ware costs are capitalized and amortized using the straight-line method over the remaining estimated useful lives, not exceeding five years.
38
Goodwill and Other Intangibles: Goodwill and other intangible assets are originally recorded at their estimated fair values at date of acquisition and are allocated to reporting units that will receive the related sales and income. The Company’s reporting units represent operating segments (aggregations of business units that have similar economic characteristics and share the same production facilities, raw materials, and labor force). Definite-lived intangible assets are amortized over their estimated useful lives and are evaluated for impair-ment annually, or more frequently if impairment indicators are present, using a process similar to that used to test long-lived assets for impairment. Goodwill and indefinite-lived intangible assets are tested annually for impairment, or more frequently if impairment indicators arise.
The goodwill impairment test is a two-step process performed at the reporting unit level. First, the fair value of each reporting unit is compared to its corresponding carrying value, includ-ing goodwill. The fair value of each reporting unit is estimated using discounted cash flow valuations (Level 3), which incorpo-rate assumptions regarding future growth rates, terminal val-ues, and discount rates. The estimates and assumptions used consider historical performance and are consistent with the assumptions used in determining future profit plans for each reporting unit, which are approved by the Company’s Board of Directors. If the first step results in the carrying value exceed-ing the fair value of any reporting unit, then a second step must be completed in order to determine the amount of goodwill impairment that should be recorded. In the second step, the implied fair value of the reporting unit’s goodwill is determined by allocating the reporting unit’s fair value to all of its assets and liabilities other than goodwill in a manner similar to a pur-chase price allocation. The resulting implied fair value of the goodwill that results from the application of this second step is then compared to the carrying amount of the goodwill and an impairment charge is recorded for the difference. Performance of the second step was not required for any of the Company’s reporting units for fiscal 2010, and no goodwill impairment charges were recorded.
Impairment testing for indefinite-lived intangible assets also compares the fair value and carrying value of the intangible asset. The fair value of indefinite-lived intangible assets is primarily determined on the basis of estimated discounted value, using the relief from royalty method (Level 3), which incorporates assumptions regarding future sales projections and discount rates. If the carrying value exceeds fair value, the indefinite-lived intangible asset is considered impaired and an impairment charge is recorded for the difference. No material impairment charges were recorded for indefinite-lived intangible assets for fiscal 2010.
Impairment of Long-lived Assets: The Company reviews long-lived assets and definite-lived intangible assets for impairment annually, or more frequently when events or changes in circumstances indicate that the carrying amount of an asset may not be recoverable. If impairment indicators are present and the estimated future undiscounted cash flows are less than the carrying value of the assets and any related
goodwill, the carrying value is reduced to the estimated fair value. During the second quarter of fiscal 2010, the Company made the decision to close its Valley Fresh plant in Turlock, California. The facilities in that location were evaluated during that process and the Company recorded a pretax charge of $6.6 million to reduce the property, plant, and equipment to its current estimated fair value. No other material write-downs were recorded in fiscal years 2010, 2009, or 2008.
Foreign Currency Translation: Assets and liabilities denomi-nated in foreign currency are translated at the current exchange rate as of the statement of financial position date, and amounts in the statement of operations are translated at the average monthly exchange rate. Translation adjustments resulting from fluctuations in exchange rates are recorded as a component of accumulated other comprehensive loss in shareholders’ investment.
When calculating foreign currency translation, the Company deemed its foreign investments to be permanent in nature and has not provided for taxes on currency translation adjust-ments arising from converting the investment in a foreign currency to U.S. dollars.
Derivatives and Hedging Activity: The Company uses com-modity and currency positions to manage its exposure to price fluctuations in those markets. The contracts are recorded at fair value on the Consolidated Statements of Financial Position within other current assets or accounts payable. Additional information on hedging activities is presented in Note L.
Equity Method Investments: The Company has a number of investments in joint ventures where its voting interests are in excess of 20 percent but not greater than 50 percent. The Company accounts for such investments under the equity method of accounting, and its underlying share of each investee’s equity is reported in the Consolidated Statements of Financial Position as part of investments in and receivables from affiliates. Significant equity method investments include a 40 percent ownership interest in a Philippines joint venture, Purefoods-Hormel Company, which had a book value of $63.9 million at October 31, 2010, and $56.6 million at October 25, 2009, and a 49 percent ownership interest in a Vietnam joint venture, San Miguel Purefoods (Vietnam) Co. Ltd., which had a book value of $20.5 million at October 31, 2010, and $21.8 million at October 25, 2009. These investments are included in the All Other segment for purposes of measuring segment assets and profits.
On October 26, 2009, the Company completed the formation of MegaMex Foods, LLC, a 50 percent owned joint venture which markets Mexican Foods in the United States. MegaMex Foods, LLC had a book value of $122.4 million at October 31, 2010. This investment is included in the Grocery Products segment for purposes of measuring segment assets and profits.
39
Income Taxes: The Company records income taxes in accor-dance with the liability method of accounting. Deferred taxes are recognized for the estimated taxes ultimately payable or recoverable based on enacted tax law. Changes in enacted tax rates are reflected in the tax provision as they occur.
Beginning in fiscal year 2008, the Company adopted the provi-sions of ASC 740, Income Taxes. In accordance with this stan-dard, the Company recognizes a tax position in its financial statements when it is more likely than not that the position will be sustained upon examination based on the technical merits of the position. That position is then measured at the largest amount of benefit that is greater than 50 percent likely of being realized upon ultimate settlement.
Employee Stock Options: The Company records stock-based compensation expense in accordance with ASC 718, Compensation — Stock Compensation. For options subject to graded vesting, the Company recognizes stock-based compensation expense ratably over the shorter of the vesting period or requisite service period. Stock-based compensation expense for grants made to retirement-eligible employees is recognized on the date of grant.
Share Repurchases: On October 2, 2002, the Company announced that its Board of Directors had authorized the Company to repurchase up to 10.0 million shares of common stock with no expiration date. During fiscal 2010, the 1.1 mil-lion shares remaining under this program were purchased at an average price per share of $39.78, which fully depleted the 10.0 million share authorization. The Company had also pur-chased 1.2 million shares at an average price of $33.10 during fiscal 2009, and 1.9 million shares at an average price per share of $36.48 during fiscal 2008 under this authorization.
On May 26, 2010, the Company announced that its Board of Directors had authorized the Company to repurchase an addi-tional 5.0 million shares of common stock with no expiration date. During fiscal 2010, 585,500 shares at an average price of $42.86 were purchased under this new authorization.
Supplemental Statement of Operations Information: Net earnings for the fiscal year ended October 31, 2010, include two non-recurring charges recorded by the Company. During the second quarter, the Company made the decision to close its Valley Fresh plant in Turlock, California. Valley Fresh® canned meats were produced at this facility. A write-down of fixed assets and the recording of employee related costs resulted in a charge of $6.3 million after tax ($0.05 per diluted share). New health care laws enacted in 2010 also required the Company to reduce the value of its deferred tax assets as a result of a change to the tax treatment of Medicare Part D subsidies. As a result, the Company recorded a charge of $7.1 million ($0.05 per diluted share) to income tax expense during the second quarter, primarily related to these new health care laws.
The Company regularly monitors and evaluates the fair value of our equity investments. If events and circumstances indicate that a decline in the fair value of these assets has occurred and is other than temporary, the Company will record a charge in equity in earnings of affiliates in the Consolidated Statements of Operations. The Company’s equity investments do not have a readily determinable fair value as none of them are publicly traded. The fair values of the Company’s private equity investments are determined by dis-counting the estimated future cash flows of each entity. These cash flow estimates include assumptions on growth rates and future currency exchange rates. The Company did not record an impairment charge on any of its equity investments in fis-cal years 2010, 2009, or 2008.
Revenue Recognition: The Company recognizes sales when title passes upon delivery of its products to customers, net of applicable provisions for discounts, returns, and allowances. Products are delivered upon receipt of customer purchase orders with acceptable terms, including price and collectabil-ity that is reasonably assured.
The Company offers various sales incentives to customers and consumers. Incentives that are offered off-invoice include prompt pay allowances, spoilage allowances, and temporary price reductions. These incentives are recognized as reduc-tion of revenue at the time title passes. Coupons are used as an incentive for consumers to purchase various products. The coupons reduce revenues at the time they are offered, based on estimated redemption rates. Promotional contracts are performed by customers to promote the Company’s products to the consumers. These incentives reduce revenues at the time of performance through direct payments and accrued promotional funds. Accrued promotional funds are unpaid liabilities for promotional contracts in process or completed at the end of a quarter or fiscal year. Promotional contract accruals are based on a review of the unpaid outstanding contracts on which performance has taken place. Estimates used to determine the revenue reduction include the level of customer performance and the historical spend rate versus contracted rates.
Advertising Expenses: Advertising costs are expensed when incurred. Advertising expenses include all media advertising but exclude the costs associated with samples and market research. Advertising costs for fiscal years 2010, 2009, and 2008 were $112.3 million, $93.6 million, and $98.5 million, respectively.
Shipping and Handling Costs: The Company’s shipping and handling expenses are included in cost of products sold.
Research and Development Expenses: Research and develop-ment costs are expensed as incurred and are included in selling, general and administrative expenses. Research and develop-ment expenses incurred for fiscal years 2010, 2009, and 2008 were $27.6 million, $25.4 million, and $22.7 million, respectively.
40
beginning on or after December 15, 2008, and interim periods within those fiscal years. The Company adopted the provisions of ASC 810 at the beginning of fiscal 2010. Adoption did not have a material impact on the consolidated financial state-ments, but resulted in the following changes in presentation and disclosure: 1) noncontrolling interests were reclassified from other long-term liabilities or accumulated other com-prehensive loss (foreign currency translation) to a separate component of shareholders’ investment in the Consolidated Statements of Financial Position; 2) consolidated net earnings on the Consolidated Statements of Operations now include the net earnings attributable to both the Company and its noncon-trolling interests; 3) the Consolidated Statement of Changes in Shareholders’ Investment now identifies the components of shareholders’ investment and comprehensive income attributable to the Company’s noncontrolling interests; and 4) the Consolidated Statements of Cash Flows now begin with consolidated net earnings attributable to both the Company and its noncontrolling interests, with the net earnings of the noncontrolling interests no longer included within changes in operating assets and liabilities and any distributions to the noncontrolling interests included in financing activities. As required, the prior year consolidated financial statements have also been reclassified to comply with the current year’s presentation and disclosure requirements.
In September 2006, the FASB issued ASC 820, Fair Value Measurements and Disclosures (ASC 820). This standard defines fair value, establishes a framework for measuring fair value, and expands disclosures about fair value measure-ments. This standard was effective for fiscal years beginning after November 15, 2007, and interim periods within those fiscal years. However, the provisions of ASC 820 allowed for deferral of adoption by one year for nonfinancial assets and liabilities measured at fair value that are recognized or disclosed on a nonrecurring basis (e.g. goodwill, intangible assets, and long-lived assets measured at fair value for impairment testing or nonfinancial assets and liabilities ini-tially measured at fair value during a business combination). Therefore, the Company adopted ASC 820 at the beginning of fiscal 2009 for its financial assets and liabilities. Adoption did not impact consolidated net earnings, cash flows, or financial position, but resulted in additional disclosures. (See further discussion in Note M.) Pursuant to the allowed deferral, the Company adopted the provisions of ASC 820 at the begin-ning of fiscal 2010 for its nonfinancial assets and liabilities. Adoption did not impact consolidated net earnings, cash flows, or financial position.
Supplemental Cash Flow Information: Non-cash investment activities presented on the Consolidated Statements of Cash Flows generally consist of unrealized gains or losses on the Company’s rabbi trust and other investments, amortization of affordable housing investments, and amortization of bond financing costs. Additionally, the Company had a $7.9 million negative reserve adjustment related to supplier contracts for the fiscal year ended October 25, 2009. The noted investments are included in other assets or short-term marketable securi-ties on the Consolidated Statements of Financial Position. Changes in the value of these investments are included in the Company’s net earnings and are presented in the Consolidated Statements of Operations as cost of products sold, interest and investment income, or interest expense, as appropriate.
Accounting Changes and Recent Accounting Pronouncements: In December 2008, the Financial Accounting Standards Board (FASB) updated the guidance within ASC 715, Compensation — Retirement Benefits. The update provides additional guidance regarding disclosures about plan assets of defined benefit pension or other post-retirement plans. The updated guidance is effective for fiscal years ending after December 15, 2009. The Company there-fore adopted the new provisions of this accounting standard for the fiscal year ending October 31, 2010, and the required disclosures are provided in Note H.
In December 2007, the FASB issued an update to ASC 805, Business Combinations (ASC 805). The update establishes principles and requirements for how an acquirer recognizes and measures in its financial statements the identifiable assets acquired, the liabilities assumed, and any noncontrol-ling interest in the acquiree, recognizes and measures the goodwill acquired in the business combination or a gain from a bargain purchase, and determines what information to disclose to enable the users of the financial statements to evaluate the nature and financial effects of the business combination. The updated guidance is effective for business combinations for which the acquisition date is on or after the beginning of the first annual reporting period beginning on or after December 15, 2008. Generally, the effect of ASC 805 will depend on future acquisitions. However, the accounting for any tax uncertainties is subject to the provisions of the standard upon adoption. The Company adopted the provisions of ASC 805 at the beginning of fiscal 2010, and adoption did not have a material impact on consolidated net earnings, cash flows, or financial position.
In December 2007, the FASB also updated the guidance within ASC 810, Consolidation (ASC 810). The update establishes accounting and reporting standards for the noncontrolling interest in a subsidiary and for the deconsolidation of a subsidiary. It also amends the requirements for certain con-solidation procedures for consistency with the requirements of ASC 805. The updated guidance is effective for fiscal years
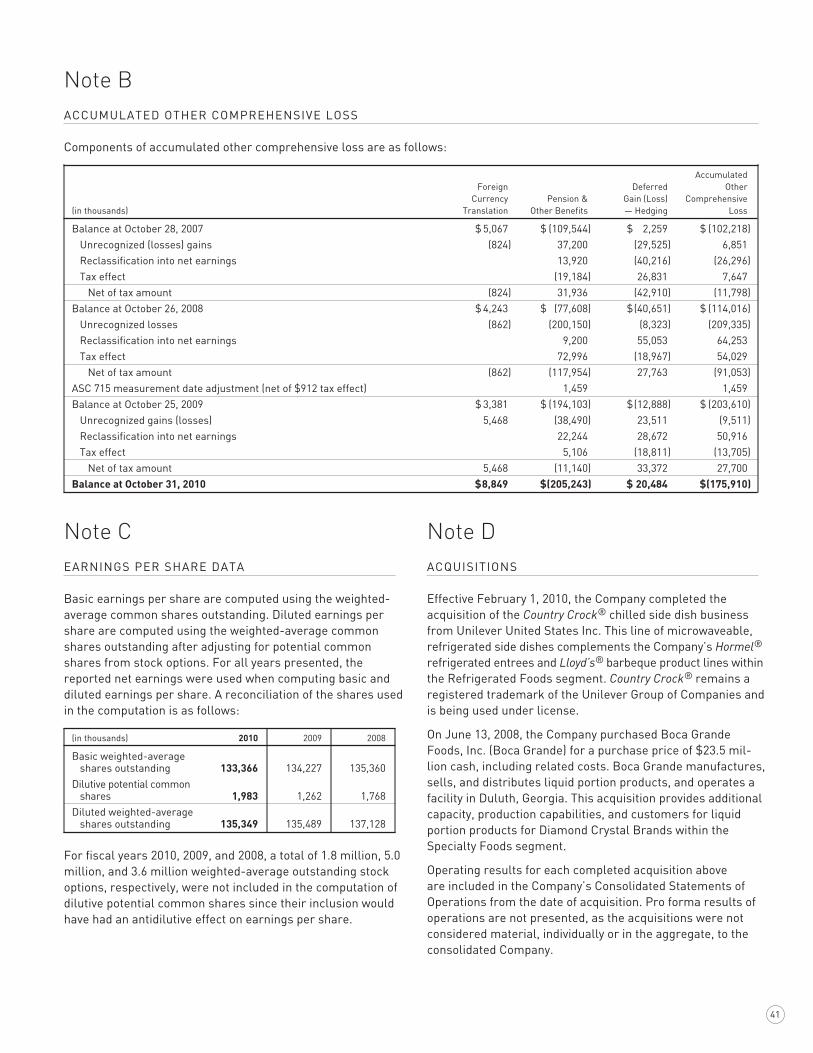
41
Note DACQUISITIONS
Effective February 1, 2010, the Company completed the acquisition of the Country Crock® chilled side dish business from Unilever United States Inc. This line of microwaveable, refrigerated side dishes complements the Company’s Hormel® refrigerated entrees and Lloyd’s® barbeque product lines within the Refrigerated Foods segment. Country Crock® remains a registered trademark of the Unilever Group of Companies and is being used under license.
On June 13, 2008, the Company purchased Boca Grande Foods, Inc. (Boca Grande) for a purchase price of $23.5 mil-lion cash, including related costs. Boca Grande manufactures, sells, and distributes liquid portion products, and operates a facility in Duluth, Georgia. This acquisition provides additional capacity, production capabilities, and customers for liquid portion products for Diamond Crystal Brands within the Specialty Foods segment.
Operating results for each completed acquisition above are included in the Company’s Consolidated Statements of Operations from the date of acquisition. Pro forma results of operations are not presented, as the acquisitions were not considered material, individually or in the aggregate, to the consolidated Company.
Note CEARNINGS PER SHARE DATA
Basic earnings per share are computed using the weighted-average common shares outstanding. Diluted earnings per share are computed using the weighted-average common shares outstanding after adjusting for potential common shares from stock options. For all years presented, the reported net earnings were used when computing basic and diluted earnings per share. A reconciliation of the shares used in the computation is as follows:
(in thousands) 2010 2009 2008
Basic weighted-average shares outstanding 133,366 134,227 135,360
Dilutive potential common shares 1,983 1,262 1,768
Diluted weighted-average shares outstanding 135,349 135,489 137,128
For fiscal years 2010, 2009, and 2008, a total of 1.8 million, 5.0 million, and 3.6 million weighted-average outstanding stock options, respectively, were not included in the computation of dilutive potential common shares since their inclusion would have had an antidilutive effect on earnings per share.
Note BACCUMULATED OTHER COMPREHENSIVE LOSS
Components of accumulated other comprehensive loss are as follows:
Accumulated Foreign Deferred Other Currency Pension & Gain (Loss) Comprehensive (in thousands) Translation Other Benefits — Hedging Loss
Balance at October 28, 2007 $ 5,067 $ (109,544) $ 2,259 $ (102,218) Unrecognized (losses) gains (824) 37,200 (29,525) 6,851 Reclassification into net earnings 13,920 (40,216) (26,296) Tax effect (19,184) 26,831 7,647 Net of tax amount (824) 31,936 (42,910) (11,798)Balance at October 26, 2008 $ 4,243 $ (77,608) $ (40,651) $ (114,016) Unrecognized losses (862) (200,150) (8,323) (209,335) Reclassification into net earnings 9,200 55,053 64,253 Tax effect 72,996 (18,967) 54,029 Net of tax amount (862) (117,954) 27,763 (91,053)ASC 715 measurement date adjustment (net of $912 tax effect) 1,459 1,459Balance at October 25, 2009 $ 3,381 $ (194,103) $ (12,888) $ (203,610) Unrecognized gains (losses) 5,468 (38,490) 23,511 (9,511) Reclassification into net earnings 22,244 28,672 50,916 Tax effect 5,106 (18,811) (13,705) Net of tax amount 5,468 (11,140) 33,372 27,700Balance at October 31, 2010 $ 8,849 $ (205,243) $ 20,484 $ (175,910)
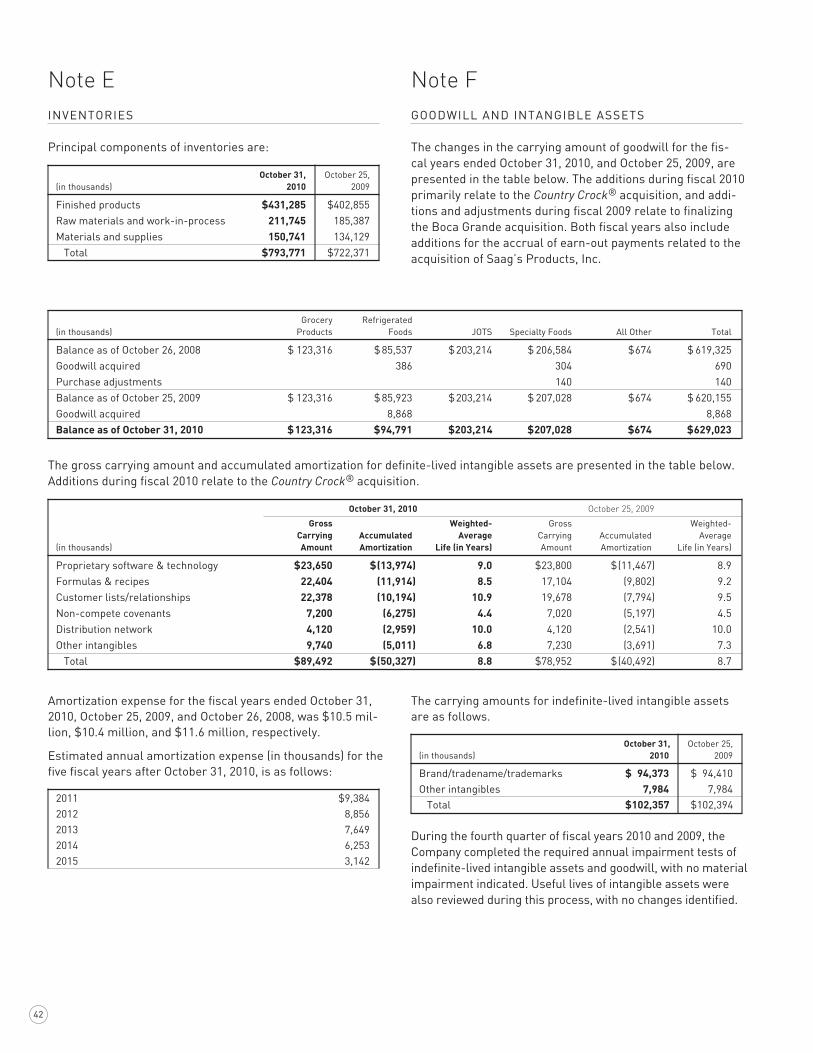
42
Note EINVENTORIES
Principal components of inventories are:
October 31, October 25, (in thousands) 2010 2009
Finished products $431,285 $402,855Raw materials and work-in-process 211,745 185,387Materials and supplies 150,741 134,129 Total $793,771 $722,371
Note FGOODWILL AND INTANGIBLE ASSETS
The changes in the carrying amount of goodwill for the fis-cal years ended October 31, 2010, and October 25, 2009, are presented in the table below. The additions during fiscal 2010 primarily relate to the Country Crock® acquisition, and addi-tions and adjustments during fiscal 2009 relate to finalizing the Boca Grande acquisition. Both fiscal years also include additions for the accrual of earn-out payments related to the acquisition of Saag’s Products, Inc.
The carrying amounts for indefinite-lived intangible assets are as follows.
October 31, October 25, (in thousands) 2010 2009
Brand/tradename/trademarks $ 94,373 $ 94,410Other intangibles 7,984 7,984 Total $ 102,357 $ 102,394
During the fourth quarter of fiscal years 2010 and 2009, the Company completed the required annual impairment tests of indefinite-lived intangible assets and goodwill, with no material impairment indicated. Useful lives of intangible assets were also reviewed during this process, with no changes identified.
Amortization expense for the fiscal years ended October 31, 2010, October 25, 2009, and October 26, 2008, was $10.5 mil-lion, $10.4 million, and $11.6 million, respectively.
Estimated annual amortization expense (in thousands) for the five fiscal years after October 31, 2010, is as follows:
2011 $9,3842012 8,8562013 7,6492014 6,2532015 3,142
Grocery Refrigerated (in thousands) Products Foods JOTS Specialty Foods All Other Total
Balance as of October 26, 2008 $ 123,316 $ 85,537 $ 203,214 $ 206,584 $ 674 $ 619,325Goodwill acquired 386 304 690Purchase adjustments 140 140Balance as of October 25, 2009 $ 123,316 $ 85,923 $ 203,214 $ 207,028 $ 674 $ 620,155Goodwill acquired 8,868 8,868Balance as of October 31, 2010 $ 123,316 $ 94,791 $ 203,214 $ 207,028 $ 674 $ 629,023
The gross carrying amount and accumulated amortization for definite-lived intangible assets are presented in the table below. Additions during fiscal 2010 relate to the Country Crock® acquisition.
October 31, 2010 October 25, 2009
Gross Weighted- Gross Weighted- Carrying Accumulated Average Carrying Accumulated Average (in thousands) Amount Amortization Life (in Years) Amount Amortization Life (in Years)
Proprietary software & technology $ 23,650 $ (13,974) 9.0 $ 23,800 $ (11,467) 8.9Formulas & recipes 22,404 (11,914) 8.5 17,104 (9,802) 9.2Customer lists/relationships 22,378 (10,194) 10.9 19,678 (7,794) 9.5Non-compete covenants 7,200 (6,275) 4.4 7,020 (5,197) 4.5Distribution network 4,120 (2,959) 10.0 4,120 (2,541) 10.0Other intangibles 9,740 (5,011) 6.8 7,230 (3,691) 7.3 Total $ 89,492 $ (50,327) 8.8 $ 78,952 $ (40,492) 8.7
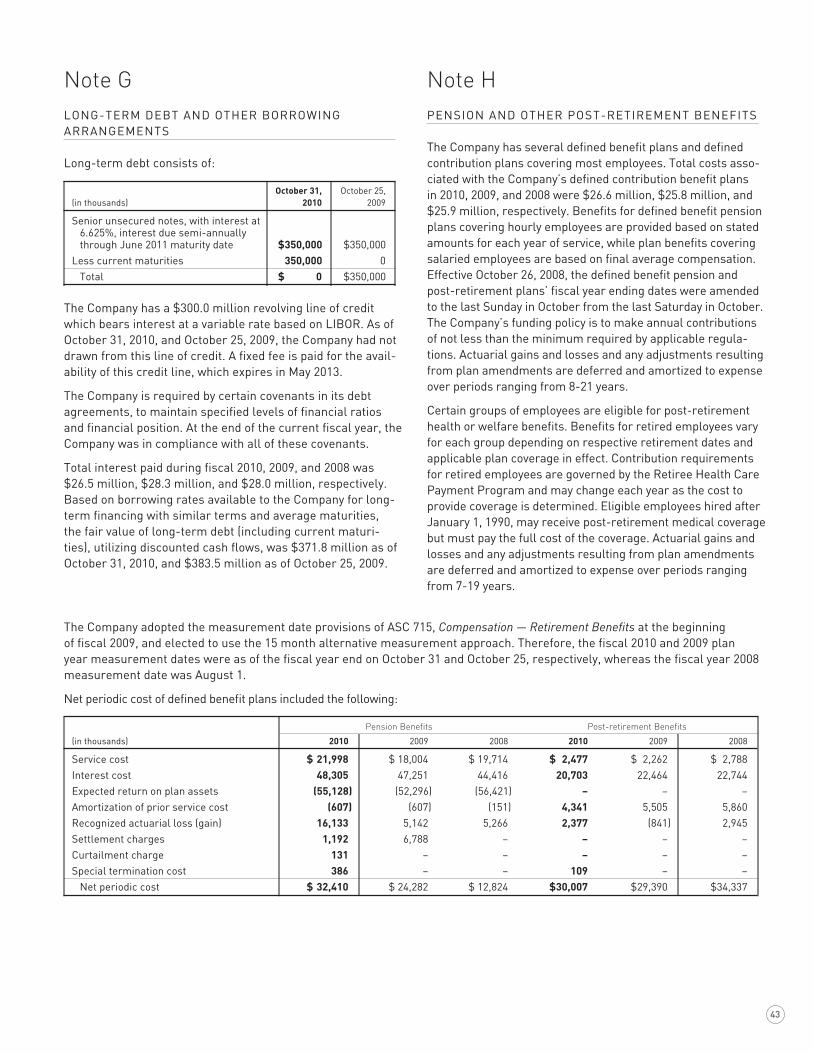
43
Note HPENSION AND OTHER POST-RETIREMENT BENEFITS
The Company has several defined benefit plans and defined contribution plans covering most employees. Total costs asso-ciated with the Company’s defined contribution benefit plans in 2010, 2009, and 2008 were $26.6 million, $25.8 million, and $25.9 million, respectively. Benefits for defined benefit pension plans covering hourly employees are provided based on stated amounts for each year of service, while plan benefits covering salaried employees are based on final average compensation. Effective October 26, 2008, the defined benefit pension and post-retirement plans’ fiscal year ending dates were amended to the last Sunday in October from the last Saturday in October. The Company’s funding policy is to make annual contributions of not less than the minimum required by applicable regula-tions. Actuarial gains and losses and any adjustments resulting from plan amendments are deferred and amortized to expense over periods ranging from 8-21 years.
Certain groups of employees are eligible for post-retirement health or welfare benefits. Benefits for retired employees vary for each group depending on respective retirement dates and applicable plan coverage in effect. Contribution requirements for retired employees are governed by the Retiree Health Care Payment Program and may change each year as the cost to provide coverage is determined. Eligible employees hired after January 1, 1990, may receive post-retirement medical coverage but must pay the full cost of the coverage. Actuarial gains and losses and any adjustments resulting from plan amendments are deferred and amortized to expense over periods ranging from 7-19 years.
Note GLONG-TERM DEBT AND OTHER BORROWING ARRANGEMENTS
Long-term debt consists of:
October 31, October 25, (in thousands) 2010 2009
Senior unsecured notes, with interest at 6.625%, interest due semi-annually through June 2011 maturity date $ 350,000 $ 350,000
Less current maturities 350,000 0 Total $ 0 $ 350,000
The Company has a $300.0 million revolving line of credit which bears interest at a variable rate based on LIBOR. As of October 31, 2010, and October 25, 2009, the Company had not drawn from this line of credit. A fixed fee is paid for the avail-ability of this credit line, which expires in May 2013.
The Company is required by certain covenants in its debt agreements, to maintain specified levels of financial ratios and financial position. At the end of the current fiscal year, the Company was in compliance with all of these covenants.
Total interest paid during fiscal 2010, 2009, and 2008 was $26.5 million, $28.3 million, and $28.0 million, respectively. Based on borrowing rates available to the Company for long-term financing with similar terms and average maturities, the fair value of long-term debt (including current maturi-ties), utilizing discounted cash flows, was $371.8 million as of October 31, 2010, and $383.5 million as of October 25, 2009.
The Company adopted the measurement date provisions of ASC 715, Compensation — Retirement Benefits at the beginning of fiscal 2009, and elected to use the 15 month alternative measurement approach. Therefore, the fiscal 2010 and 2009 plan year measurement dates were as of the fiscal year end on October 31 and October 25, respectively, whereas the fiscal year 2008 measurement date was August 1.
Net periodic cost of defined benefit plans included the following:
Pension Benefits Post-retirement Benefits
(in thousands) 2010 2009 2008 2010 2009 2008
Service cost $ 21,998 $ 18,004 $ 19,714 $ 2,477 $ 2,262 $ 2,788Interest cost 48,305 47,251 44,416 20,703 22,464 22,744Expected return on plan assets (55,128) (52,296) (56,421) – – –Amortization of prior service cost (607) (607) (151) 4,341 5,505 5,860Recognized actuarial loss (gain) 16,133 5,142 5,266 2,377 (841) 2,945Settlement charges 1,192 6,788 – – – –Curtailment charge 131 – – – – –Special termination cost 386 – – 109 – – Net periodic cost $ 32,410 $ 24,282 $ 12,824 $ 30,007 $ 29,390 $ 34,337
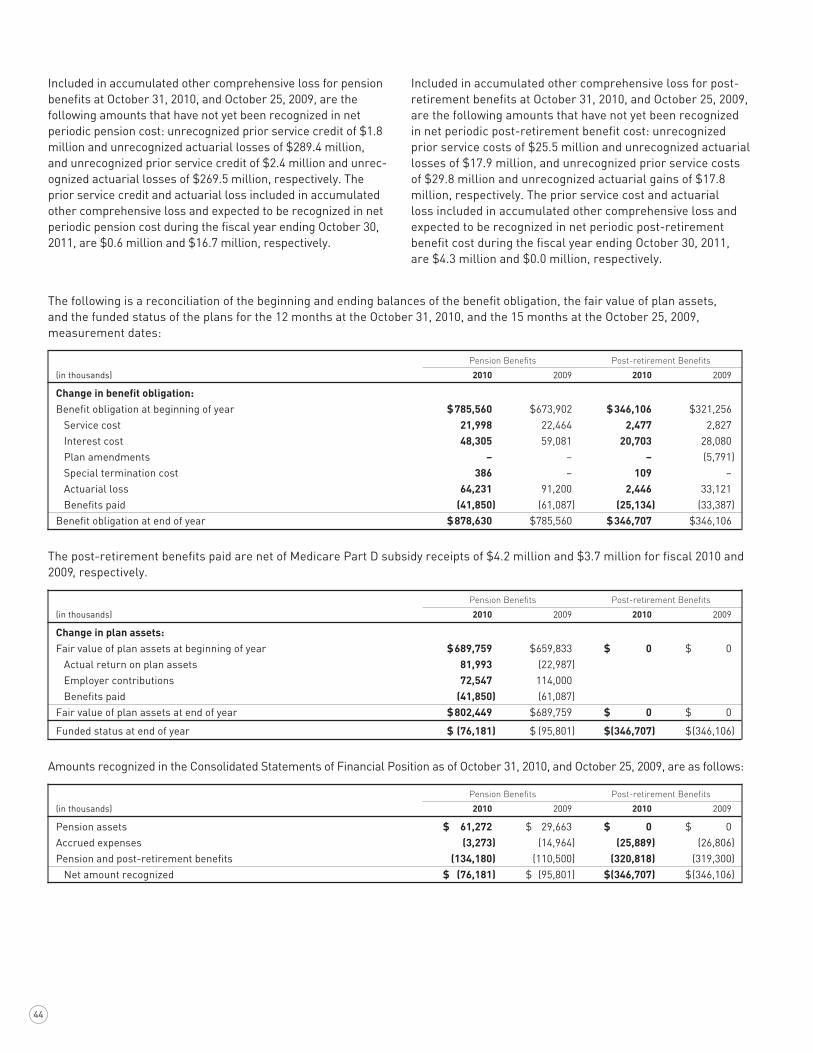
44
Included in accumulated other comprehensive loss for post-retirement benefits at October 31, 2010, and October 25, 2009, are the following amounts that have not yet been recognized in net periodic post-retirement benefit cost: unrecognized prior service costs of $25.5 million and unrecognized actuarial losses of $17.9 million, and unrecognized prior service costs of $29.8 million and unrecognized actuarial gains of $17.8 million, respectively. The prior service cost and actuarial loss included in accumulated other comprehensive loss and expected to be recognized in net periodic post-retirement benefit cost during the fiscal year ending October 30, 2011, are $4.3 million and $0.0 million, respectively.
Included in accumulated other comprehensive loss for pension benefits at October 31, 2010, and October 25, 2009, are the following amounts that have not yet been recognized in net periodic pension cost: unrecognized prior service credit of $1.8 million and unrecognized actuarial losses of $289.4 million, and unrecognized prior service credit of $2.4 million and unrec-ognized actuarial losses of $269.5 million, respectively. The prior service credit and actuarial loss included in accumulated other comprehensive loss and expected to be recognized in net periodic pension cost during the fiscal year ending October 30, 2011, are $0.6 million and $16.7 million, respectively.
The following is a reconciliation of the beginning and ending balances of the benefit obligation, the fair value of plan assets, and the funded status of the plans for the 12 months at the October 31, 2010, and the 15 months at the October 25, 2009, measurement dates:
Pension Benefits Post-retirement Benefits
(in thousands) 2010 2009 2010 2009
Change in benefit obligation:Benefit obligation at beginning of year $ 785,560 $ 673,902 $ 346,106 $ 321,256 Service cost 21,998 22,464 2,477 2,827 Interest cost 48,305 59,081 20,703 28,080 Plan amendments – – – (5,791) Special termination cost 386 – 109 – Actuarial loss 64,231 91,200 2,446 33,121 Benefits paid (41,850) (61,087) (25,134) (33,387)Benefit obligation at end of year $ 878,630 $ 785,560 $ 346,707 $ 346,106
The post-retirement benefits paid are net of Medicare Part D subsidy receipts of $4.2 million and $3.7 million for fiscal 2010 and 2009, respectively.
Pension Benefits Post-retirement Benefits
(in thousands) 2010 2009 2010 2009
Change in plan assets:Fair value of plan assets at beginning of year $ 689,759 $ 659,833 $ 0 $ 0 Actual return on plan assets 81,993 (22,987) Employer contributions 72,547 114,000 Benefits paid (41,850) (61,087)Fair value of plan assets at end of year $ 802,449 $ 689,759 $ 0 $ 0
Funded status at end of year $ (76,181) $ (95,801) $ (346,707) $ (346,106)
Amounts recognized in the Consolidated Statements of Financial Position as of October 31, 2010, and October 25, 2009, are as follows:
Pension Benefits Post-retirement Benefits
(in thousands) 2010 2009 2010 2009
Pension assets $ 61,272 $ 29,663 $ 0 $ 0Accrued expenses (3,273) (14,964) (25,889) (26,806)Pension and post-retirement benefits (134,180) (110,500) (320,818) (319,300) Net amount recognized $ (76,181) $ (95,801) $ (346,707) $ (346,106)

45
Target allocations, which were revised in fiscal 2010, are established in consultation with outside advisors through the use of asset-liability modeling to attempt to match the duration of the plan assets with the duration of the Company’s projected benefit liability. The asset allocation strategy attempts to minimize the long-term cost of pension benefits, reduce the volatility of pen-sion expense, and achieve a healthy funded status for the plans.
As of the 2010 measurement date, plan assets included 1.7 million shares of common stock of the Company having a market value of $76.1 million or 9% of total plan assets. Dividends paid during the year on shares held by the plan were $1.4 million. In 2009, plan assets included 1.7 million shares of common stock of the Company having a market value of $60.2 million or 9% of total plan assets.
Weighted-average assumptions used to determine net peri-odic benefit costs are as follows:
2010 2009 2008
Discount rate 6.28% 7.30% 6.40%Rate of future compensation
increase (for plans that base benefits on final compensation level) 4.08% 4.09% 4.09%
Expected long-term return on plan assets 8.25% 8.25% 8.25%
The expected long-term rate of return on plan assets is devel-oped in consultation with outside advisors. A range is determined based on the composition of the asset portfolio, historical long-term rates of return, and estimates of future performance.
The projected benefit obligation, accumulated benefit obliga-tion, and fair value of plan assets for the pension plans with accumulated benefit obligations in excess of plan assets were $139.5 million, $113.2 million, and $2.2 million, respectively, as of October 31, 2010, and $114.5 million, $98.7 million, and $1.9 million, respectively, as of October 25, 2009.
Weighted-average assumptions used to determine benefit obligations are as follows:
2010 2009
Discount rate 6.12% 6.28%Rate of future compensation increase
(for plans that base benefits on final compensation level) 4.03% 4.08%
For measurement purposes, an 8.0% annual rate of increase in the per capita cost of covered health care benefits for pre-Medicare and post-Medicare retirees’ coverage is assumed for 2011. The pre-Medicare and post-Medicare rate is assumed to decrease to 5.0% for 2016, and remain at that level thereafter.
The assumed discount rate, expected long-term rate of return on plan assets, rate of future compensation increase, and health care cost trend rate have a significant impact on the amounts reported for the benefit plans. A one-percentage-point change in these rates would have the following effects:
1-Percentage-Point
Expense Benefit Obligation
(in thousands) Increase Decrease Increase Decrease
Pension Benefits: Discount rate $ (10,658) $ 13,657 $ (104,686) $ 130,152 Expected long-term rate of return on plan assets $ (7,874) $ 7,874 – – Rate of future compensation increase $ 6,987 $ (6,104) $ 31,690 $ (28,189)Post-retirement Benefits: Discount rate $ 836 $ 1,195 $ (32,342) $ 38,460 Health care cost trend rate $ 1,832 $ (1,406) $ 27,882 $ (23,365)
The actual and target weighted-average asset allocations for the Company’s pension plan assets as of the plan measurement date are as follows:
2010 2009
Asset Category Actual Target Range Actual Target Range
Large Capitalization Equity 33.1% 22-32% 34.6% –Small Capitalization Equity 14.0% 3-13% 12.6% –International Equity 17.8% 15-25% 17.7% –Private Equity 1.2% 0-15% 0.5% – Total Equity Securities 66.1% 55-75% 65.4% 60-80%Fixed Income 31.8% 25-45% 33.5% 25-35%Cash and Cash Equivalents 2.1% 0% 1.1% 0%
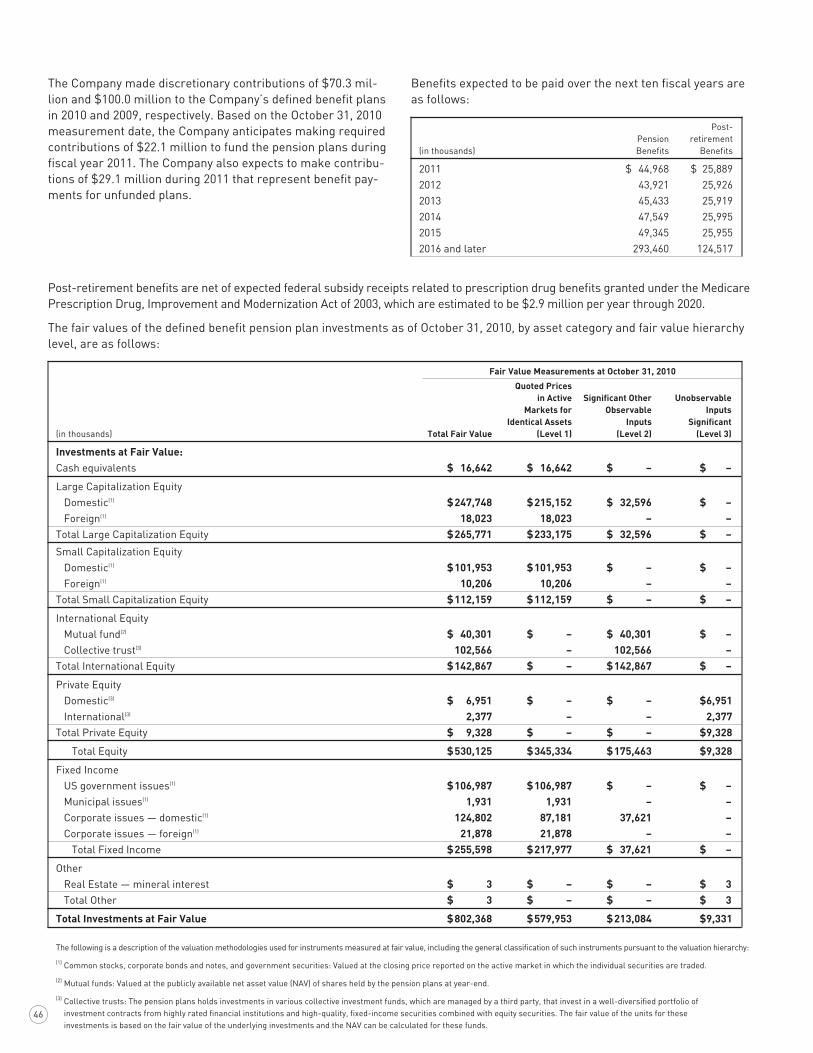
46
Benefits expected to be paid over the next ten fiscal years are as follows:
Post- Pension retirement (in thousands) Benefits Benefits
2011 $ 44,968 $ 25,8892012 43,921 25,9262013 45,433 25,9192014 47,549 25,9952015 49,345 25,9552016 and later 293,460 124,517
The Company made discretionary contributions of $70.3 mil-lion and $100.0 million to the Company’s defined benefit plans in 2010 and 2009, respectively. Based on the October 31, 2010 measurement date, the Company anticipates making required contributions of $22.1 million to fund the pension plans during fiscal year 2011. The Company also expects to make contribu-tions of $29.1 million during 2011 that represent benefit pay-ments for unfunded plans.
Post-retirement benefits are net of expected federal subsidy receipts related to prescription drug benefits granted under the Medicare Prescription Drug, Improvement and Modernization Act of 2003, which are estimated to be $2.9 million per year through 2020.
The fair values of the defined benefit pension plan investments as of October 31, 2010, by asset category and fair value hierarchy level, are as follows:
Fair Value Measurements at October 31, 2010
Quoted Prices in Active Significant Other Unobservable Markets for Observable Inputs Identical Assets Inputs Significant (in thousands) Total Fair Value (Level 1) (Level 2) (Level 3)
Investments at Fair Value: Cash equivalents $ 16,642 $ 16,642 $ – $ –
Large Capitalization Equity Domestic(1) $ 247,748 $ 215,152 $ 32,596 $ – Foreign(1) 18,023 18,023 – –Total Large Capitalization Equity $ 265,771 $ 233,175 $ 32,596 $ –
Small Capitalization Equity Domestic(1) $ 101,953 $ 101,953 $ – $ – Foreign(1) 10,206 10,206 – –Total Small Capitalization Equity $ 112,159 $ 112,159 $ – $ –
International Equity Mutual fund(2) $ 40,301 $ – $ 40,301 $ – Collective trust(3) 102,566 – 102,566 –Total International Equity $ 142,867 $ – $ 142,867 $ –
Private Equity Domestic(3) $ 6,951 $ – $ – $ 6,951 International(3) 2,377 – – 2,377Total Private Equity $ 9,328 $ – $ – $ 9,328
Total Equity $ 530,125 $ 345,334 $ 175,463 $ 9,328
Fixed Income US government issues(1) $ 106,987 $ 106,987 $ – $ – Municipal issues(1) 1,931 1,931 – – Corporate issues — domestic(1) 124,802 87,181 37,621 – Corporate issues — foreign(1) 21,878 21,878 – – Total Fixed Income $ 255,598 $ 217,977 $ 37,621 $ –
Other Real Estate — mineral interest $ 3 $ – $ – $ 3 Total Other $ 3 $ – $ – $ 3
Total Investments at Fair Value $ 802,368 $ 579,953 $ 213,084 $ 9,331
The following is a description of the valuation methodologies used for instruments measured at fair value, including the general classification of such instruments pursuant to the valuation hierarchy:
(1) Common stocks, corporate bonds and notes, and government securities: Valued at the closing price reported on the active market in which the individual securities are traded.
(2) Mutual funds: Valued at the publicly available net asset value (NAV) of shares held by the pension plans at year-end.
(3) Collective trusts: The pension plans holds investments in various collective investment funds, which are managed by a third party, that invest in a well-diversified portfolio of investment contracts from highly rated financial institutions and high-quality, fixed-income securities combined with equity securities. The fair value of the units for these investments is based on the fair value of the underlying investments and the NAV can be calculated for these funds.

47
Significant components of the deferred income tax liabilities and assets are as follows:
October 31, October 25, (in thousands) 2010 2009
Deferred tax liabilities: Tax over book depreciation $ (81,821) $ (76,809) Book/tax basis difference
from acquisitions (30,262) (32,100) Pension assets (22,809) (5,761) Commodity hedging contracts (16,327) – Other, net (54,273) (47,659)Deferred tax assets: Post-retirement benefits 133,684 142,334 Pension benefits 52,445 47,730 Stock options 29,092 26,362 Deferred compensation 21,409 20,355 Federal benefit of state tax 14,799 15,733 Insurance accruals 14,318 13,573 Vacation accruals 13,857 12,850 Promotional accruals 7,208 14,345 Commodity hedging contracts – 6,887 Other, net 61,809 50,602 Net deferred tax assets $ 143,129 $ 188,442
Reconciliation of the statutory federal income tax rate to the Company’s effective tax rate is as follows:
2010 2009 2008
U.S. statutory rate 35.0% 35.0% 35.0%State taxes on income,
net of federal tax benefit 3.1 2.9 3.3Rabbi trust (0.3) (1.0) 2.2Medicare Part D
supplement (0.2) (0.3) (0.3)Manufacture deduction (1.7) (1.6) (1.7)Book income attributable to
noncontrolling interests (0.2) (0.2) (0.3)All other, net 0.3 (0.3) (0.9)Effective tax rate 36.0% 34.5% 37.3%
The Company has accumulated undistributed earnings of foreign subsidiaries and joint ventures of approximately $56.0 million as of October 31, 2010. These earnings are expected to be indefinitely reinvested outside of the United States.
Total income taxes paid during fiscal 2010, 2009, and 2008 were $212.6 million, $160.3 million, and $144.7 million, respectively.
The Company adopted the amended provisions of ASC 740, Income Taxes at the beginning of fiscal 2008, on October 29, 2007. Adoption resulted in a $13.9 million increase in the liability for uncertain tax positions (resulting in a total liability balance of $32.3 million), a $4.9 million increase in deferred tax assets, and a decrease in retained earnings of $9.0 million.
A reconciliation of the beginning and ending balance of the investments measured at fair value using significant unob-servable inputs (Level 3) is as follows:
(in thousands)
Beginning Balance, October 25, 2009 $ 3,108 Purchases, issuances and settlements (net) 5,506 Unrealized gains 717 Realized gains (losses) –Ending Balance, October 31, 2010 $ 9,331
The Company has commitments totaling $85.0 million for the private equity investments within the pension plans, of which $77.0 million remains unfunded at fiscal year end 2010. These commitments include $53.3 million and $23.7 million for domestic and foreign equity investments, respectively. Funding for future private equity capital calls will come from existing pension plan asset investments and not from addi-tional cash contributions into the Company’s pension plans.
Note IINCOME TAxES
The components of the provision for income taxes are as follows:
(in thousands) 2010 2009 2008
Current: U.S. Federal $ 170,326 $ 159,208 $ 157,314 State 22,896 22,027 22,105 Foreign 2,124 1,245 2,330 Total current 195,346 182,480 181,749Deferred: U.S. Federal 27,009 (392) (9,013) State 2,420 81 (700) Total deferred 29,429 (311) (9,713) Total provision for
income taxes $ 224,775 $ 182,169 $ 172,036
Deferred income taxes reflect the net tax effects of temporary differences between the carrying amounts of assets and liabilities for financial reporting purposes and the amounts used for income tax purposes. The Company believes that, based upon its lengthy and consistent history of profitable operations, it is more likely than not that the net deferred tax assets of $143.1 million will be realized on future tax returns, primarily from the generation of future taxable income.
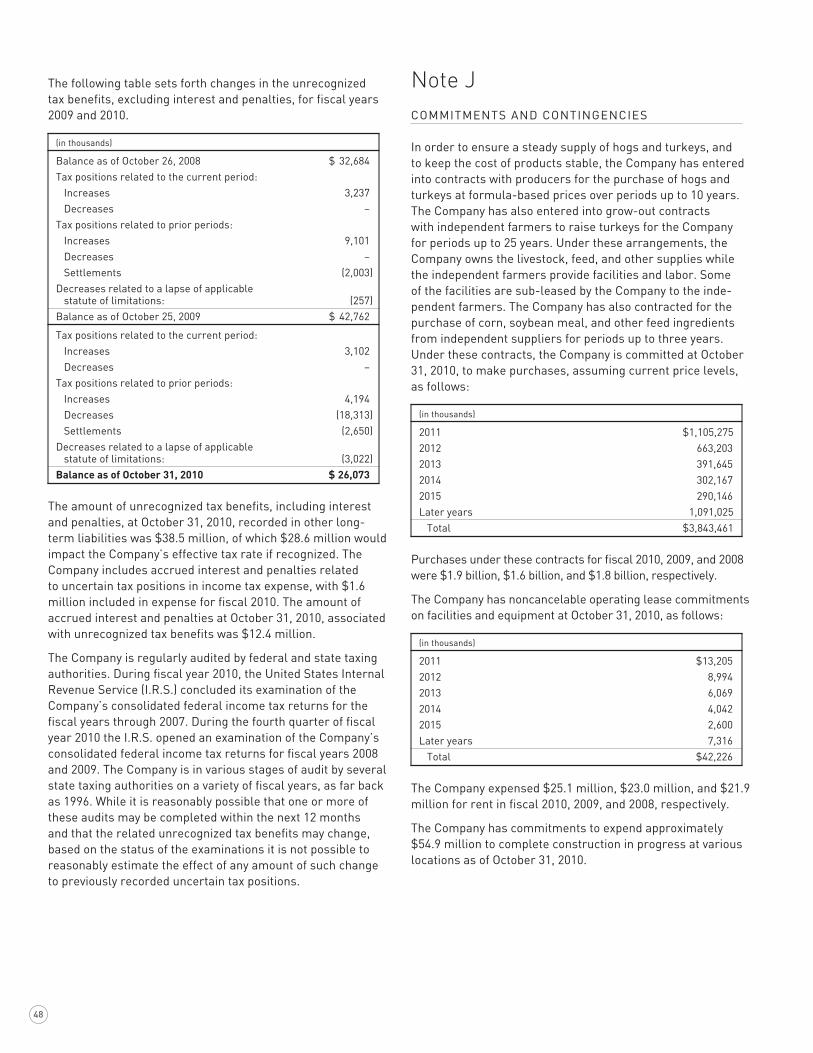
48
Note JCOMMITMENTS AND CONTINGENCIES
In order to ensure a steady supply of hogs and turkeys, and to keep the cost of products stable, the Company has entered into contracts with producers for the purchase of hogs and turkeys at formula-based prices over periods up to 10 years. The Company has also entered into grow-out contracts with independent farmers to raise turkeys for the Company for periods up to 25 years. Under these arrangements, the Company owns the livestock, feed, and other supplies while the independent farmers provide facilities and labor. Some of the facilities are sub-leased by the Company to the inde-pendent farmers. The Company has also contracted for the purchase of corn, soybean meal, and other feed ingredients from independent suppliers for periods up to three years. Under these contracts, the Company is committed at October 31, 2010, to make purchases, assuming current price levels, as follows:
(in thousands)
2011 $ 1,105,2752012 663,2032013 391,6452014 302,1672015 290,146Later years 1,091,025 Total $ 3,843,461
Purchases under these contracts for fiscal 2010, 2009, and 2008 were $1.9 billion, $1.6 billion, and $1.8 billion, respectively.
The Company has noncancelable operating lease commitments on facilities and equipment at October 31, 2010, as follows:
(in thousands)
2011 $ 13,2052012 8,9942013 6,0692014 4,0422015 2,600Later years 7,316 Total $ 42,226
The Company expensed $25.1 million, $23.0 million, and $21.9 million for rent in fiscal 2010, 2009, and 2008, respectively.
The Company has commitments to expend approximately $54.9 million to complete construction in progress at various locations as of October 31, 2010.
The following table sets forth changes in the unrecognized tax benefits, excluding interest and penalties, for fiscal years 2009 and 2010.
(in thousands)
Balance as of October 26, 2008 $ 32,684Tax positions related to the current period: Increases 3,237 Decreases –Tax positions related to prior periods: Increases 9,101 Decreases – Settlements (2,003)Decreases related to a lapse of applicable
statute of limitations: (257)Balance as of October 25, 2009 $ 42,762
Tax positions related to the current period: Increases 3,102 Decreases –Tax positions related to prior periods: Increases 4,194 Decreases (18,313) Settlements (2,650)Decreases related to a lapse of applicable
statute of limitations: (3,022)Balance as of October 31, 2010 $ 26,073
The amount of unrecognized tax benefits, including interest and penalties, at October 31, 2010, recorded in other long-term liabilities was $38.5 million, of which $28.6 million would impact the Company’s effective tax rate if recognized. The Company includes accrued interest and penalties related to uncertain tax positions in income tax expense, with $1.6 million included in expense for fiscal 2010. The amount of accrued interest and penalties at October 31, 2010, associated with unrecognized tax benefits was $12.4 million.
The Company is regularly audited by federal and state taxing authorities. During fiscal year 2010, the United States Internal Revenue Service (I.R.S.) concluded its examination of the Company’s consolidated federal income tax returns for the fiscal years through 2007. During the fourth quarter of fiscal year 2010 the I.R.S. opened an examination of the Company’s consolidated federal income tax returns for fiscal years 2008 and 2009. The Company is in various stages of audit by several state taxing authorities on a variety of fiscal years, as far back as 1996. While it is reasonably possible that one or more of these audits may be completed within the next 12 months and that the related unrecognized tax benefits may change, based on the status of the examinations it is not possible to reasonably estimate the effect of any amount of such change to previously recorded uncertain tax positions.
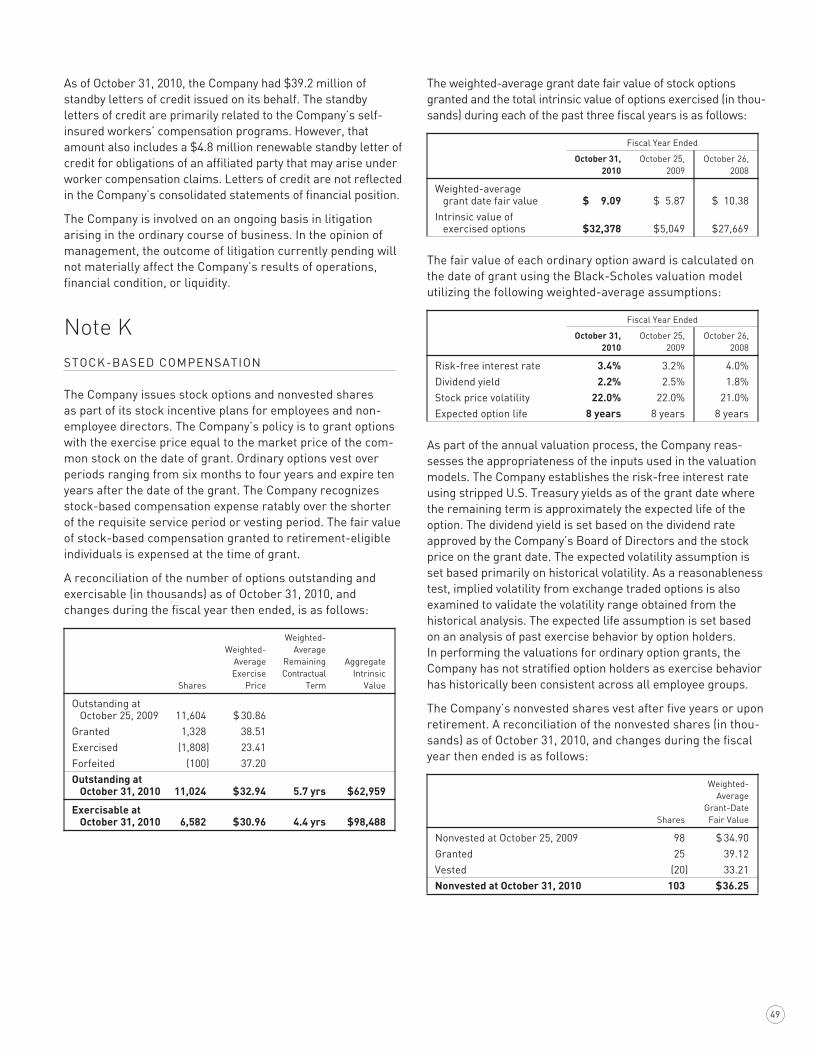
49
The weighted-average grant date fair value of stock options granted and the total intrinsic value of options exercised (in thou-sands) during each of the past three fiscal years is as follows:
Fiscal Year Ended
October 31, October 25, October 26, 2010 2009 2008
Weighted-average grant date fair value $ 9.09 $ 5.87 $ 10.38
Intrinsic value of exercised options $ 32,378 $ 5,049 $ 27,669
The fair value of each ordinary option award is calculated on the date of grant using the Black-Scholes valuation model utilizing the following weighted-average assumptions:
Fiscal Year Ended
October 31, October 25, October 26, 2010 2009 2008
Risk-free interest rate 3.4% 3.2% 4.0%Dividend yield 2.2% 2.5% 1.8%Stock price volatility 22.0% 22.0% 21.0%Expected option life 8 years 8 years 8 years
As part of the annual valuation process, the Company reas-sesses the appropriateness of the inputs used in the valuation models. The Company establishes the risk-free interest rate using stripped U.S. Treasury yields as of the grant date where the remaining term is approximately the expected life of the option. The dividend yield is set based on the dividend rate approved by the Company’s Board of Directors and the stock price on the grant date. The expected volatility assumption is set based primarily on historical volatility. As a reasonableness test, implied volatility from exchange traded options is also examined to validate the volatility range obtained from the historical analysis. The expected life assumption is set based on an analysis of past exercise behavior by option holders. In performing the valuations for ordinary option grants, the Company has not stratified option holders as exercise behavior has historically been consistent across all employee groups.
The Company’s nonvested shares vest after five years or upon retirement. A reconciliation of the nonvested shares (in thou-sands) as of October 31, 2010, and changes during the fiscal year then ended is as follows:
Weighted- Average Grant-Date Shares Fair Value
Nonvested at October 25, 2009 98 $ 34.90Granted 25 39.12Vested (20) 33.21Nonvested at October 31, 2010 103 $ 36.25
As of October 31, 2010, the Company had $39.2 million of standby letters of credit issued on its behalf. The standby letters of credit are primarily related to the Company’s self-insured workers’ compensation programs. However, that amount also includes a $4.8 million renewable standby letter of credit for obligations of an affiliated party that may arise under worker compensation claims. Letters of credit are not reflected in the Company’s consolidated statements of financial position.
The Company is involved on an ongoing basis in litigation arising in the ordinary course of business. In the opinion of management, the outcome of litigation currently pending will not materially affect the Company’s results of operations, financial condition, or liquidity.
Note KSTOCk-BASED COMPENSATION
The Company issues stock options and nonvested shares as part of its stock incentive plans for employees and non-employee directors. The Company’s policy is to grant options with the exercise price equal to the market price of the com-mon stock on the date of grant. Ordinary options vest over periods ranging from six months to four years and expire ten years after the date of the grant. The Company recognizes stock-based compensation expense ratably over the shorter of the requisite service period or vesting period. The fair value of stock-based compensation granted to retirement-eligible individuals is expensed at the time of grant.
A reconciliation of the number of options outstanding and exercisable (in thousands) as of October 31, 2010, and changes during the fiscal year then ended, is as follows:
Weighted- Weighted- Average Average Remaining Aggregate Exercise Contractual Intrinsic Shares Price Term Value
Outstanding at October 25, 2009 11,604 $ 30.86
Granted 1,328 38.51Exercised (1,808) 23.41Forfeited (100) 37.20Outstanding at
October 31, 2010 11,024 $ 32.94 5.7 yrs $ 62,959
Exercisable at October 31, 2010 6,582 $ 30.96 4.4 yrs $ 98,488
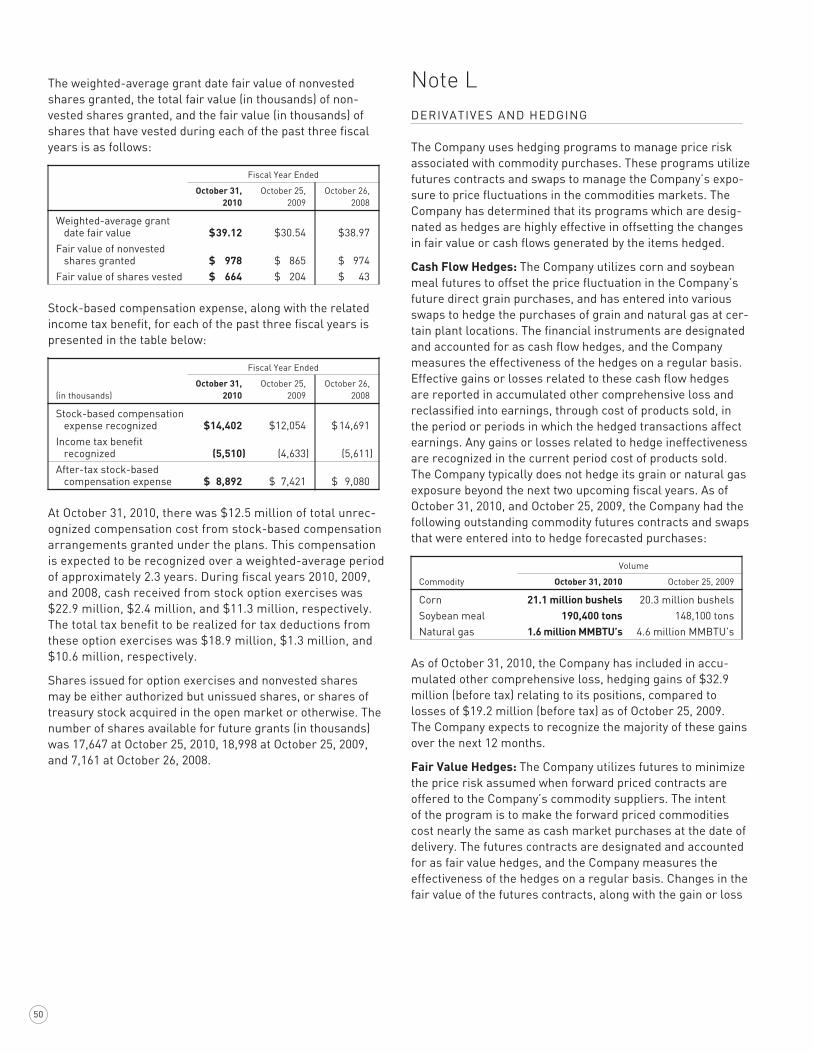
50
Note LDERIVATIVES AND HEDGING
The Company uses hedging programs to manage price risk associated with commodity purchases. These programs utilize futures contracts and swaps to manage the Company’s expo-sure to price fluctuations in the commodities markets. The Company has determined that its programs which are desig-nated as hedges are highly effective in offsetting the changes in fair value or cash flows generated by the items hedged.
Cash Flow Hedges: The Company utilizes corn and soybean meal futures to offset the price fluctuation in the Company’s future direct grain purchases, and has entered into various swaps to hedge the purchases of grain and natural gas at cer-tain plant locations. The financial instruments are designated and accounted for as cash flow hedges, and the Company measures the effectiveness of the hedges on a regular basis. Effective gains or losses related to these cash flow hedges are reported in accumulated other comprehensive loss and reclassified into earnings, through cost of products sold, in the period or periods in which the hedged transactions affect earnings. Any gains or losses related to hedge ineffectiveness are recognized in the current period cost of products sold. The Company typically does not hedge its grain or natural gas exposure beyond the next two upcoming fiscal years. As of October 31, 2010, and October 25, 2009, the Company had the following outstanding commodity futures contracts and swaps that were entered into to hedge forecasted purchases:
Volume
Commodity October 31, 2010 October 25, 2009
Corn 21.1 million bushels 20.3 million bushelsSoybean meal 190,400 tons 148,100 tonsNatural gas 1.6 million MMBTU’s 4.6 million MMBTU’s
As of October 31, 2010, the Company has included in accu-mulated other comprehensive loss, hedging gains of $32.9 million (before tax) relating to its positions, compared to losses of $19.2 million (before tax) as of October 25, 2009. The Company expects to recognize the majority of these gains over the next 12 months.
Fair Value Hedges: The Company utilizes futures to minimize the price risk assumed when forward priced contracts are offered to the Company’s commodity suppliers. The intent of the program is to make the forward priced commodities cost nearly the same as cash market purchases at the date of delivery. The futures contracts are designated and accounted for as fair value hedges, and the Company measures the effectiveness of the hedges on a regular basis. Changes in the fair value of the futures contracts, along with the gain or loss
The weighted-average grant date fair value of nonvested shares granted, the total fair value (in thousands) of non-vested shares granted, and the fair value (in thousands) of shares that have vested during each of the past three fiscal years is as follows:
Fiscal Year Ended
October 31, October 25, October 26, 2010 2009 2008
Weighted-average grant date fair value $ 39.12 $ 30.54 $ 38.97
Fair value of nonvested shares granted $ 978 $ 865 $ 974
Fair value of shares vested $ 664 $ 204 $ 43
Stock-based compensation expense, along with the related income tax benefit, for each of the past three fiscal years is presented in the table below:
Fiscal Year Ended
October 31, October 25, October 26, (in thousands) 2010 2009 2008
Stock-based compensation expense recognized $ 14,402 $ 12,054 $ 14,691
Income tax benefit recognized (5,510) (4,633) (5,611)
After-tax stock-based compensation expense $ 8,892 $ 7,421 $ 9,080
At October 31, 2010, there was $12.5 million of total unrec-ognized compensation cost from stock-based compensation arrangements granted under the plans. This compensation is expected to be recognized over a weighted-average period of approximately 2.3 years. During fiscal years 2010, 2009, and 2008, cash received from stock option exercises was $22.9 million, $2.4 million, and $11.3 million, respectively. The total tax benefit to be realized for tax deductions from these option exercises was $18.9 million, $1.3 million, and $10.6 million, respectively.
Shares issued for option exercises and nonvested shares may be either authorized but unissued shares, or shares of treasury stock acquired in the open market or otherwise. The number of shares available for future grants (in thousands) was 17,647 at October 25, 2010, 18,998 at October 25, 2009, and 7,161 at October 26, 2008.
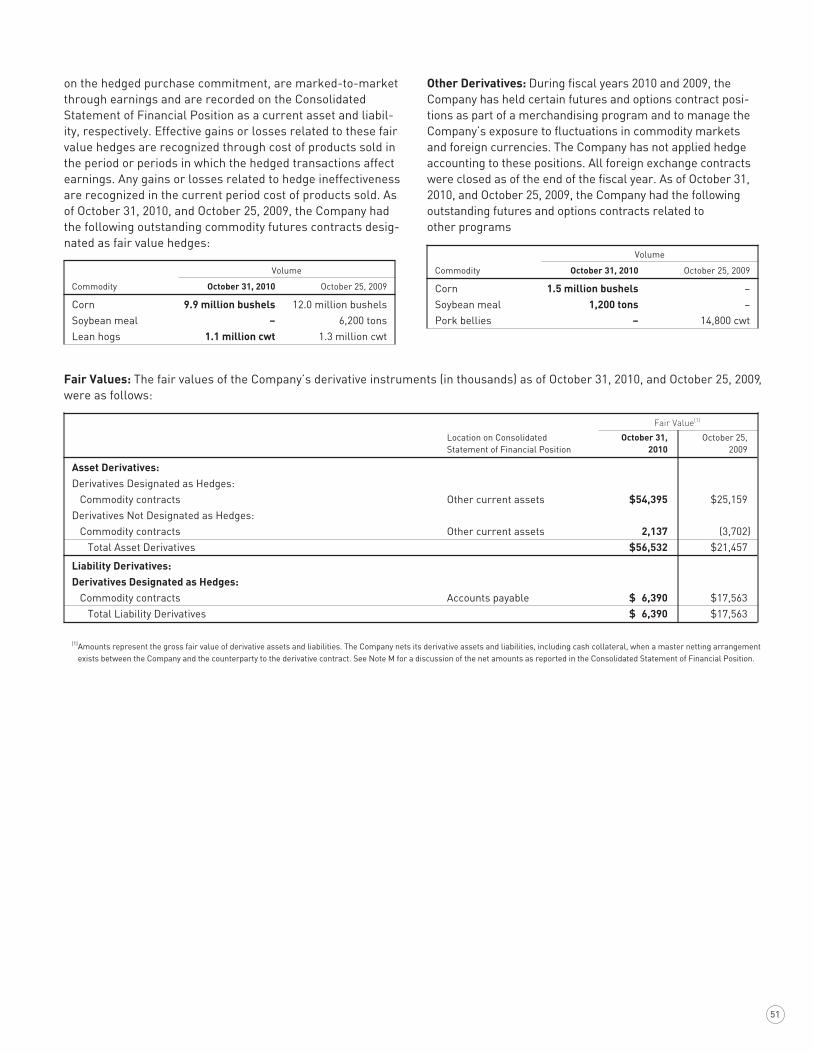
51
Other Derivatives: During fiscal years 2010 and 2009, the Company has held certain futures and options contract posi-tions as part of a merchandising program and to manage the Company’s exposure to fluctuations in commodity markets and foreign currencies. The Company has not applied hedge accounting to these positions. All foreign exchange contracts were closed as of the end of the fiscal year. As of October 31, 2010, and October 25, 2009, the Company had the following outstanding futures and options contracts related to other programs
Volume
Commodity October 31, 2010 October 25, 2009
Corn 1.5 million bushels –Soybean meal 1,200 tons –Pork bellies – 14,800 cwt
on the hedged purchase commitment, are marked-to-market through earnings and are recorded on the Consolidated Statement of Financial Position as a current asset and liabil-ity, respectively. Effective gains or losses related to these fair value hedges are recognized through cost of products sold in the period or periods in which the hedged transactions affect earnings. Any gains or losses related to hedge ineffectiveness are recognized in the current period cost of products sold. As of October 31, 2010, and October 25, 2009, the Company had the following outstanding commodity futures contracts desig-nated as fair value hedges:
Volume
Commodity October 31, 2010 October 25, 2009
Corn 9.9 million bushels 12.0 million bushelsSoybean meal – 6,200 tonsLean hogs 1.1 million cwt 1.3 million cwt
Fair Values: The fair values of the Company’s derivative instruments (in thousands) as of October 31, 2010, and October 25, 2009, were as follows:
Fair Value(1)
Location on Consolidated October 31, October 25, Statement of Financial Position 2010 2009
Asset Derivatives:Derivatives Designated as Hedges: Commodity contracts Other current assets $ 54,395 $ 25,159Derivatives Not Designated as Hedges: Commodity contracts Other current assets 2,137 (3,702) Total Asset Derivatives $ 56,532 $ 21,457
Liability Derivatives:Derivatives Designated as Hedges: Commodity contracts Accounts payable $ 6,390 $ 17,563 Total Liability Derivatives $ 6,390 $ 17,563
(1) Amounts represent the gross fair value of derivative assets and liabilities. The Company nets its derivative assets and liabilities, including cash collateral, when a master netting arrangement exists between the Company and the counterparty to the derivative contract. See Note M for a discussion of the net amounts as reported in the Consolidated Statement of Financial Position.
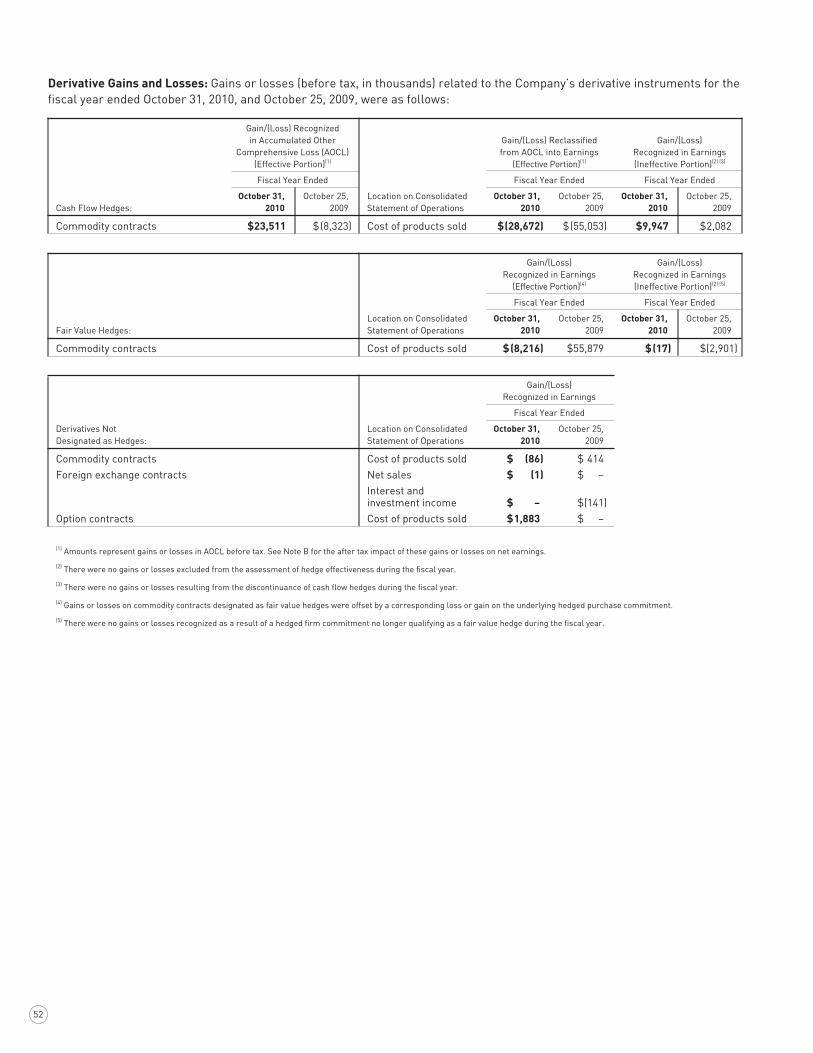
52
Derivative Gains and Losses: Gains or losses (before tax, in thousands) related to the Company’s derivative instruments for the fiscal year ended October 31, 2010, and October 25, 2009, were as follows:
Gain/(Loss) Recognized in Accumulated Other Gain/(Loss) Reclassified Gain/(Loss) Comprehensive Loss (AOCL) from AOCL into Earnings Recognized in Earnings (Effective Portion)(1) (Effective Portion)(1) (Ineffective Portion)(2) (3)
Fiscal Year Ended Fiscal Year Ended Fiscal Year Ended
October 31, October 25, Location on Consolidated October 31, October 25, October 31, October 25, Cash Flow Hedges: 2010 2009 Statement of Operations 2010 2009 2010 2009
Commodity contracts $ 23,511 $ (8,323) Cost of products sold $ (28,672) $ (55,053) $ 9,947 $ 2,082
Gain/(Loss) Gain/(Loss) Recognized in Earnings Recognized in Earnings (Effective Portion)(4) (Ineffective Portion)(2) (5)
Fiscal Year Ended Fiscal Year Ended
Location on Consolidated October 31, October 25, October 31, October 25, Fair Value Hedges: Statement of Operations 2010 2009 2010 2009
Commodity contracts Cost of products sold $ (8,216) $ 55,879 $ (17) $ (2,901)
Gain/(Loss) Recognized in Earnings
Fiscal Year Ended
Derivatives Not Location on Consolidated October 31, October 25, Designated as Hedges: Statement of Operations 2010 2009
Commodity contracts Cost of products sold $ (86) $ 414 Foreign exchange contracts Net sales $ (1) $ – Interest and
investment income $ – $ (141)Option contracts Cost of products sold $ 1,883 $ –
(1) Amounts represent gains or losses in AOCL before tax. See Note B for the after tax impact of these gains or losses on net earnings.
(2) There were no gains or losses excluded from the assessment of hedge effectiveness during the fiscal year.
(3) There were no gains or losses resulting from the discontinuance of cash flow hedges during the fiscal year.
(4) Gains or losses on commodity contracts designated as fair value hedges were offset by a corresponding loss or gain on the underlying hedged purchase commitment.
(5) There were no gains or losses recognized as a result of a hedged firm commitment no longer qualifying as a fair value hedge during the fiscal year.

53
Note MFAIR VALUE MEASUREMENTS
Effective at the beginning of fiscal 2009, the Company adopted the provisions of ASC 820, Fair Value Measurements and Disclosures (ASC 820) for its financial assets and liabilities carried at fair value on a recurring basis in the consolidated financial statements. The fair value of those assets and liabilities as of October 31, 2010, and October 25, 2009, and their level within the fair value hierar-chy, are presented in the table below.
Fair Value Measurements at October 31, 2010
Quoted Prices in Fair Value at Active Markets Significant Other Significant October 31, for Identical Observable Unobservable (in thousands) 2010 Assets (Level 1) Inputs (Level 2) Inputs (Level 3)
Assets at Fair Value: Cash equivalents(1) $ 360,064 $ 360,064 $ – $ – Short-term marketable securities(2) 50,595 66 50,529 – Other trading securities(3) 109,153 49,889 59,264 – Commodity derivatives(4) 11,604 11,604 – – Total Assets at Fair Value $ 531,416 $ 421,623 $ 109,793 $ –
Liabilities at Fair Value: Commodity derivatives(4) $ 6,390 $ – $ 6,390 $ – Deferred compensation(3) 42,141 13,298 28,843 – Total Liabilities at Fair Value $ 48,531 $ 13,298 $ 35,233 $ –
Fair Value Measurements at October 25, 2009
Quoted Prices in Active Markets Significant Other Significant Fair Value at for Identical Observable Unobservable (in thousands) October 25, 2009 Assets (Level 1) Inputs (Level 2) Inputs (Level 3)
Assets at Fair Value: Cash equivalents(1) $ 290,476 $ 290,476 $ – $ – Other trading securities(3) 103,801 49,608 54,193 – Commodity derivatives(4) 6,776 6,776 – – Total Assets at Fair Value $ 401,053 $ 346,860 $ 54,193 $ –
Liabilities at Fair Value: Commodity derivatives(4) $ 17,563 $ – $ 17,563 $ – Deferred compensation(3) 38,786 10,670 28,116 – Total Liabilities at Fair Value $ 56,349 $ 10,670 $ 45,679 $ –
The following methods and assumptions were used to estimate the fair value of the financial assets and liabilities above:
(1) The Company’s cash equivalents consist of money market funds rated AAA. As these investments have a maturity date of three months or less, the carrying value approximates fair value.
(2) The Company holds trading securities as part of a portfolio maintained to generate investment income and to provide cash for operations of the Company, if necessary. The portfolio is managed by a third party who is responsible for daily trading activities, and all assets within the portfolio are highly liquid. The cash and highly rated money market funds held by the portfolio are classified as Level 1. The current investment portfolio also includes corporate bonds, agency securities, mortgage-backed securities, and other asset-backed securities for which there is an active, quoted market. Market prices are obtained from a variety of industry standard providers, large financial institutions, and other third-party sources to calculate a representative daily market value, and therefore, these securities are classified as Level 2.
(3) The Company also holds trading securities as part of a rabbi trust to fund certain supplemental executive retirement plans and deferred income plans. The rabbi trust is included in other assets on the Consolidated Statements of Financial Position and is valued based on the underlying fair value of each fund held by the trust. A portion of the funds held related to the sup-plemental executive retirement plans have been invested in fixed income funds managed by a third party. The declared rate on these funds is set based on a formula using the yield of the general account investment portfolio that supports the fund, adjusted for expenses and other charges. The rate is guaranteed for one year at issue, and may be reset annually on the policy anniversary, subject to a guaranteed minimum rate. As the value is based on adjusted market rates, and the fixed rate is only reset on an annual basis, these funds are classified as Level 2. The remaining funds held are also managed by a third party, and include equity securities, money market accounts, bond funds, or other portfolios for which there is an active quoted market. Therefore these securities are classified as Level 1. The related deferred compensation liabilities are included in other long-term liabilities on the Consolidated Statements of Financial Position and are valued based on the underlying investment selections held in each participant’s account. Investment options generally mirror those funds held by the rabbi trust, for which there is an active quoted market. Therefore these investment balances are classified as Level 1. The Company also offers a fixed rate investment option to participants. The rate earned on these investments is adjusted annually based on a specified percentage of I.R.S. Applicable Federal Rates in effect and therefore these balances are classified as Level 2.
(4) The Company’s commodity derivatives represent futures contracts, option contracts, and swaps used in its hedging programs to offset price fluctuations associated with purchases of corn, soybean meal, and natural gas, and to minimize the price risk assumed when forward priced contracts are offered to the Company’s commodity suppliers. The Company’s futures and options contracts for corn and soybean meal are traded on the Chicago Board of Trade (CBOT), while futures contracts for lean hogs and bellies are traded on the Chicago Mercantile Exchange. These are active markets with quoted prices available and therefore the futures contracts are classified as Level 1. The Company’s corn and soybean meal swaps settle based on quoted prices from the CBOT, while natural gas swaps are settled based on quoted prices from the New York Mercantile Exchange. As the swaps settle based on quoted market prices, but are not held directly with the exchange, the swaps are classified as Level 2. All derivatives are reviewed for potential credit risk and risk of nonperformance. The Company nets its derivative assets and liabilities, including cash collateral, when a master netting arrangement exists between the Company and the counterparty to the derivative contract. The net balance for each arrangement is included in other current assets or accounts payable, as appropriate, in the Consolidated Statements of Financial Position. As of October 31, 2010, the Company has recognized the obligation to return cash collateral of $44.9 million to various counterparties. As of October 25, 2009, the Company had recognized the right to reclaim cash collateral of $2.2 million from, and the obligation to return cash collateral of $16.9 million to, various counterparties.
54
Foods businesses. Precept Foods, LLC, is a 50.01 percent owned joint venture between Hormel Foods Corporation and Cargill Meat Solutions Corporation, a wholly-owned subsid-iary of Cargill, Incorporated.
The Jennie-O Turkey Store segment consists primarily of the processing, marketing, and sale of branded and unbranded turkey products for retail, foodservice, and fresh product customers.
The Specialty Foods segment includes the Diamond Crystal Brands, Century Foods International, and Hormel Specialty Products operating segments. This segment consists of the packaging and sale of various sugar and sugar substitute products, salt and pepper products, liquid portion products, dessert mixes, ready-to-drink products, sports nutrition products, gelatin products, and private label canned meats to retail and foodservice customers. This segment also includes the processing, marketing, and sale of nutritional food prod-ucts and supplements to hospitals, nursing homes, and other marketers of nutritional products.
The All Other segment includes the Hormel Foods International operating segment, which manufactures, markets, and sells Company products internationally. This segment also includes the results from the Company’s inter-national joint ventures and miscellaneous corporate sales.
Intersegment sales are recorded at prices that approximate cost and are eliminated in the Consolidated Statements of Operations. The Company does not allocate investment income, interest expense, and interest income to its segments when measuring performance. The Company also retains various other income and unallocated expenses at corporate. Equity in earnings of affiliates is included in segment operat-ing profit; however, earnings attributable to the Company’s noncontrolling interests are excluded. These items are included below as net interest and investment income, gen-eral corporate expense, and noncontrolling interest when reconciling to earnings before income taxes.
The Company’s financial assets and liabilities also include cash, accounts receivable, accounts payable, and other liabili-ties, for which carrying value approximates fair value. The Company does not carry its long-term debt at fair value in its Consolidated Statements of Financial Position. Based on bor-rowing rates available to the Company for long-term financing with similar terms and average maturities, the fair value of long-term debt (including current maturities), utilizing dis-counted cash flows, was $371.8 million as of October 31, 2010, and $383.5 million as of October 25, 2009.
As discussed in Note A, the FASB allowed deferral of the provisions of ASC 820 for one year for nonfinancial assets and liabilities measured at fair value that are recognized or disclosed on a nonrecurring basis. Pursuant to this allowed deferral, the Company adopted the provisions of ASC 820 at the beginning of fiscal 2010 for its nonfinancial assets and lia-bilities. During the second quarter of fiscal 2010, the Company made the decision to close its Valley Fresh plant in Turlock, California. The facilities in that location were evaluated during that process and the Company recorded a pretax charge of $6.6 million to reduce the property, plant and equipment to its current estimated fair value. During the fiscal year ended October 31, 2010, there were no other material remeasure-ments of assets or liabilities at fair value on a nonrecurring basis subsequent to their initial recognition.
Note NSEGMENT REPORTING
The Company develops, processes, and distributes a wide array of food products in a variety of markets. The Company reports its results in the following five segments: Grocery Products, Refrigerated Foods, Jennie-O Turkey Store, Specialty Foods, and All Other.
The Grocery Products segment consists primarily of the processing, marketing, and sale of shelf-stable food products sold predominantly in the retail market. This segment also includes the results from the Company’s MegaMex Foods, LLC (MegaMex) joint venture.
The Refrigerated Foods segment includes the Hormel Refrigerated operating segment and the Affiliated Business Units. This segment consists primarily of the processing, marketing, and sale of branded and unbranded pork and beef products for retail, foodservice, and fresh product customers. The Affiliated Business Units include the Farmer John, Burke Corporation, Dan’s Prize, Saag’s Products, Inc., and Precept
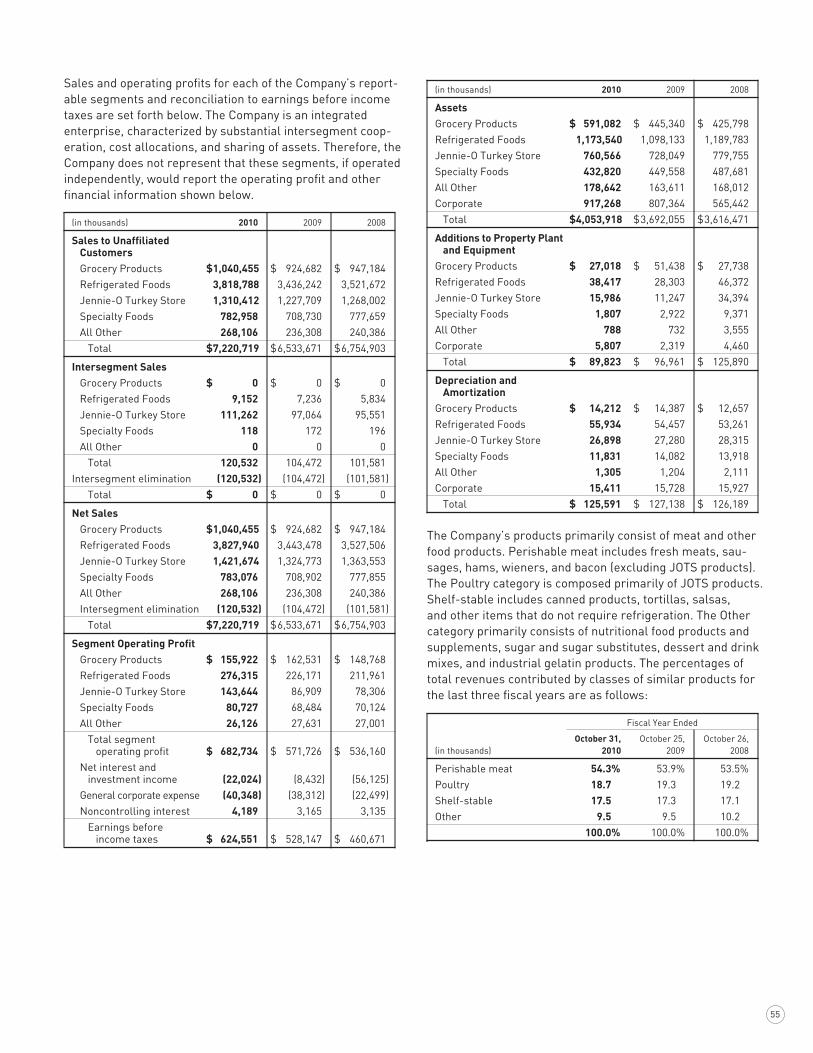
55
(in thousands) 2010 2009 2008
Assets Grocery Products $ 591,082 $ 445,340 $ 425,798Refrigerated Foods 1,173,540 1,098,133 1,189,783 Jennie-O Turkey Store 760,566 728,049 779,755 Specialty Foods 432,820 449,558 487,681 All Other 178,642 163,611 168,012 Corporate 917,268 807,364 565,442 Total $ 4,053,918 $ 3,692,055 $ 3,616,471
Additions to Property Plant and Equipment
Grocery Products $ 27,018 $ 51,438 $ 27,738Refrigerated Foods 38,417 28,303 46,372 Jennie-O Turkey Store 15,986 11,247 34,394 Specialty Foods 1,807 2,922 9,371 All Other 788 732 3,555 Corporate 5,807 2,319 4,460 Total $ 89,823 $ 96,961 $ 125,890
Depreciation and Amortization
Grocery Products $ 14,212 $ 14,387 $ 12,657Refrigerated Foods 55,934 54,457 53,261 Jennie-O Turkey Store 26,898 27,280 28,315 Specialty Foods 11,831 14,082 13,918 All Other 1,305 1,204 2,111 Corporate 15,411 15,728 15,927 Total $ 125,591 $ 127,138 $ 126,189
The Company’s products primarily consist of meat and other food products. Perishable meat includes fresh meats, sau-sages, hams, wieners, and bacon (excluding JOTS products). The Poultry category is composed primarily of JOTS products. Shelf-stable includes canned products, tortillas, salsas, and other items that do not require refrigeration. The Other category primarily consists of nutritional food products and supplements, sugar and sugar substitutes, dessert and drink mixes, and industrial gelatin products. The percentages of total revenues contributed by classes of similar products for the last three fiscal years are as follows:
Fiscal Year Ended
October 31, October 25, October 26, (in thousands) 2010 2009 2008
Perishable meat 54.3% 53.9% 53.5%Poultry 18.7 19.3 19.2Shelf-stable 17.5 17.3 17.1Other 9.5 9.5 10.2 100.0% 100.0% 100.0%
Sales and operating profits for each of the Company’s report-able segments and reconciliation to earnings before income taxes are set forth below. The Company is an integrated enterprise, characterized by substantial intersegment coop-eration, cost allocations, and sharing of assets. Therefore, the Company does not represent that these segments, if operated independently, would report the operating profit and other financial information shown below.
(in thousands) 2010 2009 2008
Sales to Unaffiliated Customers
Grocery Products $ 1,040,455 $ 924,682 $ 947,184 Refrigerated Foods 3,818,788 3,436,242 3,521,672 Jennie-O Turkey Store 1,310,412 1,227,709 1,268,002 Specialty Foods 782,958 708,730 777,659 All Other 268,106 236,308 240,386 Total $ 7,220,719 $ 6,533,671 $ 6,754,903
Intersegment Sales Grocery Products $ 0 $ 0 $ 0 Refrigerated Foods 9,152 7,236 5,834 Jennie-O Turkey Store 111,262 97,064 95,551 Specialty Foods 118 172 196 All Other 0 0 0 Total 120,532 104,472 101,581 Intersegment elimination (120,532) (104,472) (101,581) Total $ 0 $ 0 $ 0
Net Sales Grocery Products $ 1,040,455 $ 924,682 $ 947,184 Refrigerated Foods 3,827,940 3,443,478 3,527,506 Jennie-O Turkey Store 1,421,674 1,324,773 1,363,553 Specialty Foods 783,076 708,902 777,855 All Other 268,106 236,308 240,386 Intersegment elimination (120,532) (104,472) (101,581) Total $ 7,220,719 $ 6,533,671 $ 6,754,903
Segment Operating Profit Grocery Products $ 155,922 $ 162,531 $ 148,768 Refrigerated Foods 276,315 226,171 211,961 Jennie-O Turkey Store 143,644 86,909 78,306 Specialty Foods 80,727 68,484 70,124 All Other 26,126 27,631 27,001 Total segment
operating profit $ 682,734 $ 571,726 $ 536,160 Net interest and
investment income (22,024) (8,432) (56,125) General corporate expense (40,348) (38,312) (22,499) Noncontrolling interest 4,189 3,165 3,135 Earnings before
income taxes $ 624,551 $ 528,147 $ 460,671
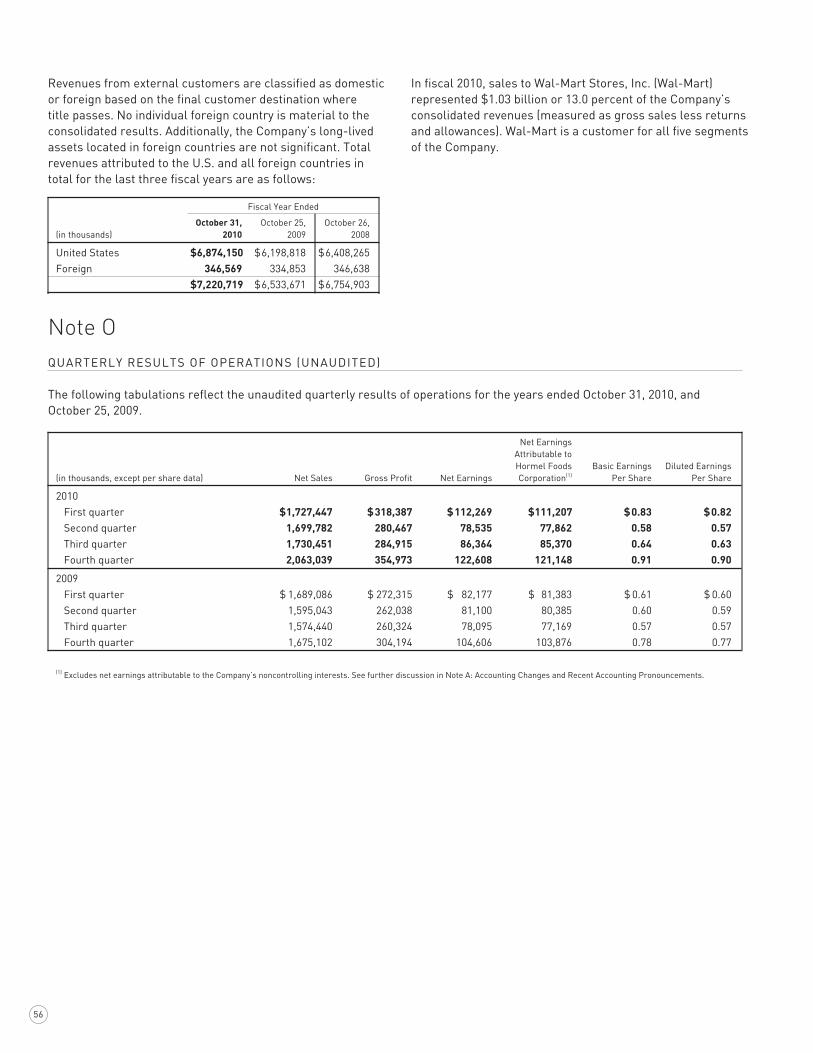
56
In fiscal 2010, sales to Wal-Mart Stores, Inc. (Wal-Mart) represented $1.03 billion or 13.0 percent of the Company’s consolidated revenues (measured as gross sales less returns and allowances). Wal-Mart is a customer for all five segments of the Company.
Revenues from external customers are classified as domestic or foreign based on the final customer destination where title passes. No individual foreign country is material to the consolidated results. Additionally, the Company’s long-lived assets located in foreign countries are not significant. Total revenues attributed to the U.S. and all foreign countries in total for the last three fiscal years are as follows:
Fiscal Year Ended
October 31, October 25, October 26, (in thousands) 2010 2009 2008
United States $ 6,874,150 $ 6,198,818 $ 6,408,265Foreign 346,569 334,853 346,638 $ 7,220,719 $ 6,533,671 $ 6,754,903
Note OQUARTERLY RESULTS OF OPERATIONS (UNAUDITED)
The following tabulations reflect the unaudited quarterly results of operations for the years ended October 31, 2010, and October 25, 2009.
Net Earnings Attributable to Hormel Foods Basic Earnings Diluted Earnings (in thousands, except per share data) Net Sales Gross Profit Net Earnings Corporation(1) Per Share Per Share
2010 First quarter $ 1,727,447 $ 318,387 $ 112,269 $ 111,207 $ 0.83 $ 0.82 Second quarter 1,699,782 280,467 78,535 77,862 0.58 0.57 Third quarter 1,730,451 284,915 86,364 85,370 0.64 0.63 Fourth quarter 2,063,039 354,973 122,608 121,148 0.91 0.90
2009 First quarter $ 1,689,086 $ 272,315 $ 82,177 $ 81,383 $ 0.61 $ 0.60 Second quarter 1,595,043 262,038 81,100 80,385 0.60 0.59 Third quarter 1,574,440 260,324 78,095 77,169 0.57 0.57 Fourth quarter 1,675,102 304,194 104,606 103,876 0.78 0.77
(1) Excludes net earnings attributable to the Company’s noncontrolling interests. See further discussion in Note A: Accounting Changes and Recent Accounting Pronouncements.
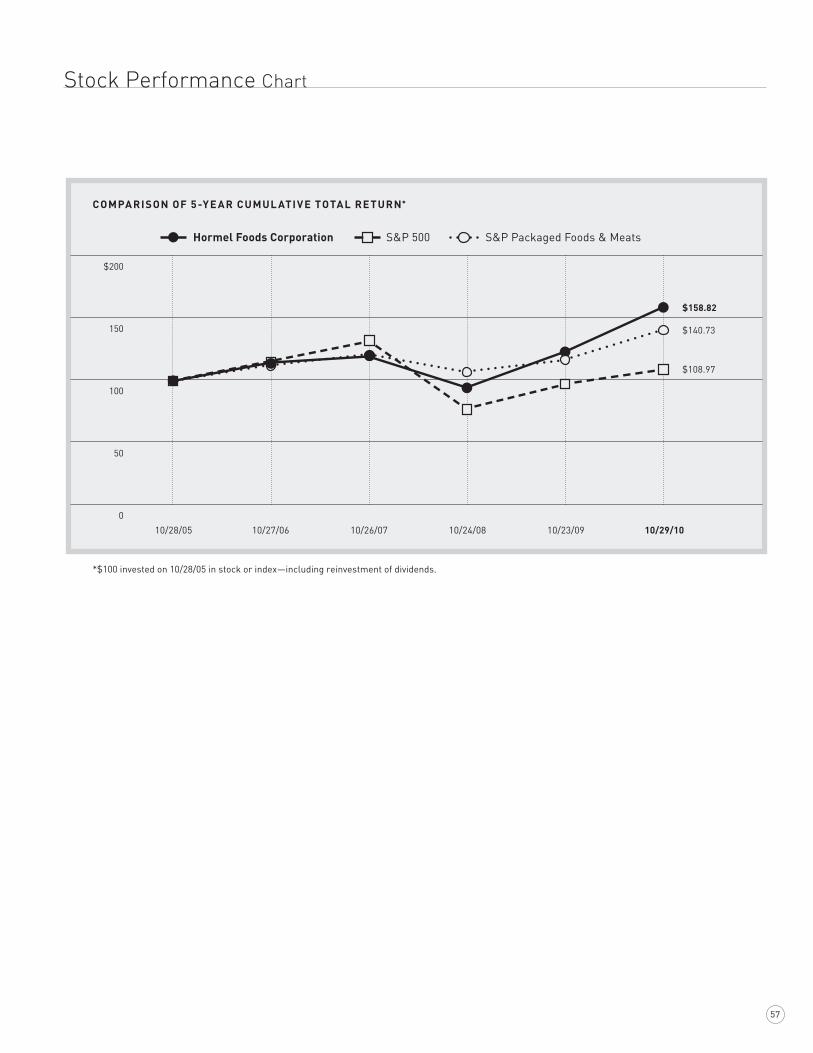
57
Stock Performance Chart
COMPARISON OF 5-YE AR CUMUL ATIVE TOTAL RETURN*
Hormel Foods Corporation S&P 500 S&P Packaged Foods & Meats
$200
150
100
50
0
*$100 invested on 10/28/05 in stock or index—including reinvestment of dividends.
10/28/05 10/27/06 10/26/07 10/24/08 10/23/09 10/29/10
$158.82
$140.73
$108.97
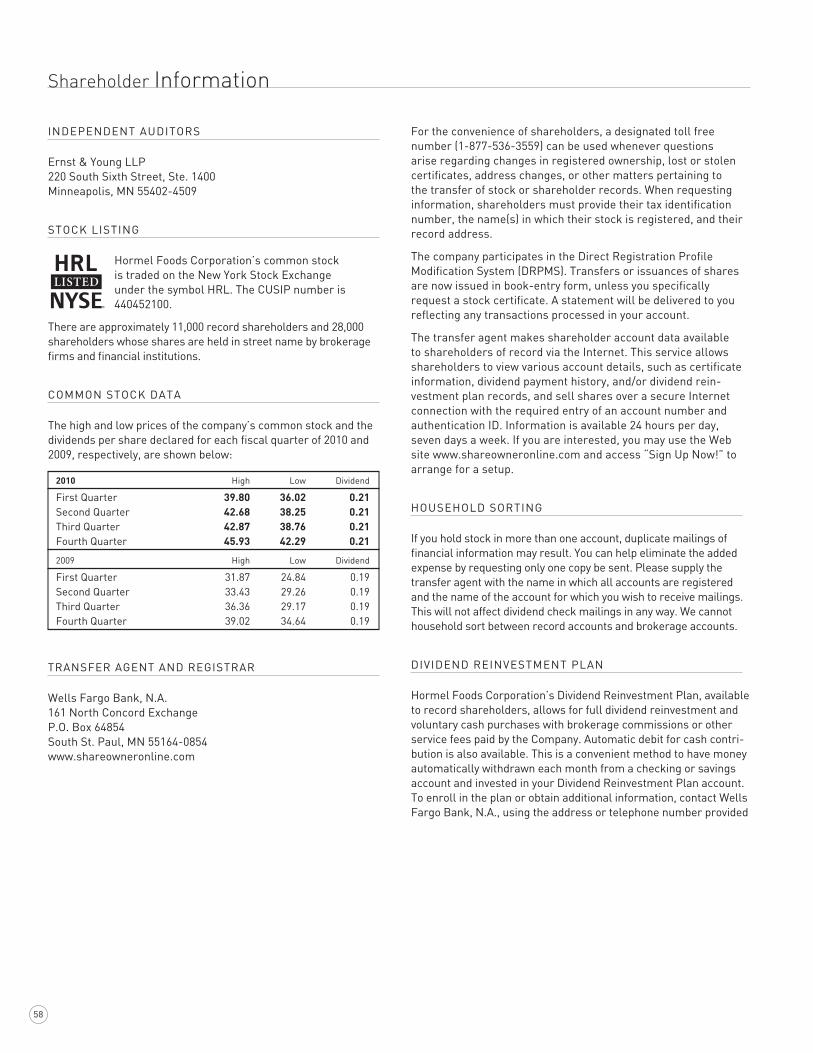
58
Shareholder Information
INDEPENDENT AUDITORS
Ernst & Young LLP 220 South Sixth Street, Ste. 1400 Minneapolis, MN 55402-4509
STOCk LISTING
Hormel Foods Corporation’s common stock is traded on the New York Stock Exchange under the symbol HRL. The CUSIP number is 440452100.
There are approximately 11,000 record shareholders and 28,000 shareholders whose shares are held in street name by brokerage firms and financial institutions.
COMMON STOCk DATA
The high and low prices of the company’s common stock and the dividends per share declared for each fiscal quarter of 2010 and 2009, respectively, are shown below:
2010 High Low Dividend
First Quarter 39.80 36.02 0.21Second Quarter 42.68 38.25 0.21Third Quarter 42.87 38.76 0.21Fourth Quarter 45.93 42.29 0.21
2009 High Low Dividend
First Quarter 31.87 24.84 0.19Second Quarter 33.43 29.26 0.19Third Quarter 36.36 29.17 0.19Fourth Quarter 39.02 34.64 0.19
TRANSFER AGENT AND REGISTRAR
Wells Fargo Bank, N.A. 161 North Concord Exchange P.O. Box 64854 South St. Paul, MN 55164-0854 www.shareowneronline.com
For the convenience of shareholders, a designated toll free number (1-877-536-3559) can be used whenever questions arise regarding changes in registered ownership, lost or stolen certificates, address changes, or other matters pertaining to the transfer of stock or shareholder records. When requesting information, shareholders must provide their tax identification number, the name(s) in which their stock is registered, and their record address.
The company participates in the Direct Registration Profile Modification System (DRPMS). Transfers or issuances of shares are now issued in book-entry form, unless you specifically request a stock certificate. A statement will be delivered to you reflecting any transactions processed in your account.
The transfer agent makes shareholder account data available to shareholders of record via the Internet. This service allows shareholders to view various account details, such as certificate information, dividend payment history, and/or dividend rein-vestment plan records, and sell shares over a secure Internet connection with the required entry of an account number and authentication ID. Information is available 24 hours per day, seven days a week. If you are interested, you may use the Web site www.shareowneronline.com and access “Sign Up Now!” to arrange for a setup.
HOUSEHOLD SORTING
If you hold stock in more than one account, duplicate mailings of financial information may result. You can help eliminate the added expense by requesting only one copy be sent. Please supply the transfer agent with the name in which all accounts are registered and the name of the account for which you wish to receive mailings. This will not affect dividend check mailings in any way. We cannot household sort between record accounts and brokerage accounts.
DIVIDEND REINVESTMENT PLAN
Hormel Foods Corporation’s Dividend Reinvestment Plan, available to record shareholders, allows for full dividend reinvestment and voluntary cash purchases with brokerage commissions or other service fees paid by the Company. Automatic debit for cash contri-bution is also available. This is a convenient method to have money automatically withdrawn each month from a checking or savings account and invested in your Dividend Reinvestment Plan account. To enroll in the plan or obtain additional information, contact Wells Fargo Bank, N.A., using the address or telephone number provided

59
with its listing in this section as Company transfer agent and registrar. Enrollment in the plan is also available on the Internet at www.shareowneronline.com
An optional direct dividend deposit service offers shareholders a convenient method of having quarterly dividend payments electroni-cally deposited into their personal checking or savings account. The dividend payment is made in the account each payment date, provid-ing shareholders with immediate use of their money. For information about the service and how to participate, contact Wells Fargo Bank, N.A., transfer agent. You may also activate this feature on the Internet at www.shareowneronline.com.
DIVIDENDS
The declaration of dividends and all dates related to the declara-tion of dividends are subject to the judgment and discretion of the Board of Directors of Hormel Foods Corporation. Quarterly dividends are typically paid on the 15th of February, May, August, and November. Postal delays may cause receipt dates to vary.
REPORTS AND PUBLICATIONS
Copies of the company’s Form 10-k (annual report) and Form 10-Q (quarterly report) to the Securities and Exchange Commission (SEC), proxy statement, all news releases and other corporate literature are available free upon request by calling (507) 437-5345 or by accessing the information on the Internet at www.hormelfoods.com. Notice and access to the Company’s Annual Report is mailed approximately one month before the Annual Meeting. The Annual Report can be viewed at the Web site named above or a hard copy will be available free upon request via email, mail or by calling (507) 437-5571.
ANNUAL MEETING
The Annual Meeting of Shareholders will be held on Monday, January 31, 2011 in the Richard L. knowlton Auditorium at Austin (Minn.) High School. The meeting will convene at 8:00 p.m. (CT).
QUESTIONS ABOUT HORMEL FOODS
Shareholder Inquiries (507) 437-5944
Analyst/Investor Inquiries (507) 437-5248
Media Inquiries (507) 437-5345
CONSUMER RESPONSE
Inquiries regarding products of Hormel Foods Corporation should be addressed:
Consumer Response Hormel Foods Corporation 1 Hormel Place Austin, MN 55912-3680 or call 1-800-523-4635
TRADEMARkS
References in italic within this report represent valuable trade-marks owned or licensed by Hormel Foods, LLC or other subsid-iaries of Hormel Foods Corporation.
“Country Crock” is a registered trademark of the Unilever Group of Companies and is used under license. All rights reserved.

60
Corporate Officers
Jeffrey M. Ettinger*
Chairman of the Board,President and Chief Executive Officer
Jody H. Feragen*
Executive Vice Presidentand Chief Financial Officer
Steven G. BinderExecutive Vice President
Ronald W. FieldingExecutive Vice President
Richard A. BrossGroup Vice PresidentPresident, Hormel Foods International
Thomas R. DayGroup Vice President
James M. SplinterGroup Vice President
Robert A. TegtGroup Vice PresidentPresident, Jennie-O Turkey Store, Inc.
Michael D. TolbertGroup Vice President
Larry L. VorpahlGroup Vice President
James W. CavanaughSenior Vice Presidentand General Counsel
William F. SnyderSenior Vice President
D. Scott AakreVice President
Deanna T. BradyVice President
Julie H. CravenVice President
Michael L. DevineVice President
Bryan D. FarnsworthVice President
Roland G. GentzlerVice President and Treasurer
Dennis B. GoettschVice President
Daniel A. HartzogVice President
Brian D. JohnsonVice President and Corporate Secretary
David P. JuhlkeVice President
Donald H. KreminVice President
Phillip L. Minerich, Ph.D.Vice President
Kurt F. MuellerVice President
Douglas R. ReetzVice President
James R. SchroederVice President
Bruce R. SchweitzerVice President
James N. SheehanVice President and Controller
James P. SneeVice President
Joe C. SwedbergVice President
James T. AndersonAssistant Controller
*Director

A balanced business modelThe balanced business model at Hormel Foods is a key driver for our annual growth. Through five segments — Grocery Products, Refrigerated Foods, Jennie-O Turkey Store, Specialty Foods and All Other — we insulate ourselves from ever-changing market forces. The diversity of these different businesses allow us to be successful in a variety of economic conditions.
Table of conTenTs
1 Letter to shareholders 4 At-a-glance 5 Balance 10 Corporate responsibility 12 Financial section
58 Shareholder information 60 Corporate officers 61 Board of directors
segment operating profit: 2005 - 2010
● Year-over-Year growth ● Year-over-Year decline
-8% 16%3% 6%13% 69%
-5%4% 5% 71%8% 78%
-17%
-27%
-2%
-5%
3%
5%
9% 7% 2%
5%
6%
7%
19% -4% 18%
17%
22%
22% 65%
11%
26%
14% 17%
33%
fY 2005
fY 2006
fY 2007
fY 2008
fY 2009
fY 2010
grocerY products
refrigerated foods
jennie-o turkeY store
specialtY foods
all other
total segment
Board of Directors
terrell k. crewsRetired as Executive Vice President,Chief Financial Officer and VegetableBusiness CEO of Monsanto Company in November 2009
Director since October 2007
jeffrey m. ettingerChairman of the Board,President and Chief Executive Officer
Director since May 2004
jody h. feragenExecutive Vice Presidentand Chief Financial Officer
Director since October 2007
susan i. marvinPresident,Marvin Windows and Doors
Director since July 2002
john l. morrisonManaging Director,Goldner Hawn Johnson &Morrison Incorporated
Director since November 2003
elsa a. murano, ph.d.Professor of Nutrition and Food Science,Texas A&M University
Director since September 2006
robert c. nakasoneChief Executive Officer,NAK Enterprises, LLC
Director since September 2006
susan k. nestegardPresident,Global Healthcare Sector,Ecolab Inc.
Director since October 2009
ronald d. pearsonChairman Emeritus,Hy-Vee, Inc.
Director since October 2007
dakota a. pippinsPresident and Chief Executive Officer,Pippins Strategies, LLC
Director since January 2001
hugh c. smith, m.d.Professor of Medicine,Mayo Clinic College of Medicine
Director since September 2006
john g. turnerChairman,Hillcrest Capital Partners
Director since March 2000
Front Row, from left: john turner, jeffrey ettinger, susan marvin
Back Row, from left: terrell crews, john morrison, ronald pearson, hugh smith, elsa murano, susan nestegard, dakota pippins, robert nakasone, jody feragen

Balance.
2010 annual report
Building upon our heritage of innovation and quality, together we will elevate the everyday experience by making Hormel Foods the favorite part of any eating occasion.Mission: Hormel Foods is a leading branded food company with a focus on profitable growth. Inspired by our founder’s
charge to “originate, don’t imitate,” we market a balanced portfolio of highly differentiated quality products. We engage our
employees by creating an environment where careers are fostered, people make a difference and integrity is absolute.
To learn more about Our Way, visit www.HormelFoods.com
Printedonrecycledpaper.Pleaserecycle.This report was printed using soy-based inks. Cover and pages 1-12 contain 10% total recovered fiber/all post-consumer waste, FSC Certified Fiber. Pages 13-60 contain 30% total recovered fiber/all post-consumer waste, FSC Certified Fiber.
Hormel Foods Corporation 1 Hormel Place Austin, MN 55912-3680 10%