Embed Size (px)
Citation preview
Series No. SDT: 32-23
GOVERNMENT OF TONGA
BALANCE OF PAYMENTS
ANNUAL REPORT
2015-16
Issued by : Statistics DepartmentP.O.Box 149Nuku’alofaTongaWebsite:www.spc.int/prism/tonga/Email:[email protected]
June 2017Price: $25
1
Preface
This bulletin presents the Tonga Balance of Payments statistics for the year 2015-16
This report contains an introductory note which explains the Balance of Payments statements andthe sources of data. It is then followed by technical notes on the scope and methodology of thestatistics and a short analysis and graphs of selected items together with referenced tables.
I wish to thank all organizations both in Government and in the Private sector, which havesupplied basic data, and in particular, the Overseas Exchange Transactions Divisions of theCommercial banks and the National Reserve Bank of Tonga. Special mention must be made ofthe hard work and devotion of the staff members of Balance of Payments Division in thecompilation of this report.
The Department would welcome any comments and suggestions to improve the contents,coverage and the quality of the statistics published in this report.
Dr. Viliami Konifelenisi FifitaGovernment Statistician.
Statistics DepartmentP.O. BOX 149Nuku’alofaTONGA
Telephone No.: (676) 23-300(676) 23-913
Fax No. : (676) 24-303E-mail [email protected] http://www.spc.int/prism/country/to/
2
Table of Contents
Preface..............................................................................................................................................1
Table of Contents .............................................................................................................................2
Symbols and Abbreviations used ....................................................................................................3
PART I
Introductory and Technical Notes ............................................................................................. 4-11
PART II
Analysis and Graphs ................................................................................................................ 12-18
PART III
Summary Tables
Table 1 Balance of Payments Ratio…........................................ ...........................19
Table 2 Balance of Payment Summary…………………………………………..19
Table 3 Goods Account……………………………………..................................20
Table 4 Services Account………………………………………………………...20
Table 5 Primary Income Account………………………………………………...21
Table 6 Secondary Income Account……………………………………………...21
Table 7 Capital Account………………………………………………………….21
3
Symbols and Abbreviations used
The following symbols and abbreviations are used throughout the bulletin.
- Nil
… Not available
r Revised
T$ Tongan Pa’anga
000 Thousand
f.o.b Free On Board in the exporting country
n.i.e. Not Identified Elsewhere
TBOP Tonga Balance of Payment
OET Overseas Exchange Transaction
4
PART 1: Introductory and Technical Notes
I Introduction
Confidentiality of Information
The Tonga Balance of Payment (TBOP) report is published in a form that prevents anyparticular item from being identifiable as relating to any particular organization or person. Basedon these considerations, the release of some information in detailed form is restricted to thestandard form shown in the tables.
II Technical Notes
Balance of Payments statements in this publication record economic transactions between Tongaand the rest of the world (or in other words, transactions of residents of Tonga with non-residents). They show the value of goods, services, income, transfers and changes in Tonga’sclaims on the liabilities with foreigners.
TBOP is based on principles set out in the “Balance of Payments Manual 6” published by theMonetary Fund.
Sources of information
The statistics presented here are from many sources. The major ones are:
o Statistics on International Merchandise Trade compiled by the Statistics Department fromcustom entries completed for all goods exported and imported across the Tonga frontier.
o The Monthly Overseas Exchange Transaction records, prepared by all commercial banksin Tonga and the National Reserve Bank of Tonga. These records show all transactionsmade with the overseas countries through the banking system.
o The monthly returns of Tonga Government agencies located overseas.
Geographic Area
The geographic areas covered by TBOP include all island groups of Tongatapu, Vava’u,Ha’apai, ‘Eua and the Niuas.
5
Accounting System
A double entry is used to prepare the TBOP, that every transaction results in a pair of equalcredit and debit entries. Any entries, which are not automatically paired, such as grants and gifts,are deliberately furnished with special offsetting entries. The sum of all credit entries in thestatement is thus in principle numerically equal to the sum of all the debit entries, with anyinequality that may rise being attributable to net statistical errors and omissions.
Residence
The concept of residence used in TBOP includes the general government, all individuals, privatenon-profit bodies serving as public and private individual enterprises, and mobile equipmentlocated or operating within the territory of Tonga.
The general Government of Tonga includes Tongan Embassies, Consulates and other entities ofgeneral government located abroad. Embassies and consulate representatives of foreigngovernments located in Tonga are not considered as Tongan residents.
The concept of residence adopted for individuals includes all persons who may be expected toconsume goods and services, participate in the production of goods and services or engage ineconomic activities in Tonga.
The resident individuals in Tonga are considered to comprise all persons living within theterritory of Tonga for at least one year. Thus tourists, crew members of vessels or aircraftsengaged in international trade, commercial travelers and employees of non-resident enterprise(except students and diplomats) who come to Tonga for less than one year and vice versa arenon-residents. Employees of foreign governments and international bodies, such as diplomaticand consulate representatives and other foreign government personnel are treated as non-residents. Tongan citizens who are employed by foreign embassies and reside in Tonga areregarded as Tongan residents employed by foreigners. Tongan resident enterprises are actual ornotional units engaged in:
i. Production of goods and services in Tonga.ii. Transactions in land located within the territory of Tonga.iii. Transactions in leases, rights, concessions, patents, copyrights, and similar non-financial intangible assets issued by the Tongan Government.
Valuation
Balance of Payments accounts are valued at market prices, a valuation system common to thatused by the National Accounting Convention.
Market price is defined as the amount of money that a willing buyer pays to acquire somethingfrom a willing seller in a commercial transaction.
6
One important category of transaction worth mentioning is the one sided transactions. In suchtransactions, one party provides nothing on which an economic value is placed in return for areal or financial asset received from the other party. An example is the provision of capitalequipment received by the Government of Tonga or the private sector, from a donor countryunder bilateral aid programmes (eg New Zealand, Australia etc). The value of such equipmentappears in the TBOP as an import and the value of freight under transportation. The valueplaced on this type of transaction is the cost to the donor country of the goods provided orservices involved. In the example the value entered in the TBOP would be the cost of acquiringthe commodity and placing it on board a ship and the freight cost of that said commodity by thedonor country.
The counter entry to this type of transaction appears in the item transfers the same value as theoriginal transaction.
Taxes, duties, subsidies, rebates, discounts, and the like are a form of the incidental cost thatmaybe included in a transaction and taken into account in establishing its market value.Alternatively they may be regarded as a separate transaction. The IMF recommended that theincidental costs of the kind mentioned above be included in the original transaction in order tomaintain a uniform system of valuation and TBOP follows this recommendation.
Time of recording
To achieve simultaneous recording of the two entries for a given transaction in the double-entrysystem of balance of payments, rules must be adopted governing the time at which a transactionis deemed to have taken place. It should be noted that, in practice, the two entries representing atransaction are often derived independently from separate sources of data, for which the principleof timing used could be different. The time of legal change of ownership of the various assetsprovided under a contract is generally considered to be the most relevant.
Unit Account
Data on the values of transactions in real resources and financial instruments from which TBOPis compiled are expressed in a variety of currencies. In order to compile TBOP statements, thesedata must be converted to a common currency or unit of account.
Since Balance of payments statements need to be comparable with the other economic statisticsof the nation, this indicates using the national currency as the unit of account. Thus Tonga usesthe Tongan pa’anga (dollar) as the unit of account.
Measure of Balance
As previously noted balances shown by selected combinations of balance of payments accountsare of considerable interest to analysts and government officials.
A term widely used in analyzing balance of payments statements is the term ‘balance’. Abalance is calculated by adding the credit entries, for selected components and subtraction of thedebit entries, for the same components. For example, the balance of services is the sum of all
7
credit entries, minus all debit entries, for those components in the statement, which representtransaction in services.
A balance, which shows a net credit, is termed a ‘surplus’ and one showing a net debit is termeda ‘deficit’.
In the analytical presentation, components are arranged in a column. Components that comprisean analytic category are grouped together. Thus it is possible to obtain a balance by drawing ahorizontal line after the last component of an analytical category and summing all thecomponents above the line, hence the expressions ‘above the line’ and ‘below the line’.
There are two major balances in the Tonga analytical presentation. The first is the balance ofcurrent account. The current account items (above the line) include the components of goods,services, income and current transfers while the components of capital transfers and financialclaims and liabilities comprise the Capital and Financial account (below the line). The balanceon current account measures the net flow of real resources between Tonga and the rest of theworld (above the line) with the flow of financial instruments between Tonga and the rest of theworld being below the line. The items below the line include components of movements incapital transfers, reserve assets and official borrowing.
Statistical discrepancies or errors and omissions
Compiling TBOP presents some difficult problems and errors and omissions normally occur intwo major areas, namely (i) coverage and (ii) valuation.
(i) Coverage: Despite attempts to gather data on all items, some internationaltransactions are not reported. One category of transaction that probably is often substantiallyunder-reported is purchases and sales of short-term financial claims. It is widely believed thatunreported movements of short-term capital contribute a great deal to total errors and omissions.In addition, there has been no attempt to collect complete data on certain other transactions,which are estimated by balance of payments statisticians. The sample observations, on whichestimates are based, are sometimes of doubtful reliability, and even the best sampling andestimating techniques will not prevent errors of estimation.
(ii) Valuation: Although imports documents may state a precise value for a particularcommodity, a different amount may eventually be paid to the exporter. These types ofdiscrepancy can arise for a number of reasons, ranging from default by the importer to incorrectvaluation of the merchandise on the import documents.
Because of problems of coverage and valuation, total recorded debits do not equal total recordedcredits in the actual balance of payments accounts in any year.
To accommodate such discrepancies, a residual account, statistical discrepancy, is created. Anexcess of credits in all other accounts is offset by an equivalent debit to this account, or an excessof debits in other accounts is offset by an equivalent credit to this account. The statisticaldiscrepancy account thus serves at least two purposes; it gives the balance of payments analystan indication of the net error in the balance of payments data, and further it provides a means of
8
satisfying the requirement of double entry book keeping that the total debits must equal totalcredits.
III Components of the analytic presentation of theTonga Balance Of Payments (TBOP)
Exports/Imports
Details of the composition of Tonga’s trade (derived from customs data) can be found in thereports of International Merchandise Trade Statistics. However, some goods are believed to passthe Tongan frontier without customs entry and the TBOP makes adjustments to cover unrecordedimports or exports.
Foreign Trade statistics values imports c.i.f. (cost, insurance and freight) while in balance ofpayments statistics imports are valued at f.o.b. (free on board) in their country of export. Forbalance of payments purposes, an estimate is made of the cost of insurance and the freightcomponents of imports, (c.i.f.) to place these data on an f.o.b. basis. This adjustment comprisesmost of the negative entry in the debit column. The counterparts to the adjustment are madeunder transportation and insurance services.
Services
Items included under services comprise all transactions on transport, insurance, travel,communication, financial, computers and information, royalties and license fees, other businessservices, personal and government services not included elsewhere. The largest component istravel, mainly comprising “tourist” expenditure in Tonga.
Transport
Transport includes freight and other distribution services in connection with merchandise. Inaddition various services are included under the heading “transport”, including servicesperformed by carriers, principally for the carriage of passengers, which are not classified underthe heading “travel”, together with goods and services acquired by carriers and consumed in theiroperations.
Travel
Travel covers primarily spending by travelers (tourist and business visitors) during visits of lessthan one year in that economy. The goods and services are purchased by, or on behalf of, thetraveler or provided, without a quid pro quo, for international carriage of travelers, which iscovered in passenger services under transport.

9
Other Services
Other Services includes all transactions in services not included elsewhere.The main categories are divided into Private and Government Transactions which are thenfurther divided as below:
Private Transactions includes;o Communication serviceso Construction serviceso Insurance serviceso Financial serviceso Computer and information serviceso Royalties and license feeso Other business services including merchant and trade related services, operational leasing
and miscellaneous business, professional and technical services.o Personal, cultural and recreational services
Government Transactions such as;o Expenses of embassies and consulates, military units and Agencies abroad, and other
official entities located abroad; and other services provided to or obtained bygovernment. Included here are transactions of the type included in the privatetransactions listed above, but where one of the parties to the transaction is a government.
Embassies and Consulates:
Transactions consist of wages and salary payments, representing labour income of local staffsand personal expenditures by diplomatic and consular staffs and their dependents in Tonga.Other expenditures by diplomatic and consular staffs for goods and services such as officesupplies, furnishings, fuel, utilities, and rent or purchases or sales of embassy and otherbuildings, official cars, (including operation and maintenance) and official entertainment.Military Units and Agencies abroad:
These are treated in the same way as embassies and consulates.
Other official entities located abroad:
These entries cover offices of general government, which are not integrated with the embassyorganization.
Other services provided to or obtained by government:
Included here are transactions of the type included in the private transactions listed above, butwhere one of the parties to the transaction is a government.
10
Income
Income covers income of non-residents from the financial assets invested in Tonga (debit) andincome of Tongan residents from their financial assets invested abroad (credit). Sub-componentsof income are:
Compensation of employees, Investment Income: including direct investment, portfolioinvestment and other investment income.
The OET data only record cash remittances. Reinvested profits of direct investment enterprisesin Tonga are therefore currently excluded from the income component, although they should beincluded as a debit entry.
Current transfers
These are transfers undertaken without a quid pro quo (for instance, a donation, a remittance byan emigrant worker, or a country’s contribution to an international organization).
Private current transfers include remittances, contributions and other current transfers.Government current transfers include the counter entry from various foreign countries to Tongagovernment pension payments.
Balance on current account
The balance on current account is calculated as the difference between the sum of all debits andthe sum of all credits representing merchandise trade, services, income and current transfers.
The Capital and Financial Account
The capital and financial account is divided into two main categories: the capital account and thefinancial account.
The capital account covers all transactions that involve the receipt or payment of capital transfersand acquisition/disposal of non-produced, non-financial capital. The financial account covers alltransactions associated with changes of ownership in the foreign financial assets and liabilities ofan economy. Such changes include the creation and liquidation of claims on, or by, the rest ofthe world.
The financial account excluding reserves covers direct investment, portfolio investment, andother investment, which make up a long term and short-term investment.
The main data source for the Capital and Financial account is the Overseas ExchangeTransactions (OET) record of all the commercial banks of Tonga and the National Reserve Bankof Tonga (NRBT), supplemented by data provided by Ministry of Finance.
11
Reserves
This reserve covers assets that are available for use by the central authorities either to financepayment imbalances directly or to manage the size of such imbalances by intervening toinfluence the exchange rate for the national currency.
Prior to the formation of the NRBT the Bank of Tonga held foreign exchange assets, as agent ofthe Government of Tonga. Thus these overseas exchange assets are included in reserves.
Other foreign assets held by the authorities are also classified under the reserve category. Priorto the creation of the NRBT, these assets included securities held by the Treasury and otherGovernment bodies, which are readily negotiable claims on foreigners. Since July 1989, theNRBT holds most of the Kingdom’s external reserves.
12
PART 11 – Analysis and Graphs
All Values in this release are in Tongan Pa’anga (TOP).
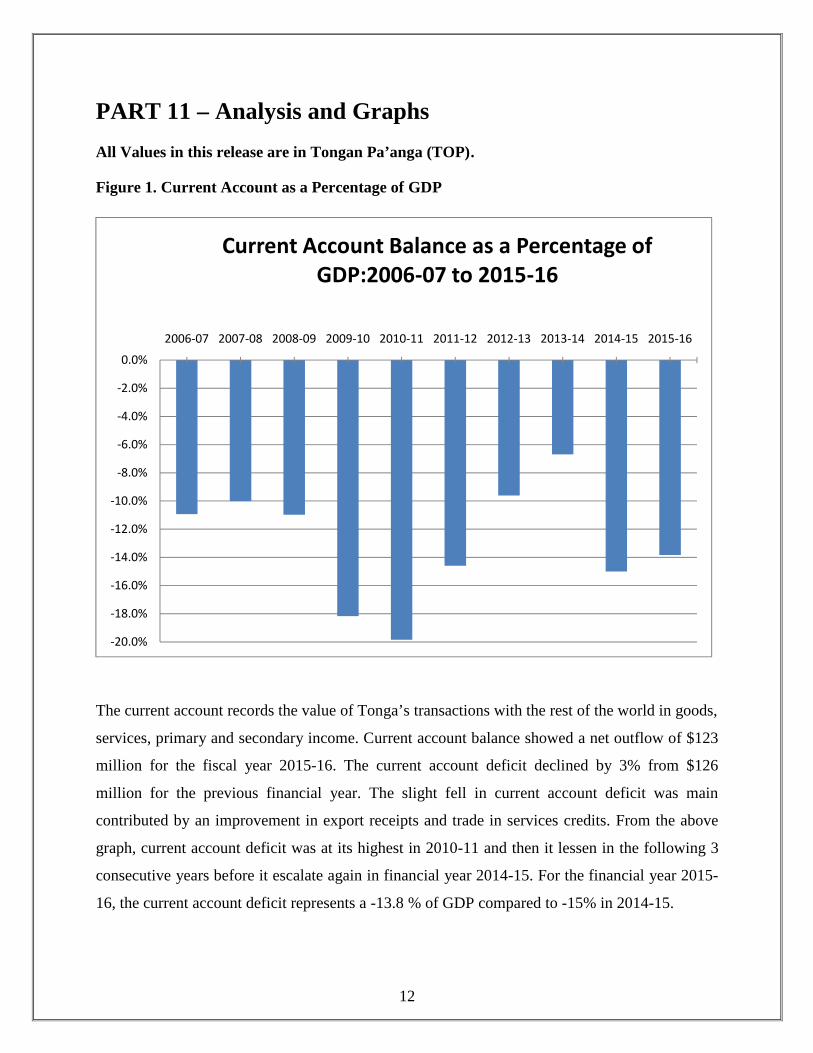
Figure 1. Current Account as a Percentage of GDP
The current account records the value of Tonga’s transactions with the rest of the world in goods,
services, primary and secondary income. Current account balance showed a net outflow of $123
million for the fiscal year 2015-16. The current account deficit declined by 3% from $126
million for the previous financial year. The slight fell in current account deficit was main
contributed by an improvement in export receipts and trade in services credits. From the above
graph, current account deficit was at its highest in 2010-11 and then it lessen in the following 3
consecutive years before it escalate again in financial year 2014-15. For the financial year 2015-
16, the current account deficit represents a -13.8 % of GDP compared to -15% in 2014-15.
-20.0%
-18.0%
-16.0%
-14.0%
-12.0%
-10.0%
-8.0%
-6.0%
-4.0%
-2.0%
0.0%
2006-07 2007-08 2008-09 2009-10 2010-11 2011-12 2012-13 2013-14 2014-15 2015-16
Current Account Balance as a Percentage ofGDP:2006-07 to 2015-16
13
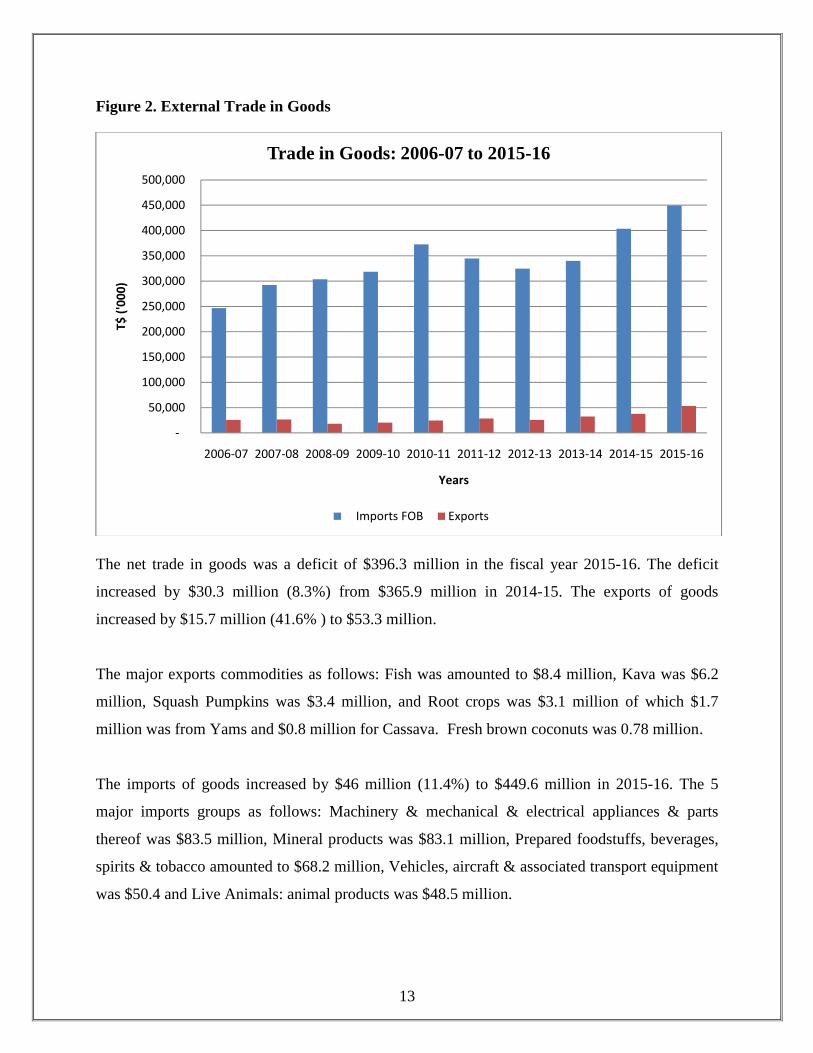
Figure 2. External Trade in Goods
The net trade in goods was a deficit of $396.3 million in the fiscal year 2015-16. The deficit
increased by $30.3 million (8.3%) from $365.9 million in 2014-15. The exports of goods
increased by $15.7 million (41.6% ) to $53.3 million.
The major exports commodities as follows: Fish was amounted to $8.4 million, Kava was $6.2
million, Squash Pumpkins was $3.4 million, and Root crops was $3.1 million of which $1.7
million was from Yams and $0.8 million for Cassava. Fresh brown coconuts was 0.78 million.
The imports of goods increased by $46 million (11.4%) to $449.6 million in 2015-16. The 5
major imports groups as follows: Machinery & mechanical & electrical appliances & parts
thereof was $83.5 million, Mineral products was $83.1 million, Prepared foodstuffs, beverages,
spirits & tobacco amounted to $68.2 million, Vehicles, aircraft & associated transport equipment
was $50.4 and Live Animals: animal products was $48.5 million.
-
50,000
100,000
150,000
200,000
250,000
300,000
350,000
400,000
450,000
500,000
2006-07 2007-08 2008-09 2009-10 2010-11 2011-12 2012-13 2013-14 2014-15 2015-16
T$ ('
000)
Years
Trade in Goods: 2006-07 to 2015-16
Imports FOB Exports
14
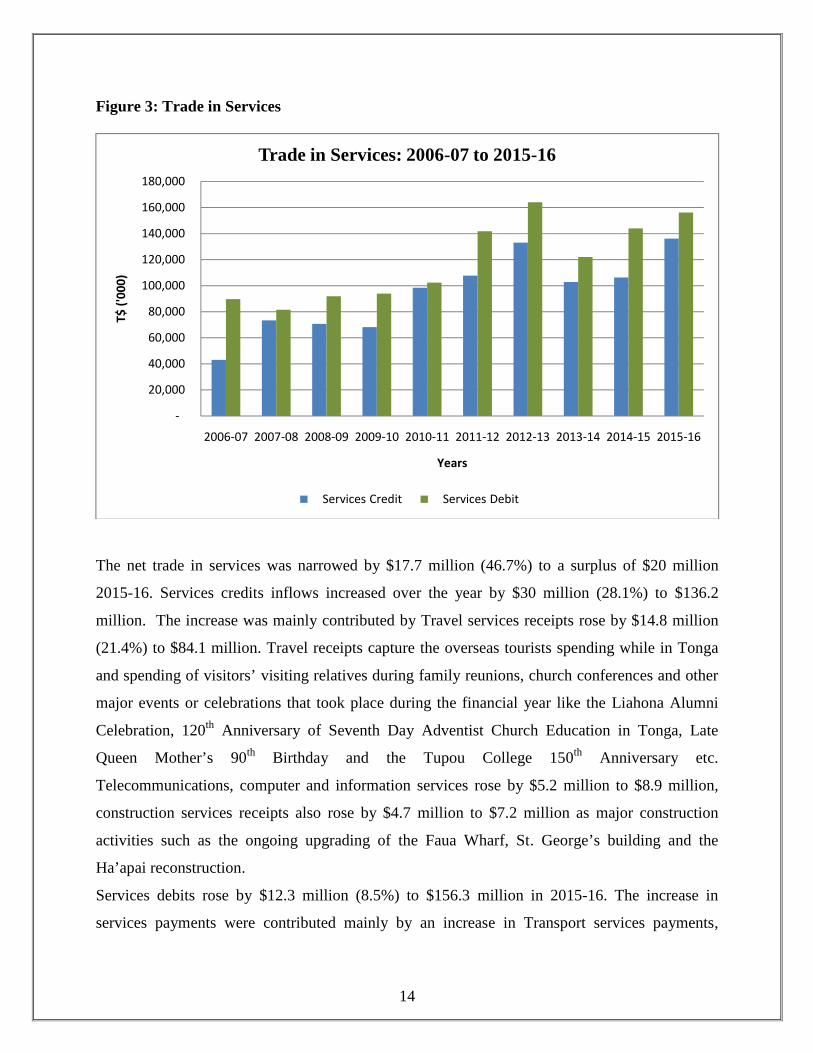
Figure 3: Trade in Services
The net trade in services was narrowed by $17.7 million (46.7%) to a surplus of $20 million
2015-16. Services credits inflows increased over the year by $30 million (28.1%) to $136.2
million. The increase was mainly contributed by Travel services receipts rose by $14.8 million
(21.4%) to $84.1 million. Travel receipts capture the overseas tourists spending while in Tonga
and spending of visitors’ visiting relatives during family reunions, church conferences and other
major events or celebrations that took place during the financial year like the Liahona Alumni
Celebration, 120th Anniversary of Seventh Day Adventist Church Education in Tonga, Late
Queen Mother’s 90th Birthday and the Tupou College 150th Anniversary etc.
Telecommunications, computer and information services rose by $5.2 million to $8.9 million,
construction services receipts also rose by $4.7 million to $7.2 million as major construction
activities such as the ongoing upgrading of the Faua Wharf, St. George’s building and the
Ha’apai reconstruction.
Services debits rose by $12.3 million (8.5%) to $156.3 million in 2015-16. The increase in
services payments were contributed mainly by an increase in Transport services payments,
-
20,000
40,000
60,000
80,000
100,000
120,000
140,000
160,000
180,000
2006-07 2007-08 2008-09 2009-10 2010-11 2011-12 2012-13 2013-14 2014-15 2015-16
T$ ('
000)
Years
Trade in Services: 2006-07 to 2015-16
Services Credit Services Debit
15
Travel, Telecommunications, computer and information services and Charges for use of
intellectual property. Over the financial year, transport services payment rose by $8.9 million
(23.3%) to $46.8 million of which $26.2 million was for sea transportation and $20.3 million for
air transportation of which $26.3 million was for freight and $17.9 million for passenger
services. Travel services payments rose by $7.7 million to $45.1 million of which $32.9 million
was for personal travel and $12.2 million for business travel. Telecommunications, computer and
information services rose by $4.2 million to $7.9 million while other business services payments
sharply fell by $17.3 million to $22.6 million a decline of 43.4%.
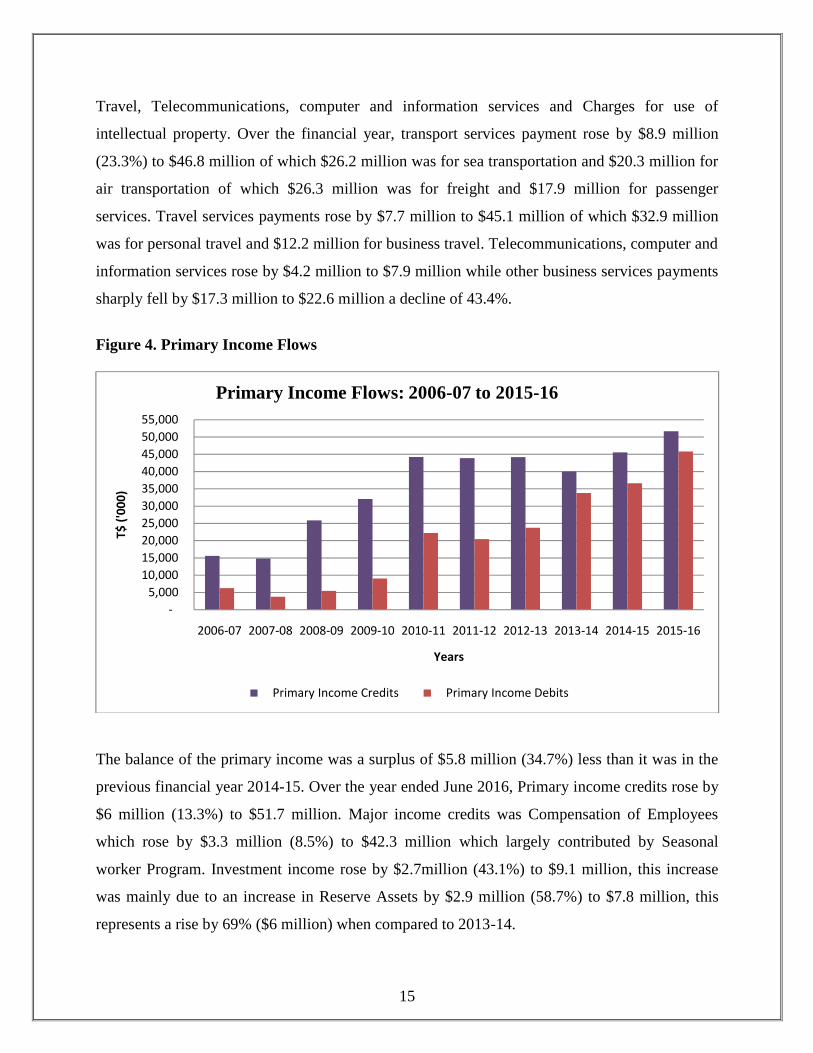
Figure 4. Primary Income Flows
The balance of the primary income was a surplus of $5.8 million (34.7%) less than it was in the
previous financial year 2014-15. Over the year ended June 2016, Primary income credits rose by
$6 million (13.3%) to $51.7 million. Major income credits was Compensation of Employees
which rose by $3.3 million (8.5%) to $42.3 million which largely contributed by Seasonal
worker Program. Investment income rose by $2.7million (43.1%) to $9.1 million, this increase
was mainly due to an increase in Reserve Assets by $2.9 million (58.7%) to $7.8 million, this
represents a rise by 69% ($6 million) when compared to 2013-14.
-5,000
10,00015,00020,00025,00030,00035,00040,00045,00050,00055,000
2006-07 2007-08 2008-09 2009-10 2010-11 2011-12 2012-13 2013-14 2014-15 2015-16
T$ ('
000)
Years
Primary Income Flows: 2006-07 to 2015-16
Primary Income Credits Primary Income Debits
16
Primary income debits rose by $9.2 million (25.1%) to $45.8 million which was mainly
contributed by an increase in Investment income payments by $8.1 million (24%) to $41.9
million in which Direct Investment income debits a component of investment income rose by
15% to $28.2 million and Other Investment debits increased by $3.9 million (41.4%) to $13.3
million. Compensation of employees rose by $1 million (37.5%) to $3.8 million.
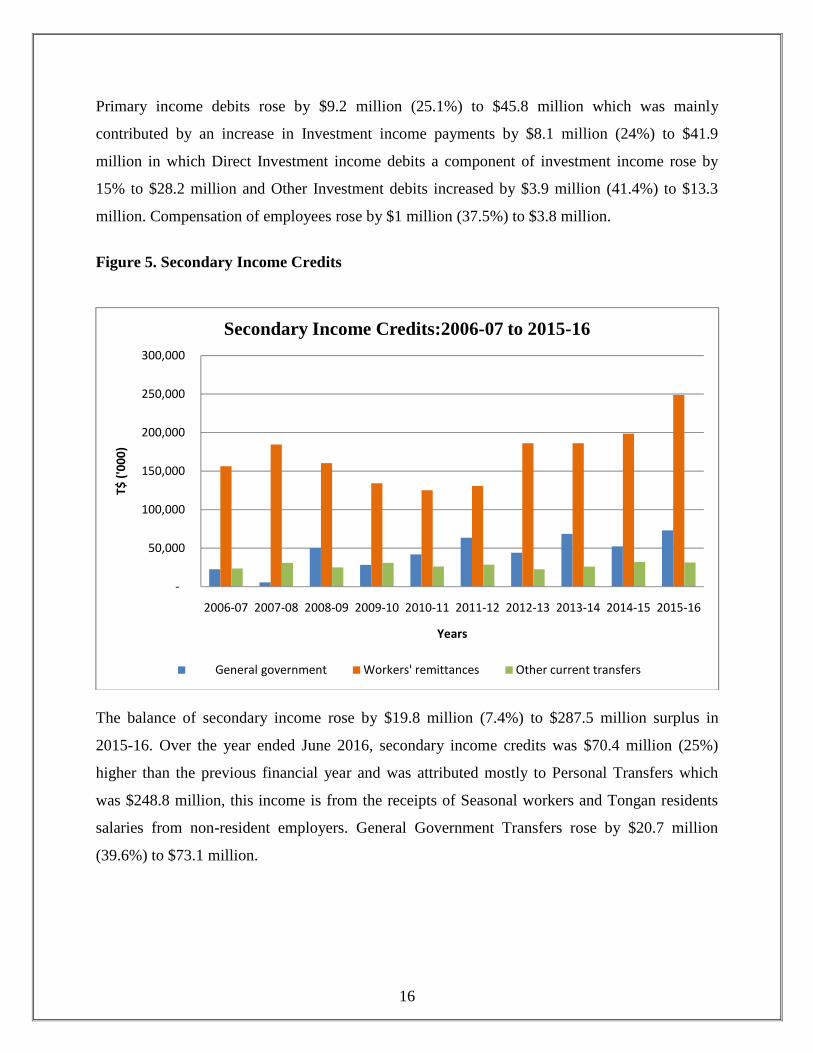
Figure 5. Secondary Income Credits
The balance of secondary income rose by $19.8 million (7.4%) to $287.5 million surplus in
2015-16. Over the year ended June 2016, secondary income credits was $70.4 million (25%)
higher than the previous financial year and was attributed mostly to Personal Transfers which
was $248.8 million, this income is from the receipts of Seasonal workers and Tongan residents
salaries from non-resident employers. General Government Transfers rose by $20.7 million
(39.6%) to $73.1 million.
-
50,000
100,000
150,000
200,000
250,000
300,000
2006-07 2007-08 2008-09 2009-10 2010-11 2011-12 2012-13 2013-14 2014-15 2015-16
T$ ('
000)
Years
Secondary Income Credits:2006-07 to 2015-16
General government Workers' remittances Other current transfers
17
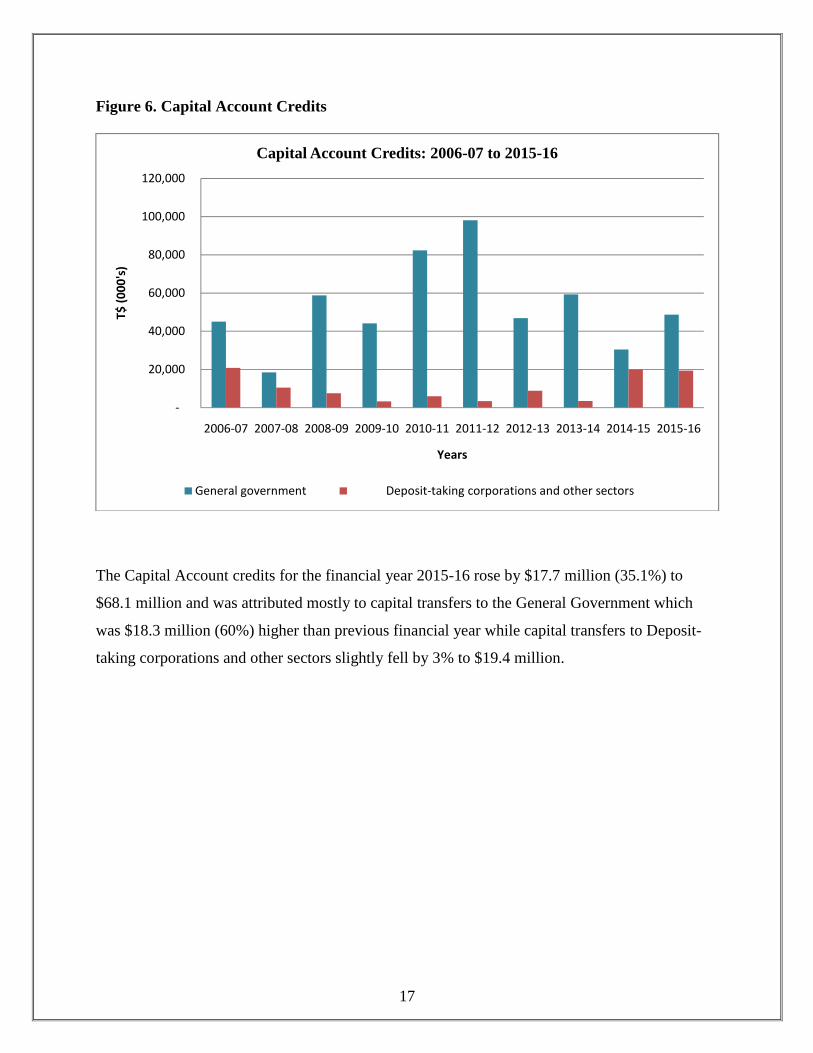
Figure 6. Capital Account Credits
The Capital Account credits for the financial year 2015-16 rose by $17.7 million (35.1%) to
$68.1 million and was attributed mostly to capital transfers to the General Government which
was $18.3 million (60%) higher than previous financial year while capital transfers to Deposit-
taking corporations and other sectors slightly fell by 3% to $19.4 million.
-
20,000
40,000
60,000
80,000
100,000
120,000
2006-07 2007-08 2008-09 2009-10 2010-11 2011-12 2012-13 2013-14 2014-15 2015-16
T$ (0
00's)
Years
Capital Account Credits: 2006-07 to 2015-16
General government Deposit-taking corporations and other sectors
18
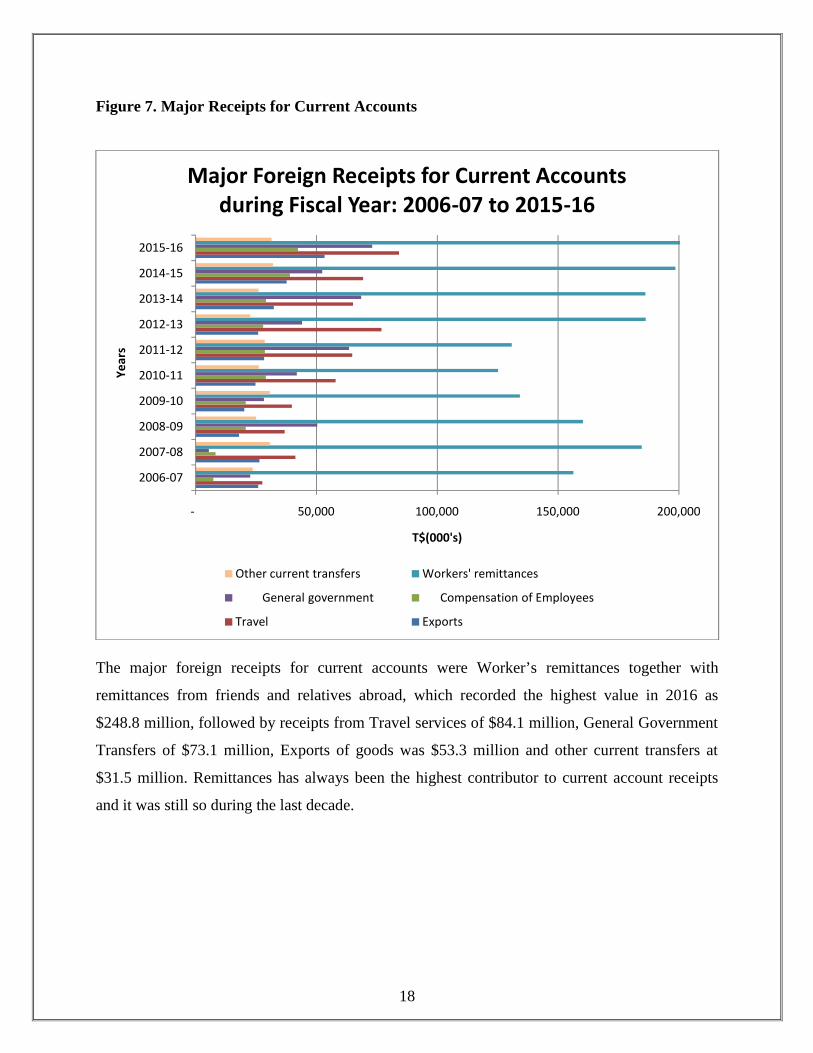
Figure 7. Major Receipts for Current Accounts
The major foreign receipts for current accounts were Worker’s remittances together with
remittances from friends and relatives abroad, which recorded the highest value in 2016 as
$248.8 million, followed by receipts from Travel services of $84.1 million, General Government
Transfers of $73.1 million, Exports of goods was $53.3 million and other current transfers at
$31.5 million. Remittances has always been the highest contributor to current account receipts
and it was still so during the last decade.
- 50,000 100,000 150,000 200,000
2006-07
2007-08
2008-09
2009-10
2010-11
2011-12
2012-13
2013-14
2014-15
2015-16
T$(000's)
Year
s
Major Foreign Receipts for Current Accountsduring Fiscal Year: 2006-07 to 2015-16
Other current transfers Workers' remittances
General government Compensation of Employees
Travel Exports
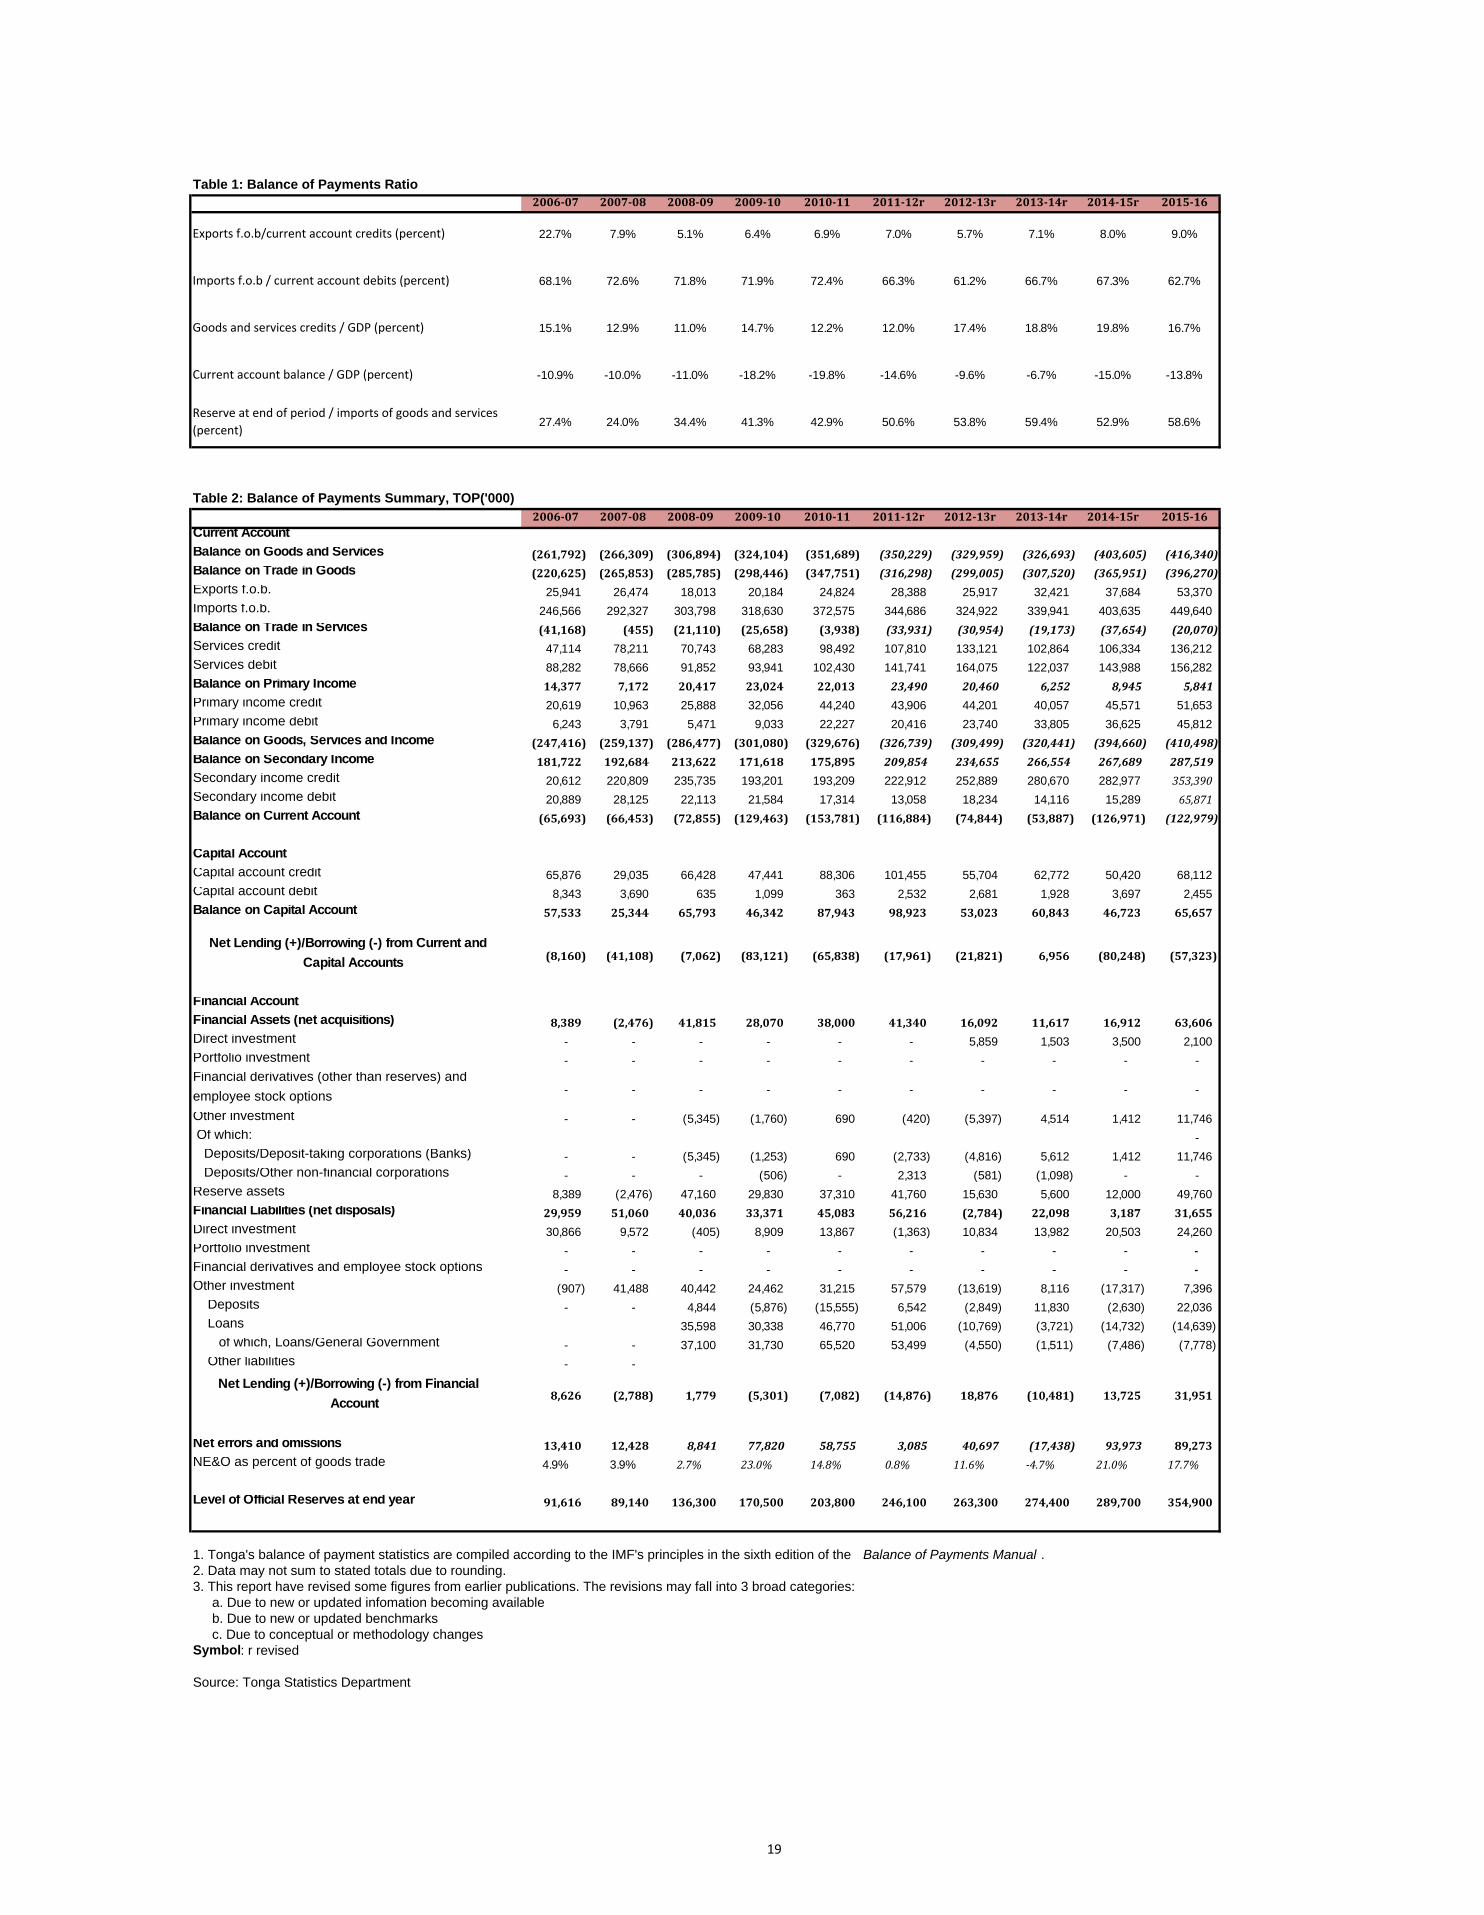
Table 1: Balance of Payments Ratio2006-07 2007-08 2008-09 2009-10 2010-11 2011-12r 2012-13r 2013-14r 2014-15r 2015-16
Exports f.o.b/current account credits (percent) 22.7% 7.9% 5.1% 6.4% 6.9% 7.0% 5.7% 7.1% 8.0% 9.0%Imports f.o.b / current account debits (percent) 68.1% 72.6% 71.8% 71.9% 72.4% 66.3% 61.2% 66.7% 67.3% 62.7%Goods and services credits / GDP (percent) 15.1% 12.9% 11.0% 14.7% 12.2% 12.0% 17.4% 18.8% 19.8% 16.7%Current account balance / GDP (percent) -10.9% -10.0% -11.0% -18.2% -19.8% -14.6% -9.6% -6.7% -15.0% -13.8%Reserve at end of period / imports of goods and services(percent) 27.4% 24.0% 34.4% 41.3% 42.9% 50.6% 53.8% 59.4% 52.9% 58.6%Table 2: Balance of Payments Summary, TOP('000)
2006-07 2007-08 2008-09 2009-10 2010-11 2011-12r 2012-13r 2013-14r 2014-15r 2015-16Current AccountBalance on Goods and Services (261,792) (266,309) (306,894) (324,104) (351,689) (350,229) (329,959) (326,693) (403,605) (416,340)Balance on Trade in Goods (220,625) (265,853) (285,785) (298,446) (347,751) (316,298) (299,005) (307,520) (365,951) (396,270)Exports f.o.b. 25,941 26,474 18,013 20,184 24,824 28,388 25,917 32,421 37,684 53,370Imports f.o.b. 246,566 292,327 303,798 318,630 372,575 344,686 324,922 339,941 403,635 449,640Balance on Trade in Services (41,168) (455) (21,110) (25,658) (3,938) (33,931) (30,954) (19,173) (37,654) (20,070)Services credit 47,114 78,211 70,743 68,283 98,492 107,810 133,121 102,864 106,334 136,212Services debit 88,282 78,666 91,852 93,941 102,430 141,741 164,075 122,037 143,988 156,282Balance on Primary Income 14,377 7,172 20,417 23,024 22,013 23,490 20,460 6,252 8,945 5,841Primary income credit 20,619 10,963 25,888 32,056 44,240 43,906 44,201 40,057 45,571 51,653Primary income debit 6,243 3,791 5,471 9,033 22,227 20,416 23,740 33,805 36,625 45,812Balance on Goods, Services and Income (247,416) (259,137) (286,477) (301,080) (329,676) (326,739) (309,499) (320,441) (394,660) (410,498)Balance on Secondary Income 181,722 192,684 213,622 171,618 175,895 209,854 234,655 266,554 267,689 287,519Secondary income credit 20,612 220,809 235,735 193,201 193,209 222,912 252,889 280,670 282,977 353,390Secondary income debit 20,889 28,125 22,113 21,584 17,314 13,058 18,234 14,116 15,289 65,871Balance on Current Account (65,693) (66,453) (72,855) (129,463) (153,781) (116,884) (74,844) (53,887) (126,971) (122,979)
Capital AccountCapital account credit 65,876 29,035 66,428 47,441 88,306 101,455 55,704 62,772 50,420 68,112Capital account debit 8,343 3,690 635 1,099 363 2,532 2,681 1,928 3,697 2,455Balance on Capital Account 57,533 25,344 65,793 46,342 87,943 98,923 53,023 60,843 46,723 65,657
Net Lending (+)/Borrowing (-) from Current andCapital Accounts (8,160) (41,108) (7,062) (83,121) (65,838) (17,961) (21,821) 6,956 (80,248) (57,323)
Financial AccountFinancial Assets (net acquisitions) 8,389 (2,476) 41,815 28,070 38,000 41,340 16,092 11,617 16,912 63,606Direct investment - - - - - - 5,859 1,503 3,500 2,100Portfolio investment - - - - - - - - - -Financial derivatives (other than reserves) andemployee stock options - - - - - - - - - -Other investment - - (5,345) (1,760) 690 (420) (5,397) 4,514 1,412 11,746 Of which: - Deposits/Deposit-taking corporations (Banks) - - (5,345) (1,253) 690 (2,733) (4,816) 5,612 1,412 11,746 Deposits/Other non-financial corporations - - - (506) - 2,313 (581) (1,098) - -Reserve assets 8,389 (2,476) 47,160 29,830 37,310 41,760 15,630 5,600 12,000 49,760Financial Liabilities (net disposals) 29,959 51,060 40,036 33,371 45,083 56,216 (2,784) 22,098 3,187 31,655Direct investment 30,866 9,572 (405) 8,909 13,867 (1,363) 10,834 13,982 20,503 24,260Portfolio investment - - - - - - - - - -Financial derivatives and employee stock options - - - - - - - - - -Other investment (907) 41,488 40,442 24,462 31,215 57,579 (13,619) 8,116 (17,317) 7,396 Deposits - - 4,844 (5,876) (15,555) 6,542 (2,849) 11,830 (2,630) 22,036 Loans 35,598 30,338 46,770 51,006 (10,769) (3,721) (14,732) (14,639) of which, Loans/General Government - - 37,100 31,730 65,520 53,499 (4,550) (1,511) (7,486) (7,778) Other liabilities - -
Net Lending (+)/Borrowing (-) from FinancialAccount 8,626 (2,788) 1,779 (5,301) (7,082) (14,876) 18,876 (10,481) 13,725 31,951
Net errors and omissions 13,410 12,428 8,841 77,820 58,755 3,085 40,697 (17,438) 93,973 89,273NE&O as percent of goods trade 4.9% 3.9% 2.7% 23.0% 14.8% 0.8% 11.6% -4.7% 21.0% 17.7%
Level of Official Reserves at end year 91,616 89,140 136,300 170,500 203,800 246,100 263,300 274,400 289,700 354,900
1. Tonga's balance of payment statistics are compiled according to the IMF's principles in the sixth edition of the Balance of Payments Manual .2. Data may not sum to stated totals due to rounding.3. This report have revised some figures from earlier publications. The revisions may fall into 3 broad categories:
a. Due to new or updated infomation becoming availableb. Due to new or updated benchmarksc. Due to conceptual or methodology changes
Symbol: r revised
Source: Tonga Statistics Department
19
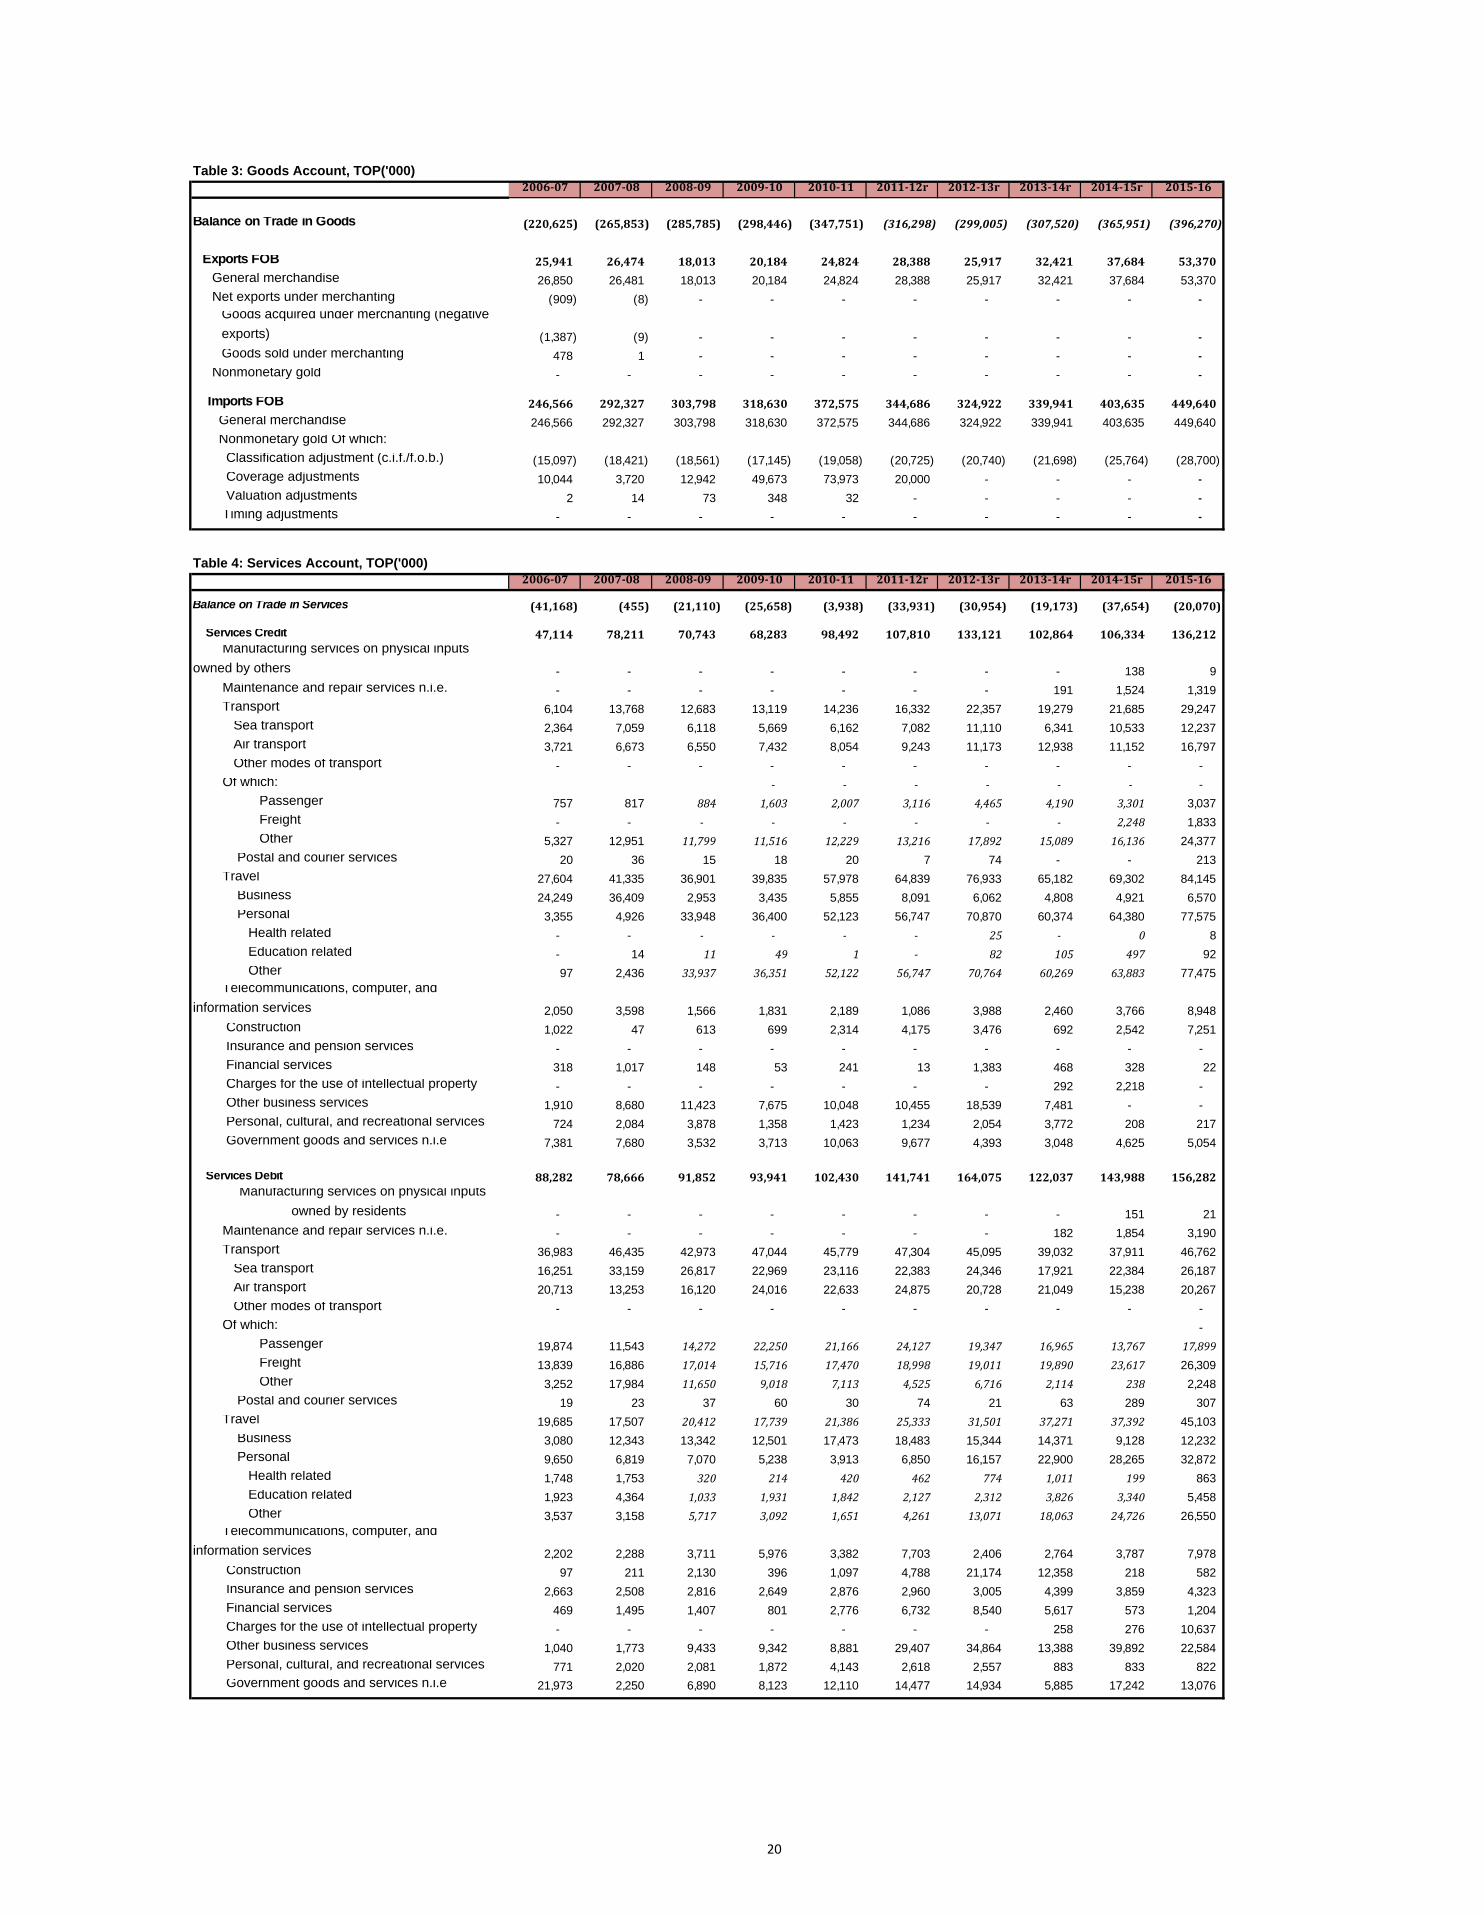
Table 3: Goods Account, TOP('000)2006-07 2007-08 2008-09 2009-10 2010-11 2011-12r 2012-13r 2013-14r 2014-15r 2015-16
Balance on Trade in Goods (220,625) (265,853) (285,785) (298,446) (347,751) (316,298) (299,005) (307,520) (365,951) (396,270)
Exports FOB 25,941 26,474 18,013 20,184 24,824 28,388 25,917 32,421 37,684 53,370General merchandise 26,850 26,481 18,013 20,184 24,824 28,388 25,917 32,421 37,684 53,370Net exports under merchanting (909) (8) - - - - - - - -
Goods acquired under merchanting (negativeexports) (1,387) (9) - - - - - - - -Goods sold under merchanting 478 1 - - - - - - - -
Nonmonetary gold - - - - - - - - - --
Imports FOB 246,566 292,327 303,798 318,630 372,575 344,686 324,922 339,941 403,635 449,640 General merchandise 246,566 292,327 303,798 318,630 372,575 344,686 324,922 339,941 403,635 449,640 Nonmonetary gold Of which: Classification adjustment (c.i.f./f.o.b.) (15,097) (18,421) (18,561) (17,145) (19,058) (20,725) (20,740) (21,698) (25,764) (28,700) Coverage adjustments 10,044 3,720 12,942 49,673 73,973 20,000 - - - - Valuation adjustments 2 14 73 348 32 - - - - - Timing adjustments - - - - - - - - - -
Table 4: Services Account, TOP('000)2006-07 2007-08 2008-09 2009-10 2010-11 2011-12r 2012-13r 2013-14r 2014-15r 2015-16
Balance on Trade in Services (41,168) (455) (21,110) (25,658) (3,938) (33,931) (30,954) (19,173) (37,654) (20,070)
Services Credit 47,114 78,211 70,743 68,283 98,492 107,810 133,121 102,864 106,334 136,212 Manufacturing services on physical inputsowned by others - - - - - - - - 138 9 Maintenance and repair services n.i.e. - - - - - - - 191 1,524 1,319 Transport 6,104 13,768 12,683 13,119 14,236 16,332 22,357 19,279 21,685 29,247 Sea transport 2,364 7,059 6,118 5,669 6,162 7,082 11,110 6,341 10,533 12,237 Air transport 3,721 6,673 6,550 7,432 8,054 9,243 11,173 12,938 11,152 16,797 Other modes of transport - - - - - - - - - - Of which: - - - - - - - Passenger 757 817 884 1,603 2,007 3,116 4,465 4,190 3,301 3,037 Freight - - - - - - - - 2,248 1,833 Other 5,327 12,951 11,799 11,516 12,229 13,216 17,892 15,089 16,136 24,377 Postal and courier services 20 36 15 18 20 7 74 - - 213 Travel 27,604 41,335 36,901 39,835 57,978 64,839 76,933 65,182 69,302 84,145 Business 24,249 36,409 2,953 3,435 5,855 8,091 6,062 4,808 4,921 6,570 Personal 3,355 4,926 33,948 36,400 52,123 56,747 70,870 60,374 64,380 77,575 Health related - - - - - - 25 - 0 8 Education related - 14 11 49 1 - 82 105 497 92 Other 97 2,436 33,937 36,351 52,122 56,747 70,764 60,269 63,883 77,475 Telecommunications, computer, andinformation services 2,050 3,598 1,566 1,831 2,189 1,086 3,988 2,460 3,766 8,948 Construction 1,022 47 613 699 2,314 4,175 3,476 692 2,542 7,251 Insurance and pension services - - - - - - - - - - Financial services 318 1,017 148 53 241 13 1,383 468 328 22 Charges for the use of intellectual property - - - - - - - 292 2,218 - Other business services 1,910 8,680 11,423 7,675 10,048 10,455 18,539 7,481 - - Personal, cultural, and recreational services 724 2,084 3,878 1,358 1,423 1,234 2,054 3,772 208 217 Government goods and services n.i.e 7,381 7,680 3,532 3,713 10,063 9,677 4,393 3,048 4,625 5,054 Services Debit 88,282 78,666 91,852 93,941 102,430 141,741 164,075 122,037 143,988 156,282
Manufacturing services on physical inputsowned by residents - - - - - - - - 151 21
Maintenance and repair services n.i.e. - - - - - - - 182 1,854 3,190 Transport 36,983 46,435 42,973 47,044 45,779 47,304 45,095 39,032 37,911 46,762 Sea transport 16,251 33,159 26,817 22,969 23,116 22,383 24,346 17,921 22,384 26,187 Air transport 20,713 13,253 16,120 24,016 22,633 24,875 20,728 21,049 15,238 20,267 Other modes of transport - - - - - - - - - - Of which: - Passenger 19,874 11,543 14,272 22,250 21,166 24,127 19,347 16,965 13,767 17,899 Freight 13,839 16,886 17,014 15,716 17,470 18,998 19,011 19,890 23,617 26,309 Other 3,252 17,984 11,650 9,018 7,113 4,525 6,716 2,114 238 2,248 Postal and courier services 19 23 37 60 30 74 21 63 289 307 Travel 19,685 17,507 20,412 17,739 21,386 25,333 31,501 37,271 37,392 45,103 Business 3,080 12,343 13,342 12,501 17,473 18,483 15,344 14,371 9,128 12,232 Personal 9,650 6,819 7,070 5,238 3,913 6,850 16,157 22,900 28,265 32,872 Health related 1,748 1,753 320 214 420 462 774 1,011 199 863 Education related 1,923 4,364 1,033 1,931 1,842 2,127 2,312 3,826 3,340 5,458 Other 3,537 3,158 5,717 3,092 1,651 4,261 13,071 18,063 24,726 26,550 Telecommunications, computer, andinformation services 2,202 2,288 3,711 5,976 3,382 7,703 2,406 2,764 3,787 7,978 Construction 97 211 2,130 396 1,097 4,788 21,174 12,358 218 582 Insurance and pension services 2,663 2,508 2,816 2,649 2,876 2,960 3,005 4,399 3,859 4,323 Financial services 469 1,495 1,407 801 2,776 6,732 8,540 5,617 573 1,204 Charges for the use of intellectual property - - - - - - - 258 276 10,637 Other business services 1,040 1,773 9,433 9,342 8,881 29,407 34,864 13,388 39,892 22,584 Personal, cultural, and recreational services 771 2,020 2,081 1,872 4,143 2,618 2,557 883 833 822 Government goods and services n.i.e 21,973 2,250 6,890 8,123 12,110 14,477 14,934 5,885 17,242 13,076
20

Table 5: Primary Income Account, TOP('000)2006-07 2007-08 2008-09 2009-10 2010-11 2011-12r 2012-13r 2013-14r 2014-15r 2015-16
Balance on Primary Income 14,377 7,172 20,417 23,024 22,013 23,490 20,460 6,252 8,945 5,841
Primary Income Credits 20,619 10,963 25,888 32,056 44,240 43,906 44,201 40,057 45,571 51,653 Compensation of Employees 7,367 8,273 20,791 20,757 29,078 28,708 27,996 29,176 39,072 42,386 Investment income 13,252 2,690 5,097 11,299 15,162 15,198 15,338 10,362 6,326 9,052 Direct investment - 5 0 - - - 1,973 - 1,366 1,182 Portfolio investment - - - - - - - - - - Other investment 13,252 2,685 2,420 9,465 10,653 9,681 7,178 3,283 - - Reserve assets - - 2,677 1,834 4,509 5,516 6,187 7,078 4,960 7,870 Other primary income - - - - - - 867 519 172 215 Primary Income Debits 6,243 3,791 5,471 9,033 22,227 20,416 23,740 33,805 36,625 45,812 Compensation of Employees 131 109 113 154 110 95 90 2,591 2,811 3,866 Investment income 6,112 3,682 5,357 8,879 22,117 20,321 23,650 31,214 33,815 41,946 Direct investment 0 4 - 35 13,866 11,732 11,799 21,011 24,365 28,243 Portfolio investment - - - - - - - - 19 371 Other investment 6,111 3,678 5,357 8,844 8,251 8,590 11,852 10,203 9,431 13,332 Other primary income - - - - - - - - - -Table 6: Secondary Income Account, TOP('000)
2006-07 2007-08 2008-09 2009-10 2010-11 2011-12r 2012-13r 2013-14r 2014-15r 2015-16
Balance on Secondary Income 181,722 192,684 213,622 171,618 175,895 209,854 234,655 266,554 267,689 287,519
Secondary Income Credits 202,612 220,809 235,735 193,201 193,209 222,912 252,889 280,670 282,977 353,390 General government 22,633 5,499 50,341 28,322 41,921 63,499 44,055 68,516 52,380 73,109 Other sectors 179,978 215,310 185,394 164,879 151,288 159,413 208,834 212,153 230,598 280,281 Personal transfers 156,335 184,565 160,305 134,150 125,118 130,791 186,208 186,091 198,545 248,816 Of which: Workers' remittances 156,335 184,565 160,305 134,150 125,118 130,791 186,208 186,091 198,545 248,816 Other current transfers 23,643 30,744 25,089 30,729 26,170 28,622 22,626 26,062 32,053 31,465 Secondary Income Debits 20,889 28,125 22,113 21,584 17,314 13,058 18,234 14,116 15,289 65,871 General government 249 147 1,828 5,350 4,059 3,623 3,649 3,134 1,084 4,930 Other sectors 20,641 27,978 20,285 16,234 13,255 9,435 14,585 10,981 13,959 60,941 Personal transfers 18,337 24,933 18,095 14,291 11,165 7,640 11,721 7,710 11,312 56,703 Of which: Workers' remittances 18,337 24,933 18,095 14,291 11,165 7,640 11,721 7,710 11,312 56,703 Other current transfers 2,304 3,045 2,190 1,943 2,090 1,795 2,863 3,271 2,646 4,237Table 7: Capital Account, T$(thousands)
2006-07 2007-08 2008-09 2009-10 2010-11 2011-12r 2012-13r 2013-14r 2014-15r 2015-16
Balance on Capital Account 57,533 25,344 113,793 46,342 87,943 98,923 53,023 60,843 46,723 65,657
Capital Account Credits 65,876 29,035 66,428 47,441 88,306 101,455 55,704 62,772 50,420 68,112 Gross disposals of nonproduced nonfinancialassets - - 48,000 - - - - - - - Capital transfers 65,876 29,035 66,428 47,441 88,306 101,455 55,704 62,772 50,420 68,112 General government 45,012 18,521 58,827 44,089 82,293 98,065 46,900 59,300 30,450 48,731 Debt forgiveness - - 1,186 - - - - - - - Other capital transfers 45,012 18,521 57,642 44,089 82,293 98,065 46,900 59,300 30,450 48,731 Deposit-taking corporations and other sectors 20,864 10,513 7,601 3,352 6,013 3,390 8,804 3,472 19,971 19,381 Debt forgiveness - - - - - - - - - - Other capital transfers 20,864 10,513 7,601 3,352 6,013 3,390 8,804 3,472 19,971 19,381 Capital Account Debits 8,343 3,690 635 1,099 363 2,532 2,681 1,928 3,697 2,455 Gross acquisitions of nonproduced nonfinancialassets - - - - - - - - - - Capital transfers 8,343 3,690 635 1,099 363 2,532 2,681 1,928 3,697 2,455 General government 4,728 3,443 159 782 - 534 231 100 16 155 Debt forgiveness - - - - - - - - - - Other capital transfers 4,728 3,443 159 782 - 534 231 100 16 155 Deposit-taking corporations and other sectors 3,615 247 476 317 363 1,997 2,451 1,828 3,682 2,300 Debt forgiveness - - - - - - - - - - Other capital transfers 3,615 247 476 317 363 1,997 2,451 1,828 3,682 2,3001. Tonga's balance of payment statistics are compiled according to the IMF's principles in the sixth edition of the Balance of Payments Manual .2. Data may not sum to stated totals due to rounding.3. This report have revised some figures from earlier publications. The revisions may fall into 3 broad categories:
a. Due to new or updated infomation becoming availableb. Due to new or updated benchmarksc. Due to conceptual or methodology channges
Symbol: r revised
Source: Tonga Statistics Department
21
Printed by: STATISTICS DEPARTMENTNuku’alofa, TONGA -2017