Embed Size (px)
Citation preview
- 59 -
Chapter 3 __________________________________________________________
Balance of Payments from a Comparative Perspective: China, India, and Russia under Globalization
Akira Uegaki
Introduction
The three regional powers of China, India, and Russia have been actively participating in
international trade and international financing recently, although they have large populations, huge
territories, and abundant natural resources,1 which would enable them to be independent and au-
tarkic. The globalization movement especially since the ’90s has undoubtedly made their attitudes
possible, but on the other hand, the fact that the three regional powers have sailed out on the world
market itself has made today’s globalizing trend as a whole stronger and faster. The purpose of this
paper is to clarify each country’s similarities and peculiarities in their international financing in a
globalizing economic situation by using balance of payments statistics.
Weight of External Economic Transactions in Each Economy
Before analyzing balance of payments statistics, we must examine the size of the external
economic transactions of each economy. The simplest way to calculate this is to research the ratio
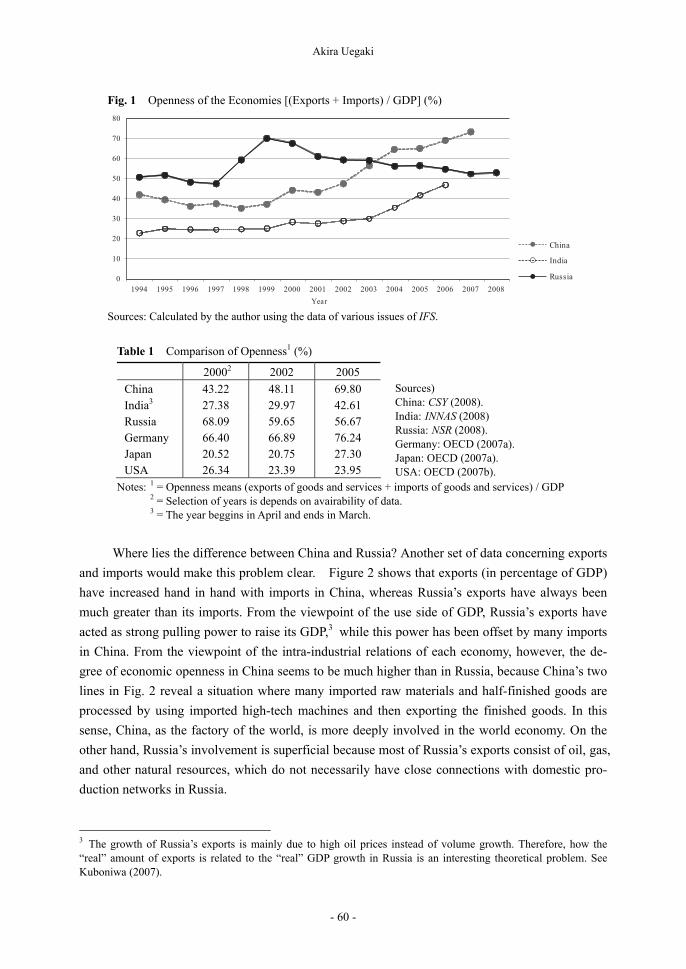
of “openness.”2 According to Fig. 1, the ratio of China and India has been increasing rapidly in
the new century, whereas the Russian ratio has stagnated recently after reaching its highest point in
1999. However, we must not exaggerate this contrast because the ratio has always been relatively
higher in China and Russia than in India. Table 1 compares the ratio of the three countries with
other developed industrial countries. Here, we can see that China and Russia are different from
another huge country, the USA, from the viewpoint of “openness.” While the USA is a rather
autarchic county, China and Russia are as highly involved in the international economy as Ger-
many. As for India, it is unique in the sense that it has recently been rapidly strengthening its in-
volvement in the world economy.
1 As for natural resources, it is difficult to say whether a certain resource is abundant in a country when considering its population and domestic demand. Abundance depends on the resource and the region. 2 Here, openness means the sum of exports and imports of goods and services divided by the GDP. To calculate the ratio, the author used the data of IFS of the IMF. If we use the data of each country’s SNA data, the ratio would be slightly different; this, however, would not change the general trend.
Akira Uegaki
- 60 -
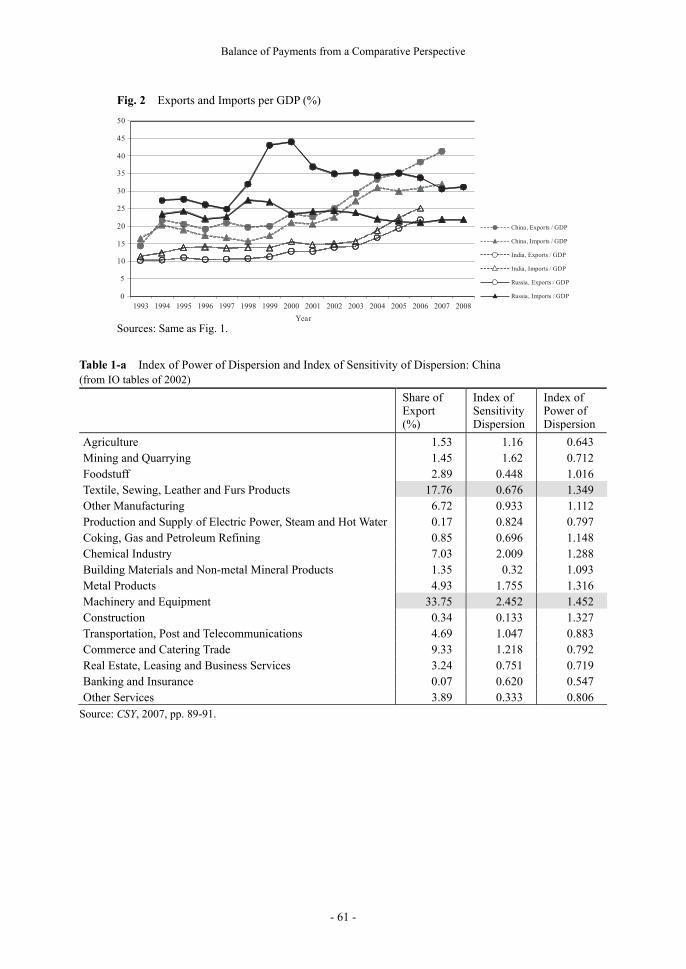
Where lies the difference between China and Russia? Another set of data concerning exports
and imports would make this problem clear. Figure 2 shows that exports (in percentage of GDP)
have increased hand in hand with imports in China, whereas Russia’s exports have always been
much greater than its imports. From the viewpoint of the use side of GDP, Russia’s exports have
acted as strong pulling power to raise its GDP,3 while this power has been offset by many imports
in China. From the viewpoint of the intra-industrial relations of each economy, however, the de-
gree of economic openness in China seems to be much higher than in Russia, because China’s two
lines in Fig. 2 reveal a situation where many imported raw materials and half-finished goods are
processed by using imported high-tech machines and then exporting the finished goods. In this
sense, China, as the factory of the world, is more deeply involved in the world economy. On the
other hand, Russia’s involvement is superficial because most of Russia’s exports consist of oil, gas,
and other natural resources, which do not necessarily have close connections with domestic pro-
duction networks in Russia.
3 The growth of Russia’s exports is mainly due to high oil prices instead of volume growth. Therefore, how the “real” amount of exports is related to the “real” GDP growth in Russia is an interesting theoretical problem. See Kuboniwa (2007).
Fig. 1 Openness of the Economies [(Exports + Imports) / GDP] (%)
Sources: Calculated by the author using the data of various issues of IFS.
Table 1 Comparison of Openness1 (%)
20002 2002 2005
China 43.22 48.11 69.80 India3 27.38 29.97 42.61 Russia 68.09 59.65 56.67 Germany 66.40 66.89 76.24 Japan 20.52 20.75 27.30 USA 26.34 23.39 23.95
Notes: 1 = Openness means (exports of goods and services + imports of goods and services) / GDP 2 = Selection of years is depends on avairability of data. 3 = The year beggins in April and ends in March.
Sources) China: CSY (2008). India: INNAS (2008) Russia: NSR (2008). Germany: OECD (2007a). Japan: OECD (2007a). USA: OECD (2007b).
Balance of Payments from a Comparative Perspective
- 61 -
Fig. 2 Exports and Imports per GDP (%)
Sources: Same as Fig. 1.
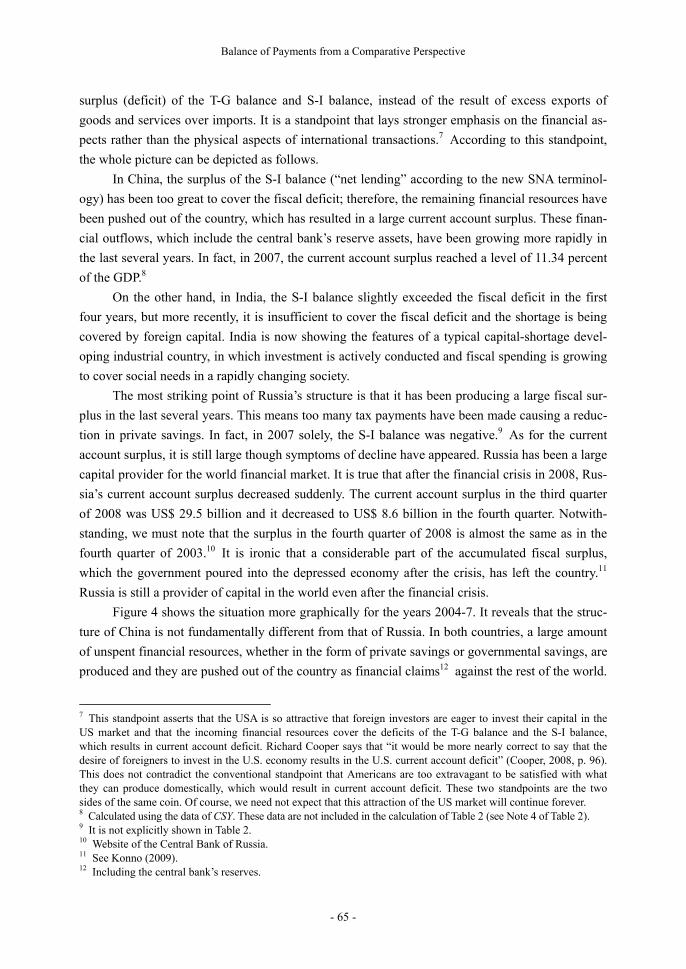
Table 1-a Index of Power of Dispersion and Index of Sensitivity of Dispersion: China (from IO tables of 2002)
Share of Export (%)
Index of Sensitivity Dispersion
Index of Power of Dispersion
Agriculture 1.53 1.16 0.643 Mining and Quarrying 1.45 1.62 0.712 Foodstuff 2.89 0.448 1.016 Textile, Sewing, Leather and Furs Products 17.76 0.676 1.349 Other Manufacturing 6.72 0.933 1.112 Production and Supply of Electric Power, Steam and Hot Water 0.17 0.824 0.797 Coking, Gas and Petroleum Refining 0.85 0.696 1.148 Chemical Industry 7.03 2.009 1.288 Building Materials and Non-metal Mineral Products 1.35 0.32 1.093 Metal Products 4.93 1.755 1.316 Machinery and Equipment 33.75 2.452 1.452 Construction 0.34 0.133 1.327 Transportation, Post and Telecommunications 4.69 1.047 0.883 Commerce and Catering Trade 9.33 1.218 0.792 Real Estate, Leasing and Business Services 3.24 0.751 0.719 Banking and Insurance 0.07 0.620 0.547 Other Services 3.89 0.333 0.806
Source: CSY, 2007, pp. 89-91.
Akira Uegaki
- 62 -
This difference can be testified by the data of input-output tables of China and Russia. Table
1-a and 1-b show the index of power of dispersion (IPD) and the index of sensitivity of dispersion
(ISD) calculated from their IO tables with data on exports. IPDj is defined as,
IPDj =
Bij
i
1n Bij
j
i
,
where Bij is an ij factor of the Leontiev inverse matrix in an nn input-output table. ISDi is
also defined as,
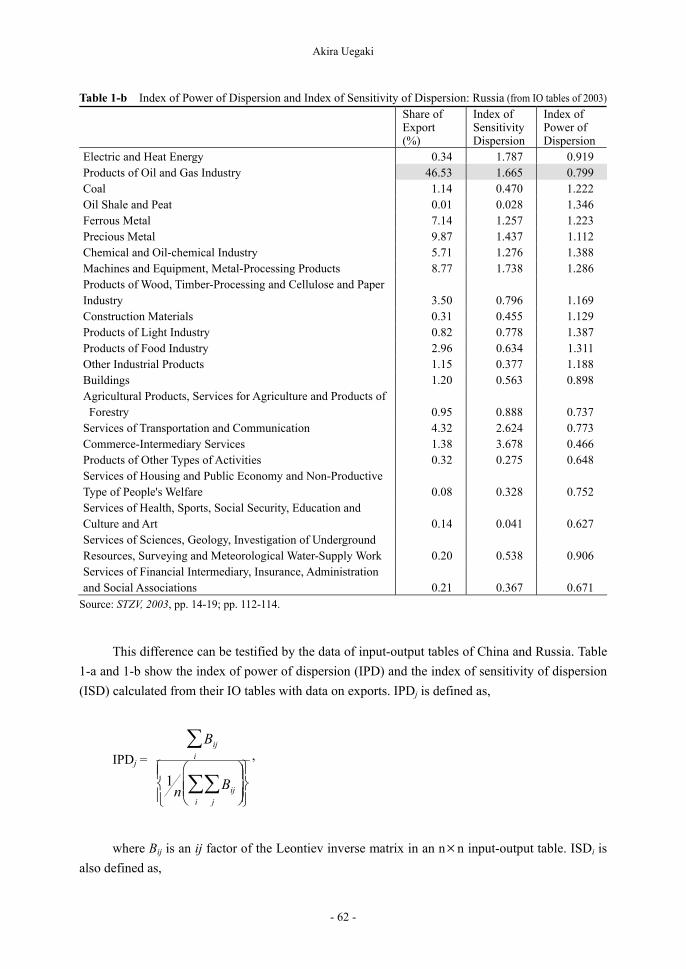
Table 1-b Index of Power of Dispersion and Index of Sensitivity of Dispersion: Russia (from IO tables of 2003)
Share of Export (%)
Index of Sensitivity Dispersion
Index of Power of Dispersion
Electric and Heat Energy 0.34 1.787 0.919 Products of Oil and Gas Industry 46.53 1.665 0.799 Coal 1.14 0.470 1.222 Oil Shale and Peat 0.01 0.028 1.346 Ferrous Metal 7.14 1.257 1.223 Precious Metal 9.87 1.437 1.112 Chemical and Oil-chemical Industry 5.71 1.276 1.388 Machines and Equipment, Metal-Processing Products 8.77 1.738 1.286 Products of Wood, Timber-Processing and Cellulose and PaperIndustry 3.50 0.796 1.169 Construction Materials 0.31 0.455 1.129 Products of Light Industry 0.82 0.778 1.387 Products of Food Industry 2.96 0.634 1.311 Other Industrial Products 1.15 0.377 1.188 Buildings 1.20 0.563 0.898 Agricultural Products, Services for Agriculture and Products of Forestry 0.95 0.888 0.737 Services of Transportation and Communication 4.32 2.624 0.773 Commerce-Intermediary Services 1.38 3.678 0.466 Products of Other Types of Activities 0.32 0.275 0.648 Services of Housing and Public Economy and Non-Productive Type of People's Welfare 0.08 0.328 0.752 Services of Health, Sports, Social Security, Education and Culture and Art 0.14 0.041 0.627 Services of Sciences, Geology, Investigation of Underground Resources, Surveying and Meteorological Water-Supply Work 0.20 0.538 0.906 Services of Financial Intermediary, Insurance, Administration and Social Associations 0.21 0.367 0.671
Source: STZV, 2003, pp. 14-19; pp. 112-114.
Balance of Payments from a Comparative Perspective
- 63 -
ISDi =
Bij
j
1n Bij
j
i
.
The IPD is an index showing how much the economy as a whole would increase when in-
dustry j increases its production by one unit. The index is shown in the form of a ratio to the aver-
age of all the industries listed. Therefore, if IPDi is higher than 1, “the ripple effect” of industry i
on the whole economy is stronger than average. On the other hand, the ISD is an index showing
how much industry i would increase its production when every industry listed increases its pro-
duction by one unit. It is also shown as a ratio to the average. According to Table 1-a, in the case of
China, the leading exporting industry (machinery and equipment) and the second-leading export
industry (textile, sewing, leather, and fur products) have high IPDs. It means that these industries
have a close connection with the domestic economy and that an increase in exports would lead to
an increase in the whole production of the country. As for the machinery and equipment industry in
China, we must note that its ISD is also high. This means that high growth of the Chinese econ-
omy as a whole would, in turn, lead to growth of its machinery and equipment industry. We see
here a virtuous circle of the Chinese economy. On the other hand, in the case of Russia, the leading
exporting industry (oil and gas products4) has a very low IPD, much lower than the national aver-
age (Table 1-b).5 The export of oil and gas has a very small “ripple effect” in Russia and its in-
crease would not result in strong power to raise the whole economy. It is natural that the IPD of the
oil and gas products industry is small, but the problem lies in the fact that this industry is the lead-
ing exporting industry of Russia.6
Current Account in a Macro Economy
Among the many figures in balance of payments statistics, the most fundamental is the cur-
rent account balance, which represents one country’s total resultant effect of international trade
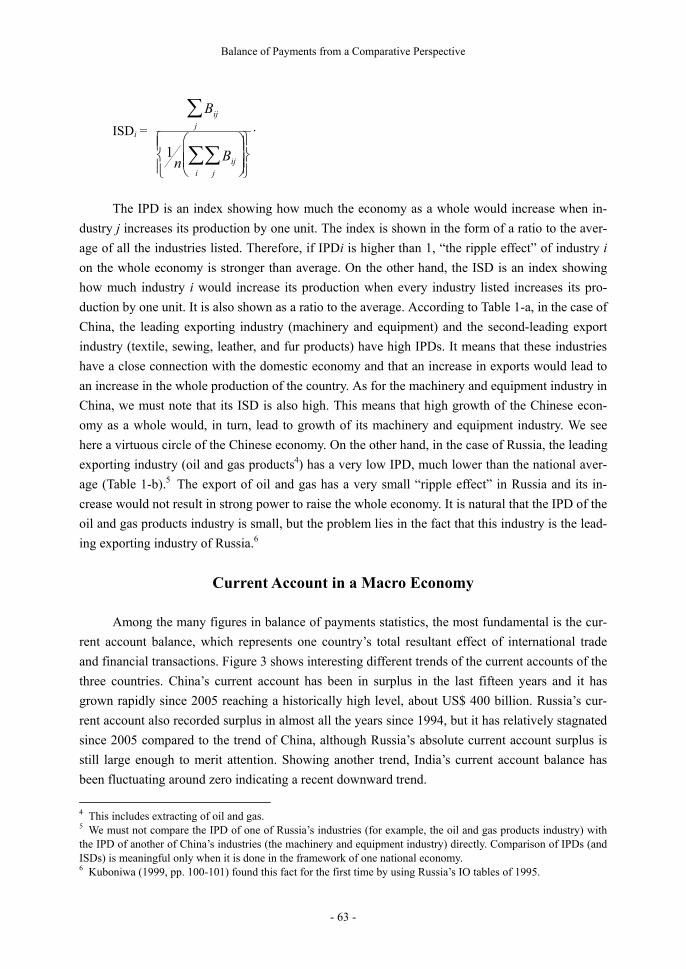
and financial transactions. Figure 3 shows interesting different trends of the current accounts of the
three countries. China’s current account has been in surplus in the last fifteen years and it has
grown rapidly since 2005 reaching a historically high level, about US$ 400 billion. Russia’s cur-
rent account also recorded surplus in almost all the years since 1994, but it has relatively stagnated
since 2005 compared to the trend of China, although Russia’s absolute current account surplus is
still large enough to merit attention. Showing another trend, India’s current account balance has
been fluctuating around zero indicating a recent downward trend.
4 This includes extracting of oil and gas. 5 We must not compare the IPD of one of Russia’s industries (for example, the oil and gas products industry) with the IPD of another of China’s industries (the machinery and equipment industry) directly. Comparison of IPDs (and ISDs) is meaningful only when it is done in the framework of one national economy. 6 Kuboniwa (1999, pp. 100-101) found this fact for the first time by using Russia’s IO tables of 1995.
Akira Uegaki
- 64 -
In the framework of a macroeconomy, the current account balance is the increase in finan-
cial claims of the residents against the rest of the world and equals the sum of fiscal surplus and
excess of residents’ savings over investment. Therefore, we get
CA = (T – G) + (S – I) [1]
where CA = current account balance, T = tax revenue, G = government expenditure, S =
private savings, I = investment including government investment.
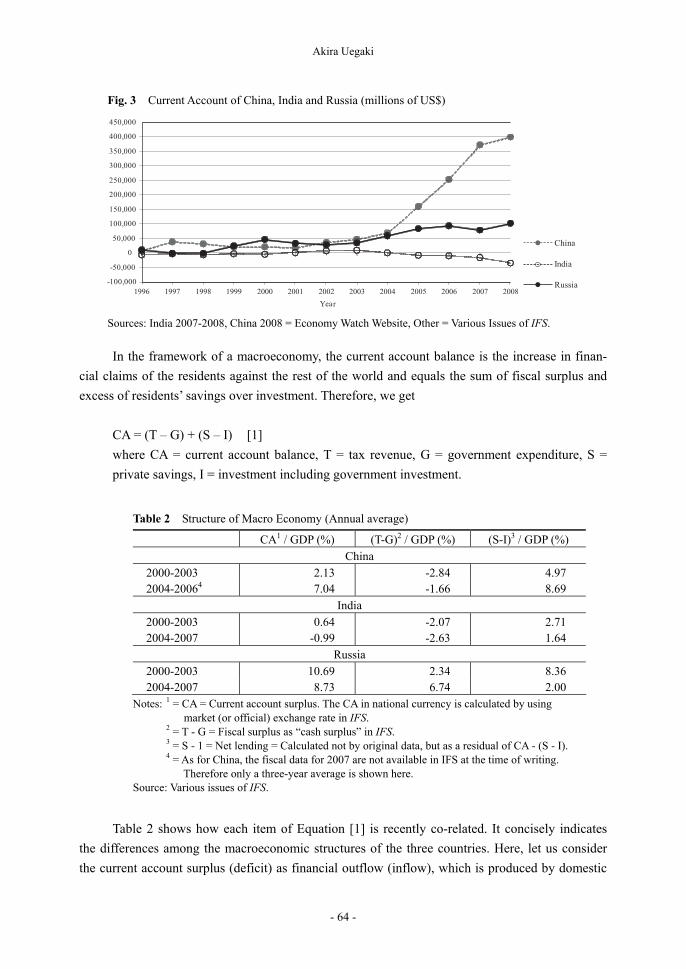
Table 2 shows how each item of Equation [1] is recently co-related. It concisely indicates
the differences among the macroeconomic structures of the three countries. Here, let us consider
the current account surplus (deficit) as financial outflow (inflow), which is produced by domestic
Fig. 3 Current Account of China, India and Russia (millions of US$)
Sources: India 2007-2008, China 2008 = Economy Watch Website, Other = Various Issues of IFS.
Table 2 Structure of Macro Economy (Annual average)
CA1 / GDP (%) (T-G)2 / GDP (%) (S-I)3 / GDP (%)
China
2000-2003 2.13 -2.84 4.97 2004-20064 7.04 -1.66 8.69
India
2000-2003 0.64 -2.07 2.71 2004-2007 -0.99 -2.63 1.64
Russia
2000-2003 10.69 2.34 8.36 2004-2007 8.73 6.74 2.00
Notes: 1 = CA = Current account surplus. The CA in national currency is calculated by using market (or official) exchange rate in IFS. 2 = T - G = Fiscal surplus as “cash surplus” in IFS. 3 = S - 1 = Net lending = Calculated not by original data, but as a residual of CA - (S - I). 4 = As for China, the fiscal data for 2007 are not available in IFS at the time of writing. Therefore only a three-year average is shown here. Source: Various issues of IFS.
Balance of Payments from a Comparative Perspective
- 65 -
surplus (deficit) of the T-G balance and S-I balance, instead of the result of excess exports of
goods and services over imports. It is a standpoint that lays stronger emphasis on the financial as-
pects rather than the physical aspects of international transactions.7 According to this standpoint,
the whole picture can be depicted as follows.
In China, the surplus of the S-I balance (“net lending” according to the new SNA terminol-
ogy) has been too great to cover the fiscal deficit; therefore, the remaining financial resources have
been pushed out of the country, which has resulted in a large current account surplus. These finan-
cial outflows, which include the central bank’s reserve assets, have been growing more rapidly in
the last several years. In fact, in 2007, the current account surplus reached a level of 11.34 percent
of the GDP.8
On the other hand, in India, the S-I balance slightly exceeded the fiscal deficit in the first
four years, but more recently, it is insufficient to cover the fiscal deficit and the shortage is being
covered by foreign capital. India is now showing the features of a typical capital-shortage devel-
oping industrial country, in which investment is actively conducted and fiscal spending is growing
to cover social needs in a rapidly changing society.
The most striking point of Russia’s structure is that it has been producing a large fiscal sur-
plus in the last several years. This means too many tax payments have been made causing a reduc-
tion in private savings. In fact, in 2007 solely, the S-I balance was negative.9 As for the current
account surplus, it is still large though symptoms of decline have appeared. Russia has been a large
capital provider for the world financial market. It is true that after the financial crisis in 2008, Rus-
sia’s current account surplus decreased suddenly. The current account surplus in the third quarter
of 2008 was US$ 29.5 billion and it decreased to US$ 8.6 billion in the fourth quarter. Notwith-
standing, we must note that the surplus in the fourth quarter of 2008 is almost the same as in the
fourth quarter of 2003.10 It is ironic that a considerable part of the accumulated fiscal surplus,
which the government poured into the depressed economy after the crisis, has left the country.11
Russia is still a provider of capital in the world even after the financial crisis.
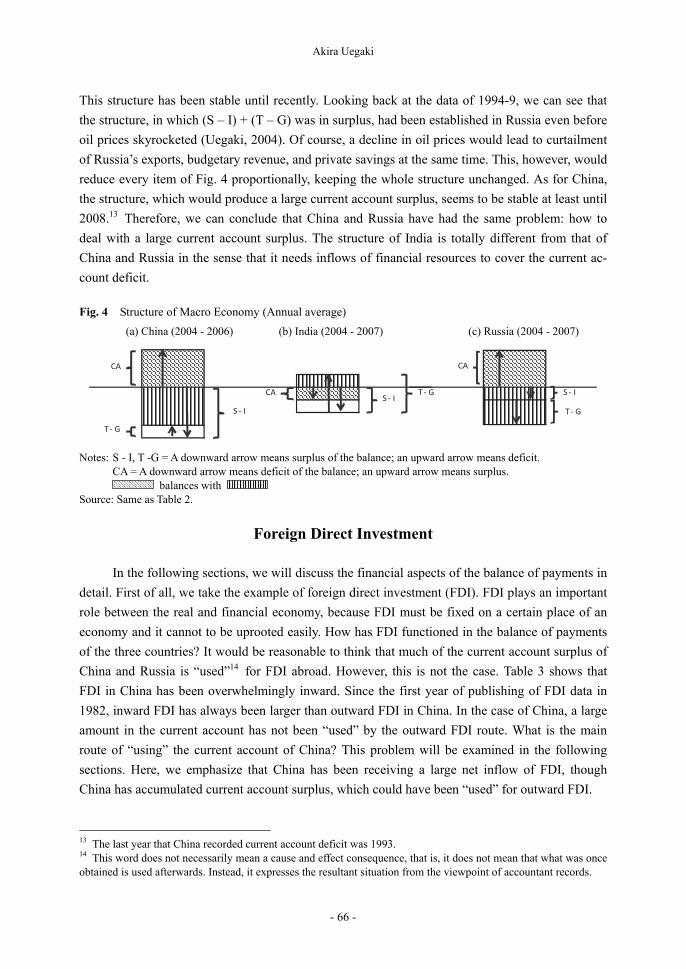
Figure 4 shows the situation more graphically for the years 2004-7. It reveals that the struc-
ture of China is not fundamentally different from that of Russia. In both countries, a large amount
of unspent financial resources, whether in the form of private savings or governmental savings, are
produced and they are pushed out of the country as financial claims12 against the rest of the world.
7 This standpoint asserts that the USA is so attractive that foreign investors are eager to invest their capital in the US market and that the incoming financial resources cover the deficits of the T-G balance and the S-I balance, which results in current account deficit. Richard Cooper says that “it would be more nearly correct to say that the desire of foreigners to invest in the U.S. economy results in the U.S. current account deficit” (Cooper, 2008, p. 96). This does not contradict the conventional standpoint that Americans are too extravagant to be satisfied with what they can produce domestically, which would result in current account deficit. These two standpoints are the two sides of the same coin. Of course, we need not expect that this attraction of the US market will continue forever. 8 Calculated using the data of CSY. These data are not included in the calculation of Table 2 (see Note 4 of Table 2). 9 It is not explicitly shown in Table 2. 10 Website of the Central Bank of Russia. 11 See Konno (2009). 12 Including the central bank’s reserves.
Akira Uegaki
- 66 -
This structure has been stable until recently. Looking back at the data of 1994-9, we can see that
the structure, in which (S – I) + (T – G) was in surplus, had been established in Russia even before
oil prices skyrocketed (Uegaki, 2004). Of course, a decline in oil prices would lead to curtailment
of Russia’s exports, budgetary revenue, and private savings at the same time. This, however, would
reduce every item of Fig. 4 proportionally, keeping the whole structure unchanged. As for China,
the structure, which would produce a large current account surplus, seems to be stable at least until
2008.13 Therefore, we can conclude that China and Russia have had the same problem: how to
deal with a large current account surplus. The structure of India is totally different from that of
China and Russia in the sense that it needs inflows of financial resources to cover the current ac-
count deficit.
Foreign Direct Investment
In the following sections, we will discuss the financial aspects of the balance of payments in
detail. First of all, we take the example of foreign direct investment (FDI). FDI plays an important
role between the real and financial economy, because FDI must be fixed on a certain place of an
economy and it cannot to be uprooted easily. How has FDI functioned in the balance of payments
of the three countries? It would be reasonable to think that much of the current account surplus of
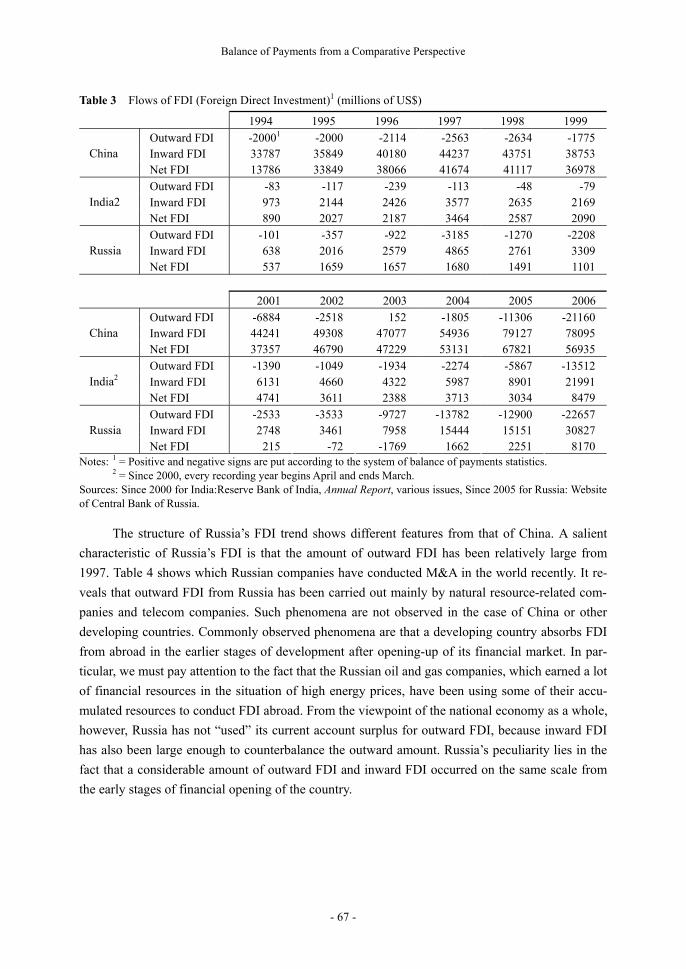
China and Russia is “used”14 for FDI abroad. However, this is not the case. Table 3 shows that
FDI in China has been overwhelmingly inward. Since the first year of publishing of FDI data in
1982, inward FDI has always been larger than outward FDI in China. In the case of China, a large
amount in the current account has not been “used” by the outward FDI route. What is the main
route of “using” the current account of China? This problem will be examined in the following
sections. Here, we emphasize that China has been receiving a large net inflow of FDI, though
China has accumulated current account surplus, which could have been “used” for outward FDI.
13 The last year that China recorded current account deficit was 1993. 14 This word does not necessarily mean a cause and effect consequence, that is, it does not mean that what was once obtained is used afterwards. Instead, it expresses the resultant situation from the viewpoint of accountant records.
Fig. 4 Structure of Macro Economy (Annual average)
(a) China (2004 - 2006) (b) India (2004 - 2007) (c) Russia (2004 - 2007)
Notes: S - I, T -G = A downward arrow means surplus of the balance; an upward arrow means deficit. CA = A downward arrow means deficit of the balance; an upward arrow means surplus. balances with Source: Same as Table 2.
Balance of Payments from a Comparative Perspective
- 67 -
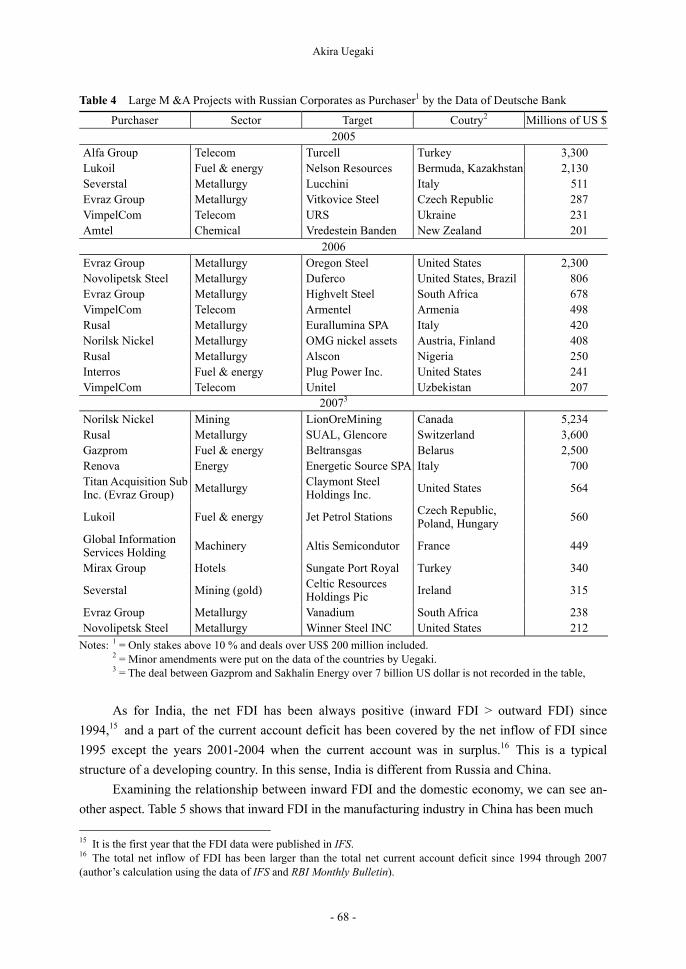
The structure of Russia’s FDI trend shows different features from that of China. A salient
characteristic of Russia’s FDI is that the amount of outward FDI has been relatively large from
1997. Table 4 shows which Russian companies have conducted M&A in the world recently. It re-
veals that outward FDI from Russia has been carried out mainly by natural resource-related com-
panies and telecom companies. Such phenomena are not observed in the case of China or other
developing countries. Commonly observed phenomena are that a developing country absorbs FDI
from abroad in the earlier stages of development after opening-up of its financial market. In par-
ticular, we must pay attention to the fact that the Russian oil and gas companies, which earned a lot
of financial resources in the situation of high energy prices, have been using some of their accu-
mulated resources to conduct FDI abroad. From the viewpoint of the national economy as a whole,
however, Russia has not “used” its current account surplus for outward FDI, because inward FDI
has also been large enough to counterbalance the outward amount. Russia’s peculiarity lies in the
fact that a considerable amount of outward FDI and inward FDI occurred on the same scale from
the early stages of financial opening of the country.
Table 3 Flows of FDI (Foreign Direct Investment)1 (millions of US$)
1994 1995 1996 1997 1998 1999
Outward FDI -20001 -2000 -2114 -2563 -2634 -1775 Inward FDI 33787 35849 40180 44237 43751 38753 China Net FDI 13786 33849 38066 41674 41117 36978
Outward FDI -83 -117 -239 -113 -48 -79 Inward FDI 973 2144 2426 3577 2635 2169 India2 Net FDI 890 2027 2187 3464 2587 2090
Outward FDI -101 -357 -922 -3185 -1270 -2208 Inward FDI 638 2016 2579 4865 2761 3309 Russia Net FDI 537 1659 1657 1680 1491 1101
2001 2002 2003 2004 2005 2006
Outward FDI -6884 -2518 152 -1805 -11306 -21160 Inward FDI 44241 49308 47077 54936 79127 78095 China Net FDI 37357 46790 47229 53131 67821 56935
Outward FDI -1390 -1049 -1934 -2274 -5867 -13512 Inward FDI 6131 4660 4322 5987 8901 21991 India2 Net FDI 4741 3611 2388 3713 3034 8479
Outward FDI -2533 -3533 -9727 -13782 -12900 -22657 Inward FDI 2748 3461 7958 15444 15151 30827 Russia Net FDI 215 -72 -1769 1662 2251 8170
Notes: 1 = Positive and negative signs are put according to the system of balance of payments statistics. 2 = Since 2000, every recording year begins April and ends March. Sources: Since 2000 for India:Reserve Bank of India, Annual Report, various issues, Since 2005 for Russia: Website of Central Bank of Russia.
Akira Uegaki
- 68 -
As for India, the net FDI has been always positive (inward FDI > outward FDI) since
1994,15 and a part of the current account deficit has been covered by the net inflow of FDI since
1995 except the years 2001-2004 when the current account was in surplus.16 This is a typical
structure of a developing country. In this sense, India is different from Russia and China.
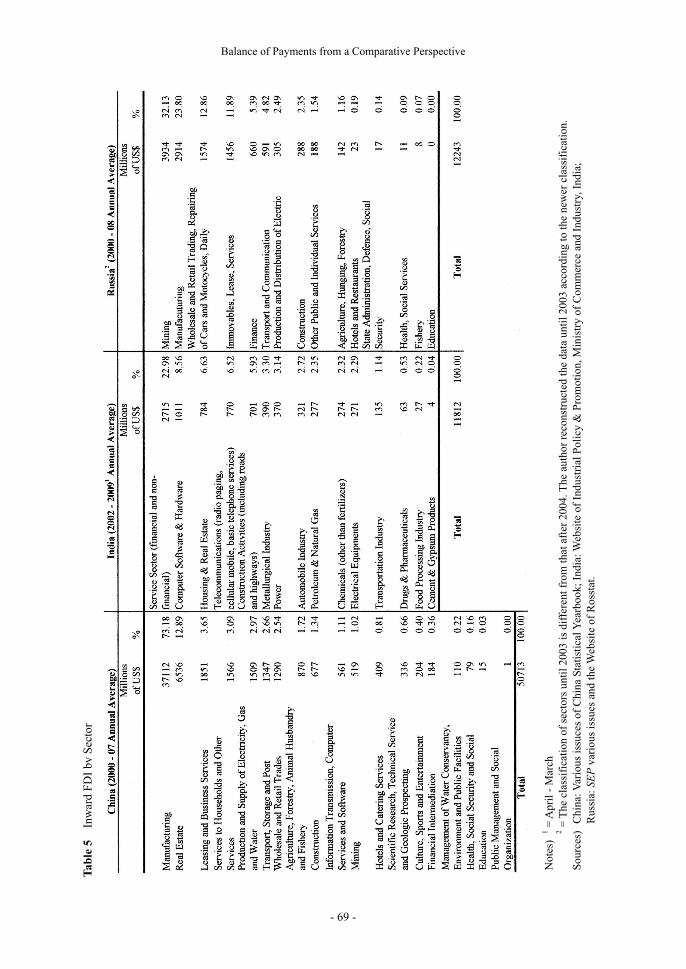
Examining the relationship between inward FDI and the domestic economy, we can see an-
other aspect. Table 5 shows that inward FDI in the manufacturing industry in China has been much
15 It is the first year that the FDI data were published in IFS. 16 The total net inflow of FDI has been larger than the total net current account deficit since 1994 through 2007 (author’s calculation using the data of IFS and RBI Monthly Bulletin).
Table 4 Large M &A Projects with Russian Corporates as Purchaser1 by the Data of Deutsche Bank
Purchaser Sector Target Coutry2 Millions of US $ 2005
Alfa Group Telecom Turcell Turkey 3,300 Lukoil Fuel & energy Nelson Resources Bermuda, Kazakhstan 2,130 Severstal Metallurgy Lucchini Italy 511 Evraz Group Metallurgy Vitkovice Steel Czech Republic 287 VimpelCom Telecom URS Ukraine 231 Amtel Chemical Vredestein Banden New Zealand 201
2006 Evraz Group Metallurgy Oregon Steel United States 2,300 Novolipetsk Steel Metallurgy Duferco United States, Brazil 806 Evraz Group Metallurgy Highvelt Steel South Africa 678 VimpelCom Telecom Armentel Armenia 498 Rusal Metallurgy Eurallumina SPA Italy 420 Norilsk Nickel Metallurgy OMG nickel assets Austria, Finland 408 Rusal Metallurgy Alscon Nigeria 250 Interros Fuel & energy Plug Power Inc. United States 241 VimpelCom Telecom Unitel Uzbekistan 207
20073 Norilsk Nickel Mining LionOreMining Canada 5,234 Rusal Metallurgy SUAL, Glencore Switzerland 3,600 Gazprom Fuel & energy Beltransgas Belarus 2,500 Renova Energy Energetic Source SPA Italy 700 Titan Acquisition Sub Inc. (Evraz Group) Metallurgy Claymont Steel
Holdings Inc. United States 564
Lukoil Fuel & energy Jet Petrol Stations Czech Republic, Poland, Hungary
560
Global Information Services Holding
Machinery Altis Semicondutor France 449
Mirax Group Hotels Sungate Port Royal Turkey 340
Severstal Mining (gold) Celtic Resources Holdings Pic Ireland 315
Evraz Group Metallurgy Vanadium South Africa 238 Novolipetsk Steel Metallurgy Winner Steel INC United States 212
Notes: 1 = Only stakes above 10 % and deals over US$ 200 million included. 2 = Minor amendments were put on the data of the countries by Uegaki. 3 = The deal between Gazprom and Sakhalin Energy over 7 billion US dollar is not recorded in the table,
Balance of Payments from a Comparative Perspective
- 69 -
Tab
le 5
In
war
d F
DI
by S
ecto
r
Not
es)
1 = A
pril
- M
arch
2 = T
he c
lass
ific
atio
n of
sec
tors
unt
il 20
03 is
dif
fere
nt f
rom
that
aft
er 2
004.
The
aut
hor
reco
nstr
ucte
d th
e da
ta u
ntil
200
3 ac
cord
ing
to th
e ne
wer
cla
ssif
icat
ion.
S
ourc
es)
Chi
na: V
ario
us is
suce
s of
Chi
na S
tati
stic
al Y
earb
ook;
Ind
ia: W
ebsi
te o
f In
dust
rial
Pol
icy
& P
rom
otio
n, M
inis
try
of C
omm
erce
and
Ind
ustr
y, I
ndia
;
R
ussi
a: S
EP
var
ious
issu
es a
nd th
e W
ebsi
te o
f R
osst
at.
Akira Uegaki
- 70 -
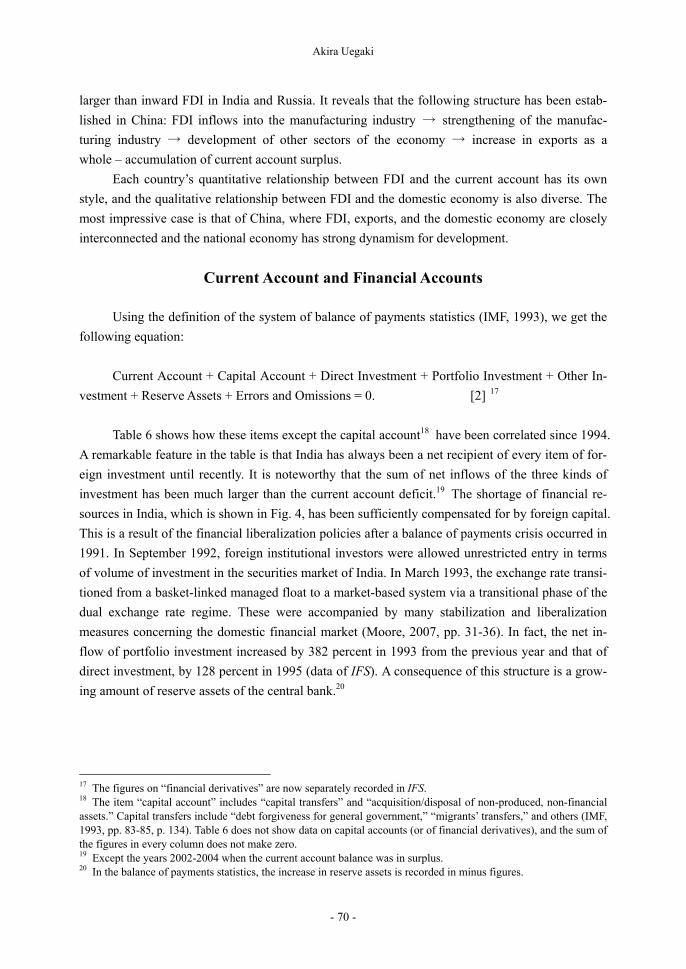
larger than inward FDI in India and Russia. It reveals that the following structure has been estab-
lished in China: FDI inflows into the manufacturing industry → strengthening of the manufac-
turing industry → development of other sectors of the economy → increase in exports as a
whole – accumulation of current account surplus.
Each country’s quantitative relationship between FDI and the current account has its own
style, and the qualitative relationship between FDI and the domestic economy is also diverse. The
most impressive case is that of China, where FDI, exports, and the domestic economy are closely
interconnected and the national economy has strong dynamism for development.
Current Account and Financial Accounts
Using the definition of the system of balance of payments statistics (IMF, 1993), we get the
following equation:
Current Account + Capital Account + Direct Investment + Portfolio Investment + Other In-
vestment + Reserve Assets + Errors and Omissions = 0. [2] 17
Table 6 shows how these items except the capital account18 have been correlated since 1994.
A remarkable feature in the table is that India has always been a net recipient of every item of for-
eign investment until recently. It is noteworthy that the sum of net inflows of the three kinds of
investment has been much larger than the current account deficit.19 The shortage of financial re-
sources in India, which is shown in Fig. 4, has been sufficiently compensated for by foreign capital.
This is a result of the financial liberalization policies after a balance of payments crisis occurred in
1991. In September 1992, foreign institutional investors were allowed unrestricted entry in terms
of volume of investment in the securities market of India. In March 1993, the exchange rate transi-
tioned from a basket-linked managed float to a market-based system via a transitional phase of the
dual exchange rate regime. These were accompanied by many stabilization and liberalization
measures concerning the domestic financial market (Moore, 2007, pp. 31-36). In fact, the net in-
flow of portfolio investment increased by 382 percent in 1993 from the previous year and that of
direct investment, by 128 percent in 1995 (data of IFS). A consequence of this structure is a grow-
ing amount of reserve assets of the central bank.20
17 The figures on “financial derivatives” are now separately recorded in IFS. 18 The item “capital account” includes “capital transfers” and “acquisition/disposal of non-produced, non-financial assets.” Capital transfers include “debt forgiveness for general government,” “migrants’ transfers,” and others (IMF, 1993, pp. 83-85, p. 134). Table 6 does not show data on capital accounts (or of financial derivatives), and the sum of the figures in every column does not make zero. 19 Except the years 2002-2004 when the current account balance was in surplus. 20 In the balance of payments statistics, the increase in reserve assets is recorded in minus figures.
Balance of Payments from a Comparative Perspective
- 71 -
As for China, the structure is different in the sense that portfolio investment and other in-
vestment have not been necessarily in surplus. However, even in the years 2005-7, when portfolio
investment and other investment were in deep deficit (outward investment > inward investment),
the current account surplus and FDI inflow were too large to be counterbalanced by these deficits.
Therefore, there must have been another route of “using” the surplus, which was the increase in
reserve assets. Like India, one of the most striking features of Chinese international financing re-
cently is the rapid growth of its reserve assets. In 1994, China pegged its currency to the US dollar
and since then, a large current account surplus and large capital inflows (mainly FDI) have resulted
in strong pressure to increase reserve assets under relatively strong capital account regulations, but
unrecorded capital outflows (capital flight) largely occurred at the same time, which kept the in-
crease in reserve assets modest. Since 2001-2, unrecorded capital flows began to be reversed from
outward to inward and reserve assets increased extraordinarily (Branstetter and Lardy, 2008, p.
665; Qi, 2006, p. 98).21
Russia began to have a large current account surplus from 1999 and in the period 2005-7,
21 This reversal occurred mainly because of increasing expectation of revaluation of the yuan (Qi, 2006, p. 98).
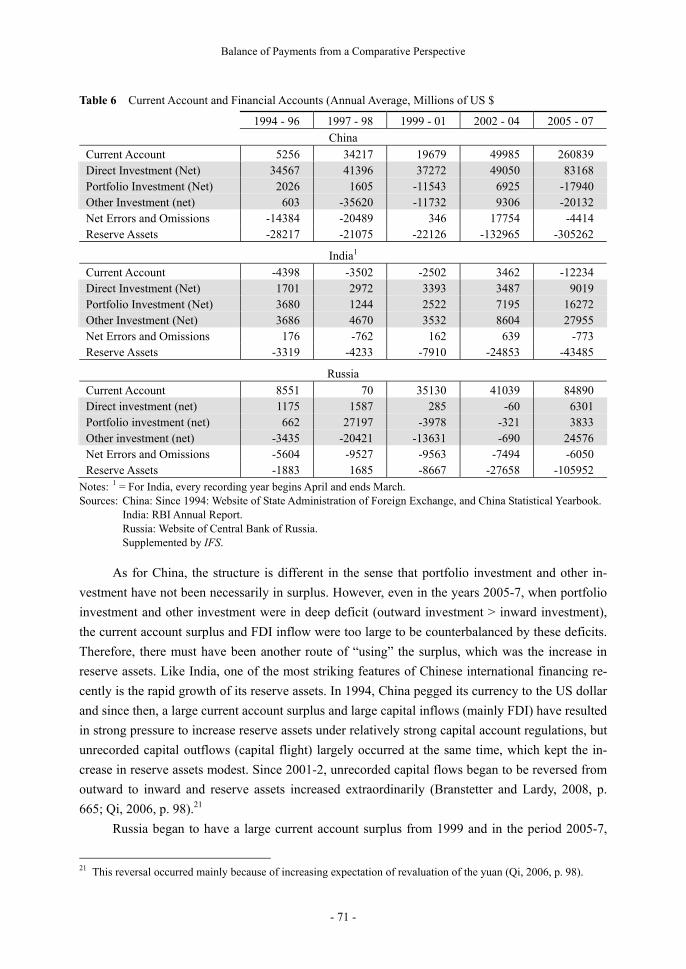
Table 6 Current Account and Financial Accounts (Annual Average, Millions of US $
1994 - 96 1997 - 98 1999 - 01 2002 - 04 2005 - 07
China
Current Account 5256 34217 19679 49985 260839 Direct Investment (Net) 34567 41396 37272 49050 83168 Portfolio Investment (Net) 2026 1605 -11543 6925 -17940 Other Investment (net) 603 -35620 -11732 9306 -20132 Net Errors and Omissions -14384 -20489 346 17754 -4414 Reserve Assets -28217 -21075 -22126 -132965 -305262
India1
Current Account -4398 -3502 -2502 3462 -12234 Direct Investment (Net) 1701 2972 3393 3487 9019 Portfolio Investment (Net) 3680 1244 2522 7195 16272 Other Investment (Net) 3686 4670 3532 8604 27955 Net Errors and Omissions 176 -762 162 639 -773 Reserve Assets -3319 -4233 -7910 -24853 -43485
Russia
Current Account 8551 70 35130 41039 84890 Direct investment (net) 1175 1587 285 -60 6301 Portfolio investment (net) 662 27197 -3978 -321 3833 Other investment (net) -3435 -20421 -13631 -690 24576 Net Errors and Omissions -5604 -9527 -9563 -7494 -6050 Reserve Assets -1883 1685 -8667 -27658 -105952
Notes: 1 = For India, every recording year begins April and ends March. Sources: China: Since 1994: Website of State Administration of Foreign Exchange, and China Statistical Yearbook. India: RBI Annual Report. Russia: Website of Central Bank of Russia. Supplemented by IFS.
Akira Uegaki
- 72 -
large-scale financial inflows occurred by the route of “other investment.”22 The way to “use” these
financial resources changed year by year. Here, we must note that the item “errors and omissions”
has always recorded a considerable amount of negative figures. It reveals that much capital flight
has occurred since the opening of the national economy until recently.23 Capital flight has been
one important item that counterbalances the credit side of the balance of payments of Russia. We
must also pay attention to the fact that since 1999, Russia has had as many reserve assets as India
and China. After the financial crisis of 1998, Russia introduced a managed floating exchange sys-
tem and since then, the currency authorities of Russia are supposed to have kept the ruble rate
against the US dollar within certain limits, which has resulted in the accumulation of reserve assets
in dollars (Konno, 2009, pp. 71-72).24
In the cases of the three countries, the credit side of the balance of payments has been made
by current account surplus (China, and Russia except the crisis years 1997-98), net inflows of FDI
(China, and India to a lesser extent), portfolio investment (India), and other investment (India, and
Russia in the years 2005-07). A common feature of the structure of the balance of payments of the
three countries is that the main route to counterbalancing the credit side has been to increase re-
serve assets except in Russia in 1994-98. This has been made possible by the exchange rate poli-
cies of the three central banks.
The increase in the reserve assets of the central banks and other currency authorities, espe-
cially in the newly emerging market,25 is a distinctive feature of recent international financing. In
February 2006, the European Central Bank published a document entitled “The Accumulation of
Foreign Reserves.” The document divides nine main emerging market countries into four types as
follows (ECB, 2006, p. 14):
a. Current account driven, in conjunction with a drop in domestic investment after the
1997-98 Asian crises: Malaysia and Singapore
b. Current account driven, in conjunction with domestic savings growing more than in-
vestment: Russia, Brazil, and Algeria
c. Driven both by the current account and the financial account, in conjunction with a drop
in domestic investment after the 1997-98 Asian crises: Korea and Taiwan
d. Driven both by the current account and the financial account in conjunction with domes-
tic savings growing more than investment: China and India
This classification corresponds with the analyses above (Table 2, Fig. 4, and Table 6) except
the case of India since 2005, where we found some current account deficits (see Fig. 3) though the
22 Mainly loans to private enterprises including banks. 23 Concerning capital flight from Russia, see Uegaki (2006). 24 February 2005, the reference rate of the ruble against the currency basket (consisting of the dollar and euro) be-gan to be used for the decision to intervene in the market (Konno, 2009, p. 71). 25 Here, the emerging market includes China, Taiwan, Russia, Korea, India, Malaysia, Singapore, Algeria, Brazil, and others. Among advanced countries, Japan, Norway, Denmark, and Australia have accumulated large reserve assets (ECB, 2006, p. 9, p. 11).
Balance of Payments from a Comparative Perspective
- 73 -
document classified India as “driven both by the current account and the financial account.” An
important point here is that the document and the author together assert that domestic savings have
been more than investment in China, India,26 and Russia. It is important because “given the in-
ability of their financial markets to channel private savings into investment, either domestically or
abroad, in certain countries, the public sector may have endeavored to direct residual savings
abroad, thus leading to reserve accumulation” (ECB, 2006, p. 15).
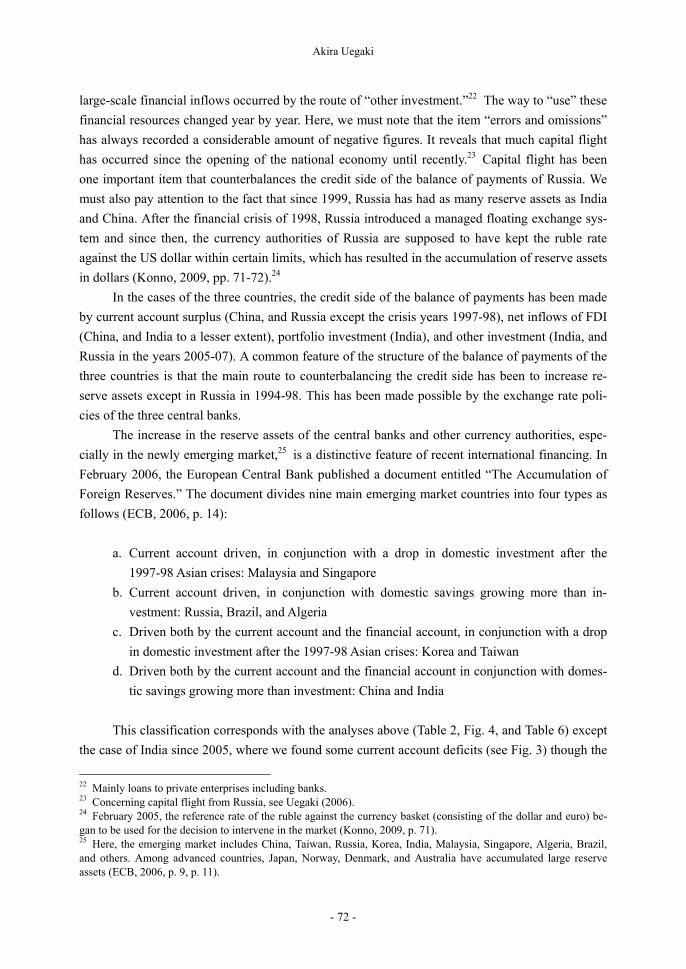
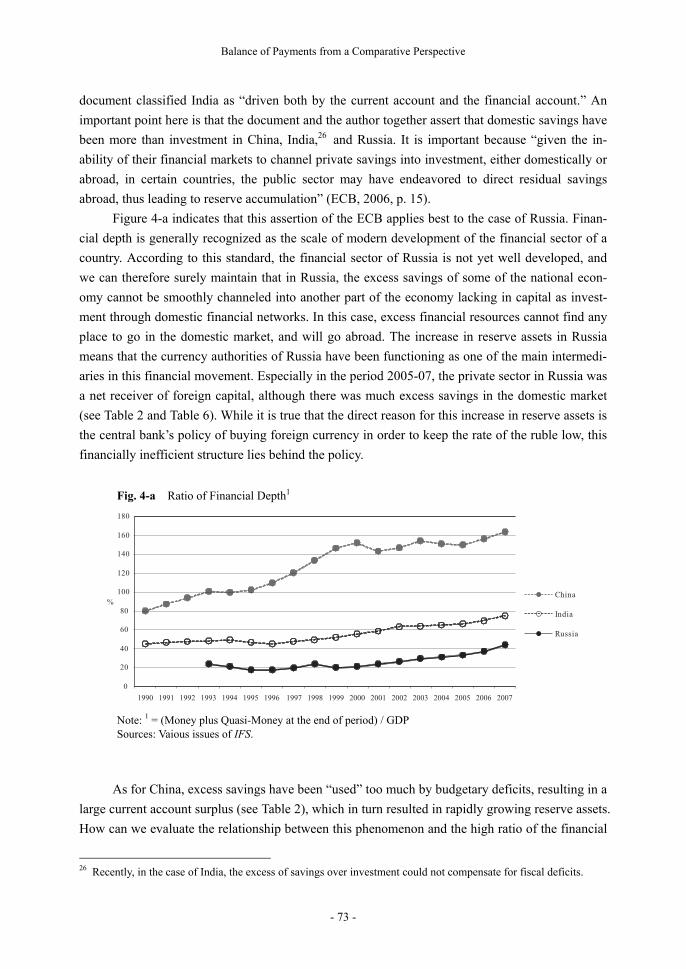
Figure 4-a indicates that this assertion of the ECB applies best to the case of Russia. Finan-
cial depth is generally recognized as the scale of modern development of the financial sector of a
country. According to this standard, the financial sector of Russia is not yet well developed, and
we can therefore surely maintain that in Russia, the excess savings of some of the national econ-
omy cannot be smoothly channeled into another part of the economy lacking in capital as invest-
ment through domestic financial networks. In this case, excess financial resources cannot find any
place to go in the domestic market, and will go abroad. The increase in reserve assets in Russia
means that the currency authorities of Russia have been functioning as one of the main intermedi-
aries in this financial movement. Especially in the period 2005-07, the private sector in Russia was
a net receiver of foreign capital, although there was much excess savings in the domestic market
(see Table 2 and Table 6). While it is true that the direct reason for this increase in reserve assets is
the central bank’s policy of buying foreign currency in order to keep the rate of the ruble low, this
financially inefficient structure lies behind the policy.
As for China, excess savings have been “used” too much by budgetary deficits, resulting in a
large current account surplus (see Table 2), which in turn resulted in rapidly growing reserve assets.
How can we evaluate the relationship between this phenomenon and the high ratio of the financial
26 Recently, in the case of India, the excess of savings over investment could not compensate for fiscal deficits.
Fig. 4-a Ratio of Financial Depth1
Note: 1 = (Money plus Quasi-Money at the end of period) / GDP Sources: Vaious issues of IFS.
Akira Uegaki
- 74 -
depth of China? Why did the excess savings of China not result in outward foreign investment of
the non-central bank sector?
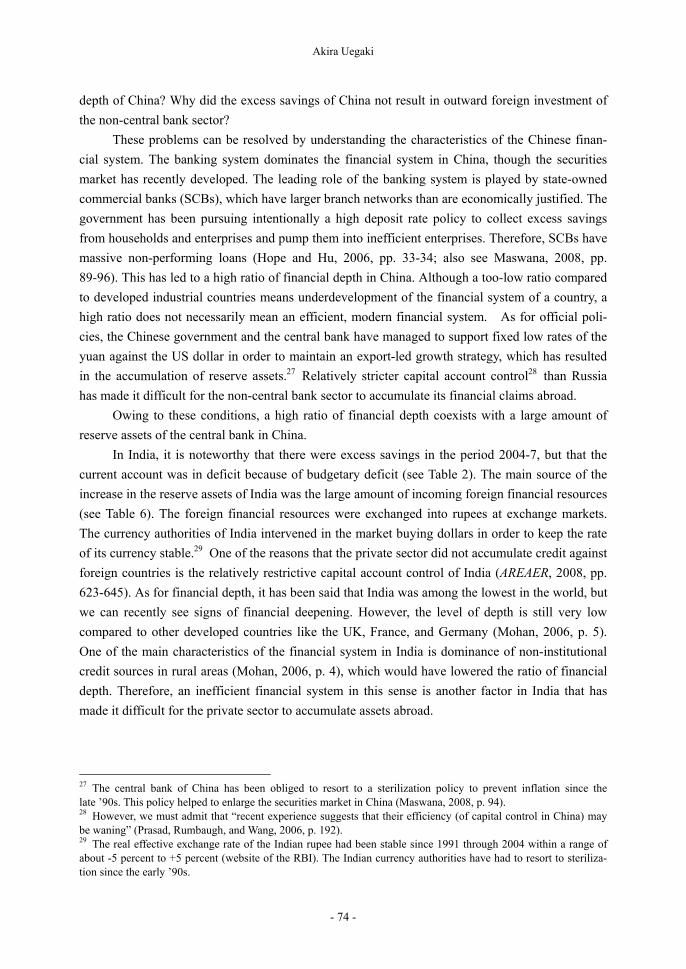
These problems can be resolved by understanding the characteristics of the Chinese finan-
cial system. The banking system dominates the financial system in China, though the securities
market has recently developed. The leading role of the banking system is played by state-owned
commercial banks (SCBs), which have larger branch networks than are economically justified. The
government has been pursuing intentionally a high deposit rate policy to collect excess savings
from households and enterprises and pump them into inefficient enterprises. Therefore, SCBs have
massive non-performing loans (Hope and Hu, 2006, pp. 33-34; also see Maswana, 2008, pp.
89-96). This has led to a high ratio of financial depth in China. Although a too-low ratio compared
to developed industrial countries means underdevelopment of the financial system of a country, a
high ratio does not necessarily mean an efficient, modern financial system. As for official poli-
cies, the Chinese government and the central bank have managed to support fixed low rates of the
yuan against the US dollar in order to maintain an export-led growth strategy, which has resulted
in the accumulation of reserve assets.27 Relatively stricter capital account control28 than Russia
has made it difficult for the non-central bank sector to accumulate its financial claims abroad.
Owing to these conditions, a high ratio of financial depth coexists with a large amount of
reserve assets of the central bank in China.
In India, it is noteworthy that there were excess savings in the period 2004-7, but that the
current account was in deficit because of budgetary deficit (see Table 2). The main source of the
increase in the reserve assets of India was the large amount of incoming foreign financial resources
(see Table 6). The foreign financial resources were exchanged into rupees at exchange markets.
The currency authorities of India intervened in the market buying dollars in order to keep the rate
of its currency stable.29 One of the reasons that the private sector did not accumulate credit against
foreign countries is the relatively restrictive capital account control of India (AREAER, 2008, pp.
623-645). As for financial depth, it has been said that India was among the lowest in the world, but
we can recently see signs of financial deepening. However, the level of depth is still very low
compared to other developed countries like the UK, France, and Germany (Mohan, 2006, p. 5).
One of the main characteristics of the financial system in India is dominance of non-institutional
credit sources in rural areas (Mohan, 2006, p. 4), which would have lowered the ratio of financial
depth. Therefore, an inefficient financial system in this sense is another factor in India that has
made it difficult for the private sector to accumulate assets abroad.
27 The central bank of China has been obliged to resort to a sterilization policy to prevent inflation since the late ’90s. This policy helped to enlarge the securities market in China (Maswana, 2008, p. 94). 28 However, we must admit that “recent experience suggests that their efficiency (of capital control in China) may be waning” (Prasad, Rumbaugh, and Wang, 2006, p. 192). 29 The real effective exchange rate of the Indian rupee had been stable since 1991 through 2004 within a range of about -5 percent to +5 percent (website of the RBI). The Indian currency authorities have had to resort to steriliza-tion since the early ’90s.
Balance of Payments from a Comparative Perspective
- 75 -
From a Comparative and Historical Perspective
Geoffrey Crowther, Charles Kindleberger, and others once presented a “balance of payments
stages hypothesis” that asserted that “the current account evolves according to a cycle and that
capital flows move essentially from developed to underdeveloped countries” (Razgallah, 2004, p.
1). Therefore, according to this hypothesis, the structure of balance of payments shows a specific
pattern in a specific historical stage, and the development of one pattern to another is commonly
observed in most countries in the world. Many theoretical investigations and empirical tests have
found that this hypothesis cannot be verified (Hitiris, 1988; Razgallah, 2004) as a theory of history.
That is, if we observe, for example, Stage II in one country at a point in history, we would not
necessarily see Stage III next. It is a matter of course, because violent fluctuations in natural re-
source prices, freely floating exchange rates, intermittently occurring technical breakthroughs,
politically decided trade policies, frequent movement of short-term capital, and other factors un-
dermine the straightforward “development” of this pattern.
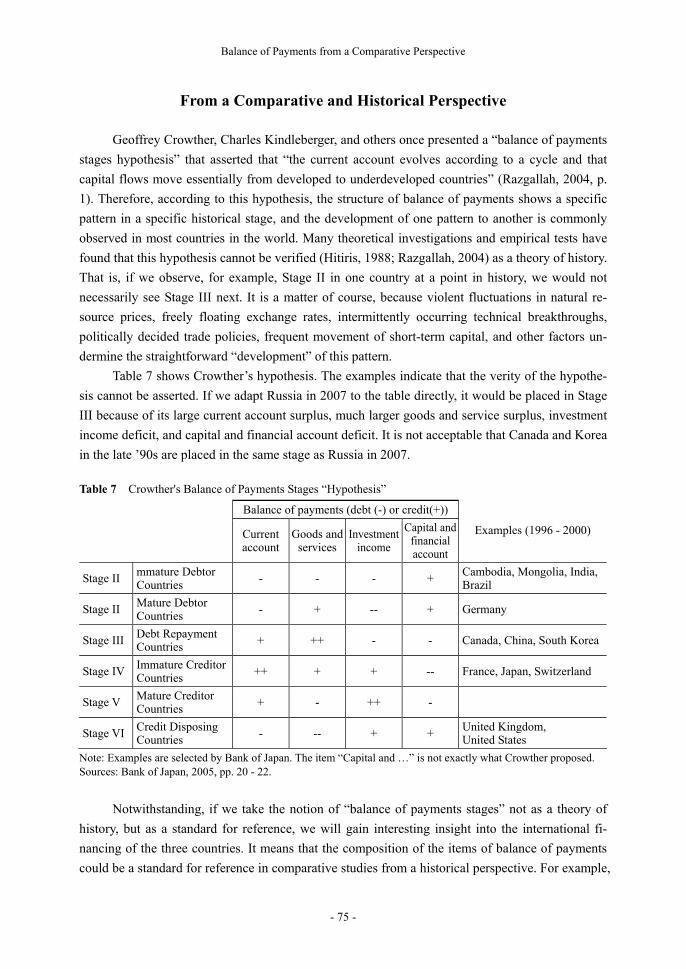
Table 7 shows Crowther’s hypothesis. The examples indicate that the verity of the hypothe-
sis cannot be asserted. If we adapt Russia in 2007 to the table directly, it would be placed in Stage
III because of its large current account surplus, much larger goods and service surplus, investment
income deficit, and capital and financial account deficit. It is not acceptable that Canada and Korea
in the late ’90s are placed in the same stage as Russia in 2007.
Notwithstanding, if we take the notion of “balance of payments stages” not as a theory of
history, but as a standard for reference, we will gain interesting insight into the international fi-
nancing of the three countries. It means that the composition of the items of balance of payments
could be a standard for reference in comparative studies from a historical perspective. For example,
Table 7 Crowther's Balance of Payments Stages “Hypothesis”
Balance of payments (debt (-) or credit(+))
Currentaccount
Goods andservices
Investmentincome
Capital andfinancialaccount
Examples (1996 - 2000)
Stage II mmature Debtor Countries
- - - + Cambodia, Mongolia, India, Brazil
Stage II Mature Debtor Countries
- + -- + Germany
Stage III Debt Repayment Countries + ++ - - Canada, China, South Korea
Stage IV Immature Creditor Countries
++ + + -- France, Japan, Switzerland
Stage V Mature Creditor Countries
+ - ++ -
Stage VI Credit Disposing Countries - -- + + United Kingdom,
United States
Note: Examples are selected by Bank of Japan. The item “Capital and …” is not exactly what Crowther proposed. Sources: Bank of Japan, 2005, pp. 20 - 22.
Akira Uegaki
- 76 -
if we find a large amount of a certain item in the balance of payments of a country, we can tell
whether it is unique in history or not so unique from a longer historical perspective from the data
discovered by the “balance of payments stages” theorists.
First, we must investigate the volume of the current account. Let us examine Table 2 again.
In the table, we find a large current account surplus in China and Russia. In 1986, Japan recorded
the highest current account surplus in percentage of the GDP (4.24 percent) after World War II, but
this is no match for Russia’s and China’s record. The researchers who developed the “hypothesis”
have found much historical data on the balance of payments. In the case of the United Kingdom,
the current account surplus was 3.8 percent of the nominal “GNP” in 1851-1890, and 3.4 percent
in 1891-1925 when the United Kingdom is thought to have moved from Stage III to Stage IV ac-
cording to the hypothesis. As for the USA, it was 0.4 percent of nominal GDP in 1851-1920 (Stage
III) and 2.4 percent in 1911-1940 (Stage IV). In Germany, it was 1.3 percent of nominal GDP in
1951-1970 (Stage III) (Uchimua, Tanaka, and Okamoto, 1998, p. 41). Considering all these data,
the current account surplus of China and Russia since 2000 is exceptionally large in modern eco-
nomic history.
A recent IMF publication explores the reasons for the divergence of current account bal-
ances across emerging economies (WEO, 2008). According to this document, “less open capital
accounts” and a lack of “liberalization of the domestic financial market” “explain a substantial part
of the current account surpluses” in emerging Asia (WEO, 2008, p. 228). This assertion corre-
sponds to our analysis above concerning China and Russia.
As for India, because of deficits in the current account, deficits in the goods and services
trade, and net receipt of capital and financial accounts, it seems to be correct to put India at Stage I.
We must, however, pay attention to the fact that the deficits in the goods and services trade have
been much larger than those in the current account as a whole since the 1980s (various issues of
IFS). It means that there must have been an item that has mitigated the deficits in the current ac-
count, that is, the net receipt of “current transfers.” The current transfers mainly include govern-
mental subsidies (cash transfer, gift of food, clothing, other consumer goods, medical supplies, etc.,
gifts of certain military equipment, and regular contributions paid to international organizations)
and workers’ remittances (IMF, 1993, paragraphs 298-302).30 According to the statistics of the
Reserve Bank of India, since the late ’80s, a large net receipt of “private transfers” has been re-
corded in the balance of payments (RBIAR, various issues). It means that the workers’ remittances
have relaxed the difficulties arising from current account deficits in India for many years. This
phenomenon can also be observed in Turkey and new EU member states like Romania and Bul-
garia. Although advocates of the balance of payments stages hypothesis overlook the item of
transfers,31 we must consider a country with many current transfer receipts as showing a new type
30 Workers’ remittances are different from “compensation for employees,” which is wages earned by workers tem-porarily (not longer than one year) working abroad. 31 The fifth edition of the balance of payment manual divides the old category of “unrequited transfers” (according to the fourth edition) into two categories, current transfers and capital transfers. The former is included in the current account and the latter is included in the capital and financial account (IMF, 1993, pp. 133-134).
Balance of Payments from a Comparative Perspective
- 77 -
of international financing. In particular, it is worth noting that the net receipt of current transfers
was larger than the net deficits of goods and services trade in India in 2001-04, and that the overall
current account was in surplus at that time (various issues of IFS).
Lastly, we examine the trend of investment income of China, India, and Russia. Table 7 in-
dicates that the item “investment income” plays a pivotal role in the last stages of the “hypothesis.”
As for attracting and offering of capital, the hypothesis asserts that a country at Stage V exports
capital and obtains much investment income and that it will then “develop” into the last stage,
when it again begins to import capital again though maintaining positive investment income. It is
very hard to prove the verity of this assertion because the definition of capital is ambiguous in the
hypothesis.
Strictly speaking, by today’s standard, investment income is “property income in the SNA”
and “covers income derived from a resident entity’s ownership of foreign financial assets. The
most common types of investment income are income on equity (dividends) and income on debt
(interest)” (IMF, 1993, paragraph 274). This definition leads us to the conclusion that the invest-
ment income can be considered as a scale for structural and institutional development of a coun-
try’s overall international financing. If receipt of investment income of a country is larger than
payment, it reveals that the financial structure of the country is well developed and “productive” in
the context of the world financial market. Such a developed financial structure indicates that the
country as a whole has reached a relatively high level of economic development.
From this standpoint, the trend of China indicates its violent structural changes in interna-
tional financing under rapid economic growth. In 199432-2004, the current account recorded large
surpluses, and under the situation of excess savings, reserve assets of the Chinese Central Bank
have been accumulated year by year. It is also noteworthy that large capital flight occurred at least
until the end of the last century (Branstetter and Lardy, 2008, p. 665; Oohashi, 2003, pp. 176-182).
During this period, the Chinese economy stepped into the world economic system more deeply by
joining the IMF (1996) and the WTO (2001), which made China very active in receiving capital
from abroad and at the same time investing abroad. As for receiving and investing capital, until
2004, the former was larger than the latter, so interest and dividends always have been in excess of
payment. The negative balance of investment income in China reached a peak in 2001, but then it
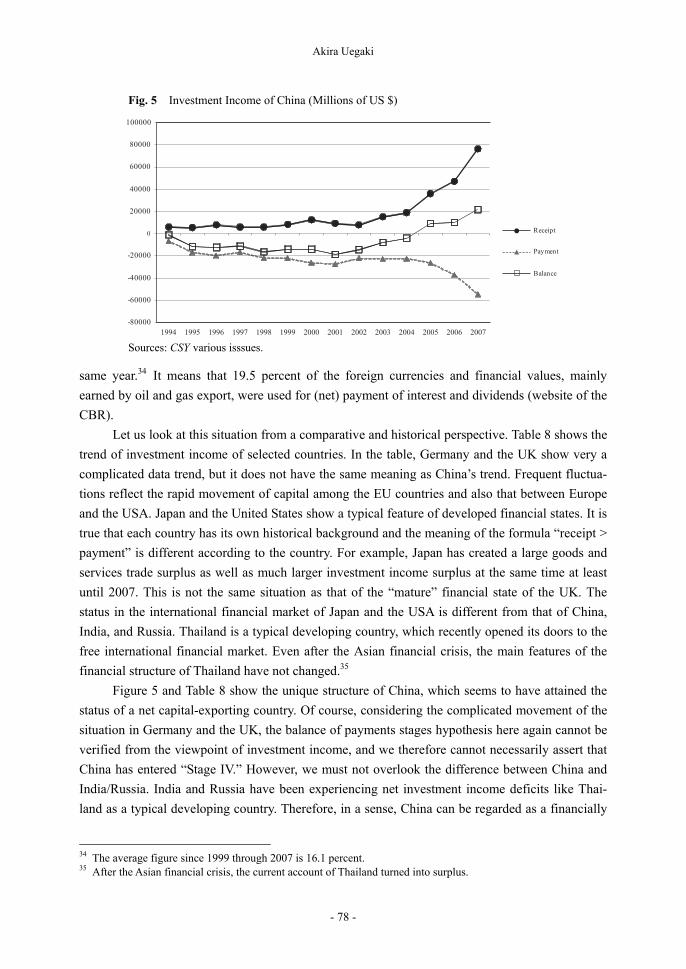
began to decrease and finally became positive in 2005 (see Fig. 5).
On the other hand, India and Russia are characterized by rapidly growing deficits in invest-
ment income until today. India’s balance in investment income reached -6573 million US dollars in
the 2006-07 fiscal year. It is larger than the trade balance deficit in the same year (RBIAR, 2008).
As for Russia, both receipt and payment of investment income has increased rapidly since 2003
under high oil prices, but payment has increased more rapidly than receipt and the minus balance
has become larger. In 2008, the net balance of receipt and payment reached -35,094 million US
dollars,33 the absolute value of which equals 19.5 percent of the surplus of the goods trade in the
32 The first year that detailed balance of payments data were open. 33 The data are “on schedule.” The amount not paid by the due date is included. The largest amount of unpaid debt was about 1.5 billion US dollars (2001).
Akira Uegaki
- 78 -
same year.34 It means that 19.5 percent of the foreign currencies and financial values, mainly
earned by oil and gas export, were used for (net) payment of interest and dividends (website of the
CBR).
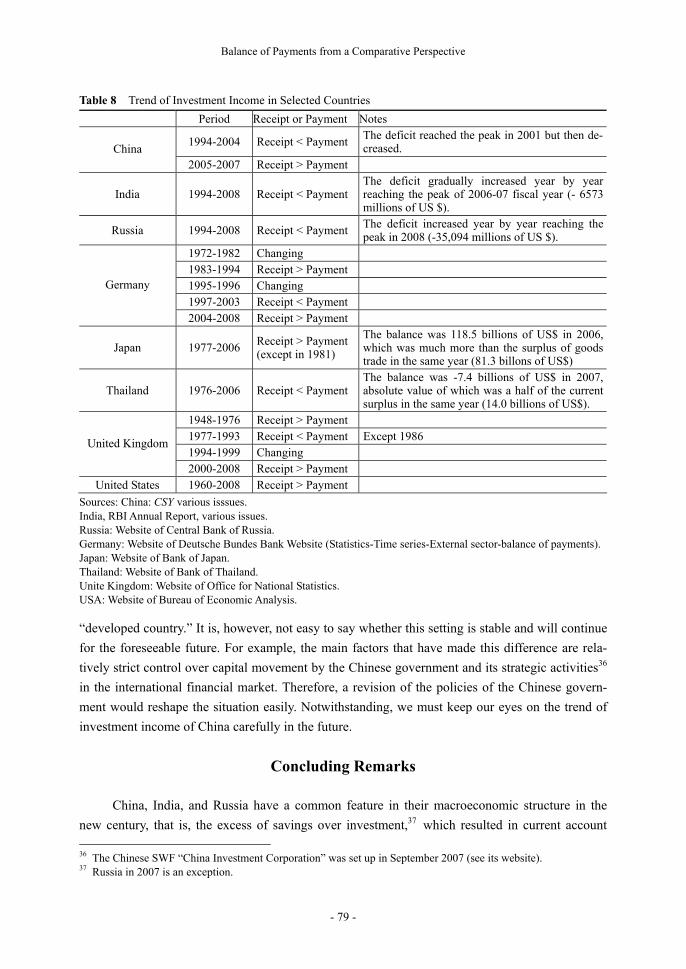
Let us look at this situation from a comparative and historical perspective. Table 8 shows the
trend of investment income of selected countries. In the table, Germany and the UK show very a
complicated data trend, but it does not have the same meaning as China’s trend. Frequent fluctua-
tions reflect the rapid movement of capital among the EU countries and also that between Europe
and the USA. Japan and the United States show a typical feature of developed financial states. It is
true that each country has its own historical background and the meaning of the formula “receipt >
payment” is different according to the country. For example, Japan has created a large goods and
services trade surplus as well as much larger investment income surplus at the same time at least
until 2007. This is not the same situation as that of the “mature” financial state of the UK. The
status in the international financial market of Japan and the USA is different from that of China,
India, and Russia. Thailand is a typical developing country, which recently opened its doors to the
free international financial market. Even after the Asian financial crisis, the main features of the
financial structure of Thailand have not changed.35
Figure 5 and Table 8 show the unique structure of China, which seems to have attained the
status of a net capital-exporting country. Of course, considering the complicated movement of the
situation in Germany and the UK, the balance of payments stages hypothesis here again cannot be
verified from the viewpoint of investment income, and we therefore cannot necessarily assert that
China has entered “Stage IV.” However, we must not overlook the difference between China and
India/Russia. India and Russia have been experiencing net investment income deficits like Thai-
land as a typical developing country. Therefore, in a sense, China can be regarded as a financially
34 The average figure since 1999 through 2007 is 16.1 percent. 35 After the Asian financial crisis, the current account of Thailand turned into surplus.
Fig. 5 Investment Income of China (Millions of US $)
Sources: CSY various isssues.
Balance of Payments from a Comparative Perspective
- 79 -
“developed country.” It is, however, not easy to say whether this setting is stable and will continue
for the foreseeable future. For example, the main factors that have made this difference are rela-
tively strict control over capital movement by the Chinese government and its strategic activities36
in the international financial market. Therefore, a revision of the policies of the Chinese govern-
ment would reshape the situation easily. Notwithstanding, we must keep our eyes on the trend of
investment income of China carefully in the future.
Concluding Remarks
China, India, and Russia have a common feature in their macroeconomic structure in the
new century, that is, the excess of savings over investment,37 which resulted in current account 36 The Chinese SWF “China Investment Corporation” was set up in September 2007 (see its website). 37 Russia in 2007 is an exception.
Table 8 Trend of Investment Income in Selected Countries
Period Receipt or Payment Notes
1994-2004 Receipt < Payment The deficit reached the peak in 2001 but then de-creased. China
2005-2007 Receipt > Payment
India 1994-2008 Receipt < PaymentThe deficit gradually increased year by year reaching the peak of 2006-07 fiscal year (- 6573 millions of US $).
Russia 1994-2008 Receipt < Payment The deficit increased year by year reaching the peak in 2008 (-35,094 millions of US $).
1972-1982 Changing 1983-1994 Receipt > Payment 1995-1996 Changing 1997-2003 Receipt < Payment
Germany
2004-2008 Receipt > Payment
Japan 1977-2006 Receipt > Payment (except in 1981)
The balance was 118.5 billions of US$ in 2006, which was much more than the surplus of goods trade in the same year (81.3 billons of US$)
Thailand 1976-2006 Receipt < PaymentThe balance was -7.4 billions of US$ in 2007, absolute value of which was a half of the current surplus in the same year (14.0 billions of US$).
1948-1976 Receipt > Payment 1977-1993 Receipt < Payment Except 1986 1994-1999 Changing
United Kingdom
2000-2008 Receipt > Payment United States 1960-2008 Receipt > Payment
Sources: China: CSY various isssues. India, RBI Annual Report, various issues. Russia: Website of Central Bank of Russia. Germany: Website of Deutsche Bundes Bank Website (Statistics-Time series-External sector-balance of payments). Japan: Website of Bank of Japan. Thailand: Website of Bank of Thailand. Unite Kingdom: Website of Office for National Statistics. USA: Website of Bureau of Economic Analysis.
Akira Uegaki
- 80 -
surpluses.38 At the same time, the three countries have actively introduced foreign financial re-
sources through various routes.39 Consequently, their financial claims against the rest of the world
have been increasing rapidly, especially in the form of reserve assets of the central banks. These
phenomena reflect weak financial networks in their domestic markets, which would have func-
tioned as financial intermediaries and added to domestic investment.
Of course there are different characteristics among the three countries. India seems to be a
typical developing industrial state, because of its relatively small current account surplus (some-
times, deficit), and active introduction of many kinds of foreign financial resources, which have
spurred domestic economic development. On the other hand, Russia is unique because both the I-S
balance and fiscal balance have been in large surplus, which resulted in a large amount of reserve
assets. At same time, it is noteworthy that its foreign economic transactions have been isolated
from domestic economic circulation. China’s international finances, especially in the sphere of
FDI, have close connection with its domestic economy. The net receipt of investment income is
also an important point in China’s future.
References
AREAER, Annual Report on Exchange Arrangements and Exchange Restrictions. New York, NY: AREAER,
IMF, 2008. Aziz, Jahangir, Steven Dunaway, and Eswar Prasad, eds., China and India, Learning from Each Other,
Reforms and Policies for Sustained Growth, Washington, DC: IMF, 2006. Japan’s Balance of Payments for 2004. Bank of Japan, International Department, 2005. Belkin, V., and V. Storozhenko, “Zolotovaliutnye rezervy Rossii i napravleniia ratsional’nogo is-
pol’zovaniia,” Voprosy ekonomiki, 10, 2007. Branstetter, Lee, and Nicholas Lardy, “China’s Embrace of Globalization,” in Loren Brandt and Thomas G.
Rawski, eds., China’s Great Economic Transformation, Cambridge, UK: Cambridge University Press, 2008.
CSY, China Statistical Yearbook, Various issues, National Bureau of Statistics of China, China Statistical Press.
Cooper, N. Richard, “Global Imbalances: Globalization, Demography, and Sustainability,” The Journal of Economic Perspectives, 22-3, 2008.
ECB, The Accumulation of Foreign Reserves. Occasional Paper Series, No. 43, February 2006 (Prepared by International Relations Committee Task Force of the Bank). European Central Bank, 2006.
Golovnin, M., “Finansovaia globalizatsiia i ogranicheniia natsional’noi denezhno-kreditnoi politiki,” Voprosy ekonomiki, 7, 2007.
Hitiris, T., “U.S. Balance-of-payments Stages 1780 - 1985: A Statistical Investigation”, The International Trade Journal, 2-3, 1988.
Hope, Nicholas, and Fred Hu, “Reforming China’s Banking System: How Much Can Foreign Strategic Investment Help?” in Jahangir Aziz, Steven Dunaway, and Eswar Prasad (2006), 2006.
IFS, International Financial Statistics, Various issues, Washington, DC: IMF. IMF, Balance of Payments Manual, Fifth edition. Washington, DC: IMF, 1993.
38 As for India in the years 2004-07, the excess was not large enough to compensate for its fiscal deficit; therefore, the current account was in deficit. 39 Russia has also “exported” capital at the same time.
Balance of Payments from a Comparative Perspective
- 81 -
INNAS, National Accounts Statistics. New Delhi, India: National Accounts Division, Central Statistical Or-ganization, Government of India, 2008.
Kheifets, B., “Vneshnii sector rossiiskoi ekonomiki,” Voprosy ekonomiki, 11, 2007. Konno, Yugo “Russian Economic Situation Today,” Mizuho Europe Insight, June 15, 2007. (in Japanese). Konno, Yugo, “Russia’s Membership in the WTO,” in Shinichro Tabata, ed., Oil and Gas and the Russian
Economy, Sapporo, Japan: Hokkaido University Press, 2008 (in Japanese). Konno, Yugo, “Russian Economy under Financial Crisis,” Mizuho Soken Ronshu, 2, 2009 (in Japanese). Kuboniwa, Masaaki, “Transformation of Industrial Structure”, in S. Tabata, and M. Kuboniwa, eds., Russian
Economy at the Crossroad: Transition to Market and SNA. Tokyo, Japan: Aoki Shoten, 1999 (in Japa-nese).
Kuboniwa, Masaaki, “Russian Economic Growth at a Turning Point: Supply Side and Income Side,” Keizai Kenkyu, 58-3, 2007 (in Japanese).
Maswana, Jean-Claude, “China’s Financial Development and Economic Growth: Exploring the Contradic-tions,” International Research Journal of Finance and Economics, 19, 2008 [http://www.eurojourlnals. com/finance.htm].
Mohan, Rakesh, “Economic Growth, Financial Deepening and Financial Inclusion,” BIS Review, 113, 2006. Moore, Tomoe, India’s Emerging Financial Market: A Flow of Funds Model, London, UK and New York,
NY: Routledge, 2007. Nestmann, Thorsten, and Daria Orlova, “Russia’s Outward Investment,” Deutsche Bank Research, April
29, 2008. NSR, Natsional’nye scheta Rossii v 2000-2007 godakh, ofitsial’noe izdanie. Rosstat (Federal’naia sluzhba
gosudarstvennoi statistiki), 2008. OECD, National Accounts of OECD Countries, volume IIa, 1994 - 2005, Detailed Tables. Paris, France:
OECD, 2007a. OECD, National Accounts of OECD Countries, volume IIb, 1994 - 2005, Detailed Tables. Paris, France:
OECD, 2007b. Oohashi, Hideo, Chinese Economy Today: Internationalization of Economy. Nagoya, Japan: Nagoya Univer-
sity Press, 2003 (in Japanese). Prasad, Eswar, Thomas Rumbaugh, and Qing Wang, “Putting the Cart Before the Horse? Capital Account
Liberalization and Exchange Rate Flexibility in China,” in Jahangir Aziz, Steven Dunaway, and Eswar Prasad (2006), 2006.
Qi, Zhongling, “Development of Currency and Exchange Rate System in China,” in Mitsuhiro Fukao, ed., Macro Economic Analysis of Chinese Economy. Tokyo, Japan: Nihon Keizai Shinbunsha Press, 2006 (in Japanese).
Razgallah, Brahim, “The Balance of Payments Stages ‘Hypothesis’: A Reappraisal,” Website of l’université d’Orléans, 2004 [http://www.univ-orleans.fr/deg/GDRecomofi/Activ/ razgallah_nice. pdf].
RBIAR, Annual Report. Reserve Bank of India, [http://www.rbi.org.in/scripts/AnnualReport Publica-tions.aspx].
RBIMB, Monthly Bulletin. Reserve Bank of India, May 2009. SEP, Sotsial’no-ekonomicheskoe polozhenie Rossii. Various issues, Moscow, Russia: Rosstat. STZV, Sistem tablits “zatraty-vypusk” Rossii za 2003. Moscow, Russia: Rosstat, 2006. Tabata, Shinichiro, “The Influence of High Oil Prices on the Russian Economy: A Comparison with Saudi
Arabia,” Eurasian Geography and Economics, 50, 1, 2009. Smyslov, D. V., “Inostrannyi kapital na fondovom rynke Rossii,” Den’gi i kredit, 1, 2008. Uchimura, Hiroshi, Kazuko Tanaka, and Toshio Okamoto, How to Read and Observe Balance of Pay-
ments? Tokyo, Japan: Chuo Keizai Publisher, 1998 (in Japanese). Uegaki, Akira, “Russia as a Newcomer to the International Financial Market, 1992 – 2002,” Acta Slavica
Iaponica, XXI, 2004. Uegaki, Akira, “Capital Flight from Russia,” in Shinichiro Tabata, ed., Dependent on Oil and Gas: Russia’s
Akira Uegaki
- 82 -
Integration into the World Economy. Sapporo, Japan: Slavic Research Center, Hokkaido University, 2006.
Uliukaev, A., and M. Kulikov, “Problemy denezhno-kreditnoi politiki v usloviiakh pritoka kapitala v Ros-sii,” Voprosy ekonomiki, 7, 2007.
WEO, World Economic Outlook 2008. Washington DC: IMF, October, 2008.
Websites Bank of Thailand = [http://www2.bot.or.th/statistics/]. Bureau of Economic Analysis, US Department of Commerce = [http://www.bea.gov/ international/]. CBR [Central Bank of Russia; Bank Rossii], The balance of payments statistics = [http://www.cbr.ru/statistics
/?Prtid=svs]. China Investment Corporation = [http://www.china-inv.cn/cicen/index.html]. Deutsche Bundesbank = [http://www.bundesbank.de/index.en.php]. Economy Watch = [http://www.economywatch.com/]. National Bureau of Statistics of China = [http://www.stats.gov.cn/eNgliSH/ statisticaldata/]. Office for National Statistics of the United Kingdom = [http://www.statistics. gov.uk/statbase/]. RBI [Reserve Bank of India] = [http://www.rbi.org.in/home.aspx]. Rosstat [Federal Statistics State Agency; Federal’naia sluzhba gosudarstvennoi statistiki] = [http://www.gks.
ru/].