Embed Size (px)
Citation preview

x
Balance Sheet of SBI
(Rs. In Crores)
Year 2011-12 2010-11 2009-10 2008-09 2007-08 2006-07 2005-06
SOURCES OF FUNDS :
Capital 671.04 635 634.88 634.88 631.47 526.3 526.3
Reserves Total 83,280.16 64,351.04 65,314.32 57,312.82 48,401.19 30,772.26 27,117.79
Equity Share Warrants 0 0 0 0 0 0 0
Equity Application Money 0 0 0 0 0 0 0
Deposits 1,043,647.36 933,932.81 804,116.23 742,073.1
3 537,403.9
4 435,521.0
9 380,046.0
6
Borrowings 127,005.57 119,568.96 103,011.60 84,057.93 51,727.41 39,703.33 30,641.24 Other Liabilities & Provisions 82,805.30 106,206.00 80,879.58 80,964.20 83,961.07 60,283.15 55,829.23
Others 0 0 0 0 0 0 0
TOTAL LIABILITIES 1,337,409.43 1,224,693.81 1,053,956.61 965,042.9
6 722,125.0
8 566,806.1
3 494,160.6
2
APPLICATION OF FUNDS :
Cash & Balances with RBI 54,075.94 94,395.50 61,290.86 55,546.17 51,534.61 29,076.43 21,652.70 Balances with Banks & money at Call 43,087.22 28,478.64 24,897.85 48,857.63 15,931.72 22,892.26 22,907.30
Investments 312,197.61 295,600.57 295,785.20 275,953.9
6 189,501.2
7 149,148.8
8 162,534.2
4
Advances 867,578.89 756,719.45 631,914.15 542,503.2
0 416,768.2
0 337,336.4
9 261,800.9
4
Fixed Assets 5,466.55 4,764.19 4,412.91 3,837.85 3,373.48 2,818.87 2,752.93
Other Assets 55,003.22 44,735.46 35,655.64 38,344.15 45,015.80 25,533.20 22,512.51 Miscellaneous Expenditure not written off 0 0 0 0 0 0 0
Others 0 0 0 0 0 0 0
TOTAL ASSETS 1,337,409.43 1,224,693.81 1,053,956.61 965,042.9
6 722,125.0
8 566,806.1
3 494,160.6
2
Contingent Liability 832,605.33 730,484.61 548,446.88 723,699.7
5 810,796.4
8 526,954.6
6 228,881.3
8
Bills for collection 66,959.85 59,904.98 47,922.33 43,870.57 18,946.80 23,367.51 20,592.95
Profit and Loss Account of SBI
(Rs. In Crores)
Year 2011-12 2010-11 2009-10 2008-09 2007-08 2006-07 2005-06
INCOME :
Interest Earned 106,521.45 81,394.36 70,993.92 63,788.43 48,950.3
1 37,242.3
3 35,979.57
Other Income 14,351.45 15,824.60 14,968.15 12,694.31 9,398.43 7,405.98 7,469.75
Total 120,872.90 97,218.96 85,962.07 76,482.74 58,348.7
4 44,648.3
1 43,449.32
II. Expenditure
Interest expended 63,230.37 48,867.96 47,322.48 42,915.29 31,929.0
8 22,184.1
3 20,390.45 Payments to/Provisions for Employees 16,974.04 15,211.62 12,754.65 9,747.31 7,785.87 7,932.59 8,123.05
Operating Expenses & 4,564.82 4,089.86 3,598.09 2,927.84 2,382.81 1,942.13 1,808.99

xi
Administrative Expenses
Depreciation 1,007.17 990.49 932.66 763.14 679.98 602.39 763.68 Other Expenses, Provisions & Contingencies 16,613.19 13,104.80 7,428.11 5,948.51 5,132.11 4,361.99 5,457.00
Provision for Tax 6,341.37 5,712.89 6,167.78 5,972.52 3,824.20 3,015.10 1,683.59
Fringe Benefit tax -21.28 0 0 142 105 88.5 458
Deferred Tax 455.93 976.82 -1,407.75 -1,055.10 -219.43 -19.83 357.89
Total 109,165.61 88,954.44 76,796.02 67,361.51 51,619.6
2 40,107.0
0 39,042.65
III. Profit & Loss
Reported Net Profit 11,707.29 8,264.52 9,166.05 9,121.23 6,729.12 4,541.31 4,406.67
Balance Sheet of HDFC Ltd.
(Rs. In Crores)
Year 2011-12 2010-11 2009-10 2008-09 2007-08 2006-07 2005-06
SOURCES OF FUNDS :
Share Capital 295.39 293.37 287.11 284.45 284.03 253 249.56
Reserves Total 18,722.19 17,023.14 14,910.55 12,852.94 11,663.31 5,298.39 4,218.77
Equity Share Warrants 0 0 0 0 0 0 0
Equity Application Money 0 0 0 0 0 0 0
Total Shareholders Funds 19,017.58 17,316.51 15,197.66 13,137.39 11,947.34 5,551.39 4,468.33
Secured Loans 91,849.96 81,641.52 63,605.65 55,180.08 51,736.69 39,668.71 31,344.01
Unsecured Loans 47,277.54 33,470.78 32,959.65 28,676.00 17,414.53 17,524.32 15,377.34
Total Loan Funds 139,127.50 115,112.30 96,565.30 83,856.08 69,151.22 57,193.03 46,721.35
Other Liabilities 2,540.81 1,726.12 0 0 0 0 0
Total Liabilities 160,685.89 134,154.93 111,762.96 96,993.47 81,098.56 62,744.42 51,189.68
APPLICATION OF FUNDS :
Loan / Non-Current Assets 127,426.14 101,774.33 97,966.99 85,198.11 73,327.78 56,512.36 44,990.12
Fixed Assets
Gross Block 555.58 547.54 524.45 493.85 488.57 493.11 515.37
Less: Accumulated Depreciation 321.63 313.59 302.34 290.44 277.91 277.87 258.42
Less:Impairment of Assets 0 0 0 0 0 0 0
Net Block 233.95 233.95 222.11 203.41 210.66 215.24 256.95
Lease Adjustment 0 0 0 0 -2.17 -2.17 -9.64
Capital Work in Progress 0 0 0 0 0 0 0
Investments 12,207.00 11,832.42 10,727.45 10,468.75 6,915.01 3,666.23 3,876.34 Current Assets,Loans & Advances
Inventories 0 0 0 0 0 0 0
Sundry Debtors 60.21 1.27 0.73 27.77 2.01 5.02 2.19
Cash and Bank Balance 5,472.85 6,130.03 5,224.15 1,718.54 777.73 1,373.35 1,201.62
Loans and Advances 20,433.56 18,472.60 2,214.27 3,824.52 3,042.87 3,678.19 3,003.22
Total Current Assets 25,966.62 24,603.90 7,439.15 5,570.83 3,822.61 5,056.56 4,207.03

xii
Profit and Loss Account of HDFC Ltd.
(Rs. In Crores)
Year 2011-12 2010-11 2009-10 2008-09 2007-08
2006-07
2005-06
INCOME :
Operating Income 17,332.94 12,852.93 11,338.28 10,994.79 8,176.35 5,831.68 4,210.39
Other Income 21.34 25.14 22.55 22.87 697.68 70.96 76.5
Total Income 17,354.28 12,878.07 11,360.83 11,017.66 8,874.03 5,902.64 4,286.89
EXPENDITURE :
Operating & Administration Expenses 159.94 144.2 147.91 146.56 134.16 111.54 105.56
Miscellaneous Expenses 154.38 119.27 83.87 74.29 56.34 48.26 33.23
Interest 11,156.78 7,559.94 7,063.08 7,432.45 5,184.59 3,673.23 2,497.52 Less: Pre-operative Expenses Capitalised 0 0 0 0 0 0 0
Employee Expense 197.02 168.5 131.78 127.86 108.84 84.37 74.59
Total Expenditure 11,668.12 7,991.91 7,426.64 7,781.16 5,483.93 3,917.40 2,710.90
Gross Profit 5,686.16 4,886.16 3,934.19 3,236.50 3,390.10 1,985.24 1,575.99
Depreciation 20.54 19.2 18.2 17.46 16.6 17.46 18.69
Profit Before Tax 5,665.62 4,866.96 3,915.99 3,219.04 3,373.50 1,967.78 1,557.30
Tax 1,555.00 1,351.00 1,091.00 942 955 415 306
Fringe Benefit tax 0 0 0 2.5 2.25 2.4 2
Deferred Tax -12 -19 -1.5 -8 -20 -20 -8
Reported Net Profit 4,122.62 3,534.96 2,826.49 2,282.54 2,436.25 1,570.38 1,257.30
Less: Current Liab. & Provisions
Current Liabilities 4,263.52 3,003.09 2,656.16 2,883.37 1,906.95 1,484.97 1,101.36
Provisions 2,570.53 2,084.34 2,222.31 1,780.08 1,415.02 1,341.93 1,107.14 Total Current Liabilites & Provisions 6,834.05 5,087.43 4,878.47 4,663.45 3,321.97 2,826.90 2,208.50
Net Current Assets 19,132.57 19,516.47 2,560.68 907.38 500.64 2,229.66 1,998.53 Miscellaneous Expenses not written off 0 0 0 0 0 0 0
Deferred Tax Assets 677.64 497.7 335.71 267.72 200.28 177.83 137.47
Deferred Tax Liability 49.44 49.57 49.98 51.9 53.64 54.73 60.09
Net Deferred Tax 628.2 448.13 285.73 215.82 146.64 123.1 77.38
Other Assets 1,058.03 349.63 0 0 0 0 0
Total Assets 160,685.89 134,154.93 111,762.96 96,993.47 81,098.56 62,744.42 51,189.68
Contingent Liability 3,330.40 2,024.95 1,409.68 1,066.56 615.8 425.04 506.71
xiii
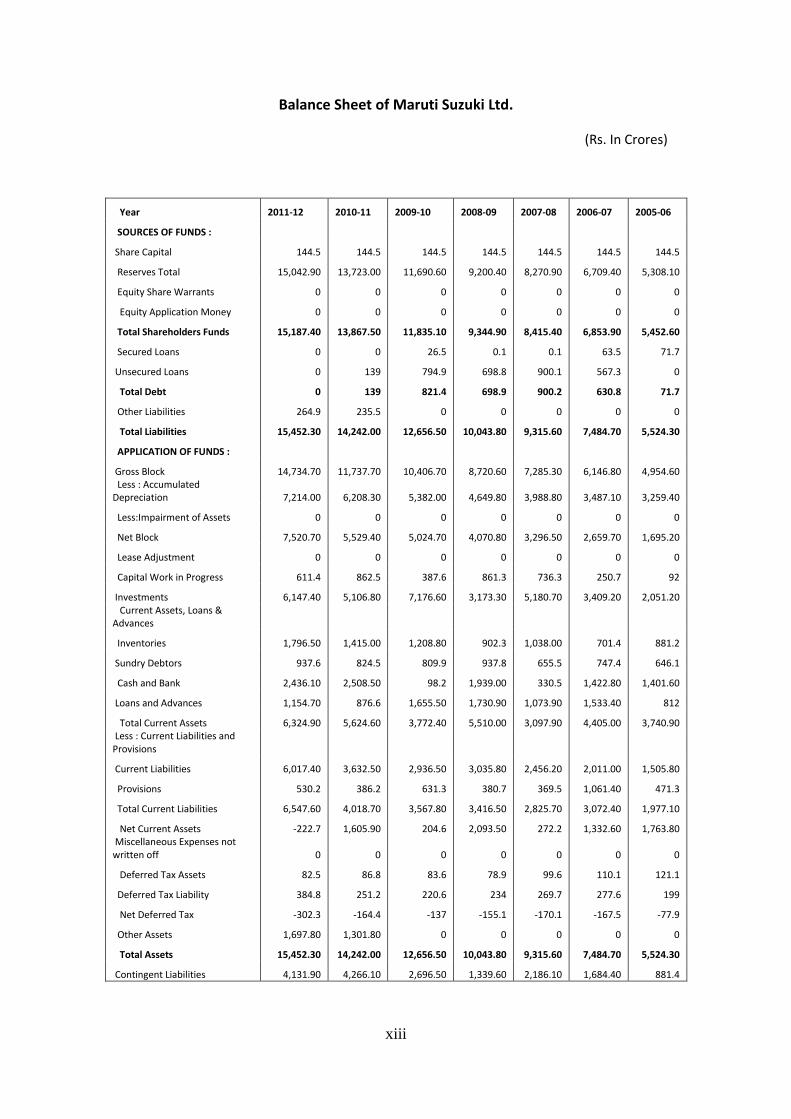
Balance Sheet of Maruti Suzuki Ltd.
(Rs. In Crores)
Year 2011-12 2010-11 2009-10 2008-09 2007-08 2006-07 2005-06
SOURCES OF FUNDS :
Share Capital 144.5 144.5 144.5 144.5 144.5 144.5 144.5
Reserves Total 15,042.90 13,723.00 11,690.60 9,200.40 8,270.90 6,709.40 5,308.10
Equity Share Warrants 0 0 0 0 0 0 0
Equity Application Money 0 0 0 0 0 0 0
Total Shareholders Funds 15,187.40 13,867.50 11,835.10 9,344.90 8,415.40 6,853.90 5,452.60
Secured Loans 0 0 26.5 0.1 0.1 63.5 71.7
Unsecured Loans 0 139 794.9 698.8 900.1 567.3 0
Total Debt 0 139 821.4 698.9 900.2 630.8 71.7
Other Liabilities 264.9 235.5 0 0 0 0 0
Total Liabilities 15,452.30 14,242.00 12,656.50 10,043.80 9,315.60 7,484.70 5,524.30
APPLICATION OF FUNDS :
Gross Block 14,734.70 11,737.70 10,406.70 8,720.60 7,285.30 6,146.80 4,954.60 Less : Accumulated Depreciation 7,214.00 6,208.30 5,382.00 4,649.80 3,988.80 3,487.10 3,259.40
Less:Impairment of Assets 0 0 0 0 0 0 0
Net Block 7,520.70 5,529.40 5,024.70 4,070.80 3,296.50 2,659.70 1,695.20
Lease Adjustment 0 0 0 0 0 0 0
Capital Work in Progress 611.4 862.5 387.6 861.3 736.3 250.7 92
Investments 6,147.40 5,106.80 7,176.60 3,173.30 5,180.70 3,409.20 2,051.20 Current Assets, Loans & Advances
Inventories 1,796.50 1,415.00 1,208.80 902.3 1,038.00 701.4 881.2
Sundry Debtors 937.6 824.5 809.9 937.8 655.5 747.4 646.1
Cash and Bank 2,436.10 2,508.50 98.2 1,939.00 330.5 1,422.80 1,401.60
Loans and Advances 1,154.70 876.6 1,655.50 1,730.90 1,073.90 1,533.40 812
Total Current Assets 6,324.90 5,624.60 3,772.40 5,510.00 3,097.90 4,405.00 3,740.90 Less : Current Liabilities and Provisions
Current Liabilities 6,017.40 3,632.50 2,936.50 3,035.80 2,456.20 2,011.00 1,505.80
Provisions 530.2 386.2 631.3 380.7 369.5 1,061.40 471.3
Total Current Liabilities 6,547.60 4,018.70 3,567.80 3,416.50 2,825.70 3,072.40 1,977.10
Net Current Assets -222.7 1,605.90 204.6 2,093.50 272.2 1,332.60 1,763.80 Miscellaneous Expenses not written off 0 0 0 0 0 0 0
Deferred Tax Assets 82.5 86.8 83.6 78.9 99.6 110.1 121.1
Deferred Tax Liability 384.8 251.2 220.6 234 269.7 277.6 199
Net Deferred Tax -302.3 -164.4 -137 -155.1 -170.1 -167.5 -77.9
Other Assets 1,697.80 1,301.80 0 0 0 0 0
Total Assets 15,452.30 14,242.00 12,656.50 10,043.80 9,315.60 7,484.70 5,524.30
Contingent Liabilities 4,131.90 4,266.10 2,696.50 1,339.60 2,186.10 1,684.40 881.4
xiv
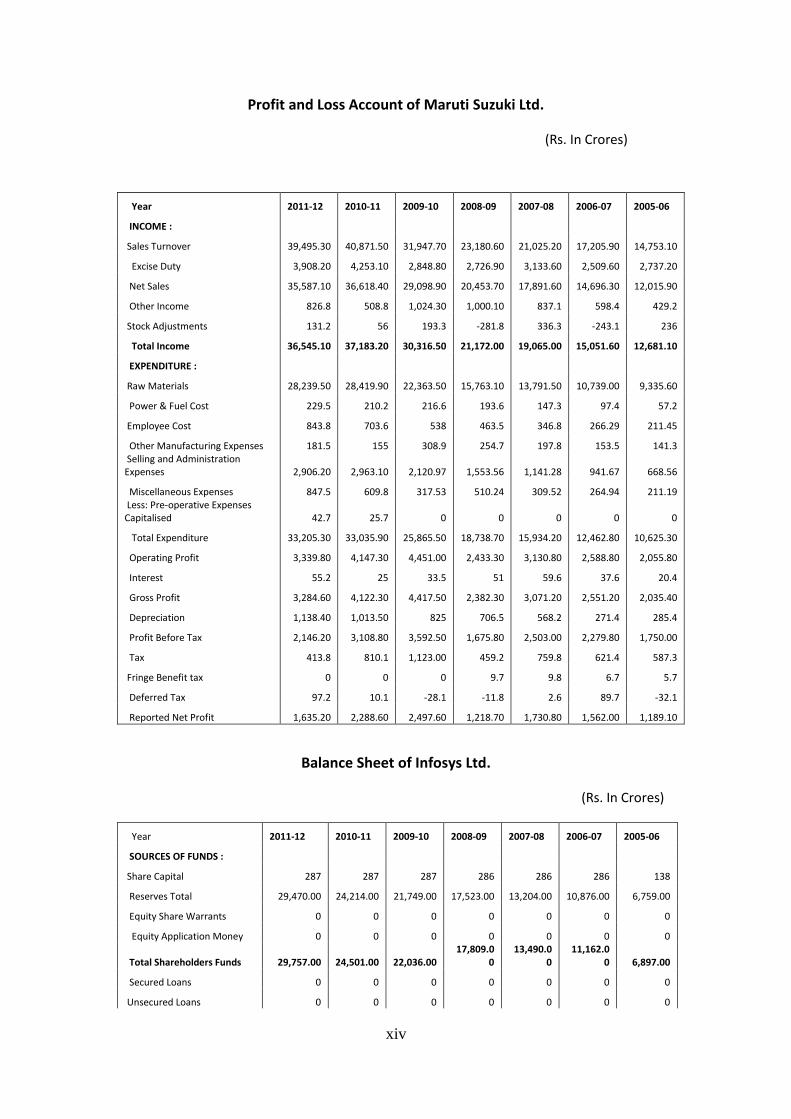
Profit and Loss Account of Maruti Suzuki Ltd.
(Rs. In Crores)
Year 2011-12 2010-11 2009-10 2008-09 2007-08 2006-07 2005-06
INCOME :
Sales Turnover 39,495.30 40,871.50 31,947.70 23,180.60 21,025.20 17,205.90 14,753.10
Excise Duty 3,908.20 4,253.10 2,848.80 2,726.90 3,133.60 2,509.60 2,737.20
Net Sales 35,587.10 36,618.40 29,098.90 20,453.70 17,891.60 14,696.30 12,015.90
Other Income 826.8 508.8 1,024.30 1,000.10 837.1 598.4 429.2
Stock Adjustments 131.2 56 193.3 -281.8 336.3 -243.1 236
Total Income 36,545.10 37,183.20 30,316.50 21,172.00 19,065.00 15,051.60 12,681.10
EXPENDITURE :
Raw Materials 28,239.50 28,419.90 22,363.50 15,763.10 13,791.50 10,739.00 9,335.60
Power & Fuel Cost 229.5 210.2 216.6 193.6 147.3 97.4 57.2
Employee Cost 843.8 703.6 538 463.5 346.8 266.29 211.45
Other Manufacturing Expenses 181.5 155 308.9 254.7 197.8 153.5 141.3 Selling and Administration Expenses 2,906.20 2,963.10 2,120.97 1,553.56 1,141.28 941.67 668.56
Miscellaneous Expenses 847.5 609.8 317.53 510.24 309.52 264.94 211.19 Less: Pre-operative Expenses Capitalised 42.7 25.7 0 0 0 0 0
Total Expenditure 33,205.30 33,035.90 25,865.50 18,738.70 15,934.20 12,462.80 10,625.30
Operating Profit 3,339.80 4,147.30 4,451.00 2,433.30 3,130.80 2,588.80 2,055.80
Interest 55.2 25 33.5 51 59.6 37.6 20.4
Gross Profit 3,284.60 4,122.30 4,417.50 2,382.30 3,071.20 2,551.20 2,035.40
Depreciation 1,138.40 1,013.50 825 706.5 568.2 271.4 285.4
Profit Before Tax 2,146.20 3,108.80 3,592.50 1,675.80 2,503.00 2,279.80 1,750.00
Tax 413.8 810.1 1,123.00 459.2 759.8 621.4 587.3
Fringe Benefit tax 0 0 0 9.7 9.8 6.7 5.7
Deferred Tax 97.2 10.1 -28.1 -11.8 2.6 89.7 -32.1
Reported Net Profit 1,635.20 2,288.60 2,497.60 1,218.70 1,730.80 1,562.00 1,189.10
Balance Sheet of Infosys Ltd.
(Rs. In Crores)
Year 2011-12 2010-11 2009-10 2008-09 2007-08 2006-07 2005-06
SOURCES OF FUNDS :
Share Capital 287 287 287 286 286 286 138
Reserves Total 29,470.00 24,214.00 21,749.00 17,523.00 13,204.00 10,876.00 6,759.00
Equity Share Warrants 0 0 0 0 0 0 0
Equity Application Money 0 0 0 0 0 0 0
Total Shareholders Funds 29,757.00 24,501.00 22,036.00 17,809.0
0 13,490.0
0 11,162.0
0 6,897.00
Secured Loans 0 0 0 0 0 0 0
Unsecured Loans 0 0 0 0 0 0 0

xv
Total Debt 0 0 0 0 0 0 0
Other Liabilities 21 25 0 0 0 0 0
Total Liabilities 29,778.00 24,526.00 22,036.00 17,809.0
0 13,490.0
0 11,162.0
0 6,897.00
APPLICATION OF FUNDS :
Gross Block 7,173.00 6,934.00 6,357.00 5,986.00 4,508.00 3,889.00 2,837.00 Less:Accumulated Depreciation 3,112.00 2,878.00 2,578.00 2,187.00 1,837.00 1,739.00 1,275.00
Less:Impairment of Assets 0 0 0 0 0 0 0
Net Block 4,061.00 4,056.00 3,779.00 3,799.00 2,671.00 2,150.00 1,562.00
Lease Adjustment 0 0 0 0 0 0 0
Capital Work in Progress 588 249 409 615 1,260.00 957 571
Investments 1,409.00 1,325.00 4,626.00 1,005.00 964 839 876 Current Assets, Loans & Advances
Inventories 0 0 0 0 0 0 0
Sundry Debtors 5,404.00 4,212.00 3,244.00 3,390.00 3,093.00 2,292.00 1,518.00
Cash and Bank 19,557.00 15,165.00 9,797.00 9,039.00 6,429.00 5,470.00 3,279.00
Loans and Advances 3,163.00 2,373.00 3,898.00 3,164.00 2,705.00 1,199.00 1,252.00
Total Current Assets 28,124.00 21,750.00 16,939.00 15,593.00 12,227.00 8,961.00 6,049.00 Less : Current Liabilities and Provisions
Current Liabilities 1,609.00 1,318.00 1,388.00 1,126.00 1,095.00 881 642
Provisions 4,428.00 3,010.00 2,410.00 2,179.00 2,636.00 943 1,575.00
Total Current Liabilities 6,037.00 4,328.00 3,798.00 3,305.00 3,731.00 1,824.00 2,217.00
Net Current Assets 22,087.00 17,422.00 13,141.00 12,288.00 8,496.00 7,137.00 3,832.00 Miscellaneous Expenses not written off 0 0 0 0 0 0 0
Deferred Tax Assets 459 406 313 139 99 79 56
Deferred Tax Liabilities 270 176 232 37 0 0 0
Net Deferred Tax 189 230 81 102 99 79 56
Other Assets 1,444.00 1,244.00 0 0 0 0 0
Total Assets 29,778.00 24,526.00 22,036.00 17,809.0
0 13,490.0
0 11,162.0
0 6,897.00
Contingent Liabilities 4,194.00 2,749.00 2,110.00 2,370.00 2,661.00 1,945.00 1,434.00
Profit and Loss Account of Infosys Ltd.
(Rs. In Crores)
Year 2011-12 2010-11 2009-10 2008-09 2007-08 2006-07 2005-06
INCOME :
Operating Income 31,254.00 25,385.00 21,140.00 20,264.00 15,648.00 13,149.00 9,028.00
Excise Duty 0 0 0 0 0 0 0
Net Operating Income 31,254.00 25,385.00 21,140.00 20,264.00 15,648.00 13,149.00 9,028.00
Other Income 2,313.00 1,147.00 967 876 683 381 227
Stock Adjustments 0 0 0 0 0 0 0
Total Income 33,567.00 26,532.00 22,107.00 21,140.00 16,331.00 13,530.00 9,255.00

xvi
EXPENDITURE : Cost of Traded Software Packages 0 0 0 0 0 0 0
Operating Expenses 3,256.00 2,636.00 1,913.00 1,576.00 1,295.37 1,163.40 717.46
Employee Cost 15,473.00 12,459.00 10,340.00 9,960.00 7,791.00 6,293.00 4,257.00
Power/Electricity Charges 154 142 122 125 106 88 62
Selling and Administration Exp. 2,162.00 1,724.00 1,362.72 1,556.00 1,363.09 1,298.60 967.03
Miscellaneous Expenses 146 9 40.28 513 111.54 65 105.51 Less : Pre-operative Expenses Capitalised 0 0 0 0 0 0 0
Total Expenditure 21,191.00 16,970.00 13,778.00 13,730.00 10,667.00 8,908.00 6,109.00
Operating Profit 12,376.00 9,562.00 8,329.00 7,410.00 5,664.00 4,622.00 3,146.00
Interest 2 1 2 2 1 1 1
Gross Profit 12,374.00 9,561.00 8,327.00 7,408.00 5,663.00 4,621.00 3,145.00
Depreciation 794 740 807 694 546 469 409
Profit Before Tax 11,580.00 8,821.00 7,520.00 6,714.00 5,117.00 4,152.00 2,736.00
Tax 3,053.00 2,521.00 1,696.00 898 650 375 325
Fringe Benefit tax 0 0 0 0 17 17 12
Deferred Tax 57 -143 21 -3 -20 -23 -22
Reported Net Profit 8,470.00 6,443.00 5,803.00 5,819.00 4,470.00 3,783.00 2,421.00
Balance Sheet of Tata Steel Ltd.
(Rs. In Crores)
Year 2011-12 2010-11 2009-10 2008-09 2007-08 2006-07 2005-06
SOURCES OF FUNDS :
Share Capital 971.41 959.41 887.41 6,203.45 6,203.30 580.67 553.67
Reserves Total 51,649.95 45,807.02 36,074.39 23,972.81 21,097.43 13,368.42 9,201.63
Equity Share Warrants 0 178.2 0 0 0 147.06 0
Equity Application Money 0.17 0.61 0.14 0.24 5.65 0.01 0
Total Shareholders Funds 52,621.53 46,945.24 36,961.94 30,176.50 27,306.38 14,096.16 9,755.30
Secured Loans 1,915.47 1,860.05 2,259.32 3,913.05 3,520.58 3,758.92 2,191.74
Unsecured Loans 19,437.73 22,639.00 22,979.88 23,033.13 14,501.11 5,886.41 324.41
Total Debt 21,353.20 24,499.05 25,239.20 26,946.18 18,021.69 9,645.33 2,516.15
Other Liabilities 4,342.35 4,075.35 1,164.11 0 0 0 0
Total Liabilities 78,317.08 75,519.64 63,365.25 57,122.68 45,328.07 23,741.49 12,271.45
APPLICATION OF FUNDS :
Gross Block 23,485.63 22,846.26 22,306.07 20,057.01 16,479.59 16,029.49 15,407.17
Less : Accumulated Depreciation 11,986.17 10,914.86 10,037.56 8,962.00 8,123.01 7,385.96 6,605.66
Less:Impairment of Assets 133.2 126.3 106.07 100.47 100.47 100.41 94.19
Net Block 11,366.26 11,805.10 12,162.44 10,994.54 8,256.11 8,543.12 8,707.32
Lease Adjustment 0 0 0 0 0 0 0
Capital Work in Progress 16,058.49 5,612.28 3,843.59 3,487.68 4,367.45 2,497.44 1,157.73
Investments 50,282.52 46,564.94 44,979.67 42,371.78 4,103.19 6,106.18 4,069.96 Current Assets, Loans & Advances
Inventories 4,858.99 3,953.76 3,077.75 3,480.47 2,604.98 2,332.98 2,174.75
xvii
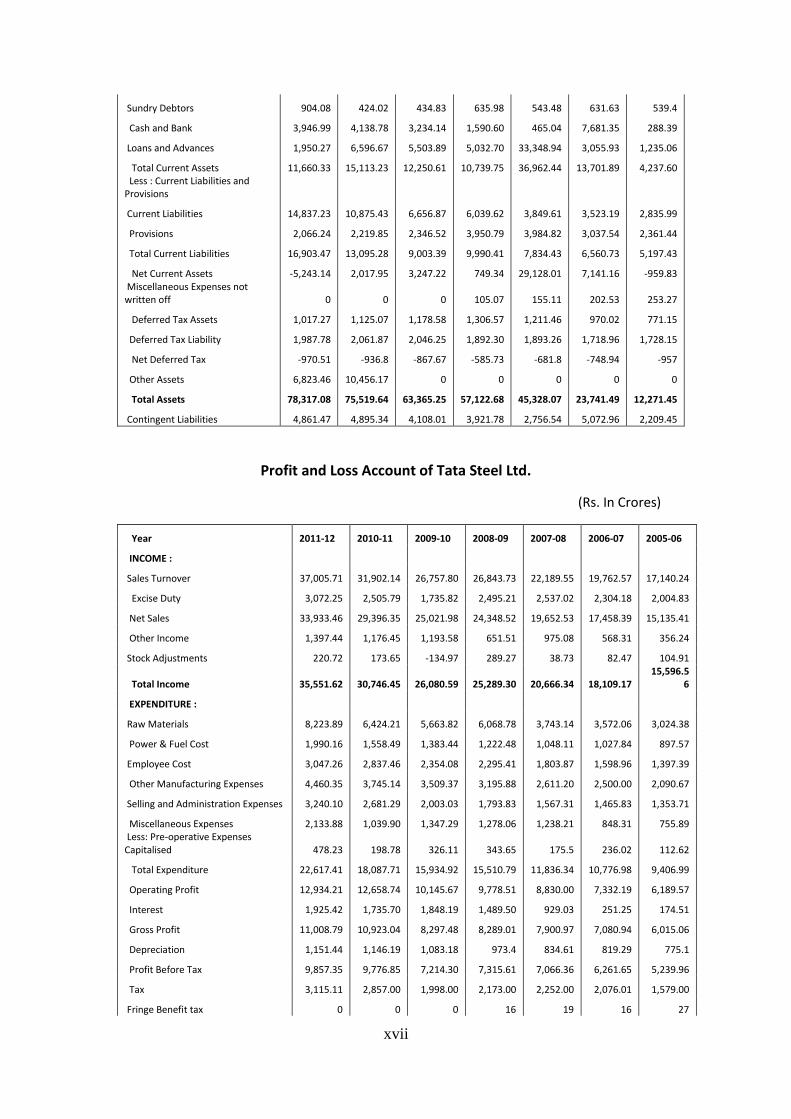
Sundry Debtors 904.08 424.02 434.83 635.98 543.48 631.63 539.4
Cash and Bank 3,946.99 4,138.78 3,234.14 1,590.60 465.04 7,681.35 288.39
Loans and Advances 1,950.27 6,596.67 5,503.89 5,032.70 33,348.94 3,055.93 1,235.06
Total Current Assets 11,660.33 15,113.23 12,250.61 10,739.75 36,962.44 13,701.89 4,237.60 Less : Current Liabilities and Provisions
Current Liabilities 14,837.23 10,875.43 6,656.87 6,039.62 3,849.61 3,523.19 2,835.99
Provisions 2,066.24 2,219.85 2,346.52 3,950.79 3,984.82 3,037.54 2,361.44
Total Current Liabilities 16,903.47 13,095.28 9,003.39 9,990.41 7,834.43 6,560.73 5,197.43
Net Current Assets -5,243.14 2,017.95 3,247.22 749.34 29,128.01 7,141.16 -959.83 Miscellaneous Expenses not written off 0 0 0 105.07 155.11 202.53 253.27
Deferred Tax Assets 1,017.27 1,125.07 1,178.58 1,306.57 1,211.46 970.02 771.15
Deferred Tax Liability 1,987.78 2,061.87 2,046.25 1,892.30 1,893.26 1,718.96 1,728.15
Net Deferred Tax -970.51 -936.8 -867.67 -585.73 -681.8 -748.94 -957
Other Assets 6,823.46 10,456.17 0 0 0 0 0
Total Assets 78,317.08 75,519.64 63,365.25 57,122.68 45,328.07 23,741.49 12,271.45
Contingent Liabilities 4,861.47 4,895.34 4,108.01 3,921.78 2,756.54 5,072.96 2,209.45
Profit and Loss Account of Tata Steel Ltd.
(Rs. In Crores)
Year 2011-12 2010-11 2009-10 2008-09 2007-08 2006-07 2005-06
INCOME :
Sales Turnover 37,005.71 31,902.14 26,757.80 26,843.73 22,189.55 19,762.57 17,140.24
Excise Duty 3,072.25 2,505.79 1,735.82 2,495.21 2,537.02 2,304.18 2,004.83
Net Sales 33,933.46 29,396.35 25,021.98 24,348.52 19,652.53 17,458.39 15,135.41
Other Income 1,397.44 1,176.45 1,193.58 651.51 975.08 568.31 356.24
Stock Adjustments 220.72 173.65 -134.97 289.27 38.73 82.47 104.91
Total Income 35,551.62 30,746.45 26,080.59 25,289.30 20,666.34 18,109.17 15,596.5
6
EXPENDITURE :
Raw Materials 8,223.89 6,424.21 5,663.82 6,068.78 3,743.14 3,572.06 3,024.38
Power & Fuel Cost 1,990.16 1,558.49 1,383.44 1,222.48 1,048.11 1,027.84 897.57
Employee Cost 3,047.26 2,837.46 2,354.08 2,295.41 1,803.87 1,598.96 1,397.39
Other Manufacturing Expenses 4,460.35 3,745.14 3,509.37 3,195.88 2,611.20 2,500.00 2,090.67
Selling and Administration Expenses 3,240.10 2,681.29 2,003.03 1,793.83 1,567.31 1,465.83 1,353.71
Miscellaneous Expenses 2,133.88 1,039.90 1,347.29 1,278.06 1,238.21 848.31 755.89 Less: Pre-operative Expenses Capitalised 478.23 198.78 326.11 343.65 175.5 236.02 112.62
Total Expenditure 22,617.41 18,087.71 15,934.92 15,510.79 11,836.34 10,776.98 9,406.99
Operating Profit 12,934.21 12,658.74 10,145.67 9,778.51 8,830.00 7,332.19 6,189.57
Interest 1,925.42 1,735.70 1,848.19 1,489.50 929.03 251.25 174.51
Gross Profit 11,008.79 10,923.04 8,297.48 8,289.01 7,900.97 7,080.94 6,015.06
Depreciation 1,151.44 1,146.19 1,083.18 973.4 834.61 819.29 775.1
Profit Before Tax 9,857.35 9,776.85 7,214.30 7,315.61 7,066.36 6,261.65 5,239.96
Tax 3,115.11 2,857.00 1,998.00 2,173.00 2,252.00 2,076.01 1,579.00
Fringe Benefit tax 0 0 0 16 19 16 27
xviii
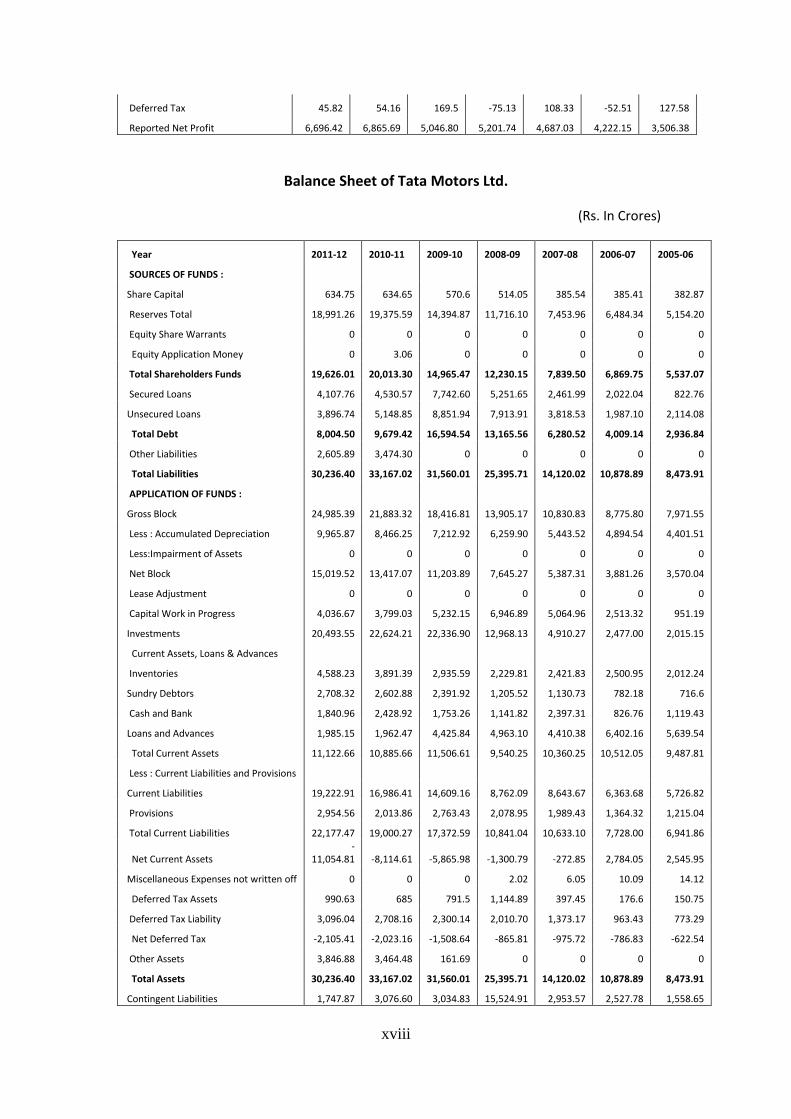
Deferred Tax 45.82 54.16 169.5 -75.13 108.33 -52.51 127.58
Reported Net Profit 6,696.42 6,865.69 5,046.80 5,201.74 4,687.03 4,222.15 3,506.38
Balance Sheet of Tata Motors Ltd.
(Rs. In Crores)
Year 2011-12 2010-11 2009-10 2008-09 2007-08 2006-07 2005-06
SOURCES OF FUNDS :
Share Capital 634.75 634.65 570.6 514.05 385.54 385.41 382.87
Reserves Total 18,991.26 19,375.59 14,394.87 11,716.10 7,453.96 6,484.34 5,154.20
Equity Share Warrants 0 0 0 0 0 0 0
Equity Application Money 0 3.06 0 0 0 0 0
Total Shareholders Funds 19,626.01 20,013.30 14,965.47 12,230.15 7,839.50 6,869.75 5,537.07
Secured Loans 4,107.76 4,530.57 7,742.60 5,251.65 2,461.99 2,022.04 822.76
Unsecured Loans 3,896.74 5,148.85 8,851.94 7,913.91 3,818.53 1,987.10 2,114.08
Total Debt 8,004.50 9,679.42 16,594.54 13,165.56 6,280.52 4,009.14 2,936.84
Other Liabilities 2,605.89 3,474.30 0 0 0 0 0
Total Liabilities 30,236.40 33,167.02 31,560.01 25,395.71 14,120.02 10,878.89 8,473.91
APPLICATION OF FUNDS :
Gross Block 24,985.39 21,883.32 18,416.81 13,905.17 10,830.83 8,775.80 7,971.55
Less : Accumulated Depreciation 9,965.87 8,466.25 7,212.92 6,259.90 5,443.52 4,894.54 4,401.51
Less:Impairment of Assets 0 0 0 0 0 0 0
Net Block 15,019.52 13,417.07 11,203.89 7,645.27 5,387.31 3,881.26 3,570.04
Lease Adjustment 0 0 0 0 0 0 0
Capital Work in Progress 4,036.67 3,799.03 5,232.15 6,946.89 5,064.96 2,513.32 951.19
Investments 20,493.55 22,624.21 22,336.90 12,968.13 4,910.27 2,477.00 2,015.15
Current Assets, Loans & Advances
Inventories 4,588.23 3,891.39 2,935.59 2,229.81 2,421.83 2,500.95 2,012.24
Sundry Debtors 2,708.32 2,602.88 2,391.92 1,205.52 1,130.73 782.18 716.6
Cash and Bank 1,840.96 2,428.92 1,753.26 1,141.82 2,397.31 826.76 1,119.43
Loans and Advances 1,985.15 1,962.47 4,425.84 4,963.10 4,410.38 6,402.16 5,639.54
Total Current Assets 11,122.66 10,885.66 11,506.61 9,540.25 10,360.25 10,512.05 9,487.81
Less : Current Liabilities and Provisions
Current Liabilities 19,222.91 16,986.41 14,609.16 8,762.09 8,643.67 6,363.68 5,726.82
Provisions 2,954.56 2,013.86 2,763.43 2,078.95 1,989.43 1,364.32 1,215.04
Total Current Liabilities 22,177.47 19,000.27 17,372.59 10,841.04 10,633.10 7,728.00 6,941.86
Net Current Assets -
11,054.81 -8,114.61 -5,865.98 -1,300.79 -272.85 2,784.05 2,545.95
Miscellaneous Expenses not written off 0 0 0 2.02 6.05 10.09 14.12
Deferred Tax Assets 990.63 685 791.5 1,144.89 397.45 176.6 150.75
Deferred Tax Liability 3,096.04 2,708.16 2,300.14 2,010.70 1,373.17 963.43 773.29
Net Deferred Tax -2,105.41 -2,023.16 -1,508.64 -865.81 -975.72 -786.83 -622.54
Other Assets 3,846.88 3,464.48 161.69 0 0 0 0
Total Assets 30,236.40 33,167.02 31,560.01 25,395.71 14,120.02 10,878.89 8,473.91
Contingent Liabilities 1,747.87 3,076.60 3,034.83 15,524.91 2,953.57 2,527.78 1,558.65

xix
Profit and Loss Account of Tata Motors Ltd.
(Rs. In Crores)
Year 2011-12 2010-11 2009-10 2008-09 2007-08 2006-07 2005-06
INCOME :
Sales Turnover 59,220.94 51,183.95 37,795.71 28,088.35 32,885.03 31,611.21 23,673.43
Excise Duty 4,914.38 4,095.51 2,771.05 2,938.48 4,347.04 4,425.44 3,380.13
Net Sales 54,306.56 47,088.44 35,024.66 25,149.87 28,537.99 27,185.77 20,293.30
Other Income 574.08 422.97 2,564.23 1,543.05 996.05 574.11 693.92
Stock Adjustments 623.84 354.22 606.63 -238.04 -40.48 349.68 256.91
Total Income 55,504.48 47,865.63 38,195.52 26,454.88 29,493.56 28,109.56 21,244.13
EXPENDITURE :
Raw Materials 40,328.77 34,421.60 24,905.83 18,368.00 20,190.19 19,374.93 14,263.86
Power & Fuel Cost 550.89 471.28 362.62 304.94 325.19 327.41 258.51
Employee Cost 2,691.45 2,294.02 1,807.76 1,514.93 1,534.41 1,361.20 1,141.48
Other Manufacturing Expenses 3,220.36 2,571.00 1,941.67 1,351.41 1,460.57 1,618.68 1,251.02 Selling and Administration Expenses 3,498.37 2,634.80 1,787.10 1,401.87 1,434.83 1,322.88 985.74
Miscellaneous Expenses 1,955.38 1,349.62 3,007.36 1,699.61 1,638.21 1,153.53 784.56 Less: Pre-operative Expenses Capitalised 907.13 817.68 726.46 885.08 744.23 577.05 308.85
Total Expenditure 51,338.09 42,924.64 33,085.88 23,755.68 25,839.17 24,581.58 18,376.32
Operating Profit 4,166.39 4,940.99 5,109.64 2,699.20 3,654.39 3,527.98 2,867.81
Interest 1,218.62 1,383.70 1,246.23 810.9 425.61 368.51 293.49
Gross Profit 2,947.77 3,557.29 3,863.41 1,888.30 3,228.78 3,159.47 2,574.32
Depreciation 1,606.74 1,360.77 1,033.87 874.54 652.31 586.29 520.94
Profit Before Tax 1,341.03 2,196.52 2,829.54 1,013.76 2,576.47 2,573.18 2,053.38
Tax 0.56 8.4 0 0 139.01 476 363.35
Fringe Benefit tax 0 0 0 15 7 6.5 19
Deferred Tax 98.24 376.3 589.46 -2.5 401.54 177.22 142.15
Reported Net Profit 1,242.23 1,811.82 2,240.08 1,001.26 2,028.92 1,913.46 1,528.88

xx
Balance Sheet of Bharti Airtel Ltd.
(Rs. In Crores)
Year 2011-12 2010-11 2009-10 2008-09 2007-08 2006-07 2005-06
SOURCES OF FUNDS :
Share Capital 1,898.80 1,898.80 1,898.80 1,898.24 1,897.91 1,895.93 1,893.88
Reserves Total 47,530.80 42,212.80 34,652.30 25,745.43 18,342.35 9,517.33 5,439.55
Equity Share Warrants 0 0 0 0 0 0 0
Equity Application Money 0 0 186.1 0.29 1.23 0 0
Total Shareholders Funds 49,429.60 44,111.60 36,737.20 27,643.96 20,241.49 11,413.26 7,333.43
Secured Loans 2.9 17.1 39.4 51.73 52.42 266.45 2,863.37
Unsecured Loans 9,402.90 9,116.00 4,999.50 7,661.92 6,517.92 5,044.36 1,932.92
Total Debt 9,405.80 9,133.10 5,038.90 7,713.65 6,570.34 5,310.81 4,796.29
Other Liabilities 2,658.90 2,613.40 0 0 0 0 0
Total Liabilities 61,494.30 55,858.10 41,776.10 35,357.61 26,811.83 16,724.07 12,129.72
APPLICATION OF FUNDS :
Gross Block 66,906.80 61,437.40 44,212.50 37,266.70 28,115.65 26,509.93 17,951.74
Less : Accumulated Depreciation 26,466.00 20,736.70 16,187.50 12,253.34 9,085.00 7,204.30 4,944.86
Less:Impairment of Assets 0 0 0 0 0 0 0
Net Block 40,440.80 40,700.70 28,025.00 25,013.36 19,030.65 19,305.63 13,006.88
Lease Adjustment 0 0 0 0 0 0 0
Capital Work in Progress 4,466.50 6,479.20 1,594.70 2,566.67 2,751.08 2,375.82 2,341.25
Investments 12,337.80 11,813.00 15,773.30 11,777.76 10,952.85 705.82 719.7
Current Assets, Loans & Advances
Inventories 32.1 34.4 27.2 62.15 56.86 51.55 18.59
Sundry Debtors 2,134.50 1,461.90 2,105.00 2,550.05 2,776.46 1,873.30 1,076.17
Cash and Bank 481.2 133.2 816.7 2,251.60 502.94 780.46 307.43
Loans and Advances 10,862.10 3,573.10 6,381.00 4,561.21 2,923.61 2,587.25 1,857.82
Total Current Assets 13,509.90 5,202.60 9,329.90 9,425.01 6,259.87 5,292.56 3,260.01
Less : Current Liabilities and Provisions
Current Liabilities 17,435.70 14,669.50 12,284.80 13,117.98 11,909.07 9,459.42 6,477.71
Provisions 557 527.4 658.7 634.4 209.88 1,262.33 539.3
Total Current Liabilities 17,992.70 15,196.90 12,943.50 13,752.38 12,118.95 10,721.75 7,017.01
Net Current Assets -4,482.80 -9,994.30 -3,613.60 -4,327.37 -5,859.08 -5,429.19 -3,757.00
Miscellaneous Expenses not written off 0 0 0 0.08 0.2 2.66 7.94
Deferred Tax Assets 1,078.00 780.9 796.3 917.31 436.3 143.74 80.73
Deferred Tax Liability 1,914.70 1,308.50 799.6 590.2 500.17 380.41 269.78
Net Deferred Tax -836.7 -527.6 -3.3 327.11 -63.87 -236.67 -189.05
Other Assets 9,568.70 7,387.10 0 0 0 0 0
Total Assets 61,494.30 55,858.10 41,776.10 35,357.61 26,811.83 16,724.07 12,129.72
Contingent Liabilities 54,144.10 50,037.00 5,396.40 3,241.16 2,148.87 1,615.17 1,501.51

xxi
Profit and Loss of Bharti Airtel Ltd.
(Rs. In Crores)
Balance Sheet of L &T Ltd.
(Rs. In Crores)
Year 2011-12 2010-11 2009-10 2008-09 2007-08 2006-07 2005-06
SOURCES OF FUNDS :
Share Capital 122.48 121.77 120.44 117.14 58.47 56.65 27.48
Reserves Total 25,100.54 21,356.18 17,882.22 12,342.55 9,496.61 5,711.78 4,612.69
Equity Share Warrants 0 0 0 0 0 0 0
Equity Application Money 0 368.31 308.98 0 0 0 0
Total Shareholders Funds 25,223.02 21,846.26 18,311.64 12,459.69 9,555.08 5,768.43 4,640.17
Secured Loans 900 1,063.04 955.73 1,102.38 308.53 245.4 465.79
Year 2011-12 2010-11 2009-10 2008-09 2007-08 2006-07 2005-06
INCOME :
Sales Turnover 41,603.80 38,017.70 35,609.50 34,014.29 25,703.51 17,851.60 11,231.47
Excise Duty 0 0 0 0 0 0 0
Net Sales 41,603.80 38,017.70 35,609.50 34,014.29 25,703.51 17,851.60 11,231.47
Other Income 624.7 321.2 377.3 525.14 359.91 148.49 94.3
Stock Adjustments 0 0 -35 5.29 9.05 30.07 -13.84
Total Income 42,228.50 38,338.90 35,951.80 34,544.72 26,072.47 18,030.16 11,311.93
EXPENDITURE :
Raw Materials 18.3 16.1 35 125.09 155.3 53.95 54.42
Power & Fuel Cost 2,972.70 2,523.30 2,265.00 2,173.30 1,045.16 658.78 26.98
Employee Cost 1,391.50 1,451.20 1,525.60 1,404.54 1,306.57 1,102.03 754.99
Other Manufacturing Expenses 12,547.00 10,868.60 9,888.50 13,049.37 8,184.32 5,813.82 4,404.78
Selling and Administration Expenses 10,408.60 9,451.10 7,620.60 3,766.89 3,718.17 2,250.33 1,330.07
Miscellaneous Expenses 622 367.1 741.6 616.74 1,028.47 887.6 671.92
Less: Pre-operative Expenses Capitalised 0 0 49.7 107.4 112.4 1.8 0.85
Total Expenditure 27,960.10 24,677.40 22,026.60 21,028.53 15,325.59 10,764.71 7,242.31
Operating Profit 14,268.40 13,661.50 13,925.20 13,516.19 10,746.88 7,265.45 4,069.62
Interest 1,396.20 324.1 -568 2,148.38 607.76 310.78 236.81
Gross Profit 12,872.20 13,337.40 14,493.20 11,367.81 10,139.12 6,954.67 3,832.81
Depreciation 5,916.00 4,611.60 3,793.90 3,206.28 3,166.58 2,353.30 1,547.02
Profit Before Tax 6,956.20 8,725.80 10,699.30 8,161.53 6,972.54 4,601.37 2,285.79
Tax 917.1 484.6 942.7 777.73 859.36 495.03 166.52
Fringe Benefit tax 0 0 0 35.87 37.23 25.5 19.05
Deferred Tax 309.1 524.3 330.4 -395.91 -168.24 47.61 88.14
Reported Net Profit 5,730.00 7,716.90 9,426.20 7,743.84 6,244.19 4,033.23 2,012.08
xxii
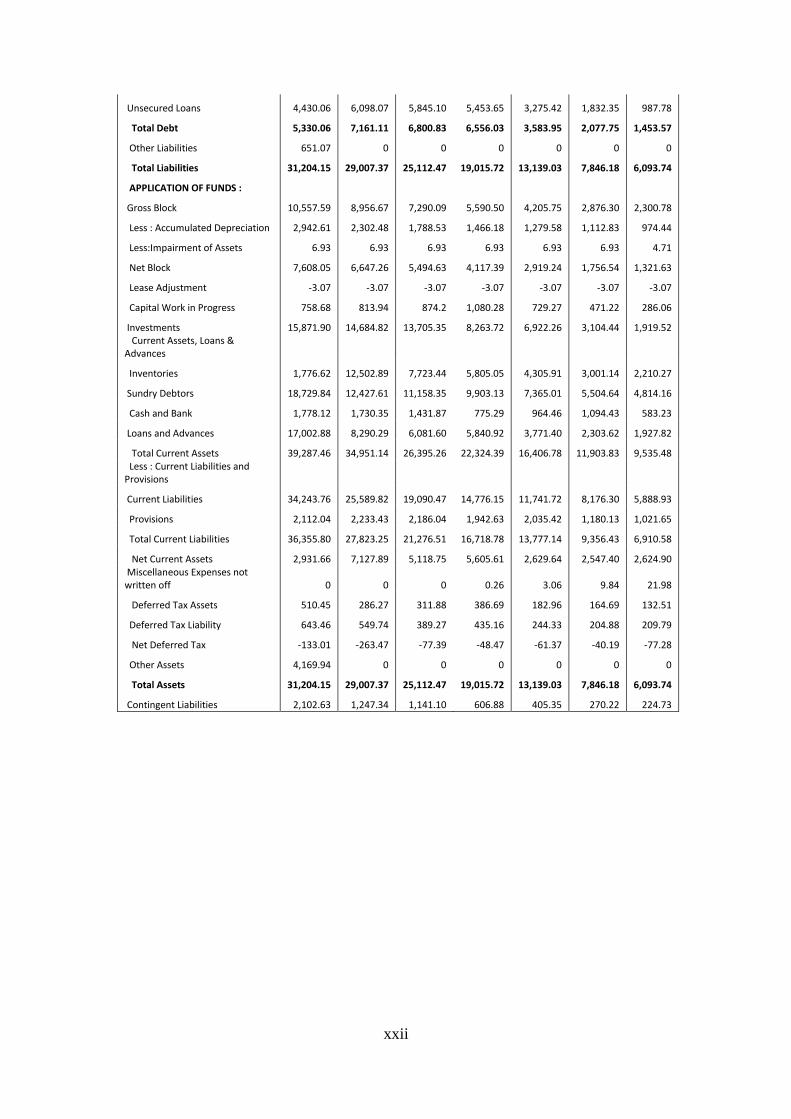
Unsecured Loans 4,430.06 6,098.07 5,845.10 5,453.65 3,275.42 1,832.35 987.78
Total Debt 5,330.06 7,161.11 6,800.83 6,556.03 3,583.95 2,077.75 1,453.57
Other Liabilities 651.07 0 0 0 0 0 0
Total Liabilities 31,204.15 29,007.37 25,112.47 19,015.72 13,139.03 7,846.18 6,093.74
APPLICATION OF FUNDS :
Gross Block 10,557.59 8,956.67 7,290.09 5,590.50 4,205.75 2,876.30 2,300.78
Less : Accumulated Depreciation 2,942.61 2,302.48 1,788.53 1,466.18 1,279.58 1,112.83 974.44
Less:Impairment of Assets 6.93 6.93 6.93 6.93 6.93 6.93 4.71
Net Block 7,608.05 6,647.26 5,494.63 4,117.39 2,919.24 1,756.54 1,321.63
Lease Adjustment -3.07 -3.07 -3.07 -3.07 -3.07 -3.07 -3.07
Capital Work in Progress 758.68 813.94 874.2 1,080.28 729.27 471.22 286.06
Investments 15,871.90 14,684.82 13,705.35 8,263.72 6,922.26 3,104.44 1,919.52 Current Assets, Loans & Advances
Inventories 1,776.62 12,502.89 7,723.44 5,805.05 4,305.91 3,001.14 2,210.27
Sundry Debtors 18,729.84 12,427.61 11,158.35 9,903.13 7,365.01 5,504.64 4,814.16
Cash and Bank 1,778.12 1,730.35 1,431.87 775.29 964.46 1,094.43 583.23
Loans and Advances 17,002.88 8,290.29 6,081.60 5,840.92 3,771.40 2,303.62 1,927.82
Total Current Assets 39,287.46 34,951.14 26,395.26 22,324.39 16,406.78 11,903.83 9,535.48 Less : Current Liabilities and Provisions
Current Liabilities 34,243.76 25,589.82 19,090.47 14,776.15 11,741.72 8,176.30 5,888.93
Provisions 2,112.04 2,233.43 2,186.04 1,942.63 2,035.42 1,180.13 1,021.65
Total Current Liabilities 36,355.80 27,823.25 21,276.51 16,718.78 13,777.14 9,356.43 6,910.58
Net Current Assets 2,931.66 7,127.89 5,118.75 5,605.61 2,629.64 2,547.40 2,624.90 Miscellaneous Expenses not written off 0 0 0 0.26 3.06 9.84 21.98
Deferred Tax Assets 510.45 286.27 311.88 386.69 182.96 164.69 132.51
Deferred Tax Liability 643.46 549.74 389.27 435.16 244.33 204.88 209.79
Net Deferred Tax -133.01 -263.47 -77.39 -48.47 -61.37 -40.19 -77.28
Other Assets 4,169.94 0 0 0 0 0 0
Total Assets 31,204.15 29,007.37 25,112.47 19,015.72 13,139.03 7,846.18 6,093.74
Contingent Liabilities 2,102.63 1,247.34 1,141.10 606.88 405.35 270.22 224.73

xxiii
Profit and Loss Account of L &T Ltd.
(Rs. In Crores)
Balance Sheet of ITC Ltd.
(Rs. In Crore)
Year 2011-12 2010-11 2009-10 2008-09 2007-08 2006-07 2005-06
INCOME :
Sales Turnover 53,737.78 44,231.90 37,330.51 34,301.40 25,314.69 17,938.29 14,994.79
Excise Duty 567.26 390.24 320.78 393.31 334.38 338.08 253.86
Net Sales 53,170.52 43,841.66 37,009.73 33,908.09 24,980.31 17,600.21 14,740.93
Other Income 1,393.28 1,577.22 2,185.75 1,734.13 547.89 484.51 559.82
Stock Adjustments 539.77 559.49 -402.54 105.11 746.17 121.76 -113.24
Total Income 55,103.57 45,978.37 38,792.94 35,747.33 26,274.37 18,206.48 15,187.51
EXPENDITURE :
Raw Materials 24,988.94 20,643.47 15,859.55 16,177.17 13,009.51 8,434.51 7,026.24
Power & Fuel Cost 687.89 392.81 365.36 483.3 365.25 308.13 234.75
Employee Cost 3,663.45 2,797.11 2,310.49 1,918.00 1,497.43 1,238.40 882.41
Other Manufacturing Expenses 14,020.98 11,835.57 10,894.66 8,836.89 5,975.49 4,536.41 4,150.38
Selling and Administration Expenses 2,939.16 2,264.98 1,968.45 1,941.26 1,547.57 1,174.56 947.43
Miscellaneous Expenses 1,044.80 857.5 395.67 943.18 366.74 215.97 286.05
Less: Pre-operative Expenses Capitalised 18.75 37.87 36.25 24.48 11.42 3.3 1.89
Total Expenditure 47,326.47 38,753.57 31,757.93 30,275.32 22,750.57 15,904.68 13,525.37
Operating Profit 7,777.10 7,224.80 7,035.01 5,472.01 3,523.80 2,301.80 1,662.14
Interest 767.31 747.52 637.67 477.68 173.62 137.66 172.37
Gross Profit 7,009.79 6,477.28 6,397.34 4,994.33 3,350.18 2,164.14 1,489.77
Depreciation 699.46 575.81 383.65 284.83 195.94 160.13 107.12
Profit Before Tax 6,310.33 5,901.47 6,013.69 4,709.50 3,154.24 2,004.01 1,382.65
Tax 1,814.13 1,776.58 1,651.56 1,217.60 891.56 611.44 364.19
Fringe Benefit tax 0 0 -10.01 -0.2 69.31 15.18 21.67
Deferred Tax 39.7 167 -3.38 10.44 19.95 -25.63 -15.35
Reported Net Profit 4,456.50 3,957.89 4,375.52 3,481.66 2,173.42 1,403.02 1,012.14
Year 2011-12 2010-11 2009-10 2008-09 2007-08 2006-07 2005-06
SOURCES OF FUNDS :
Share Capital 781.84 773.81 381.82 377.44 376.86 376.22 375.52
Reserves Total 18,010.05 15,179.46 13,682.56 13,357.64 11,680.81 10,060.86 8,685.96
Equity Share Warrants 0 0 0 0 0 0 0
Equity Application Money 0 0 0 0 0 0 0
Total Shareholders Funds 18,791.89 15,953.27 14,064.38 13,735.08 12,057.67 10,437.08 9,061.48
Secured Loans 1.77 1.94 0 11.63 5.57 60.78 25.91
Unsecured Loans 87.35 97.26 107.71 165.92 208.86 140.1 93.82
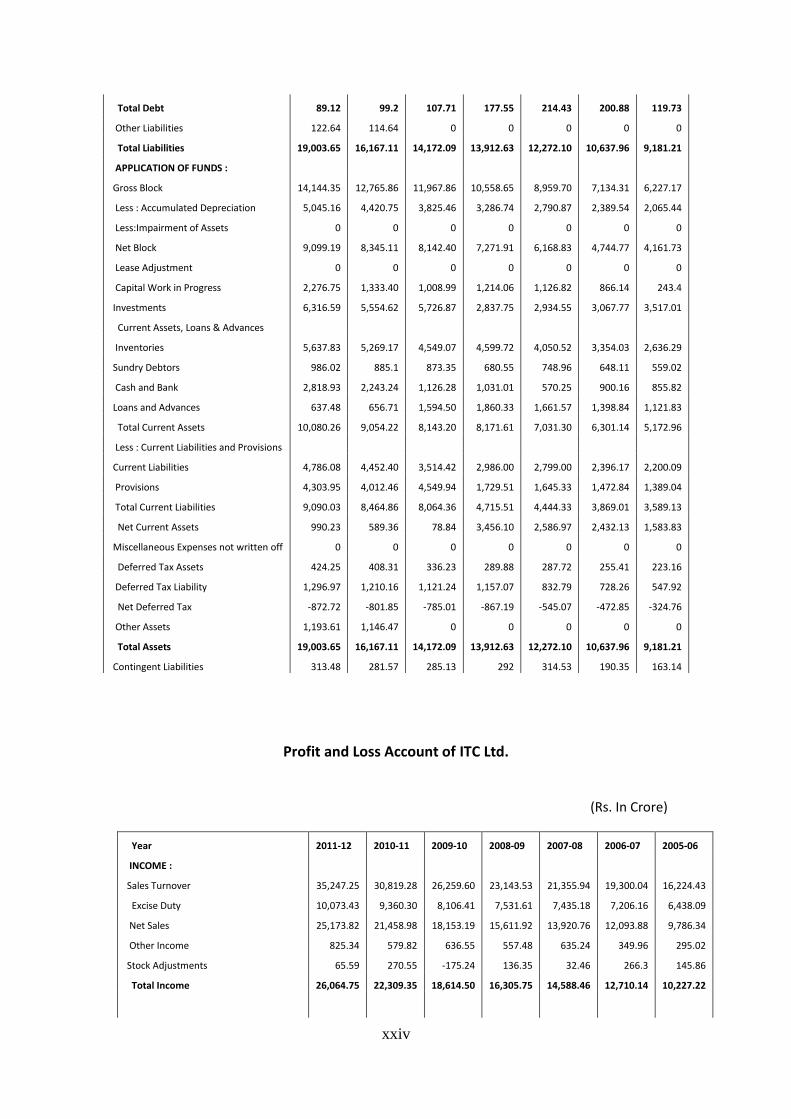
xxiv
Profit and Loss Account of ITC Ltd.
(Rs. In Crore)
Year 2011-12 2010-11 2009-10 2008-09 2007-08 2006-07 2005-06
INCOME :
Sales Turnover 35,247.25 30,819.28 26,259.60 23,143.53 21,355.94 19,300.04 16,224.43
Excise Duty 10,073.43 9,360.30 8,106.41 7,531.61 7,435.18 7,206.16 6,438.09
Net Sales 25,173.82 21,458.98 18,153.19 15,611.92 13,920.76 12,093.88 9,786.34
Other Income 825.34 579.82 636.55 557.48 635.24 349.96 295.02
Stock Adjustments 65.59 270.55 -175.24 136.35 32.46 266.3 145.86
Total Income 26,064.75 22,309.35 18,614.50 16,305.75 14,588.46 12,710.14 10,227.22
Total Debt 89.12 99.2 107.71 177.55 214.43 200.88 119.73
Other Liabilities 122.64 114.64 0 0 0 0 0
Total Liabilities 19,003.65 16,167.11 14,172.09 13,912.63 12,272.10 10,637.96 9,181.21
APPLICATION OF FUNDS :
Gross Block 14,144.35 12,765.86 11,967.86 10,558.65 8,959.70 7,134.31 6,227.17
Less : Accumulated Depreciation 5,045.16 4,420.75 3,825.46 3,286.74 2,790.87 2,389.54 2,065.44
Less:Impairment of Assets 0 0 0 0 0 0 0
Net Block 9,099.19 8,345.11 8,142.40 7,271.91 6,168.83 4,744.77 4,161.73
Lease Adjustment 0 0 0 0 0 0 0
Capital Work in Progress 2,276.75 1,333.40 1,008.99 1,214.06 1,126.82 866.14 243.4
Investments 6,316.59 5,554.62 5,726.87 2,837.75 2,934.55 3,067.77 3,517.01
Current Assets, Loans & Advances
Inventories 5,637.83 5,269.17 4,549.07 4,599.72 4,050.52 3,354.03 2,636.29
Sundry Debtors 986.02 885.1 873.35 680.55 748.96 648.11 559.02
Cash and Bank 2,818.93 2,243.24 1,126.28 1,031.01 570.25 900.16 855.82
Loans and Advances 637.48 656.71 1,594.50 1,860.33 1,661.57 1,398.84 1,121.83
Total Current Assets 10,080.26 9,054.22 8,143.20 8,171.61 7,031.30 6,301.14 5,172.96
Less : Current Liabilities and Provisions
Current Liabilities 4,786.08 4,452.40 3,514.42 2,986.00 2,799.00 2,396.17 2,200.09
Provisions 4,303.95 4,012.46 4,549.94 1,729.51 1,645.33 1,472.84 1,389.04
Total Current Liabilities 9,090.03 8,464.86 8,064.36 4,715.51 4,444.33 3,869.01 3,589.13
Net Current Assets 990.23 589.36 78.84 3,456.10 2,586.97 2,432.13 1,583.83
Miscellaneous Expenses not written off 0 0 0 0 0 0 0
Deferred Tax Assets 424.25 408.31 336.23 289.88 287.72 255.41 223.16
Deferred Tax Liability 1,296.97 1,210.16 1,121.24 1,157.07 832.79 728.26 547.92
Net Deferred Tax -872.72 -801.85 -785.01 -867.19 -545.07 -472.85 -324.76
Other Assets 1,193.61 1,146.47 0 0 0 0 0
Total Assets 19,003.65 16,167.11 14,172.09 13,912.63 12,272.10 10,637.96 9,181.21
Contingent Liabilities 313.48 281.57 285.13 292 314.53 190.35 163.14

xxv
EXPENDITURE :
Raw Materials 9,698.12 8,431.28 6,832.02 6,094.22 6,022.39 5,390.67 4,124.90
Power & Fuel Cost 453.19 421.06 387.34 394.12 309.9 253 245.17
Employee Cost 1,248.47 1,122.86 1,002.39 886.57 728.51 628 539.4
Other Manufacturing Expenses 1,059.32 944.29 820.77 813.48 320.22 276.23 235.32
Selling and Administration Expenses 3,117.07 2,802.07 2,388.60 2,273.23 1,705.17 1,408.81 1,110.88
Miscellaneous Expenses 794.58 575.66 540.96 493.88 567 490.29 409.72
Less: Pre-operative Expenses Capitalised 0 0 71.88 72.55 112.75 42.52 15.78
Total Expenditure 16,370.75 14,297.22 11,900.20 10,882.95 9,540.44 8,404.48 6,649.61
Operating Profit 9,694.00 8,012.13 6,714.30 5,422.80 5,048.02 4,305.66 3,577.61
Interest 97.96 87.98 90.28 47.65 37.79 16.04 21.1
Gross Profit 9,596.04 7,924.15 6,624.02 5,375.15 5,010.23 4,289.62 3,556.51
Depreciation 698.51 655.99 608.71 549.41 438.46 362.92 332.34
Profit Before Tax 8,897.53 7,268.16 6,015.31 4,825.74 4,571.77 3,926.70 3,224.17
Tax 2,664.29 2,263.96 2,036.87 1,215.31 1,355.48 1,062.48 1,020.12
Fringe Benefit tax 0 -0.25 -0.38 24.72 23.97 16.08 20.03
Deferred Tax 70.87 16.84 -82.18 322.12 72.22 148.17 -51.33
Reported Net Profit 6,162.37 4,987.61 4,061.00 3,263.59 3,120.10 2,699.97 2,235.35
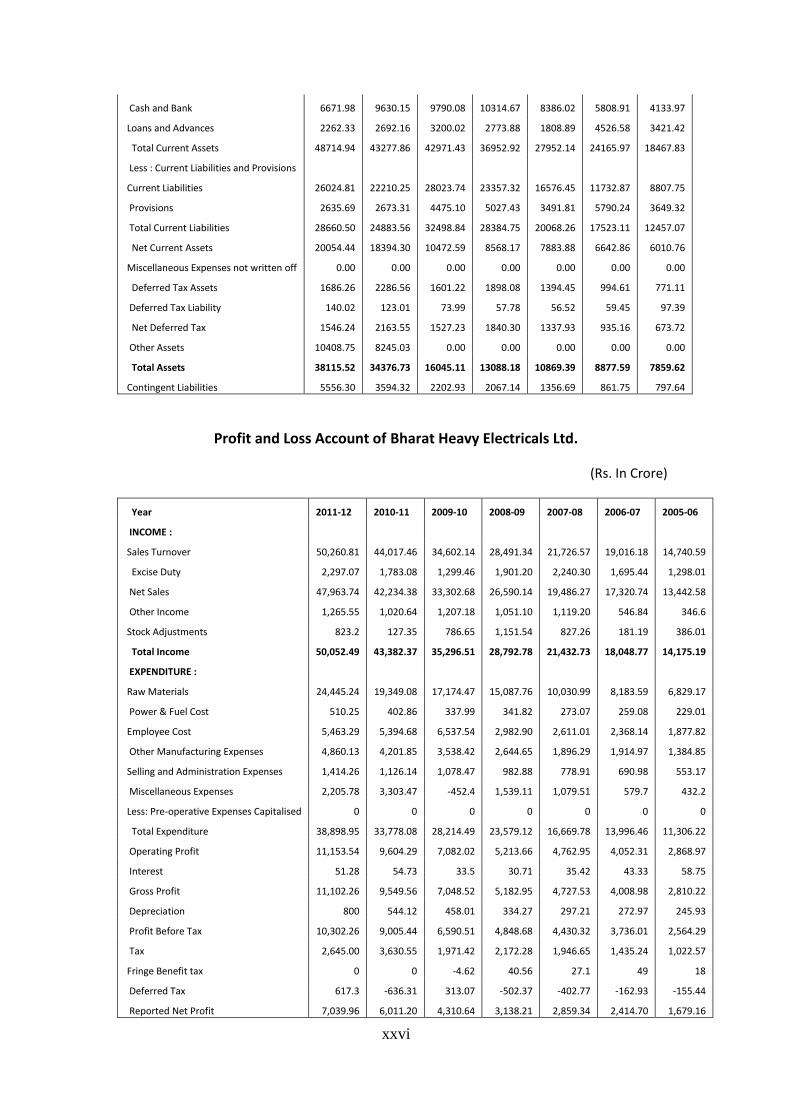
Balance Sheet of Bharat Heavy Electricals Ltd.
(Rs. In Crore)
Year 2011-12 2010-11 2009-10 2008-09 2007-08 2006-07 2005-06
SOURCES OF FUNDS :
Share Capital 489.52 489.52 489.52 489.52 489.52 244.76 244.76
Reserves Total 24883.69 19664.32 15427.84 12449.29 10284.69 8543.50 7056.62
Equity Share Warrants 0.00 0.00 0.00 0.00 0.00 0.00 0.00
Equity Application Money 0.00 0.00 0.00 0.00 0.00 0.00 0.00
Total Shareholders Funds 25373.21 20153.84 15917.36 12938.81 10774.21 8788.26 7301.38
Secured Loans 0.00 0.00 0.00 0.00 0.00 0.00 500.00
Unsecured Loans 185.86 157.26 127.75 149.37 95.18 89.33 58.24
Total Debt 185.86 157.26 127.75 149.37 95.18 89.33 558.24
Other Liabilities 12556.45 14065.63 0.00 0.00 0.00 0.00 0.00
Total Liabilities 38115.52 34376.73 16045.11 13088.18 10869.39 8877.59 7859.62
APPLICATION OF FUNDS :
Gross Block 9706.64 8049.74 6580.14 5224.87 4443.47 4135.05 3822.06
Less : Accumulated Depreciation 5413.47 4648.64 4150.52 3713.25 3403.08 3117.05 2852.76
Less:Impairment of Assets 0.00 0.00 0.00 0.00 0.00 0.00 0.00
Net Block 4293.17 3401.10 2429.62 1511.62 1040.39 1018.00 969.30
Lease Adjustment 3.64 -0.18 -14.22 -41.22 -59.13 -29.26 12.98
Capital Work in Progress 1347.61 1733.76 1550.05 1156.97 658.03 302.54 184.57
Investments 461.67 439.17 79.84 52.34 8.29 8.29 8.29
Current Assets, Loans & Advances
Inventories 13444.50 10852.05 9292.58 7888.87 5782.36 4217.67 3744.37
Sundry Debtors 26336.13 20103.50 20688.75 15975.50 11974.87 9612.81 7168.07
xxvi
Cash and Bank 6671.98 9630.15 9790.08 10314.67 8386.02 5808.91 4133.97
Loans and Advances 2262.33 2692.16 3200.02 2773.88 1808.89 4526.58 3421.42
Total Current Assets 48714.94 43277.86 42971.43 36952.92 27952.14 24165.97 18467.83
Less : Current Liabilities and Provisions
Current Liabilities 26024.81 22210.25 28023.74 23357.32 16576.45 11732.87 8807.75
Provisions 2635.69 2673.31 4475.10 5027.43 3491.81 5790.24 3649.32
Total Current Liabilities 28660.50 24883.56 32498.84 28384.75 20068.26 17523.11 12457.07
Net Current Assets 20054.44 18394.30 10472.59 8568.17 7883.88 6642.86 6010.76
Miscellaneous Expenses not written off 0.00 0.00 0.00 0.00 0.00 0.00 0.00
Deferred Tax Assets 1686.26 2286.56 1601.22 1898.08 1394.45 994.61 771.11
Deferred Tax Liability 140.02 123.01 73.99 57.78 56.52 59.45 97.39
Net Deferred Tax 1546.24 2163.55 1527.23 1840.30 1337.93 935.16 673.72
Other Assets 10408.75 8245.03 0.00 0.00 0.00 0.00 0.00
Total Assets 38115.52 34376.73 16045.11 13088.18 10869.39 8877.59 7859.62
Contingent Liabilities 5556.30 3594.32 2202.93 2067.14 1356.69 861.75 797.64
Profit and Loss Account of Bharat Heavy Electricals Ltd.
(Rs. In Crore)
Year 2011-12 2010-11 2009-10 2008-09 2007-08 2006-07 2005-06
INCOME :
Sales Turnover 50,260.81 44,017.46 34,602.14 28,491.34 21,726.57 19,016.18 14,740.59
Excise Duty 2,297.07 1,783.08 1,299.46 1,901.20 2,240.30 1,695.44 1,298.01
Net Sales 47,963.74 42,234.38 33,302.68 26,590.14 19,486.27 17,320.74 13,442.58
Other Income 1,265.55 1,020.64 1,207.18 1,051.10 1,119.20 546.84 346.6
Stock Adjustments 823.2 127.35 786.65 1,151.54 827.26 181.19 386.01
Total Income 50,052.49 43,382.37 35,296.51 28,792.78 21,432.73 18,048.77 14,175.19
EXPENDITURE :
Raw Materials 24,445.24 19,349.08 17,174.47 15,087.76 10,030.99 8,183.59 6,829.17
Power & Fuel Cost 510.25 402.86 337.99 341.82 273.07 259.08 229.01
Employee Cost 5,463.29 5,394.68 6,537.54 2,982.90 2,611.01 2,368.14 1,877.82
Other Manufacturing Expenses 4,860.13 4,201.85 3,538.42 2,644.65 1,896.29 1,914.97 1,384.85
Selling and Administration Expenses 1,414.26 1,126.14 1,078.47 982.88 778.91 690.98 553.17
Miscellaneous Expenses 2,205.78 3,303.47 -452.4 1,539.11 1,079.51 579.7 432.2
Less: Pre-operative Expenses Capitalised 0 0 0 0 0 0 0
Total Expenditure 38,898.95 33,778.08 28,214.49 23,579.12 16,669.78 13,996.46 11,306.22
Operating Profit 11,153.54 9,604.29 7,082.02 5,213.66 4,762.95 4,052.31 2,868.97
Interest 51.28 54.73 33.5 30.71 35.42 43.33 58.75
Gross Profit 11,102.26 9,549.56 7,048.52 5,182.95 4,727.53 4,008.98 2,810.22
Depreciation 800 544.12 458.01 334.27 297.21 272.97 245.93
Profit Before Tax 10,302.26 9,005.44 6,590.51 4,848.68 4,430.32 3,736.01 2,564.29
Tax 2,645.00 3,630.55 1,971.42 2,172.28 1,946.65 1,435.24 1,022.57
Fringe Benefit tax 0 0 -4.62 40.56 27.1 49 18
Deferred Tax 617.3 -636.31 313.07 -502.37 -402.77 -162.93 -155.44
Reported Net Profit 7,039.96 6,011.20 4,310.64 3,138.21 2,859.34 2,414.70 1,679.16
xxvii
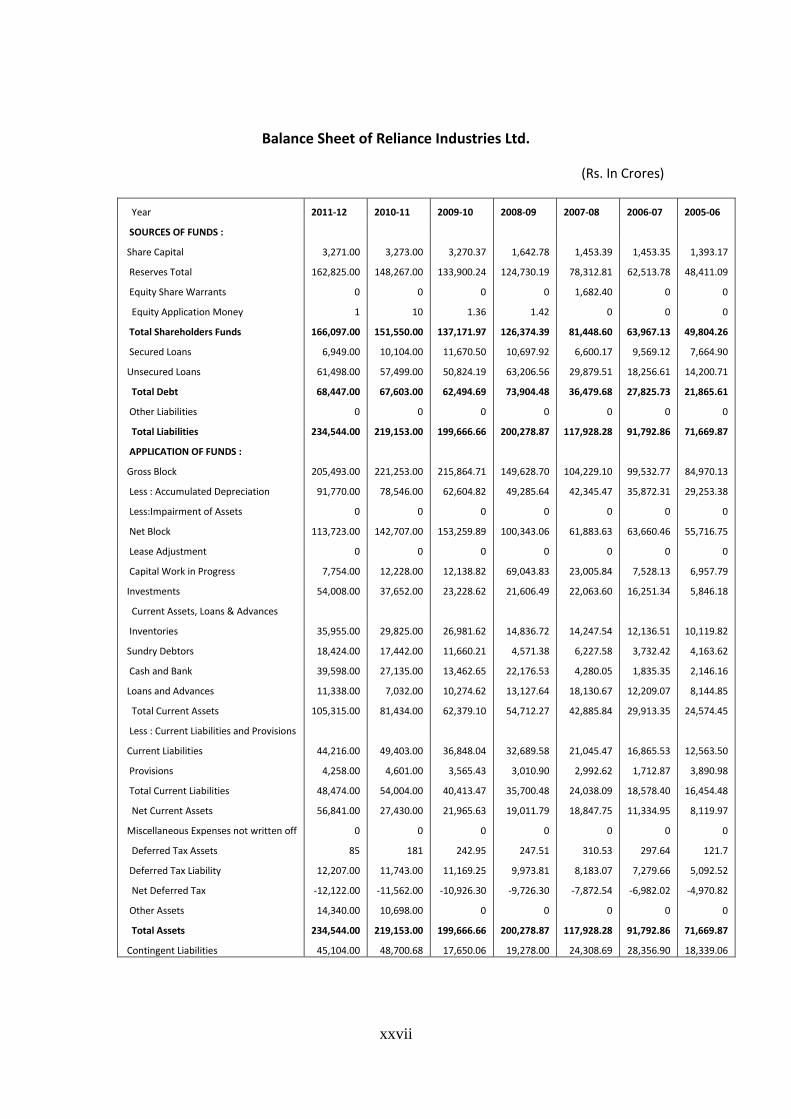
Balance Sheet of Reliance Industries Ltd.
(Rs. In Crores)
Year 2011-12 2010-11 2009-10 2008-09 2007-08 2006-07 2005-06
SOURCES OF FUNDS :
Share Capital 3,271.00 3,273.00 3,270.37 1,642.78 1,453.39 1,453.35 1,393.17
Reserves Total 162,825.00 148,267.00 133,900.24 124,730.19 78,312.81 62,513.78 48,411.09
Equity Share Warrants 0 0 0 0 1,682.40 0 0
Equity Application Money 1 10 1.36 1.42 0 0 0
Total Shareholders Funds 166,097.00 151,550.00 137,171.97 126,374.39 81,448.60 63,967.13 49,804.26
Secured Loans 6,949.00 10,104.00 11,670.50 10,697.92 6,600.17 9,569.12 7,664.90
Unsecured Loans 61,498.00 57,499.00 50,824.19 63,206.56 29,879.51 18,256.61 14,200.71
Total Debt 68,447.00 67,603.00 62,494.69 73,904.48 36,479.68 27,825.73 21,865.61
Other Liabilities 0 0 0 0 0 0 0
Total Liabilities 234,544.00 219,153.00 199,666.66 200,278.87 117,928.28 91,792.86 71,669.87
APPLICATION OF FUNDS :
Gross Block 205,493.00 221,253.00 215,864.71 149,628.70 104,229.10 99,532.77 84,970.13
Less : Accumulated Depreciation 91,770.00 78,546.00 62,604.82 49,285.64 42,345.47 35,872.31 29,253.38
Less:Impairment of Assets 0 0 0 0 0 0 0
Net Block 113,723.00 142,707.00 153,259.89 100,343.06 61,883.63 63,660.46 55,716.75
Lease Adjustment 0 0 0 0 0 0 0
Capital Work in Progress 7,754.00 12,228.00 12,138.82 69,043.83 23,005.84 7,528.13 6,957.79
Investments 54,008.00 37,652.00 23,228.62 21,606.49 22,063.60 16,251.34 5,846.18
Current Assets, Loans & Advances
Inventories 35,955.00 29,825.00 26,981.62 14,836.72 14,247.54 12,136.51 10,119.82
Sundry Debtors 18,424.00 17,442.00 11,660.21 4,571.38 6,227.58 3,732.42 4,163.62
Cash and Bank 39,598.00 27,135.00 13,462.65 22,176.53 4,280.05 1,835.35 2,146.16
Loans and Advances 11,338.00 7,032.00 10,274.62 13,127.64 18,130.67 12,209.07 8,144.85
Total Current Assets 105,315.00 81,434.00 62,379.10 54,712.27 42,885.84 29,913.35 24,574.45
Less : Current Liabilities and Provisions
Current Liabilities 44,216.00 49,403.00 36,848.04 32,689.58 21,045.47 16,865.53 12,563.50
Provisions 4,258.00 4,601.00 3,565.43 3,010.90 2,992.62 1,712.87 3,890.98
Total Current Liabilities 48,474.00 54,004.00 40,413.47 35,700.48 24,038.09 18,578.40 16,454.48
Net Current Assets 56,841.00 27,430.00 21,965.63 19,011.79 18,847.75 11,334.95 8,119.97
Miscellaneous Expenses not written off 0 0 0 0 0 0 0
Deferred Tax Assets 85 181 242.95 247.51 310.53 297.64 121.7
Deferred Tax Liability 12,207.00 11,743.00 11,169.25 9,973.81 8,183.07 7,279.66 5,092.52
Net Deferred Tax -12,122.00 -11,562.00 -10,926.30 -9,726.30 -7,872.54 -6,982.02 -4,970.82
Other Assets 14,340.00 10,698.00 0 0 0 0 0
Total Assets 234,544.00 219,153.00 199,666.66 200,278.87 117,928.28 91,792.86 71,669.87
Contingent Liabilities 45,104.00 48,700.68 17,650.06 19,278.00 24,308.69 28,356.90 18,339.06

xxviii
Profit and Loss Account of Reliance Industries Ltd.
(Rs. In Crores)
Year 2011-12 2010-11 2009-10 2008-09 2007-08 2006-07 2005-06
INCOME :
Sales Turnover 339,792.00 258,651.00 200,399.79 146,328.07 139,269.46 118,353.71 89,124.46
Excise Duty 9,888.00 10,481.00 7,938.77 4,369.07 5,463.68 6,654.68 8,246.67
Net Sales 329,904.00 248,170.00 192,461.02 141,959.00 133,805.78 111,699.03 80,877.79
Other Income 6,192.00 3,052.00 2,460.32 2,148.40 6,615.62 478.28 682.92
Stock Adjustments 872 3,243.00 3,947.89 427.56 -1,867.16 654.6 2,131.19
Total Income 336,968.00 254,465.00 198,869.23 144,534.96 138,554.24 112,831.91 83,691.90
EXPENDITURE :
Raw Materials 276,255.00 194,698.00 150,915.03 107,010.32 96,311.56 78,692.94 58,342.31
Power & Fuel Cost 4,094.00 2,255.00 2,706.71 3,355.98 2,052.84 2,261.69 1,146.26
Employee Cost 2,862.00 2,624.00 2,307.73 2,357.40 2,049.95 2,045.95 932.09
Other Manufacturing Expenses 6,309.00 6,600.00 5,578.24 3,704.00 3,951.40 3,486.87 2,217.72
Selling and Administration Expenses 6,925.00 6,807.00 5,549.74 4,619.24 4,882.01 5,342.31 5,765.46
Miscellaneous Expenses 749 333 -11.48 1,379.92 547.3 588.85 461.19
Less: Pre-operative Expenses Capitalised 37 30 1,217.92 3,265.65 175.46 111.21 155.14
Total Expenditure 297,157.00 213,287.00 165,828.05 119,161.21 109,619.60 92,307.40 68,709.89
Operating Profit 39,811.00 41,178.00 33,041.18 25,373.75 28,934.64 20,524.51 14,982.01
Interest 2,667.00 2,328.00 1,997.21 1,745.23 1,077.36 1,188.89 877.04
Gross Profit 37,144.00 38,850.00 31,043.97 23,628.52 27,857.28 19,335.62 14,104.97
Depreciation 11,394.00 13,608.00 10,496.53 5,195.29 4,847.14 4,815.15 3,400.91
Profit Before Tax 25,750.00 25,242.00 20,547.44 18,433.23 23,010.14 14,520.47 10,704.06
Tax 5,150.00 4,320.00 3,111.77 1,206.50 2,604.96 1,617.10 900
Fringe Benefit tax 0 0 0 56.87 47 40.34 30.72
Deferred Tax 560 636 1,200.00 1,860.54 899.89 919.63 704
Reported Net Profit 20,040.00 20,286.00 16,235.67 15,309.32 19,458.29 11,943.40 9,069.34

xxix
Balance Sheet of Hindalco Industries Ltd.
(Rs. In Crores)
Year 2011-12 2010-11 2009-10 2008-09 2007-08 2006-07 2005-06
SOURCES OF FUNDS :
Share Capital 191.48 191.46 191.37 170.46 123.06 104.33 98.57
Reserves Total 31,299.68 29,508.64 27,715.61 23,584.69 17,171.53 12,313.71 9,507.69
Equity Share Warrants 0 0 0 0 139.1 0 0
Equity Application Money 541.31 0 4.43 3.62 0.35 0.4 3.07
Total Shareholders Funds 32,032.47 29,700.10 27,911.41 23,758.77 17,434.04 12,418.44 9,609.33
Secured Loans 11,112.11 5,142.99 5,153.90 5,713.23 6,205.42 6,410.20 2,848.05
Unsecured Loans 3.02 4.55 1,203.00 2,611.06 2,123.16 949.03 2,055.39
Total Debt 11,115.13 5,147.54 6,356.90 8,324.29 8,328.58 7,359.23 4,903.44
Other Liabilities 1,240.42 558.57 0 0 0 0 0
Total Liabilities 44,388.02 35,406.21 34,268.31 32,083.06 25,762.62 19,777.67 14,512.77
APPLICATION OF FUNDS :
Gross Block 14,477.87 14,287.31 13,793.35 13,393.07 12,608.46 11,252.66 10,418.25
Less : Accumulated Depreciation 7,121.99 6,484.97 5,840.00 5,241.65 4,636.81 4,056.33 3,531.07
Less:Impairment of Assets 205.68 217.96 218.53 264.45 162.32 189.62 104.38
Net Block 7,150.20 7,584.38 7,734.82 7,886.97 7,809.33 7,006.71 6,782.80
Lease Adjustment 0 0 0 0 0 0 0
Capital Work in Progress 16,256.94 6,030.41 3,702.79 1,389.63 1,119.87 1,476.42 832.92
Investments 18,087.10 18,246.75 21,480.83 19,148.84 14,107.99 8,675.32 3,971.29
Current Assets, Loans & Advances
Inventories 7,742.86 7,651.40 5,921.41 4,070.14 5,097.91 4,315.31 4,095.09
Sundry Debtors 1,427.45 1,255.49 1,311.87 1,201.22 1,565.02 1,504.50 1,248.40
Cash and Bank 722.3 233.39 140.21 843.72 146.98 665.5 917.29
Loans and Advances 2,003.43 1,591.83 1,490.80 1,624.83 1,041.76 1,293.03 1,041.99
Total Current Assets 11,896.04 10,732.11 8,864.29 7,739.91 7,851.67 7,778.34 7,302.77
Less : Current Liabilities and Provisions
Current Liabilities 9,115.16 9,027.21 5,426.49 1,868.46 2,896.56 2,752.35 2,196.49
Provisions 919.88 815.43 721.49 803.16 906.01 1,284.14 953.16
Total Current Liabilities 10,035.04 9,842.64 6,147.98 2,671.62 3,802.57 4,036.49 3,149.65
Net Current Assets 1,861.00 889.47 2,716.31 5,068.29 4,049.10 3,741.85 4,153.12
Miscellaneous Expenses not written off 0 0 0 0 0 3.17 6
Deferred Tax Assets 113.45 102.1 97.82 84.33 83.42 67.83 12.32
Deferred Tax Liability 1,338.01 1,389.59 1,464.26 1,495.00 1,407.09 1,193.63 1,245.68
Net Deferred Tax -1,224.56 -1,287.49 -1,366.44 -1,410.67 -1,323.67 -1,125.80 -1,233.36
Other Assets 2,257.34 3,942.69 0 0 0 0 0
Total Assets 44,388.02 35,406.21 34,268.31 32,083.06 25,762.62 19,777.67 14,512.77
Contingent Liabilities 1,095.72 1,361.60 8,559.38 8,209.13 16,952.19 927.46 1,539.81

xxx
Profit and Loss Account of Hindalco Industries Ltd.
(Rs. In Crores)
Balance Sheet of ONGC Ltd.
(Rs. In Crores)
Year 2011-12 2010-11 2009-10 2008-09 2007-08 2006-07 2005-06
SOURCES OF FUNDS :
Share Capital 4,277.76 4,277.76 2,138.89 2,138.89 2,138.89 2,138.89 1,425.93
Reserves Total 108,678.97 93,226.67 85,143.71 76,596.53 68,478.51 59,785.04 52,533.74
Equity Share Warrants 0 0 0 0 0 0 0
Equity Application Money 0 0 0 0 0 0 0
Total Shareholders Funds 112,956.73 97,504.43 87,282.60 78,735.42 70,617.40 61,923.93 53,959.67
Secured Loans 4,500.00 0 0 0 0 0 0
Unsecured Loans 0 0 16,405.65 16,035.70 12,482.71 15,109.07 12,722.61
Total Debt 4,500.00 0 16,405.65 16,035.70 12,482.71 15,109.07 12,722.61
Other Liabilities 21,875.05 21,405.97 0 0 0 0 0
Year 2011-12 2010-11 2009-10 2008-09 2007-08 2006-07 2005-06
INCOME :
Sales Turnover 28,296.96 25,348.12 20,441.41 19,551.66 20,729.98 19,701.99 12,201.99
Excise Duty 1,700.18 1,488.91 1,047.58 1,498.69 1,825.67 1,608.47 1,082.35
Net Sales 26,596.78 23,859.21 19,393.83 18,052.97 18,904.31 18,093.52 11,119.64
Other Income 615.79 347.49 388.11 851.05 857.75 601.83 567.2
Stock Adjustments 407.31 394.67 755.25 -520.58 141.8 443.89 1,036.30
Total Income 27,619.88 24,601.37 20,537.19 18,383.44 19,903.86 19,139.24 12,723.14
EXPENDITURE :
Raw Materials 18,049.08 16,054.51 13,297.67 10,444.13 12,144.24 11,134.91 6,603.37
Power & Fuel Cost 2,881.74 2,224.30 1,938.00 1,897.57 1,910.83 1,848.62 1,795.59
Employee Cost 1,159.27 1,064.68 856.87 807.49 621.22 514.64 458.98
Other Manufacturing Expenses 764.93 668.67 603.39 583.59 481.6 491.25 526.74
Selling and Administration Expenses 593.09 471.93 465.07 483.98 389.52 380.06 355.95
Miscellaneous Expenses 659.55 737.52 162.27 495.09 462.4 469.94 134.96
Less: Pre-operative Expenses Capitalised 208.33 122.42 0 0 0 0 0
Total Expenditure 23,899.33 21,099.19 17,323.27 14,711.85 16,009.81 14,839.42 9,875.59
Operating Profit 3,720.55 3,502.18 3,213.92 3,671.59 3,894.05 4,299.82 2,847.55
Interest 293.63 219.96 278 336.93 280.63 242.39 225.17
Gross Profit 3,426.92 3,282.22 2,935.92 3,334.66 3,613.42 4,057.43 2,622.38
Depreciation 689.97 687.48 671.36 644.34 587.81 552.8 516.68
Profit Before Tax 2,736.95 2,594.74 2,264.56 2,690.32 3,025.61 3,504.63 2,105.70
Tax 562.68 555.68 261.03 327.28 65.69 984.1 324.11
Fringe Benefit tax 0 0 0 11.37 11.4 11.3 10.06
Deferred Tax -62.93 -97.86 87.9 121.4 87.58 -55.1 115.98
Reported Net Profit 2,237.20 2,136.92 1,915.63 2,230.27 2,860.94 2,564.33 1,655.55
xxxi
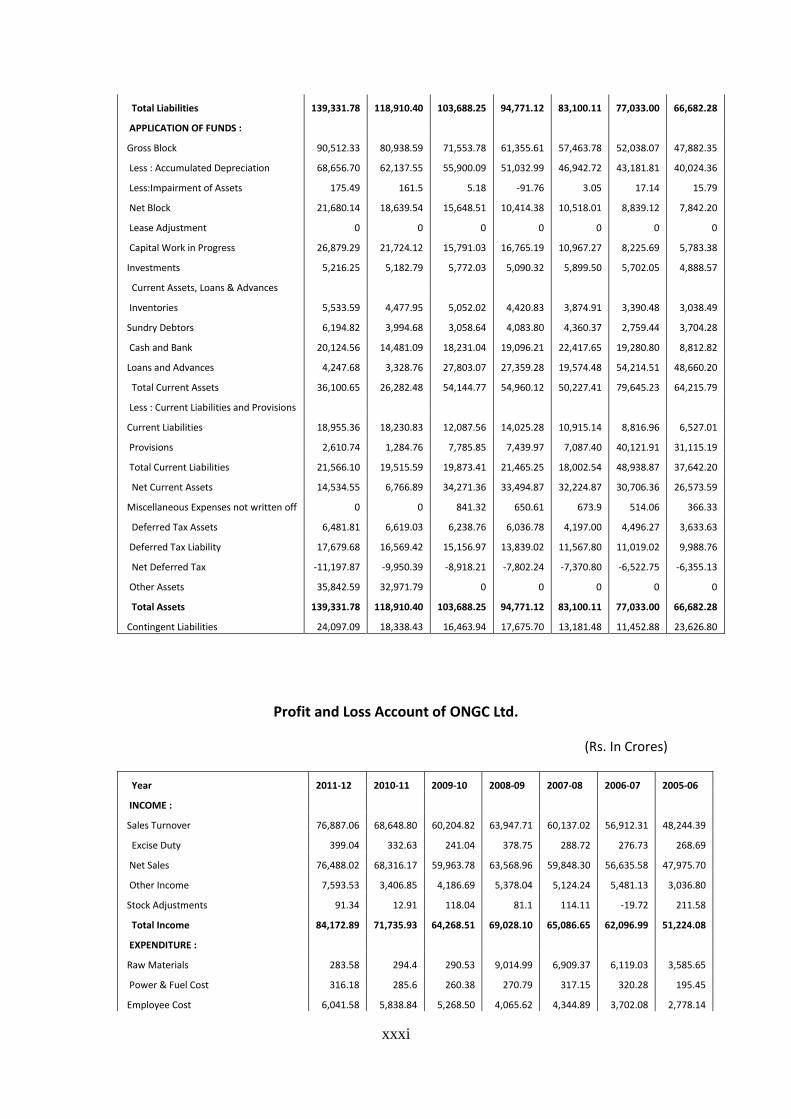
Total Liabilities 139,331.78 118,910.40 103,688.25 94,771.12 83,100.11 77,033.00 66,682.28
APPLICATION OF FUNDS :
Gross Block 90,512.33 80,938.59 71,553.78 61,355.61 57,463.78 52,038.07 47,882.35
Less : Accumulated Depreciation 68,656.70 62,137.55 55,900.09 51,032.99 46,942.72 43,181.81 40,024.36
Less:Impairment of Assets 175.49 161.5 5.18 -91.76 3.05 17.14 15.79
Net Block 21,680.14 18,639.54 15,648.51 10,414.38 10,518.01 8,839.12 7,842.20
Lease Adjustment 0 0 0 0 0 0 0
Capital Work in Progress 26,879.29 21,724.12 15,791.03 16,765.19 10,967.27 8,225.69 5,783.38
Investments 5,216.25 5,182.79 5,772.03 5,090.32 5,899.50 5,702.05 4,888.57
Current Assets, Loans & Advances
Inventories 5,533.59 4,477.95 5,052.02 4,420.83 3,874.91 3,390.48 3,038.49
Sundry Debtors 6,194.82 3,994.68 3,058.64 4,083.80 4,360.37 2,759.44 3,704.28
Cash and Bank 20,124.56 14,481.09 18,231.04 19,096.21 22,417.65 19,280.80 8,812.82
Loans and Advances 4,247.68 3,328.76 27,803.07 27,359.28 19,574.48 54,214.51 48,660.20
Total Current Assets 36,100.65 26,282.48 54,144.77 54,960.12 50,227.41 79,645.23 64,215.79
Less : Current Liabilities and Provisions
Current Liabilities 18,955.36 18,230.83 12,087.56 14,025.28 10,915.14 8,816.96 6,527.01
Provisions 2,610.74 1,284.76 7,785.85 7,439.97 7,087.40 40,121.91 31,115.19
Total Current Liabilities 21,566.10 19,515.59 19,873.41 21,465.25 18,002.54 48,938.87 37,642.20
Net Current Assets 14,534.55 6,766.89 34,271.36 33,494.87 32,224.87 30,706.36 26,573.59
Miscellaneous Expenses not written off 0 0 841.32 650.61 673.9 514.06 366.33
Deferred Tax Assets 6,481.81 6,619.03 6,238.76 6,036.78 4,197.00 4,496.27 3,633.63
Deferred Tax Liability 17,679.68 16,569.42 15,156.97 13,839.02 11,567.80 11,019.02 9,988.76
Net Deferred Tax -11,197.87 -9,950.39 -8,918.21 -7,802.24 -7,370.80 -6,522.75 -6,355.13
Other Assets 35,842.59 32,971.79 0 0 0 0 0
Total Assets 139,331.78 118,910.40 103,688.25 94,771.12 83,100.11 77,033.00 66,682.28
Contingent Liabilities 24,097.09 18,338.43 16,463.94 17,675.70 13,181.48 11,452.88 23,626.80
Profit and Loss Account of ONGC Ltd.
(Rs. In Crores)
Year 2011-12 2010-11 2009-10 2008-09 2007-08 2006-07 2005-06
INCOME :
Sales Turnover 76,887.06 68,648.80 60,204.82 63,947.71 60,137.02 56,912.31 48,244.39
Excise Duty 399.04 332.63 241.04 378.75 288.72 276.73 268.69
Net Sales 76,488.02 68,316.17 59,963.78 63,568.96 59,848.30 56,635.58 47,975.70
Other Income 7,593.53 3,406.85 4,186.69 5,378.04 5,124.24 5,481.13 3,036.80
Stock Adjustments 91.34 12.91 118.04 81.1 114.11 -19.72 211.58
Total Income 84,172.89 71,735.93 64,268.51 69,028.10 65,086.65 62,096.99 51,224.08
EXPENDITURE :
Raw Materials 283.58 294.4 290.53 9,014.99 6,909.37 6,119.03 3,585.65
Power & Fuel Cost 316.18 285.6 260.38 270.79 317.15 320.28 195.45
Employee Cost 6,041.58 5,838.84 5,268.50 4,065.62 4,344.89 3,702.08 2,778.14
xxxii
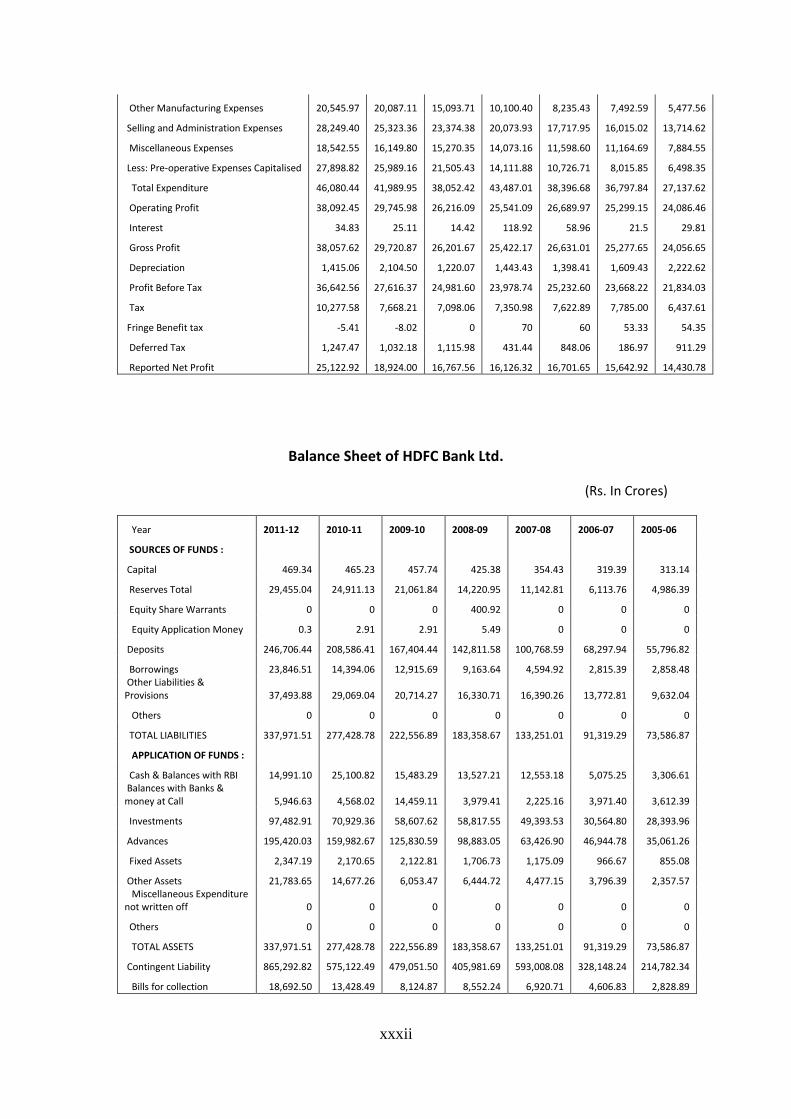
Other Manufacturing Expenses 20,545.97 20,087.11 15,093.71 10,100.40 8,235.43 7,492.59 5,477.56
Selling and Administration Expenses 28,249.40 25,323.36 23,374.38 20,073.93 17,717.95 16,015.02 13,714.62
Miscellaneous Expenses 18,542.55 16,149.80 15,270.35 14,073.16 11,598.60 11,164.69 7,884.55
Less: Pre-operative Expenses Capitalised 27,898.82 25,989.16 21,505.43 14,111.88 10,726.71 8,015.85 6,498.35
Total Expenditure 46,080.44 41,989.95 38,052.42 43,487.01 38,396.68 36,797.84 27,137.62
Operating Profit 38,092.45 29,745.98 26,216.09 25,541.09 26,689.97 25,299.15 24,086.46
Interest 34.83 25.11 14.42 118.92 58.96 21.5 29.81
Gross Profit 38,057.62 29,720.87 26,201.67 25,422.17 26,631.01 25,277.65 24,056.65
Depreciation 1,415.06 2,104.50 1,220.07 1,443.43 1,398.41 1,609.43 2,222.62
Profit Before Tax 36,642.56 27,616.37 24,981.60 23,978.74 25,232.60 23,668.22 21,834.03
Tax 10,277.58 7,668.21 7,098.06 7,350.98 7,622.89 7,785.00 6,437.61
Fringe Benefit tax -5.41 -8.02 0 70 60 53.33 54.35
Deferred Tax 1,247.47 1,032.18 1,115.98 431.44 848.06 186.97 911.29
Reported Net Profit 25,122.92 18,924.00 16,767.56 16,126.32 16,701.65 15,642.92 14,430.78
Balance Sheet of HDFC Bank Ltd.
(Rs. In Crores)
Year 2011-12 2010-11 2009-10 2008-09 2007-08 2006-07 2005-06
SOURCES OF FUNDS :
Capital 469.34 465.23 457.74 425.38 354.43 319.39 313.14
Reserves Total 29,455.04 24,911.13 21,061.84 14,220.95 11,142.81 6,113.76 4,986.39
Equity Share Warrants 0 0 0 400.92 0 0 0
Equity Application Money 0.3 2.91 2.91 5.49 0 0 0
Deposits 246,706.44 208,586.41 167,404.44 142,811.58 100,768.59 68,297.94 55,796.82
Borrowings 23,846.51 14,394.06 12,915.69 9,163.64 4,594.92 2,815.39 2,858.48 Other Liabilities & Provisions 37,493.88 29,069.04 20,714.27 16,330.71 16,390.26 13,772.81 9,632.04
Others 0 0 0 0 0 0 0
TOTAL LIABILITIES 337,971.51 277,428.78 222,556.89 183,358.67 133,251.01 91,319.29 73,586.87
APPLICATION OF FUNDS :
Cash & Balances with RBI 14,991.10 25,100.82 15,483.29 13,527.21 12,553.18 5,075.25 3,306.61 Balances with Banks & money at Call 5,946.63 4,568.02 14,459.11 3,979.41 2,225.16 3,971.40 3,612.39
Investments 97,482.91 70,929.36 58,607.62 58,817.55 49,393.53 30,564.80 28,393.96
Advances 195,420.03 159,982.67 125,830.59 98,883.05 63,426.90 46,944.78 35,061.26
Fixed Assets 2,347.19 2,170.65 2,122.81 1,706.73 1,175.09 966.67 855.08
Other Assets 21,783.65 14,677.26 6,053.47 6,444.72 4,477.15 3,796.39 2,357.57 Miscellaneous Expenditure not written off 0 0 0 0 0 0 0
Others 0 0 0 0 0 0 0
TOTAL ASSETS 337,971.51 277,428.78 222,556.89 183,358.67 133,251.01 91,319.29 73,586.87
Contingent Liability 865,292.82 575,122.49 479,051.50 405,981.69 593,008.08 328,148.24 214,782.34
Bills for collection 18,692.50 13,428.49 8,124.87 8,552.24 6,920.71 4,606.83 2,828.89

xxxiii
Profit and Loss Account of HDFC Bank Ltd.
(Rs. In Crores)
Year 2011-12 2010-11 2009-10 2008-09 2007-08 2006-07 2005-06
INCOME :
Interest Earned 27,286.3
5 19,928.2
1 16,172.7
2 16,332.2
6 10,115.0
0 6,647.93 4,475.34
Other Income 5,243.70 4,335.15 3,983.11 3,470.64 2,283.15 1,594.59 1,213.64
Total 32,530.0
5 24,263.3
6 20,155.8
3 19,802.9
0 12,398.1
5 8,242.52 5,688.98
II. Expenditure
Interest expended 14,989.5
8 9,385.08 7,786.30 8,911.10 4,887.11 3,179.45 1,929.50 Payments to/Provisions for Employees 3,399.91 2,836.04 2,289.18 2,238.20 1,301.35 776.86 486.82 Operating Expenses & Administrative Expenses 2,349.09 2,048.46 1,783.23 1,580.24 1,135.40 856.26 750.19
Depreciation 542.52 497.41 394.39 359.91 271.71 219.6 178.59 Other Expenses, Provisions & Contingencies 3,735.79 3,677.71 3,613.59 3,414.20 2,521.93 1,571.60 1,090.37
Provision for Tax 2,606.25 2,237.46 1,365.67 1,054.31 866.25 581.88 359.56
Fringe Benefit tax 0 0 0 0 16.78 12 11
Deferred Tax -260.18 -345.2 -25.23 0 -192.58 -96.58 12.17
Total 27,362.9
6 20,336.9
6 17,207.1
3 17,557.9
6 10,807.9
5 7,101.07 4,818.20
III. Profit & Loss
Reported Net Profit 5,167.09 3,926.40 2,948.70 2,244.94 1,590.20 1,141.45 870.78
Balance Sheet of ICICI Bank Ltd.
(Rs. In Crores)
Year 2011-12 2010-11 2009-10 2008-09 2007-08 2006-07 2005-06
SOURCES OF FUNDS :
Capital 1,152.77 1,151.82 1,114.89 1,113.29 1,462.68 1,249.34 1,239.83
Reserves Total 59,250.09 53,938.82 50,503.48 48,419.73 45,357.53 23,413.92 21,316.16
Equity Share Warrants 0 0 0 0 0 0 0
Equity Application Money 2.38 0.29 0 0 0 0 0
Deposits 255,499.96 225,602.11 202,016.60 218,347.83 244,431.05 230,510.19 165,083.17
Borrowings 140,164.91 109,554.28 94,263.57 93,155.45 65,648.43 51,256.03 38,521.91
Other Liabilities & Provisions 18,004.49 16,430.76 15,968.29 18,813.30 43,517.43 38,882.96 25,897.60
Others 0 0 0 0 0 0 0
TOTAL LIABILITIES 474,074.60 406,678.08 363,866.83 379,849.60 400,417.12 345,312.44 252,058.67
APPLICATION OF FUNDS :
Cash & Balances with RBI 20,461.29 20,906.97 27,514.30 17,536.33 29,377.53 18,706.88 8,934.37 Balances with Banks & money at Call 15,768.02 13,183.11 11,359.40 12,430.23 8,663.60 18,414.44 8,105.85
Investments 159,560.04 134,685.96 120,892.80 103,058.31 111,454.34 91,257.84 71,547.39
Advances 253,727.66 216,365.90 181,205.60 218,310.85 225,616.08 195,865.60 146,163.11

xxxiv
Fixed Assets 4,614.69 4,744.26 3,212.69 3,801.62 4,108.90 3,923.42 3,980.71
Other Assets 19,942.90 16,791.88 19,682.04 24,712.26 21,196.67 17,144.26 13,327.24 Miscellaneous Expenditure not written off 0 0 0 0 0 0 0
Others 0 0 0 0 0 0 0
TOTAL ASSETS 474,074.60 406,678.08 363,866.83 379,849.60 400,417.12 345,312.44 252,058.67
Contingent Liability 915,465.10 923,121.61 727,084.06 834,683.00 1,211,082.33 562,959.91 395,033.67
Bills for collection 7,572.06 8,530.03 6,474.95 6,000.44 4,278.28 4,046.56 4,338.46
Profit and Loss Account of ICICI Bank Ltd.
(Rs. In Crores)
Year 2011-12 2010-11 2009-10 2008-09 2007-08 2006-07 2005-06
INCOME :
Interest Earned 33,542.65 25,974.05 25,706.93 31,092.55 30,788.34 21,995.59 14,306.13
Other Income 7,502.76 6,647.90 7,477.65 8,176.26 8,878.85 6,962.95 5,062.22
Total 41,045.41 32,621.95 33,184.58 39,268.81 39,667.19 28,958.54 19,368.35
II. Expenditure
Interest expended 22,808.50 16,957.15 17,592.57 22,725.94 23,484.24 16,358.50 9,597.45 Payments to/Provisions for Employees 3,515.28 2,816.93 1,925.79 1,971.71 2,078.90 1,616.75 1,082.29 Operating Expenses & Administrative Expenses 1,925.30 1,815.42 1,770.03 1,952.99 1,922.20 1,510.44 1,126.66
Depreciation 524.53 562.44 619.5 678.6 578.35 544.78 623.79 Other Expenses, Provisions & Contingencies 3,474.47 3,712.30 5,934.37 6,825.60 6,550.40 5,283.03 3,844.55
Provision for Tax 2,187.42 2,138.11 1,597.78 1,793.31 1,569.53 944.32 661.87
Fringe Benefit tax 0 0 0 34.2 39.2 36.93 26.35
Deferred Tax 144.65 -531.78 -280.44 -471.67 -713.36 -446.43 -134.68
Total 34,580.15 27,470.57 29,159.60 35,510.68 35,509.46 25,848.32 16,828.28
III. Profit & Loss
Reported Net Profit 6,465.26 5,151.38 4,024.98 3,758.13 4,157.73 3,110.22 2,540.07
Balance Sheet of Wipro Ltd.
(Rs. In Crores)
Year 2011-12 2010-11 2009-10 2008-09 2007-08 2006-07 2005-06
SOURCES OF FUNDS :
Share Capital 491.7 490.8 293.6 293 346.3 291.8 285.15
Reserves Total 23,860.80 20,829.40 17,396.80 12,220.40 11,260.40 9,025.10 6,135.30
Equity Share Warrants 0 0 0 0 0 0 0 Equity Application Money 0 0 1.8 1.5 4 3.5 0
Total Shareholders Funds 24,352.50 21,320.20 17,692.20 12,514.90 11,610.70 9,320.40 6,420.45
Secured Loans 1 9.6 0 0 4 23.2 45.06
Unsecured Loans 2,201.20 1,925.80 5,530.20 5,013.90 3,818.40 214.8 5.1
xxxv
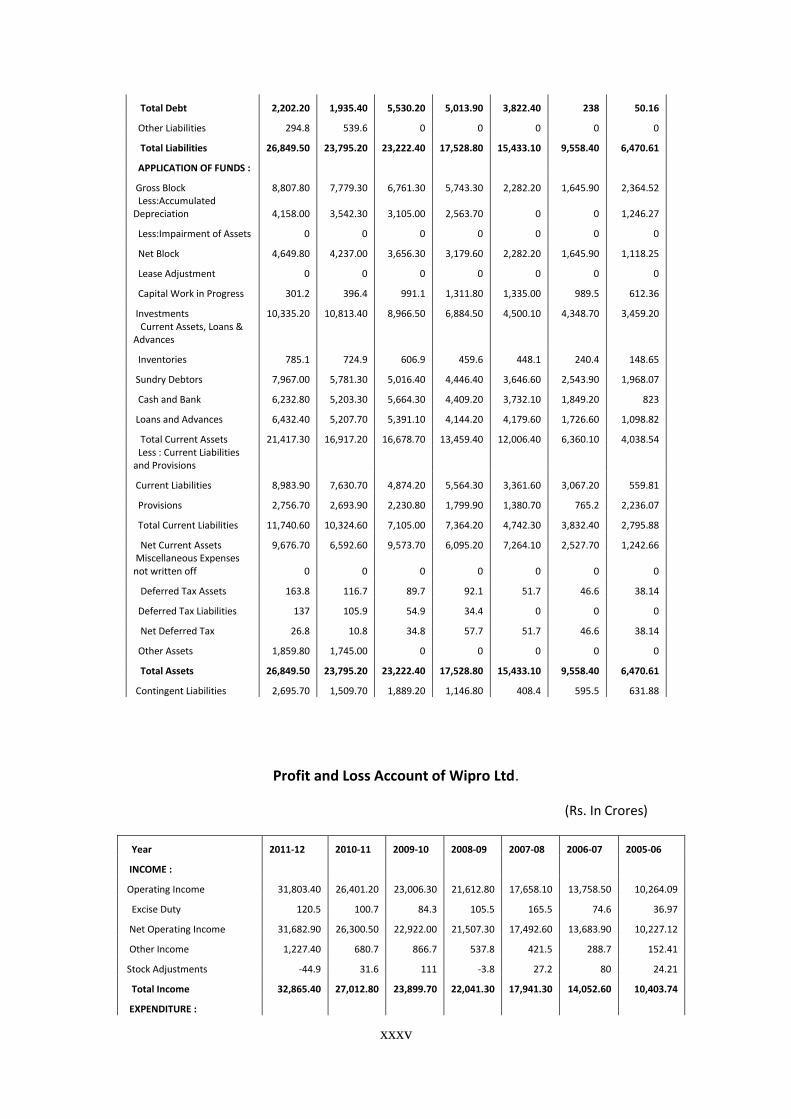
Profit and Loss Account of Wipro Ltd.
(Rs. In Crores)
Year 2011-12 2010-11 2009-10 2008-09 2007-08 2006-07 2005-06
INCOME :
Operating Income 31,803.40 26,401.20 23,006.30 21,612.80 17,658.10 13,758.50 10,264.09
Excise Duty 120.5 100.7 84.3 105.5 165.5 74.6 36.97
Net Operating Income 31,682.90 26,300.50 22,922.00 21,507.30 17,492.60 13,683.90 10,227.12
Other Income 1,227.40 680.7 866.7 537.8 421.5 288.7 152.41
Stock Adjustments -44.9 31.6 111 -3.8 27.2 80 24.21
Total Income 32,865.40 27,012.80 23,899.70 22,041.30 17,941.30 14,052.60 10,403.74
EXPENDITURE :
Total Debt 2,202.20 1,935.40 5,530.20 5,013.90 3,822.40 238 50.16
Other Liabilities 294.8 539.6 0 0 0 0 0
Total Liabilities 26,849.50 23,795.20 23,222.40 17,528.80 15,433.10 9,558.40 6,470.61
APPLICATION OF FUNDS :
Gross Block 8,807.80 7,779.30 6,761.30 5,743.30 2,282.20 1,645.90 2,364.52 Less:Accumulated Depreciation 4,158.00 3,542.30 3,105.00 2,563.70 0 0 1,246.27
Less:Impairment of Assets 0 0 0 0 0 0 0
Net Block 4,649.80 4,237.00 3,656.30 3,179.60 2,282.20 1,645.90 1,118.25
Lease Adjustment 0 0 0 0 0 0 0
Capital Work in Progress 301.2 396.4 991.1 1,311.80 1,335.00 989.5 612.36
Investments 10,335.20 10,813.40 8,966.50 6,884.50 4,500.10 4,348.70 3,459.20 Current Assets, Loans & Advances
Inventories 785.1 724.9 606.9 459.6 448.1 240.4 148.65
Sundry Debtors 7,967.00 5,781.30 5,016.40 4,446.40 3,646.60 2,543.90 1,968.07
Cash and Bank 6,232.80 5,203.30 5,664.30 4,409.20 3,732.10 1,849.20 823
Loans and Advances 6,432.40 5,207.70 5,391.10 4,144.20 4,179.60 1,726.60 1,098.82
Total Current Assets 21,417.30 16,917.20 16,678.70 13,459.40 12,006.40 6,360.10 4,038.54 Less : Current Liabilities and Provisions
Current Liabilities 8,983.90 7,630.70 4,874.20 5,564.30 3,361.60 3,067.20 559.81
Provisions 2,756.70 2,693.90 2,230.80 1,799.90 1,380.70 765.2 2,236.07
Total Current Liabilities 11,740.60 10,324.60 7,105.00 7,364.20 4,742.30 3,832.40 2,795.88
Net Current Assets 9,676.70 6,592.60 9,573.70 6,095.20 7,264.10 2,527.70 1,242.66 Miscellaneous Expenses not written off 0 0 0 0 0 0 0
Deferred Tax Assets 163.8 116.7 89.7 92.1 51.7 46.6 38.14
Deferred Tax Liabilities 137 105.9 54.9 34.4 0 0 0
Net Deferred Tax 26.8 10.8 34.8 57.7 51.7 46.6 38.14
Other Assets 1,859.80 1,745.00 0 0 0 0 0
Total Assets 26,849.50 23,795.20 23,222.40 17,528.80 15,433.10 9,558.40 6,470.61
Contingent Liabilities 2,695.70 1,509.70 1,889.20 1,146.80 408.4 595.5 631.88

xxxvi
Cost of Traded Software Packages 4,656.10 3,782.90 3,730.40 3,403.70 2,979.50 1,969.00 1,350.69
Operating Expenses 3,777.00 2,790.20 2,617.60 1,869.80 1,584.30 1,132.00 847.16
Employee Cost 13,311.50 10,937.40 9,093.80 9,282.60 7,409.10 5,768.10 4,271.52
Power/Electricity Charges 233.4 200.5 141.4 154 135.2 98.1 86.46 Selling and Administration Exp. 2,400.20 1,991.40 1,746.70 1,749.20 1,369.10 1,253.70 997.23
Miscellaneous Expenses 1,216.80 868.8 201.6 1,303.70 421.5 288.5 215.61 Less : Pre-operative Expenses Capitalised 0 0 0 0 0 0 0
Total Expenditure 25,595.00 20,571.20 17,531.50 17,763.00 13,898.70 10,509.40 7,768.67
Operating Profit 7,270.40 6,441.60 6,368.20 4,278.30 4,042.60 3,543.20 2,635.07
Interest 605.7 136 99.8 196.8 116.8 7.2 3.13
Gross Profit 6,664.70 6,305.60 6,268.40 4,081.50 3,925.80 3,536.00 2,631.94
Depreciation 746.1 600.1 579.6 533.6 456.1 359.8 292.26
Profit Before Tax 5,918.60 5,705.50 5,688.80 3,547.90 3,469.70 3,176.20 2,339.68
Tax 1,249.50 837.8 767.9 539.5 382.1 317.5 290.15
Fringe Benefit tax 0 0 0 40.6 29.4 23.9 22.77
Deferred Tax -16 24 22.9 -6 -5.1 -7.3 6.28
Reported Net Profit 4,685.10 4,843.70 4,898.00 2,973.80 3,063.30 2,842.10 2,020.48