Embed Size (px)
Citation preview

1
NiCE Working Paper 09-106
February 2009
Balanced Scorecard diffusion from a social network
perspective. The effects of interlocking directorates
on the use of balanced scorecard practices
Geert Braam
Lex Borghans
Nijmegen Center for Economics (NiCE)
Institute for Management Research
Radboud University Nijmegen
P.O. Box 9108, 6500 HK Nijmegen, The Netherlands
http://www.ru.nl/nice/workingpapers
2
Abstract
This study examines the influence of the social networks of the board of directors on the use
of Balanced Scorecard (BSC) practices. Combining insights from research on social networks
in management and literature on organizational innovativeness and accounting, our theoretical
framework suggests that interlocking directorates influence the likelihood of BSC use.
Modelling variation in the relationship between interlocking board members and making a
distinction between different ways of BSC use, we measured the effects of the interlock ties
of the executive and supervisory board members in a two-tier system on the use of the BSC as
a strategic performance measurement tool in companies’ annual reports. Using data from 149
companies listed on the Dutch stock exchange, our results suggest that director experience
with BSC practices on other boards influences firm’s use of the BSC. Firms with board
members who have experience with BSC practices in other firms they are associated with,
have a higher probability to use this strategic performance measurement tool in their own firm
too. Experience of the CEO is relevant for information disclosure about customers, while
members of the supervisory board, especially the chairman, seem to promote additional
information about internal business processes and learning and growth.
Direct correspondence to Geert Braam, Department of Economics, Radboud University
P.O. Box 9108, 6500 HK, Nijmegen, The Netherlands. Phone +31 24 3613086; E-mail
The authors express their thanks for comments and suggestions received on previous versions
of this paper from Jos Benders, Mahmoud Ezzamel, Paul Hendriks, Paula van Veen, the
participants at the EAA 2008 and the RACC conference 2008, and Annelien Arnouts, Andy
Defares and Mehment Akpolat for their research assistance.

3
1. Introduction
The Balanced Scorecard (BSC) is an important recent administrative innovation which is
supposed to allow top managers to better measure and manage their companies’ key
organizational processes resulting in an improved competitive market position and company
performance (Kaplan and Norton, 1992, 1996, 2001, 2004). Empirical evidence suggests that
this concept is widely used in large organizations in the United States and throughout Europe,
i.e. 20-30% of the larger firms investigated have adopted a BSC (Ittner, Larcker and Randall,
2003; Speckbacher, Bischof and Pfeiffer, 2003). However, as is the case with other
administrative innovations, the BSC lacks physical component and detailed implementation
instructions. As a consequence, this strategic performance measurement system is open to
multiple interpretations resulting in variation in the way this innovations is used in practice
(Malmi, 2001; Speckbacher, Bischof and Pfeiffer, 2003; Chenhall, 2005). It also suggests that
its implementation and use are complex, and the positive influence on organizational
performance uncertain (Ittner, Larcker and Randall, 2003; Davis and Albright, 2004; Ittner,
2008). To advance firm’s knowledge about the effectiveness of this innovation and its
competitive advantages, firm’s top management decision makers may want to obtain
additional information to decide whether to adopt and use the BSC. This information should
help to reduce uncertainty and risks associated with their decisions to implement this
innovation, and increase their understanding of how the tool might fit organization’s needs
and opportunities effectively. However, relatively little is known about which sources of
information influence a company’s decision to use this strategic performance measurement
system.
This paper focuses on the influence of interlocking directorates on administrative
innovativeness in general and on the BSC in particular. An interlocking directorate occurs
when a person affiliated with one organization sits on the board of directors of another
organization (Mizruchi, 1996). The social network literature emphasizes the role of board
interlocks as a source of inter organizational information exchange about potential and
effective innovative corporate practices (Carpenter and Westphal, 2001). From an
informational perspective, board interlocks are influential in corporate decision making and
control relative to other sources of information because of the trustworthy, credible, and
consequently persuasive nature of the information they convey (Useem, 1984; Haunschild,
1993; Mizruchi, 1996; Davis, 1996; Geletkanycz and Hambrick, 1997; Gulati and Westphal,
1999; Carpenter and Westphal, 2001; Rogers, 2003; Borgatti and Foster, 2003). However, in
accounting literature little attention has been paid to the influence of board interlock ties

4
among organizations through key decision makers of one organization sitting in the boards of
others on accounting innovativeness. It is not clear how a focal firm’s decisions are
influenced by exposure of their key decision makers to experiences of other organization
which made similar decisions.
In this paper we examine the influence of interlocking directorates on the use of the
BSC as a strategic performance measurement tool in the companies’ annual reports. We
investigate the role of the interlock ties of executive and supervisory board members in
supporting use of the BSC, and how this role was affected by the positions of the members in
the board. Directors often work for several firms, which allow them to bring experience from
one firm to another. Exposure to the experiences of other firms may provide them with
valuable information which they use in their own firm to influence organizational behaviour.
The idea of the paper is to identify the cross-firm diffusion of BSC practices, using
information of the interlocks of firms’ board of directors and their external auditors. We apply
this approach to companies in a small region, i.e. Dutch firms, since relatively small
communities are characterized by a high degree of interlocking relationships (Carroll and
Fennema, 2002). We use data from 149 companies listed on the Dutch stock market to
identify interlocking directorates and to assess use of the BSC as a strategic performance
measurement tool in the companies’ annual reports. Our results suggest that experiences of
board members with similar decisions in other companies affect firm’s use of the BSC. Firms
with board members who have experience with this strategic performance measurement tool
in other firms they are associated with, have a higher likelihood to use BSC practices in their
own firm too. Experience of the CEO is relevant for information disclosure about customers,
while members of the supervisory board, especially the chairman, seem to promote additional
information about internal business processes and learning and growth. The external auditor’s
experience matters for provision of information on financial aspects. These findings suggest
that the social networks in which firms are embedded profoundly influence their conduct and
use of particular organizational practices, stressing the importance to pay attention to the
influence of intra organizational and interpersonal relations next to economic and
organizational factors in driving organizational change.
This study is related to the literature in several ways. First, it is related to the
accounting literature and the social network research on management. Despite the fact that
management accounting research has investigated factors that affect accounting innovations
like ABC (Shields, 1995) and TQM (Westphal, Gulati and Shortell, 1997), little research has
been undertaken towards understanding the influence of social network ties of board members

5
on their decisions to use such administrative innovations. Social network literature, on the
other hand, emphasizes the role of social factors such as intra organizational and interpersonal
relations rather than economic and organizational factors in facilitating the spread of
innovations. From a network perspective board interlock ties to other firms are a form of
social capital that provides access to information that flows through the network. Board
interlocks have been found to influence many organizational practices, including governance
practices (Davis, 1991), merger and acquisition (Haunschild, 1993), organizational structures
(Palmer, Jennings and Zhou, 1993), and CEO compensation (Geletkanycz, Boyd and
Finkelstein, 2001). This study contributes to both types of literature by examining whether
and how board interlock ties facilitate administrative innovation diffusion, i.e. BSC usage.
Second, this study is related to the literature on interlocking directorates. Despite the
general assumption in empirical interlock research that all ties affect outcomes uniformly,
results show that some interlocks are more influential than others. Haunschild and Beckman
(1998) made a distinction between interlock partners in similar and dissimilar industries to
show that some interlocks are more influential than others. In this paper we specify and model
variation in the positions of the interlocking board members in a two-tier system, i.e.
executive and supervisory board members, to examine their differential influence on BSC
usage.
Third and closely related to the previous issue, this study adds to the literature on
administrative innovations (Rogers, 2003). In contrast to technical innovations that tend to be
determined by their tangible design and content, administrative innovation’s intangibility has
been found to lead to serious variation in its interpretation and use (e.g. Benders and Van
Veen, 2001). This study takes into accountant that under the same label, the BSC can and will
be used in different ways involving many different functional areas and strategic performance
indicators (Malmi, 2001; Olson and Slater, 2002; Speckbacher, Bischof and Pfeiffer, 2003;
Braam and Nijssen, 2004; Ax and Bjørnenak, 2005). We examine the influence of
heterogeneity among board interlocks on the use of the four measurement perspectives of the
BSC described by Kaplan and Norton (1992).
Finally, in spite of the fact that the primary focus of interlock research is on the effects
of direct network ties, empirical evidence suggests that indirect network ties – or third-party
ties – can also influence company’s decisions to use various organizational practices (Gulati
and Westphal, 1999). In this paper we study whether experiences of firm’s external auditor
with BSC practices in related firms influence company’s use of this accounting-based strategy
control tool. The auditor’s influence is indirect because the organizations’ top management

6
decision makers receive the information about BSC use in related firms second-hand. On the
other hand, the interlocks arguments should apply for the firm’s external auditor because the
auditor is exposed to innovative organizational practices in other firms and the auditor can use
this experience to influence company’s management and supervisory board on use of such
corporate practices.
The remainder of the article is structured as follows. First, we review related literature
and develop hypotheses regarding the influence of interlocking directorates on firm’s use of
BSC practices. Next the research method is described, and the results are presented and
discussed. Finally, we draw conclusions, discuss limitations of our study, and point out
directions for further research.
2. Literature review and development of hypotheses
The board of directors generally has a dominant position in shaping an organization’s strategy
and management control systems (Hambrick and Mason, 1984). The BSC offers them a
strategic management tool for describing and implementing corporate strategy using a
comprehensive set of financial and non-financial strategic performance measures covering the
measurement perspectives financial, customer, internal business, and learning and growth
orientation (Kaplan and Norton, 1992, 1996, 2001, 2004; Drew and Kaye, 2007). However,
like other administrative innovations, the BSC lacks detailed “product specifications”. As a
consequence, the tool can be and is used in different ways, which make its implementation
complex (Ahn, 2001; Malmi, 2001; Malina and Selto, 2001; Ax and Bjørnerak, 2005). In
addition, research shows that different ways of BSC use may have different effects on
company performance, i.e. BSC use that complements corporate strategy positively influences
company’s competitive position and company performance, while BSC use that is only
loosely related to the strategy may decrease it (Ittner, Larcker and Randall, 2003; Davis and
Albright, 2004; Braam and Nijssen, 2004; Chenhall, 2005; Ittner, 2008). As a result, firm’s
top management decision makers may want to obtain additional information to decide
whether and how to use this strategic performance measurement system. This information
should help to reduce uncertainty and risks associated with their decisions to implement and
use this innovation, and increase their understanding of how the tool might fit organization’s
needs and opportunities effectively.
The social network literature emphasizes the role of board interlocks as an influential
source of inter organizational information exchange about such potential effective innovative
corporate practices (Useem, 1984; Mizruchi, 1996; Davis, 1996; Carpenter and Westphal,

7
2001; Borgatti and Foster, 2003; Rogers, 2003). Exposed to the practices in other firms,
interlock ties to other firms are potentially influential channels to convey trustworthy, credible
and valuable information about other firms. They provide opportunities to share strategic
information and learn about innovations that might fit unique organizational needs and
opportunities (Geletkanycz and Hambrick, 1997; Haunschild and Beckman, 1998; Gulati and
Westphal, 1999; Carpenter and Westphal, 2001; Borgatti and Foster, 2003). Interlocks enable
board members to achieve a ‘business scan’ of latest business practices, observing innovative
practices in other firms, and witness firsthand the consequences of those practices (Useem,
1984). Moreover, direct contact with an innovator may help to clarify whether and how a
specific innovation might fit unique organizational needs and opportunities, thus reducing
uncertainty and risks associated with the innovation (Haunschild, 1993). For these reasons,
network research in management suggests that inter organizational and interpersonal network
ties are key antecedents to consider when explaining the spread of information about an
innovation across organizations and their effects on the adoption and use of organizational
innovations (Borgatti and Foster, 2003; Mizruchi, 1996; Rogers, 2003). Consequently, firms
that are interlocked with current adopters will be more likely to adopt and use themselves
(Rogers, 2003; Mizruchi, 1996). Related studies have used board interlocks to explain the
adoption of organizational innovations, including governance practices (Davis, 1991), merger
and acquisition (Haunschild, 1993), organizational structures (Palmer, Jennings and Zhou,
1993), and CEO pay premiums (Geletkanycz, Boyd and Finkelstein, 2001). This evidence
suggests that firms are more likely to make changes in their performance measurement
practices if their key decision makers have ties to leaders of other firms engaging in similar
innovative practices (Haunschild, 1993; Westphal and Zajac, 1997; Gulati and Westphal,
1999). Hence,
H1: BSC use in a firm is positively related to use of BSC practices in other companies to
which the firm is related via their board interlocks.
In empirical research on board interlocks all interlock ties were generally treated as
equal connections that facilitate the exchange of information between firms. However, the
governance literature suggests that interlocks may not uniformly affect outcomes.
Heterogeneity among board interlock members may affect the extent in which they convey
information and how they influence decisions about adoption and use of various
organizational practices (Haunschild and Beckman, 1998; Carpenter and Westphal, 2001;
Borgatti and Foster, 2003). In this paper we examine the influence of the interlocks of the

8
executive and supervisory board members in a two-tier structure on specific ways of use of
the BSC. In a two-tier structure the executive is responsible for the administration of the firm,
while the supervisory board is charged with monitoring and controlling management’s
decision making to protect shareholders’ interests. However, agency theory emphasizes that
the supervisory board is less well informed than the management board because the former
board wholly consists of outsiders. As a result, executive and supervisory board members,
who may have different goals and objectives, may differently affect the way of use of the
BSC as a strategic performance measurement system focusing on financial and non-financial
strategic performance indicators in different perspectives to realize their goals and objectives
(Drew and Kaye, 2007; Braam, Benders and Heusinkveld, 2007). Their exposures to the
experiences with similar decisions in other companies via their interlock ties may confirm and
enforce their decisions about how to use the BSC in a specific way. To uncover differential
effects, we investigate the effects of the interlock ties of executive and supervisory board
members on the use of the four measurement perspectives of the BSC described by Kaplan
and Norton (1992), as well as the influence of the interlocks of the CEO, the CFO, other
members of the executive board, the chairman of the supervisory board and the other
members of the supervisory board on company’s use of these perspectives. Hence,
H2: Use of the specific measurement perspectives of the BSC in a firm is positively related
to use of these perspectives in other companies to which the firm is related via their
board interlocks.
H3: The positive correlation of the use of the specific measurement perspectives of the
BSC in a firm with the use of these perspectives in others firms to which there is a
board interlock depends on the positions of members in the board.
3. Research method
3.1 Data
The data used in this paper were collected using two databases: (1) data on general firm
information and information about the interlock ties of executive and supervisory directors
and auditors from Osiris; (2) data on financial and non-financial strategic performance
indicators in companies’ annual reports from AnnualReports. These data were subsequently
merged yielding a complete data set.

9
We restricted our data to companies in a small region, i.e. Dutch companies since
relatively small communities are characterized by a high degree of interlocking relationships
(Mizruchi, 1996; Carroll and Fennema, 2002). The companies selected met the following
criteria: they were publicly listed on the NYSE Euronext Amsterdam in 2004, had their
headquarters in the Netherlands, and had a two-tier structure. Our sample comprises 149
Dutch companies.
For a comprehensive measurement system to be a BSC, it should contain financial and
non-financial strategic performance measures that cover the original four measurement
perspectives described by Kaplan and Norton (1992) (Malmi, 2001; Speckbacher, Bischof
and Pfeiffer, 2003). To assess a company’s use of the BSC as strategic performance
measurement system, we used publicly available data from annual reports. An important
advantage of these data is that we can assess the variety of ways how the firms selected
effectively use a comprehensive set of financial and non-financial strategic performance
measures. Measuring actual use of the BSC is important since the assessment of its formal use
may result in biased results (Ittner, Larcker and Randall, 2003). Companies that formally say
to have adopted such a tool may not effectively use it but may have adopted the tool for other
reasons like legitimacy (Westphal, Gulati and Shortell, 1997). In addition, firms that actually
use the BSC may not explicitly mention that they use this strategic performance measurement
system or use other names for similar practices (Chenhall, 2005).
3.2 Measurement of variables
3.2.1 Dependent variables
BSC usage as strategic performance measurement system was measured using a 68-item scale
adapted from Hoque and James (2000), Maltz, Shenhar and Reilly (2003), and Chenhall
(2005). The instrument comprised financial and non-financial strategic performance measures
covering the four scorecard perspectives described by Kaplan and Norton (1992), i.e.
financial, customer, internal business, and learning and growth orientation, using respectively
20, 17, 12 and 19 strategic performance indicators with dichotomous scales (‘yes’ or ‘no’).
Appendix A presents a full overview of the items used classified per perspective. Two
independent raters assessed the scores on these performance indictors using content analysis.
An indictor receives a score of ‘1’if the annual report provides relevant information about this
measure, otherwise ‘0’. To compute a standardized outcome for each of the four measurement
perspectives, the scores of each individual question referring to this information category
were added and divided by the number of questions. This results in a score between 0–1; 0

10
indicating a poor score on a BSC perspective, while an outcome of 1 implies excellence. For
each annual report assessed, the standardized outcomes for the perspectives were added and
divided by four to construct a measure for overall BSC usage. Figures 1–5 show the
distributions of the total BSC scores and the sub scores on the four BSC perspectives.
[Insert Figures 1–5]
3.2.2 Independent variables
The main independent variables of interest are the average and maximum total BSC scores
and the sub scores on the four BSC perspectives of the companies to which the firm is related
via the interlocks of the board of directors and its external auditor.
To identify the interlocking directorates we used the Osires data base which provides the
names of all board members in the firm in our sample, with their function within the firm.
After correcting differences in spelling of the name of the same person, we matched for each
board member within a firm, all the other firms in which this person was also a board
member. Based on these relationships, we calculated the average and maximum scores on the
four perspectives for a certain member in each of his/her related firms. These numbers thus
indicate the average and most extensive use in the annual report of a certain facet of the BSC
in any of the other firms of a board member.
To aggregate these outside experiences of all board members to figures on firm level, we
clustered the functions of the board member into five categories:
1) CEO;
2) CFO;
3) Other member of the board;
4) Chairman of the supervisory board;
5) Other member of the supervisory board.
Per firm, first, we assessed the average and maximum BSC scores for all these categories.
Second, we computed the average or the maximum scores for board members in the executive
board (1, 2, or 3) versus members of the supervisory board (4, 5). Third, we assessed the
average and maximum BSC experiences for the board of directors as a whole. For measuring
the interlock scores related to firm’s external auditor, we used a similar approach.
Finally, in our study measures are missing if firm’s board members or their auditor do
not have interlocks. To eliminate potential biases caused by these missing variables we
included dummy variables. These variables are equal to 1 if the board members and the
auditor of the focal firm do not have interlocks, otherwise 0. The dummy coefficients can be

11
interpreted as the effects of not having experience with the BSC in related firms on firm’s use
of the BSC. The average and maximum (sub) scores for BSC experiences in other firms can
be regarded as an estimate of the influence of interlocks among the firms that have interlock
ties (Allison, 2001: 13-14).
3.2.3 Control variables
We included the natural logarithm of total employees or total assets, and industry dummies as
control variables. The natural logarithm of total employees and/or total assets was included to
proxy for the size of the company. Contingency theory suggests that larger companies have to
provide more financial and non-financial information to meet the requirements and
expectations of their interested parties than their smaller counterparts. Consistently, empirical
evidences suggest that larger firms are more likely to use BSC practices than smaller firms
(Hoque and James, 2000; Speckbacher, Bischof and Pfeiffer, 2003). The industry dummies
were included to control for industry effects on BSC use.
3.3 Analysis
To asses the effects of interfirm network ties on the use of BSC practices, we used linear
regression analysis and the dummy variable adjustment method (Allison, 2001). The dummy
variable adjustment method produces optimal estimates for missing predictors in a regression
analysis in situations in which data about a variable are missing because the unobserved
values simply do not exist, i.e. the firm does not have board or auditor interlock ties (Allison,
2001: 125).
To check the robustness of our results, we performed similar regression analyses with
different measures of BSC use, i.e. average and maximum total BSC scores and the sub scores
in the four perspectives, and different control variables.
4. Results
Table 1 presents the distribution of the sample firms across industry – using the 2-digit SIC
codes – and size, and shows the number of positions of the executive and supervisory board
members in their own company and in other firms they are associated with.
[Insert Table 1]
Table 2 presents the correlation between total BSC score and the sub scores on the
four perspectives with and without correction for size effects. Tables 2 shows that the
correlations between the total BSC score and the sub scores with and without correction for

12
size effects ranged from respectively 0.512 and 0.439 for the financial perspective to 0.846
and 0.830 for the learning and growth perspective, indicating acceptable internal levels of
consistency.
[Insert Table 2]
The results in Table 3 panel A and B provide support for hypothesis H1, which
predicts that BSC use in a firm is positively related to use of BSC practices in other
companies to which the firm is related via their board interlocks. Using both the average and
maximum total BSC scores of the interlocking firms as measures of the experience of the
board of directors with BSC practices in the related firms, the results are consistently positive
and significant. These findings suggest that interfirm network ties of board members
positively affect company’s use of the BSC. However, no significant influence was found of
the experiences of the external auditor with use of the BSC in related firms on firm’s use of
this strategic measurement tool.
In addition, the analyses in the panels A and B also show that the results are robust.
The relationships between a firm’s use of the BSC and the average and maximum experiences
of the board of directors with BSC practices in related firms are consistently positive and
significant when using different control variables. In the remainder of this study we use the
average BSC (sub) scores as the measure of the influence of interfirm network ties.
[Insert Table 3]
The results in Table 4 show support for hypothesis H2, which predicts a positive
relationships between use of the four specific measurement perspectives of the BSC in a firm
and use of these perspectives in firms to which the firm is related via its board interlocks. The
results show that the experiences of board members with use of the perspectives customer and
learning and growth in related firms is relevant for firm’s information disclosure in these
perspectives. In addition, the results show a significant influence of the experiences of the
external auditor with use of the financial perspective in related firms on firm’s information
disclosure in the financial perspective. These findings suggest that use of the perspectives
customer and learning and growth is directly related to experiences of board members with
use of these perspectives in related firms, while use of the financial perspective is indirectly
related through the interlock ties of the firm’s external auditor.
[Insert Table 4]
Table 5 presents the results regarding the relationship between firm’s use of specific
measurement perspectives of the BSC and the experiences of firm’s executive and
supervisory board members and its external auditor with use of these perspectives in other

13
firms they are associated with via their interlocks. These results show that experience of the
CEO is relevant for information disclosure about customers, whereas the chairman of the
supervisory board seems to promote additional information about internal business processes
and learning and growth. Experience of the other members of the supervisory board is also
relevant for information disclosure in the learning and growth perspective. The external
auditor’s experience matters for provision of information on financial aspects, while the
interlock ties of the other members of the supervisory board negatively moderate this effect.
No significant influence was found of the board interlock ties of the CFO and other members
of the executive board on specific BSC use. Consequently, these findings provide partial
support for H3, which predicts that the positive correlations of the use of specific
measurement perspectives of the BSC in a firm with the use of these perspectives in others
firms to which there is a board interlock depend on the positions of members in the board.
The findings suggest that the interlock ties of the CEO, the chairman of the supervisory board
and the other members of the supervisory board influence strategic performance measurement
in the customer perspective and information disclosure about internal business processes and
innovation. Disclosure of information in the financial perspective is positively related to use
of this perspective in other companies to which the firm is indirectly related through
interlocks ties of its external auditor, while experiences of the other members of the
supervisory board negatively affect this relationship.
[Insert Table 5]
5. Conclusion and Discussion
This paper has investigated the role of the social networks of the board of directors in
supporting BSC use, and how this role was affected by the positions of the members in the
board. Consistent with our general expectations, our findings show that director experience on
other boards does affect decision making about strategic performance measurement. Firms
with board members who have experience with BSC practices in other firms they are
associated with, have a higher probability to use the BSC in their own firm too. Members of
the supervisory board, especially the chairman, seem to promote additional information about
internal business processes and innovation. Experience of the CEO is relevant for information
disclosure about customers, while the external auditor’s experience matters for provision of
information on financial aspects. These findings suggest that the social networks provide
access to intra organizational information that is important in driving organizational change.

14
The networks of relationships in which firms are embedded profoundly influence their
conduct and use of particular organizational practices. In addition, the results stress the
importance to pay attention to the influence of intra organizational and interpersonal relations
next to economic and organizational factors in explaining the diffusion of administrative
innovations like the BSC.
This study has several limitations. Two of these limitations are the use of cross
sectional data of a small community which limit the generalizability of our findings, and the
assumption made in the empirical part of paper that the members of the board of directors
uniformly affect the decisions to use the BSC. Regarding the latter, powerful actors in the
board may form dominant coalitions to control the decision making processes (Hambrick and
Mason, 1984; Zajac and Westphal, 1996; Golden and Zajac, 2001). Consequently, the
influence of social networks of some members of the board could be more influential than the
information from other interlock partners (Finkelstein, 1992). Another limitation of this paper
is its focus on the inter organizational social networks of the board of directors, ignoring the
contributions of other actors via intra organizational ties on the diffusion of BSC practices
(Mizruchi, 1996). Organizational actors like the managers at business and departmental levels
may influence BSC use as strategic performance measurement tool as well.
This study, which is exploratory in nature, leaves ample room for further research.
First, future research could test and expand the research model using larger national and
international samples to provide further insight into the external validity of the findings.
Second, further studies may look at the extent to which dominant coalitions within the board
of directors use their power and authority to influence the diffusion of organizational
innovations in general and accounting innovations in particular. Finally, the analysis
performed in this study could be complemented with the effects of indirect networks ties of
other groups of actors which potentially can influence the diffusion of particular
organizational practices. Increased understanding of the direct and indirect role of both inter
organizational and intra organizational social networks of the firm’s key decision makers on
the diffusion of innovative organizational practices may help to reap the benefits that Kaplan
and Norton promised in their writings.
References
Ahn, H. (2001). ‘Applying the balanced scorecard concept: an experience report’. Long
Range Planning, 34(4): 441-461.
Allison, P.D. (2001). ‘Missing data’. London: Sage Publications Inc.

15
Ax, C. and Bjørnenak, T. (2005). ‘Bundling and diffusion of management accounting
innovations – the case of the balanced scorecard in Sweden’. Management Accounting
Research, 16(1): 1-20.
Benders, J. and Van Veen, K. (2001). ‘What’s in a fashion? Interpretative viability and
management fashion’. Organization, 8(1): 33-53.
Borgatti, S.P. and Foster, P.C. (2003). ‘The network paradigm in organizational research:
a review and typology’. Journal of Management, 29(6): 911-1013.
Braam, G.J.M. and Nijssen, E.J. (2004). ‘Performance effects of using the balanced
scorecard: a note on the Dutch experience’. Long Range Planning, 37(4): 335-349.
Braam, G.J.M., Benders, J. and Heusinkveld, S.H. (2007). ‘The Balanced Scorecard in the
Netherlands; An analysis of its evolution using print-media indicators’. Journal of
Organizational Change Management, 20(6): 866-879.
Carroll. W. and Fennema, M. (2002). ‘Is there a transnational business community?’.
International Sociology, 17(3): 393-419.
Carpenter, M.A. and Westphal, J.D. (2001). ‘The strategic context of external network
ties: examining the impact of director appointments on board involvement in strategic
decision making’. Academy of Management Journal, 44(4): 639-660.
Chenhall, R.H. (2005). ‘Integrative strategic performance measurement systems, strategic
alignment of manufacturing, learning and strategic outcomes: an exploratory study’.
Accounting, Organizations and Society, 30(5): 395-422.
Davis, G.F. (1991). ‘Agents without principles? The spread of the poison pill through the
inter corporate network’. Administrative Science Quarterly, 36(4): 583-613.
Davis, G.F. (1996). ‘The significance of board interlocks for corporate governance’.
Corporate Governance, 4: 154-159.
Davis, S. and Albright, T. (2004). An investigation of the effect of Balanced Scorecard
implementation on financial performance’. Management Accounting Research, 15(2):
135-153.
Drew, S.A. and Kaye, R. (2007). ‘Engaging boards in corporate direction-setting strategic
scorecards’. European Management Journal, 25(5): 539-369.
Finkelstein, S. (1992). ‘Power in top management teams: dimensions, measurement, and
validation’. The Academy of Management Journal, 35(3): 505-538.

16
Geletkanycz, M.A. and Hambrick, D.C. (1997). ‘The external ties of top executives:
implications for strategic choice and performance’. Administrative Science Quarterly,
42(4): 654-681.
Geletkanycz, M.A., Boyd, B.K. and Finkelstein, S. (2001). ‘The strategic value of CEO
external directorate networks: implications for CEO compensation’. Strategic
Management Journal, 22(9): 889-924.
Golden, B.R. and Zajac, E. (2001). ‘When will board influence strategy? Inclination x
power = strategic change’. Strategic Management Journal, 22: 1087-1111.
Gulati, R. and Westphal, J.D. (1999). ‘Cooperative or controlling? The effect of CEO-
board relations and the content of interlocks on the formation of joint ventures’.
Administrative Science Quarterly, 44(3): 473-506.
Hambrick, D.C. and Mason, P.A. (1984). ‘Upper echelons: the organization as a reflection
of its top management’. Academy of Management Review, 9(2): 193-206.
Haunschild, P.R. (1993). ‘Interorganizational imitation: the impact of interlocks on
corporate acquisition activity’. Administrative Science Quarterly, 38(4): 564-592.
Haunschild, P.R. and Beckman, C.M. (1998). ‘When do interlocks matter: alternative
sources of information and interlock influence’. Administrative Science Quarterly, 43(4):
815-845.
Hoque, Z. and James, W. (2000). ‘Linking balanced scorecard measures to size and
market factors: impact on organizational performance’. Journal of Management
Accounting Research, 12(1): 1-15.
Ittner, C.D. (2008). ‘Does measuring intangibles for management purposes improve
performance? A review of the evidence’. Accounting and Business Research, 38(3): 261-
272.
Ittner, C.D., Larcker, D.F. and Randall, T. (2003). ‘Performance implications of strategic
performance measurement in financial services firms’. Accounting, Organizations and
Society, 28(7-8): 715-741.
Kaplan, R.S. and Norton, D.P. (1992). ‘The Balanced Scorecard: measures that drive
performance’. Harvard Business Review, 70(1): 71-79.
Kaplan, R.S. and Norton, D.P. (1996). ‘The Balanced Scorecard: translating strategy into
action. Boston, MA: Harvard Business School Press.
Kaplan, R.S. and Norton, D.P. (2001). The Strategy-Focused Organization. Boston, MA:
Harvard Business School Press.

17
Kaplan, R.S. and Norton, D.P. (2004). Strategy maps: converting intangibles assets into
tangible outcomes. Boston, MA: Harvard Business School Press.
Malina, M.A. and Selto, F.H. (2001). ‘Communicating and controlling strategy: an
empirical study of the effectiveness of the balanced scorecard’. Journal of Management
Accounting Research, 13(1): 47-90.
Malmi, T. (2001). ‘Balanced scorecards in Finnish companies: A research note’.
Management Accounting Research, 12(2): 207-220.
Maltz, A.C., Shenhar, A.J. and Reilly, R.R. (2003). ‘Beyond the balanced scorecard.
Refining the search for organizational success measures’. Long Range Planning, 36: 187-
204.
Mizruchi, M.S. (1996). ‘What do interlocks do? An analysis, critique and assessment of
research on interlocking directorates’. Annual Review of Sociology, 22: 271-298.
Olson, E.M. and Slater, S.F. (2002). ‘The balanced scorecard, competitive strategy, and
performance’. Business Horizons, May-June: 11-16.
Palmer, D.A., Jennings, P.D. and Zhou, X. (1993). ‘Late adoption of the multidivisional
form by large U.S. corporations: institutional, political an economic accounts’.
Administrative Science Quarterly, 38(1): 100-131.
Rogers, E.M. (2003). Diffusion of innovations. New York, NY: Free Press, 5th
edition.
Shields, M.D. (1995). ‘An empirical analysis of firms’ implementation experiences with
activity-based costing’. Journal of Management Accounting Research, 7: 148.
Speckbacher, B., Bischof, G.J. and Pfeiffer, T. (2003). ‘A descriptive analysis on the
implementation of Balanced Scorecards in German-speaking countries’. Management
Accounting Research, 14(4): 361-387.
Useem, M. (1984). The inner circle. New York: Oxford University Press.
Westphal, J.D., Gulati, R. and Shortell, S.M. (1997). ‘Customizing or conformity? An
institutional and network perspective on the content and consequences of TQM adoption’.
Administrative Science Quarterly, 42(2): 366-394.
Westphal, J.D. and Zajac, E.J. (1997). ‘Defections from inner circle; social exchange,
reciprocity, and the diffusion of board interdependence in U.S. corporations’.
Administrative Science Quarterly, 42(1): 161-183.
Zajac, E.J. and Westphal, J.D. (1996). ‘Director reputation, CEO-board power, and the
dynamics of board interlocks’. Administrative Science Quarterly, 41(3): 507-529.

18
Figure 1 Distribution of the total BSC scores
1,000,800,600,400,200,00
Frequency
25
20
15
10
5
0
Mean =0,48�Std. Dev. =0,128�
N =149
Figure 2
Distribution of BSC scores on the customer perspective
0,800,600,400,200,00
Frequency
20
15
10
5
0
Mean =0,36�Std. Dev. =0,19�
N =149

19
Figure 3
Distribution of the BSC scores on the internal business perspective
1,000,800,600,400,200,00
Frequency
30
20
10
0
Mean =0,42�Std. Dev. =0,168�
N =149
Figure 4
Distribution of the BSC scores on the learning and growth perspective
1,201,000,800,600,400,200,00
Frequency
25
20
15
10
5
0
Mean =0,54�Std. Dev. =0,198�
N =149

20
Figure 5
Distribution of the BSC scores on the financial perspective
1,201,000,800,600,400,200,00
Frequency
40
30
20
10
0
Mean =0,61�Std. Dev. =0,166�
N =149

21
Table 1 Sample characteristics
Panel A: Firm characteristics
Industry Number Company size
of firms No of employees Assets per employee
mean sd mean sd
Mining and construction 8 24875 37994 274 403
Manufacturing 68 13284 38112 220 221
Transportation and communication 16 15464 37940 4551 10790
Wholesale trade 15 10661 13941 185 220
Retail trade 11 25540 45147 3648 3142
Finance and Insurance 31 11501 39340 260 734
Total 149 14410 36724 946 3871
Panel B: Number of positions of the executive and supervisory board members in own and
other firms they are associated with
Number of board positions in
related firms
Board positions Total No positions in
other firms in
data set 1 2 3 ≥4
CEO 156 135 13 4 2 2
CFO 145 143 2 0 0 0
Other members of
the board of
directors
430 407 19 4 0 0
Chairman of the
supervisory board
150 104 19 16 11 0
Other members of
the supervisory
board
450 315 72 38 22 3
Total 1331 1104 125 62 35 5

22
Table 2
Correlation between the total BSC Score and the sub scores on the four perspectives, with and without correction for size effects
Panel A: Pearson correlation coefficients without correction for size effects
Total Customer Internal-processes Learning and
growth
Financial
Total 1.000
Customer .731*** 1.000
Internal-processes .722*** .374*** 1.000
Learning and growth .846*** .449*** .636*** 1.000
Financial .512*** .201** .035 .266*** 1.000
Panel B: Pearson correlation coefficients with correction for size effects
Total Customer Internal-processes Learning and
growth
Financial
Total 1.000
Customer .688*** 1.000
Internal-processes .710*** .323*** 1.000
Learning and growth .830*** .382*** .610*** 1.000
Financial .439*** .101 -.041 .185** 1.000
*** = p < 0.01 (2-tailed); **= p<0.05 (2-tailed); *= p<0.10 (2-tailed)

23
Table 3
Relationship between the total BSC score and the average and maximum experience of board members and auditors with the BSC in other firms they are associated with
Panel A: Relationships based on average experience
1 2 3
Constant .083 .795 .095 0.855 .127 1.070
Average experience of board
members with the BSC in related
firms
.339 2.631** .345 2.642*** .336 2.633***
No board member in other firms .149 2.173** .152 2.190** .150 2.190**
Average experience of auditor
with the BSC in related firms
.189 0.972 .189 0.972 .219 1.126
No auditor in other firms .049 .493 .051 0.508 .073 .723
Ln(employees) .019 3.909*** .021 2.724** .020 4.178***
Ln(Assets) -.002 -0.323
Sector dummies
No No Yes
F-statistic 9.053*** 7.515*** 4.895***
Adj. R² .214 .209 .240

24
Table 3 (Continued)
Panel B: Relationships based on maximum experience
1 2 3
Constant .128 1.351 .142 1.389 .162 1.465
Maximum experience of board
members with the BSC in related
firms
.264 2.521** .271 2.540** .279 2.681***
No board member in other firms .122 1.993** .125 2.018** .129 2.147**
Maximum experience of auditor
with the BSC in related firms
.162 .854 .164 .857 .203 1.070
No auditor in other firms .038 .387 .040 .408 .065 .660
Ln(employees) .018 3.650*** .020 2.638*** .019 3.873***
Ln(Assets) -.003 -.373
Sector dummies No No Yes
F-statistic 8.935*** 7.424*** 4.939***
Adj. R² .211 .207 .242
*** = p < 0.01 (2-tailed); **= p<0.05 (2-tailed); *= p<0.10 (2-tailed)

25
Table 4
Relationship between the scores on the specific measurement perspectives of the BSC and the average experience of the board members and the external auditor with these
perspectives in other firms they are associated with
Customer Internal Business Learning and Growth Financial
Constant .096 .918 .203 1.703* .065 .478 .211 1.754*
Average experience of board members with
specific BSC perspective
.271 1.947* .070 .557 .379 2.862*** .003 .363
No board member in other firms .097 1.532 .016 .248 .202 2.383** -.024 -.261
Average experience of the auditor with
specific BSC perspective
-.208 -.931 .206 .865 .206 .945 .023 2.491**
No auditor in other firms -.035 -.380 .007 .062 -.016 -.119 .284 2.365**
Ln(employees) .030 4.159*** .014 2.142** .021 2.763*** .013 1.990**
F-statistic 5.237*** 2.509** 6.611*** 5.376***
Adj. R² .125 .049 .159 .129
*** = p < 0.01 (2-tailed); **= p<0.05 (2-tailed); *= p<0.10 (2-tailed)

26
Table 5
Relationship between the total BSC score and the scores on the specific measurement perspectives of the BSC and the average experience of the executive and supervisory
board members and the external auditor with the BSC and its specific perspectives in other firms they are associated with
Total BSC score Scores on the specific measurement perspectives of the BSC
Customer Internal Business Learning and growth Financial
Constant -.414 -1.345 -.250 -.808 .051 .109 -.457 -.813 .118 .297
Average experience of the CEO with
specific BSC perspective
.293 1.245 .416 1.868* .210 .904 .093 .418 .000 .007
Average experience of the CFO with
specific BSC perspective
.643 .880 .135 .079 .544 .353 .391 .352 .027 .876
Average experience of the other
executive board members with
specific BSC perspective
-.111 -.421 .009 .030 -.245 -.799 .283 1.146 .006 .446
Average experience of the chairman of
supervisory board with specific BSC
perspective
.360 2.391** .072 .383 .306 1.912* .469 2.955*** .003 .441
Average experience of the other
supervisory board members with
specific BSC perspective
.196 1.359 .210 1.392 -.214 -1.554 .272 1.789* -.020 -1.233**
No CEO in other firms .139 1.112 .182 1.469* -.031 -.293 .063 .443 .014 .062
No CFO in other firms .324 1.151 .164 .623 .342 .765 .110 .194 .245 .714
No other executive board member in
other firms
-.025 -.188 .044 .374 -.108 -.0799 .223 1.430 .106 .650
No chairman of supervisory board in
other firms
.170 2.131** .026 .324 .138 1.821* .244 2.398** .010 .095
No other supervisory board member in
other firms
.060 .778 .017 .250 -.115 -1.633 .127 1.337 -.303 -1.605**
Average experience of auditor with
specific BSC perspective
.144 .743 -.218 -.955 .188 .773 .111 .458 .264 2.249**
No auditor in other firms .029 .287 -.024 -.250 .002 .017 -.081 -.552 . 021 2.031**
Ln(employees) .018 3.439*** .029 3.658*** .006 .830 .021 2.595** .017 2.372**
F-statistic 4.375*** 2.668*** 2.443*** 3.190*** 2.950***
Adj. R² .229 .112 .161 .146
*** = p < 0.01 (2-tailed); **= p<0.05 (2-tailed); *= p<0.10 (2-tailed)
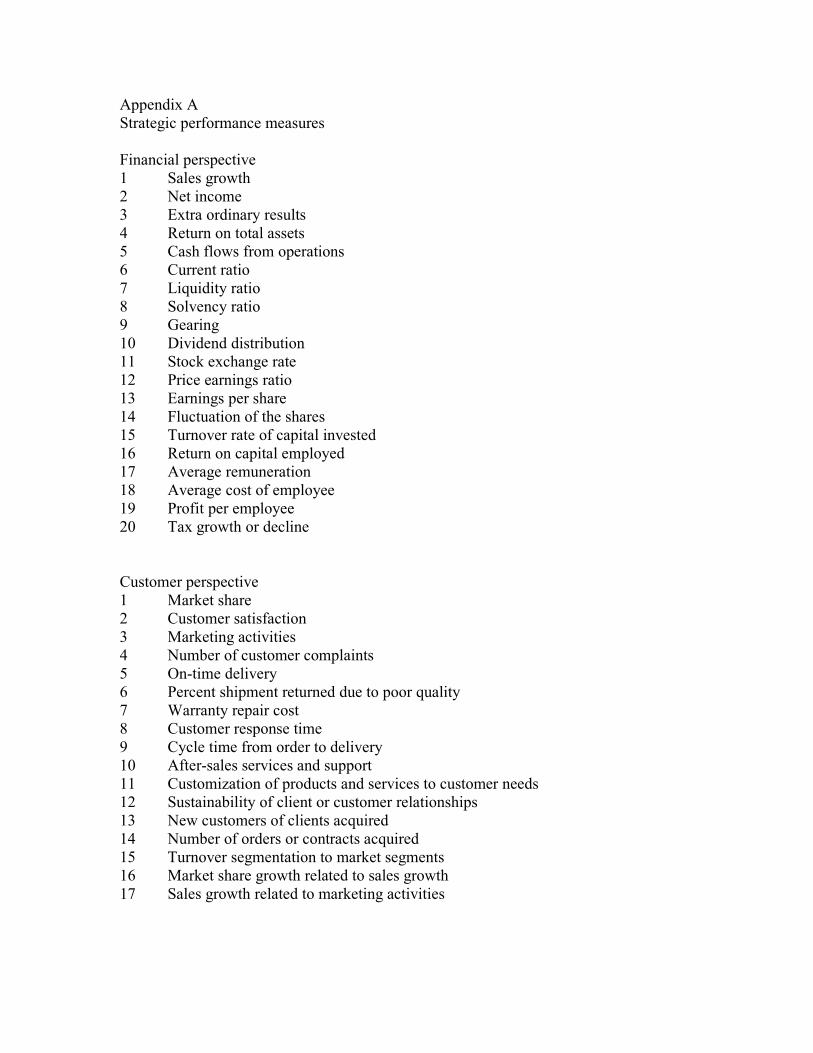
Appendix A
Strategic performance measures
Financial perspective
1 Sales growth
2 Net income
3 Extra ordinary results
4 Return on total assets
5 Cash flows from operations
6 Current ratio
7 Liquidity ratio
8 Solvency ratio
9 Gearing
10 Dividend distribution
11 Stock exchange rate
12 Price earnings ratio
13 Earnings per share
14 Fluctuation of the shares
15 Turnover rate of capital invested
16 Return on capital employed
17 Average remuneration
18 Average cost of employee
19 Profit per employee
20 Tax growth or decline
Customer perspective
1 Market share
2 Customer satisfaction
3 Marketing activities
4 Number of customer complaints
5 On-time delivery
6 Percent shipment returned due to poor quality
7 Warranty repair cost
8 Customer response time
9 Cycle time from order to delivery
10 After-sales services and support
11 Customization of products and services to customer needs
12 Sustainability of client or customer relationships
13 New customers of clients acquired
14 Number of orders or contracts acquired
15 Turnover segmentation to market segments
16 Market share growth related to sales growth
17 Sales growth related to marketing activities

1
Internal business perspective
1 Manufacturing lead-time
2 Order delivery time
3 Use of quality control systems (like TQM)
4 Dropout rates and waste
5 Staff competency requirements
6 Safety requirements
7 Capacity utilization
8 Labour efficiency variance
9 Material efficiency variance
10 Cost reduction of operational processes
11 Efficiency of logistics
12 Percentage defective products shipped
Learning and growth perspective
1 Introduction of new products or services
2 Number of new patents of licenses
3 Time to market of new products
4 Influence of changing market conditions
5 Influence of changing technological conditions
6 Changes in product design
7 Investments in research and development
8 Speed development of new products
9 Employee growth
10 Employee segmentation
11 Training programs
12 Hours of employee (re)training
13 Employee satisfaction
14 Employee tenure
15 Employee remuneration policy
16 Sickness and absence policy
17 Qualified leadership
18 Knowledge sharing systems
19 Interactive control systems


![Interlocking Principles[1]](https://img.pdfslide.net/doc/110x75/577ccd121a28ab9e788b6c16/interlocking-principles1.jpg)