Embed Size (px)
Citation preview
1
Balancing operating theatre and bed capacity in a
cardiothoracic centre
John Bowers
Stirling Management School, University of Stirling, Stirling FK9 4LA, United
Kingdom
e-mail address: [email protected]
Tel: +44 1786 467377; fax: +44 1786 467329
Abstract
This paper examines the balance between operating theatre and bed capacity in a
specialist facility providing elective heart and lung surgery. The capacity of the
whole facility is determined by the availability of operating theatre time and
Intensive Care beds: without both resources surgery has to be postponed.
Although the admissions can be managed, there are significant stochastic
components, notably the cancellation of theatre procedures and patients’ length of
stay on the Intensive Care Unit. A simulation was constructed to explore the
interdependencies of resource availabilities and the daily demand. The model was
developed with clinical and management staff to explore options for expanding
the capacity of the whole facility. Ideally the bed and theatre capacity should be
well balanced but unmatched increases in the capacity of either resource can still
be beneficial. The study provides an example of a capacity planning problem in
which there is uncertainty in the demand and availabilities of two symbiotic
resources.
Keywords: OR in health services; intensive care; staff scheduling; simulation
1. Background
The Heart and Lung Centre (HLC) at the Golden Jubilee National Hospital was
established in 2008 as specialist National Health Service (NHS) facility for
cardiac and thoracic surgery. A key component is the Intensive Care Unit (ICU)
which is essential for many patients undergoing the specialist procedures at the
HLC. A distinguishing feature of this ICU is that the large majority of the activity
is elective: a patient’s surgery can only proceed if there is both operating theatre
time and an ICU bed available otherwise it is postponed to another day. Capacity
planning for surgical specialties often focuses on the operating theatres: the beds
are regarded as a secondary resource requirement that seldom constrains the
overall capacity (Guerriero, 2011). However, capacity in a facility such as the
HLC depends on the balance of operating theatre and ICU bed availability. The
formation of the HLC involved a transfer of staff and resources from a variety of
hospitals, with a reorganisation of working practices. The new centre was unable
to meet demand, resulting in significant waiting lists; this study examined the
options for enhancing the capacity of the HLC.
2
Cardiac and thoracic surgery have a high profile and their waiting lists attract
particular attention. However, the services are also expensive, especially since
many patients require an ICU stay involving 24 hour care from a dedicated nurse.
Given typical working patterns this implies 5.9 nurses for every bed though this
ratio varies depending on local conditions and the physical layout of the ICU. In
addition to the dedicated ICU nurse the need for other support and supervisory
staff, and specialised equipment all add to the cost of care in an ICU.
2. Modelling ICU’s and the balance of resources
The need for rigorous analysis when planning Intensive or Critical Care Units is
reflected in the many operational research studies of subject. Most ICU’s have to
cope with a large stochastic demand generated by emergency admissions, and
simulation is often employed as the prime analytical tool (Kim, 1999; Kim &
Horowitz, 2000; Ridge et al., 1998; Kolker, 2009; Griffiths et al., 2005; Mallor &
Azcárate, 2011). Even though some patients may have undergone elective
surgery, their ICU stay is often not anticipated: the nature of their surgery may
imply the chance of an ICU stay but effectively this flow of patients is modelled
as stochastic, though with a weekly mean arrival pattern reflecting typical theatre
activity (Griffiths et al., 2005; Griffiths et al., 2010; Shahani et al., 2008). Other
studies (Vanberkel et al., 2010) may assume that surgery will not be postponed
due to a lack of a bed but this is a very real possibility in the HLC. In the HLC,
the elective surgery is characterised by a very high proportion of the patients
requiring at least a short ICU stay: a surgical procedure will only begin if an ICU
bed is available. While long delays would not be acceptable, surgery can often be
postponed for a few days providing some scope to manage admissions.
Synchronising the use of operating theatre time and ICU beds is a major
organisational challenge at the HLC: both are expensive (ISD Scotland, 2011) and
need to be well managed. Although much of the HLC activity can be planned,
theatre procedures may be cancelled for a variety of reasons and a patient’s length
of stay on the ICU is highly variable and unpredictable. This introduces a
significant stochastic element and adds to the management challenge.
Capacity planning studies often consider the trade-off between service level and
the utilisation of one dominant resource, as when considering ICU bed provision
and the implications for rejecting or diverting patients (Kim, 1999). Many models
do not include crucial management responses to demand; in reality there may be
opportunities to manage admissions, as in the HLC, or expedite patient transfer or
discharge of patients. Ignoring such management responses can lead to
overestimates of the capacity requirements (Costa et al., 2003). In some units,
there may be the possibility to expedite the transfer of some patients out of the
ICU if occupancy levels are high, or extending the stay when occupancy is low
(Mallor & Azcárate, 2011). Such responses were not identified at the HLC,
though further investigation could be useful. Another study incorporating
management responses considered the possibility of revising the schedules of the
operating theatres feeding the ICU (Kolker, 2009), producing a smoother flow of
activity that improved the service levels, assuming a fixed bed capacity. The
HLC has to manage both ICU bed stay and operating theatre time, striving to
achieve a balance between the utilisation of these expensive, scarce resources and
the overall service level.
3
3. Referrals and Length of stay
A key component of demand for the HLC was the number of referrals for surgery.
However, estimates of elective referrals require some caution and simply using
historic admissions to the HLC as a measure of demand can be misleading;
treatment may be postponed either as a result of a lack of capacity or the personal
characteristics and preferences of the patient. This problem can be avoided by
using longer time series but changes in practice may cast some doubt about the
relevance of older data. The problem was aggravated at the HLC since it had only
been operational for a relatively short time and referral practices were still
evolving. At the time of the study, ICU admissions were typically 25-30 per
week, with 90% coming from cardiac surgery. Increases in some waiting lists
suggested that additional capacity was required. The data quoted in throughout
this paper should be regarded as illustrative of an early phase of the development
of the new HLC; practice has evolved and the data do not necessarily reflect
current experience at the HLC.
The other component of demand for the ICU is the length of stay. This is highly
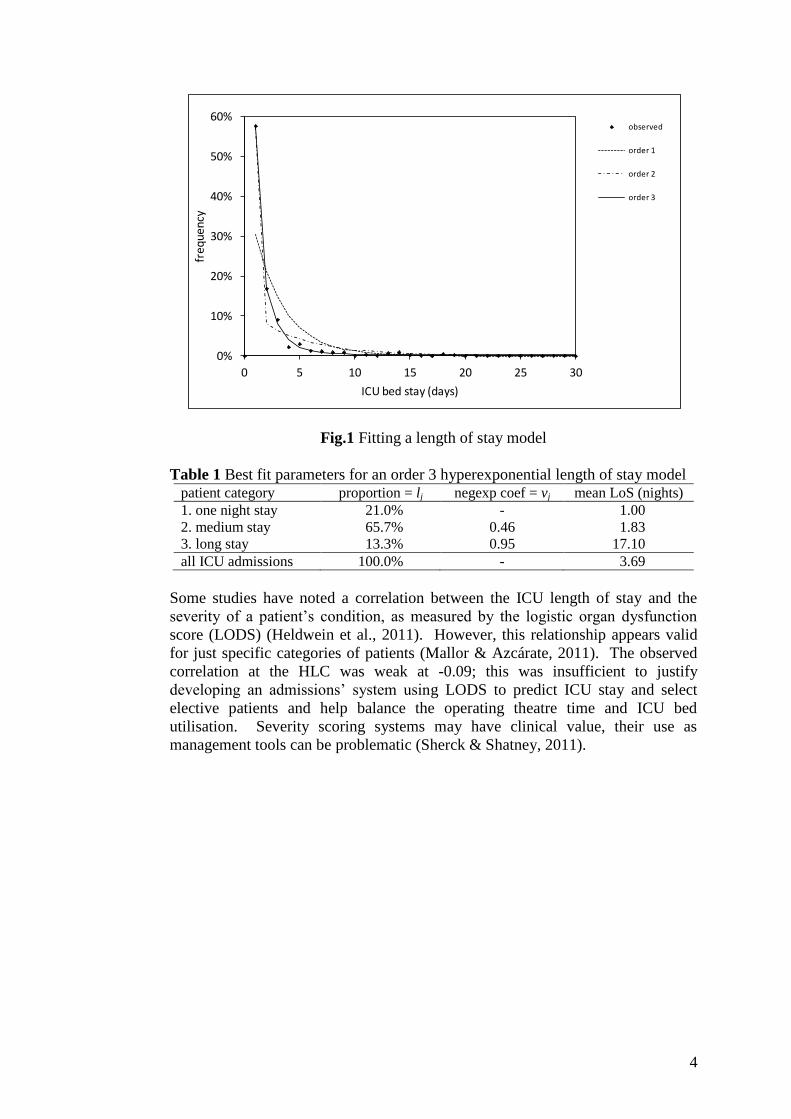
variable, as illustrated by the empirical distribution of patients’ ICU stay in Fig.1
based on 758 observations; many patients just spend 1 day in an ICU bed but
stays of 2-5 days are common and a few patients require 10-50 days in the ICU.
Similar distributions have been noted in other ICU’s, particularly where the
admissions include elective patients (McManus et al., 2004; Griffiths et al., 2005).
Hyperexponential distributions have been successfully employed in modelling
length of stay in diverse healthcare systems ranging from labour wards (Harper et
al, 2012) to geriatrics (McClean & Millard, 2003). The simplest form is the order
1 exponential distribution (Litvak et al., 2008) and this provides an approximate
but imperfect fit to the HLC length of stay data, as illustrated in Fig.1. However,
it has been suggested that while an exponential distribution can provide a
reasonable fit for emergency ICU stay it is not appropriate for elective patients
(Kim, 1999). In the current application, an order 2 hyperexponential model offers
some improvement but an order 3 model provides a significantly better fit, as
illustrated in Fig.1. The best fit parameters for the proportions and negative
exponential coefficients are included in Table 1. This length of stay model
suggests three categories of patients, relating well to clinicians’ practical
distinctions (Vasilakis & Marshall, 2005). The patients in the third category
deserve particular attention: the relatively high probability of a long stay may well
be the result of a combination of particularly difficult surgery and co-morbidity.
The potential of a long stay on the ICU may be inevitable for some patients but
perhaps others might benefit from having their surgery postponed until they are in
a medical state that might reduce the chance of such a long stay.
4
Fig.1 Fitting a length of stay model
Table 1 Best fit parameters for an order 3 hyperexponential length of stay model patient category proportion = lj negexp coef = vj mean LoS (nights)
1. one night stay 21.0% - 1.00
2. medium stay 65.7% 0.46 1.83
3. long stay 13.3% 0.95 17.10
all ICU admissions 100.0% - 3.69
Some studies have noted a correlation between the ICU length of stay and the
severity of a patient’s condition, as measured by the logistic organ dysfunction
score (LODS) (Heldwein et al., 2011). However, this relationship appears valid
for just specific categories of patients (Mallor & Azcárate, 2011). The observed
correlation at the HLC was weak at -0.09; this was insufficient to justify
developing an admissions’ system using LODS to predict ICU stay and select
elective patients and help balance the operating theatre time and ICU bed
utilisation. Severity scoring systems may have clinical value, their use as
management tools can be problematic (Sherck & Shatney, 2011).
0%
10%
20%
30%
40%
50%
60%
0 5 10 15 20 25 30
freq
uenc
y
ICU bed stay (days)
observed
order 1
order 2
order 3
5
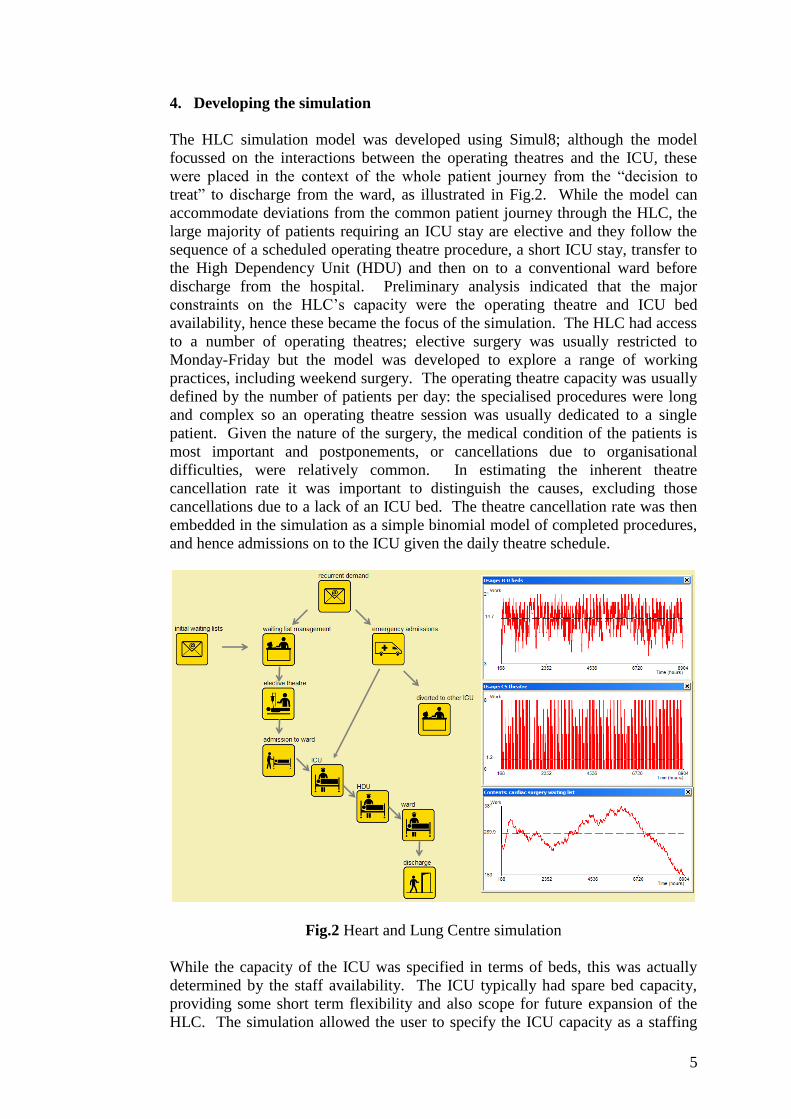
4. Developing the simulation
The HLC simulation model was developed using Simul8; although the model
focussed on the interactions between the operating theatres and the ICU, these
were placed in the context of the whole patient journey from the “decision to
treat” to discharge from the ward, as illustrated in Fig.2. While the model can
accommodate deviations from the common patient journey through the HLC, the
large majority of patients requiring an ICU stay are elective and they follow the
sequence of a scheduled operating theatre procedure, a short ICU stay, transfer to
the High Dependency Unit (HDU) and then on to a conventional ward before
discharge from the hospital. Preliminary analysis indicated that the major
constraints on the HLC’s capacity were the operating theatre and ICU bed
availability, hence these became the focus of the simulation. The HLC had access
to a number of operating theatres; elective surgery was usually restricted to
Monday-Friday but the model was developed to explore a range of working
practices, including weekend surgery. The operating theatre capacity was usually
defined by the number of patients per day: the specialised procedures were long
and complex so an operating theatre session was usually dedicated to a single
patient. Given the nature of the surgery, the medical condition of the patients is
most important and postponements, or cancellations due to organisational
difficulties, were relatively common. In estimating the inherent theatre
cancellation rate it was important to distinguish the causes, excluding those
cancellations due to a lack of an ICU bed. The theatre cancellation rate was then
embedded in the simulation as a simple binomial model of completed procedures,
and hence admissions on to the ICU given the daily theatre schedule.
Fig.2 Heart and Lung Centre simulation
While the capacity of the ICU was specified in terms of beds, this was actually
determined by the staff availability. The ICU typically had spare bed capacity,
providing some short term flexibility and also scope for future expansion of the
HLC. The simulation allowed the user to specify the ICU capacity as a staffing
6
profile over the week and also the daily theatre schedule. At the start of each
simulated day, the bed availability in the ICU is checked before allocating patients
to particular theatre sessions: some theatre sessions will be unused if no ICU bed
is available. The key simulation outputs were the number of admissions and the
utilisation of the theatres and ICU beds; comparisons of these metrics with
historic data helped validate the model and confirm its value as a basis for
decision making. Clinical and management staff were very active in the
development of the simulation and used it to explore various organisational issues,
helping to identify cost effective options for enhancing the HLC capacity.
5. Staffing and ICU capacity
The simulation model provided a mechanism for assessing the service level
implications, given the specified demand and the available resources. However,
any estimate of the HLC capacity depended on both the component resource
capacities and their management. In particular the assessment depended on
assumptions about the deployment of the available ICU staff. Stochastic
mathematical programming might be used to determine the optimal allocation of
staff (Morton & Popova, 2004). However, experiments indicated that in the
present example a relatively simple staff allocation was sufficient based on the
minimisation of an approximation of the expected excess ICU requirement X ,
given a specified pattern of theatre activity:
dPbdX i
i bd
i
i
7
1
(1)
where:
w = ward capacity (maximum number of beds available on any one
day)
bi = ICU bed capacity on day i determined by staffing; bi ≤ w (i =
1..7)
7
1i
ibB since budgetary constraints limit the weekly
staffing
id = mean ICU bed demand on day i, reflecting the theatre schedule,
cancellation rate and ICU length of stay distribution
Pi(d) = probability that bed demand on day i is d, assuming a Poisson
distribution with a mean demand for day i of id
While the total staffed bed capacity B was constrained by the budget, the number
available on any one day was also limited, though in this application this was not
a significant constraint. id was estimated assuming that the contributions from
the three components of demand identified in Table 1 are independent with id (j)
being the mean demand on day i for component j of demand (j=1..3). Other
studies (Adan et al., 2011) have formulated similar problems but adopted more
complex distributions of ICU bed-stay. However, the exponential nature of the
7
length of stay model permits a comparatively simple formulation reflecting the
remaining patients from previous days’ admissions to the ICU and the 7-day cycle
of activity. Each of the three hyperexponential components (j=1..3) of Table 1,
contributes to the mean bed demand on day i (i= 1..7) reflecting the daily theatre
capacity ti specified by the week’s schedule:
...111 2
7mod27mod1 jijiiji vctvctctljd
(2)
where:
ti = available theatre capacity (number of patients) on day i
c = theatre cancellation rate
lj = proportion of patients of category j, see Table 1
vj = fitted exponential parameter corresponding to the mean stay for
category j patients, see Table 1.
A high theatre cancellation rate can have a large effect on the demand for beds,
especially for the long stay category of patients, j=3. In the current study there
was no significant relationship distinguishing the cancellation rates for different
categories, though this could be included if required. Exploiting the common
summations applicable to the geometric nature of the model of accumulating bed
demand, this can be rewritten as:
7
6
0
7mod
6
0
7mod
146
0
7mod
76
0
7mod
1
1
...111
j
k
k
jkij
i
k
k
jkijj
k
k
jkijj
k
k
jkiji
v
vctl
jd
vctvlvctvlvctljd
(3)
Hence considering the sum of the components of the order 3 hyperexponential
length of stay model:
3
1
6
0
7mod71
1j k
k
jki
j
j
i vctv
ld
(4)
Using this estimate of mean daily demand to specify a Poisson distribution of
demand in Eq.1, E[X] was minimised using a standard branch and bound integer
programming routine to estimate the optimal staffing profile described by bi (i
=1..7) for a specified theatre allocation ti (i =1..7).
The assumptions used in determining these staffing profiles were tested in a series
of experiments using the simulation. Sensitivity analyses were undertaken
considering perturbations about the proposed staffing profiles under three
scenarios: well match bed and theatre capacity; beds > theatres; theatres > beds.
25 perturbations of the staffing profiles were examined considered for each
scenario; although there were a number of equivalent profiles, none offered any
improvement in performance.
8
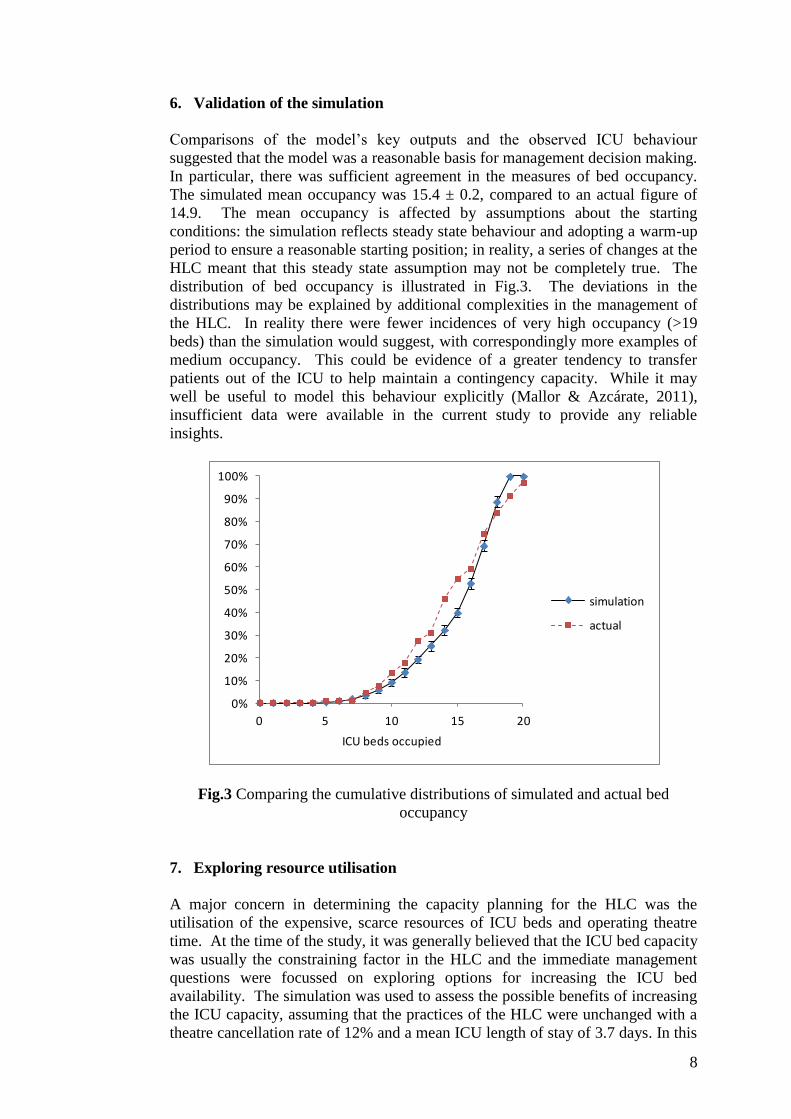
6. Validation of the simulation
Comparisons of the model’s key outputs and the observed ICU behaviour
suggested that the model was a reasonable basis for management decision making.
In particular, there was sufficient agreement in the measures of bed occupancy.
The simulated mean occupancy was 15.4 ± 0.2, compared to an actual figure of
14.9. The mean occupancy is affected by assumptions about the starting
conditions: the simulation reflects steady state behaviour and adopting a warm-up
period to ensure a reasonable starting position; in reality, a series of changes at the
HLC meant that this steady state assumption may not be completely true. The
distribution of bed occupancy is illustrated in Fig.3. The deviations in the
distributions may be explained by additional complexities in the management of
the HLC. In reality there were fewer incidences of very high occupancy (>19
beds) than the simulation would suggest, with correspondingly more examples of
medium occupancy. This could be evidence of a greater tendency to transfer
patients out of the ICU to help maintain a contingency capacity. While it may
well be useful to model this behaviour explicitly (Mallor & Azcárate, 2011),
insufficient data were available in the current study to provide any reliable
insights.
Fig.3 Comparing the cumulative distributions of simulated and actual bed
occupancy
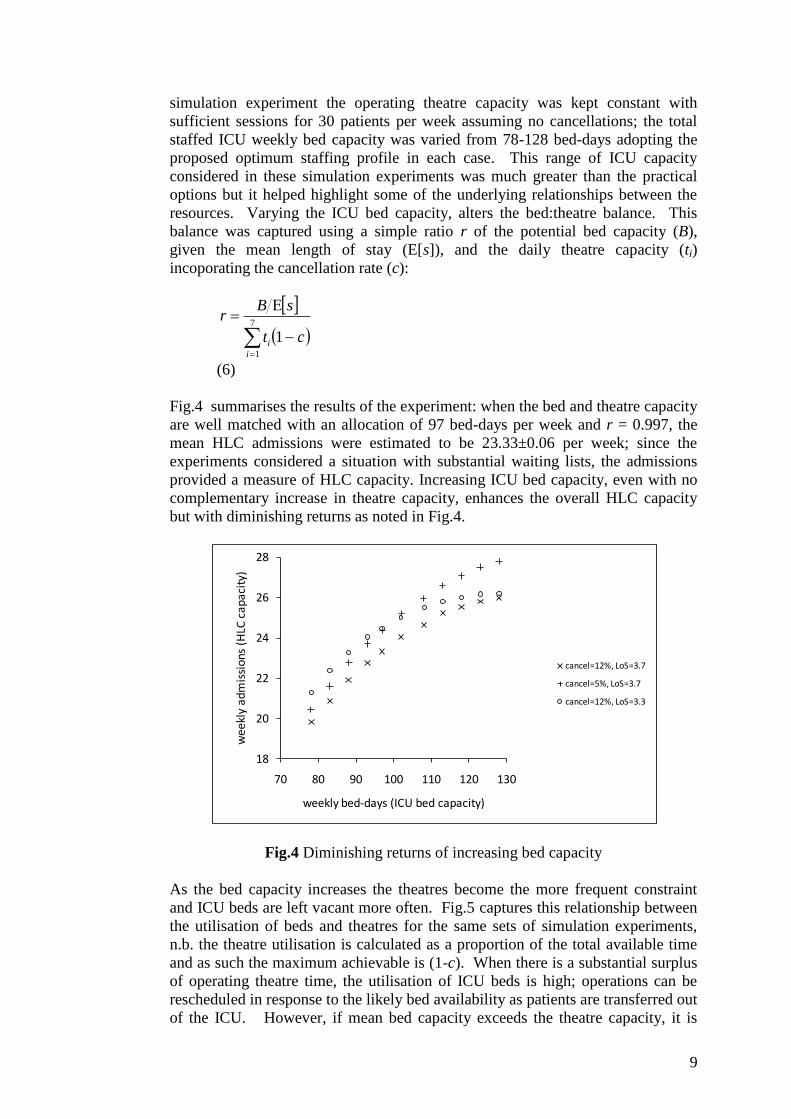
7. Exploring resource utilisation
A major concern in determining the capacity planning for the HLC was the
utilisation of the expensive, scarce resources of ICU beds and operating theatre
time. At the time of the study, it was generally believed that the ICU bed capacity
was usually the constraining factor in the HLC and the immediate management
questions were focussed on exploring options for increasing the ICU bed
availability. The simulation was used to assess the possible benefits of increasing
the ICU capacity, assuming that the practices of the HLC were unchanged with a
theatre cancellation rate of 12% and a mean ICU length of stay of 3.7 days. In this
0%
10%
20%
30%
40%
50%
60%
70%
80%
90%
100%
0 5 10 15 20
ICU beds occupied
simulation
actual
9
simulation experiment the operating theatre capacity was kept constant with
sufficient sessions for 30 patients per week assuming no cancellations; the total
staffed ICU weekly bed capacity was varied from 78-128 bed-days adopting the
proposed optimum staffing profile in each case. This range of ICU capacity
considered in these simulation experiments was much greater than the practical
options but it helped highlight some of the underlying relationships between the
resources. Varying the ICU bed capacity, alters the bed:theatre balance. This
balance was captured using a simple ratio r of the potential bed capacity (B),
given the mean length of stay (E[s]), and the daily theatre capacity (ti)
incoporating the cancellation rate (c):
7
1
1i
i ct
sBr
(6)
Fig.4 summarises the results of the experiment: when the bed and theatre capacity
are well matched with an allocation of 97 bed-days per week and r = 0.997, the
mean HLC admissions were estimated to be 23.33±0.06 per week; since the
experiments considered a situation with substantial waiting lists, the admissions
provided a measure of HLC capacity. Increasing ICU bed capacity, even with no
complementary increase in theatre capacity, enhances the overall HLC capacity
but with diminishing returns as noted in Fig.4.
Fig.4 Diminishing returns of increasing bed capacity
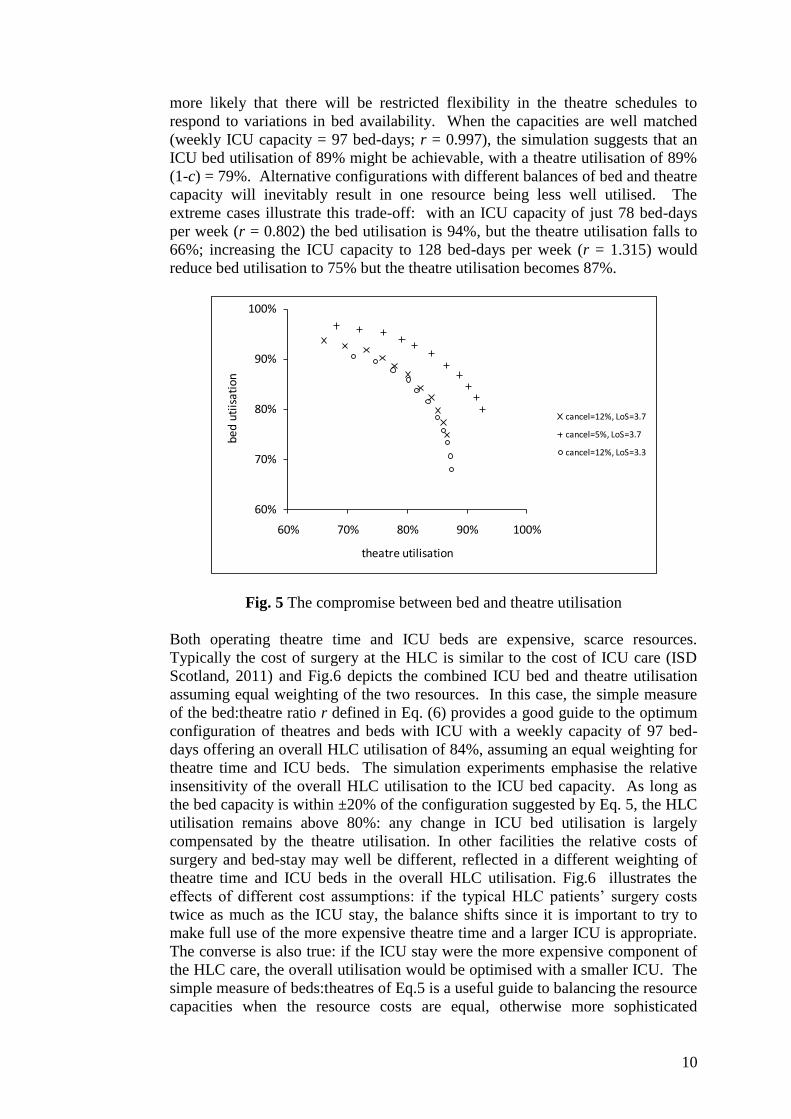
As the bed capacity increases the theatres become the more frequent constraint
and ICU beds are left vacant more often. Fig.5 captures this relationship between
the utilisation of beds and theatres for the same sets of simulation experiments,
n.b. the theatre utilisation is calculated as a proportion of the total available time
and as such the maximum achievable is (1-c). When there is a substantial surplus
of operating theatre time, the utilisation of ICU beds is high; operations can be
rescheduled in response to the likely bed availability as patients are transferred out
of the ICU. However, if mean bed capacity exceeds the theatre capacity, it is
18
20
22
24
26
28
70 80 90 100 110 120 130
we
ekl
y a
dm
issi
on
s (H
LC c
ap
aci
ty)
weekly bed-days (ICU bed capacity)
cancel=12%, LoS=3.7
cancel=5%, LoS=3.7
cancel=12%, LoS=3.3
10
more likely that there will be restricted flexibility in the theatre schedules to
respond to variations in bed availability. When the capacities are well matched
(weekly ICU capacity = 97 bed-days; r = 0.997), the simulation suggests that an
ICU bed utilisation of 89% might be achievable, with a theatre utilisation of 89%
(1-c) = 79%. Alternative configurations with different balances of bed and theatre
capacity will inevitably result in one resource being less well utilised. The
extreme cases illustrate this trade-off: with an ICU capacity of just 78 bed-days
per week (r = 0.802) the bed utilisation is 94%, but the theatre utilisation falls to
66%; increasing the ICU capacity to 128 bed-days per week (r = 1.315) would
reduce bed utilisation to 75% but the theatre utilisation becomes 87%.
Fig. 5 The compromise between bed and theatre utilisation
Both operating theatre time and ICU beds are expensive, scarce resources.
Typically the cost of surgery at the HLC is similar to the cost of ICU care (ISD
Scotland, 2011) and Fig.6 depicts the combined ICU bed and theatre utilisation
assuming equal weighting of the two resources. In this case, the simple measure
of the bed:theatre ratio r defined in Eq. (6) provides a good guide to the optimum
configuration of theatres and beds with ICU with a weekly capacity of 97 bed-
days offering an overall HLC utilisation of 84%, assuming an equal weighting for
theatre time and ICU beds. The simulation experiments emphasise the relative
insensitivity of the overall HLC utilisation to the ICU bed capacity. As long as
the bed capacity is within ±20% of the configuration suggested by Eq. 5, the HLC
utilisation remains above 80%: any change in ICU bed utilisation is largely
compensated by the theatre utilisation. In other facilities the relative costs of
surgery and bed-stay may well be different, reflected in a different weighting of
theatre time and ICU beds in the overall HLC utilisation. Fig.6 illustrates the
effects of different cost assumptions: if the typical HLC patients’ surgery costs
twice as much as the ICU stay, the balance shifts since it is important to try to
make full use of the more expensive theatre time and a larger ICU is appropriate.
The converse is also true: if the ICU stay were the more expensive component of
the HLC care, the overall utilisation would be optimised with a smaller ICU. The
simple measure of beds:theatres of Eq.5 is a useful guide to balancing the resource
capacities when the resource costs are equal, otherwise more sophisticated
60%
70%
80%
90%
100%
60% 70% 80% 90% 100%
bed
utiis
atio
n
theatre utilisation
cancel=12%, LoS=3.7
cancel=5%, LoS=3.7
cancel=12%, LoS=3.3
11
models, such as the simulation of this study, are necessary if the optimal balance
is required.
Fig.6 Optimising HLC utilisation
But is an optimal balance necessary? When bed:theatre cost = 0.5, the simulation
suggests that the overall HLC utilisation is optimised with a weekly capacity of
113 ICU bed-days, compared to the 97 implied by the simple measure r, see Eq.
6. This provides a 2.1% increase in HLC utilisation, as noted in Table 3. If
bed:theatre cost = 2.0, the simulation suggests an optimal ICU capacity of 88 bed-
days, providing an increase of 0.5% in HLC utilisation. Even when the bed and
theatre costs are not identical, the overall utilisation is relatively robust due to the
trade-offs of the component utilisations illustrated in Fig.5. While the
improvements in the HLC utilisations are statistically significant, as indicated by
the 95% confidence intervals included in Table 3, the increases may not always be
of great practical relevance. Utilisation is just one performance metric: HLC
capacity may be more important. Furthermore, the options available to HLC
management can be limited by operational resourcing practicalities, such as the
scope to recruit qualified staff and the physical space available. However,
presentations of the results of various sets of simulation experiments, such as Figs.
4-6, helped develop management’s understanding of the inter-relationships
between resources and identify a practical plan to increase the HLC capacity.
Table 3 Identifying the optimal balance (* ICU capacity suggested by the
simulations)
bed:theatre
cost
B = weekly
ICU capacity
r = bed:theatre
capacity
HLC
utilisation
0.5 113* 1.161 83.5±0.1%
0.5 97 0.997 81.4±0.2%
1.0 102* 1.048 83.5±0.2%
1.0 97 0.997 83.2±0.2%
2.0 88* 0.904 85.6±0.2%
2.0 97 0.997 85.1±0.2%
70%
75%
80%
85%
90%
70 80 90 100 110 120 130
HLC
uti
isat
ion
weekly bed-days (ICU capacity)
bed = theatre cost
bed < theatre cost
bed > theatre cost
12
8. Utilisation and the interaction of resources’ availabilities
One approach to increasing the HLC capacity is investment in additional beds or
theatres but the model was also used to explore other possible management
actions to enhance capacity. Analyses of the causes of theatre cancellations
suggested that some might be avoidable. Improved theatre management can
increase theatre availability: reducing the theatre cancellation rate to 5% increases
the overall HLC capacity as noted in Fig.4. This is especially valuable when the
bed capacity is high and it is relatively easy to utilise the additional theatre
sessions. Other actions focussed on the use of the ICU and the possibility of
reducing the length of stay for some patients: this increases the ICU bed
availability with a corresponding increase in HLC admissions, as illustrated in
Fig.4 by the results of the simulation experiment considering a reduction of 10%
in the mean length of stay to 3.3 days. However, the increases in HLC capacity
may not always be as great as expected since changing the availability of just one
resource alters the beds: theatres balance, and the resource utilisations as reflected
in Fig.5.
Where a single resource dominates, a simple trade-off between capacity and
utilisation will typically emerge; increases in capacity will tend to be rewarded
with diminishing increases in throughput. However, in the case of the HLC the
overall capacity was determined by the combination of the availabilities of two
symbiotic resources: beds and theatres. Increasing the number of beds, without
increasing the theatre availability, will result in greater competition for theatre
time and a reduction in bed utilisation. Failing to manage the ratio of
beds:theatres will result in one of the resources being under utilised; it is
important to consider the whole HLC system rather than focussing on the
performance of one component resource.
9. Management guidance
Simple comparisons of high level statistics such as admissions and bed occupancy
confirmed that the simulation provided a useful approximation to reality and a
reasonable basis for capacity planning. A simulation model, with a simplified
interface, was delivered for NHS staff use to explore various scenarios describing
the possible development of the HLC. In addition to the model, some simple,
general guidance was provided summarising the understanding developed from
the simulation experiments:
improvements in the efficient use of resources (e.g. shorter ICU bed stay
or fewer theatre cancellations) are always beneficial;
investing in additional capacity in either resource will enhance the overall
system capacity but the benefits are greater if the resources are reasonably
well matched;
increasing the availability of just one resource will result in reducing its
utilisation but increasing the utilisation of the companion resource;
the optimum balance between the resources should reflect their relative
costs.
13
10. Conclusions
This study illustrates a capacity planning problem in which the daily demand is
partly dependent on supply: the bed demand for any given day is a function of
both the admissions on that day and also the admissions of previous days, which
in turn are dependent on the bed availability for those days. An approximation
ignoring these interactions facilitated an analytic formulation, further simplified
by the use of an order 3 hyperexponential model of length of stay on the ICU. In
this study, the approximation provided a reasonable estimate of relative
performance and a basis for comparing options. This was sufficient to identify
near optimal practice, such as efficient weekly staffing profiles. However,
ignoring the interactions can produce significant errors in the estimates of the
absolute capacity; a simulation was required to capture the interdependencies of
the ICU beds and theatres, developing a fuller understanding of the subtle
interactions and providing a more reliable approach to capacity planning for the
whole system.
11. References
1. Adan, I., Bekkers, J., Dellaert, N., Jeunet, J., & Vissers, J. (2011). Improving
operational effectiveness of tactical master plans for emergency and elective
patients under stochastic demand and capacitated resources. European Journal
of Operational Research, 213, 290-308.
2. Blake, J. T. & Donald, J. (2002). Mount Sinai Hospital uses integer
programming to allocate operating room time. Interfaces, 32, 63-73.
3. Costa, A. X., Ridley, S. A., Shahani, A. K., Harper, P. R., De Senna, V., &
Nielsen, M. S. (2003). Mathematical modelling and simulation for planning
critical care capacity. Anaesthesia, 58, 320-327.
4. Ernst, A. T., Jiang, H., Krishnamoorthy, M., & Sier, D. (2004). Staff
scheduling and rostering: A review of applications, methods and models.
European Journal of Operational Research, 153, 3-27.
5. Fackrell, M. (2009). Modelling healthcare systems with phase-type
distributions. Health Care Management Science, 12, 11-26.
6. Griffiths, J. D., Jones, M., Read, M. S., & Williams, J. E. (2010). A simulation
model of bed-occupancy in a critical care unit. Journal of Simulation, 4, 52-
59.
7. Griffiths, J. D., Price-Lloyd, N., Smithies, M., & Williams, J. E. (2005).
Modelling the requirement for supplementary nurses in an intensive care unit.
Journal of the Operational Research Society, 56, 126-133.
8. Guerriero F., Guido R. (2011) Operational research in the management of the
operating theatre: a survey, Health Care Management Science, 14, 89-114
9. Harper, P. R., Knight, V. A., & Marshall, A. H. (2012). Discrete Conditional
Phase-type models utilising classification trees: Application to modelling
health service capacities. European Journal of Operational Research, 219,
522-530.
10. Heldwein, M., Badreldin, A., Doerr, F., Lehmann, T., Bayer, O., Doenst, T. &
Hekmat, K. (2011). Logistic Organ Dysfunction Score (LODS): A reliable
postoperative risk management score also in cardiac surgical patients? Journal
of Cardiothoracic Surgery, 6, 110.
14
11. Ingolfsson, A., manul Haque, M., & Umnikov, A. (2002). Accounting for
time-varying queueing effects in workforce scheduling. European Journal of
Operational Research, 139, 585-597.
12. ISD Scotland (2011). Costs Book 2010. Available at:
http://www.isdscotlandarchive.scot.nhs.uk/isd/4683.html, accessed 20.9.11
13. Kim, S. C., Horowitz I., Young, K.K. & Buckley, T.A. (1999). Analysis of
capacity management of the intensive care unit in a hospital. European
Journal of Operational Research, 115, 36-46.
14. Kim, S. C., Horowitz I., Young, K.K. & Buckley, T.A. (2000). Flexible bed
allocation and performance in the intensive care unit. Journal of Operations
Management,18, 427-443.
15. Kolker, A. (2009). Process Modeling of ICU Patient Flow: Effect of Daily
Load Leveling of Elective Surgeries on ICU Diversion. Journal of Medical
Systems, 33, 27-40.
16. Litvak, N., van Rijsbergen, M., Boucherie, R. J., & van Houdenhoven, M.
(2008). Managing the overflow of intensive care patients. European Journal
of Operational Research, 185, 998-1010.
17. Mallor, F. & Azcárate C. (2011) . Combining optimization with simulation to
obtain credible models for intensive care units. Annals of Operations Research
doi 10.1007/s10479-011-1035-8
18. Marshall, A. & McClean, S. (2004). Using Coxian Phase-Type Distributions
to Identify Patient Characteristics for Duration of Stay in Hospital. Health
Care Management Science, 7, 285-289.
19. Marshall A.H & Zenga M. (2012). Experimenting with the Coxian Phase-
Type Distribution to Uncover Suitable Fits. Methodology and Computing in
Applied Probability, 14, 71-86.
20. McClean, S. & Millard, P. (1993). Patterns of Length of Stay After Admission
in Geriatric Medicine: An Event History Approach. Journal of the Royal
Statistical Society. Series D (The Statistician), 42, 263-274.
21. McManus, M. L., Long, M. C., Cooper, A., & Litvak, E. (2004). Queuing
theory accurately models the need for critical care resources. Anesthesiology,
100, 1271-1276.
22. Morton, D. P. & Popova, E. (2004). A Bayesian stochastic programming
approach to an employee scheduling problem. Iie Transactions, 36, 155-167.
23. Oddoye, J. P., Jones, D. F., Tamiz, M., & Schmidt, P. (2009). Combining
simulation and goal programming for healthcare planning in a medical
assessment unit. European Journal of Operational Research, 193, 250-261.
24. Ridge, J. C., Jones, S. K., Nielsen, M. S., & Shahani, A. K. (1998). Capacity
planning for intensive care units. European Journal of Operational Research,
105, 346-355.
25. Shahani, A. K., Ridley, S. A., & Nielsen, M. S. (2008). Modelling patient
flows as an aid to decision making for critical care capacities and organisation.
Anaesthesia, 63, 1074-1080.
26. Shaw, B. & Marshall, A. H. (2007). Modelling the flow of congestive heart
failure patients through a hospital system. Journal of the Operational
Research Society, 58, 212-218.
27. Sherck, J. & Shatney, C. (1996). ICU scoring systems do not allow prediction
of patient outcomes or comparison of ICU performance. Critical Care Clinics,
12, 515-523.
28. Siferd, S. P. & Benton, W. C. (1994). A decision modes for shift scheduling of
nurses. European Journal of Operational Research, 74, 519-527.
15
29. Smith-Daniels, V. L., Schweikhart, S. B., & Smith-Daniels, D. E. (1988).
Capacity Management in Health Care Services: Review and Future Research
Directions. Decision Sciences, 19, 889-919.
30. Utley, M., Gallivan, S., Treasure, T., & Valencia, O. (2003). Analytical
Methods for Calculating the Capacity Required to Operate an Effective
Booked Admissions Policy for Elective Inpatient Services. Health Care
Management Science, 6, 97-104.
31. Vanberkel, P. T., Boucherie, R. J., Hans, E. W., Hurink, J. L., van Lent, W. A.
M., & van Harten, W. H. (2011). An exact approach for relating recovering
surgical patient workload to the master surgical schedule. Journal of the
Operational Research Society, 62, 1851-1860.
32. Vasilakis, C. & Marshall, A. H. (2005). Modelling nationwide hospital length
of stay: opening the black box. Journal of the Operational Research Society,
56, 862-869.
33. Vassilacoupolos, G. (1985). Allocating Doctors to Shifts in an Accident and
Emergency Department. Journal of the Operational Research Society, 36,
517-523.
34. Vissers, J. (1998). Patient flow-based allocation of inpatient resources: a case
study. European Journal of Operational Research, 105, 356-370.