Embed Size (px)
Citation preview
BALANCING SHOCK ABSORBERS
MANUFACTURING LINE WITH THE
MTM-UAS METHODOLOGY
Rafael Cardoso Azevedo Amaral (UFSJ)
Juliana Cassia de Souza Caliari (UFSJ)
Claudio Vitor Maquine Salvador (UFSJ)
Gustavo Henrique Resende Pinto (UFSJ)
Wilson Trigueiro de Sousa Junior (UFSJ)
In the present study a manufacturing line for automotive parts was analyzed with the
objective of balancing operations, and consequently, reduce loss during the process.
The MTM-UAS technique quality consist of: Methods-time measurement, GBO chart,
Yamazumi diagram, 5W1H, brainstorming and Ishikawa diagram. For the
improvement validation, a survey was realized (after improvement), to compare with
the current one. With this project, the desbalacing loss, the bottleneck time were
reduced by 35% and 9%, and increase by 13% in the production of manufacturing
parts weekly. Consequently, there was a reduction of cost and annual increase of
productivity in the order of R$115,000.00
Palavras-chave: Balancing, cycle time, MTM-UAS
XXXVII ENCONTRO NACIONAL DE ENGENHARIA DE PRODUCAO “A Engenharia de Produção e as novas tecnologias produtivas: indústria 4.0, manufatura aditiva e outras abordagens
avançadas de produção” Joinville, SC, Brasil, 10 a 13 de outubro de 2017.
XXXVII ENCONTRO NACIONAL DE ENGENHARIA DE PRODUCAO “A Engenharia de Produção e as novas tecnologias produtivas: indústria 4.0, manufatura aditiva e outras abordagens
avançadas de produção” Joinville, SC, Brasil, 10 a 13 de outubro de 2017.
2
1 Introduction
The industrial sector called “Time and Methods”, that compose the Lean production, is used in
automotive companies, whose functions is to observe, measure, guard information, for identify
problems and propose solutions to contribute with costs reduction (MELO et al., 2016).
The execution of this project is justified by the potential gain that line balancing application will result
for the company, especially in financial terms, as well the contribution for the deepen of bibliography
about this area, but 576 articles were found about Line Balancing in Web Science, using the category
Enginnering Manufacturing.
This study of Methods-Time measurement analyzed a manufacturing line of components of trucks and
bus bumper, through the technic of Methods-Time Measurement – Universal Analysis System
(MTM – UAS) to generate the cycle with quality tools.
2 Literature review
2.1 Time evaluation methods
According to Swann (1973), the studies of methods determine how the operator should do the activity,
so the process is optimized and results in improvements.
The three most popular time evaluation techniques already known are: Chrono Analisys, multi-
moment and system of predertermined times.
Swann (1973) defines the Chrono Analisys as a technique of work measurement that records time,
execution, resources and work environment information to determine the time required for a specific
task to be done, without harming the worker. Therefore, the appropriate time consumed by the task is
known.
Maynard (2001) defines the multi-moment as observations of activities done in random intervals.
These observations are redefined into categories, according to the conduction of the analyzed activity.
The time is done by the probabilistic analysis of the category in relation to the total of work under
study.
According to Bedny et al. (2014), the systems of predetermined time constitute the times evaluation
methods focused by this paper. The systems of predetermined times are: “Methods-Time
XXXVII ENCONTRO NACIONAL DE ENGENHARIA DE PRODUCAO “A Engenharia de Produção e as novas tecnologias produtivas: indústria 4.0, manufatura aditiva e outras abordagens
avançadas de produção” Joinville, SC, Brasil, 10 a 13 de outubro de 2017.
3
Measurement” (MTM), “Work-Factor” (WF), “Motion-Time-Analysis” (MTA) and “Basic Motion
Time Study” (BMT).
Bedny et al. (2014) define Predetermined Time Systems as the verification of defined times through
theoretical studies for determined activity, because these studies originated work methodologies.
2.3 Methods-time measurement (MTM 1)
The Methods-Time Measurement was developed by Gilbreth and Gilbreth (1917), pioneers of
these studies, who perceived the need to determine the adequate time of the execution of work
by the employees.
The MTM-1 consists in basic movements like (BEDNY et al., 2014): reaching, picking (hold),
moving, positioning and releasing.
The MTM-1 model did not include these new types of the activities, and were necessary
elabored methods that included these new movements. This is how it came about the Methods
Time Measurement-Universal Analyzing System (MTM-UAS) and the Methods Time
Measurement-Small Batch Production (MTM-MEK) (MELO et al., 2016).
The MTM-UAS is a new methodology, with improvements, derived from MTM-1, because it
analyzes the time resulting from set of basic movements of the MTM- 1, as body movement,
handle auxiliary means, catch and put in place visual control, movements cycles (MELO et
al., 2016).
According to Barnes (1977), the main advantages of using MTM are: to develop the adequate
method for specific activity; use the chosen methods as a standardized model; determine the
adequate time for activity, analyzing its execution in regular time by a qualified professional
and use the model chosen to coach the workers.
2.3.1 Methods of time measurement- universal analysis system (MTM-UAS)
The MTM-UAS provides the choice of work method that result in the shortest cycle time for
the activity and is used as standard. The pre-determination of the movements aims to obtain
accurately the cycle time of activity, without the influence of any external environment (DI
GIRONIMO et al., 2012).
Because the MTM-UAS is based in predetermined times, it provides the simulation of
activities, planning the work station using the shortest cycle time method, without stopping a
XXXVII ENCONTRO NACIONAL DE ENGENHARIA DE PRODUCAO “A Engenharia de Produção e as novas tecnologias produtivas: indústria 4.0, manufatura aditiva e outras abordagens
avançadas de produção” Joinville, SC, Brasil, 10 a 13 de outubro de 2017.
4
production line for observation. In this way, the MTM-UAS become an improvement tool, not
only a measuring tool (DI GIRONIMO et al., 2012).
According to Corrêa et al. (2013) and Heyel (2012) on the codification system of the MTM-
UAS tool, each sequence of movement is represented basically by two alphabetic characters
and on special cases by one more digit. In every sequence of movement is contained a group
of basic movement elements.
Corrêa et al. (2013) and Heyel (2012) also shows that the first digit of the codification
corresponds to the respective module, the second, refers to the influence parameter, in this
case it represents the precision on the execution of the movement, and it can be classified by
low, medium and high precision, and depending of case, by one more number that represents
the range of distance.
The MTM application process consists of the following procedure, described on the paper of
(DI GIRONIMO et al., 2012): (1) observe the operations, (2) register in documents images
and relevant information of the operations, (3) determine and classify all movement sequence,
(4) register movements according MTM standards, (5) define times to each identified
movement, (6) sum the times of all movements of the sequence to know the total time referent
to the activity being studied, (7) include all the requirements of the chosen method to validate
and apply the standard.
The MTM-UAS was used in works as Stadnicka and Antosz (2015), which implemented
SMED by adjusting the time of each activity by the MTM-UAS model to reduce setup time;
Metternich et al. (2015), which realized in the manufacturing cell that uses labor, can be
optimized to generate the of same volume of expected production.
Melo et al. (2016) did a balancing of a manufacturing line in an company of the automobile
sector. To calculate the cycle time of the operations, they used the MTM-UAS time analysis
tool. As a result, they could reduce the execution time of each activity without affect the
productive capacity of the line.
Although goods results, Di Gironimo et al. (2012) shows MTM-UAS doesn´t include
ergonomic factors and to correct this deficiency, he based in studies about the task analysis,
teories human postures and physical aptitude, through product design in virtual environment.
XXXVII ENCONTRO NACIONAL DE ENGENHARIA DE PRODUCAO “A Engenharia de Produção e as novas tecnologias produtivas: indústria 4.0, manufatura aditiva e outras abordagens
avançadas de produção” Joinville, SC, Brasil, 10 a 13 de outubro de 2017.
5
2.4 Line balancing
The line balancing has the finality to increase the productivity and reduce costs, by allocating
the tasks by work stations and operator, so the work time is used in the maximum capacity,
leading the tasks to fulfill the established orders (CHAPLIN et al., 2015).
Lam et al. (2016) emphasize that the operations in any manufacturing environment has
difficulties to become balanced, due to incorrect organization of extra capacities and due to
statistical instabilities and market occurrences, that result in immediate decisions of managers.
Once the activity time is analyzed, the balancing of the production becomes one of the best
ways to increase the productivity (CHAPLIN et al., 2015).
According to Melo (2014), to realize line balancing, one must: (1) analyze the imbalance
losses calculations, (2) analyze the cycle time calculations of the operations, according to the
MTM-UAS techniques standards, (3) analyze the time determined by the operational
balancing graph (GBO), (4) Draw up the Yamazumi diagram, through all the information
collected, (5) Use the quality tools: 5W1H, brainstorming and the Ishikawa Diagram to
generate the action plan of activities, (6) analyze possible improvement project through the
calculating of the unbalance loss, (7) apply the GBO and the Yamazumi Diagram to calculate
the financial benefit of the project.
2.5 Quality tools
The use of quality tools, adequately elaborated and performed, should provide significant
improvements in terms of efficiency, safety, quality control and performance management
(JURAN; GRYNA, 1991). Some tools are essentials for the good execution of an
improvement, as described:
5W1H Method used to verify the occurrence of a problem and elaboration of an
action plan (LIU et al., 2016);
The brainstorming analyzes several suggestions the solve a problem (TROCHIM;
MCLINDEN, 2017);
Ishikawa Diagram identifies possible causes of a problem, defined in material,
method, machine, raw material, environment and measurement causes
(RUPARATHNA et al., 2017);
XXXVII ENCONTRO NACIONAL DE ENGENHARIA DE PRODUCAO “A Engenharia de Produção e as novas tecnologias produtivas: indústria 4.0, manufatura aditiva e outras abordagens
avançadas de produção” Joinville, SC, Brasil, 10 a 13 de outubro de 2017.
6
Operational Balancing Graph (GBO) detailing the cycle time of each operation
(GUSSONI et al., 2016);
Yamazumi Diagram identifies parts of process that doesn´t directly contribute to
product development Obara (2012).
3. Methodology
3.1 Nature of Research
The present paper is an action research goal is describe and verify the possibility to perform
balancing in a manufacturing line of automotive sector of a multinational, located in Minas
Gerais.
The action research the reacher helps by collaborating with the others peoples involved in the
place of study to solve problems raised from scientific techniques (MARTINS et al., 2014).
Thus, the participants undestand the best way to work, demonstrate to the company the lived
experience lived, help in decision making, make it more collaborative and critical in the work
group for data collection and changes that must be made due to their due to their own
difficulties (MARTINS et al., 2014).
3.2 Methods used
The Line Balancing followed the model to Melo (2014), described previously in the item Line
Balancing, in steps seven.
The Melo (2014) methodology, composed of model MTM-UAS with Quality Tools is
different MTM-UAS application reviseds, because this works show the combination of the
MTM-UAS with variables models, the work as Stadnicka and Antosz (2015), used only the
SMED, Metternich et al. (2015), used only the same volume of expected production, Di
Gironimo et al. (2012), used task analysis, teories human postures and physical aptitude.
To start the study, production lines of the company were analyzed using surveys previously
performed by MTM-UAS.
With the chosen line, the data of time were collected with an operator performing a normal
sequence of activity of his working station. For the collection of the time spend by the
machine, were used a centesimal chronometer, Hanhart model, with precision of 0,001
XXXVII ENCONTRO NACIONAL DE ENGENHARIA DE PRODUCAO “A Engenharia de Produção e as novas tecnologias produtivas: indústria 4.0, manufatura aditiva e outras abordagens
avançadas de produção” Joinville, SC, Brasil, 10 a 13 de outubro de 2017.
7
hundredth of a second. Only one data collection was done, with the operator of the first work
station to have a reference of the cycle time of the operations to be generated.
After this data gathering, the time used by the machine and the movement time codes were
stored in the TICON software, developed by the Softwarehouse of the MTM group, which
performed the data processing, analyzing the operator’s movement, generating the total
operation time and the GBO.
The GBO observed the obsolescence of the operator as a function of machine time, through a
comparison with the ocious time of the line (longer cycle time by part produced).
After this comparative process, the imbalance loss percentage was obtained, dividing the sum
of the difference between the work content and the ocious time by the sum of the total
percentage.
With the results, was necessary to use the Yamazumi Diagram to identify the processes which
the operators are inactive, with the data of VA (added value) and NVA (not added value).
Afterwards, a brainstorming was realized with the line operators, production leader and area
supervisor to list possible ideas to eliminate NVA activities and eliminate unbalancing. The
5W1H tool was used to analyze the problem and the direct the ideas listed on the
brainstorming.
These ideas were classified in four topics according to the Ishikawa Diagram to list possible
root causes of the problems and propose improvements to the productive line. With this tool
was possible to distinguish ideas related to the problems.
The ideas classified as pertinent were dismembered and a plan of action was created,
containing the description of the activities, the names of the staff responsible to execute the
task and a deadline to finalize the activities. Thus, the action stage was started and the
planning stage to line balancing was finalized.
After the execution of the activities provided in the action plan, the stage of checking the
improvement begins, through plotting graphs and indicators. Data about the line were
collected again, using MTM-UAS tool. The new GBO graph and the Yamazumi Diagram
were elaborated, to demonstrate the reduction of the losses recently balanced with the
improvements, to reorganize the workforce in all the productive process and to distinguish all
the parts of production that are not relevant to the final product.
XXXVII ENCONTRO NACIONAL DE ENGENHARIA DE PRODUCAO “A Engenharia de Produção e as novas tecnologias produtivas: indústria 4.0, manufatura aditiva e outras abordagens
avançadas de produção” Joinville, SC, Brasil, 10 a 13 de outubro de 2017.
8
The viability of the project implementation was analyzed through a planning stage and was
created an action plan to change the layout and enable the worker to be able to perform new
operations.
The productivity was used as an indicator, the result was found dividing the number of parts
produced by the number of line operators. To do this, five weeks were taking as basis, before
the full implantation of the project in production line.
Looking for a better balancing benefit, a comparative graph between the productivity averages
before and after implantation of the improvement was done.
After the implantation of all the actions, the benefit leaded by reducing the number of
manufacturing line operators was calculated. This calculus was made using multiplication of
variables: operator cost per hour; average hours worked per day; number of work shift;
average number of days worked in the month and number of months in a year.
The operations involved in the project had their standardization documents changed and the
operators referring to the problems checked in this work were trained to demonstrate the new
reality of the productive cell.
After all the stage of implantation and checking, the modifications realized must be used
as standard and documented according to the norms used by the company. This project
began in the first week of June 2015 and finalized in the last week of August.
4. Case Study
4.1 Company Characterization
This project was implanted in a company located in south of the state of Minas Gerais/Brasil.
It produces shock absorbers and, therefore, belongs to the segment of automotive auto parts.
The company’s brand was founded in 1951, and today possesses more than two thousand
employees. It exports their products to more than sixty and two countries and has a share of
about 65% of national market in the shock absorbers area.
In its units, the organization adopts a posture aimed to reduce losses generated in the process.
4.2 Manufaturing Line Characterization
XXXVII ENCONTRO NACIONAL DE ENGENHARIA DE PRODUCAO “A Engenharia de Produção e as novas tecnologias produtivas: indústria 4.0, manufatura aditiva e outras abordagens
avançadas de produção” Joinville, SC, Brasil, 10 a 13 de outubro de 2017.
9
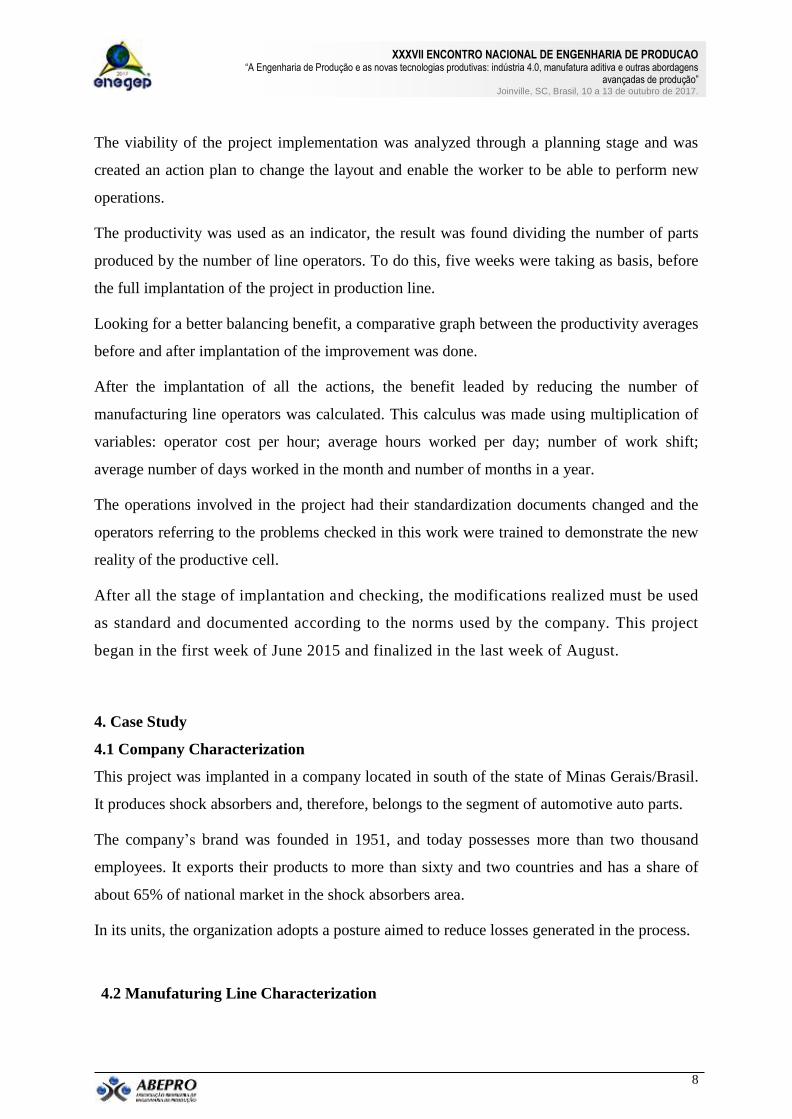
This plant produced types of shock absorbers, and a manufacturing line destined for
trucks and buses was used this project, due to imbalance losses. These employees are
responsible to operate 12 work stations (Table 1).
Table 1 – Description of work stations in manufacturing line
Source: Author
The manufacturing line, 12 work stations, has 12 employees who work in two shifts, from
Monday to Saturday, working 8 hours and 30 minutes daily. The activities consist in to mount
parts of shock absorbers.
4.3 Analysis and results
XXXVII ENCONTRO NACIONAL DE ENGENHARIA DE PRODUCAO “A Engenharia de Produção e as novas tecnologias produtivas: indústria 4.0, manufatura aditiva e outras abordagens
avançadas de produção” Joinville, SC, Brasil, 10 a 13 de outubro de 2017.
10
The MTM-UAS technique demonstrated the need of improvement in manufacturing line of
trucks and buses, because the indicators of loss were high in relation to the other areas. Don’t
were done improvement in manufacturing line of others components produced in the factory.
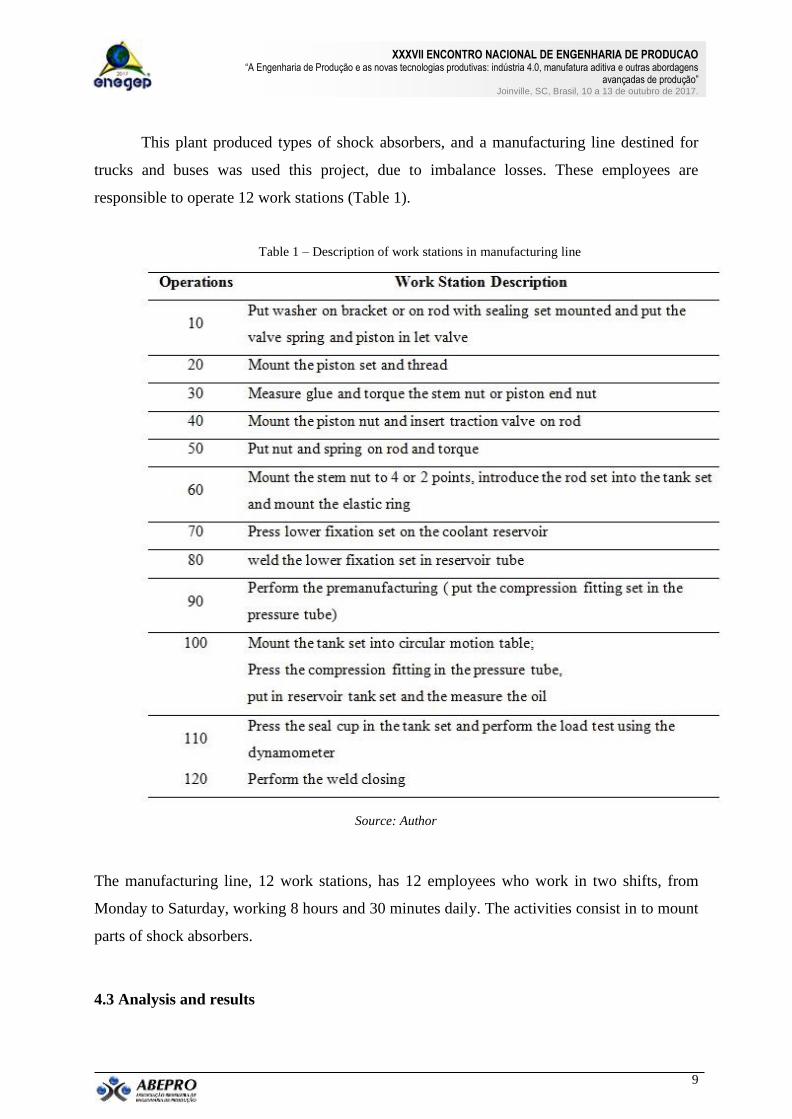
A analysis of the data used Ticon software (Table 2), it identified the operation 100, the
longest cycle time, with duration of 16,02 seconds.
Table 2 – Manufacturing line Data
Source: Author
The line loss represented 32,56%. The recommended loss was 18%.
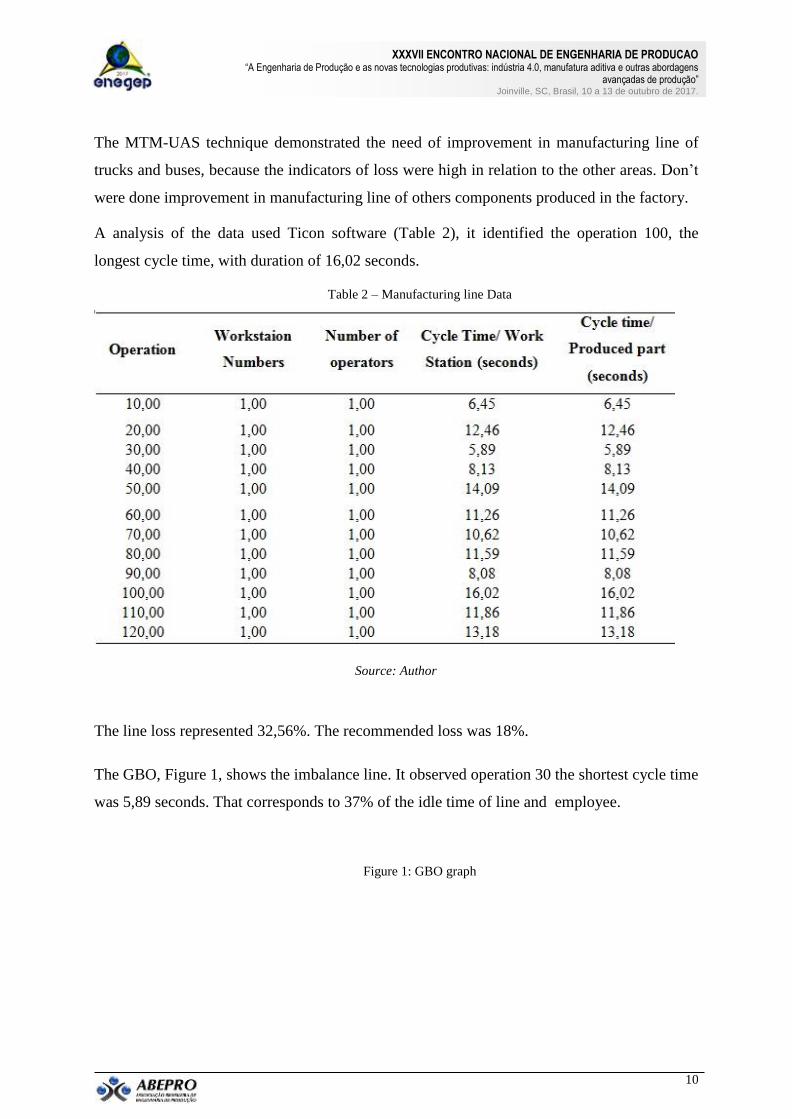
The GBO, Figure 1, shows the imbalance line. It observed operation 30 the shortest cycle time
was 5,89 seconds. That corresponds to 37% of the idle time of line and employee.
Figure 1: GBO graph
XXXVII ENCONTRO NACIONAL DE ENGENHARIA DE PRODUCAO “A Engenharia de Produção e as novas tecnologias produtivas: indústria 4.0, manufatura aditiva e outras abordagens
avançadas de produção” Joinville, SC, Brasil, 10 a 13 de outubro de 2017.
11
Source: Author
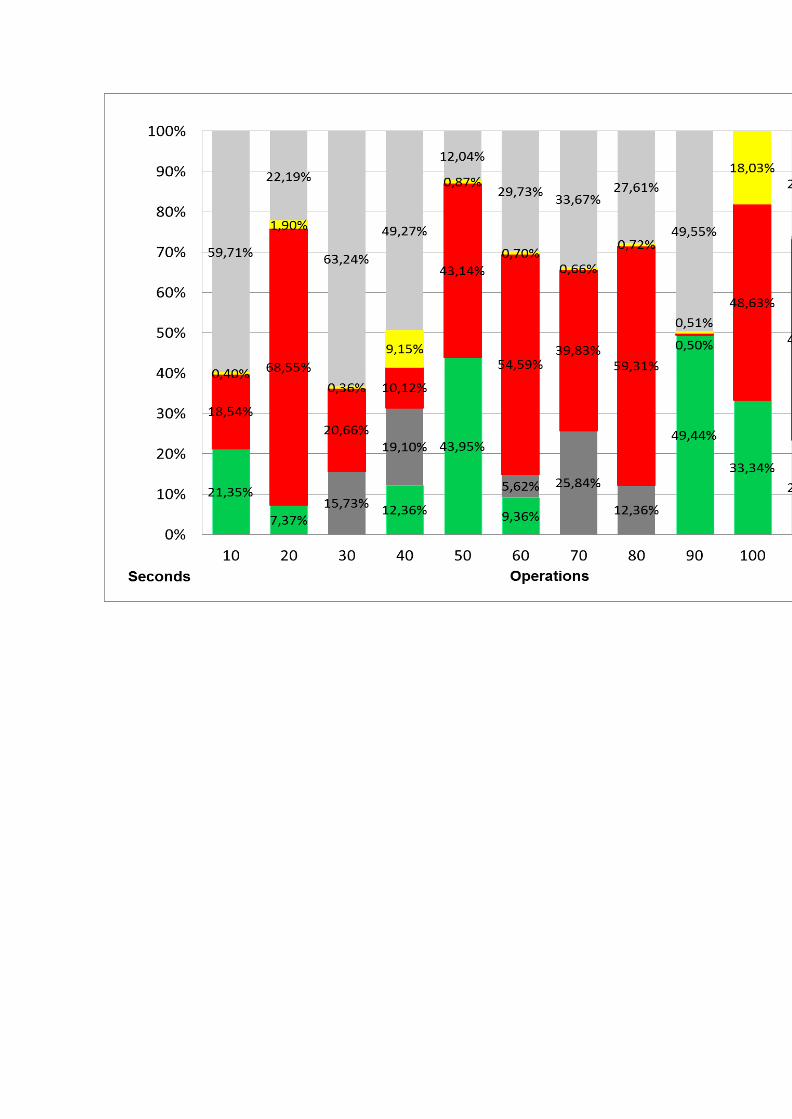
The Yamazumi Diagram, Figure 2, was observed the operation 90 has the highest percentage
of activities that add value to the product (49,44 %), while the operations 30, 70, 80, 110 e
120 presents low VA to the shock absorber. However, it doesn´t mean that it should eliminate
these activities, since there are NVA activities essential for obtaining the final product.
Figure 2: Yamazumi Diagram
Source: Author
About the unsaturations, the idle time of the employee is represented in Figure 3 by gray
color, the operations 10, 30 and 90 has higher values, about 60, 64 and 50% respectively,
allowing alterations in work stations activities.
With the data collected from the production line and analyzing the loss, the stage raise ideas
began. The 5W1H tool was used with assistance of all the project team. Then the
brainstorming was realized, with the intention of reduce the loss. This stage had duration of 7
days.
After using 5W1H and brainstorming, and also the analysis of Ishikawa Diagram, were raised
the following ideias:
U
nite the activities of operations 20 and 30, because they have a low cycle time and are
close to each other;
Designate to the employee of operation 90, the introdution the reservoir set into the
circular motion table, present in operation 100.
After this change in layout, the operations 20 and 30 united, reduction of the number
employees line.
The introduction the reservoir set into the circular motion table was implemented to the
employee, the new work station operations was standardized and validate.
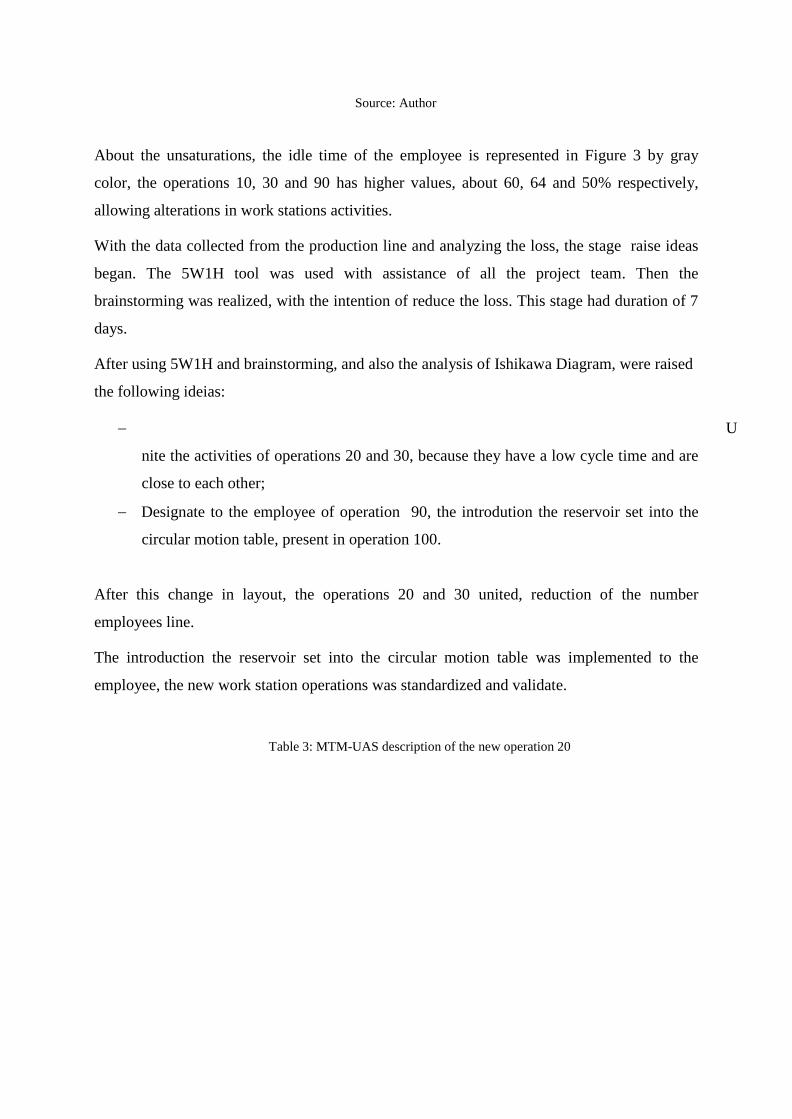
Table 3: MTM-UAS description of the new operation 20
XXXVII ENCONTRO NACIONAL DE ENGENHARIA DE PRODUCAO “A Engenharia de Produção e as novas tecnologias produtivas: indústria 4.0, manufatura aditiva e outras abordagens
avançadas de produção” Joinville, SC, Brasil, 10 a 13 de outubro de 2017.
15
Source: Author
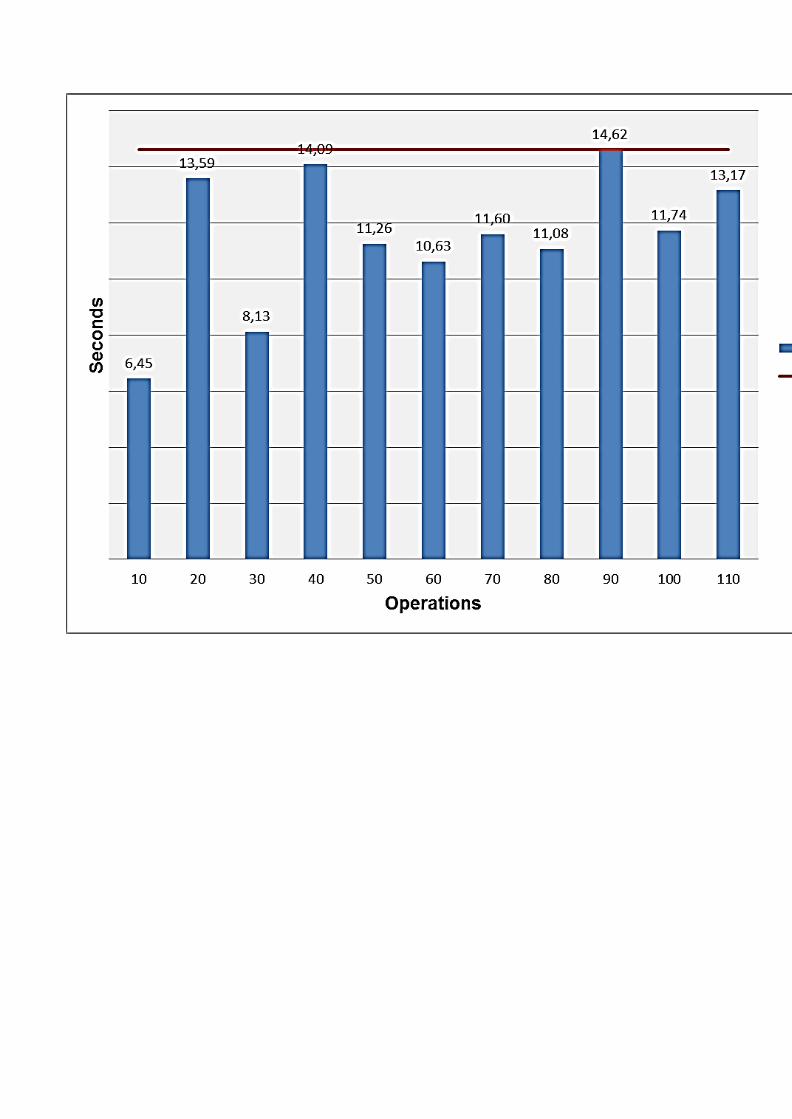
A new cycle time of operations was done, according to (Corrêa et al., 2013, Heyel, 2012), by
the tool MTM-UAS. It observes that, the new operation is done in a lower time according to
the new idle time (14,62 seconds, this represents a reduction of 9%) of manufacturing line
(Figure 3), in other words, it allows the increase of the productivity without interfere in the
losses of process.
Figure 3: GBO chart
Source: Author
After the calculation of loss due to inbalance (21,08%), was observed the reduction of
35,25%. This directly impacts the optimization of the workforce resources on the process.
During the implementation of the improvements, a new Yamazumi Diagram of Figure 7 was
generated, with new values of VA, NVA and unsaturations of the new operations, as Figure 4.
Figure 4: Yamazumi Diagram

Source: Author
The operations that have lower VA values didn´t suffered changes after the implementation of
the ideas. However, with the changes in the new colligated operation, 20, suffered a increase
of VA about 6,17%, that is to say, occurred a reduction in the employee schedule and allowed
increase in productivity.
Analyzing the development of line productivity , an increase in production can be noticed
from the implantation of the actions in the 30th week of 2015. This increase is mainly due to
the fact that each operator is dedicated and familiar with the new activities designated to them,
without the waste of time by idleness and by reduction of the bottleneck (9% of reduction) of
the line.
Still analyzing the effects of the implementation of the improvement, was observed an increase
in the production of manufacturing parts weekly, by approximately 13%, comparing the
production average of the five weeks before and after the beginning of balancing activities.
With the reduce of the number of employees in manufacturing line, the company obtained an
annual benefit of R$115,000.00 approximately. Considering that one hour of a employee labor
costs for the company R$30.00, value used by the institution to account benefits, working on
average 8 hours a day and 20 days in month. During 12 months and in 2 periods, the annual
benefit will be of R$115,200.00 (R$30.00 x 8 hours x 20 days x 12 months x 2 periods).
5 Conclusion
The implementation of the project reduced the cycle time of the operation considered
bottleneck, that is to say, it enabled the increase of the productive capacity of manufacturing
line, reduced the number of operations and employees in manufacturing line, produced a
longer number of parts and reduced its fixed cost.
The benefit generated by the project was positive for the company, considering the reduction
of the employee schedule,the desbalacing loss were reduced 35%, the bottleneck time were
reduced 9%, increase by 13% in the production of manufacturing parts weekly and increase of
productivity in the order of R$115,000.00.
For future papers, there is a suggestion of expanding this project to other areas of the
company, presenting in detail the layout modification process and the stratification of the
financial gains provided by the improvement.
XXXVII ENCONTRO NACIONAL DE ENGENHARIA DE PRODUCAO “A Engenharia de Produção e as novas tecnologias produtivas: indústria 4.0, manufatura aditiva e outras abordagens
avançadas de produção” Joinville, SC, Brasil, 10 a 13 de outubro de 2017.
20
6 Bibliographic references BARNES, R. M. Estudo de movimentos e de tempos: Projeto e medida de trabalho. São Paulo,
SP: Edgar Blucher Ltda, 1977.
BEDNY, G. Z.; KARWOWSKI, W.; VOSKOBOYNIKOV, F. Application of Standardized
Motions in Temporal Analysis of Work Activity. Human Factors and Ergonomics in
Manufacturing & Service Industries, v. 25, n. 4, p. 469-483. 2015.
CHAPLIN, L.; HEAP, J.; O’ROURKE, S. Could “Lean Lite” be the cost effective solution to
applying lean manufacturing in developing economies? International Journal of Productivity
and Performance Management, v. 65, n. 1. 2016.
COETZEE, R.; VAN DER MERWE, K.; VAN DYK, L. Lean implementation strategies:
how are the toyota way principles addressed? South African Journal of Industrial
engineering, v. 27, n. 3, p. 79-91. 2016.
CORRÊA, H. L.; CORRÊA, C. A. Administração de Produção e de Operações. 2 ed. São
Paulo, SP: Atlas, 2013.
HEYEL, C. The Foreman/supervisor’s handbook (5td ed.). Nova Iorque: Van Nostrand
Reinhold Company, 2012.
DI GIRONIMO, G.; DI MARTINO, C.; LANZOTTI, A.; MARZANO, A.; RUSSO, G.
Improving MTM-UAS to predetermine automotive maintenance times. International
Journal on Interactive Design and Manufacturing (IJIDEM), v. 6, n. 4, p. 265-273. 2012.
GILBRETH, F. W.; GILBRETH, L. M. Applied Motion Study. Nem York: Sturgis and
Walton, 1917.
GUSSONI, R.; GIACAGLIA, G. E. O.; CAMARGO, J. R., LAMAS, W. Q. Manufacturing
cell balance. Engineering Research, v. 7, n. 3, p. 1-8. 2016.
JURAN, J M.; GRYNA, F. M. Controle de qualidade: handbook.São Paulo: Makron Books,
1991.
LAM, N. T.; TOI, L. M.; TUYEN, V. T. T.; HIEN, D. N. Lean line balancing for an
electronics assembly line. In 13 th Global Conference on Sustainable Manufacturing-
Decoupling Growth Resource Use. Procedia CIRP 40, 437-442. 2016.
LANGE, P. M.; LANGE, C. M.; BONATTO, S. V.; JUNG, C. F. Otimização da utilização da
mão de obra e reestruturação de layout com o auxílio do gráfico de balanceamento de
operador em uma célula de manufatura. In IX Congresso Nacional de Excelência em Gestão.
Rio de Janeiro, RJ. (2013, Junho).
Liu, X.; Xie, R.; Lin, C.; Cao, L. Question microblog identification and answer
recommendation. Multimedia Systems, v. 22, n.4, p. 487-496. 2016.
XXXVII ENCONTRO NACIONAL DE ENGENHARIA DE PRODUCAO “A Engenharia de Produção e as novas tecnologias produtivas: indústria 4.0, manufatura aditiva e outras abordagens
avançadas de produção” Joinville, SC, Brasil, 10 a 13 de outubro de 2017.
21
MARTINS, R. A; MELLO, C. H. P.; TURRIONI, J. B. Guia para elaboração de monografia
e TCC em engenharia de produção. São Paulo, SP: Atlas, 2014.
Maynard, H. B. Engenharia Industrial – Handbook (5 ed.). McGraw-Hill Professional, 2001.
MELO, D. J.; ANDRADE, I. H.; SILVA, L. A.; JUNIOR, W. T. S. Aplicação do MTM-UAS
para redução de custos. In XXXVI Encontro Nacional de Engenharia de Produção:
Contribuições da Engenharia de Produção para Melhores Práticas de Gestão e Modernização
do Brasil. João Pesso, PB/Brasil. (2016, outubro).
MELO, D. J. Utilização do método MTM-UAS como ferramenta de análise e aumento de
produtividade. In XIV Congresso Nacional de Engenharia Mecânica e Industrial. Salvador,
Ba/Brasil. (2014).
METTERNICH, J.; ABELE, E.; BECHTLOFF, S.; SEIFERMANN, S. Static total cost
comparison model to identify economic fields of application of Cellular Manufacturing for
milling and drilling processes versus done-in-one-concepts. CIRP Annals - Manufacturing
Technology, 64(1), 471-474. 2015.
MONTEVECHI, J.A. B.; SENA, D. C.; SILVA, E. M. M. S.; SCHEIDEGGER, A. P. G.
Hybrid simulation of production process of Pupunha palm. 2015 Winter Simulation
Conference, Huntington Beach/California. 2015, December.
OBARA, S. Toyota by Toyota – Reflections from the inside. Taylor & Francis USA, 2012.
RUPARATHNA, R.; HEWAGE, K.; SADIQ, R. Economic evaluation of building energy
retrofits: A fuzzy based approach. Energy and Buildings, v. 139, n. 15, p. 395-406. 2017.
Stadnicka, D., & Antosz, K. (2015). The Investigation of Setups and Development of
Decision Support Model for Setups Selection to SMED Analysis. Journal of Business and
Economics, v. 6, n. 7, p. 1334-1347.
Swann, K. Técnicas de produção eficiente. London: MacMillan, 1973.
TROCHIM, W. M.; MCLINDEN, D. Introduction to a special issue on concept mapping.
Evalluation and Program Planning, v. 60, p. 166-175. 2017.
ZWICKER, C.; REINHART, G. System for the Estimation of Robot Cycle Times in Early
Production Planning Phase. Applied Mechanics and Materials, 840, p. 99-106. 2016.


![MTM-400 Reaktivt taktilluftsdon [rörlig underplåt]GTD Rumsklimatsreglering DCV-RC AC omm. MTM + Donlåda HMK Typlösning - Landskap med MTM. MTM-400 Reaktivt taktilluftsdon [rörlig](https://img.pdfslide.net/doc/110x75/60e48d1000dbc51cda4a5fe9/mtm-400-reaktivt-taktilluftsdon-rrlig-underplt-gtd-rumsklimatsreglering-dcv-rc.jpg)


![[Gregory Z. Bedny, Waldemar Karwowski] Human-Compu(Bookos.org)](https://img.pdfslide.net/doc/110x75/55cf9c2d550346d033a8ea1f/gregory-z-bedny-waldemar-karwowski-human-compubookosorg.jpg)