Embed Size (px)
Citation preview
European Journal of Operational Research 185 (2008) 905–914
www.elsevier.com/locate/ejor
Balancing the NHS balanced scorecard!
Brijesh Patel *, Thierry Chaussalet, Peter Millard
Health and Social Care Modelling Group, University of Westminster, NG103 Copeland Building,
115 New Cavendish Street, London W1W 6UW, United Kingdom
Received 1 April 2005; accepted 1 February 2006Available online 13 October 2006
Abstract
In the UK, the split between opposition and supporters views of the National Health Service (NHS) performance rat-ings system is growing. Objective argument and consensus would be facilitated if a methodology was developed whichshowed the cause and effect relationships between the components of the performance rating system. The NHS hospitaltrust performance ratings data used in 2002 and 2003 were downloaded from the Department of Health performance rat-ing website. Structural equation modelling was used to construct a causal-loop diagram showing the cause and effect rela-tionships between the 16 common performance indicators in the two years. Scenario testing suggests that indicators ofdelayed transfer of care and of data quality are compromised if emergency readmissions performance is improved.� 2006 Elsevier B.V. All rights reserved.
Keywords: Health services; Balanced scorecard; System thinking; Structural equation modelling; Performance management
1. Introduction
The ageing populations and increased cost ofmedical care in most developed countries have madehealthcare a very demanding task for governmentsworldwide. Hospital staff and managers are underpressure and concerned for effective use of scarceresources and sustainable performance. To thateffect, in the UK, the NHS has introduced a bal-anced scorecard [1] (BSC) as a part of the frame-work for hospital trusts’ performance ratings. Thepurpose of the performance ratings framework isdebatable but is assumed to contribute towards per-formance management in the NHS.
0377-2217/$ - see front matter � 2006 Elsevier B.V. All rights reserved
doi:10.1016/j.ejor.2006.02.056
* Corresponding author.E-mail address: [email protected] (B. Patel).
Many more organisations, both public and pri-vate, have been focusing on long-term performanceand the use of BSC as part of a performance man-agement framework [2–5]. The BSC is a balancedrepresentation of performance of internal as wellas external objectives. A typical BSC has financial,customer, internal processes, and learning andgrowth dimensions. These dimensions are interre-lated with cause-and-effect relationships in a tree-like fashion [6]. Cause-and-effect relationshipsamongst these dimensions imply how fruits (finan-cial measures) in the tree are related to leaves (cus-tomers), trunk (processes) and roots (learning andgrowth).
The NHS has been following a balanced score-card approach since 2001. The framework is rapidlyevolving [7–9]. Fig. 1 indicates that, prior to 2001,the performance ratings were based on a set of
.
After 2001
Before 2001
Key Targets CHI Review
Key Targets BSC CHI Review
Fig. 1. Change in performance rating framework for NHShospitals in UK.
906 B. Patel et al. / European Journal of Operational Research 185 (2008) 905–914
key targets and reviews by the Commission forHealth Improvement (CHI). Now, NHS hospitaltrusts are rated using BSC performance indicatorsin addition to the previous criteria.
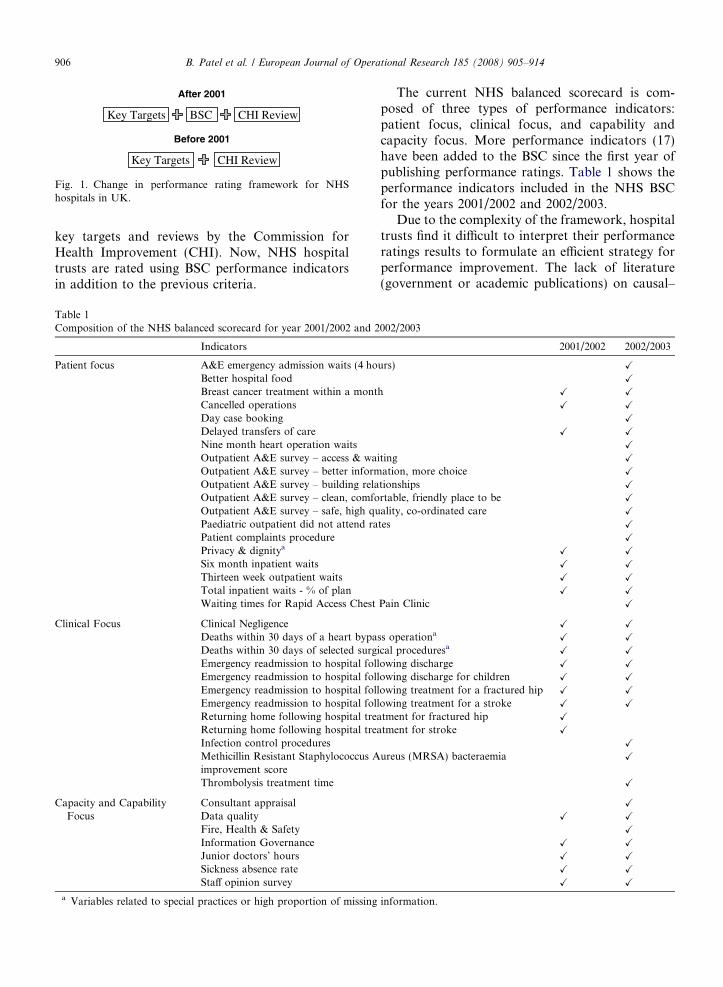
Table 1Composition of the NHS balanced scorecard for year 2001/2002 and 2
Indicators
Patient focus A&E emergency admission waits (4 hoBetter hospital foodBreast cancer treatment within a montCancelled operationsDay case bookingDelayed transfers of careNine month heart operation waitsOutpatient A&E survey – access & waOutpatient A&E survey – better informOutpatient A&E survey – building relaOutpatient A&E survey – clean, comfoOutpatient A&E survey – safe, high quPaediatric outpatient did not attend raPatient complaints procedurePrivacy & dignitya
Six month inpatient waitsThirteen week outpatient waitsTotal inpatient waits - % of planWaiting times for Rapid Access Chest
Clinical Focus Clinical NegligenceDeaths within 30 days of a heart bypaDeaths within 30 days of selected surgEmergency readmission to hospital folEmergency readmission to hospital folEmergency readmission to hospital folEmergency readmission to hospital folReturning home following hospital treReturning home following hospital treInfection control proceduresMethicillin Resistant Staphylococcus Aimprovement scoreThrombolysis treatment time
Capacity and CapabilityFocus
Consultant appraisalData qualityFire, Health & SafetyInformation GovernanceJunior doctors’ hoursSickness absence rateStaff opinion survey
a Variables related to special practices or high proportion of missing
The current NHS balanced scorecard is com-posed of three types of performance indicators:patient focus, clinical focus, and capability andcapacity focus. More performance indicators (17)have been added to the BSC since the first year ofpublishing performance ratings. Table 1 shows theperformance indicators included in the NHS BSCfor the years 2001/2002 and 2002/2003.
Due to the complexity of the framework, hospitaltrusts find it difficult to interpret their performanceratings results to formulate an efficient strategy forperformance improvement. The lack of literature(government or academic publications) on causal–
002/2003
2001/2002 2002/2003
urs) X
X
h X X
X X
X
X X
X
iting X
ation, more choice X
tionships X
rtable, friendly place to be X
ality, co-ordinated care X
tes X
X
X X
X X
X X
X X
Pain Clinic X
X X
ss operationaX X
ical proceduresaX X
lowing discharge X X
lowing discharge for children X X
lowing treatment for a fractured hip X X
lowing treatment for a stroke X X
atment for fractured hip X
atment for stroke X
X
ureus (MRSA) bacteraemia X
X
X
X X
X
X X
X X
X X
X X
information.
Pro
cess
es
Out
put
Data Selection and Pre-processing
Model investigation
Model Representation
Causal-loop diagram
Scenario Testing
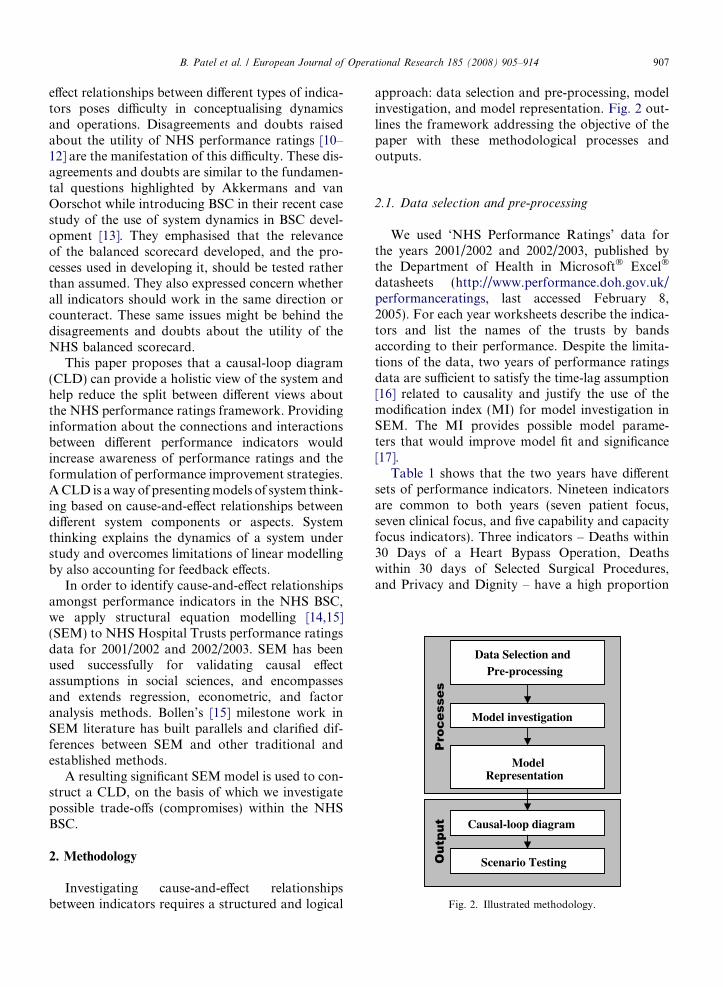
Fig. 2. Illustrated methodology.
B. Patel et al. / European Journal of Operational Research 185 (2008) 905–914 907
effect relationships between different types of indica-tors poses difficulty in conceptualising dynamicsand operations. Disagreements and doubts raisedabout the utility of NHS performance ratings [10–12] are the manifestation of this difficulty. These dis-agreements and doubts are similar to the fundamen-tal questions highlighted by Akkermans and vanOorschot while introducing BSC in their recent casestudy of the use of system dynamics in BSC devel-opment [13]. They emphasised that the relevanceof the balanced scorecard developed, and the pro-cesses used in developing it, should be tested ratherthan assumed. They also expressed concern whetherall indicators should work in the same direction orcounteract. These same issues might be behind thedisagreements and doubts about the utility of theNHS balanced scorecard.
This paper proposes that a causal-loop diagram(CLD) can provide a holistic view of the system andhelp reduce the split between different views aboutthe NHS performance ratings framework. Providinginformation about the connections and interactionsbetween different performance indicators wouldincrease awareness of performance ratings and theformulation of performance improvement strategies.A CLD is a way of presenting models of system think-ing based on cause-and-effect relationships betweendifferent system components or aspects. Systemthinking explains the dynamics of a system understudy and overcomes limitations of linear modellingby also accounting for feedback effects.
In order to identify cause-and-effect relationshipsamongst performance indicators in the NHS BSC,we apply structural equation modelling [14,15](SEM) to NHS Hospital Trusts performance ratingsdata for 2001/2002 and 2002/2003. SEM has beenused successfully for validating causal effectassumptions in social sciences, and encompassesand extends regression, econometric, and factoranalysis methods. Bollen’s [15] milestone work inSEM literature has built parallels and clarified dif-ferences between SEM and other traditional andestablished methods.
A resulting significant SEM model is used to con-struct a CLD, on the basis of which we investigatepossible trade-offs (compromises) within the NHSBSC.
2. Methodology
Investigating cause-and-effect relationshipsbetween indicators requires a structured and logical
approach: data selection and pre-processing, modelinvestigation, and model representation. Fig. 2 out-lines the framework addressing the objective of thepaper with these methodological processes andoutputs.
2.1. Data selection and pre-processing
We used ‘NHS Performance Ratings’ data forthe years 2001/2002 and 2002/2003, published bythe Department of Health in Microsoft� Excel�
datasheets (http://www.performance.doh.gov.uk/performanceratings, last accessed February 8,2005). For each year worksheets describe the indica-tors and list the names of the trusts by bandsaccording to their performance. Despite the limita-tions of the data, two years of performance ratingsdata are sufficient to satisfy the time-lag assumption[16] related to causality and justify the use of themodification index (MI) for model investigation inSEM. The MI provides possible model parame-ters that would improve model fit and significance[17].
Table 1 shows that the two years have differentsets of performance indicators. Nineteen indicatorsare common to both years (seven patient focus,seven clinical focus, and five capability and capacityfocus indicators). Three indicators – Deaths within30 Days of a Heart Bypass Operation, Deathswithin 30 days of Selected Surgical Procedures,and Privacy and Dignity – have a high proportion
908 B. Patel et al. / European Journal of Operational Research 185 (2008) 905–914
of missing information or relate to special practice,hence, are not applicable to all hospital trusts. Thusthis study is based on the 16 common performanceindicators for which data is available.
Data pre-processing involved definition of miss-ing values for selected performance indicators andconversion of all percentage variables into fractionsof one to minimise scale difference.
2.2. Model investigation
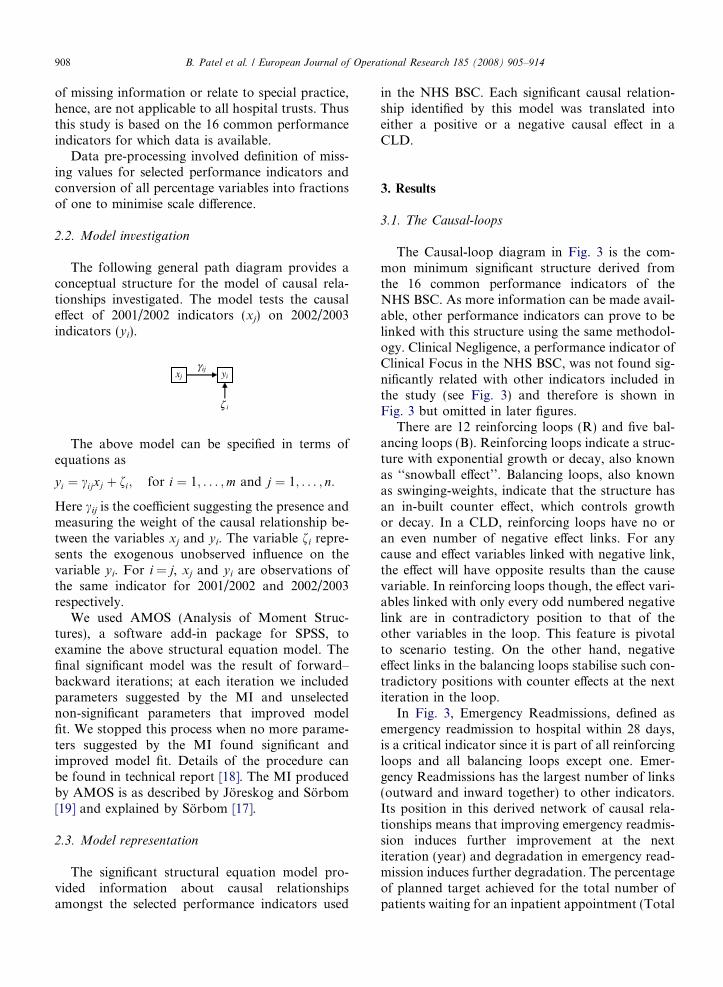
The following general path diagram provides aconceptual structure for the model of causal rela-tionships investigated. The model tests the causaleffect of 2001/2002 indicators (xj) on 2002/2003indicators (yi).
xj yi
ζ i
γ ij
The above model can be specified in terms ofequations as
yi ¼ cijxj þ fi; for i ¼ 1; . . . ;m and j ¼ 1; . . . ; n:
Here cij is the coefficient suggesting the presence andmeasuring the weight of the causal relationship be-tween the variables xj and yi. The variable fi repre-sents the exogenous unobserved influence on thevariable yi. For i = j, xj and yi are observations ofthe same indicator for 2001/2002 and 2002/2003respectively.
We used AMOS (Analysis of Moment Struc-tures), a software add-in package for SPSS, toexamine the above structural equation model. Thefinal significant model was the result of forward–backward iterations; at each iteration we includedparameters suggested by the MI and unselectednon-significant parameters that improved modelfit. We stopped this process when no more parame-ters suggested by the MI found significant andimproved model fit. Details of the procedure canbe found in technical report [18]. The MI producedby AMOS is as described by Joreskog and Sorbom[19] and explained by Sorbom [17].
2.3. Model representation
The significant structural equation model pro-vided information about causal relationshipsamongst the selected performance indicators used
in the NHS BSC. Each significant causal relation-ship identified by this model was translated intoeither a positive or a negative causal effect in aCLD.
3. Results
3.1. The Causal-loops
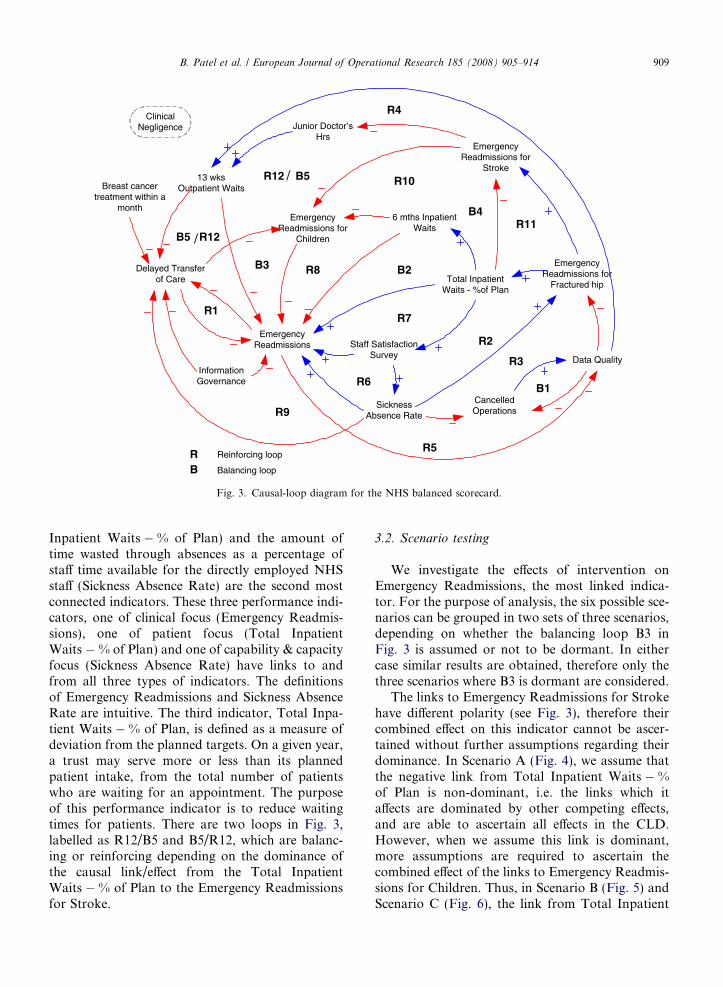
The Causal-loop diagram in Fig. 3 is the com-mon minimum significant structure derived fromthe 16 common performance indicators of theNHS BSC. As more information can be made avail-able, other performance indicators can prove to belinked with this structure using the same methodol-ogy. Clinical Negligence, a performance indicator ofClinical Focus in the NHS BSC, was not found sig-nificantly related with other indicators included inthe study (see Fig. 3) and therefore is shown inFig. 3 but omitted in later figures.
There are 12 reinforcing loops (R) and five bal-ancing loops (B). Reinforcing loops indicate a struc-ture with exponential growth or decay, also knownas ‘‘snowball effect’’. Balancing loops, also knownas swinging-weights, indicate that the structure hasan in-built counter effect, which controls growthor decay. In a CLD, reinforcing loops have no oran even number of negative effect links. For anycause and effect variables linked with negative link,the effect will have opposite results than the causevariable. In reinforcing loops though, the effect vari-ables linked with only every odd numbered negativelink are in contradictory position to that of theother variables in the loop. This feature is pivotalto scenario testing. On the other hand, negativeeffect links in the balancing loops stabilise such con-tradictory positions with counter effects at the nextiteration in the loop.
In Fig. 3, Emergency Readmissions, defined asemergency readmission to hospital within 28 days,is a critical indicator since it is part of all reinforcingloops and all balancing loops except one. Emer-gency Readmissions has the largest number of links(outward and inward together) to other indicators.Its position in this derived network of causal rela-tionships means that improving emergency readmis-sion induces further improvement at the nextiteration (year) and degradation in emergency read-mission induces further degradation. The percentageof planned target achieved for the total number ofpatients waiting for an inpatient appointment (Total
Emergency Readmissions
Data Quality
6 mths Inpatient Waits
Delayed Transfer of Care
Cancelled Operations
Emergency Readmissions for
Children
Emergency Readmissions for
Stroke
Emergency Readmissions for
Fractured hip
Staff Satisfaction Survey
Junior Doctor’s Hrs
Total Inpatient Waits - %of Plan
13 wks Outpatient Waits
Sickness Absence Rate
Information Governance
Breast cancer treatment within a
month
/
/
R5
B1
R3
R2
R11B4
R10
R4
B5R12
B5 R12
B3 R8 B2
R7
R6
R9
R1
Reinforcing loop
Balancing loop
RB
Clinical Negligence
Fig. 3. Causal-loop diagram for the NHS balanced scorecard.
B. Patel et al. / European Journal of Operational Research 185 (2008) 905–914 909
Inpatient Waits � % of Plan) and the amount oftime wasted through absences as a percentage ofstaff time available for the directly employed NHSstaff (Sickness Absence Rate) are the second mostconnected indicators. These three performance indi-cators, one of clinical focus (Emergency Readmis-sions), one of patient focus (Total InpatientWaits � % of Plan) and one of capability & capacityfocus (Sickness Absence Rate) have links to andfrom all three types of indicators. The definitionsof Emergency Readmissions and Sickness AbsenceRate are intuitive. The third indicator, Total Inpa-tient Waits � % of Plan, is defined as a measure ofdeviation from the planned targets. On a given year,a trust may serve more or less than its plannedpatient intake, from the total number of patientswho are waiting for an appointment. The purposeof this performance indicator is to reduce waitingtimes for patients. There are two loops in Fig. 3,labelled as R12/B5 and B5/R12, which are balanc-ing or reinforcing depending on the dominance ofthe causal link/effect from the Total InpatientWaits � % of Plan to the Emergency Readmissionsfor Stroke.
3.2. Scenario testing
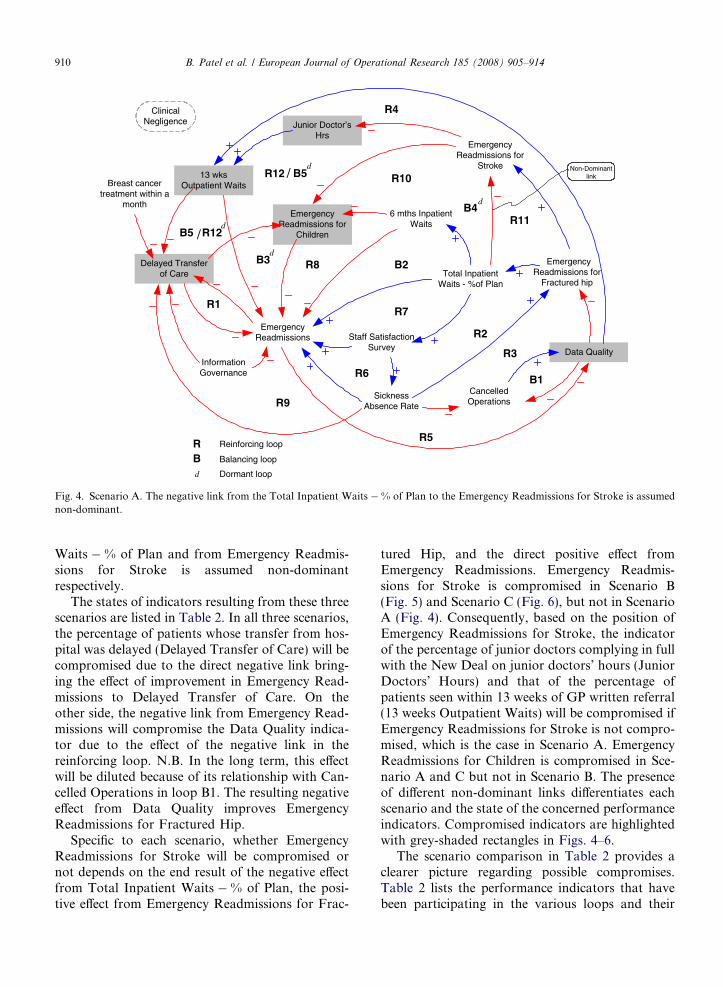
We investigate the effects of intervention onEmergency Readmissions, the most linked indica-tor. For the purpose of analysis, the six possible sce-narios can be grouped in two sets of three scenarios,depending on whether the balancing loop B3 inFig. 3 is assumed or not to be dormant. In eithercase similar results are obtained, therefore only thethree scenarios where B3 is dormant are considered.
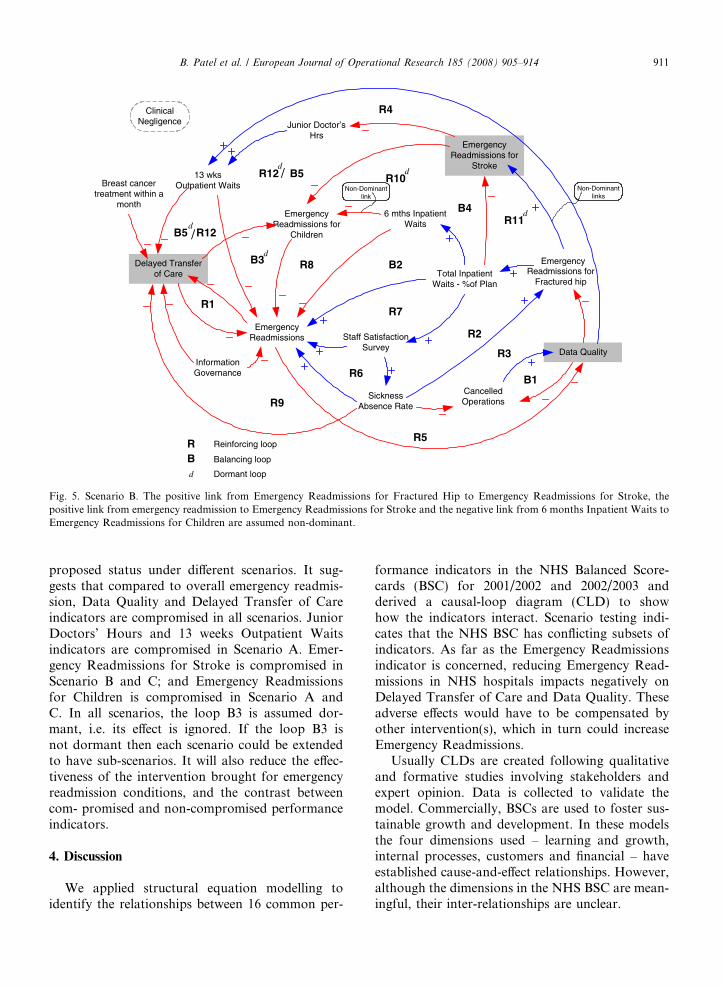
The links to Emergency Readmissions for Strokehave different polarity (see Fig. 3), therefore theircombined effect on this indicator cannot be ascer-tained without further assumptions regarding theirdominance. In Scenario A (Fig. 4), we assume thatthe negative link from Total Inpatient Waits � %of Plan is non-dominant, i.e. the links which itaffects are dominated by other competing effects,and are able to ascertain all effects in the CLD.However, when we assume this link is dominant,more assumptions are required to ascertain thecombined effect of the links to Emergency Readmis-sions for Children. Thus, in Scenario B (Fig. 5) andScenario C (Fig. 6), the link from Total Inpatient
Emergency Readmissions
Data Quality
6 mths Inpatient Waits
Delayed Transfer of Care
Cancelled Operations
Emergency Readmissions for
Children
Emergency Readmissions for
Stroke
Emergency Readmissions for
Fractured hip
Staff Satisfaction Survey
Junior Doctor’s Hrs
Total Inpatient Waits - %of Plan
13 wks Outpatient Waits
Sickness Absence Rate
Information Governance
Breast cancer treatment within a
month
/
/
R5
B1
R3
R2
R11B4
R10
R4
B5R12
B5 R12
B3 R8 B2
R7
R6
R9
R1
Reinforcing loop
Balancing loop
Dormant loopd
RB
Non-Dominant link
d
d
d
Clinical Negligence
d
Fig. 4. Scenario A. The negative link from the Total Inpatient Waits � % of Plan to the Emergency Readmissions for Stroke is assumednon-dominant.
910 B. Patel et al. / European Journal of Operational Research 185 (2008) 905–914
Waits � % of Plan and from Emergency Readmis-sions for Stroke is assumed non-dominantrespectively.
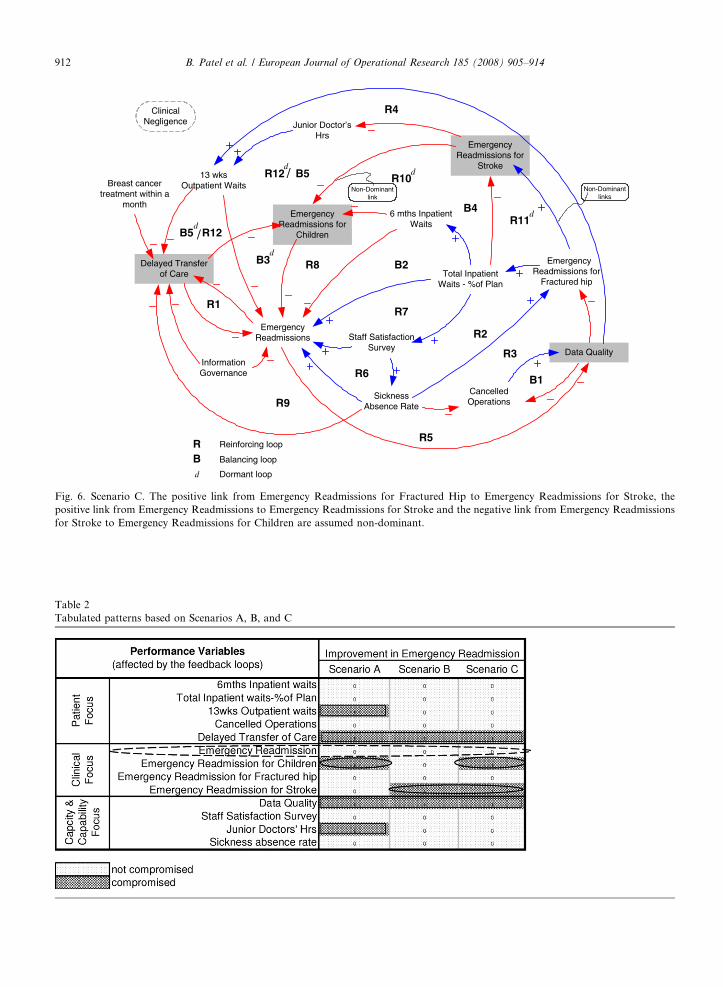
The states of indicators resulting from these threescenarios are listed in Table 2. In all three scenarios,the percentage of patients whose transfer from hos-pital was delayed (Delayed Transfer of Care) will becompromised due to the direct negative link bring-ing the effect of improvement in Emergency Read-missions to Delayed Transfer of Care. On theother side, the negative link from Emergency Read-missions will compromise the Data Quality indica-tor due to the effect of the negative link in thereinforcing loop. N.B. In the long term, this effectwill be diluted because of its relationship with Can-celled Operations in loop B1. The resulting negativeeffect from Data Quality improves EmergencyReadmissions for Fractured Hip.
Specific to each scenario, whether EmergencyReadmissions for Stroke will be compromised ornot depends on the end result of the negative effectfrom Total Inpatient Waits � % of Plan, the posi-tive effect from Emergency Readmissions for Frac-
tured Hip, and the direct positive effect fromEmergency Readmissions. Emergency Readmis-sions for Stroke is compromised in Scenario B(Fig. 5) and Scenario C (Fig. 6), but not in ScenarioA (Fig. 4). Consequently, based on the position ofEmergency Readmissions for Stroke, the indicatorof the percentage of junior doctors complying in fullwith the New Deal on junior doctors’ hours (JuniorDoctors’ Hours) and that of the percentage ofpatients seen within 13 weeks of GP written referral(13 weeks Outpatient Waits) will be compromised ifEmergency Readmissions for Stroke is not compro-mised, which is the case in Scenario A. EmergencyReadmissions for Children is compromised in Sce-nario A and C but not in Scenario B. The presenceof different non-dominant links differentiates eachscenario and the state of the concerned performanceindicators. Compromised indicators are highlightedwith grey-shaded rectangles in Figs. 4–6.
The scenario comparison in Table 2 provides aclearer picture regarding possible compromises.Table 2 lists the performance indicators that havebeen participating in the various loops and their
Emergency Readmissions
Data Quality
6 mths Inpatient Waits
Delayed Transfer of Care
Cancelled Operations
Emergency Readmissions for
Children
Emergency Readmissions for
Stroke
Emergency Readmissions for
Fractured hip
Staff Satisfaction Survey
Junior Doctor’s Hrs
Total Inpatient Waits - %of Plan
13 wks Outpatient Waits
Sickness Absence Rate
Information Governance
Breast cancer treatment within a
month
/
/
R5
B1
R3
R2
R11B4
R10
R4
B5R12
B5 R12
B3 R8 B2
R7
R6
R9
R1
Non-Dominant links
Non-Dominant link
d
d
d
d
Reinforcing loop
Balancing loop
Dormant loopd
RB
Clinical Negligence
d
Fig. 5. Scenario B. The positive link from Emergency Readmissions for Fractured Hip to Emergency Readmissions for Stroke, thepositive link from emergency readmission to Emergency Readmissions for Stroke and the negative link from 6 months Inpatient Waits toEmergency Readmissions for Children are assumed non-dominant.
B. Patel et al. / European Journal of Operational Research 185 (2008) 905–914 911
proposed status under different scenarios. It sug-gests that compared to overall emergency readmis-sion, Data Quality and Delayed Transfer of Careindicators are compromised in all scenarios. JuniorDoctors’ Hours and 13 weeks Outpatient Waitsindicators are compromised in Scenario A. Emer-gency Readmissions for Stroke is compromised inScenario B and C; and Emergency Readmissionsfor Children is compromised in Scenario A andC. In all scenarios, the loop B3 is assumed dor-mant, i.e. its effect is ignored. If the loop B3 isnot dormant then each scenario could be extendedto have sub-scenarios. It will also reduce the effec-tiveness of the intervention brought for emergencyreadmission conditions, and the contrast betweencom- promised and non-compromised performanceindicators.
4. Discussion
We applied structural equation modelling toidentify the relationships between 16 common per-
formance indicators in the NHS Balanced Score-cards (BSC) for 2001/2002 and 2002/2003 andderived a causal-loop diagram (CLD) to showhow the indicators interact. Scenario testing indi-cates that the NHS BSC has conflicting subsets ofindicators. As far as the Emergency Readmissionsindicator is concerned, reducing Emergency Read-missions in NHS hospitals impacts negatively onDelayed Transfer of Care and Data Quality. Theseadverse effects would have to be compensated byother intervention(s), which in turn could increaseEmergency Readmissions.
Usually CLDs are created following qualitativeand formative studies involving stakeholders andexpert opinion. Data is collected to validate themodel. Commercially, BSCs are used to foster sus-tainable growth and development. In these modelsthe four dimensions used – learning and growth,internal processes, customers and financial – haveestablished cause-and-effect relationships. However,although the dimensions in the NHS BSC are mean-ingful, their inter-relationships are unclear.
Emergency Readmissions
Data Quality
6 mths Inpatient Waits
Delayed Transfer of Care
Cancelled Operations
Emergency Readmissions for
Children
Emergency Readmissions for
Stroke
Emergency Readmissions for
Fractured hip
Staff Satisfaction Survey
Junior Doctor’s Hrs
Total Inpatient Waits - %of Plan
13 wks Outpatient Waits
Sickness Absence Rate
Information Governance
Breast cancer treatment within a
month
/
/
R5
B1
R3
R2
R11B4
R10
R4
B5R12
B5 R12
B3 R8 B2
R7
R6
R9
R1
Non-Dominant links
Non-Dominant link
d
d
d
d
Reinforcing loop
Balancing loop
Dormant loopd
RB
Clinical Negligence
d
Fig. 6. Scenario C. The positive link from Emergency Readmissions for Fractured Hip to Emergency Readmissions for Stroke, thepositive link from Emergency Readmissions to Emergency Readmissions for Stroke and the negative link from Emergency Readmissionsfor Stroke to Emergency Readmissions for Children are assumed non-dominant.
Table 2Tabulated patterns based on Scenarios A, B, and C
912 B. Patel et al. / European Journal of Operational Research 185 (2008) 905–914
B. Patel et al. / European Journal of Operational Research 185 (2008) 905–914 913
Identifying the statistically significant relation-ships between the indicators in the NHS BSC wouldprovide the basis for understanding the dynamics ofa basket of performance indicators. This objectiveforms the basis of this novel approach to recon-struct the relationships between indicators of theNHS BSC. Using structured equation modellingwe determined the statistical relationships (p-value < 0.05) between 16 of the common indicatorsin the scorecard. Using casual-loop diagrams wefound that the key indicator was emergencyreadmission.
The central role of emergency readmission withinthe current set of indicators suggests that the start-ing point to address the recurring problems inNHS hospitals is to focus on the clinical and socialcauses of emergency readmissions. A word of cau-tion should be expressed, however, because ourCLD was based only on two years PerformanceData for all Acute NHS Trusts in England. Threeperformance indicators were excluded as they hadinsufficient data. If the data had been available,including these indicators might have added morelinks and loops. However, the structure presentedhere would remain valid as the existing relationshipswould not have changed. Thus causal-loop dia-grams could be used as a reference framework, tobuild a consensus for policy actions that would leadto a solution for current problems.
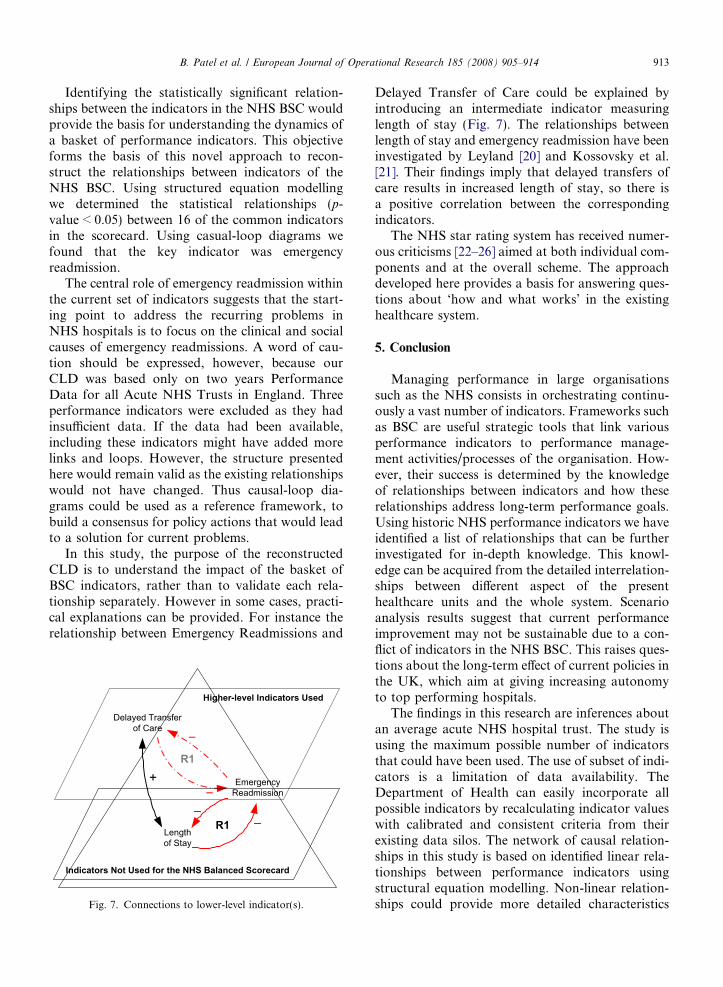
In this study, the purpose of the reconstructedCLD is to understand the impact of the basket ofBSC indicators, rather than to validate each rela-tionship separately. However in some cases, practi-cal explanations can be provided. For instance therelationship between Emergency Readmissions and
EmergencyReadmission
Delayed Transferof Care
R1
Lengthof Stay
R1
+
Higher-level Indicators Used
Indicators Not Used for the NHS Balanced Scorecard
Fig. 7. Connections to lower-level indicator(s).
Delayed Transfer of Care could be explained byintroducing an intermediate indicator measuringlength of stay (Fig. 7). The relationships betweenlength of stay and emergency readmission have beeninvestigated by Leyland [20] and Kossovsky et al.[21]. Their findings imply that delayed transfers ofcare results in increased length of stay, so there isa positive correlation between the correspondingindicators.
The NHS star rating system has received numer-ous criticisms [22–26] aimed at both individual com-ponents and at the overall scheme. The approachdeveloped here provides a basis for answering ques-tions about ‘how and what works’ in the existinghealthcare system.
5. Conclusion
Managing performance in large organisationssuch as the NHS consists in orchestrating continu-ously a vast number of indicators. Frameworks suchas BSC are useful strategic tools that link variousperformance indicators to performance manage-ment activities/processes of the organisation. How-ever, their success is determined by the knowledgeof relationships between indicators and how theserelationships address long-term performance goals.Using historic NHS performance indicators we haveidentified a list of relationships that can be furtherinvestigated for in-depth knowledge. This knowl-edge can be acquired from the detailed interrelation-ships between different aspect of the presenthealthcare units and the whole system. Scenarioanalysis results suggest that current performanceimprovement may not be sustainable due to a con-flict of indicators in the NHS BSC. This raises ques-tions about the long-term effect of current policies inthe UK, which aim at giving increasing autonomyto top performing hospitals.
The findings in this research are inferences aboutan average acute NHS hospital trust. The study isusing the maximum possible number of indicatorsthat could have been used. The use of subset of indi-cators is a limitation of data availability. TheDepartment of Health can easily incorporate allpossible indicators by recalculating indicator valueswith calibrated and consistent criteria from theirexisting data silos. The network of causal relation-ships in this study is based on identified linear rela-tionships between performance indicators usingstructural equation modelling. Non-linear relation-ships could provide more detailed characteristics
914 B. Patel et al. / European Journal of Operational Research 185 (2008) 905–914
of the relationships between indicators and could beinvestigated in further research. Further researchwill look for approaches to incorporate the chang-ing composition of the BSC and observe character-istics over a longer period.
References
[1] R.S. Kaplan, D.P. Norton, The balanced scorecard –measures that drive performance, Harvard Business Review70 (1) (1992) 71–79.
[2] K. Castaneda-Mendez, K. Mangan, A.M. Lavery, The roleand application of the balanced scorecard in healthcarequality management, Journal for Healthcare Quality 20 (1)(1998) 1–10.
[3] M.A. Fitzpatrick, Let’s bring balance to health care, NursingManagement 33 (3) (2002) 35–37.
[4] J.R. Griffith, J.A. Alexander, R.C. Jelinek, Measuringcomparative hospital performance, Journal of HealthcareManagement 47 (1) (2002) 1–57.
[5] J. Solano et al., Integration of systemic quality and thebalanced scorecard, Information Systems Management 20(1) (2003) 66–81.
[6] R.S. Kaplan, D.P. Norton, The Balanced Scorecard: Trans-lating Strategy into Action, Harvard Business School Press,Boston, MA, 1996.
[7] DoH, NHS Performance Ratings: Acute Trusts 2000/01,Leaflet, Department of Health, London, UK, 2001, 23p.
[8] DoH, NHS Performance Ratings and Indicators 2002,Department of Health, UK, 2002. Available from: <www.performance.doh.gov.uk/performanceratings/2002/tech_index_trusts.html>.
[9] DoH, NHS Performance Ratings: Introduction, Departmentof Health, UK, July, 2002. Available from: <www.perfor-mance.doh.gov.uk/performanceratings>.
[10] J. Carvel, Four of the ‘‘Top’’ Hospitals Fall Out of Running,The Guardian, London, 2003, July 16.
[11] Society-Guardian, NHS Star Ratings: Reaction in Quotes,The Guardian, London, 2003, July 16.
[12] T. Shifrin, New NHS Measures ‘‘Don’t go Far Enough’’,The Guardian, London, 2004, July 2.
[13] H.A. Akkermans, K.E. van Oorschot, Relevance assumed: Acase study of balanced scorecard development using systemdynamics, Journal of Operational Research Society 56 (8)(2005) 931–941.
[14] R.H. Hoyle, Structural Equation Modeling: Concepts, Issuesand Applications, Sage Publications, Thousand Oaks, Cal-ifornia, 1995.
[15] K.A. Bollen, Structural Equations with Latent Vari-ablesWiley Series in Probability and Mathematical Statistics,Wiley, New York, Chichester, 1989.
[16] G.W. Bohrnstedt, D. Knoke, Statistics for Social DataAnalysis, third ed., F.E. Peacock Publishers Inc., Itasca, IL,1994.
[17] D. Sorbom, Model modification, Psychometrika 54 (3)(1989) 371–384.
[18] B. Patel, Forward–backward stepwise selection strategy formodel investigation, Technical Report, Health and Social-care Modelling Group, University of Westminster, London,2005, 17pp.
[19] K.G. Joreskog, D. Sorbom, LISREL 7: A Guide to theProgram and Applications, second ed., SPSS Inc., Chicago,IL, 1989.
[20] A.H. Leyland, Examining the relationship between length ofstay and readmission rates for selected diagnoses in Scottishhospitals, IMA Journal of Mathematics Applied in Medicineand Biology 12 (3–4) (1995) 175–184.
[21] M.P. Kossovsky et al., Unplanned readmissions of patientswith congestive heart failure: Do they reflect in-hospitalquality of care or patient characteristics? American Journalof Medicine 109 (5) (2000) 386–390.
[22] R.M. Barker, M.S. Pearce, M. Irving, Star wars, NHS style,BMJ 329 (7457) (2004) 107–109.
[23] A. Gulland, Health professionals question ‘‘star ratings’’ forNHS, BMJ 325 (7358) (2002) 236.
[24] Z. Kmietowicz, Star rating system fails to reduce variation,BMJ 327 (7408) (2003) 184.
[25] R. Mannion, H. Davies, M. Marshall, Impact of starperformance ratings in English acute hospital trusts, Journalof Health Services Research and Policy 10 (1) (2005) 18–24.
[26] I. Snelling, Do star ratings really reflect hospital perfor-mance? Journal of Health Organization and Management 17(3) (2003) 210–223.