Embed Size (px)
Citation preview

Balancing the R&D equationMeasuring the return from pharmaceutical innovation 2016

Foreword 01
Executive summary 03
Measuring returns from pharmaceutical innovation 06
Balancing the R&D equation: Increasing pipeline value 18
Balancing the R&D equation: Reducing the cost to launch 28
Peer benchmarks and additional analysis 37
Contacts 39
Endnotes 40
Contents
The Deloitte Centre for Health SolutionsThe Deloitte UK Centre for Health Solutions generates insights and thought leadership based on the key trends, challenges and opportunities within the healthcare and life sciences industry. In producing this report we have worked closely with the US Center for Health Solutions in Washington DC, our teams of researchers develop ideas, innovations and insights that encourage collaboration across the health value chain, connecting the public and private sectors, health providers and purchasers, and consumers and suppliers. We aim to bring you unique perspectives to support you in the role you play in driving better patient outcomes, sustaining a strong health economy and enhancing the reputation of our industry. In this publication, references to Deloitte are references to Deloitte LLP, the UK member firm of DTTL.
GlobalDataGlobalData provides world-class healthcare research and consulting that delivers actionable insight and industry perspective on the critical decisions our clients have to make. Together with our experienced team of researchers, analysts, epidemiologists and consultants, and an unmatched suite of proprietary databases and workflow tools, we provide high-quality accurate and transparent insight that helps our clients achieve growth and increase business value. Combining precision with innovation, our research and consulting solutions ensure that our clients stay at the forefront of their markets by integrating forecasts and analysis on the latest trends and developments with the unrivalled expertise of our analyst teams.

Foreword
Colin TerryPartner, EMEA Life Sciences R&D AdvisoryDeloitte [email protected]
Neil LesserPrincipal, US Life Sciences R&D StrategyDeloitte Consulting [email protected]
Welcome to the seventh annual report from the Deloitte Centre for Health Solutions exploring the performance of the pharmaceutical industry and its ability to generate returns from its annual investment in new product innovation.
The report provides estimates of the return on investment that 12 leading biopharma companies might expect to achieve from their late-stage pipelines. Our analysis is focused on assets that are currently in late-stage development and expected to launch within the next one to four years, using data from publicly-available audited annual reports and forecasts provided by GlobalData.
Following on from our 2015 report ‘Transforming returns in uncertain times’ this report continues to track the performance of an extension cohort of four mid-to-large cap biopharma companies allowing us to compare and contrast their performance against the original cohort. This helps deepen our insights into company and portfolio characteristics that produce higher R&D returns.
In our 2015 report we analysed factors that positively influence returns for companies and improve outcomes for patients. This year we have supplemented this core quantitative analysis with information obtained from a series of qualitative interviews with industry executives and leading experts to focus on two key themes:
• the strategies that pharmaceutical companies employ during drug development that can positively influence the commercial success of a product
• the approaches used to drive greater R&D efficiency, reversing diseconomies of scale associated with drug development.
The industry continues to face regulatory and reimbursement hurdles that make the operating environment increasingly challenging. While inventive deal-making and collaborations continue, the biopharma industry needs to find a way to address structural and productivity challenges in order to grow and deliver future sources of innovative medicines. The productivity improvements needed are significant and will be extremely challenging for the industry to achieve.
We hope you find this report thought-provoking, and welcome your feedback on the findings and the implications for the industry.
01
Balancing the R&D equation | Measuring the return from pharmaceutical innovation 2016

2010$1.188bn
2015$1.576bn
up 33%
2016$1.539bndown 2%
2010$816m 2015
$416mdown 50%
2016$394m
down 5%
R&D costs
Forecast sales
Blockbuster costs... ...not blockbuster sales
R&D returns continue to decline for the original large-cap biopharma cohort
2010 2011 2012 2013 2014 2015 2016
10.1% 7.6% 7.3% 4.8% 5.5% 4.2% 3.7%
R&D costs per asset have stabilised for the originallarge-cap biopharma cohort but forecast peak sales per
asset continue to decline
02
Balancing the R&D equation | Measuring the return from pharmaceutical innovation 2016

Executive summary
The subject of projected returns on R&D investment remains as critical as ever for the industry. For investors, they present an objective performance measurement tool, help demonstrate shareholder value and justify the allocation of capital to R&D. They also provide a sound starting point for the ongoing dialogue between payers, Health Technology Assessment (HTA) groups and the biopharma industry, to help determine value for money from innovative medicines and understand the impact of declining incentives for innovation. In this report we continue to look beyond the analysis to consider actions that can be taken to improve returns in the context of today’s industry challenges.
The biopharma industry continues to face a challenging external environment Few of the external challenges faced by the industry that
have been documented in our previous reports are going away, and in many cases are increasing. Pricing is perhaps the most publicised challenge, with political and public scrutiny intensifying. Addressing unmet clinical needs is a growing challenge, especially in view of the availability of first- or second-line treatments already available that reduce or eliminate both the disease and its symptoms.
The industry continues to evolve in response to these challenges and our analysis now includes some of the changes that have occurred, including the GSK/Novartis asset swap and AbbVie’s acquisition of Pharmacyclics.
Overall performance continues to declineSince 2010, our original cohort of 12 companies has launched 233 products with projected total revenues of
$1,538 billion. Over the same period, the R&D divisions of these companies have progressed 376 assets into late-stage pipelines, with total forecast sales of $1,697 billion. Despite these successes, overall returns on pharmaceutical innovation continue to fall.
The projected returns generated by our original cohort has declined to 3.7 per cent from a high of 10.1 per cent in 2010. The decreasing trend in average peak sales per asset has also continued, with an average value of $394 million in 2016, an 11.4 per cent year-on-year fall since 2010. Costs to bring a product from discovery to launch have stabilised, moving from $1,576 million in 2015 to $1,539 million in 2016. This slight decrease is driven mostly by cycle time improvements, which may be due in part to the impact of reduced cycle times for breakthrough designations; however in the light of pricing uncertainty, these costs remain unsustainable.
While the number of assets in combined pipelines has remained relatively consistent for all years, in 2016 far fewer (21) would now be considered to have blockbuster status (assets with forecast peak sales greater than $1 billion). This has led to a situation in which there are blockbuster costs without balancing blockbuster revenues, an equation that does not add up for long-term stakeholder value.
The extension cohort of four mid-to-large cap biopharma companies, which in last year’s report outperformed the original cohort on every measure, has experienced a decline in overall performance, but continues to outperform the original cohort. The decline is due primarily to pipeline volatility, with a number of approvals during the year and new R&D costs from M&A. As this group evolves, it will be interesting to see how they translate new acquisitions and associated costs into pipeline value following their latest round of M&A activity.
03
Balancing the R&D equation | Measuring the return from pharmaceutical innovation 2016

Trends linked to increased returns continueTherapy area (TA) focus is linked to higher peak sales. Companies that have lower volatility in TA make-up of
their late-stage development portfolio outperform those that are continually changing the focus of their drug development efforts. We believe this is due to the depth of knowledge and scientific expertise needed to develop and successfully market products becoming embedded within the organisation. In comparison, companies that constantly change focus or are spread too thinly to foster depth of expertise may require higher investment to achieve similar future revenues.
Size continues to be a significant factor as there is a negative correlation between company size and predicted returns, and a positive correlation between company size and cost per asset. This holds true regardless of whether we consider only the original cohort or all 16 companies. We continue to deduce that scale acts as a barrier to creating value within an R&D organisation, and that fundamental company characteristics cause these differences in performance.
M&A may be about to increaseSince 2013 there has been a steady decrease in the proportion of projected late-stage pipeline revenue
derived from externally-sourced assets, a trend which accelerated in 2016 as more of the assets acquired as part of large-scale M&A in the late 2000s leave the late-stage pipelines. This trend, together with the decrease in returns, indicates that companies are struggling to replace pipeline value through self-originated assets. We anticipate that the coming years will see increasing M&A activity in a quest for higher R&D returns through R&D cost synergies or the acquisition of valuable assets. However the costs, both financial and otherwise, of these transactions are likely to be high and could place further pressure on R&D organisations that seem ‘too big to succeed’.
Strategic choices during R&D can positively or negatively impact long-term commercial valueResearch into outperforming brands shows that leading
companies tend to make a series of strategic decisions which collectively increase the commercial value of assets. These companies have explicit TA focus and expertise; target populations where value can be maximised; develop and adhere to a robust Target Product Profile (TPP); and generate evidence supporting the needs of all stakeholders.
Maintaining depth and focus within a TA is important for reducing volatility and improving returns. When entering into a new TA or major indication, we find that it is important to invest heavily in understanding the market and its competitive landscape, the needs of the patient population and the patient journey. Other elements of a successful strategy include:
• targeting patient populations where value can be maximised by taking time to understand and prioritise the order of entry; successful strategies tend to focus early launches on areas with the highest unmet needs and lowest commercial barriers
• developing and, more importantly, resisting the temptation to erode the TPP; as without constant open communication between cross-functional teams on how the minimum criteria were set and why it is critical to achieve those criteria, they can easily be lost
• ensuring that all external stakeholder needs are considered and met is important to the success and outperformance of the product, whether this involves a specific approach for accelerated approvals, understanding endpoints valued by patients, making the product easy to prescribe within the current healthcare infrastructure or engaging collaboratively with payers to effect win-win scenarios.
To enable these strategies, alignment of end-to-end decision-making and incentives across the organisation was a common theme amongst outperforming assets.
04
Balancing the R&D equation | Measuring the return from pharmaceutical innovation 2016

Companies can improve R&D efficiency, regardless of scaleWith scale acting as a barrier to creating value within
R&D organisations, we have observed that companies are able to achieve greater efficiency in drug development through nimble decision-making: empowering key decision-makers, accepting greater risk, making quick kills, and embedding a rigorous but dynamic process for funding projects. We outline some ways in which these can be applied across the industry.
The move to more extensive outsourcing within R&D promised greater efficiencies; however our findings and observations indicate that this has not consistently proved to be the case. Many of the contract organisation functions have not yet realised their full potential for delivering efficiencies, due in part to sub-optimal partner management by companies and the use of operating models that hinder externalisation. Having a clear sourcing strategy, reorganising around process outputs, and relinquishing some control are all key factors in unlocking potential benefits.
The data landscape within biopharma R&D is growing in complexity, placing a huge cost burden on organisations, making data both the biggest asset for biopharma and also a considerable liability. The key to successful exploitation of data remains the same: ensuring that data is held securely and is well-catalogued, accessible, and available to the right people when they need it, whether or not they knew it existed. To achieve this, critical requirements are prioritised approaches to data migration, and developing and implementing master data management principles that allow the landscape to be maintained with minimal effort. The role of the IT organisation needs to evolve into one that manages the information the business generates.
Creating large-scale organisations has failed to improve returns, while assets themselves continue to decline in value. Despite the performance of the extension cohort, there are signs they may be on a similar path unless they act proactively to maintain factors that have brought them past success. With a three-fold improvement in productivity required to balance the R&D equation, fundamental change may no longer be an option but a necessity for the industry, and in this year’s report we highlight some of the options available.
05
Balancing the R&D equation | Measuring the return from pharmaceutical innovation 2016

Measuring returns from pharmaceutical innovation
Few of the external challenges the industry is facing, documented in previous reports, are going away, and in many cases they are growing. Pricing is perhaps the most publicised challenge, with political and public scrutiny intensifying in recent months. What constitutes ‘normal’ price increases in drugs has also been extensively debated,1 particularly in view of the problem the general public has in distinguishing between price increases on existing products and the pricing of new medicines.
Regarding the price of new medicines ‘De-linkage of the costs of R&D from prices’ was suggested in the UN Secretary-General’s recent high-level panel on access to medicines report,2 but given that the report also highlights the need for new innovative medicines, it is unclear how they propose reconciling the two.
Identifying unmet clinical needs that can be realistically addressed, given scientific and economic constraints, is an increasing challenge, especially considering the availability of first- or second-line treatments which reduce or eliminate both the disease and its symptoms. Higher per-unit asset costs that do not deliver adequate returns on investment are a direct consequence of the smaller effective patient population sizes and increased competition. Some of the key measures taken by the industry to overcome these challenges are now reflected in our analysis, including the GSK/Novartis asset swap, and AbbVie’s acquisition of Pharmacyclics.
With seven years’ worth of data stretching back to 2010, this report continues to provide a comprehensive review of R&D performance.
A consistent approach to objective benchmarkingWith seven years’ worth of data stretching back to 2010, this report continues to provide a comprehensive review of R&D performance at an original cohort of 12 leading biopharma companies by R&D spend.
Our analysis presents a consistent and objective measure of industry performance, aimed at deriving insights into opportunities for improving return on investment in R&D. The underlying principles we have applied are comparability (a consistent, unbiased, direct comparison across the industry and investments of different sizes), accessibility (relevant to a diverse audience, both within and outside of the biopharma industry) and availability (the analysis is derived from publically available information from audited annual reports or readily accessible from third-party data providers).
To calculate the Internal Rate of Return (IRR) from a company’s late-stage pipeline, two inputs are calculated: the total costs incurred in bringing an asset (or basket of assets) to launch, and an estimate of the future net cash inflows these assets are forecast to deliver. Figure 1 summarises the methodology, showing both the static and dynamic measures of R&D returns.
In deriving these inputs the analysis accounts for: forecast revenue splits where a compound is in development for multiple indications; the impact of in-licencing and M&A on R&D costs; success rates in late-stage development; and the impact of clinical cycle times.
06
Balancing the R&D equation | Measuring the return from pharmaceutical innovation 2016

The use of total costs incurred within this analysis means the projected returns that we have calculated incorporate the cost of failure; that is they include expenditure on terminated programmes and compounds. Given the uncertainty and risks when undertaking R&D, incorporating the cost of failure provides a more well-rounded view of a company’s performance and decisions relating to capital allocation. It also ensures that costs are included, which may be missed from a bottom-up programmatic analysis.
To reduce the forecasting risk to an acceptable level, we limit our analysis to assets currently in late-stage development (Phase II breakthrough, Phase III and filed), given they are better characterised and forecasts should therefore contain a lower level of volatility than those in earlier phases of development.
We calculate the static year-on-year rate of return and also include the longer-term three-year average figures (which we first introduced in our 2015 report) as this reduces the volatility associated with the static measures and so provides a more well-rounded view of an organisation’s projected R&D returns to match the long time periods over which decisions within R&D play out.
For the second year, we have also analysed the R&D returns of four mid-to-large cap biopharma companies (covering the period 2013-2016). The inclusion of this extension cohort provides a greater understanding of their long-term performance and insight into factors linked to improved R&D productivity.
A detailed explanation of the methodology employed can be found at: www.deloitte.co.uk/measuringreturns.
Figure 1. Late-stage pipeline static IRR and drivers of change in IRR methodology
Source: Deloitte LLP
Static IRR:Snapshot calculation based
on investment costs and expected returns
Dynamic IRR:Illustrates the impact on
underlying levers on changes in IRR over time
Discovery Preclinical Phase I Phase II Phase III Launch21 year sales forecasts(from external supplier)
R&D costs (company annual reports) including cycle time and
allocations (benchmarks)
Basket of assets for which predicted
returns are measured
+ submittedfor approval
Existing assetSales forecasts
up/down
Transition of new assetsfrom earlier phases,in-licensed, acquired
Forecast sales from approved and launch assets fall out
Forecast sales fromterminated assets fall out
07
Balancing the R&D equation | Measuring the return from pharmaceutical innovation 2016

The trends continue as R&D returns decline againOur 2016 analysis sees a continuing decline in consolidated returns for the original cohort, from 10.1 per cent in 2010 to 3.7 per cent in 2016 (see Figure 2). To put this into context, the average industry cost of capital, the level against which R&D returns should be appraised, stands at approximately 8.4 per cent which is almost five percentage points above the 2016 figure for the original cohort.3
It is unclear whether the returns we are observing will stabilise, or whether the trend is set to continue; however given the ongoing decline, this report will take a closer look at the fundamental economics of the problem, the cost to develop assets and the value of those assets, in order to identify insights that can help to reverse the industry’s fortunes.
In response to the continual decline in returns, there is a tendency within the industry to use examples of successful launches to cite healthy R&D productivity. The original cohort of companies has been highly successful at commercialising their collective late-stage pipelines and launching new assets, with 233 assets launched since 2010 with total forecast lifetime sales of $1,538 billion. The past year has been no exception, with 45 approvals totalling $280 billion of forecast lifetime sales. However this commercial success releases value from late-stage pipelines into the commercial portfolio, and companies are struggling to bring forward new assets to replace those that are released into the market. Terminations and the rising costs of R&D have further exacerbated the fall in returns.
Despite the fall in returns, the 12 companies in the original cohort have brought 70 assets into late-stage development since 2015, with total forecast lifetime sales of $283 billion. Figure 3 shows there is a large variation in performance, with differences in returns between the top and bottom performer averaging about 13 percentage points each year since 2010. In 2016, three companies in the original cohort achieved returns of more than seven per cent on the static measure and half of the cohort (six companies) improved their static returns compared to 2015.
Figure 4 (on page 10) shows the effect on performance of various drivers, for the period 2010–16 and also for the most recent year 2015–16.
Some of the more promising signs in the changes between 2015 and 2016 are:
• new assets entering the pipeline accounted for an increase of 2.9 percentage points in IRR, with 70 assets entering late-stage development. However this was offset by approvals and terminations of 2.9 percentage points
• terminations were at their second-lowest since our records began in 2010
• R&D cycle times saw a slight improvement; this may indicate that the impact of accelerated pathways is starting to take effect, though on average assets are still taking 14 years and 5 months to launch.
Figure 2. Return on late-stage portfolio, 2010-16 – original cohort
Source: Deloitte LLP
Absolute IRR Number of assets
0%
2%
4%
6%
8%
10%
12%
2016201520142013201220112010
Abso
lute
IRR
(%)
0
50
100
150
200
250
Num
ber of assets in late-stage development
10.1
7.6 7.3
4.85.5
4.23.7
206
184195 194
181189 189
08
Balancing the R&D equation | Measuring the return from pharmaceutical innovation 2016

Figure 3. Return on late-stage portfolio, 2010-16 – original and extension cohort
Figure 3 shows the distribution of the original cohort’s performance from 2010-16 along with the average figures for the original cohort, and extension cohort from 2013-16.
Source: Deloitte LLP
17.4
Abso
lute
IRR
(%)
20%
15%
10%
5%
0%
-5%
-10% 2010 2011 2012 2013 2014 2015 2016
Original cohort
Extension cohort
17.7
16.1
9.910.1
7.6 7.3 4.8 5.5
4.2 3.7
Key
Top performer
Third quartile
Mean
Median
First quartile
Bottom performer
To put this into context, the average industry cost of capital, the level against which R&D returns should be appraised, stands at approximately 8.4 per cent which is almost five percentage points above the 2016 IRR figure for the original cohort.
Given the de-risking that takes place over time, all things being equal, the value from existing assets should increase as they move closer to launch. However, for the original cohort a fall in value has been observed in five of the six time-periods, with 2015 to 2016 showing a fall of 0.5 percentage points (see Figure 4).
Whilst positive trial data and an increase in potential patient populations are the main reasons for increases in value from existing assets, for the original cohort these have been more than offset by negative trial data, positive competitor data, increased biosimilar/generic erosion, lengthy delays in disclosing results, and decreases in forecast patient populations.
09
Balancing the R&D equation | Measuring the return from pharmaceutical innovation 2016

Figure 4. Drivers of change in IRR, 2010-16 consolidated, 2010-16 year-on-year and 2015-16 – original cohort
Figure 4 shows the aggregate drivers of change for the original cohort between 2010 and 2016, referencing this to the year-on-year return on late-stage portfolio.It then illustrates the drivers of change between 2015 and 2016.
Source: Deloitte LLP
0%
5%
10%
15%
20%
25%
2016OtherPhasingR&D cost(pure)
MarginTerminatedApprovedExistingNew2010
Abso
lute
IRR
(%)
0%
2%
4%
6%
8%
10%
12%
2016201520142013201220112010
Abso
lute
IRR
(%)
10.17.6 7.3
4.8 5.54.2 3.7
0%1%2%3%4%5%6%7%8%
2016OtherR&Dcost (pure)
MarginTerminatedApprovedExistingNew2015
Abso
lute
IRR
(%)
10.13.7
3.74.2
+14.8-13.9
-2.1
-3.5+0.4 -1.3 -0.9 +0.3
+2.9 -0.5 -2.6
-0.3 -0.2 -0.3 +0.6
10
Balancing the R&D equation | Measuring the return from pharmaceutical innovation 2016

The extension cohort has seen another strong year of commercialisation The extension cohort, included for the second time, but for which we now have four years’ worth of data, 2016 has been another strong year of commercialisation, with the successful launch of nine assets with total forecast sales of $187 billion.
However, static returns have fallen to 9.9 per cent in 2016, a decrease of 6.2 percentage points on 2015 (see Figure 5). Of this decrease, roughly half was attributable to net commercialisation: as assets launch, a greater amount of forecast sales have moved to the commercial portfolio (note; the commercial portfolio is not included in this analysis) than have entered as new assets joining late-stage pipelines. The rest of the decrease was attributable to increasing R&D costs, partly offset by improved operating margins and cost phasing.
This decrease in returns for the extension cohort could reflect natural volatility associated with their collective pipeline size; alternatively, they could be starting to experience similar problems to the original cohort. Even so, average returns for the extension cohort in 2016 are still higher than returns for even the best performer in the original cohort.
In addition to the decrease in returns, there are other signs that the extension cohort may be starting to experience similar issues to the larger biopharma companies, such as increasing costs to bring assets to launch. With the value from new assets entering late-stage development not matching the value of transitions to the commercial portfolio (see Figure 5), the challenge to replenish pipelines is being met in part through M&A and portfolio acquisitions, as the extension cohort looks to recharge pipelines with external assets.
In addition to the impact of M&A activity on returns, the extension cohort has steadily increased internal R&D expenditure, which accounted for 1.1 of the 3.5 percentage point decrease in returns since 2015 that was attributable to overall R&D costs.
The extension cohort has consistently added value to assets during late-stage development, in each of the three periods for which data has been obtained. Between 2015 and 2016 this added 1.2 percentage points to late-stage pipeline returns, driven largely by positive trial data and failure of competitor products. The only negative impact on returns came as a result of increases in biosimilar erosion curves.
Figure 5. Drivers of change in IRR, 2015-16 – extension cohort
Source: Deloitte LLP
0%
5%
10%
15%
20%
25%
2016OtherMarginPhasingR&D cost(pure)
TerminatedApprovedExistingNew2015
Abso
lute
IRR
(%)
16.19.9
+3.5 -8.2+1.2
0.0 -3.5+0.6 +0.2 -0.1
11
Balancing the R&D equation | Measuring the return from pharmaceutical innovation 2016

Realising adequate returns from biopharma R&D is a growing challengeOur 2015 report underlined the simple truth that R&D costs and sales have become unbalanced, producing an equation that is no longer set to deliver sustainable returns on innovation. In our 2016 report we continue to track the trend in both average peak sales per asset and average R&D costs to launch, for both the original and extension cohorts, and the impact this has on the R&D equation.
Sales are now a long way from average blockbuster levelsForecast asset sales continue to fall, with average peak sales for the original cohort now at $394 million, a 5.3 per cent fall since 2015 and a decrease of over 50 per cent since 2010 (see Figure 6).
The extension cohort has continued to outperform the original cohort, with average peak sales of $803 million in 2016, over twice the amount for the original cohort. This represents a fall of 28 per cent since 2015; however this can be attributed to the commercialisation of one or two key assets. Once this factor has been taken into account, the late-stage pipelines otherwise remain consistent with the figure in the 2015 report.
The total number of assets in late-stage development for the original cohort has remained relatively consistent, at 191 ± 15 or 7.8 per cent, approximately 16 assets per company on average. The continuing decline in returns is driven primarily by the decrease in average peak sales rather than the decrease in asset numbers or other factors (see Figure 7).
There remains a wide range in forecast peak sales within the product portfolio of the original cohort. However, although there are a number of assets in the portfolio with high average peak sales, the curve for 2016 lags behind previous years in terms of aggregate peak sales. Figure 8 shows how the contribution of blockbuster products has decreased significantly. 68 per cent of forecast sales in 2010 came from blockbuster assets (those with risk-adjusted forecast peak sales greater than $1 billion), compared with 44 per cent in 2016. This is reflected in the change in portfolio composition; in 2010 28 per cent of assets would have been considered blockbusters, compared to 12 per cent in 2016, whilst assets with forecast peak sales below $500 million represent 68 per cent of all assets in 2016, compared to 50 per cent in 2010.
Figure 6. Average peak sales per pipeline asset, 2010-16
Source: Deloitte LLP
$952
Peak
sal
es ($
m)
$1,600
$1,200
$800
$400
$0
2010 2011 2012 2013 2014 2015 2016
$816
$1,047$1,113
$801$702
$551$466 $471 $416 $394
$1,400
$1,000
$600
$200
Original cohort
Extension cohort
Key
Top performer
Third quartile
Mean
Median
First quartile
Bottom performer
12
Balancing the R&D equation | Measuring the return from pharmaceutical innovation 2016

Figure 7. Overall impact of pipeline factors on change in IRR, 2010-16 – original cohort
Source: Deloitte LLP
0%
2%
4%
6%
8%
10%
12%
2016OtherAverage salesper asset
Assetnumbers
2010
Abso
lute
IRR
(%)
10.1
3.7
0.7 4.1
1.5
The fall in average peak sales per asset, combined with the challenging time companies are having bringing value into late-stage pipelines, puts future growth into question. However, the cash-generative position highlighted in our 2015 report, driven by profitable legacy products, may be contributing to the general perception that the pricing of new medicines is putting profits before patients, rather than setting a fair price based on the economic outlay required.4 Whether it is due to this perception, the health of the global economy, or market economics, payer-driven pricing pressure is increasing.
With many diseases now having a first- or second-line treatment which causes reduction or elimination of symptoms and the disease, finding areas of economically-viable unmet clinical need, based on current science, is becoming more difficult. Areas where there is still unmet need, such as Alzheimer’s and other Central Nervous System (CNS) disorders, are proving to have complex and poorly-understood underlying biology, where clinical endpoints are hard to demonstrate. Combined with pricing pressure, this is leading to diminishing returns.
Figure 8. Proportion of forecast peak sales based on peak sales grouping, 2010-16 – original cohort
Source: Deloitte LLP
Prop
ortio
n of
pip
elin
e (%
)
0%
20%
40%
60%
80%
100%
2016201520142013201220112010
0-$500m$500m-$1bn>$1bn (blockbuster)
Our 2015 report underlined the simple truth that R&D costs and sales have become unbalanced, producing an equation that is no longer set to deliver sustainable returns on innovation.
13
Balancing the R&D equation | Measuring the return from pharmaceutical innovation 2016

Figure 9. Average R&D cost to develop a compound from discovery to launch, 2010-16
Source: Deloitte LLP
Cost
to la
unch
($m
)
$4,000
$3,000
$2,000
$1,000
$0
2010 2011 2012 2013 2014 2015 2016
$1,034
$1,188$1,403
$1,576
$1,982
$1,310$1,175
$1,348
$951$1,260
$1,539
$3,500
$2,500
$1,500
$500
Original cohort
Extension cohort
Key
Top performer
Third quartile
Mean
Median
First quartile
Bottom performer
R&D costs remain at blockbuster levelsThere has been a slight decrease since 2015 in the average cost to bring an asset from discovery to launch; however the cost remains extremely high at $1.539 billion and is 30 per cent above the 2010 cost (see Figure 9). Based on our calculations, if average peak sales remain constant, the cost of getting to market would need to be approximately $574 million in order to obtain returns in line with those achieved by the original cohort in 2010. This represents a reduction of 63 per cent ($614 million) from the average cost per asset in 2010.
The extension cohort has seen a marked increase in the average cost of bringing an asset from discovery to launch, up from $1.26 billion in 2015 to just under $2 billion in 2016 (a 57 per cent increase). However as discussed earlier, this is largely driven by M&A and portfolio acquisitions, with companies acquiring ongoing R&D costs from their acquisitions rather than increases in internal spend. To maintain returns going forward, these companies will need to pull a significant amount of value into their late-stage portfolios.
Drug discovery, and the search for ever-more differentiated products to fulfil the requirements of Health Technology Assessment boards (HTAs) compared with the current standard of care, continues to be a difficult and risky business. There are problems associated with understanding the complex underlying molecular biology. With Alzheimer’s disease for example, some sources have suggested that drug companies should probably abandon the field until the underlying biology is better understood.5 Overall compound attrition rates stand at between 80 and 90 per cent between first-in-man studies and launch.6, 7, 8, 9 Even in Phase III, late-stage issues for promising products can occur. For example, between 2015 and 2016 the original cohort experienced a decrease in returns of 0.3 percentage points due to late-stage terminations (see Figure 4).
These developments are all leading to a situation in which there is further de-linkage of drug pricing from the R&D cost base required to launch a product, with returns therefore falling to an unsustainable level. An increase in costs to blockbuster proportions without a matching blockbuster increase in balancing revenues creates an equation which does not add up for long-term stakeholder value.
14
Balancing the R&D equation | Measuring the return from pharmaceutical innovation 2016

With the current focus on pricing and industry practices, companies are finding it harder to demonstrate value to governments and other payers of new innovation, making negotiations on pricing more difficult. This places a requirement on both companies and payers to develop behaviours that result in win-win outcomes for all stakeholders. There are some examples of collaborative legislation including the recent ‘Fast track for cost-effective medicines’ scheme under review by the National Institute for Health and Care Excellence (NICE), the agency in the UK that determines whether a product will be made available on the National Health Service.
In the US, the recent 21st century cures act passed 21st Century Cures Act gives incentives to drug companies, in terms of market exclusivity, for speciality drugs and those offering a significant improvement over existing treatments. Whilst in Europe, the European Medicines Agency (EMA) has announced a new voluntary scheme to strengthen regulatory support during development. This scheme, called PRIME, focuses on drugs which may offer significant therapeutic advantage over current treatments, or benefit patients with no treatment options.
It remains to be seen how effective any of this legislation will be at ensuring reward for innovation. The examples above illustrate the need for a more open discussion about the role of policy makers in incentivising R&D expenditure including consideration of the indirect impact; from an economic, healthcare and employment perspective; of failing to provide an environment that delivers sustainable returns on innovation.
The balance between sales from internally and externally-sourced assets is shiftingFor the first time since 2013, the original cohort is now less reliant on externally-innovated assets (those acquired through acquisitions, joint ventures or in-licensing) to drive forecast sales than it is on self-originated assets. In 2016, forecast sales from external sources fell below 50 per cent for the first time, to 43 per cent.
This marks the continuation of a trend that began in 2013 (see Figure 10). Much of the decline has been due to falls in forecast sales from assets obtained as part of company acquisitions. There are a few possible reasons for this.
M&A cycles play a large part. Consolidation in the late 2000s saw acquisitions bringing significant pipeline value to the original cohort, and these are now becoming integrated to the point where new pipeline assets are synonymous with internal innovation.
There have been a number of instances where industry leaders have stated large-scale M&A is not currently a strategy they are keen to pursue, given the premium that target companies are currently attracting, and so with price tags in excess of the risk taken.10, 11 High prices are possibly driven by competition, but acquisition targets also have more options to commercialise assets without the need for a large pharma partner, for example through collaborations with the increasingly mature contract outsourcing industry.
Our 2015 report highlighted that external innovation has been an important source of late-stage pipeline value for the extension cohort, with 79 per cent of forecast sales in that year sourced externally; this refuted the hypothesis that the extension cohort success was driven purely from in-house discoveries. Although 2016 has seen a reduction in the proportion of total forecast revenue from externally innovated assets to 45 per cent (see Figure 11), the extension cohort have continued to pursue an external innovation strategy through M&A, with three of the four companies making major acquisitions during this period. Figure 5 (on page 11) provides further evidence that this strategy can be successful as the extension cohort has consistently added value to existing assets during late-stage development.
Now that companies in the original cohort have commercialised many of their externally-innovated assets and are struggling to maintain the value of late-stage pipelines through progression of self-originated assets from earlier stages of development, they are likely to start reconsidering the risk-reward profile associated with external pools of innovation in order to reload their late-stage pipelines. This may drive increased M&A activity in the coming years, despite the associated high costs and the question of whether it represents good value for all stakeholders involved.
15
Balancing the R&D equation | Measuring the return from pharmaceutical innovation 2016

Figure 10. Internal/external composition, 2013-16 –original cohort
Source: Deloitte LLP
Perc
enta
ge o
f for
ecas
t lat
e-st
age
pipe
line
reve
nue
(%)
Acquisition Co-development Licensed-in Self originated NME
Self originated LE
0%
20%
40%
60%
80%
100%
2016201520142013
16
27
19
30
9
29
17
13
32
10
22
16
16
36
11
13
15
14
45
13
Figure 11. Internal/external composition, 2013-16 – extension cohort
Source: Deloitte LLP
Perc
enta
ge o
f for
ecas
t lat
e-st
age
pipe
line
reve
nue
(%)
Acquisition
0%
20%
40%
60%
80%
100%
2016201520142013
57
10
154
15
47
17
13
9
13
40
23
15
138
11
25
9
43
12
Co-development Licensed-in Self originated NME
Self originated LE
Some companies are managing successfully to balance the equation and generate sustainable returnsDespite the overall decrease in returns in 2016, companies within the extension cohort, along with a few of the original cohort, are successfully managing to balance forecast revenues and costs to earn returns above their cost of capital on their investment in innovation.
Companies across the industry (and many of the original cohort in particular) are implementing changes to adapt to the challenges they are facing. Despite the benefits that many of their improvement programmes are predicted to deliver, there is still a long way to go to reach a level where the average cost to launch an asset falls to the $574 million mark so that the average returns projected in 2010 can be achieved again. We recognise that biopharma R&D is a long-term investment, with decisions playing out over decades, as such the following sections of the report build on these findings by delving into two core questions:
1. What strategies can be employed to ensure the maximum incremental increase in commercial value of the current pipeline?
2. What changes can R&D organisations make to deliver new drugs at a cost that is acceptable for both payers and investors?
The extension cohort have continued to pursue an external innovation strategy through M&A, with three of the four companies making major acquisitions during this period.
16
Balancing the R&D equation | Measuring the return from pharmaceutical innovation 2016

Figure 12. Blockbuster costs without the balancing blockbuster revenues
R&D costs
Forecast sales
Source: Deloitte LLP
There has been a slight decrease since 2015 in the average cost to bring an asset from discovery to launch; however the cost remains extremely high at $1.5 billion.
17
Balancing the R&D equation | Measuring the return from pharmaceutical innovation 2016
Balancing the R&D equation: increasing pipeline value
Given the finding that the continued decline in returns is driven primarily by the fall in average peak sales, we have sought to understand practices that might be employed to help companies maximise the potential of their pipelines. We have focused on key strategic choices that help market-leading products in competitive drug classes differentiate themselves and maximise the value of their assets and returns on R&D investment. We have spoken with industry leaders to understand the strategies they employ and their impact on asset value, supplementing this research with insights from Deloitte practitioners and secondary research.
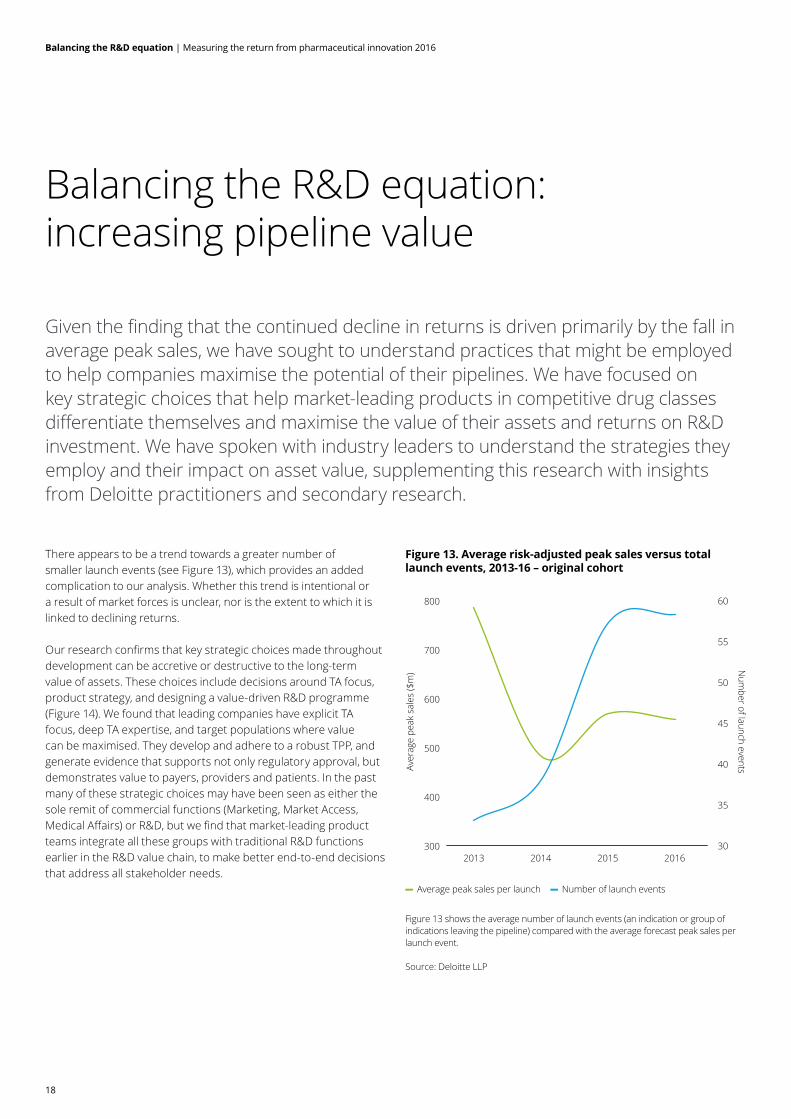
There appears to be a trend towards a greater number of smaller launch events (see Figure 13), which provides an added complication to our analysis. Whether this trend is intentional or a result of market forces is unclear, nor is the extent to which it is linked to declining returns.
Our research confirms that key strategic choices made throughout development can be accretive or destructive to the long-term value of assets. These choices include decisions around TA focus, product strategy, and designing a value-driven R&D programme (Figure 14). We found that leading companies have explicit TA focus, deep TA expertise, and target populations where value can be maximised. They develop and adhere to a robust TPP, and generate evidence that supports not only regulatory approval, but demonstrates value to payers, providers and patients. In the past many of these strategic choices may have been seen as either the sole remit of commercial functions (Marketing, Market Access, Medical Affairs) or R&D, but we find that market-leading product teams integrate all these groups with traditional R&D functions earlier in the R&D value chain, to make better end-to-end decisions that address all stakeholder needs.
Figure 13. Average risk-adjusted peak sales versus total launch events, 2013-16 – original cohort
Figure 13 shows the average number of launch events (an indication or group of indications leaving the pipeline) compared with the average forecast peak sales per launch event.
Source: Deloitte LLP
Average peak sales per launch Number of launch events
300
400
500
600
700
800
2016201520142013
Aver
age
peak
sal
es ($
m)
30
35
40
45
50
55
60
Num
ber of launch events
18
Balancing the R&D equation | Measuring the return from pharmaceutical innovation 2016

Figure 14. Strategic choices that collectively increase the commercial value of the pipeline
Therapeutic area focus
How broad or targeted do wewant our portfolio to be?
What role do we want to play in theoverall treatment and disease evolution?
What are the non-financial objectives(e.g. strategic value)?
Product strategy
Where are the prioritised opportunities for the product?
Should we go after a broad population or target a sub-population?
How do we position our product against the standard of care?
What specifically do we want practitioners, patients, payers and influencers to do differently?
R&D programme design
What procedures can we put in place to ensure we retain the principles outlined in our original target product profile?
What attributes does the product need to demonstrate in each of the key stakeholder groups to reach it’s market potentialand how do we align the organisation to ensure these are met during development?
Payers
What evidence do we need togenerate to demonstrate bothclinical and economic value?
How can we turn pricingnegotiations into a win-win scenario?
Prescribers
How do prescribersperceive value and assess
benefits and risks?
What is required to makeproducts easy to prescribe?
Patients
What do patients really valuein their treatment regime?
How do we maintain and buildcloser relationships with patients
beyond clinical trials?
Regulators
How do we best engageregulators as partners?
How can we best leverage the differences in development
strategy for accelerated pathways?
Source: Deloitte LLP
19
Balancing the R&D equation | Measuring the return from pharmaceutical innovation 2016

Therapeutic area focus We revisited the analysis performed in the 2015 report on the impact of therapy area focus, and the relationship between volatility in the number/value of assets in late-stage development for a given TA over time; and forecast peak sales per asset (see Figure 15). Although our original cohort comprises the top 12 companies by 2009 R&D spend, they vary in size and focus, and forecast peak sales per asset continue to correlate with lower TA volatility. As such, our analysis continues to suggest that ‘pursuing the science’ (focussing on a detailed understanding of a disease state or mechanism of action within a TA) could offer higher rewards than ‘pursuing the market’ (following diseases or TAs for which drugs with significant sales already exist or where there is perceived to be a significant opportunity for sales).12
Many of the organisations in the original cohort have varying expertise and depth of experience across several TAs, whereas the extension cohort tends to bring more depth and focus to only a few TAs. These differences in strategy reflect decisions by each organisation to align objectives to their key strengths. Some organisations are able to leverage global reach and scale to execute broad-based commercialisation strategies. Others leverage a depth of TA knowledge, infrastructure and stakeholder relationships, to continuously improve treatment within a dedicated set of TAs.
The notion that greater TA focus could offer higher rewards than pursuit of a broad-based commercialisation strategy was supported by the people we interviewed. They take the view that in-depth TA knowledge enables organisations to make better decisions about where they place their bets, and which products to kill early. They also pointed out that for those products the organisation does pursue, they are able to leverage established relationships with key stakeholders throughout the development process, such as academic researchers, clinical investigators, key opinion leaders and patient advocacy groups.
The notion that greater TA focus could offer higher rewards than pursuit of a broad-based commercialisation strategy was supported by the people we interviewed.
Figure 15. Total peak sales volatility (2014-16) versus average peak sales (2014-16) – original cohort
Figure 15 compares three-year average peak sales per asset with late-stage pipeline TA volatility, measured as the weighted standard deviation in forecast sales for a TA between 2014 and 2016.
Source: Deloitte LLP
Thre
e ye
ar a
vera
ge p
eak
sale
s 2
014-
2016
($m
)
700
600
500
400
300
200
100
00.050 0.060 0.070 0.080 0.090 0.100 0.110
TA Volatility Index (value of assets)
These relationships can be tapped into early and often, to obtain input that can refine development programmes and increase the value of assets. Interviewees also pointed out that focus has additional benefits beyond relationships:
• a TA-focused strategy can help to cultivate a focused portfolio and focus business development efforts
• companies that maintain critical mass and focus will be smarter at placing bets and picking winners
• development teams are able to build a depth of knowledge so that resources can move development programmes forward more efficiently
• clinical teams can leverage prior development experience to further refine protocols.
20
Balancing the R&D equation | Measuring the return from pharmaceutical innovation 2016

For organisations with broad commercialisation strategies, maintaining depth and focus in any given area is important. Our interviewees suggest that when entering a new TA, successful companies do this wholeheartedly and make meaningful investments early to understand the market, before deciding to invest in a compound and fleshing out the development strategy. This investment should include developing an understanding of the competitive landscape, the needs of the patient population and the patient journey. Investments should be made in patient interviews, advisory boards, physician interviews, payer discussions, and engaging with patient advocacy groups, in order to better understand the patient population and their unmet needs. This input is essential to shaping a robust TPP that will drive the development of a successful product.
Organisations that have not invested adequately in an early understanding of new markets have struggled to maximise the value of recently-launched assets. For example a recently-launched cardiovascular product was cited by one interviewee as having not reached analysts’ expectations post-launch, possibly as a result of low investment in market planning and associated marketing tactics.
Our interviewees suggest that when entering a new TA, successful companies do this wholeheartedly and make meaningful investments early to understand the market, before deciding to invest in a compound and fleshing out the development strategy.
Product strategy We have found that to develop a successful product strategy, organisations need to make critical decisions about indication approach, patient populations, and positioning relative to the current standard of care. Unsurprisingly, the outperforming product teams we looked at have made most or all of the critical decisions we outline to develop a successful product strategy.
Indication approachHaving a targeted indication strategy was an area highlighted by interviewees, who emphasised the importance of first indication at launch and the bearing this has on the overall success of the product, particularly in striking the right balance between quickest approval, greatest uptake, and potential for premium pricing. They also indicated that decisions on whether to target a large number of indications all at once or to be more focused, and getting the order of entry right, depends on external factors such as:
• unmet need
• what market adoption could look like and the potential barriers
• what data is required in order to achieve reimbursement and market access
• what the competitive set looks like.
Successful strategies have tended to focus early launches in areas with the highest unmet needs and lowest commercial barriers. Interviewees pointed out that prioritisation of product opportunities is key to the successful launch of multiple indications and maximising the value of the asset. This may in part explain the trend for a greater number of smaller launch events highlighted in Figure 13.
21
Balancing the R&D equation | Measuring the return from pharmaceutical innovation 2016

Patient sub-populationOnce a decision on disease area is made, organisations are faced with a choice about patient segmentation: whether to pursue a broad or a targeted population? Interviewees agreed that this choice should be based on where the product can deliver the greatest value. Targeting a sub-population could expedite time to market, and increase the likelihood of clinical success and reimbursement. Clinical trials can be more targeted and smaller, with fewer patients and faster enrolment, to demonstrate the desired magnitude of benefit. In addition, the product is more likely to be reimbursed, since payers will be able to identify which portion of their populations would be eligible for the product.13 Payers can manage spend by allowing access to a smaller, qualified segment of the population, where real world evidence would be more likely to demonstrate product value.
Employing an effective biomarker strategyA targeted product strategy may require incorporation of a biomarker and a companion diagnostic. However given the asset class dependency and trade-offs to be considered, there was no clear conclusion among interviewees about what leads to outperformance. Some common themes were expressed, broadly related to having a biomarker and diagnostic strategy for all assets in order to preserve optionality when weighing up trade-offs.
There are trade-offs to be considered with any biomarker strategy. If an organisation does not have internal capabilities to develop a companion diagnostic, it will need to partner, adding complexity to the development programme and subsequent commercialisation of the product. On the other hand, potential for reduced attrition has been linked with asset programmes that include biomarker endpoints. One study placed overall attrition rates between First Time in Man (FTIM) and launch for programmes utilising biomarkers for patient selection at 74 per cent, 18 percentage points better than the 92 per cent attrition quoted for development programmes not utilising biomarkers.14
It is also important to understand how the requirement for a diagnostic could impact physician workflow, and whether it would potentially delay treatment. If there is a roughly equivalent competitor that does not need a diagnostic, and is potentially more broad-acting, a requirement for a diagnostic could be a commercial disadvantage. This should be taken into consideration when the difference in benefit between the sub-population and the broader population is small, or when there are other complexities involved in following a biomarker strategy. (See sidebar: Immuno-oncology and the complexity of biomarker strategy).15
Immuno-oncology and the complexity of biomarker strategy
Recent market activity in this drug class illustrates some of the challenges in defining a biomarker approach. Sales data for two products launched for advanced non-small cell lung cancer (NSCLC) would suggest that leading with a biomarker strategy acts as a competitive disadvantage due to the added complexity of requiring a diagnostic test. However, ongoing clinical trials for the same set of products appear to show that by focusing on a targeted sub-population, it is possible to demonstrate greater clinical benefit as first-line treatment in NSCLC.
Currently, several organisations are testing combination immuno-therapies for multiple cancer types and patient sub-populations without a clear biomarker strategy. It is unclear which combinations will be most effective in which populations, or what predictive markers would help to identify those populations. Success in this competitive drug class will ultimately depend on the ability to differentiate products for targeted populations.16
22
Balancing the R&D equation | Measuring the return from pharmaceutical innovation 2016

Positioning within the current standard of careA key theme amongst those we interviewed was the view that product strategy needs to take into account existing treatment paradigms. Products that outperform tend to have strategies that ensure they are clearly differentiated from current, and future, treatment options, in order to ensure reimbursement. Closely aligned to this, product strategies that leverage the current health delivery systems and infrastructure to provide the existing standard of care increased product uptake versus those that may have been more differentiated but required new infrastructure to be built.
R&D programme design Once a disease area, indication and patient population are chosen, programme design is the next stage where value can be added. Creating an environment that aligns the various functions within the commercial and R&D organisations to allow end-to-end decisions to be made, and ensuring all stakeholder needs are addressed was a common theme among outperforming assets. Other features of successful teams include developing a robust TPP and establishing the discipline to stay committed to key criteria, as well as engaging early with regulators, payers and patients to understand their specific needs.
Programme design starts with developing the detailed TPP, including both clinical and value-related endpoints, and establishing the discipline to stay committed to key criteria. Early engagement with regulators and payers can help to refine critical endpoints. Endpoints that enable market access should be central to the development plan, and a robust health economics and outcomes research (HEOR) strategy can demonstrate value to payers, providers and patients, and maximise commercial potential.
Key programme design strategies
Have a plan and stick to it:
• set the minimum-acceptable, base-case, and best-case criteria for the TPP. Include a multi-year evidence blueprint that demonstrates clinically meaningful and value-creating endpoints (as defined by key health plans and purchasers)
• resist the temptation to erode the TPP criteria.
Regulatory strategy and considerations for regulatory approvals:
• engage global regulators early and aim to align endpoints and diagnostic strategy where relevant
• recognise the differences in development strategy and defining value for accelerated pathways.
Reimbursement strategy discussions beyond price
• engage with payers early to understand how they define value beyond price. Incorporate those value criteria no later than Phase II.
Take a more patient and physician targeted approach
• develop and validate tools to capture patient reported outcomes early in development
• incorporate or design HEOR endpoints that will differentiate the product not just to payers, but also patients and physicians.
23
Balancing the R&D equation | Measuring the return from pharmaceutical innovation 2016
Have a plan and stick to it: developing and committing to a robust TPP Some of the organisations we interviewed start developing the TPP as early as Discovery, but none start later than Investigational New Drug (IND) submission. Cross-functional input from Commercial, Research, and Development teams is needed to develop the TPP and embed criteria for commercial viability. These criteria include optimal positioning, the clinically-differentiating benefit, an efficacy/safety profile, dosing information, and value-related endpoints that meet the needs of the different stakeholders. One interviewee defined the TPP as a qualitative document containing quantitative information.
The document should provide for some flexibility, and the criteria should be set in ranges; minimally acceptable, base case, and best case. The minimally acceptable criteria should set the baseline for what is required for the product to be commercially viable at launch relative to the costs required to get it there.
As the development programme progresses new data from clinical and competitive intelligence emerges, and there can be significant pressure to erode the TPP value criteria. As the actual product profile starts to emerge, the TPP should be used as a measuring stick to determine whether or not development of the product should advance. It is essential that teams maintain discipline to stick with the original criteria for realising the product’s commercial potential. Constant communication and alignment between the Commercial, Research and Development teams is essential for understanding how the minimum criteria were set and why it is critically important to achieve those criteria. Interviewees pointed out that it is important for the TPP to evolve as the landscape changes. A change in the treatment paradigm, or new information from competitive clinical development programmes, could alter the baseline for what makes the product commercially viable.
A document outlining the multi-year evidence blueprint, supplementing the TPP, ensures the TPP stays relevant, taking into consideration endpoints required to support regulatory approval, reimbursement, and provider and patient adoption of the product.
Early engagement is critical for regulatory strategy and accelerated approvalsThe regulatory landscape is evolving and the teams we interviewed are exploring ways to develop their approach to reflect new scientific and evidentiary models in development and approval processes. Although regulators across the globe focus on patient health, safety and efficacy, the way in which policies are developed can vary widely from country to country. A recurring theme among our interviewees is that success depends on an early start to discussions with regulators (typically Phase I) and aiming to submit data at the same time to the different regulators. Some interviewees enthused that regulators made good partners and that early and regular discussions and meetings (especially after a pivotal study design to hear different opinions) help the speed to market.
One successful product team pointed out important differences in development strategy when pursuing accelerated approval. The team was able to file for approval in the US using Phase II data. Phase III trials were run in parallel to the review process allowing new data to be generated during the review, which was submitted directly to the FDA. The end result was greater demonstration of clinical benefit, combined with an accelerated approval meaning a fast approval for a broader indication. Having primarily addressed the questions of safety and efficacy, the team embedded other HEOR data in the Phase III trial, which was used to make a stronger case to payers to justify reimbursement.
As the development programme progresses, new data from clinical and competitive intelligence emerges and there can be significant pressure to erode the TPP value criteria.
24
Balancing the R&D equation | Measuring the return from pharmaceutical innovation 2016

Moving reimbursement strategy beyond price to focus on valueReimbursement strategy is a dynamic area that all interviewees are working on to stay ahead in the coming years. Although used to a more centralised reimbursement process in Europe and a more dispersed system in the US, one interviewee noted that the discrepancy is changing as the US government becomes a bigger percentage share of the US market. Many interviewees expect US pricing policy to change in the coming years, and some thought that this might may make the reimbursement strategy across different markets more challenging, but more aligned.
Whilst regulatory input and feedback can be obtained through ongoing dialogue, incorporating payer input into clinical trial design is not easy. Interviewees said that they are working on how to structure clinical trials to meet the regulatory requirements whilst also taking economic benefit into account. They are exploring strategies to generate outcomes data earlier. Acknowledging that payers have grown sceptical of the ability for randomised controlled trials to translate to the real world, some hypothesise data from digital strategies and real world evidence might help them advance the field of HEOR, and translate benefits to all stakeholders, including the patient. Failing to include elements of value in clinical development could make successful commercialisation of products more difficult. (See sidebar: New cholesterol drugs and reimbursement in the US).
Interviewees agreed that reimbursement strategies now come into play earlier than they did five years ago and all are now focused on reimbursement planning by Phase II at the latest. One interviewee noted less resistance to engaging with health plans than in prior years, and a common theme was that biopharma companies and payers are becoming more open to working together earlier. Conversations with payers are also broadening beyond those focused solely on price, to discussions about how development plans should be tailored to demonstrate elements of value.
New cholesterol drugs and reimbursement in the US
In the US, disappointing sales of a new class of drugs to treat high cholesterol illustrate the impact of not adequately demonstrating value to payers. These drugs are generally well-tolerated and effective in reducing low-density lipoprotein cholesterol (LDL-C), a significant health concern for millions of Americans. These drugs may be more effective than statins in lowering cholesterol, but have a higher price.
When considering reimbursement approach, payers took into account the potential budgetary impact these products would have if used across a significant portion of the population. In determining their approach, payers considered the long-term impact of these therapies on cardiovascular health as compared to the standard of care and how to identify the patients who would benefit; those deemed to be high-risk or statin intolerant.
Ultimately, there was no clear way to distinguish patients who would benefit versus those would do just as well with traditional therapy and the evidence was not sufficient to convince payers of disproportionate long-term benefit of these new drugs. Without a way to clearly identify these patients, combined with a high price tag, payers instead opted to take a conservative approach to managing use, resulting in strict access controls and a lower interest from physicians in experimenting with these products.17
Whilst the data generated during development for this class of drugs was sufficient to secure regulatory approval and generated interest from the cardiologist community,18, 19 the lack of sufficient data to convince payers of disproportionate benefit and sufficient patient segmentation has led to lacklustre sales. This example reinforces the importance of understanding the clinical endpoints that are valued by payers, and identifying and targeting the specific patient population where value can be maximised.
25
Balancing the R&D equation | Measuring the return from pharmaceutical innovation 2016

Patient input and patient reported outcomes (PROs) are usually components of the value equation for payers, but better engagement and relationships with patients can drive greater uptake post-launch. If an appropriate validated tool does not exist, aiming to develop this in Phase I, validate in Phase II, and use in Phase III has proved to be successful. Early PRO development is especially important for rare diseases, where views of the patient primarily drive the value discussion.
Patient engagement includes understanding endpoints valued by patients, as well as those which are deemed the standard of care or used to gain regulatory approval or access. One interviewee cited an example where redefining evidence generated during development based on patient engagement allowed trials to focus on endpoints that the patients valued more, thus greatly increasing demand and uptake post-launch.
Decision-making criteria for physicians, and increasingly other prescribing clinicians such as nurse practitioners and physician assistants, should also be factored into HEOR strategies. In addition to PROs and what is important to the patient and health plans, HEOR data can help demonstrate value to clinicians, and improve their willingness to prescribe products. Understanding how prescribers perceive value and assess benefits and risks in different patient populations are also important factors to consider when designing HEOR strategies.
However, value is not easily or consistently defined by any stakeholder. Interviewees said that they wanted to further their understanding, through conversations with payers, on how each payer defines value for each specific sub-population of patients. For the US market, leading practice is to have conversations not only with the health plan’s pharmacy team, but also with medical and quality teams, who can broaden the conversation beyond price to discuss how they evaluate products and perceive value for therapies in different populations. In Europe, several regulatory and HTA bodies are offering joint reviews of development programmes. These conversations can help tailor clinical development programmes to support the evidence needs for both approval and market access.
Reimbursement strategy is a dynamic area that all interviewees are working on to stay ahead in the coming years.
Taking more patient and physician-centric approaches to programme designFor R&D-based biopharma companies, the process of designing a product or service around the patient starts with programme design. However many of our interviewees agreed this was not always something that outperforming products have in common. An area in which the whole industry can improve is in taking a patient-centric approach to trial design and in delivering endpoints that patients value.
26
Balancing the R&D equation | Measuring the return from pharmaceutical innovation 2016

Forecast sales
R&D costs
Figure 16. Key strategies employed in commercially outperforming products during development
Therapy area focus
Adhere to robust Target Product
Profile
Generate evidence to support all
stakeholder needs
Align end-to-end decision-making across
the organisation
Target populations where value can be
maximised
Source: Deloitte LLP
Our research confirms that key strategic choices made throughout development can be accretive or destructive to the long-term value of assets.
27
Balancing the R&D equation | Measuring the return from pharmaceutical innovation 2016

Balancing the R&D equation: Reducing the cost to launch
Findings from our previous reports relating to company size and R&D productivity continue to hold true. Companies in our extension cohort continue to deliver higher returns than those in the original cohort. There also continues to be a significant negative correlation within both the original cohort and the overall cohort of 16 companies between company size (measured by either ten-year R&D spend or revenues) and IRR, along with a positive correlation between company size and cost per asset (see Figures 17 and 18). Whilst we acknowledge that the reasons for this are likely to be multi-variate in nature, we argue that key lessons from our interviews with R&D leaders can be applied to help companies develop assets more efficiently.
Our interviews focused on R&D leaders with experience at both small and large biopharma companies to get their perspectives on differences that could lead to diseconomies of scale. We have outlined some of the lessons learned across the areas of governance and decision-making, staffing and outsourcing, and dealing with data complexity (see Figure 19).
For the purposes of this discussion, we have defined ‘small’ companies as those ranging from pre-revenue to mid-cap, while ‘large’ refers to large-cap biopharma companies synonymous with our original cohort. The terms ‘smaller’ and ‘larger’ have been used relatively to indicate the extent to which a point is likely to apply across this range. The lessons learned do not specifically refer to any individual or group of companies within our cohort and we believe they are applicable to a greater or lesser degree across the industry.
Figure 17. Company size versus three-year average IRR
Figures 17 and 18 compare company size (measured by 10 year R&D spend) with three year weighted average IRR and average cost per asset for all 16 companies in the overall cohort. To protect the anonymity of the companies being analysed, units are omitted on the chart axis.
Source: Deloitte LLP
IRR
Higher
Lower
Smaller Larger
Company size
Figure 18. Company size versus three-year average cost to develop an asset
IRR
Higher
Lower
Smaller Larger
Company size
28
Balancing the R&D equation | Measuring the return from pharmaceutical innovation 2016

Figure 19. Targeted approaches to improve R&D productivity
Think small, win big to optimise decision-making
Staffing and outsourcing: Strike the right balance
Lifting the burden of data complexity
• create environment to empower key decision makers and align incentives
• accept risk to reduce development timelines
• make quick kills to benefit other competing programmes with greater commercial potential
• consider funding approaches that allow the continuation of programmes between stage-gates.
• balance internal and external resources
• treat outsourcing providers like partners or staff
• build rapport with partners to establish transparency and align incentives
• give greater control to partners to fully utilise expertise
• actively manage and track expectations with partners
• understand internal processes/cost allocation to benchmark internal performance against external partners.
• ensure data safety, accessibility and availability
• implement master data management principles
• make decisions on where to draw the line between past and future data
• create end-to-end data architecture
• integrate and leverage historical knowledge
• prioritise data for integration post-M&A
• evolve the role of the IT Organisation.
Source: Deloitte LLP
Think small, win big to optimise decision-making Approaches to decision-making at companies can differ, based on their strategic focus. Smaller companies tend to focus on value creation and demonstrating quickly the potential of new products. Larger companies are often more focused on sustaining a commercially-viable portfolio of products that will generate a sufficient return. There are some lessons for large companies in how smaller companies operationalise decision-making that supports more efficient drug development. These include empowering key decision-makers, accepting risk, making quick kills, and embedding a rigorous but dynamic process to fund projects.
Empower key decision-makersLarge companies tend to be saddled with intensive governance processes which, whilst intended to align the organisation, can be time-consuming, inefficient, and not do not provide an environment that rewards creativity. As company size and portfolio diversity increase, there are more competing priorities, which often cut across multiple functions or divisions, making resolution politically challenging.
As a result, large teams often spend time on presentations and preparing for committee meetings, rather than on programme decisions and execution. Traditional committee meetings tend to have a rigid structure and require a lot of advanced planning; this does not lend itself to creative input or dynamic decision-making. Portfolio governance by consensus does not work.
Smaller organisations tend to be more nimble when it comes to decision-making, with a handful of key decision-makers engaged early to drive the direction of the programme. One interviewee described an example where traditionally distinct roles – the Head of Research and the Head of Development for a specific TA – were merged into one. The organisation was able to expedite decision-making and make tough decisions that normally would have been politically charged. Further, smaller organisations are able to integrate commercial input into R&D more effectively, enabling greater alignment across the organisation on strategic direction.
29
Balancing the R&D equation | Measuring the return from pharmaceutical innovation 2016

Interviewees also pointed out that it is crucially important to cultivate an environment that empowers internal decision-making and aligns incentives across different functional teams. One organisation intentionally leaves internal teams slightly under-resourced, as a way to expedite decision-making, simply as a result of having fewer decision-makers. External resources can be used to supplement these teams to provide the resources needed to implement the decisions that have been taken.
Accept riskThe risk profile of the organisation determines the level of creativity teams will apply to development. Large companies tend to focus on de-risking programmes by answering a larger breadth of clinical questions, and this can result in longer development timelines. In contrast, smaller companies strive to develop strategies to accelerate value demonstration and bring a product to market. One interviewee pointed out that at smaller organisations ‘the clock is ticking’ and external funding pressures create the need to demonstrate the value of assets early and accelerate to market. These organisations focus on key scientific questions and implement creative approaches to find answers to these questions sooner.
Make quick killsGiven their risk-averse nature, large companies are not set up to kill projects quickly that no longer meet the minimum success criteria as documented in the TPP. The end of a project requires careful consideration of how to manage the existing development team. But quick kills, combined with a method of resource planning and resource redeployment, can benefit competing programmes with greater commercial potential. We found smaller companies, by answering key questions early and maintaining a keen focus on strategic objectives, are able to make these quick kill decisions. This is in part due to pressures created by external funding (a lack of evidence results in a lack of funding) but also as a result of having a smaller group of key decision-makers.
Embed a rigorous but dynamic process to fund projectsLarge companies usually require decisions by multiple governance committees to approve funding for programmes. Delays in decision-making can result in delays in moving programmes forward. One interviewee discussed a funding approach taken by an organisation that allows programmes to keep moving forward unless leadership indicates otherwise. The organisation funds the portfolio at 120 per cent of budget, making the assumption that some programmes will accelerate while others will decelerate. This approach may not be practical, especially for budget-constrained organisations with multiple competing priorities. Even where an organisation is not budget constrained finance mechanisms that provide an early warning when the program offsets are not occurring remain critical to this funding approach succeeding.
Key stage gate meetings are still held, but focus on the evidence rather than the budget. At these stage gate meetings the commercial potential of projects is challenged to prevent ‘unbridled optimism’ that project teams may have embedded in projections. Projections are tested to determine how low they would have to go before a programme is no longer able to meet minimally acceptable success criteria and so should be removed from the portfolio.
Organisations should consider an approach that allows continuation of programmes between stage gates, focusing governance teams on commercial viability at key decision points.
There are some lessons for large companies in how smaller companies operationalise decision-making that supports more efficient drug development; empowering key decision-makers, accepting risk, making quick kills, and embedding a rigorous but dynamic process to fund projects.
30
Balancing the R&D equation | Measuring the return from pharmaceutical innovation 2016

Staffing and outsourcing: strike the right balanceThe decision to make or buy services in R&D is complex, with many factors influencing the decision. The move to greater outsourcing within R&D promised greater efficiencies; however, our findings and observations indicate that this has not consistently proved to be the case.
There are some clear benefits of pursuing externalisationA number of interviewees took the view that externalisation can deliver significant value by enabling organisations to scale flexibly, provide a broader global footprint, increase internal accountability for changes to decisions, and allow expertise to be leveraged.
One of the most frequently cited benefits of externalisation is improving the management of unpredictability in drug development and allowing organisations to scale flexibly with demand. For example, at the end of a large trial the organisation can scale down as needed without having to worry about continual re-deployment, under-utilisation, or lay-offs and re-hiring.
A number of those we interviewed pointed to the greater transparency of the impact of decisions and amendments on costs and cycle time. This helps to improve adherence to decisions and reduces the number of protocol amendments which would otherwise have been missed, as timeline and cost increases are absorbed by the programme.
Externalisation can also provide greater objectivity on design and resource requirements as well as (potentially) broader expertise. One interviewee noted that outsourcing certain functions allows the organisation to focus on its core expertise, while outsourcing partners can bring a depth of knowledge from prior experience in other areas.
Benefits need to be reconciled with the challengesWhen brought back in-house, data was often described by interviewees as ‘not quite meeting the team’s expectations’, making it difficult to integrate into systems. The reasons tend to be communication barriers and excessive focus on inputs at the expense of successful articulation of required outputs.
When activities are run internally, those in oversight roles are both decision-makers and line managers. Interviewees cited the internal headcount required to manage the outsourced process and control quality as one of the main underlying reasons why studies run externally are often more expensive than those run in-house.
When running trials, working through contract research organisations puts the company a further step away from the patient, so that there are even fewer opportunities for interactions, impacting the ability to execute many of the patient-centric recommendations highlighted in the previous section of this report.
Opportunities to reduce costs exist, in clinical trials, during discovery and in other areas of development, and are being realised by some companies. The benefits however are not being realised universally. Based on our findings, we have identified some key sourcing considerations and other best practices that can be applied.
Leading sourcing strategiesInterviewees considered that a directed sourcing strategy, covering make-or-buy decisions, is crucial. Strategic considerations also include: length of time capacity is needed; whether an internal operation or external organisation can be managed effectively; volume volatility and the need for flexibility; maturity of external partners to deliver the required capability; and the degree of control needed over the strategic direction of the capability.
Contract organisations should be treated like strategic partners, or part of your own staff. It is important to build a rapport with partners in order to achieve effective communication, transparency and aligned incentives.
Companies earlier in their lifecycle tend to have less choice when faced with the costs and timeframes associated with building capabilities internally. Among those we interviewed, their companies are likely to give greater control of managing the activity to the external provider. This means that internal staff are able to focus on outputs, rather than managing the process, avoiding many of the costs associated with duplicated resources and handoffs.
31
Balancing the R&D equation | Measuring the return from pharmaceutical innovation 2016

Finding internal staff to manage external partners is difficult. External partners are only as successful as the company managing the relationship. With too little support or direction, the quality of outputs can be compromised. However, too much oversight, for example, maintaining a similar internal leverage ratio over external partner staff, as would be used with internal line management, rapidly results in erosion of any business case to externalise in the first place.
The underlying cause of additional cost and complexity when working with external partners is often that companies may not fully comprehend the data flows, handoffs and outputs required internally. Reorganising internal processes around outputs, rather than managing the inputs, helps to ensure that the organisation is set up to work efficiently in a landscape involving both internal and external parties.
Giving greater control over managing the process to the external partner, and setting expectations around outcomes, makes full use of the external partner’s depth of knowledge from repeatedly executing the service. An example is to allow the partner to use their own Sstandard Operating Procedures (SOPs), this provides efficiency and quality (given the need to train staff) over companies insisting that their own SOPs are adhered to.
Greater understanding of internal processes and cost allocation makes it possible to benchmark against internal team performance and other external partners. This not only holds external partners accountable for performance but also enables risk sharing, allowing the partner to benefit from cost and efficiency gains relative to benchmarks. Aligning these incentives can stimulate the desire to be efficient, and also encourage the company to demonstrate efficiency gains internally.
Many of the contract organisation functions have not yet realised their full potential for delivering efficiencies, due to companies providing sub-optimal partner management and maintaining operating models which hinder externalisation. Having a clear sourcing strategy, reorganising around process outputs, and relinquishing some control, are all key factors in unlocking potential benefits.
Lifting the burden of data complexityThe data landscape within biopharma R&D is becoming ever more complex. This places a huge cost burden on organisations. Challenges include new technologies, reporting standards, legacy data, the inherent complexity of biopharma R&D, external partnerships, siloed inward-facing data architecture, inherited data and systems from M&A deals or in-licensed products. The explosion of genomics data, patient generated data from wearables during clinical trials and real-world evidence data is both the biggest asset for biopharma and also a considerable liability. Our interviews highlighted that companies which are at an earlier stage in their lifecycles (and so likely to be smaller) are not yet experiencing many of these problems to the same degree. But they will. Failing to prepare for the problems of data complexity could hinder opportunities in the future to take greater advantage of new sources of data.
Successful data exploitationThe key to successful exploitation of data remains the same; ensuring that data is held securely, and is well catalogued, accessible and available to the right people when they need it, whether or not they knew it existed. This highlights a further problem: the amount of time spent searching for or obtaining access to data. In many cases people who could benefit from data do not know that it exists.
Our interviews found that smaller companies are at a significant advantage. With less inherent complexity from size, legacy data and business combinations, less effort is required to develop a data landscape which enables user-friendly search, access, re-use and archiving. By acting proactively, they should be able to maintain a more efficient data landscape and take advantage of new sources of data.
32
Balancing the R&D equation | Measuring the return from pharmaceutical innovation 2016

Stages of data landscape progression
Understand Order Maintain
• Where is the information? • What form is it in? • What is it used for?
Ensure data is: • well catalogued • accessible, including to external business partners
• available to the right people when they need it.
Develop and implement master data management principles around collection, standardisation, search and storage that allow the data landscape to be maintained with minimal effort.
A new paradigm within the R&D/regulatory landscape involves unlocking the value of the data that is available, and combining it with increasing volumes of new data whilst reducing the cost to maintain and access it. Larger companies have a competitive advantage when it comes to investing in and leveraging new sources of data and technologies, but this can exacerbate the problem, as the ongoing challenge of how to integrate and contextualise new sources of data remains. To do this, data needs to exist in a more maintained landscape, and maintenance needs to be straightforward.
For many organisations the scale of this task should not be underestimated.
Options for dealing with it lie on a spectrum:
• focus purely on new data as it is being generated
• deal with all data on a prioritised basis, using criteria such as business value versus the effort required to deal with old and new data
• prioritise legacy data before dealing with accumulating new data.
However, with new external data available regularly, understanding where to draw the line on internal legacy data to begin such a programme can be problematic.
33
Balancing the R&D equation | Measuring the return from pharmaceutical innovation 2016

We found that many approaches currently employed within the industry involve complex back-end integrations to deal with the stages outlined (See: Stages of data landscape progression on page 33). To resolve some of the current root causes relating to the burden of data complexity, a modern, end-to-end data architecture would be preferable. Alternative technologies are available which can patch together systems, processes and information. For example Robotic Process Automation (RPA) is finding uses in many repetitive data processes that make compliance responsibilities difficult. Tools that utilise Natural Language Generation (NLG) or Natural Language Processing (NLP) can be used to simplify the mining of and interaction with a complex data landscape. A downside to these technologies is that they risk papering over the root causes of data complexity problems and may not incentivise the right behaviours. They do however provide an attractive alternative to greater outsourcing of processes, allowing the company to reap the rewards of efficiencies. Research by Deloitte estimates that for many business processes automation can be up to three times cheaper and of a higher quality than outsourcing a process.20
Dealing with M&AInterviewees who have been involved in integration and separation events commented that inefficient integration of legacy data and systems have a huge impact on increasing data complexity. Many organisations take an extended period of time to fully integrate systems, or never achieve it. Often decisions are taken to keep separate business units running in parallel. We found this can impact on the ability of an organisation to leverage its data, and creates a very onerous task when data needs to be combined (for example, for submission of data for regulatory compliance purposes). Key recommendations are to:
• act quickly and decisively, integrating systems and not allowing them to run in parallel
• prioritise data for integration, and integrate slices of data at a time, following the steps (understand, order, maintain) outlined in the callout box above.
Evolving role of the IT organisationThe role of the IT organisation has to evolve from one of building and maintaining systems that support siloed generation of business data, into an organisation that manages the information the business generates. This ‘curator and archivist’ role requires a different approach and skill sets to an organisation set up for building and maintenance.
Our interviews highlighted that companies which are at an earlier stage in their lifecycles (and so likely to be smaller) are not yet experiencing many of these problems to the same degree. But they will.
34
Balancing the R&D equation | Measuring the return from pharmaceutical innovation 2016

Lift the burdenof data complexity
Think small, win big to optimise and streamline
decision making Forecast salesR&D costs
Figure 20. Key lessons that can be applied regardless of scale to help develop assets more efficiently
Internal/external resources: Strike the
right balance
Source: Deloitte LLP
With a three-fold improvement on productivity required to balance the R&D equation, fundamental change may no longer be an option but a necessity for the industry.
35
Balancing the R&D equation | Measuring the return from pharmaceutical innovation 2016

Figure 22. Three-year average returns on late-stage portfolio, 2010-16
Source: Deloitte LLP
Abso
lute
IRR
(%)
20%
15%
5%
-5%2010-12 2011-13 2012-14 2013-15 2014-16
10%
0%
8.46.7 6.0
5.0 4.8
17.0
14.1Original cohort
Extension cohort
Key
Top performer
Third quartile
Mean
Median
First quartile
Bottom performer
Peer benchmarks and additional analysis
Figure 21. Year-on-year drivers of change in IRR, 2010-16
Source: Deloitte LLP
Abso
lute
IRR
(%)
14%
6%
2%
4%
0%
12%
10%
8%
2010
New
Exis
ting
Appr
oved
Term
inat
edR&
D c
ost (
pure
)
Oth
erM
argi
n
2011
New
Exis
ting
Appr
oved
Term
inat
edR&
D c
ost (
pure
)
Oth
erM
argi
n
2012
New
Exis
ting
Appr
oved
Term
inat
edR&
D c
ost (
pure
)
Oth
erM
argi
n
2013
New
Exis
ting
Appr
oved
Term
inat
edR&
D c
ost (
pure
)
Oth
erM
argi
n
2014
New
Exis
ting
Appr
oved
Term
inat
edR&
D c
ost (
pure
)
Oth
erM
argi
n
2015
New
Exis
ting
Appr
oved
Term
inat
edR&
D c
ost (
pure
)
Oth
erM
argi
n
2016
10.1
+1.3
-0.7
-2.7
-0.6
+0.6 -0.8
+0.5
7.6
+3.2
-1.2
-1.8
-0.9
-0.5
+0.5
+0.4
7.3
+2.3
-0.2
-2.5
-0.7
-0.5
-1.1
+0.2
4.8
+3.2
-0.1
-1.6
-0.7
-0.1
+0.4
-0.2
5.5
+2.0 +0
.5-2
.7-0
.2-0
.5
-0.2-0.2
4.2
+2.9
-0.5
-2.6
-0.3
-0.3
+0.6
-0.2
3.7
36
Balancing the R&D equation | Measuring the return from pharmaceutical innovation 2016

Figure 23. Three-year rolling average R&D cost to develop an asset from discovery to launch, 2010-16
Source: Deloitte LLP
Cost
to la
unch
($m
)
3,500
2,500
1,000
02010-12 2011-13 2012-14 2013-15 2014-16
2,000
500
3,000
1,500 $1,222 $1,277 $1,306$1,442 $1,508
$1,381
$1,082
Original cohort
Extension cohort
Key
Top performer
Third quartile
Mean
Median
First quartile
Bottom performer
Figure 24. Three-year rolling average peak sales per late-stage pipeline asset, 2010-16
Source: Deloitte LLP
Peak
sal
es ($
m)
1,200
1,000
400
02010-12 2011-13 2012-14 2013-15 2014-16
800
200
600
$692
$571
$497$451 $427
$993$1,037
Original cohort
Extension cohort
Key
Top performer
Third quartile
Mean
Median
First quartile
Bottom performer
37
Balancing the R&D equation | Measuring the return from pharmaceutical innovation 2016

Contacts
Deloitte EMEA contactsColin TerryPartnerLife Sciences R&D AdvisoryDeloitte MCS Ltd+44 (0) 20 7007 [email protected]
Julian RemnantPartner, EMEA Life Sciences R&D Advisory LeadDeloitte MCS Ltd+44 (0) 20 7303 3303 [email protected]
Hanno RontePartnerLife Science & HealthcareMonitor Deloitte+44 (0) 20 7007 [email protected]
John HaugheyPartner, Life Sciences and Healthcare Leader, UK & SwitzerlandDeloitte MCS Ltd+44 (0) 20 7303 [email protected]
Mike StandingPartner, Life Sciences and Healthcare Leader, EMEAMonitor Deloitte+44 (0) 20 7007 [email protected]
Deloitte US contactsNeil LesserPrincipalUS Life Sciences R&D StrategyDeloitte Consulting LLP+1 (215) 446 [email protected]
Daniel ResslerPrincipal, Life Sciences R&D Practice LeaderDeloitte Consulting LLP+1 (215) 299 [email protected]
Gregory RehPrincipal, Global Sector Leader Life SciencesDeloitte Consulting LLP+1 (215) 997 [email protected]
GlobalData contactsSean X. HuVP and Head of Consulting, AmericasGlobalData+1 (908) 578 [email protected]
Neil ColemanPrincipal Consultant, EMEAGlobalData+44 (0) 20 7406 [email protected]
Anne DelaneyGlobal Head of PharmaGlobalData+44 (0) 20 7406 [email protected]
AuthorsKaren TaylorDirectorUK Centre for Health SolutionsDeloitte LLP+44 (0) 20 7007 [email protected]
Mark StockbridgeManagerLife Sciences R&D AdvisoryDeloitte MCS Ltd+44 (0) 20 7303 [email protected]
Sonal ShahSenior ManagerUS Center for Health SolutionsDeloitte Services LP+1 (212) 653 [email protected]
Deloitte project teamWe would like to acknowledge the significant contribution of the following people to the analysis, research and drafting of the report, without which this report would not have been possible: Casey Korba, Oliver Whight and Matthew Thaxter (Deloitte Centre for Health Solutions), Susan Dick and Sim Taylor (Deloitte MCS Ltd). We would also like to thank the following members of the project team for their contribution to this report, Kevin Dondarski, Anthony Leese, William Loosemore and Richard Fautley.
Global Data ContributorsWe would like to acknowledge the contribution from Global Data’s Therapy Analysis and Database teams.
Contact informationTo see more research and sign up for future publications visit: www.deloitte.co.uk/centreforhealthsolutions
38
Balancing the R&D equation | Measuring the return from pharmaceutical innovation 2016

Endnotes
1. Political Prescriptions for Drug-Price Increases, Morgan Stanley, 2016. See also: https://www.morganstanley.com/ideas/drug-price-hikes-us-election-2016
2. Report of the United Nations Secretary-General’s High-Level Panel on Access to Medicines, United Nations, 2016. See also: https://static1.squarespace.com/static/562094dee4b0d00c1a3ef761/t/57d9c6ebf5e231b2f02cd3d4/1473890031320/UNSG+HLP+Report+FINAL+12+Sept+2016.pdf
3. Bloomberg L.P. (2016). Retrieved from Bloomberg database 05/10/2016
4. Restoring the pharmaceutical industry’s reputation, Nature Biotechnology, 2014. See also: http://www.nature.com/nbt/journal/v32/n10/full/nbt.3036.html
5. Rules for Modern Drug Development, Derek Lowe, 2016. See also: http://blogs.sciencemag.org/pipeline/archives/2016/08/16/rules-for-modern-drug-development
6. Pharmaceutical R&D performance by firm size: approval success rates and economic returns, American Journal of Therapeutics, 2014. See also: http://journals.lww.com/americantherapeutics/Abstract/2014/01000/Pharmaceutical_R_D_Performance_by_Firm_Size__.6.aspx
7. Trends in risks associated with new drug development: success rates for investigational drugs, Clinical Pharmacology & Therapeutics, 2010. See also: https://www.ncbi.nlm.nih.gov/pubmed/20130567
8. Can the pharmaceutical industry reduce attrition rates?, Nature Reviews: Drug Discovery, 2004. See also: http://www.nature.com/nrd/journal/v3/n8/full/nrd1470.html
9. Clinical Development Success Rates 2006-2015, BIO/BioMedTracker/Amplion, 2016. See also: https://www.bio.org/sites/default/files/Clinical%20Development%20Success%20Rates%202006-2015%20-%20BIO,%20Biomedtracker,%20Amplion%202016.pdf
10. Incoming Lilly CEO says dealmaking will be a focus, Reuters, 2016. See also: http://www.reuters.com/article/us-eli-lilly-ceo-idUSKCN1071AU
11. Roche Holding’s (RHHBY) CEO Severin Schwan on Q2 2016 Results – Earnings Call Transcript, Seeking Alpha, 2016. See also: http://seekingalpha.com/article/3990415-roche-holdings-rhhby-ceo-severin-schwan-q2-2016-results-earnings-call-transcript?part=single
12. Measuring the returns from pharmaceutical innovation 2015: Transforming R&D in uncertain times, Deloitte, 2015. See also: https://www2.deloitte.com/uk/en/pages/life-sciences-and-healthcare/articles/measuring-return-from-pharmaceutical-innovation.html
13. Segment Segmentation: Success in the Payer-Dominated Pharma Marketplace, In Vivo: Pharma Intelligence, 2016. See also: https://invivo.pharmamedtechbi.com/IV004900/Smart-Segmentation-Success-In-The-PayerDominated-Pharma-Marketplace
14. How is Biomarker Use for Patient Selection Affecting Clinical/Approval Success Rates?, BioMedTracker, 2016
15. How Immuno-Oncology is turning Biomarker Development on its head, In Vivo: Pharma Intelligence, 2016. See also: https://invivo.pharmamedtechbi.com/IV004938/How-ImmunoOncology-Is-Turning-Biomarker-Development-On-Its-Head
16. Segment Segmentation: Success in the Payer-Dominated Pharma Marketplace, In Vivo: Pharma Intelligence, 2016. See also: https://invivo.pharmamedtechbi.com/IV004900/Smart-Segmentation-Success-In-The-PayerDominated-Pharma-Marketplace
17. Segment Segmentation: Success in the Payer-Dominated Pharma Marketplace, In Vivo: Pharma Intelligence, 2016. See also: https://invivo.pharmamedtechbi.com/IV004900/Smart-Segmentation-Success-In-The-PayerDominated-Pharma-Marketplace
18. PCSK9 Inhibitors: Now That We Have Them What Do We Do? MedPageToday, 2015, See also: http://www.medpagetoday.com/Cardiology/Dyslipidemia/53451
19. PCSK9 Sponsors, Payers In The Ring At ACC, RealEndpoints, 2016. See also: https://realendpoints.com/pcsk9-sponsors-payers-in-the-ring-at-acc
20. The Robots are coming, Deloitte, 2015. See also https://www2.deloitte.com/content/dam/Deloitte/uk/Documents/finance/deloitte-uk-finance-robots-are-coming.pdf
39
Balancing the R&D equation | Measuring the return from pharmaceutical innovation 2016

Notes
40
Balancing the R&D equation | Measuring the return from pharmaceutical innovation 2016


Deloitte refers to one or more of Deloitte Touche Tohmatsu Limited (“DTTL”), a UK private company limited by guarantee, and its network of member firms, each of which is a legally separate and independent entity. Please see www.deloitte.co.uk/about for a detailed description of the legal structure of DTTL and its member firms.
Deloitte LLP is the United Kingdom member firm of DTTL.
This publication has been written in general terms and therefore cannot be relied on to cover specific situations; application of the principles set out will depend upon the particular circumstances involved and we recommend that you obtain professional advice before acting or refraining from acting on any of the contents of this publication. Deloitte LLP would be pleased to advise readers on how to apply the principles set out in this publication to their specific circumstances. Deloitte LLP accepts no duty of care or liability for any loss occasioned to any person acting or refraining from action as a result of any material in this publication.
© 2016 Deloitte LLP. All rights reserved.
Deloitte LLP is a limited liability partnership registered in England and Wales with registered number OC303675 and its registered office at 2 New Street Square, London EC4A 3BZ, United Kingdom. Tel: +44 (0) 20 7936 3000 Fax: +44 (0) 20 7583 1198.
Designed and produced by The Creative Studio at Deloitte, London. J10513