Embed Size (px)
Citation preview
1
BALFOUR BEATTY PLC RESULTS FOR THE HALF-YEAR ENDED 30 JUNE 2017
16 August 2017
Financial Highlights
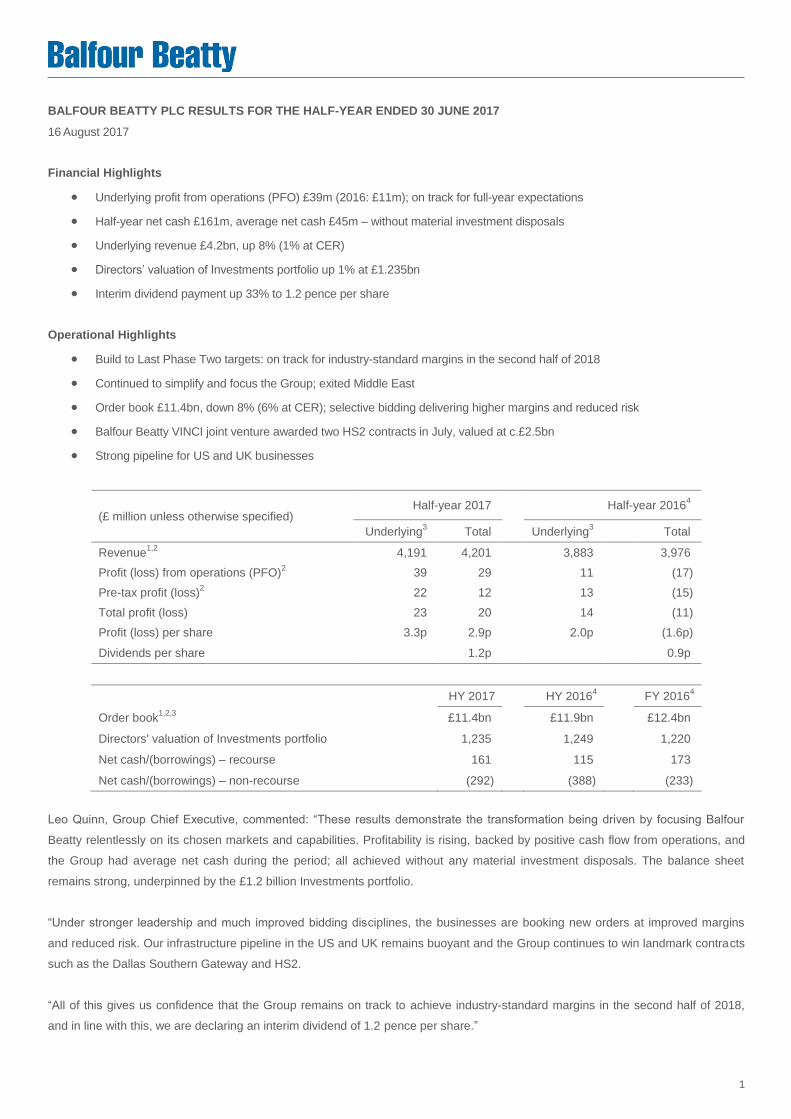
Underlying profit from operations (PFO) £39m (2016: £11m); on track for full-year expectations
Half-year net cash £161m, average net cash £45m – without material investment disposals
Underlying revenue £4.2bn, up 8% (1% at CER)
Directors’ valuation of Investments portfolio up 1% at £1.235bn
Interim dividend payment up 33% to 1.2 pence per share
Operational Highlights
Build to Last Phase Two targets: on track for industry-standard margins in the second half of 2018
Continued to simplify and focus the Group; exited Middle East
Order book £11.4bn, down 8% (6% at CER); selective bidding delivering higher margins and reduced risk
Balfour Beatty VINCI joint venture awarded two HS2 contracts in July, valued at c.£2.5bn
Strong pipeline for US and UK businesses
(£ million unless otherwise specified) Half-year 2017 Half-year 2016
4
Underlying3 Total Underlying
3 Total
Revenue1,2
4,191 4,201
3,883
3,976
Profit (loss) from operations (PFO)2 39 29
11
(17)
Pre-tax profit (loss)2 22 12
13
(15)
Total profit (loss) 23 20
14
(11)
Profit (loss) per share 3.3p 2.9p
2.0p
(1.6p)
Dividends per share 1.2p 0.9p
HY 2017
HY 2016
4
FY 2016
4
Order book1,2,3
£11.4bn
£11.9bn
£12.4bn
Directors' valuation of Investments portfolio 1,235
1,249
1,220
Net cash/(borrowings) – recourse 161
115
173
Net cash/(borrowings) – non-recourse (292) (388) (233)
Leo Quinn, Group Chief Executive, commented: “These results demonstrate the transformation being driven by focusing Balfour
Beatty relentlessly on its chosen markets and capabilities. Profitability is rising, backed by positive cash flow from operations, and
the Group had average net cash during the period; all achieved without any material investment disposals. The balance sheet
remains strong, underpinned by the £1.2 billion Investments portfolio.
“Under stronger leadership and much improved bidding disciplines, the businesses are booking new orders at improved margins
and reduced risk. Our infrastructure pipeline in the US and UK remains buoyant and the Group continues to win landmark contracts
such as the Dallas Southern Gateway and HS2.
“All of this gives us confidence that the Group remains on track to achieve industry-standard margins in the second half of 2018,
and in line with this, we are declaring an interim dividend of 1.2 pence per share.”

2
Notes: 1 including share of joint ventures and associates
2 from continuing operations
3 before non-underlying items (Note 7)
4 re-presented to classify the Group’s 49% interests in Dutco Balfour Beatty LLC and BK Gulf LLC as discontinued operations
Alternative performance measures (APM), including constant exchange rates (CER), are defined in the Measuring Our
Performance section of this document.
Investor and Analyst enquiries:
Angus Barry
Tel. +44 (0)20 7216 6824
Media enquiries:
Louise McCulloch
Tel. +44 (0)20 7216 6846
Investor and Analyst presentation:
A presentation to investors and analysts will be made at 58VE, 58 Victoria Embankment, London, EC4Y 0DS at 09:00 (UK time) on
16 August 2017. There will be a live webcast of this presentation on: www.balfourbeatty.com/webcast
3
2017 HALF-YEAR RESULTS ANNOUNCEMENT
GROUP CHIEF EXECUTIVE’S REVIEW
RESULTS OVERVIEW
DIVISIONAL OPERATING REVIEW
OTHER FINANCIAL ITEMS
MEASURING OUR PERFORMANCE
GROUP CHIEF EXECUTIVE’S REVIEW
The Group’s half-year 2017 results demonstrate the strong benefits being delivered under the Build to Last transformation
programme.
For the first six months, the Group reported an underlying profit from operations of £39 million (2016: £11 million). Significantly,
there were material year-on-year improvements in each earnings-based business, with Support Services reporting profits in the
range of industry-standard margins and US Construction well-positioned to do so for the full-year. UK Construction continues to
make solid progress, reporting a profit from operations of £2 million (2016: £69 million loss). The Group is confident of achieving
industry-standard margins in the second half of 2018 as it continues to drive three key levers for improved financial performance:
managing the remaining historical contracts through to completion; reducing costs across the Group; and executing on the
improved order book.
Management has continued to build a culture of strong cash discipline and cost control. Group net cash at 30 June 2017 was £161
million (2016: £115 million), with no material asset sales from the Investments portfolio in the period. Average net cash in the period
was £45 million and the Group continues to reduce seasonal variations in cash flow. This, coupled with the Directors’ valuation of
the Investments portfolio, which stands at £1.235 billion (FY 2016: £1.220 billion), emphasises the strength of Balfour Beatty’s
balance sheet.
The order book at 30 June 2017 stood at £11.4 billion (FY 2016: £12.4 billion), down 8% (6% at CER), due, in part, to phasing and
lower orders consistent with the Group’s stated policy of selective bidding, managed through the Gated Lifecycle process, to avoid
projects not aligned with the Group’s capabilities or where the risk/reward is not appropriately balanced.
In July 2017, HS2 awarded Balfour Beatty’s 50:50 joint venture (Balfour Beatty VINCI) the maximum two sections of Phase One,
Lot N1 and Lot N2 valued at £1.32 billion and £1.15 billion respectively, in a two-part design and build contract (NEC Target Cost
C). These awards are not yet included in the order book and are characteristic of the strong pipeline of projects in the Group’s
chosen markets.
The Group exited the Middle East in the period following the sale of its entire share of Dutco Balfour Beatty and BK Gulf. Both
businesses were sold, with no future liabilities, to its joint venture partner in early 2017, allowing management to focus on its
chosen markets and capabilities.
As the legacy challenges are increasingly worked through, management has been able to focus the Group on its chosen markets –
those where opportunities are greatest and have the best match with Balfour Beatty’s capabilities. The impact of upgraded
leadership and improved governance means that new contracts are coming on stream which are bid, won, executed and monitored
to the Group’s new contracting disciplines. This means that the strong foundation created in the first 24-month self-help phase of
Build to Last will increasingly be reflected in improved operational delivery.
4
Build to Last
The Group transformation continues to be shaped by progress against its Build to Last goals of Lean, Expert, Trusted and Safe,
measured by cash flow and profits from operations, employee engagement, customer satisfaction and Zero Harm, respectively.
In Lean, the governance and processes introduced during Phase One of Build to Last have put Balfour Beatty on track to achieve
industry-standard margins in the second half of 2018. Having exceeded its Phase One targets of £200 million cash in : £100 million
cost out, the Group continues to exploit opportunities to re-engineer processes to drive efficiencies and take out cost, whilst
maintaining or improving effectiveness.
As a priority, the Group continues to invest in its Expert people, looking to recruit, train and retain the highest calibre of workforce.
Whilst the growing pipeline of major projects increases competition for skilled workers, Balfour Beatty’s ability to win some of the
most iconic and challenging engineering projects in the industry provides an important attraction for the most talented employees.
Skills shortages within the construction industry have been a challenge for some time. In the UK, the decision to leave the
European Union, the weakness of sterling and uncertainty around free movement are likely to reduce migrant labour at a time when
a growing pipeline of major projects is likely to increase demand for skilled workers. Balfour Beatty is, therefore, focused on
maintaining the core strength of its capability, investing in the future and improving the employee proposition.
The Group has been developing competency frameworks for key operational job families including Project Management,
Engineering and Commercial, thus ensuring that an individual’s experience and competencies can be matched to contract risk and
complexity, as well as providing a clear career path for employees. This approach is now 85% complete across the core Project
Management job family and 50% complete for Engineering. Following a successful pilot in May 2017, it is now being rolled out
across the wider Commercial job family.
Balfour Beatty continues its sponsorship of The 5% Club, which encourages employers to provide ‘earn and learn’ training
opportunities to equip the UK’s workforce with the necessary skills for the UK’s economy to succeed.
Trusted is Balfour Beatty doing “what it says it will do”. The governance and controls which have been put in place – including the
Gated Lifecycle, the Digital Briefcase and Project on a Page – provide management with a clear and consistent line of sight on work
which is being bid for and delivered.
The Gated Lifecycle, introduced in 2015, takes a project from the initial enquiry through to completion. The process reduces the risk
of pursuing inappropriate opportunities, underbidding or accepting inappropriate levels of risk, including the cash profile of projects.
All new UK sales opportunities and projects are now using the Digital Briefcase, a secure web-based platform which continues to
digitise the governance and document control through all stages of the Gated Lifecycle; a further 100 active projects have installed
this retrospectively. The Digital Briefcase helps to ensure that correct procedure is being followed and that documentation is more
easily accessible in the event of claims or other issues.
Project on a Page allows for projects to be monitored in a timely and consistent manner, enabling early intervention where signs of
adverse trends are detected, thus reducing risk to the business and strengthening customer relationships.
The Group’s use of IT and IT systems has been transformed since the start of Build to Last, providing the ability to monitor and
intervene on projects to a degree not possible two years ago, and is now providing the Group with a competitive advantage.
Taken together, the governance and controls now in place allow Balfour Beatty to selectively bid business to match capability, with
reduced levels of risk; track execution all the way through the lifecycle of a project, including the defect period; and ultimately drive
higher margins for the Construction and Support Services businesses.
5
Everyone who comes into contact with Balfour Beatty’s work has the right to go home safely at the end of the day. Our Safe goal is
monitored through a combination of leading and lagging performance indicators: in the first half of 2017, all of these indicators
continue to trend positively, with the Group Lost Time Incident Rate (excluding international joint ventures) falling to 0.19 (FY 2016:
0.22), continuing the steady improvement since the start of the Build to Last programme.
With a focus on safety and health by design, the Group are increasingly using digital technology and exploring ways to move work
off site where it can be done more safely, such as modularisation. Digital technology and virtual reality are helping reduce and
eliminate risks by supporting staff training and identifying potential construction risk pinch points.
Markets
The Group primarily operates across three geographies (UK, US and the Far East) and three sectors (Construction Services,
Support Services and Infrastructure Investments). As such, it is less exposed to a downturn in a single geography or sector.
Overall, the trading environment for Balfour Beatty’s chosen markets and capabilities remains favourable.
In the UK, Government policy is helping to drive a strong pipeline of major infrastructure projects in transport and energy. Over the
next few years, the ‘4Hs’ – HS2 (High Speed rail), new nuclear power stations at Hinkley Point C and Wylfa, smart motorways for
Highways England and the third runway at Heathrow airport – will contribute to the Government’s investment in infrastructure
commitment, which is targeted to rise from 0.8% to over 1% of GDP by 2020-21.
Within the UK commercial building sector, Balfour Beatty continues to see growth opportunities across regional markets. The Group
remains cautious on the outlook for London, where there has been a slowdown of projects coming to market. As London has been
a highly-competitive market for some time, Balfour Beatty has chosen to become more selective in the opportunities it pursues in
this area.
In the US, Balfour Beatty operates in specific geographies. As the population migrates south and west, it is moving to cities, driving
urbanisation in our chosen markets. This leads directly to increased demand for buildings and infrastructure.
Even before the 2016 Presidential election, there was a strong market outlook for construction. In December 2015, the FAST Act
(Fixing America’s Surface Transportation), a US$305 billion transportation bill, was signed, providing guaranteed funding for a five-
year period. There are further opportunities being created, for example with the number of state-backed infrastructure bonds (over
US$200 billion multi-state transportation bonds, US$35 billion of education bonds in California).
In Support Services, the outlook for the power transmission and distribution market is positive. Gas and water operates in a stable
market as a cost plus business with a fee on recovery. Water is in the middle of its asset management period (AMP) cycle, with the
next round of new contracts to be awarded in 2020. Transportation, which includes major road and rail maintenance contracts, is
expected to remain stable.
The Infrastructure Investments business continues to see significant opportunities for future investment in its chosen geographic
markets in the UK and North America, including any potential development of a PF2 pipeline in the UK and the new administration’s
proposed PPP infrastructure investment in the US.
Outlook
The Build to Last transformation programme is designed to deliver superior returns over the medium term for all stakeholders, from
a Group which is Lean, Expert, Trusted and Safe. As a result of the successful self-help actions taken in Phase One, Balfour Beatty
now has a solid foundation on which to deliver sustainable, profitable growth.
6
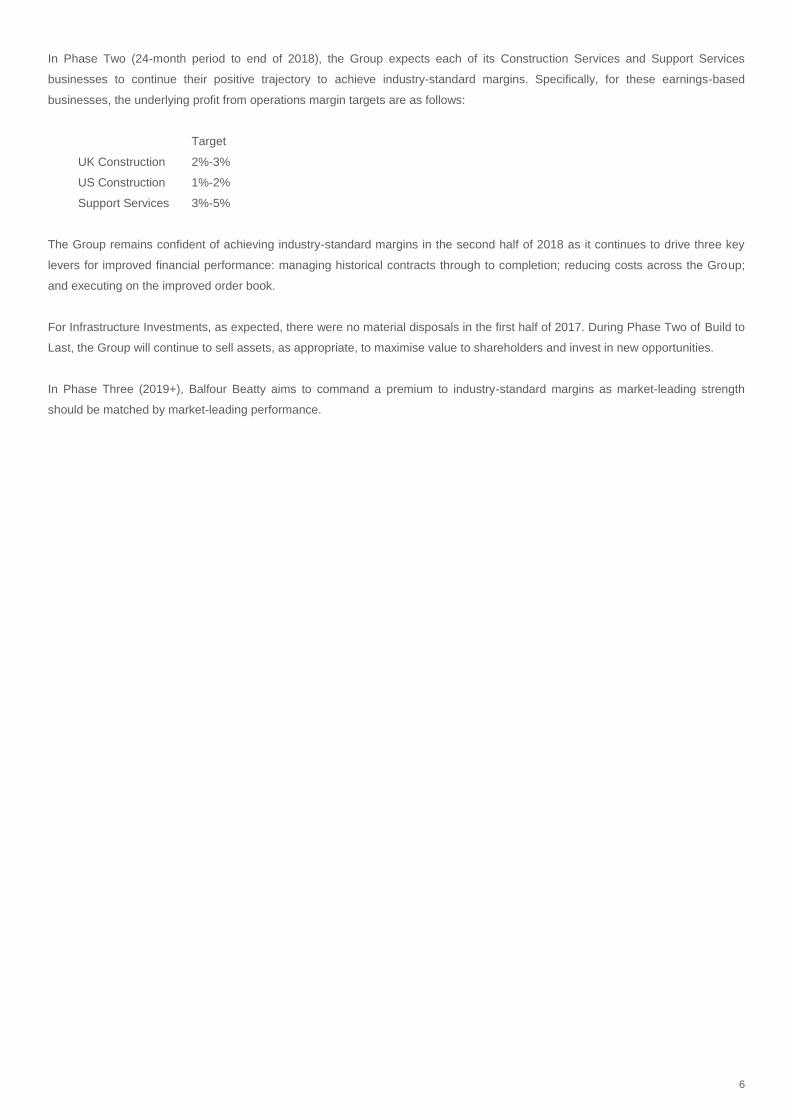
In Phase Two (24-month period to end of 2018), the Group expects each of its Construction Services and Support Services
businesses to continue their positive trajectory to achieve industry-standard margins. Specifically, for these earnings-based
businesses, the underlying profit from operations margin targets are as follows:
Target
UK Construction 2%-3%
US Construction 1%-2%
Support Services 3%-5%
The Group remains confident of achieving industry-standard margins in the second half of 2018 as it continues to drive three key
levers for improved financial performance: managing historical contracts through to completion; reducing costs across the Group;
and executing on the improved order book.
For Infrastructure Investments, as expected, there were no material disposals in the first half of 2017. During Phase Two of Build to
Last, the Group will continue to sell assets, as appropriate, to maximise value to shareholders and invest in new opportunities.
In Phase Three (2019+), Balfour Beatty aims to command a premium to industry-standard margins as market-leading strength
should be matched by market-leading performance.
7
RESULTS OVERVIEW
Unless otherwise stated, all commentary in this section, the Divisional operating reviews and Other financial items is on an
underlying continuing operations basis.
Throughout this report, Balfour Beatty has presented financial performance measures which are used to manage the Group’s
performance. These financial performance measures are chosen to provide a balanced view of the Group’s operations and are
considered useful to investors as these measures provide relevant information on the Group’s past or future performance, position
or cash flows. These measures are also used internally to assess business performance in its budgeting process and when
determining compensation. An explanation of the Group’s financial performance measures and appropriate reconciliations to its
statutory measures is provided in the Measuring Our Performance section. Non-underlying items and the results from discontinued
operations are the causes of the differences between underlying and statutory profitability. Additionally, underlying revenue includes
the Group’s share of revenue in joint ventures and associates and is presented on a continuing operations basis.
The Group has presented its 49% interests in its Middle East joint ventures as discontinued operations in the first half of the year,
with comparatives restated accordingly.
As previously advised, UK Construction now includes Rail Construction, with comparatives restated accordingly.
Group financial summary
Underlying revenue from continuing operations, including joint ventures and associates (underlying revenue), increased by 8% (1%
at CER) in the first half to £4,191 million (2016: £3,883 million). Statutory revenue, which excludes joint ventures and associates,
was £3,544 million (2016: £3,323 million).
Construction Services underlying revenue was up 12% (4% at CER) at £3,408 million (2016: £3,036 million), primarily due to
growth in the US. Support Services underlying revenue declined 5% to £519 million (2016: £548 million) as an increase in utilities
was more than offset by lower transportation revenues.
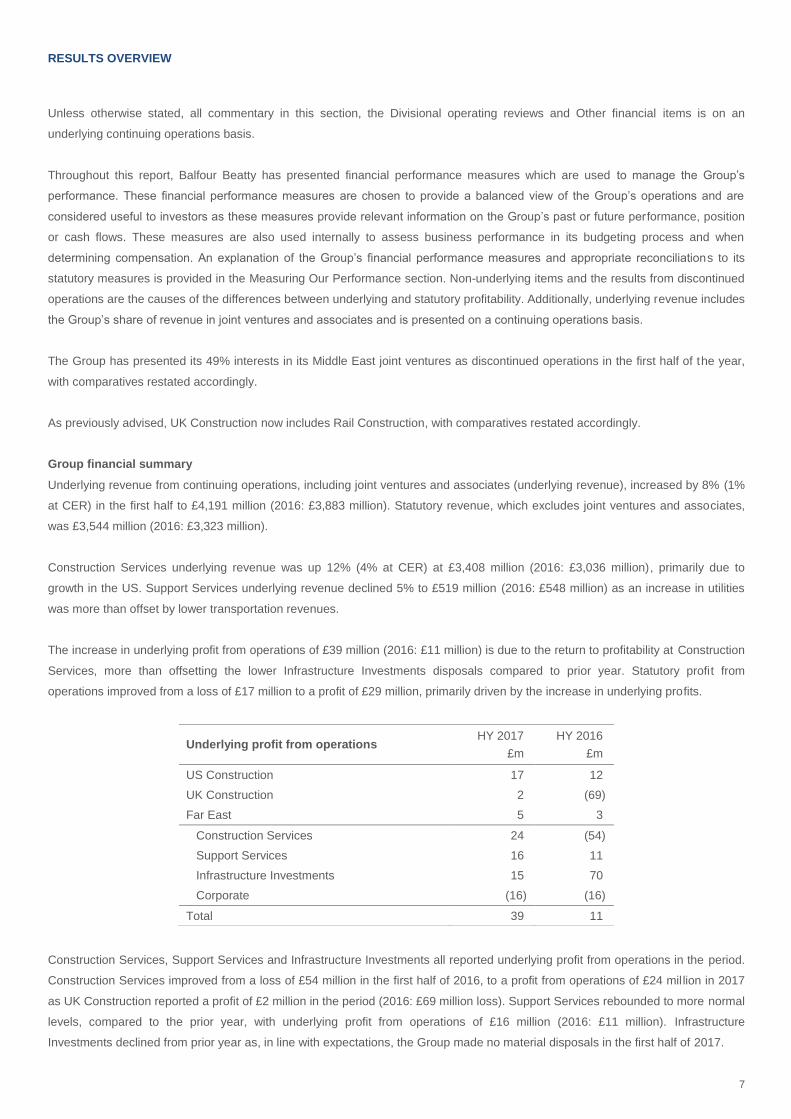
The increase in underlying profit from operations of £39 million (2016: £11 million) is due to the return to profitability at Construction
Services, more than offsetting the lower Infrastructure Investments disposals compared to prior year. Statutory profit from
operations improved from a loss of £17 million to a profit of £29 million, primarily driven by the increase in underlying profits.
Construction Services, Support Services and Infrastructure Investments all reported underlying profit from operations in the period.
Construction Services improved from a loss of £54 million in the first half of 2016, to a profit from operations of £24 mil lion in 2017
as UK Construction reported a profit of £2 million in the period (2016: £69 million loss). Support Services rebounded to more normal
levels, compared to the prior year, with underlying profit from operations of £16 million (2016: £11 million). Infrastructure
Investments declined from prior year as, in line with expectations, the Group made no material disposals in the first half of 2017.
Underlying profit from operations HY 2017
£m
HY 2016
£m
US Construction 17 12
UK Construction 2 (69)
Far East 5 3
Construction Services 24 (54)
Support Services 16 11
Infrastructure Investments 15 70
Corporate (16) (16)
Total 39 11
8
Net finance costs increased to £17 million (2016: £2 million gain), primarily due to a £3 million foreign exchange charge in the
period, compared to a foreign exchange benefit of £12 million in 2016. The taxation charge on underlying profits increased to £nil
million (2016: £7 million tax credit) due to the changing geographic mix of profits in the period.
Underlying profit after tax for the period of £23 million (2016: £14 million) is due to the improvement in profit from operations,
partially offset by higher finance and taxation charges. Total statutory profit after tax for the period was £20 million (2016: £11
million loss).
As a result of phasing and the continued disciplined and selective approach to bidding, the order book decreased 8% to £11.4
billion (6% at CER) from £12.4 billion at December 2016. The decrease was predominantly due to Construction Services at £8.1
billion (FY 2016: £9.3 billion), with US Construction down 10% at CER and Far East down 18% at CER. The UK Construction order
book was down 4% at £2.2 billion. The Support Services order book increased 6% to £3.3 billion (FY 2016: £3.1 billion).
Earnings per share
Underlying earnings per share from continuing operations was 3.2 pence (2016: 2.7 pence), which, along with a non-underlying
loss per share from continuing operations of 1.2 pence (2016: 4.0 pence), gave a total earnings per share for continuing operations
of 2.0 pence (2016: 1.3 pence loss). Discontinued operations per share of 0.1 pence (2016: 0.7 pence loss) contributed to the total
underlying earnings of 3.3 pence (2016: 2.0 pence). Total earnings per share was 2.9 pence (2016: 1.6 pence loss).
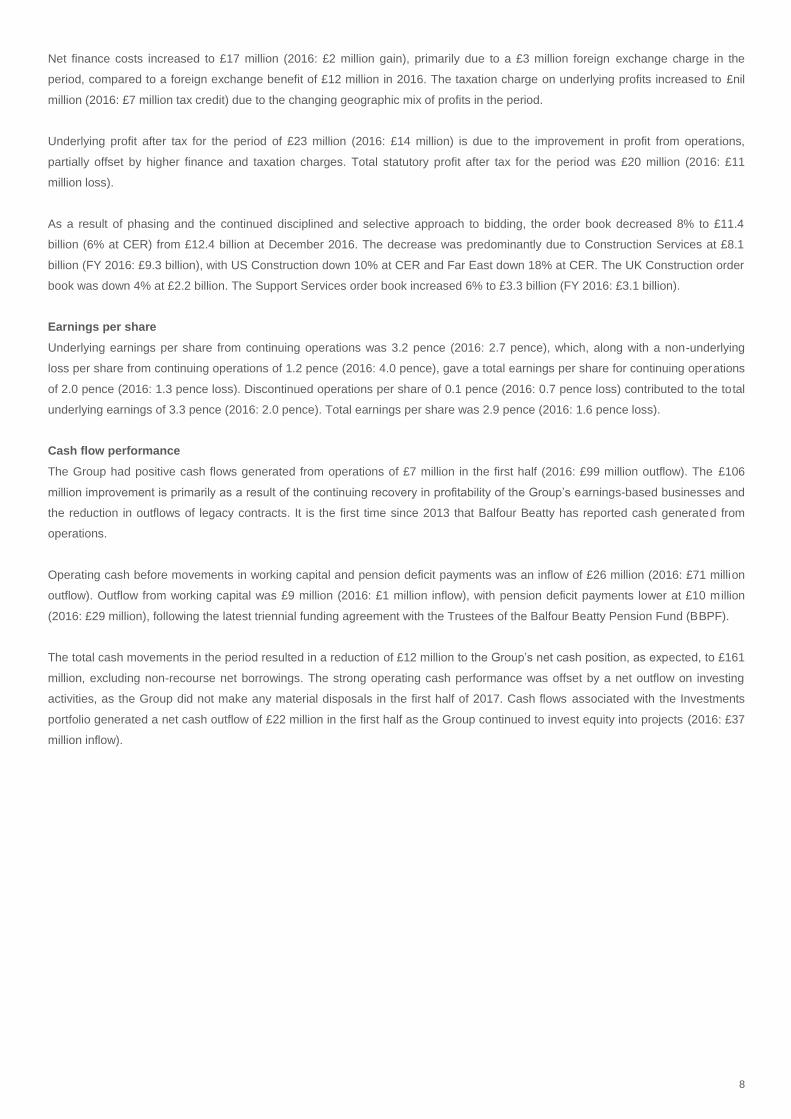
Cash flow performance
The Group had positive cash flows generated from operations of £7 million in the first half (2016: £99 million outflow). The £106
million improvement is primarily as a result of the continuing recovery in profitability of the Group’s earnings-based businesses and
the reduction in outflows of legacy contracts. It is the first time since 2013 that Balfour Beatty has reported cash generated from
operations.
Operating cash before movements in working capital and pension deficit payments was an inflow of £26 million (2016: £71 million
outflow). Outflow from working capital was £9 million (2016: £1 million inflow), with pension deficit payments lower at £10 million
(2016: £29 million), following the latest triennial funding agreement with the Trustees of the Balfour Beatty Pension Fund (BBPF).
The total cash movements in the period resulted in a reduction of £12 million to the Group’s net cash position, as expected, to £161
million, excluding non-recourse net borrowings. The strong operating cash performance was offset by a net outflow on investing
activities, as the Group did not make any material disposals in the first half of 2017. Cash flows associated with the Investments
portfolio generated a net cash outflow of £22 million in the first half as the Group continued to invest equity into projects (2016: £37
million inflow).
9
Cash flow performance HY 2017
£m
HY 2016
£m
Operating cash flows 26 (71)
Working capital (9) 1
Pension deficit payments (10) (29)
Cash generated from / (used in) operations 7 (99)
Infrastructure Investments:
- Disposal proceeds 2 82
- New investments (24) (45)
Effects of foreign exchange 5 23
Other (2) (9)
Cash (outflow)/inflow (12) (48)
Opening net cash1 173 163
Movements in the year (12) (48)
Closing net cash1 161 115
1 excluding infrastructure concessions (non-recourse)
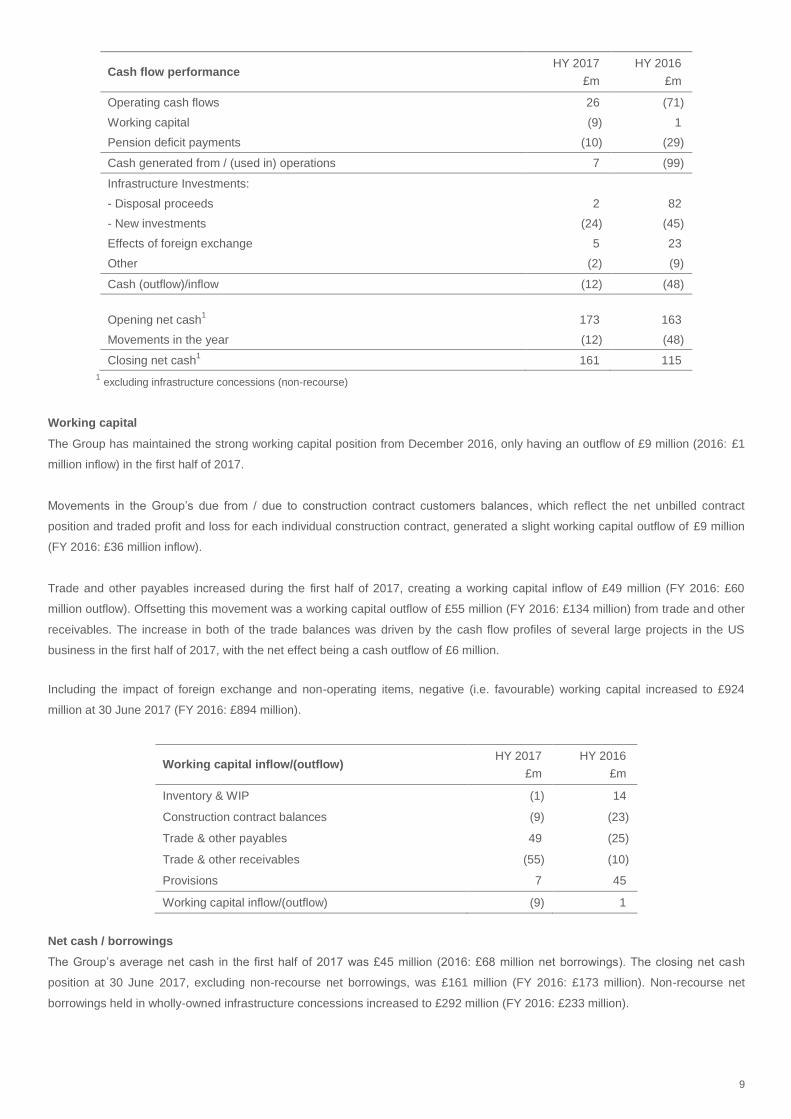
Working capital
The Group has maintained the strong working capital position from December 2016, only having an outflow of £9 million (2016: £1
million inflow) in the first half of 2017.
Movements in the Group’s due from / due to construction contract customers balances, which reflect the net unbilled contract
position and traded profit and loss for each individual construction contract, generated a slight working capital outflow of £9 million
(FY 2016: £36 million inflow).
Trade and other payables increased during the first half of 2017, creating a working capital inflow of £49 million (FY 2016: £60
million outflow). Offsetting this movement was a working capital outflow of £55 million (FY 2016: £134 million) from trade and other
receivables. The increase in both of the trade balances was driven by the cash flow profiles of several large projects in the US
business in the first half of 2017, with the net effect being a cash outflow of £6 million.
Including the impact of foreign exchange and non-operating items, negative (i.e. favourable) working capital increased to £924
million at 30 June 2017 (FY 2016: £894 million).
Working capital inflow/(outflow) HY 2017
£m
HY 2016
£m
Inventory & WIP (1) 14
Construction contract balances (9) (23)
Trade & other payables 49 (25)
Trade & other receivables (55) (10)
Provisions 7 45
Working capital inflow/(outflow) (9) 1
Net cash / borrowings
The Group’s average net cash in the first half of 2017 was £45 million (2016: £68 million net borrowings). The closing net cash
position at 30 June 2017, excluding non-recourse net borrowings, was £161 million (FY 2016: £173 million). Non-recourse net
borrowings held in wholly-owned infrastructure concessions increased to £292 million (FY 2016: £233 million).
10
Dividend
The Board is declaring an interim dividend of 1.2 pence per share, a 33% increase on prior year (0.9 pence per share). The Board
anticipates a progressive dividend policy going forward.
DIVISIONAL OPERATING REVIEWS
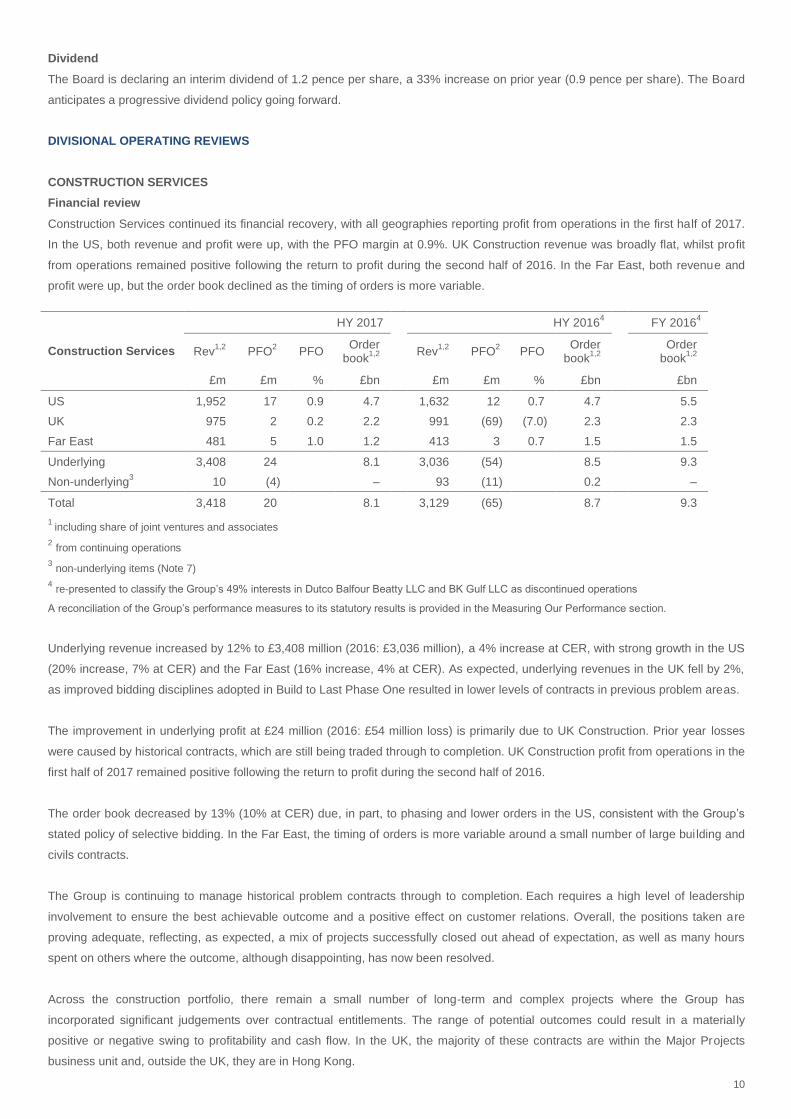
CONSTRUCTION SERVICES
Financial review
Construction Services continued its financial recovery, with all geographies reporting profit from operations in the first half of 2017.
In the US, both revenue and profit were up, with the PFO margin at 0.9%. UK Construction revenue was broadly flat, whilst profit
from operations remained positive following the return to profit during the second half of 2016. In the Far East, both revenue and
profit were up, but the order book declined as the timing of orders is more variable.
1 including share of joint ventures and associates
2 from continuing operations
3 non-underlying items (Note 7)
4 re-presented to classify the Group’s 49% interests in Dutco Balfour Beatty LLC and BK Gulf LLC as discontinued operations
A reconciliation of the Group’s performance measures to its statutory results is provided in the Measuring Our Performance section.
Underlying revenue increased by 12% to £3,408 million (2016: £3,036 million), a 4% increase at CER, with strong growth in the US
(20% increase, 7% at CER) and the Far East (16% increase, 4% at CER). As expected, underlying revenues in the UK fell by 2%,
as improved bidding disciplines adopted in Build to Last Phase One resulted in lower levels of contracts in previous problem areas.
The improvement in underlying profit at £24 million (2016: £54 million loss) is primarily due to UK Construction. Prior year losses
were caused by historical contracts, which are still being traded through to completion. UK Construction profit from operations in the
first half of 2017 remained positive following the return to profit during the second half of 2016.
The order book decreased by 13% (10% at CER) due, in part, to phasing and lower orders in the US, consistent with the Group’s
stated policy of selective bidding. In the Far East, the timing of orders is more variable around a small number of large building and
civils contracts.
The Group is continuing to manage historical problem contracts through to completion. Each requires a high level of leadership
involvement to ensure the best achievable outcome and a positive effect on customer relations. Overall, the positions taken are
proving adequate, reflecting, as expected, a mix of projects successfully closed out ahead of expectation, as well as many hours
spent on others where the outcome, although disappointing, has now been resolved.
Across the construction portfolio, there remain a small number of long-term and complex projects where the Group has
incorporated significant judgements over contractual entitlements. The range of potential outcomes could result in a materially
positive or negative swing to profitability and cash flow. In the UK, the majority of these contracts are within the Major Projects
business unit and, outside the UK, they are in Hong Kong.
Construction Services
HY 2017
HY 20164
FY 2016
4
Rev1,2
PFO2 PFO
Order book
1,2
Rev1,2
PFO2 PFO
Order book
1,2
Order book
1,2
£m £m % £bn
£m £m % £bn
£bn
US 1,952 17 0.9 4.7
1,632 12 0.7 4.7
5.5
UK 975 2 0.2 2.2
991 (69) (7.0) 2.3
2.3
Far East 481 5 1.0 1.2
413 3 0.7 1.5
1.5
Underlying 3,408 24 8.1
3,036 (54) 8.5
9.3
Non-underlying3 10 (4) –
93 (11) 0.2
–
Total 3,418 20 8.1 3,129 (65) 8.7
9.3
11
As these challenges reduce, new contracts are coming on stream which are bid, won, executed and monitored to the Group’s new
contracting disciplines. This means that the strong foundation created in the first 24 months of Build to Last will increasingly be
reflected in improved operational delivery. As this feeds through the second phase of Build to Last, management time can
increasingly be refocused onto the many opportunities in the pipeline which play to Balfour Beatty’s engineering capability.
Operational review
UK
The UK Construction business is organised into three delivery units consisting of:
Major Projects: focused on complex projects and ground engineering services in key market sectors such as
transportation, heavy infrastructure and energy;
Regional: private and public, civil engineering, mechanical and electrical engineering and building, providing customers
with locally-delivered, flexible and fully-integrated civil and building services; and
Rail: Civil engineering, track, power and electrification projects.
Underlying revenue fell by 2% to £975 million (2016: £991 million) as increases in Major Projects, notably highways, were offset by
lower Regional revenues in London and the North & Midlands.
The underlying profit from the UK construction business at £2 million (2016: £69 million loss), represented solid progress from the
prior year. Prior year losses were caused by historical contracts, which are still being traded through to completion.
The UK order book decreased by 4% to £2.2 billion (FY 2016: £2.3 billion). The UK construction business continued to be more
selective in the work that it bids, through increased bid margin thresholds, improved risk frameworks and better contract
governance. There has also been a shift towards a lower risk contract portfolio, with a reduction in the number of fixed price
contracts offset by an increase in target cost contracts and framework agreements. Both target cost contracts and framework
agreements require early contractor involvement (ECI) with the customer to ensure greater clarity around scope, schedule and cost
which, in combination, reduces delivery risk for all parties.
The business is continuing to manage historical problem contracts through to completion. At the 2015 half-year, 89 historical
contracts were identified that had a material negative impact on profitability and cash. As at the end of June 2017, 82 (92%) of
these projects were at practical completion (90% at end December 2016), with over 75% at financial completion (over 70% at end
December 2016). Two of the remaining seven contracts are expected to reach practical completion in 2017, with the remainder in
2018.
In the first half of 2017, the Major Projects business successfully opened the M3 as a four-lane smart motorway between junction
4a for Farnborough and junction 2 for the M25. The project added an extra lane in both directions by converting the hard shoulder
into a traffic lane – increasing capacity and adding technology that will make the road more resilient for road users.
At the A14 between Cambridge and Huntingdon, work has commenced which includes widening a total of seven miles of the A14 in
each direction, a major new bypass south of Huntingdon, widening a three-mile section of the A1 and demolishing a viaduct at
Huntingdon. At the A21 project, a key milestone was achieved with completion of a new flyover which forms part of the major
upgrade works between Tonbridge and Pembury in Kent.
On Crossrail, Balfour Beatty’s three major projects: C510 (Liverpool Street and Whitechapel Station tunnels); C512 (Whitechapel
Station); and C530 (Woolwich Station) all made significant progress during the period and at the Thames Tideway Tunnel work
continues on the 6-kilometre ‘West’ section which runs from Acton to Wandsworth.
12
In July, Balfour Beatty’s 50:50 joint venture with VINCI was awarded two major civil engineering lots (Lots N1 and N2), the two
northern stretches of HS2 Phase 1, closest to Birmingham. Balfour Beatty VINCI will deliver Lot N1, valued at c.£1.32 billion, and
Lot N2, valued at c.£1.15 billion, between the Long Itchington Wood Green tunnel to the Delta Junction / Birmingham Spur and from
the Delta Junction to the West Coast Main Line tie-in respectively, in a two-part design and build contract. The contracts will be
included in awarded but not contracted (ABNC) as the first stage, a 16-month Early Contract Involvement (ECI) period, commenced
on 28 July 2017.
Also included in ABNC, the highways business has been selected to deliver two Smart Motorway packages to upgrade sections of
the M6 (J2 – J4) and M4 (J3 – J12). Additionally, a contract from Highways England for the construction of a proposed lorry area
near the M20 has been awarded, but is currently under consultation.
The Major Projects business continues to pursue a number of major infrastructure opportunities across core transportation and
energy markets. Over the next few years HS2, new nuclear power stations (Hinkley, Wyfla) and airport expansion (Heathrow) will
all contribute to the Government’s investment in infrastructure target, which is forecast to rise to over 1% of GDP by 2020-21. In
addition, the highways market continues to provide good growth opportunities following the Government’s commitment of £15 billion
to Highways England in order to deliver the first Roads Investment Strategy.
The Regional business is organised into four regions and Balfour Beatty Kilpatrick.
Regional Construction: Four regions (Scotland, North & Midlands, South and London) providing public and private
customers with locally-delivered, flexible and fully-integrated civil and building services.
Balfour Beatty Kilpatrick: Heavy mechanical and electrical (M&E) installations and building services.
As a result of the focus on bidding for contracts with increased margins and more favourable contract terms, the Regional business
is now focused on fewer, larger contracts and continues to reduce its exposure to contracts under £5 million. This allows the
business to focus on projects where risk/reward is appropriately balanced and it also improves the span of control as it operates
fewer sites. As a result, the total number of live jobs in the Regional business has reduced from over 400 at December 2015 to
approximately 200 at June 2017. Over 150 of the current live projects have been through the Gated Lifecycle process.
In the first half of 2017, the Regional business successfully completed the Pen y Cymoedd wind farm. Europe’s largest onshore
wind farm started operating at full power for the first time on 7 May 2017. Other projects successfully handed over to customers
include: Gatwick level 10, which involved improvements to check-in and bag-drop facilities, utilising newer technology, in a better
layout, to provide efficiency gains and reduced queues; Lewisham and Southwark College, comprising an extension to the college
campus in central London, resulting in a new teaching block, reception and break-out areas; and Project Zeppelin, the construction
of a cryogenic storage tank, forming part of a new ethane import terminal facility on Teesside.
Work commenced at the Madison Tower, a 53-storey residential building in Canary Wharf, London. Other material ongoing projects
include: the Kennedy Street student accommodation project in Glasgow; Redwood luxury retirement village for Audley; and the
renovation and new-build scheme at No.1 Palace Street in St James’, London. At RAF Marham, a topping-out ceremony was held
as the last panel of roofing was set for the new hanger build.
The Regional business won a number of new contracts in the year to-date. Notable new awards include a:
£179 million contract to construct 2,000 new bedrooms for Sussex University;
£29 million contract to construct new secondary schools for the David Ross Educational Trust;
£23 million Tails Management Facility (TMF) for Urenco; and
£16 million enabling works contract by Network Rail for the redevelopment of Glasgow Queen Street Station.
13
Balfour Beatty has been selected as construction partner on Manchester University’s flagship project, the Engineering Campus
development, with over £200 million included within ABNC. The Group has also been selected as preferred bidder for the
Wokingham Public Road project and Caernarfon bypass.
The Regional business continues to pursue a number of opportunities across its core aviation, defence, education, health,
residential-led neighbourhoods, student accommodation and transportation markets.
In the Rail Construction business, underlying revenues were lower as track and overhead line equipment projects between Slough
and Maidenhead for Crossrail substantially completed. These projects contributed to a profit improvement in this delivery unit. After
a period of contraction, Balfour Beatty expects to increase its market share over the next 12 to 24 months.
In the period, work commenced on the Eleclink project (in conjunction with power transmission and distribution). In February,
Balfour Beatty published its ‘Staying on Track’ paper. This lays out the Group’s view that new funding models are essential to
provide the UK’s rail industry with continuity of project flow in order to support growth in innovation and skills.
US
Underlying revenues in the US grew by 20% in the period (7% at CER) to £2.0 billion. The order book decreased by 15% (10% at
CER) to £4.7 billion due, in part, to timing and as the business continued to bid selectively on new opportunities.
The business reported an underlying profit from operations for the period of £17 million (2016: £12 million). The half-year underlying
operating profit margin was 0.9%. The US business is well-positioned to reach the 1-2% target range for the full-year.
The US business continued to drive operational focus and business simplification. The business operates in specific geographies
known as ‘The Southern Smile’. This starts in the Pacific North West, runs through California, Arizona, Texas, Florida and up
through Georgia and the Carolinas to Washington DC. In the US, approximately 85% of revenues are generated from the general
building market, with the infrastructure market accounting for the remaining 15%.
The US business remains focused on working with repeat customers, in known geographies where it can deliver value. It has,
therefore, intentionally withdrawn from bidding on most stick-frame multi-family housing, where historically it has experienced loss-
making contracts, in order to switch to better-quality revenues in chosen markets such as office, education, hospitality, residential
and healthcare. The infrastructure business continues to pursue design-build and alternative delivery projects in its key rail,
highway and water markets.
Notable awards in the period included: a $625 million (45% Balfour Beatty, 55% Fluor Corporation joint venture) contract to
reconstruct and improve the Southern Gateway, an 11-mile stretch of road in Dallas, Texas and a contract to build Whole Foods
Market’s new multi-level flagship store in Midtown Atlanta.
Included in ABNC, the business has been awarded: the $260 million Harrison Medical Centre project in Seattle; the $230 million
Matthews River Landing project in Miami; a $150 million contract for an Atlanta airport hotel; a $100 million contract to serve as
construction manager for Cleburne Independent School District’s (CISD) 500,000 square foot update and expansion of Cleburne
High School (CHS); and a $70 million contract for Disney in Orlando.
Even before the 2016 Presidential election, there was a strong market outlook for construction in the US. In December 2015, the
FAST Act (Fixing America’s Surface Transportation), a US$305 billion transportation bill, was signed, providing guaranteed funding
for a five-year period. This bill permits longer-term project planning horizons in the public market and is leading to improved visibility
for public-funded projects that had been slow to come to market. There are further opportunities being created with the number of
state-backed infrastructure bonds (over US$200 billion multi-state transportation bonds, US$35 billion of education bonds in
California) and, potentially, an increase in US private-public partnership (PPP) schemes.
14
Since 2014, over half of the 50 US states have increased State Gasoline Tax. In 2017 alone, eight states have passed legislation to
increase their respective State Gasoline Tax, which will raise around $5 billion in new funding for infrastructure. Additionally, many
counties in various states have raised their Sales Tax from 0.5% to 1%, which will increase infrastructure funding by over $2 billion
per year.
Far East
Underlying revenue in the Group’s Hong Kong and Singapore 50:50 joint venture, Gammon Construction, increased by 16% (4% at
CER), due to growth in major building projects including: the redevelopment of Somerset House into a 48-storey office building; the
construction of the Lee Garden Three Project, which will include 20 floors of office space atop a five-level retail complex; and the
construction of a 71,000 square metre data centre for Global Switch in Hong Kong. Work has also continued in the first half on a
number of iconic civils projects in Hong Kong, including the West Kowloon Terminus North for the express rail link.
Underlying profit from operations in the region increased to £5 million (2016: £3 million). In Hong Kong, there are a number of
significant contracts where the range of potential outcomes could result in a materially positive or negative swing to profitability.
The order book declined by 20% (18% at CER), as timing of orders is more variable around a small number of large building and
civil contracts. In the period, Gammon was selected for a HK$2 billion (c.£200 million) contract to create Hong Kong’s first year-
round, all-weather water-park at Tai Shue Wan for Ocean Park Corporation and a HK$900m (c.£90m) Urban Renewal Authority
Project at Ma Tau Wai Road. Since the half-year, Gammon has been selected for a HK$3 billion (c.£270 million) residential scheme
for Great Eagle.
SUPPORT SERVICES
Financial review
The Support Services segment comprises utilities and transportation businesses. Utilities operates across power transmission and
distribution and the gas and water sectors. Transportation operates across rail, highways and managed road schemes for local
authorities.
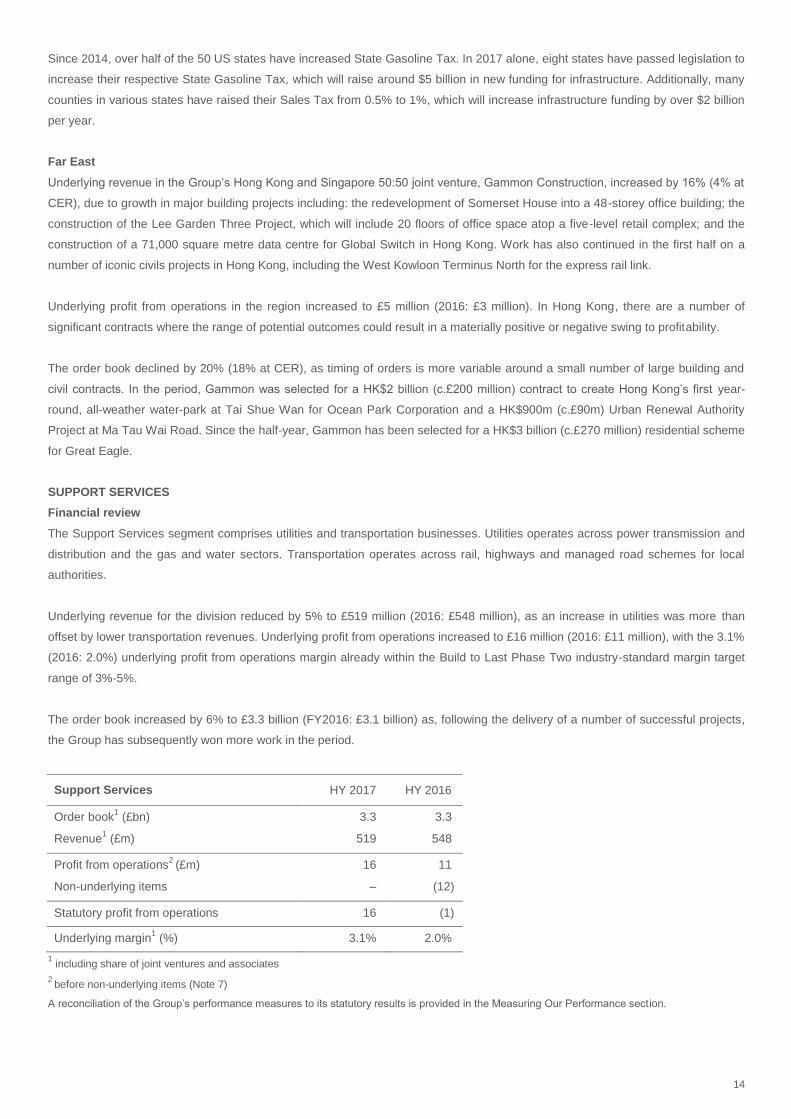
Underlying revenue for the division reduced by 5% to £519 million (2016: £548 million), as an increase in utilities was more than
offset by lower transportation revenues. Underlying profit from operations increased to £16 million (2016: £11 million), with the 3.1%
(2016: 2.0%) underlying profit from operations margin already within the Build to Last Phase Two industry-standard margin target
range of 3%-5%.
The order book increased by 6% to £3.3 billion (FY2016: £3.1 billion) as, following the delivery of a number of successful projects,
the Group has subsequently won more work in the period.
Support Services HY 2017 HY 2016
Order book1 (£bn) 3.3 3.3
Revenue1 (£m) 519 548
Profit from operations2
(£m) 16 11
Non-underlying items – (12)
Statutory profit from operations 16 (1)
Underlying margin1 (%) 3.1% 2.0%
1 including share of joint ventures and associates
2 before non-underlying items (Note 7)
A reconciliation of the Group’s performance measures to its statutory results is provided in the Measuring Our Performance section.
15
Operational review
Underlying utilities revenue increased 3% to £299 million. An increase of 14% at gas and water, as it approaches the middle of the
current AMP period, was partially offset by a 9% reduction at power transmission and distribution. The utilities order book was
stable as the expected decline at gas and water was offset by an increase at power transmission and distribution.
In the period, power transmission and distribution successfully completed the Bhlaraidh-Bennuien wind farm connections project (a
combined overhead line, cabling and substations contract) near Fort Augustus in Scotland. The business has commenced work on
the Eleclink project to install two 50-kilometre electricity cables between France and the United Kingdom through the Channel
Tunnel and, in April, was awarded a contract by Scottish and Southern Electricity (SSE) Networks for the design and refurbishment
of five 132kV overhead lines across Southern England. The business has also begun work on delivering a major overhead line
refurbishment scheme for National Grid in South Wales. Furthermore, in Scotland the business will undertake the installation of a
new overhead line to connect the Dorenell wind farm for SSE Networks using a new composite tower design, in addition to being
awarded a 10-kilometre cabling scheme for SSE in the period.
The 14% increase in gas and water underlying revenue was due to the UK water regulatory cycle, as new contracts continue to
mature under AMP6 (2015-2020). The reduction in the order book was as expected, given the progress of the AMP6 delivery cycle.
Many water contracts are extended over multiple AMP periods and the Group has already started to engage on the AMP7 planning
cycle.
In the period, the business commenced utility work on Heat Networks in Gateshead, as part of a government funded initiative, and
continued to construct a new water treatment facility for South West Water. The delivery of key and complex schemes across the
business remains on track. Gas and water expect a peak volume year in 2017, as it represents the middle of the current AMP6
cycle.
Underlying transportation revenues reduced by 14% to £220 million, due to expected volume declines from rail and highways.
Highways revenues declined due to the end of a maintenance contract and lower capital spend on a number of contracts. The
transportation order book grew by 13%, due to increased order intake in highways and from local authorities.
INFRASTRUCTURE INVESTMENTS
Financial review
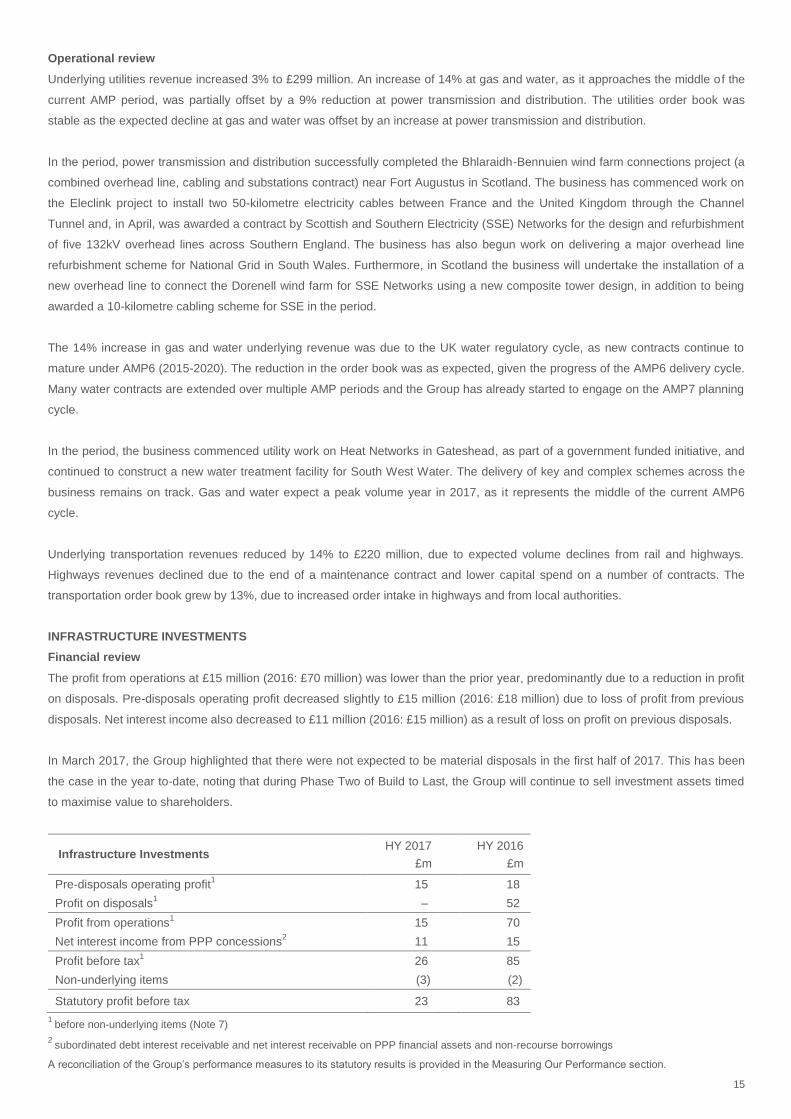
The profit from operations at £15 million (2016: £70 million) was lower than the prior year, predominantly due to a reduction in profit
on disposals. Pre-disposals operating profit decreased slightly to £15 million (2016: £18 million) due to loss of profit from previous
disposals. Net interest income also decreased to £11 million (2016: £15 million) as a result of loss on profit on previous disposals.
In March 2017, the Group highlighted that there were not expected to be material disposals in the first half of 2017. This has been
the case in the year to-date, noting that during Phase Two of Build to Last, the Group will continue to sell investment assets timed
to maximise value to shareholders.
Infrastructure Investments HY 2017
£m
HY 2016
£m
Pre-disposals operating profit1 15
18
Profit on disposals1 –
52
Profit from operations1 15
70
Net interest income from PPP concessions2 11
15
Profit before tax1 26
85
Non-underlying items (3) (2)
Statutory profit before tax 23 83
1 before non-underlying items (Note 7)
2 subordinated debt interest receivable and net interest receivable on PPP financial assets and non-recourse borrowings
A reconciliation of the Group’s performance measures to its statutory results is provided in the Measuring Our Performance section.
16
Operational review
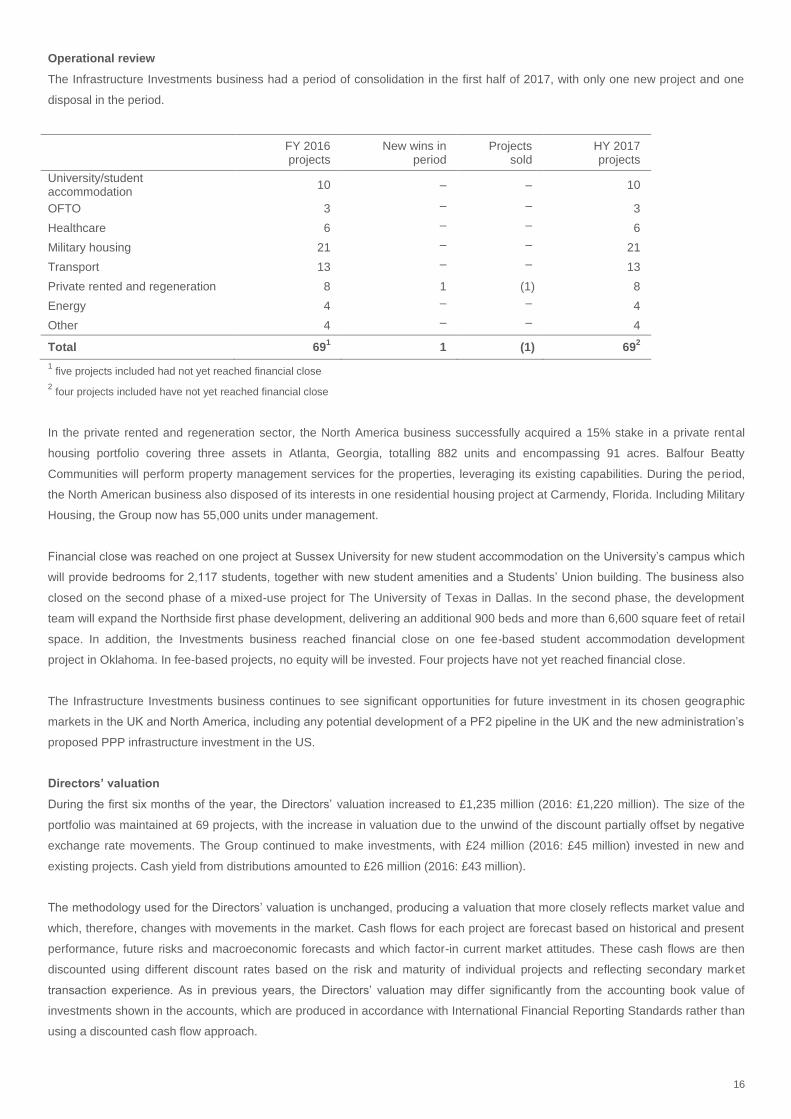
The Infrastructure Investments business had a period of consolidation in the first half of 2017, with only one new project and one
disposal in the period.
FY 2016 projects
New wins in period
Projects sold
HY 2017 projects
University/student accommodation
10 – – 10
OFTO 3 – – 3
Healthcare 6 – – 6
Military housing 21 – – 21
Transport 13 – – 13
Private rented and regeneration 8 1 (1) 8
Energy 4 – – 4
Other 4 – – 4
Total 691 1 (1) 69
2
1 five projects included had not yet reached financial close
2 four projects included have not yet reached financial close
In the private rented and regeneration sector, the North America business successfully acquired a 15% stake in a private rental
housing portfolio covering three assets in Atlanta, Georgia, totalling 882 units and encompassing 91 acres. Balfour Beatty
Communities will perform property management services for the properties, leveraging its existing capabilities. During the period,
the North American business also disposed of its interests in one residential housing project at Carmendy, Florida. Including Military
Housing, the Group now has 55,000 units under management.
Financial close was reached on one project at Sussex University for new student accommodation on the University’s campus which
will provide bedrooms for 2,117 students, together with new student amenities and a Students’ Union building. The business also
closed on the second phase of a mixed-use project for The University of Texas in Dallas. In the second phase, the development
team will expand the Northside first phase development, delivering an additional 900 beds and more than 6,600 square feet of retail
space. In addition, the Investments business reached financial close on one fee-based student accommodation development
project in Oklahoma. In fee-based projects, no equity will be invested. Four projects have not yet reached financial close.
The Infrastructure Investments business continues to see significant opportunities for future investment in its chosen geographic
markets in the UK and North America, including any potential development of a PF2 pipeline in the UK and the new administration’s
proposed PPP infrastructure investment in the US.
Directors’ valuation
During the first six months of the year, the Directors’ valuation increased to £1,235 million (2016: £1,220 million). The size of the
portfolio was maintained at 69 projects, with the increase in valuation due to the unwind of the discount partially offset by negative
exchange rate movements. The Group continued to make investments, with £24 million (2016: £45 million) invested in new and
existing projects. Cash yield from distributions amounted to £26 million (2016: £43 million).
The methodology used for the Directors’ valuation is unchanged, producing a valuation that more closely reflects market value and
which, therefore, changes with movements in the market. Cash flows for each project are forecast based on historical and present
performance, future risks and macroeconomic forecasts and which factor-in current market attitudes. These cash flows are then
discounted using different discount rates based on the risk and maturity of individual projects and reflecting secondary market
transaction experience. As in previous years, the Directors’ valuation may differ significantly from the accounting book value of
investments shown in the accounts, which are produced in accordance with International Financial Reporting Standards rather than
using a discounted cash flow approach.
17
Demand for high-quality infrastructure investments in the secondary market remains strong and the Group will continue to sell
investment assets timed to maximise value to shareholders. Investor appetite for yield in the ongoing, low interest rate environment
continues unabated and pricing in the secondary market is, therefore, expected to remain strong for the foreseeable future.
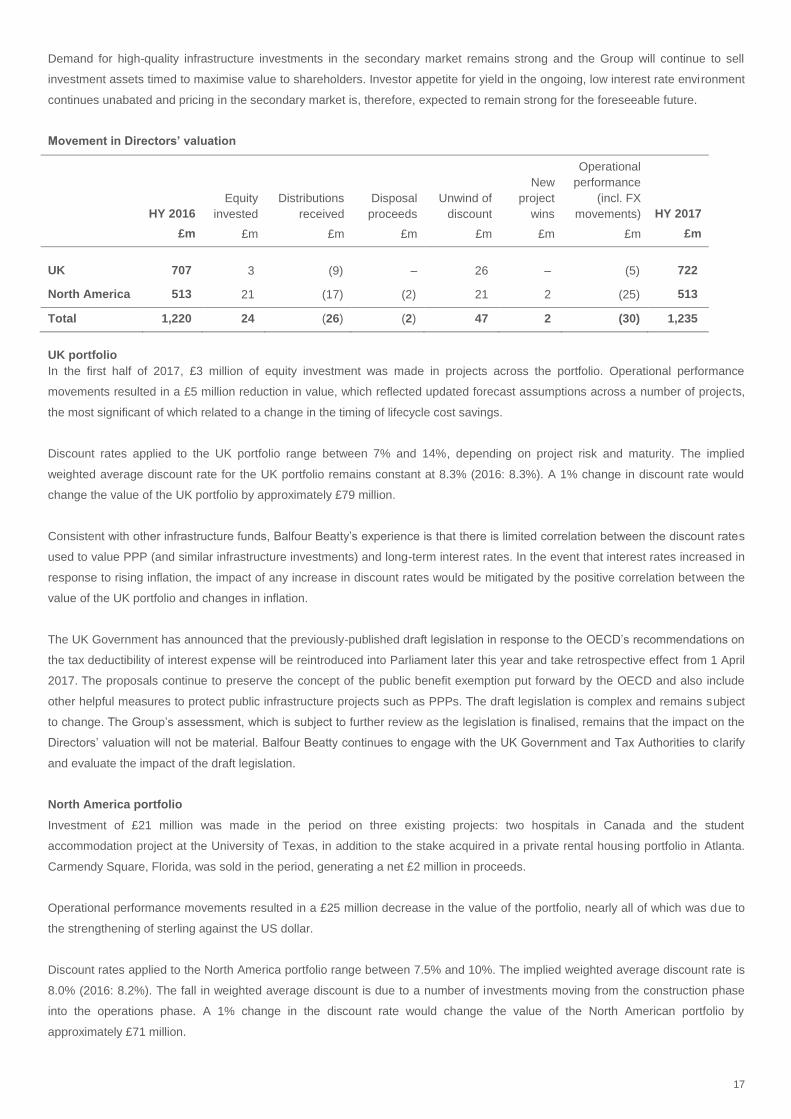
Movement in Directors’ valuation
HY 2016
£m
Equity
invested
£m
Distributions
received
£m
Disposal
proceeds
£m
Unwind of
discount
£m
New
project
wins
£m
Operational
performance
(incl. FX
movements)
£m
HY 2017
£m
UK 707 3 (9) – 26 – (5) 722
North America 513 21 (17) (2) 21 2 (25) 513
Total 1,220 24 (26) (2) 47 2 (30) 1,235
UK portfolio
In the first half of 2017, £3 million of equity investment was made in projects across the portfolio. Operational performance
movements resulted in a £5 million reduction in value, which reflected updated forecast assumptions across a number of projects,
the most significant of which related to a change in the timing of lifecycle cost savings.
Discount rates applied to the UK portfolio range between 7% and 14%, depending on project risk and maturity. The implied
weighted average discount rate for the UK portfolio remains constant at 8.3% (2016: 8.3%). A 1% change in discount rate would
change the value of the UK portfolio by approximately £79 million.
Consistent with other infrastructure funds, Balfour Beatty’s experience is that there is limited correlation between the discount rates
used to value PPP (and similar infrastructure investments) and long-term interest rates. In the event that interest rates increased in
response to rising inflation, the impact of any increase in discount rates would be mitigated by the positive correlation between the
value of the UK portfolio and changes in inflation.
The UK Government has announced that the previously-published draft legislation in response to the OECD’s recommendations on
the tax deductibility of interest expense will be reintroduced into Parliament later this year and take retrospective effect from 1 April
2017. The proposals continue to preserve the concept of the public benefit exemption put forward by the OECD and also include
other helpful measures to protect public infrastructure projects such as PPPs. The draft legislation is complex and remains subject
to change. The Group’s assessment, which is subject to further review as the legislation is finalised, remains that the impact on the
Directors’ valuation will not be material. Balfour Beatty continues to engage with the UK Government and Tax Authorities to c larify
and evaluate the impact of the draft legislation.
North America portfolio
Investment of £21 million was made in the period on three existing projects: two hospitals in Canada and the student
accommodation project at the University of Texas, in addition to the stake acquired in a private rental housing portfolio in Atlanta.
Carmendy Square, Florida, was sold in the period, generating a net £2 million in proceeds.
Operational performance movements resulted in a £25 million decrease in the value of the portfolio, nearly all of which was due to
the strengthening of sterling against the US dollar.
Discount rates applied to the North America portfolio range between 7.5% and 10%. The implied weighted average discount rate is
8.0% (2016: 8.2%). The fall in weighted average discount is due to a number of investments moving from the construction phase
into the operations phase. A 1% change in the discount rate would change the value of the North American portfolio by
approximately £71 million.
18
OTHER FINANCIAL ITEMS
Non-underlying items
The Group believes non-underlying items should be separately identified on the face of the income statement to assist in
understanding the underlying financial performance achieved by the Group.
Non-underlying items from continuing operations before tax of £10 million were charged to the income statement in the first half of
2017 (2016: £28 million). Items included £5 million of restructuring costs incurred relating to the Group’s Build to Last
transformation programme. A further £5 million was charged to non-underlying relating to the amortisation of acquired intangible
assets.
Taxation
The Group’s underlying loss before tax from continuing operations, excluding share of joint ventures, of £8 million (2016: £13
million) resulted in an underlying tax charge of £nil (2016: £7 million credit). The tax position principally arises due to a tax charge in
the US offset by a tax credit in the UK. Under IFRS tax accounting rules, these figures have been calculated without taking account
of the proposed UK law changes to restrict the offset of brought forward losses to 50% of current year profits and to limit the ability
to offset interest expense for tax purposes. These proposals will be re-introduced into Parliament in the autumn and, assuming they
are passed as currently intended, they will have retrospective effect to 1 April 2017, and hence, impact our 2017 full-year results.
Therefore, it is expected that the second half 2017 taxation charge will be higher than the first half.
Discontinued operations
The Group has presented its 49% interests in its Middle East joint ventures as discontinued operations in the first-half of the year,
with comparatives restated accordingly. Following the completion of the sale in March 2017, the Group recorded a non-underlying
gain on disposal of £5 million in the first-half of the year.
Pension
The Group’s balance sheet includes aggregate deficits of £208 million (FY 2016: £231 million) for pension schemes. The decrease
in pension deficit in the period is due to a small reduction in life expectancy based on the latest mortality studies, together with cash
deficit payments made by the company, partially offset by a small reduction in corporate bond yields. In the largest scheme, Balfour
Beatty Pension Fund, the programme of hedging against changes in interest rates and inflation projections has continued to
decrease volatility and provide significant benefit.
Borrowing facilities
Balfour Beatty’s committed borrowing facility totals £400 million. The purpose of this syndicated revolving credit facility is to provide
liquidity from a set of core relationship banks to support ongoing activities. The Group completed its refinancing in December 2015
with the facility extending through to 2018. In November 2016, £375 million of the facility was extended until December 2019. A
further one-year extension, through to 2020, is available, subject to bank approval. At 30 June 2017, this facility was undrawn.
19
Responsibility statement
We confirm that to the best of our knowledge:
· the condensed Group financial statements have been prepared in accordance with IAS 34 Interim Financial Reporting;
· the interim management report, as required by Disclosure and Transparency Rules 4.2.7R and 4.2.8R, includes a fair review of:
o important events during the half-year ended 30 June 2017 and their impact on the condensed Group financial
statements;
o a description of the principal risks and uncertainties for the second half of the year; and
o related parties’ transactions and changes therein.
On behalf of the Board
Leo Quinn Phil Harrison
Group Chief Executive Chief Financial Officer
15 August 2017
Forward-looking statements
This announcement may include certain forward-looking statements, beliefs or opinions, including statements with respect to
Balfour Beatty plc’s business, financial condition and results of operations. These forward-looking statements can be identified by
the use of forward-looking terminology, including the terms "believes", "estimates", "plans", "anticipates", "targets", "aims",
"continues", "expects", "intends", "hopes", "may", "will", "would", "could" or "should" or, in each case, their negative or other various
or comparable terminology. These statements are made by the Balfour Beatty plc Directors in good faith based on the information
available to them at the date of this announcement and reflect the Balfour Beatty plc Directors’ beliefs and expectations. By their
nature these statements involve risk and uncertainty because they relate to events and depend on circumstances that may or may
not occur in the future. A number of factors could cause actual results and developments to differ materially from those expressed
or implied by the forward-looking statements, including, without limitation, developments in the global economy, changes in UK and
US government policies, spending and procurement methodologies, and failure in Balfour Beatty's health, safety or environmental
policies.
No representation or warranty is made that any of these statements or forecasts will come to pass or that any forecast results will
be achieved. Forward-looking statements speak only as at the date of this announcement and Balfour Beatty plc and its advisers
expressly disclaim any obligations or undertaking to release any update of, or revisions to, any forward-looking statements in this
announcement. No statement in the announcement is intended to be, or intended to be construed as, a profit forecast or profit
estimate or to be interpreted to mean that earnings per Balfour Beatty plc share for the current or future financial years wi ll
necessarily match or exceed the historical earnings per Balfour Beatty plc share. As a result, you are cautioned not to place any
undue reliance on such forward-looking statements.
20
MEASURING OUR PERFORMANCE
Providing clarity on the Group’s alternative performance measures
Following the issuance of the Guidelines on Alternative Performance Measures (APMs) by the European Securities and Markets
Authorities (ESMA) in June 2015, the Group has included this section in its half-year statement with the aim of providing
transparency and clarity on the measures adopted internally to assess performance.
Throughout this report, the Group has presented performance measures which are considered most relevant to the Group and are
used to measure the Group’s performance on a day-to-day basis. These measures are chosen to provide a balanced view of the
Group’s operations and are considered useful to investors as these measures provide relevant information on the Group’s past or
future performance, position or cash flows.
The APMs adopted by the Group are also commonly used in the sectors it operates in and therefore serve as a useful aid for
investors to compare Balfour Beatty’s performance to its peers.
The Board believes that disclosing these performance measures enhances investors’ ability to evaluate and assess the underlying
financial performance of the Group’s continuing operations and the related key business drivers. These financial performance
measures are also aligned to measures used internally to assess business performance in the Group’s budgeting process and
when determining compensation.
Equivalent information cannot be presented by using financial measures defined in the financial reporting framework alone.
Readers are encouraged to review the half-year financial statements in their entirety.
Performance measures used to assess the Group’s operations in the period
Underlying profit from operations (PFO)
Underlying PFO is presented before finance cost and interest income and is the key measure used to assess the Group’s
performance in the Construction Services and Support Services segments. This is also a common measure used by the Group’s
peers operating in these sectors.
This measure reflects the returns to the Group from services provided in these operations that are generated from activities that are
not financing in nature and therefore an underlying pre-finance cost measure is more suited to assessing underlying performance.
Underlying profit before tax (PBT)
The Group assesses performance in its Infrastructure Investments segment using an underlying PBT measure. This differs from the
underlying PFO measure used to measure the Group’s Construction Services and Support Services segments because in addition
to margins generated from operations, there are returns to the Investments business which are generated from the financing
element within its projects.
These returns take the form of subordinated debt interest receivable and interest receivable on PPP financial assets which are
included in the Group’s income statement in investment income. These are then offset by the finance cost incurred on the non-
recourse debt associated with the underlying projects, which is included in the Group’s income statement in finance costs.
21
Measuring the Group’s performance
The following measures are referred to in this half-year financial statements when reporting performance, both in absolute terms
and also in comparison to earlier years:
Statutory measures
Statutory measures are derived from the Group’s reported financial statements, which are prepared in accordance with the
International Financial Reporting Standards (IFRSs) as adopted by the EU and as issued by the International Accounting Standards
Board (IASB).
Where a standard allows certain interpretations to be adopted, the Group has applied its accounting policies consistently. These
accounting policies can be found on pages 112 to 118 of the Group’s 2016 Annual Report and Accounts.
The Group’s statutory measures take into account all of the factors, including those that it cannot influence (principally foreign
currency fluctuations) and also large non-recurring items which do not reflect the ongoing underlying performance of the Group
(refer to section (b)).
Performance measures
In assessing its performance, the Group has adopted certain non-statutory measures because, unlike its statutory measures, these
cannot be derived directly from its financial statements. The Group commonly uses the following measures to assess its
performance:
a) Order book
The Group’s disclosure of its order book is aimed to provide insight into its pipeline of work and future performance. The Group’s
order book is not a measure of past performance and therefore cannot be derived from its financial statements.
The Group’s order book comprises the unexecuted element of orders on contracts that have been secured. Where contracts are
subject to variations, only secured contract variations are included in the reported order book.
Where contracts fall under framework agreements, an estimate is made of orders to be secured under that framework agreement.
This is based on historical trends from similar framework agreements delivered in the past and the estimate of orders included in
the order book is that which is probable to be secured.
b) Underlying performance
The Group adjusts for certain non-underlying items which the Board believes assist in understanding the performance achieved by
the Group. These items include:
− gains and losses on the disposal of businesses and investments, unless this is part of a programme of releasing value from the
disposal of similar businesses or investments such as infrastructure concessions
− costs of major restructuring and reorganisation of existing businesses
− acquisition and similar costs related to business combinations such as transaction costs
− impairment and amortisation charges on intangible assets arising on business combinations (amortisation of acquired intangible
assets). These are non-underlying costs as they do not relate to the underlying performance of the Group.
From time to time, it may be appropriate to disclose further items as non-underlying items in order to reflect the underlying
performance of the Group.
The results of Rail Germany and certain legacy ES contracts have been treated as non-underlying items as the Group is committed
to exiting these parts of the business.
Further details of these non-underlying items are provided in Note 7.
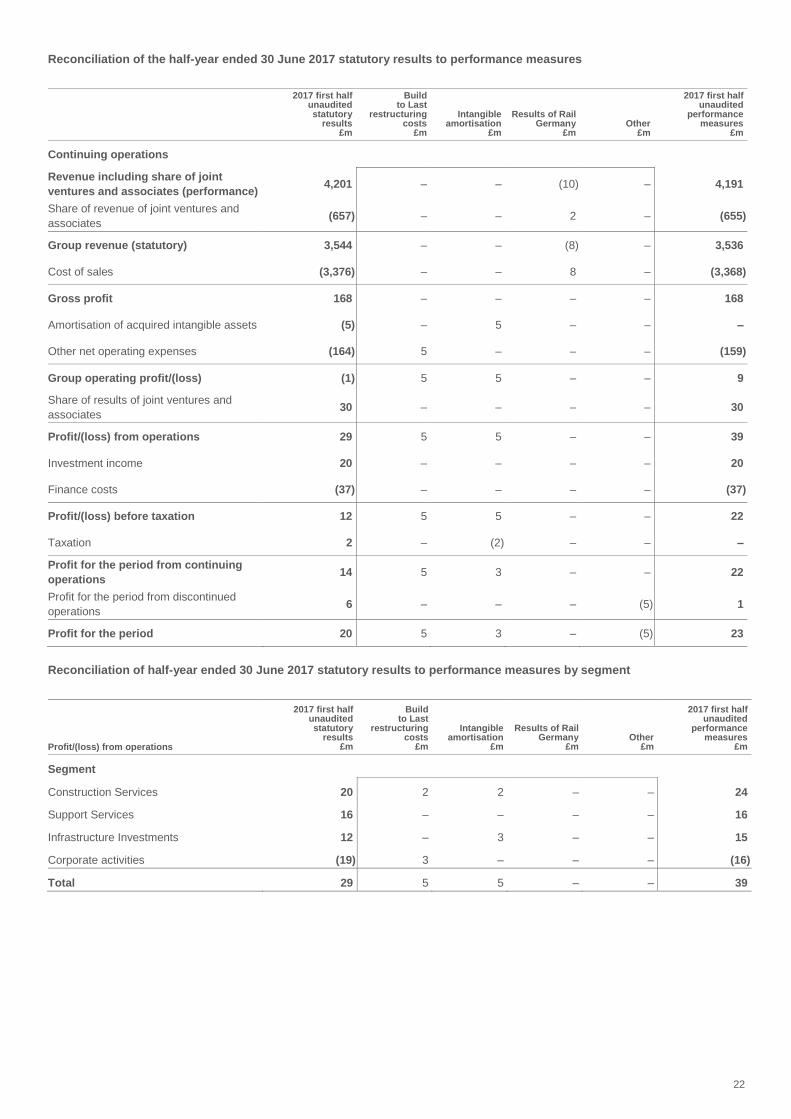
A reconciliation has been provided below to show how the Group’s statutory results are adjusted to exclude significant items that
are non-recurring and their impact on its statutory financial information, both as a whole and in respect of specific line items.
22
Reconciliation of the half-year ended 30 June 2017 statutory results to performance measures
2017 first half unaudited statutory
results £m
Build to Last
restructuring costs
£m
Intangible amortisation
£m
Results of Rail Germany
£m Other
£m
2017 first half unaudited
performance measures
£m
Continuing operations
Revenue including share of joint
ventures and associates (performance) 4,201 – – (10) – 4,191
Share of revenue of joint ventures and
associates (657) – – 2 – (655)
Group revenue (statutory) 3,544 – – (8) – 3,536
Cost of sales (3,376) – – 8 – (3,368)
Gross profit 168 – – – – 168
Amortisation of acquired intangible assets (5) – 5 – – –
Other net operating expenses (164) 5 – – – (159)
Group operating profit/(loss) (1) 5 5 – – 9
Share of results of joint ventures and
associates 30 – – – – 30
Profit/(loss) from operations 29 5 5 – – 39
Investment income 20 – – – – 20
Finance costs (37) – – – – (37)
Profit/(loss) before taxation 12 5 5 – – 22
Taxation 2 – (2) – – –
Profit for the period from continuing
operations 14 5 3 – – 22
Profit for the period from discontinued
operations 6 – – – (5) 1
Profit for the period 20 5 3 – (5) 23
Reconciliation of half-year ended 30 June 2017 statutory results to performance measures by segment
Profit/(loss) from operations
2017 first half unaudited statutory
results £m
Build to Last
restructuring costs
£m
Intangible amortisation
£m
Results of Rail Germany
£m Other
£m
2017 first half unaudited
performance measures
£m
Segment
Construction Services 20 2 2 – – 24
Support Services 16 – – – – 16
Infrastructure Investments 12 – 3 – – 15
Corporate activities (19) 3 – – – (16)
Total 29 5 5 – – 39
23
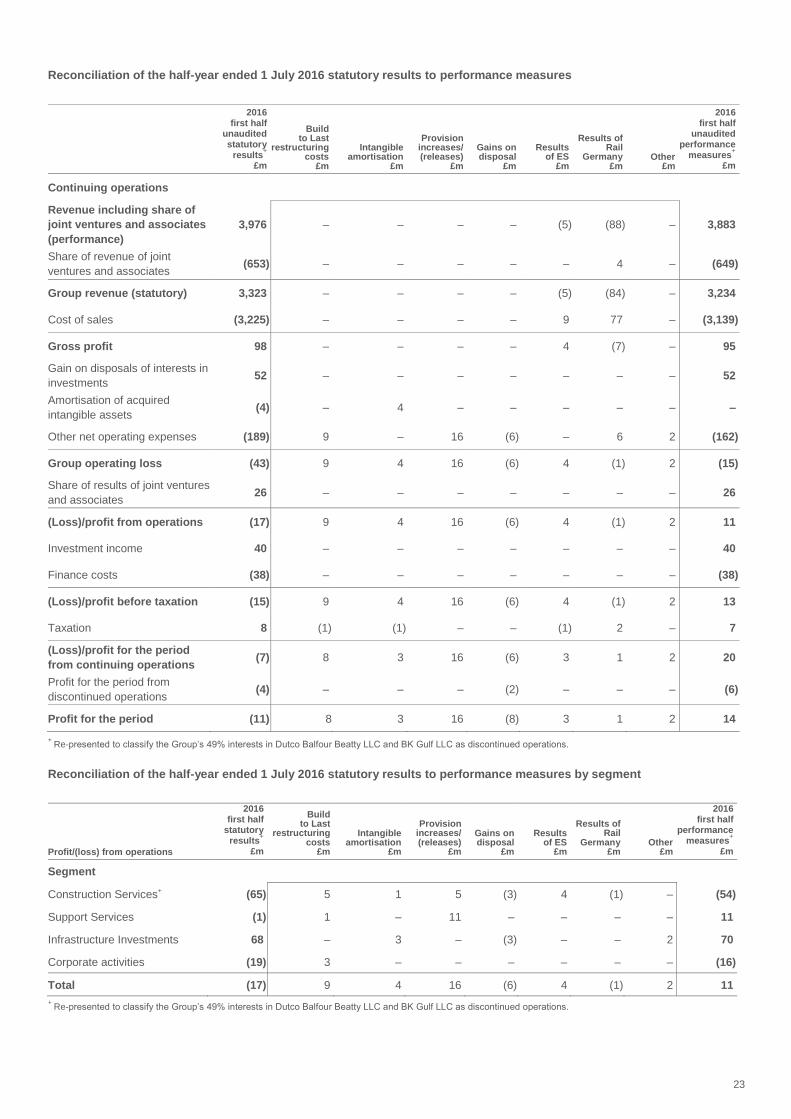
Reconciliation of the half-year ended 1 July 2016 statutory results to performance measures
2016 first half
unaudited statutory
results+
£m
Build to Last
restructuring costs
£m
Intangible amortisation
£m
Provision increases/ (releases)
£m
Gains on disposal
£m
Results of ES
£m
Results of Rail
Germany £m
Other £m
2016 first half
unaudited performance
measures+
£m
Continuing operations
Revenue including share of
joint ventures and associates
(performance)
3,976 – – – – (5) (88) – 3,883
Share of revenue of joint
ventures and associates (653) – – – – – 4 – (649)
Group revenue (statutory) 3,323 – – – – (5) (84) – 3,234
Cost of sales (3,225) – – – – 9 77 – (3,139)
Gross profit 98 – – – – 4 (7) – 95
Gain on disposals of interests in
investments 52 – – – – – – – 52
Amortisation of acquired
intangible assets (4) – 4 – – – – – –
Other net operating expenses (189) 9 – 16 (6) – 6 2 (162)
Group operating loss (43) 9 4 16 (6) 4 (1) 2 (15)
Share of results of joint ventures
and associates 26 – – – – – – – 26
(Loss)/profit from operations (17) 9 4 16 (6) 4 (1) 2 11
Investment income 40 – – – – – – – 40
Finance costs (38) – – – – – – – (38)
(Loss)/profit before taxation (15) 9 4 16 (6) 4 (1) 2 13
Taxation 8 (1) (1) – – (1) 2 – 7
(Loss)/profit for the period
from continuing operations (7) 8 3 16 (6) 3 1 2 20
Profit for the period from
discontinued operations (4) – – – (2) – – – (6)
Profit for the period (11) 8 3 16 (8) 3 1 2 14
+ Re-presented to classify the Group’s 49% interests in Dutco Balfour Beatty LLC and BK Gulf LLC as discontinued operations.
Reconciliation of the half-year ended 1 July 2016 statutory results to performance measures by segment
Profit/(loss) from operations
2016 first half
statutory results
+
£m
Build to Last
restructuring costs
£m
Intangible amortisation
£m
Provision increases/ (releases)
£m
Gains on disposal
£m
Results of ES
£m
Results of Rail
Germany £m
Other £m
2016 first half
performance measures
+
£m
Segment
Construction Services+ (65) 5 1 5 (3) 4 (1) – (54)
Support Services (1) 1 – 11 – – – – 11
Infrastructure Investments 68 – 3 – (3) – – 2 70
Corporate activities (19) 3 – – – – – – (16)
Total (17) 9 4 16 (6) 4 (1) 2 11
+ Re-presented to classify the Group’s 49% interests in Dutco Balfour Beatty LLC and BK Gulf LLC as discontinued operations.
24
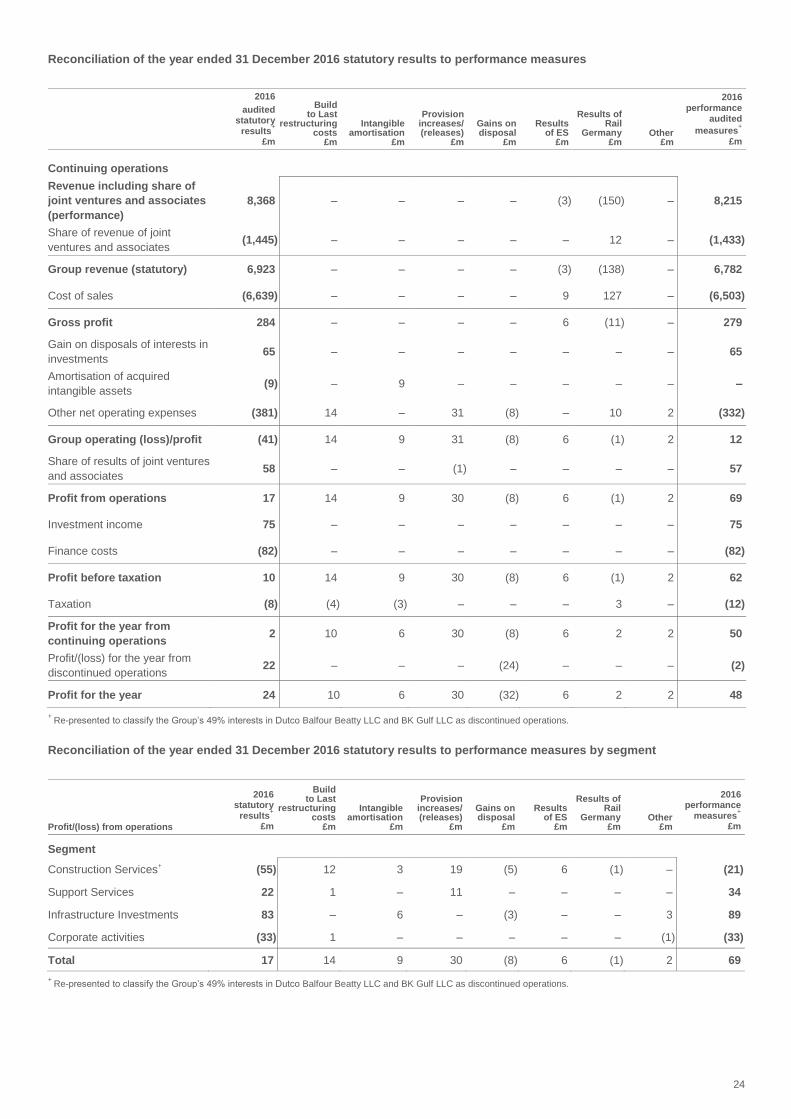
Reconciliation of the year ended 31 December 2016 statutory results to performance measures
2016
audited statutory
results+
£m
Build to Last
restructuring costs
£m
Intangible amortisation
£m
Provision increases/ (releases)
£m
Gains on disposal
£m
Results of ES
£m
Results of Rail
Germany £m
Other £m
2016 performance
audited
measures+
£m
Continuing operations
Revenue including share of
joint ventures and associates
(performance)
8,368 – – – – (3) (150) – 8,215
Share of revenue of joint
ventures and associates (1,445) – – – – – 12 – (1,433)
Group revenue (statutory) 6,923 – – – – (3) (138) – 6,782
Cost of sales (6,639) – – – – 9 127 – (6,503)
Gross profit 284 – – – – 6 (11) – 279
Gain on disposals of interests in
investments 65 – – – – – – – 65
Amortisation of acquired
intangible assets (9) – 9 – – – – – –
Other net operating expenses (381) 14 – 31 (8) – 10 2 (332)
Group operating (loss)/profit (41) 14 9 31 (8) 6 (1) 2 12
Share of results of joint ventures
and associates 58 – – (1) – – – – 57
Profit from operations 17 14 9 30 (8) 6 (1) 2 69
Investment income 75 – – – – – – – 75
Finance costs (82) – – – – – – – (82)
Profit before taxation 10 14 9 30 (8) 6 (1) 2 62
Taxation (8) (4) (3) – – – 3 – (12)
Profit for the year from
continuing operations 2 10 6 30 (8) 6 2 2 50
Profit/(loss) for the year from
discontinued operations 22 – – – (24) – – – (2)
Profit for the year 24 10 6 30 (32) 6 2 2 48
+ Re-presented to classify the Group’s 49% interests in Dutco Balfour Beatty LLC and BK Gulf LLC as discontinued operations.
Reconciliation of the year ended 31 December 2016 statutory results to performance measures by segment
Profit/(loss) from operations
2016 statutory
results+
£m
Build to Last
restructuring costs
£m
Intangible amortisation
£m
Provision increases/ (releases)
£m
Gains on disposal
£m
Results of ES
£m
Results of Rail
Germany £m
Other £m
2016 performance
measures+
£m
Segment
Construction Services+ (55) 12 3 19 (5) 6 (1) – (21)
Support Services 22 1 – 11 – – – – 34
Infrastructure Investments 83 – 6 – (3) – – 3 89
Corporate activities (33) 1 – – – – – (1) (33)
Total 17 14 9 30 (8) 6 (1) 2 69
+ Re-presented to classify the Group’s 49% interests in Dutco Balfour Beatty LLC and BK Gulf LLC as discontinued operations.
25
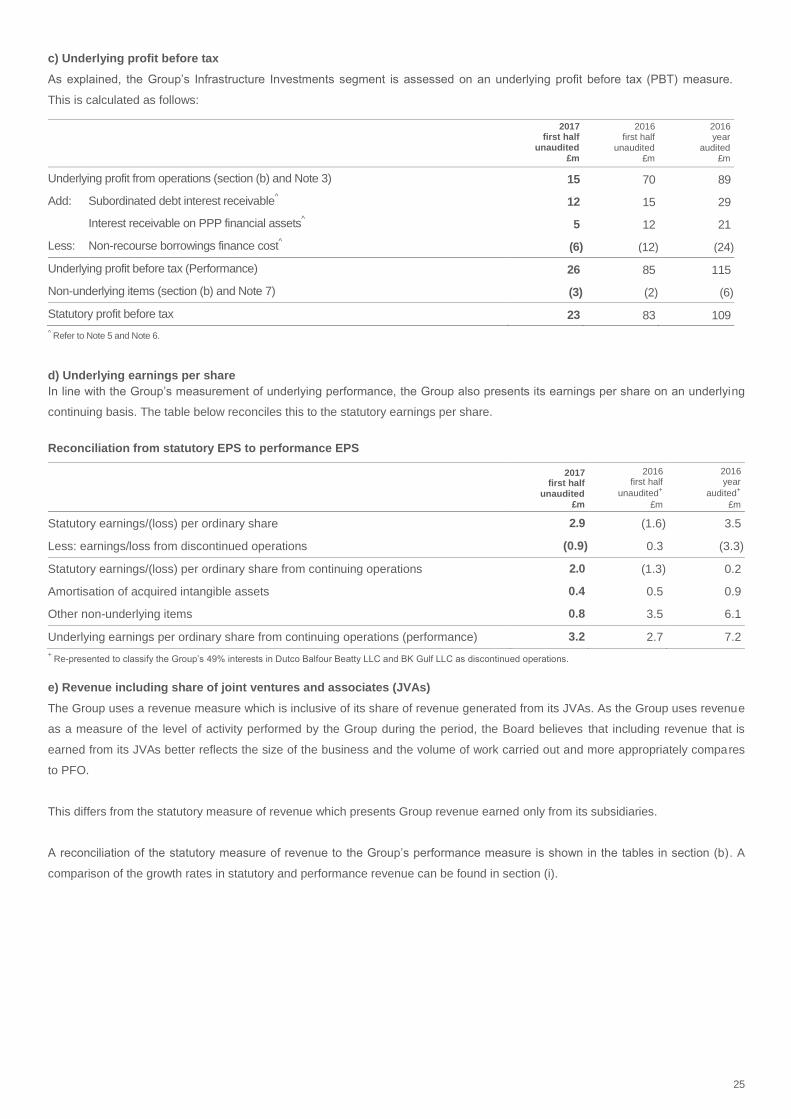
c) Underlying profit before tax
As explained, the Group’s Infrastructure Investments segment is assessed on an underlying profit before tax (PBT) measure.
This is calculated as follows:
2017 first half
unaudited £m
2016 first half
unaudited £m
2016 year
audited £m
Underlying profit from operations (section (b) and Note 3) 15 70 89
Add: Subordinated debt interest receivable^ 12 15 29
Interest receivable on PPP financial assets^ 5 12 21
Less: Non-recourse borrowings finance cost^ (6) (12) (24)
Underlying profit before tax (Performance) 26 85 115
Non-underlying items (section (b) and Note 7) (3) (2) (6)
Statutory profit before tax 23 83 109
^ Refer to Note 5 and Note 6.
d) Underlying earnings per share
In line with the Group’s measurement of underlying performance, the Group also presents its earnings per share on an underlying
continuing basis. The table below reconciles this to the statutory earnings per share.
Reconciliation from statutory EPS to performance EPS
2017 first half
unaudited £m
2016 first half
unaudited+
£m
2016 year
audited+
£m
Statutory earnings/(loss) per ordinary share 2.9 (1.6) 3.5
Less: earnings/loss from discontinued operations (0.9) 0.3 (3.3)
Statutory earnings/(loss) per ordinary share from continuing operations 2.0 (1.3) 0.2
Amortisation of acquired intangible assets 0.4 0.5 0.9
Other non-underlying items 0.8 3.5 6.1
Underlying earnings per ordinary share from continuing operations (performance) 3.2 2.7 7.2
+ Re-presented to classify the Group’s 49% interests in Dutco Balfour Beatty LLC and BK Gulf LLC as discontinued operations.
e) Revenue including share of joint ventures and associates (JVAs)
The Group uses a revenue measure which is inclusive of its share of revenue generated from its JVAs. As the Group uses revenue
as a measure of the level of activity performed by the Group during the period, the Board believes that including revenue that is
earned from its JVAs better reflects the size of the business and the volume of work carried out and more appropriately compares
to PFO.
This differs from the statutory measure of revenue which presents Group revenue earned only from its subsidiaries.
A reconciliation of the statutory measure of revenue to the Group’s performance measure is shown in the tables in section (b) . A
comparison of the growth rates in statutory and performance revenue can be found in section (i).
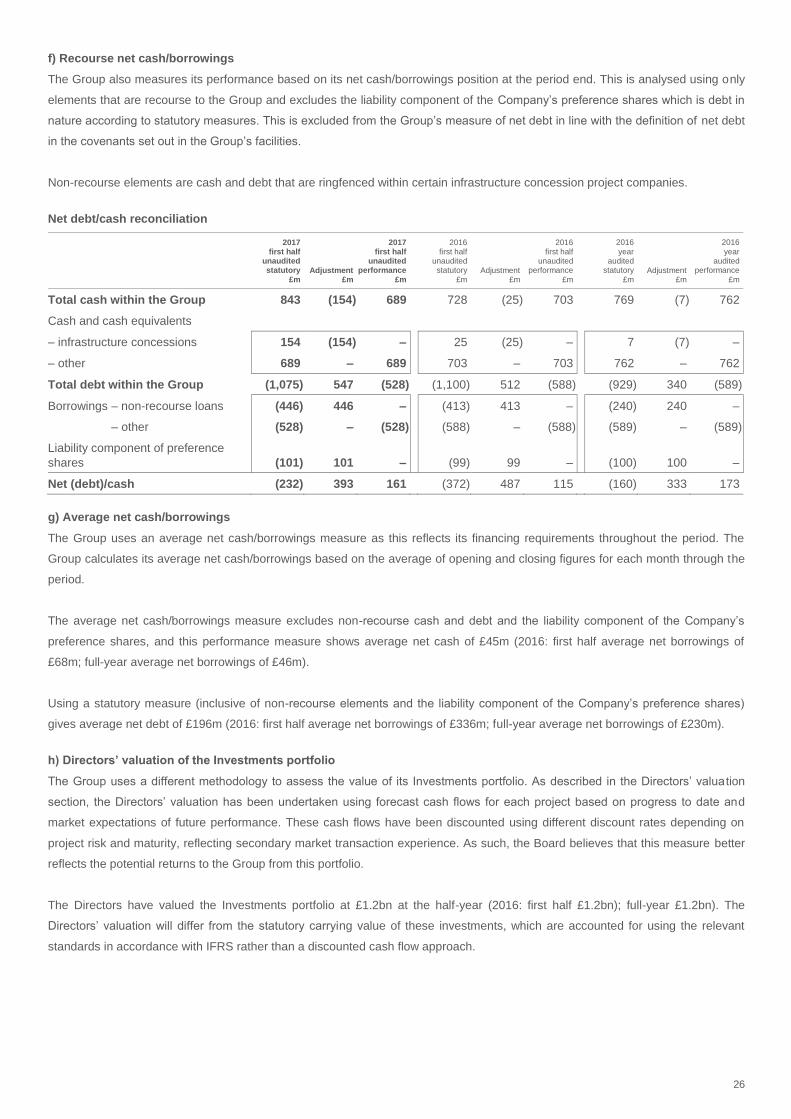
26
f) Recourse net cash/borrowings
The Group also measures its performance based on its net cash/borrowings position at the period end. This is analysed using only
elements that are recourse to the Group and excludes the liability component of the Company’s preference shares which is debt in
nature according to statutory measures. This is excluded from the Group’s measure of net debt in line with the definition of net debt
in the covenants set out in the Group’s facilities.
Non-recourse elements are cash and debt that are ringfenced within certain infrastructure concession project companies.
Net debt/cash reconciliation
2017 first half
unaudited statutory
£m Adjustment
£m
2017 first half
unaudited performance
£m
2016 first half
unaudited statutory
£m Adjustment
£m
2016 first half
unaudited performance
£m
2016
year audited
statutory
£m Adjustment
£m
2016
year audited
performance
£m
Total cash within the Group 843 (154) 689 728 (25) 703 769 (7) 762
Cash and cash equivalents
– infrastructure concessions 154 (154) – 25 (25) – 7 (7) –
– other 689 – 689 703 – 703 762 – 762
Total debt within the Group (1,075) 547 (528) (1,100) 512 (588) (929) 340 (589)
Borrowings – non-recourse loans (446) 446 – (413) 413 – (240) 240 –
– other (528) – (528) (588) – (588) (589) – (589)
Liability component of preference
shares (101) 101 – (99) 99 – (100) 100 –
Net (debt)/cash (232) 393 161 (372) 487 115 (160) 333 173
g) Average net cash/borrowings
The Group uses an average net cash/borrowings measure as this reflects its financing requirements throughout the period. The
Group calculates its average net cash/borrowings based on the average of opening and closing figures for each month through the
period.
The average net cash/borrowings measure excludes non-recourse cash and debt and the liability component of the Company’s
preference shares, and this performance measure shows average net cash of £45m (2016: first half average net borrowings of
£68m; full-year average net borrowings of £46m).
Using a statutory measure (inclusive of non-recourse elements and the liability component of the Company’s preference shares)
gives average net debt of £196m (2016: first half average net borrowings of £336m; full-year average net borrowings of £230m).
h) Directors’ valuation of the Investments portfolio
The Group uses a different methodology to assess the value of its Investments portfolio. As described in the Directors’ valua tion
section, the Directors’ valuation has been undertaken using forecast cash flows for each project based on progress to date and
market expectations of future performance. These cash flows have been discounted using different discount rates depending on
project risk and maturity, reflecting secondary market transaction experience. As such, the Board believes that this measure better
reflects the potential returns to the Group from this portfolio.
The Directors have valued the Investments portfolio at £1.2bn at the half-year (2016: first half £1.2bn); full-year £1.2bn). The
Directors’ valuation will differ from the statutory carrying value of these investments, which are accounted for using the relevant
standards in accordance with IFRS rather than a discounted cash flow approach.
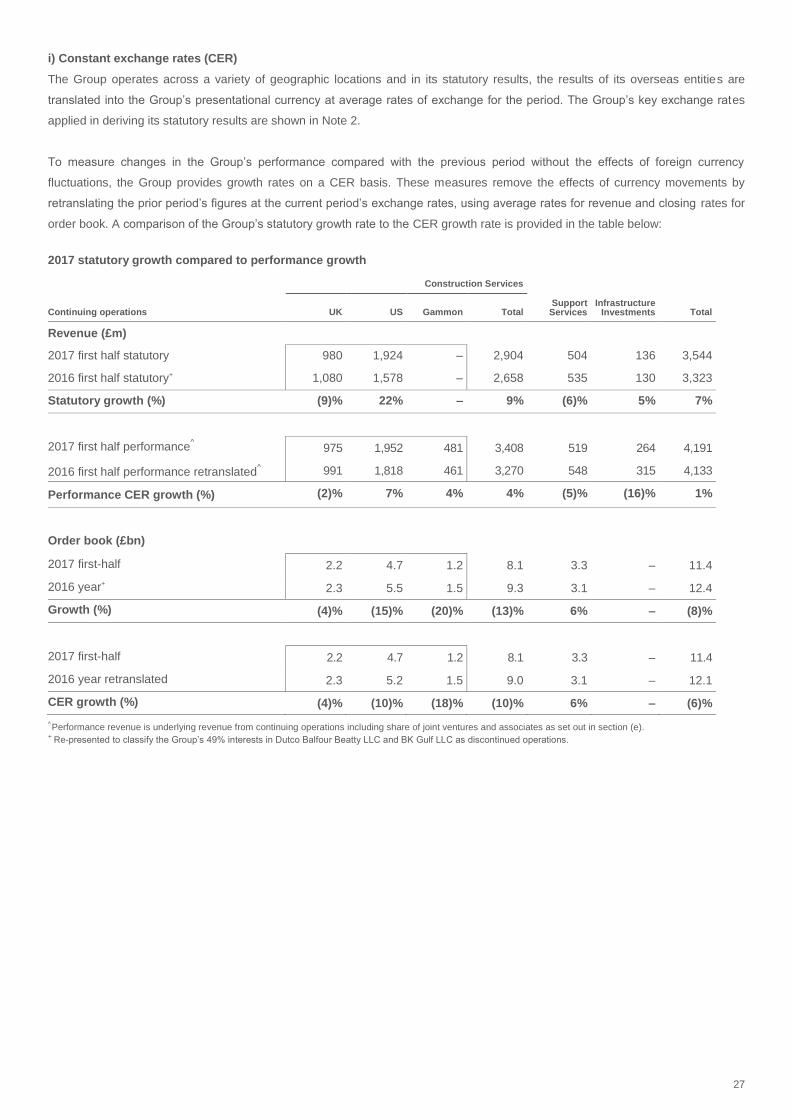
27
i) Constant exchange rates (CER)
The Group operates across a variety of geographic locations and in its statutory results, the results of its overseas entities are
translated into the Group’s presentational currency at average rates of exchange for the period. The Group’s key exchange rates
applied in deriving its statutory results are shown in Note 2.
To measure changes in the Group’s performance compared with the previous period without the effects of foreign currency
fluctuations, the Group provides growth rates on a CER basis. These measures remove the effects of currency movements by
retranslating the prior period’s figures at the current period’s exchange rates, using average rates for revenue and closing rates for
order book. A comparison of the Group’s statutory growth rate to the CER growth rate is provided in the table below:
2017 statutory growth compared to performance growth
Construction Services
Continuing operations UK US Gammon Total Support
Services Infrastructure
Investments Total
Revenue (£m)
2017 first half statutory 980 1,924 – 2,904 504 136 3,544
2016 first half statutory+ 1,080 1,578 – 2,658 535 130 3,323
Statutory growth (%) (9)% 22% – 9% (6)% 5% 7%
2017 first half performance^ 975 1,952 481 3,408 519 264 4,191
2016 first half performance retranslated^ 991 1,818 461 3,270 548 315 4,133
Performance CER growth (%) (2)% 7% 4% 4% (5)% (16)% 1%
Order book (£bn)
2017 first-half 2.2 4.7 1.2 8.1 3.3 – 11.4
2016 year+ 2.3 5.5 1.5 9.3 3.1 – 12.4
Growth (%) (4)% (15)% (20)% (13)% 6% – (8)%
2017 first-half 2.2 4.7 1.2 8.1 3.3 – 11.4
2016 year retranslated 2.3 5.2 1.5 9.0 3.1 – 12.1
CER growth (%) (4)% (10)% (18)% (10)% 6% – (6)%
Performance revenue is underlying revenue from continuing operations including share of joint ventures and associates as set out in section (e).
+ Re-presented to classify the Group’s 49% interests in Dutco Balfour Beatty LLC and BK Gulf LLC as discontinued operations.
28
INDEPENDENT REVIEW REPORT TO BALFOUR BEATTY PLC
Conclusion
We have been engaged by the company to review the condensed set of financial statements in the half-yearly financial report for
the six months ended 30 June 2017 which comprises the Condensed Group Income Statement, the Condensed Group Statement
of Comprehensive Income, the Condensed Group Statement of Changes in Equity, the Condensed Group Balance Sheet, the
Condensed Group Statement of Cash Flows and the related explanatory notes.
Based on our review, nothing has come to our attention that causes us to believe that the condensed set of financial statements in
the half-yearly financial report for the six months ended 30 June 2017 is not prepared, in all material respects, in accordance with
IAS 34 Interim Financial Reporting as adopted by the EU and the Disclosure Guidance and Transparency Rules (“the DTR”) of the
UK’s Financial Conduct Authority (“the UK FCA”).
Scope of review
We conducted our review in accordance with International Standard on Review Engagements (UK and Ireland) 2410 Review of
Interim Financial Information Performed by the Independent Auditor of the Entity issued by the Auditing Practices Board for use in
the UK. A review of interim financial information consists of making enquiries, primarily of persons responsible for financial and
accounting matters, and applying analytical and other review procedures. We read the other information contained in the half-
yearly financial report and consider whether it contains any apparent misstatements or material inconsistencies with the information
in the condensed set of financial statements.
A review is substantially less in scope than an audit conducted in accordance with International Standards on Auditing (UK) and
consequently does not enable us to obtain assurance that we would become aware of all significant matters that might be identified
in an audit. Accordingly, we do not express an audit opinion.
Directors’ responsibilities
The half-yearly financial report is the responsibility of, and has been approved by, the directors. The directors are responsible for
preparing the half-yearly financial report in accordance with the DTR of the UK FCA.
As disclosed in note 1.1, the annual financial statements of the group are prepared in accordance with International Financial
Reporting Standards as adopted by the EU. The directors are responsible for preparing the condensed set of financial statements
included in the half-yearly financial report in accordance with IAS 34 as adopted by the EU.
Our responsibility
Our responsibility is to express to the company a conclusion on the condensed set of financial statements in the half-yearly financial
report based on our review.
The purpose of our review work and to whom we owe our responsibilities
This report is made solely to the company in accordance with the terms of our engagement to assist the company in meeting the
requirements of the DTR of the UK FCA. Our review has been undertaken so that we might state to the company those matters we
are required to state to it in this report and for no other purpose. To the fullest extent permitted by law, we do not accept or assume
responsibility to anyone other than the company for our review work, for this report, or for the conclusions we have reached.
Stephen Wardell
for and on behalf of KPMG LLP
Chartered Accountants
15 Canada Square,
London E14 5GL
15 August 2017
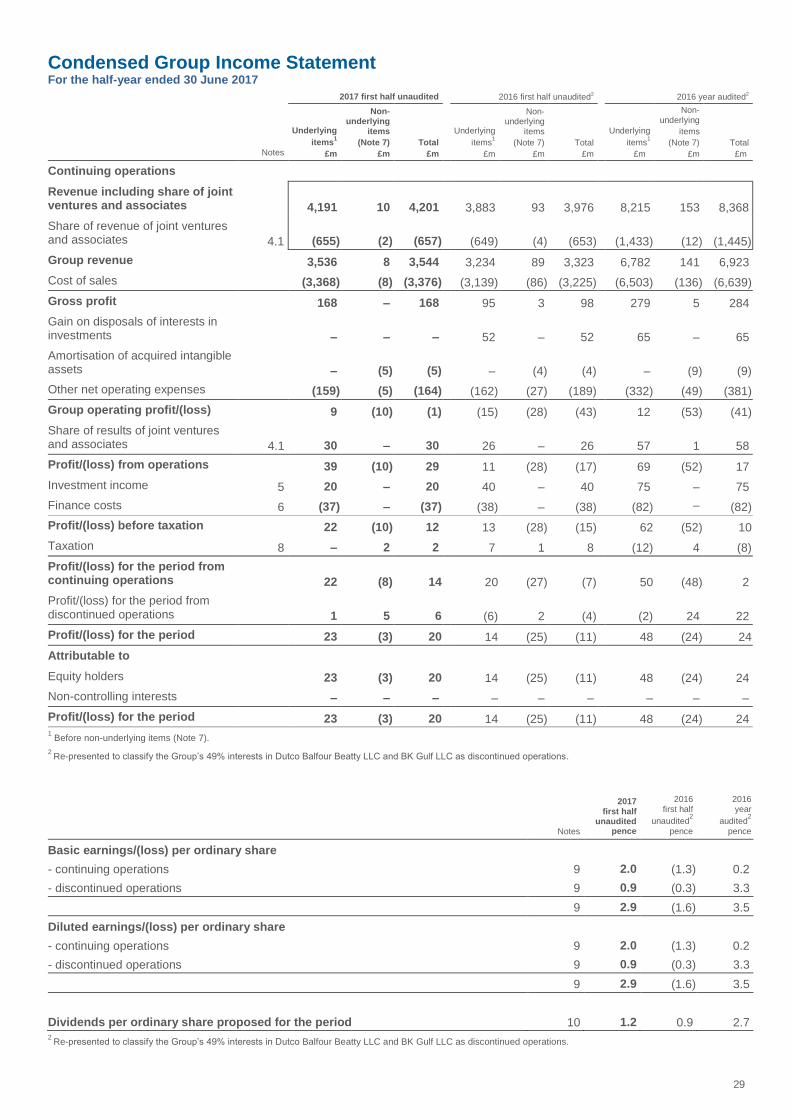
29
Condensed Group Income Statement For the half-year ended 30 June 2017
2017 first half unaudited 2016 first half unaudited2 2016 year audited2
Notes
Underlying
items1
£m
Non-underlying
items
(Note 7)
£m
Total
£m
Underlying
items1
£m
Non-underlying
items
(Note 7)
£m
Total
£m
Underlying
items1
£m
Non-underlying
items
(Note 7)
£m
Total
£m
Continuing operations
Revenue including share of joint ventures and associates 4,191 10 4,201 3,883 93 3,976 8,215 153 8,368
Share of revenue of joint ventures and associates 4.1 (655) (2) (657) (649) (4) (653) (1,433) (12) (1,445)
Group revenue 3,536 8 3,544 3,234 89 3,323 6,782 141 6,923
Cost of sales (3,368) (8) (3,376) (3,139) (86) (3,225) (6,503) (136) (6,639)
Gross profit 168 – 168 95 3 98 279 5 284
Gain on disposals of interests in investments – – – 52 – 52 65 – 65
Amortisation of acquired intangible assets – (5) (5) – (4) (4) – (9) (9)
Other net operating expenses (159) (5) (164) (162) (27) (189) (332) (49) (381)
Group operating profit/(loss) 9 (10) (1) (15) (28) (43) 12 (53) (41)
Share of results of joint ventures and associates 4.1 30 – 30 26 – 26 57 1 58
Profit/(loss) from operations 39 (10) 29 11 (28) (17) 69 (52) 17
Investment income 5 20 – 20 40 – 40 75 – 75
Finance costs 6 (37) – (37) (38) – (38) (82) – (82)
Profit/(loss) before taxation 22 (10) 12 13 (28) (15) 62 (52) 10
Taxation 8 – 2 2 7 1 8 (12) 4 (8)
Profit/(loss) for the period from continuing operations 22 (8) 14 20 (27) (7) 50 (48) 2
Profit/(loss) for the period from discontinued operations 1 5 6 (6) 2 (4) (2) 24 22
Profit/(loss) for the period 23 (3) 20 14 (25) (11) 48 (24) 24
Attributable to
Equity holders 23 (3) 20 14 (25) (11) 48 (24) 24
Non-controlling interests – – – – – – – – –
Profit/(loss) for the period 23 (3) 20 14 (25) (11) 48 (24) 24 1 Before non-underlying items (Note 7).
2 Re-presented to classify the Group’s 49% interests in Dutco Balfour Beatty LLC and BK Gulf LLC as discontinued operations.
Notes
2017 first half
unaudited pence
2016 first half
unaudited2
pence
2016 year
audited2
pence
Basic earnings/(loss) per ordinary share
- continuing operations 9 2.0 (1.3) 0.2
- discontinued operations 9 0.9 (0.3) 3.3
9 2.9 (1.6) 3.5
Diluted earnings/(loss) per ordinary share
- continuing operations 9 2.0 (1.3) 0.2
- discontinued operations 9 0.9 (0.3) 3.3
9 2.9 (1.6) 3.5
Dividends per ordinary share proposed for the period 10 1.2 0.9 2.7 2
Re-presented to classify the Group’s 49% interests in Dutco Balfour Beatty LLC and BK Gulf LLC as discontinued operations.
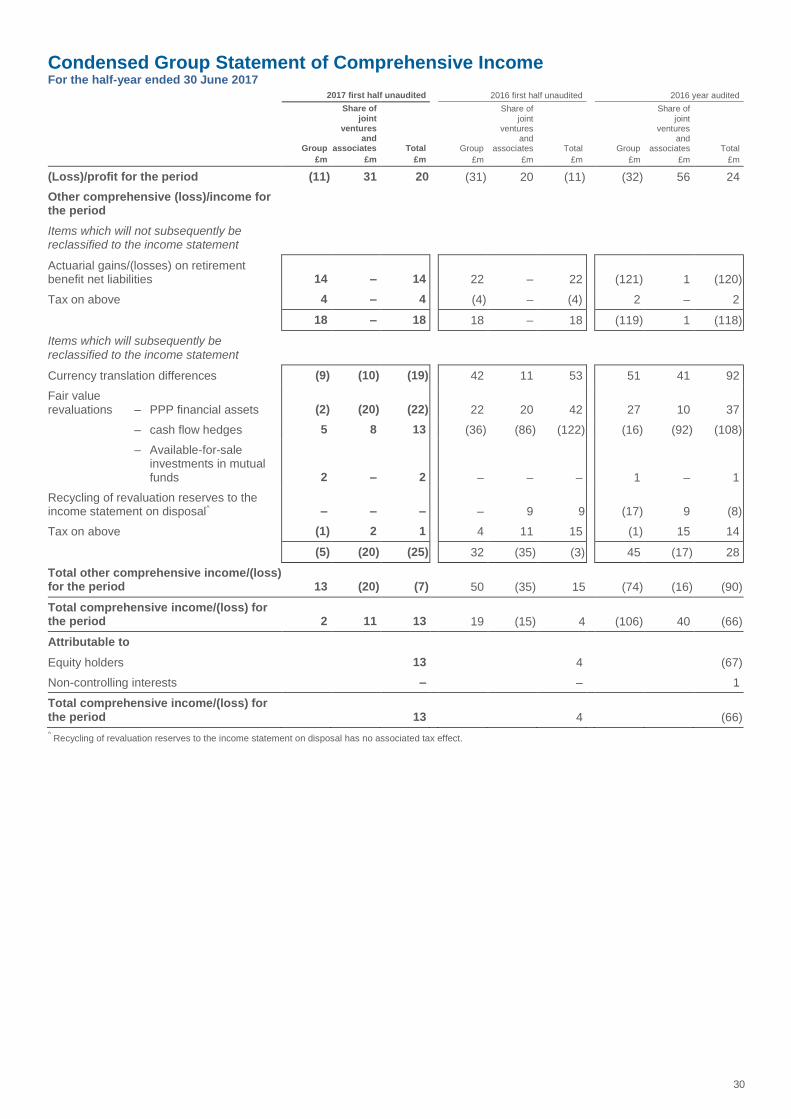
30
Condensed Group Statement of Comprehensive Income For the half-year ended 30 June 2017
2017 first half unaudited 2016 first half unaudited 2016 year audited
Group
£m
Share of joint
ventures and
associates
£m
Total
£m
Group
£m
Share of joint
ventures and
associates
£m
Total
£m
Group
£m
Share of joint
ventures and
associates
£m
Total
£m
(Loss)/profit for the period (11) 31 20 (31) 20 (11) (32) 56 24
Other comprehensive (loss)/income for the period
Items which will not subsequently be reclassified to the income statement
Actuarial gains/(losses) on retirement benefit net liabilities 14 – 14 22 – 22 (121) 1 (120)
Tax on above 4 – 4 (4) – (4) 2 – 2
18 – 18 18 – 18 (119) 1 (118)
Items which will subsequently be reclassified to the income statement
Currency translation differences (9) (10) (19) 42 11 53 51 41 92
Fair value revaluations – PPP financial assets (2) (20) (22) 22 20 42 27 10 37
– cash flow hedges 5 8 13 (36) (86) (122) (16) (92) (108)
– Available-for-sale investments in mutual funds 2 – 2 – – – 1 – 1
Recycling of revaluation reserves to the income statement on disposal^ – – –
– 9 9
(17) 9 (8)
Tax on above (1) 2 1 4 11 15 (1) 15 14
(5) (20) (25) 32 (35) (3) 45 (17) 28
Total other comprehensive income/(loss) for the period 13 (20) (7) 50 (35) 15 (74) (16) (90)
Total comprehensive income/(loss) for the period 2 11 13 19 (15) 4 (106) 40 (66)
Attributable to
Equity holders 13 4 (67)
Non-controlling interests – – 1
Total comprehensive income/(loss) for the period 13 4 (66)
^ Recycling of revaluation reserves to the income statement on disposal has no associated tax effect.
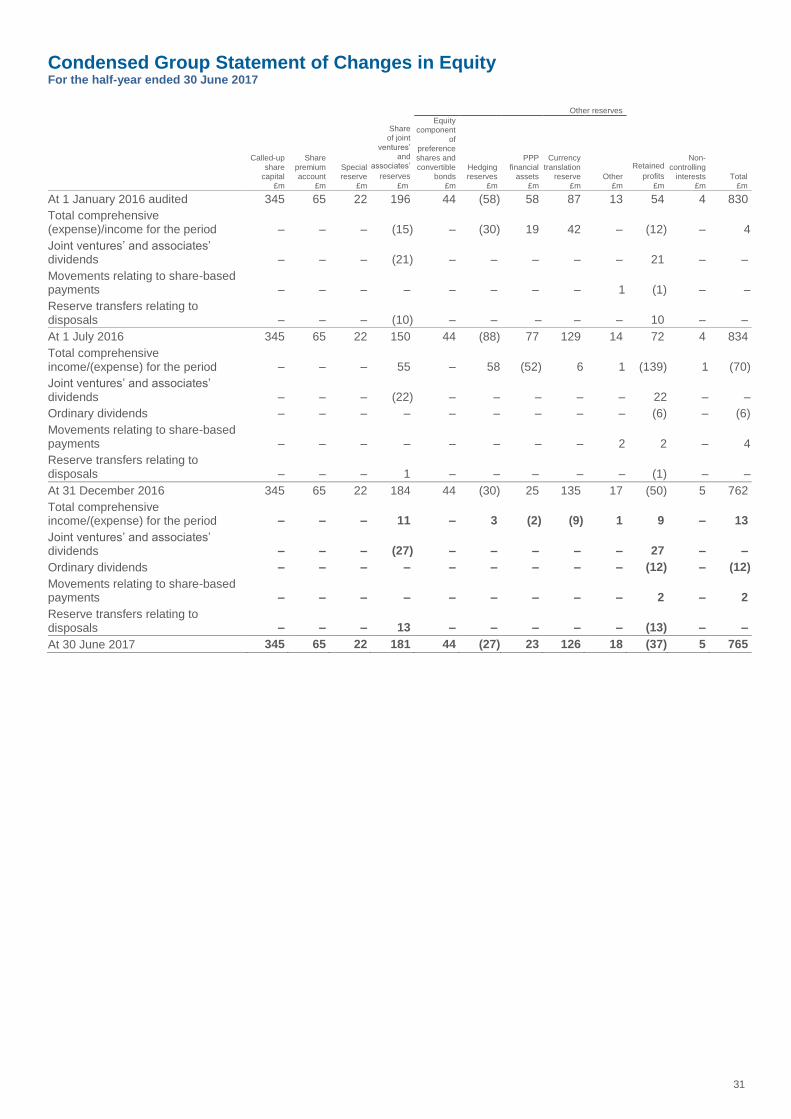
31
Condensed Group Statement of Changes in Equity For the half-year ended 30 June 2017
Other reserves
Called-up
share capital
£m
Share
premium account
£m
Special reserve
£m
Share of joint
ventures’ and
associates’
reserves
£m
Equity component
of preference shares and
convertible bonds
£m
Hedging reserves
£m
PPP
financial assets
£m
Currency
translation reserve
£m Other
£m
Retained
profits
£m
Non-
controlling interests
£m Total
£m
At 1 January 2016 audited
345 65 22 196 44 (58) 58 87 13 54 4 830
Total comprehensive (expense)/income for the period – – – (15) – (30) 19 42 – (12) – 4
Joint ventures’ and associates’ dividends – – – (21) – – – – – 21 – –
Movements relating to share-based payments – – – – – – – – 1 (1) – –
Reserve transfers relating to disposals – – – (10) – – – – – 10 – –
At 1 July 2016 345 65 22 150 44 (88) 77 129 14 72 4 834
Total comprehensive income/(expense) for the period – – – 55 – 58 (52) 6 1 (139) 1 (70)
Joint ventures’ and associates’ dividends – – – (22) – – – – – 22 – –
Ordinary dividends – – – – – – – – – (6) – (6)
Movements relating to share-based payments – – – – – – – – 2 2 – 4
Reserve transfers relating to disposals – – – 1 – – – – – (1) – –
At 31 December 2016 345 65 22 184 44 (30) 25 135 17 (50) 5 762
Total comprehensive income/(expense) for the period – – – 11 – 3 (2) (9) 1 9 – 13
Joint ventures’ and associates’ dividends – – – (27) – – – – – 27 – –
Ordinary dividends – – – – – – – – – (12) – (12)
Movements relating to share-based payments – – – – – – – – – 2 – 2
Reserve transfers relating to disposals – – – 13 – – – – – (13) – –
At 30 June 2017 345 65 22 181 44 (27) 23 126 18 (37) 5 765

32
Condensed Group Balance Sheet At 30 June 2017
Notes
2017 first half
unaudited £m
2016 first half
unaudited3
£m
2016 year
audited
£m
Non-current assets
Intangible assets – goodwill 11 911 896 937
– other 267 226 225
Property, plant and equipment3
173 174 181
Investment properties3 47 23 36
Investments in joint ventures and associates 4.2 630 583 628
Investments 43 45 45
PPP financial assets 14 159 432 163
Trade and other receivables 12 217 146 180
Retirement benefit assets 15 – 27 –
Deferred tax assets 68 70 54
Derivative financial instruments 20 2 3 3
2,517 2,625 2,452
Current assets
Inventories and non-construction work in progress 95 127 101
Due from construction contract customers 384 382 380
Trade and other receivables 12 1,043 994 1,066
Cash and cash equivalents – infrastructure concessions 17.2 154 25 7
– other 17.2 689 703 762
Current tax assets – – 8
Derivative financial instruments 20 3 1 1
2,368 2,232 2,325
Assets held for sale – 56 –
2,368 2,288 2,325
Total assets 4,885 4,913 4,777
Current liabilities
Due to construction contract customers (531) (476) (542)
Trade and other payables 13 (1,746) (1,741) (1,752)
Provisions (169) (165) (147)
Borrowings – non-recourse loans 17.3 (45) (15) (47)
– other 17.3 (40) (77) (56)
Current tax liabilities (9) (26) (18)
Derivative financial instruments 20 (4) (14) (6)
(2,544) (2,514) (2,568)
Liabilities held for sale – (40) –
(2,544) (2,554) (2,568)
Non-current liabilities
Trade and other payables 13 (166) (132) (151)
Provisions (96) (98) (126)
Borrowings – non-recourse loans 17.3 (401) (398) (193)
– other 17.3 (488) (511) (533)
Liability component of preference shares (101) (99) (100)
Retirement benefit liabilities 15 (208) (123) (231)
Deferred tax liabilities (85) (63) (80)
Derivative financial instruments 20 (31) (101) (33)
(1,576) (1,525) (1,447)
Total liabilities (4,120) (4,079) (4,015)
Net assets 765 834 762
Equity
Called-up share capital 345 345 345
Share premium account 65 65 65
Special reserve 22 22 22
Share of joint ventures’ and associates’ reserves 181 150 184
Other reserves 184 176 191
Retained profits (37) 72 (50)
Equity attributable to equity holders of the parent 760 830 757
Non-controlling interests 5 4 5
Total equity 765 834 762 3
Re-presented to show assets that are held by the Group to generate rental income and/or capital appreciation separately from property, plant and equipment. These
assets meet the definition of investment properties and have been reclassified accordingly.
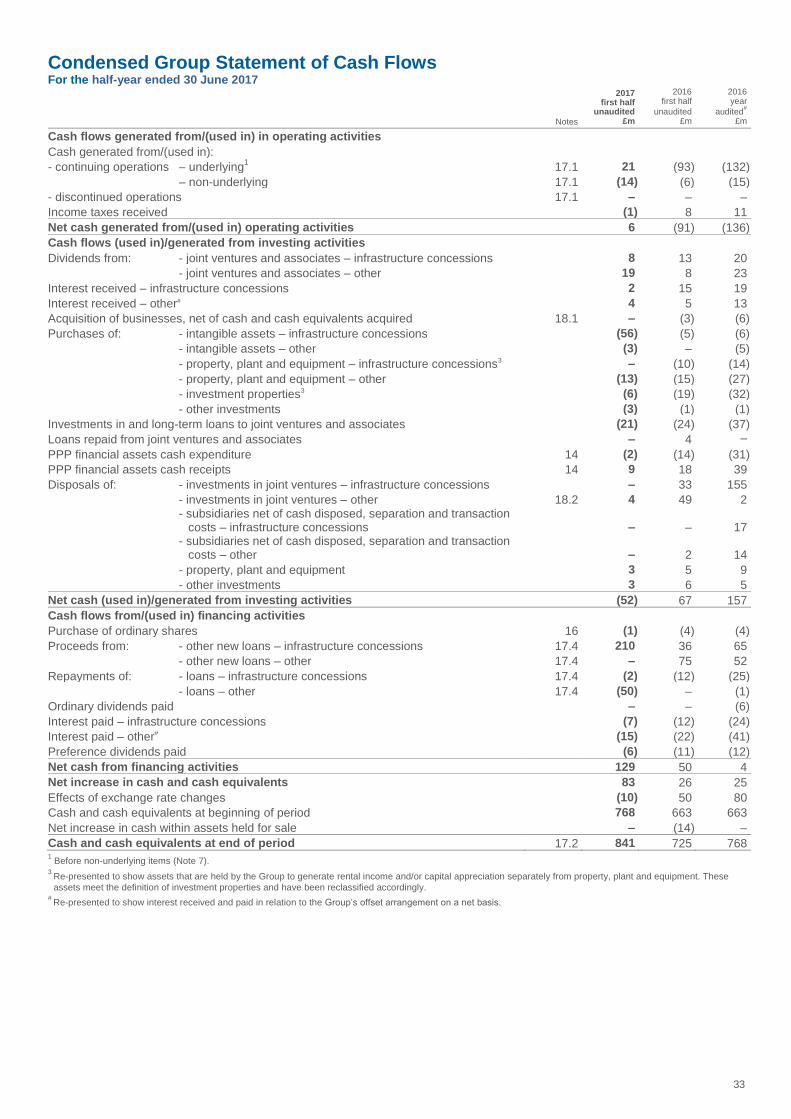
33
Condensed Group Statement of Cash Flows For the half-year ended 30 June 2017
Notes
2017 first half
unaudited £m
2016 first half
unaudited £m
2016 year
audited#
£m
Cash flows generated from/(used in) in operating activities
Cash generated from/(used in):
- continuing operations – underlying1 17.1 21 (93) (132)
– non-underlying 17.1 (14) (6) (15)
- discontinued operations 17.1 – – –
Income taxes received (1) 8 11
Net cash generated from/(used in) operating activities 6 (91) (136)
Cash flows (used in)/generated from investing activities
Dividends from: - joint ventures and associates – infrastructure concessions 8 13 20
- joint ventures and associates – other 19 8 23
Interest received – infrastructure concessions 2 15 19
Interest received – other# 4 5 13
Acquisition of businesses, net of cash and cash equivalents acquired 18.1 – (3) (6)
Purchases of: - intangible assets – infrastructure concessions (56) (5) (6)
- intangible assets – other (3) – (5)
- property, plant and equipment – infrastructure concessions3 – (10) (14)
- property, plant and equipment – other (13) (15) (27)
- investment properties3 (6) (19) (32)
- other investments (3) (1) (1)
Investments in and long-term loans to joint ventures and associates (21) (24) (37)
Loans repaid from joint ventures and associates – 4 –
PPP financial assets cash expenditure 14 (2) (14) (31)
PPP financial assets cash receipts 14 9 18 39
Disposals of: - investments in joint ventures – infrastructure concessions – 33 155
- investments in joint ventures – other 18.2 4 49 2
- subsidiaries net of cash disposed, separation and transaction
costs – infrastructure concessions – – 17
- subsidiaries net of cash disposed, separation and transaction
costs – other – 2 14
- property, plant and equipment 3 5 9
- other investments 3 6 5
Net cash (used in)/generated from investing activities (52) 67 157
Cash flows from/(used in) financing activities
Purchase of ordinary shares 16 (1) (4) (4)
Proceeds from: - other new loans – infrastructure concessions 17.4 210 36 65
- other new loans – other 17.4 – 75 52
Repayments of: - loans – infrastructure concessions 17.4 (2) (12) (25)
- loans – other 17.4 (50) – (1)
Ordinary dividends paid – – (6)
Interest paid – infrastructure concessions (7) (12) (24)
Interest paid – other# (15) (22) (41)
Preference dividends paid (6) (11) (12)
Net cash from financing activities 129 50 4
Net increase in cash and cash equivalents 83 26 25
Effects of exchange rate changes (10) 50 80
Cash and cash equivalents at beginning of period 768 663 663
Net increase in cash within assets held for sale – (14) –
Cash and cash equivalents at end of period 17.2 841 725 768 1 Before non-underlying items (Note 7).
3 Re-presented to show assets that are held by the Group to generate rental income and/or capital appreciation separately from property, plant and equipment. These
assets meet the definition of investment properties and have been reclassified accordingly. #
Re-presented to show interest received and paid in relation to the Group’s offset arrangement on a net basis.
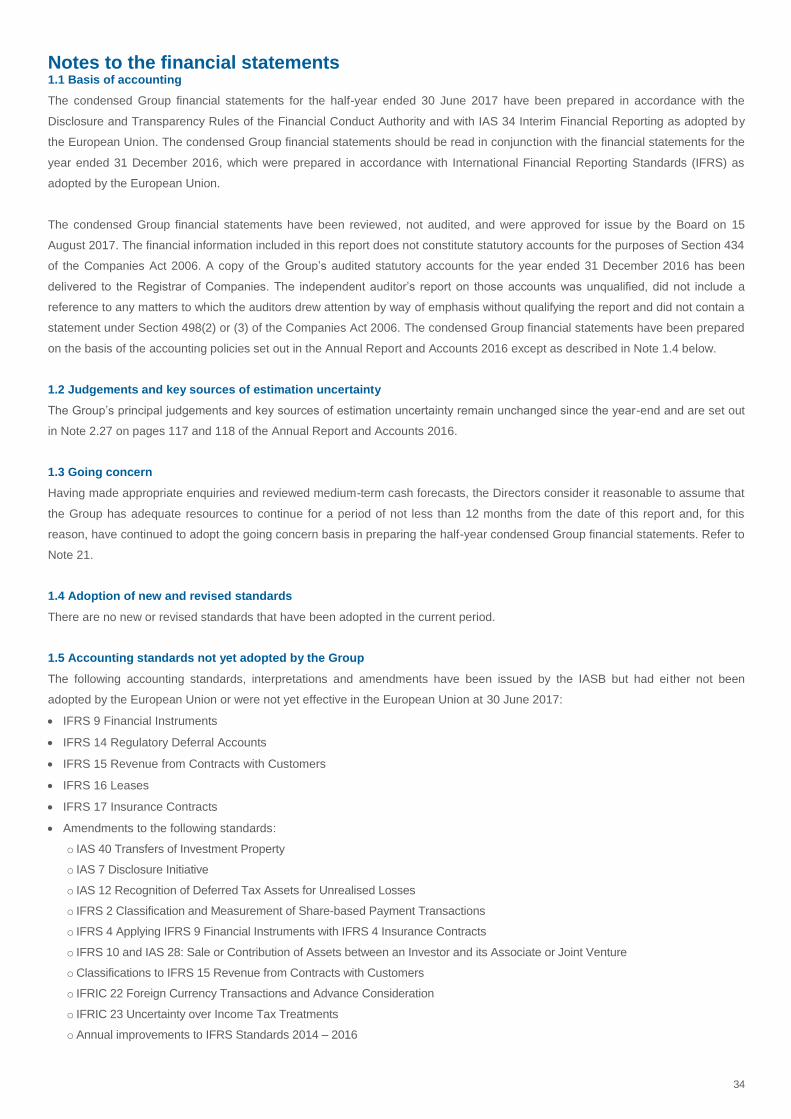
34
Notes to the financial statements 1.1 Basis of accounting
The condensed Group financial statements for the half-year ended 30 June 2017 have been prepared in accordance with the
Disclosure and Transparency Rules of the Financial Conduct Authority and with IAS 34 Interim Financial Reporting as adopted by
the European Union. The condensed Group financial statements should be read in conjunction with the financial statements for the
year ended 31 December 2016, which were prepared in accordance with International Financial Reporting Standards (IFRS) as
adopted by the European Union.
The condensed Group financial statements have been reviewed, not audited, and were approved for issue by the Board on 15
August 2017. The financial information included in this report does not constitute statutory accounts for the purposes of Section 434
of the Companies Act 2006. A copy of the Group’s audited statutory accounts for the year ended 31 December 2016 has been
delivered to the Registrar of Companies. The independent auditor’s report on those accounts was unqualified, did not include a
reference to any matters to which the auditors drew attention by way of emphasis without qualifying the report and did not contain a
statement under Section 498(2) or (3) of the Companies Act 2006. The condensed Group financial statements have been prepared
on the basis of the accounting policies set out in the Annual Report and Accounts 2016 except as described in Note 1.4 below.
1.2 Judgements and key sources of estimation uncertainty
The Group’s principal judgements and key sources of estimation uncertainty remain unchanged since the year-end and are set out
in Note 2.27 on pages 117 and 118 of the Annual Report and Accounts 2016.
1.3 Going concern
Having made appropriate enquiries and reviewed medium-term cash forecasts, the Directors consider it reasonable to assume that
the Group has adequate resources to continue for a period of not less than 12 months from the date of this report and, for this
reason, have continued to adopt the going concern basis in preparing the half-year condensed Group financial statements. Refer to
Note 21.
1.4 Adoption of new and revised standards
There are no new or revised standards that have been adopted in the current period.
1.5 Accounting standards not yet adopted by the Group
The following accounting standards, interpretations and amendments have been issued by the IASB but had either not been
adopted by the European Union or were not yet effective in the European Union at 30 June 2017:
IFRS 9 Financial Instruments
IFRS 14 Regulatory Deferral Accounts
IFRS 15 Revenue from Contracts with Customers
IFRS 16 Leases
IFRS 17 Insurance Contracts
Amendments to the following standards:
o IAS 40 Transfers of Investment Property
o IAS 7 Disclosure Initiative
o IAS 12 Recognition of Deferred Tax Assets for Unrealised Losses
o IFRS 2 Classification and Measurement of Share-based Payment Transactions
o IFRS 4 Applying IFRS 9 Financial Instruments with IFRS 4 Insurance Contracts
o IFRS 10 and IAS 28: Sale or Contribution of Assets between an Investor and its Associate or Joint Venture
o Classifications to IFRS 15 Revenue from Contracts with Customers
o IFRIC 22 Foreign Currency Transactions and Advance Consideration
o IFRIC 23 Uncertainty over Income Tax Treatments
o Annual improvements to IFRS Standards 2014 – 2016
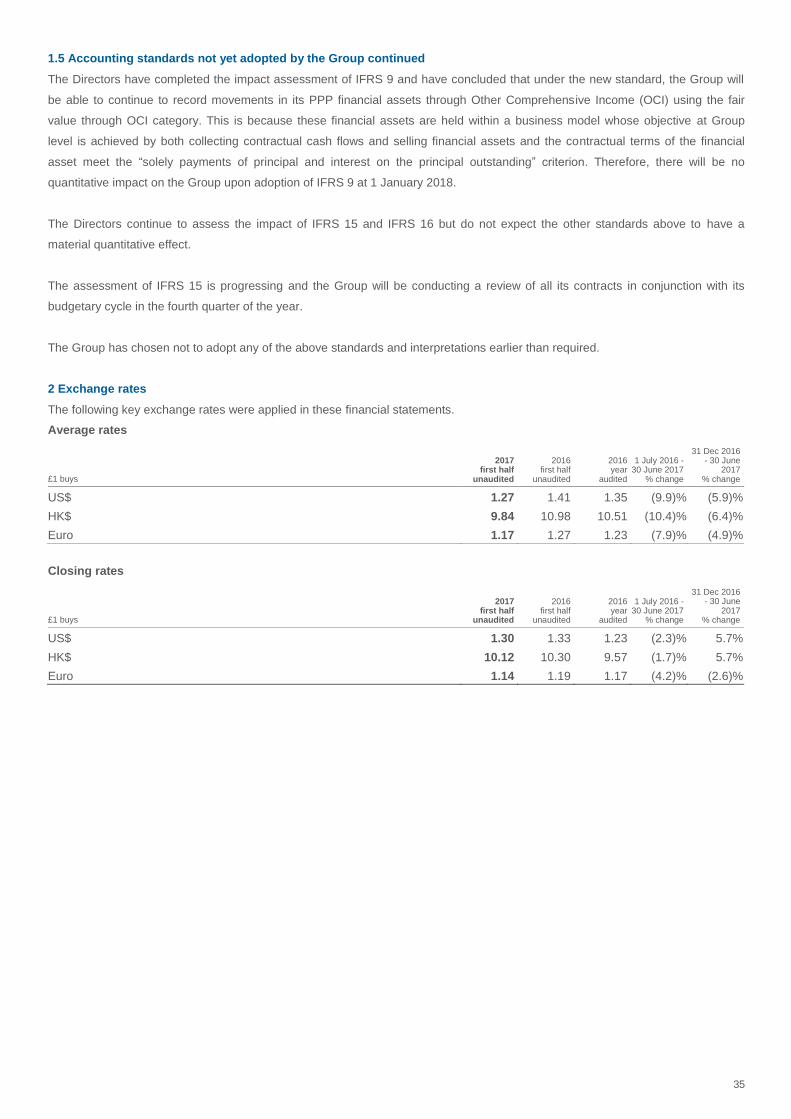
35
1.5 Accounting standards not yet adopted by the Group continued
The Directors have completed the impact assessment of IFRS 9 and have concluded that under the new standard, the Group will
be able to continue to record movements in its PPP financial assets through Other Comprehensive Income (OCI) using the fair
value through OCI category. This is because these financial assets are held within a business model whose objective at Group
level is achieved by both collecting contractual cash flows and selling financial assets and the contractual terms of the financial
asset meet the “solely payments of principal and interest on the principal outstanding” criterion. Therefore, there will be no
quantitative impact on the Group upon adoption of IFRS 9 at 1 January 2018.
The Directors continue to assess the impact of IFRS 15 and IFRS 16 but do not expect the other standards above to have a
material quantitative effect.
The assessment of IFRS 15 is progressing and the Group will be conducting a review of all its contracts in conjunction with its
budgetary cycle in the fourth quarter of the year.
The Group has chosen not to adopt any of the above standards and interpretations earlier than required.
2 Exchange rates
The following key exchange rates were applied in these financial statements.
Average rates
£1 buys
2017 first half
unaudited
2016 first half
unaudited
2016 year
audited
1 July 2016 - 30 June 2017
% change
31 Dec 2016 - 30 June
2017 % change
US$ 1.27 1.41 1.35 (9.9)% (5.9)%
HK$ 9.84 10.98 10.51 (10.4)% (6.4)%
Euro 1.17 1.27 1.23 (7.9)% (4.9)%
Closing rates
£1 buys
2017 first half
unaudited
2016 first half
unaudited
2016 year
audited
1 July 2016 - 30 June 2017
% change
31 Dec 2016 - 30 June
2017 % change
US$ 1.30 1.33 1.23 (2.3)% 5.7%
HK$ 10.12 10.30 9.57 (1.7)% 5.7%
Euro 1.14 1.19 1.17 (4.2)% (2.6)%
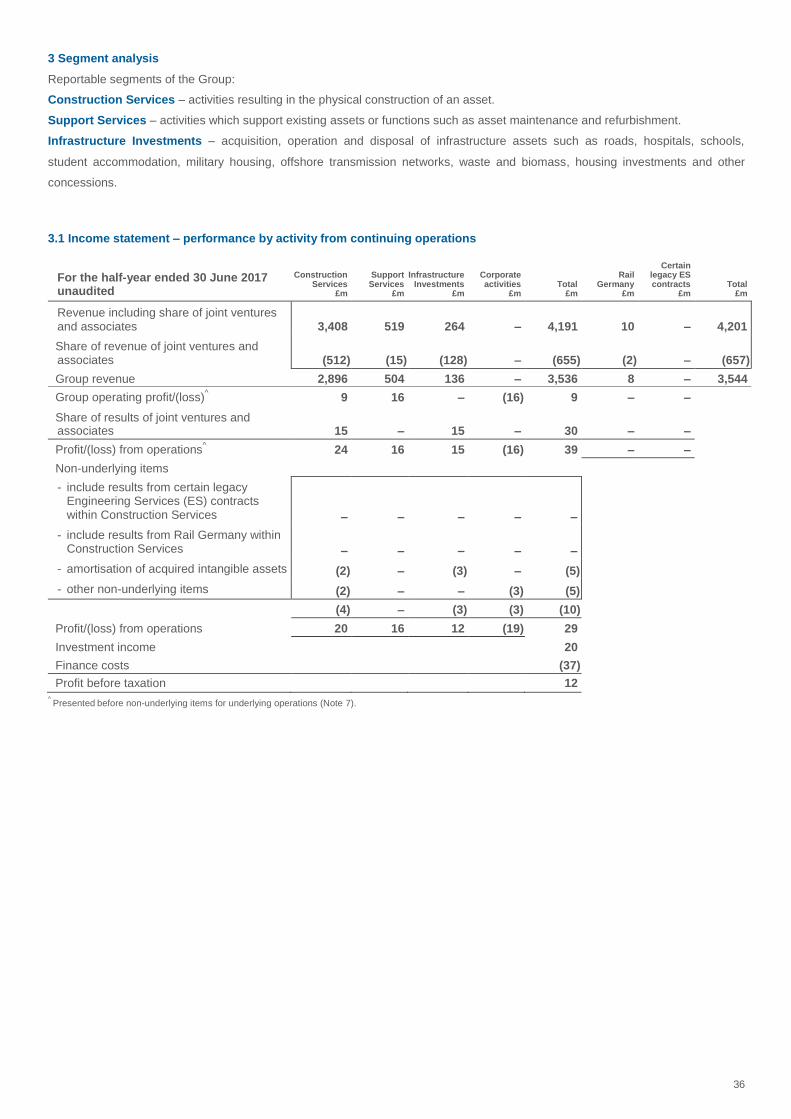
36
3 Segment analysis
Reportable segments of the Group:
Construction Services – activities resulting in the physical construction of an asset.
Support Services – activities which support existing assets or functions such as asset maintenance and refurbishment.
Infrastructure Investments – acquisition, operation and disposal of infrastructure assets such as roads, hospitals, schools,
student accommodation, military housing, offshore transmission networks, waste and biomass, housing investments and other
concessions.
3.1 Income statement – performance by activity from continuing operations
For the half-year ended 30 June 2017 unaudited
Construction Services
£m
Support Services
£m
Infrastructure Investments
£m
Corporate activities
£m Total
£m
Rail Germany
£m
Certain legacy ES contracts
£m Total
£m
Revenue including share of joint ventures and associates 3,408 519 264 – 4,191 10 – 4,201
Share of revenue of joint ventures and associates (512) (15) (128) – (655) (2) – (657)
Group revenue 2,896 504 136 – 3,536 8 – 3,544
Group operating profit/(loss)^ 9 16 – (16) 9 – –
Share of results of joint ventures and associates 15 – 15 – 30 – –
Profit/(loss) from operations^ 24 16 15 (16) 39 – –
Non-underlying items
- include results from certain legacy Engineering Services (ES) contracts within Construction Services – – – – –
- include results from Rail Germany within Construction Services – – – – –
- amortisation of acquired intangible assets (2) – (3) – (5)
- other non-underlying items (2) – – (3) (5)
(4) – (3) (3) (10)
Profit/(loss) from operations 20 16 12 (19) 29
Investment income 20
Finance costs (37)
Profit before taxation 12 ^ Presented before non-underlying items for underlying operations (Note 7).
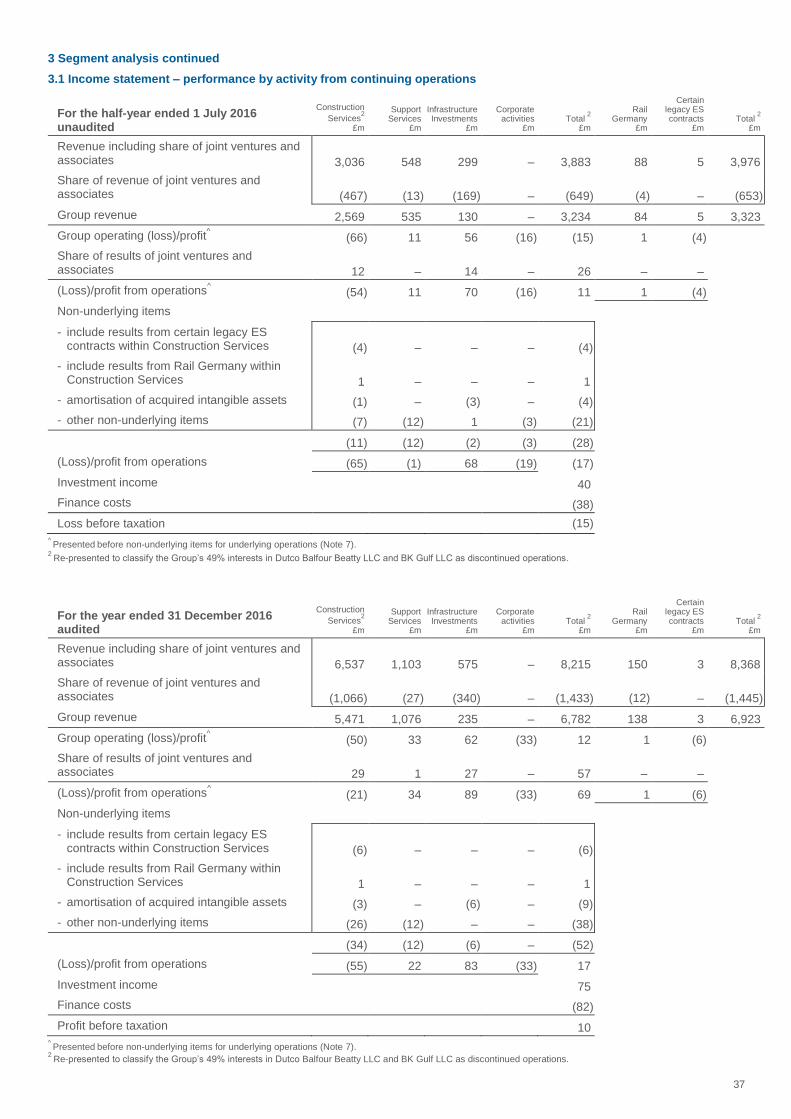
37
3 Segment analysis continued
3.1 Income statement – performance by activity from continuing operations
For the half-year ended 1 July 2016 unaudited
Construction
Services2
£m
Support Services
£m
Infrastructure Investments
£m
Corporate activities
£m Total
2
£m
Rail Germany
£m
Certain legacy ES contracts
£m Total
2
£m
Revenue including share of joint ventures and associates 3,036 548 299 – 3,883 88 5 3,976
Share of revenue of joint ventures and associates (467) (13) (169) – (649) (4) – (653)
Group revenue 2,569 535 130 – 3,234 84 5 3,323
Group operating (loss)/profit^ (66) 11 56 (16) (15) 1 (4)
Share of results of joint ventures and associates 12 – 14 – 26 – –
(Loss)/profit from operations^ (54) 11 70 (16) 11 1 (4)
Non-underlying items
- include results from certain legacy ES contracts within Construction Services (4) – – – (4)
- include results from Rail Germany within Construction Services 1 – – – 1
- amortisation of acquired intangible assets (1) – (3) – (4)
- other non-underlying items (7) (12) 1 (3) (21)
(11) (12) (2) (3) (28)
(Loss)/profit from operations (65) (1) 68 (19) (17)
Investment income 40
Finance costs (38)
Loss before taxation (15) ^ Presented before non-underlying items for underlying operations (Note 7).
2 Re-presented to classify the Group’s 49% interests in Dutco Balfour Beatty LLC and BK Gulf LLC as discontinued operations.
For the year ended 31 December 2016 audited
Construction
Services2
£m
Support Services
£m
Infrastructure Investments
£m
Corporate activities
£m Total
2
£m
Rail Germany
£m
Certain legacy ES contracts
£m Total
2
£m
Revenue including share of joint ventures and associates 6,537 1,103 575 – 8,215 150 3 8,368
Share of revenue of joint ventures and associates (1,066) (27) (340) – (1,433)
(12) – (1,445)
Group revenue 5,471 1,076 235 – 6,782 138 3 6,923
Group operating (loss)/profit^ (50) 33 62 (33) 12 1 (6)
Share of results of joint ventures and associates 29 1 27 – 57 – –
(Loss)/profit from operations^ (21) 34 89 (33) 69 1 (6)
Non-underlying items
- include results from certain legacy ES contracts within Construction Services (6) – – – (6)
- include results from Rail Germany within Construction Services 1 – – – 1
- amortisation of acquired intangible assets (3) – (6) – (9)
- other non-underlying items (26) (12) – – (38)
(34) (12) (6) – (52)
(Loss)/profit from operations (55) 22 83 (33) 17
Investment income 75
Finance costs (82)
Profit before taxation 10 ^ Presented before non-underlying items for underlying operations (Note 7).
2 Re-presented to classify the Group’s 49% interests in Dutco Balfour Beatty LLC and BK Gulf LLC as discontinued operations.
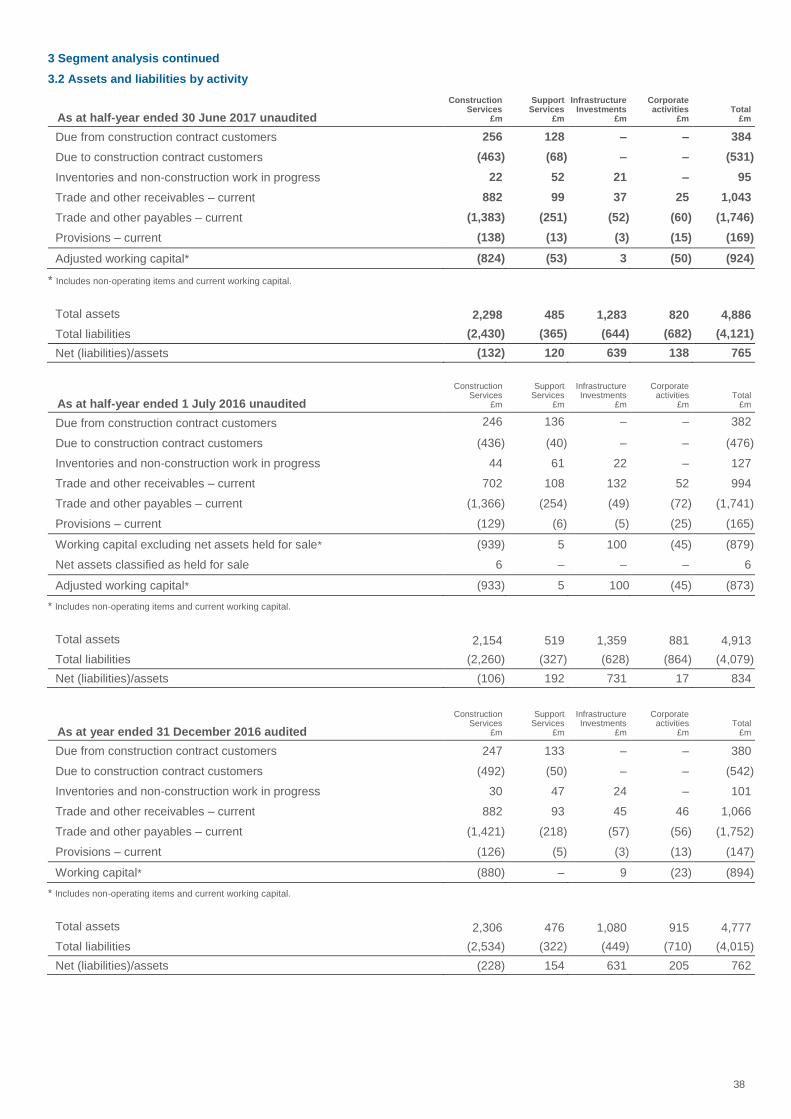
38
3 Segment analysis continued
3.2 Assets and liabilities by activity
As at half-year ended 30 June 2017 unaudited
Construction Services
£m
Support Services
£m
Infrastructure Investments
£m
Corporate activities
£m Total
£m
Due from construction contract customers 256 128 – – 384
Due to construction contract customers (463) (68) – – (531)
Inventories and non-construction work in progress 22 52 21 – 95
Trade and other receivables – current 882 99 37 25 1,043
Trade and other payables – current (1,383) (251) (52) (60) (1,746)
Provisions – current (138) (13) (3) (15) (169)
Adjusted working capital* (824) (53) 3 (50) (924)
* Includes non-operating items and current working capital.
Total assets
2,298 485 1,283 820 4,886
Total liabilities (2,430) (365) (644) (682) (4,121)
Net (liabilities)/assets (132) 120 639 138 765
As at half-year ended 1 July 2016 unaudited
Construction Services
£m
Support Services
£m
Infrastructure Investments
£m
Corporate activities
£m Total
£m
Due from construction contract customers 246 136 – – 382
Due to construction contract customers (436) (40) – – (476)
Inventories and non-construction work in progress 44 61 22 – 127
Trade and other receivables – current 702 108 132 52 994
Trade and other payables – current (1,366) (254) (49) (72) (1,741)
Provisions – current (129) (6) (5) (25) (165)
Working capital excluding net assets held for sale* (939) 5 100 (45) (879)
Net assets classified as held for sale 6 – – – 6
Adjusted working capital* (933) 5 100 (45) (873)
* Includes non-operating items and current working capital.
Total assets
2,154 519 1,359 881 4,913
Total liabilities (2,260) (327) (628) (864) (4,079)
Net (liabilities)/assets (106) 192 731 17 834
As at year ended 31 December 2016 audited
Construction Services
£m
Support Services
£m
Infrastructure Investments
£m
Corporate activities
£m Total
£m
Due from construction contract customers 247 133 – – 380
Due to construction contract customers (492) (50) – – (542)
Inventories and non-construction work in progress 30 47 24 – 101
Trade and other receivables – current 882 93 45 46 1,066
Trade and other payables – current (1,421) (218) (57) (56) (1,752)
Provisions – current (126) (5) (3) (13) (147)
Working capital* (880) – 9 (23) (894)
* Includes non-operating items and current working capital.
Total assets
2,306 476 1,080 915 4,777
Total liabilities (2,534) (322) (449) (710) (4,015)
Net (liabilities)/assets (228) 154 631 205 762
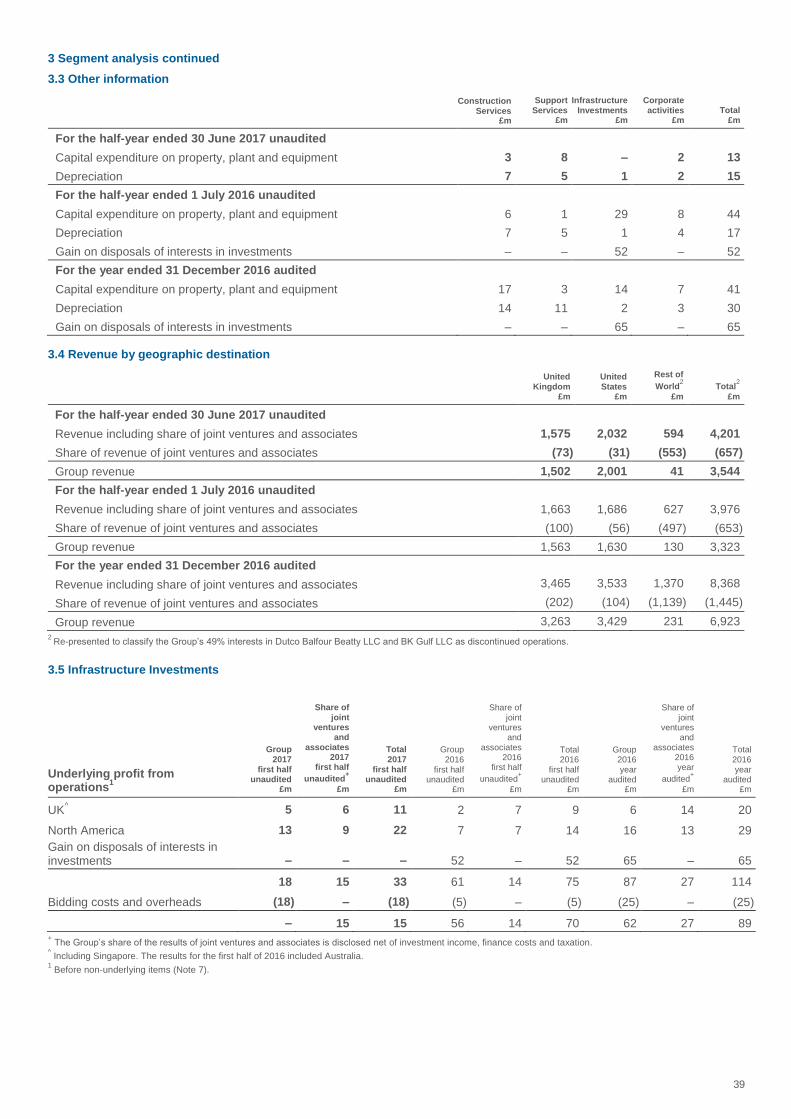
39
3 Segment analysis continued
3.3 Other information
Construction Services
£m
Support Services
£m
Infrastructure Investments
£m
Corporate activities
£m Total
£m
For the half-year ended 30 June 2017 unaudited
Capital expenditure on property, plant and equipment 3 8 – 2 13
Depreciation 7 5 1 2 15
For the half-year ended 1 July 2016 unaudited
Capital expenditure on property, plant and equipment 6 1 29 8 44
Depreciation 7 5 1 4 17
Gain on disposals of interests in investments – – 52 – 52
For the year ended 31 December 2016 audited
Capital expenditure on property, plant and equipment 17 3 14 7 41
Depreciation 14 11 2 3 30
Gain on disposals of interests in investments – – 65 – 65
3.4 Revenue by geographic destination
United Kingdom
£m
United States
£m
Rest of
World2
£m
Total2
£m
For the half-year ended 30 June 2017 unaudited
Revenue including share of joint ventures and associates 1,575 2,032 594 4,201
Share of revenue of joint ventures and associates (73) (31) (553) (657)
Group revenue 1,502 2,001 41 3,544
For the half-year ended 1 July 2016 unaudited
Revenue including share of joint ventures and associates 1,663 1,686 627 3,976
Share of revenue of joint ventures and associates (100) (56) (497) (653)
Group revenue 1,563 1,630 130 3,323
For the year ended 31 December 2016 audited
Revenue including share of joint ventures and associates 3,465 3,533 1,370 8,368
Share of revenue of joint ventures and associates (202) (104) (1,139) (1,445)
Group revenue 3,263 3,429 231 6,923
2 Re-presented to classify the Group’s 49% interests in Dutco Balfour Beatty LLC and BK Gulf LLC as discontinued operations.
3.5 Infrastructure Investments
Underlying profit from operations
1
Group 2017
first half unaudited
£m
Share of joint
ventures and
associates 2017
first half
unaudited+
£m
Total 2017
first half unaudited
£m
Group 2016
first half unaudited
£m
Share of joint
ventures and
associates 2016
first half
unaudited+
£m
Total 2016
first half unaudited
£m
Group 2016 year
audited £m
Share of joint
ventures and
associates 2016 year
audited+
£m
Total 2016 year
audited £m
UK^ 5 6 11 2 7 9 6 14 20
North America 13 9 22 7 7 14 16 13 29
Gain on disposals of interests in investments – – – 52 – 52 65 – 65
18 15 33 61 14 75 87 27 114
Bidding costs and overheads (18) – (18) (5) – (5) (25) – (25)
– 15 15 56 14 70 62 27 89 + The Group’s share of the results of joint ventures and associates is disclosed net of investment income, finance costs and taxation.
^ Including Singapore. The results for the first half of 2016 included Australia.
1 Before non-underlying items (Note 7).
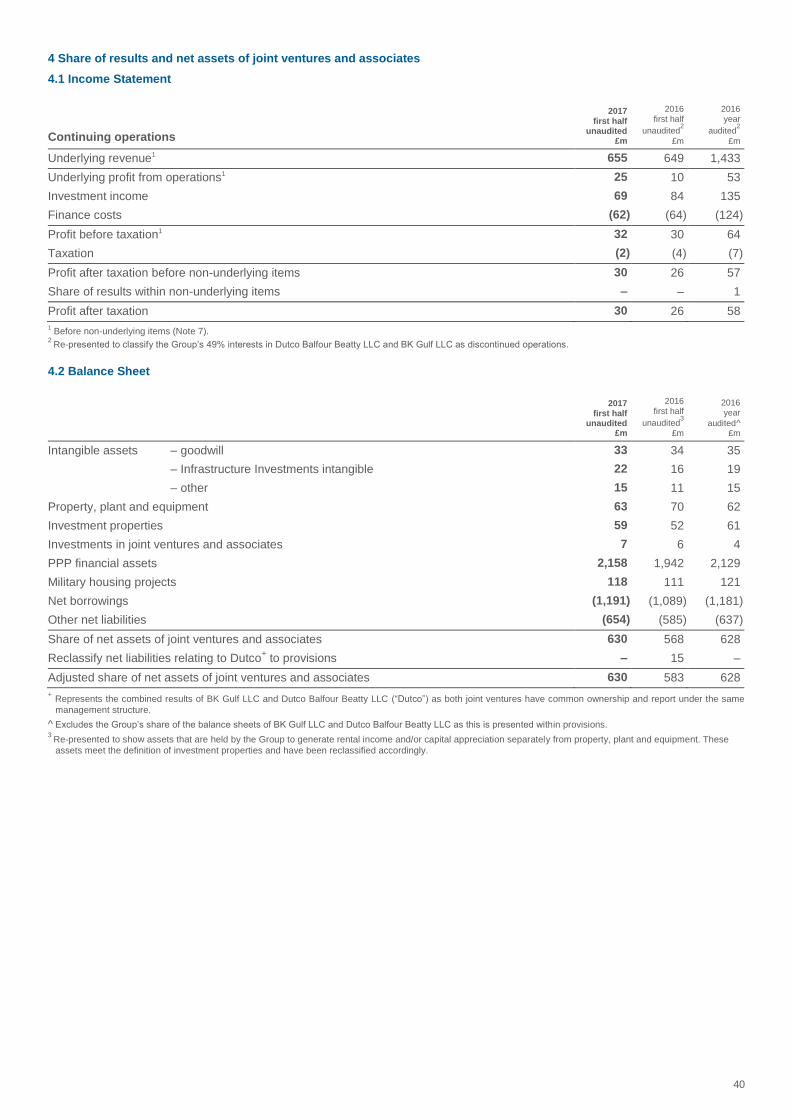
40
4 Share of results and net assets of joint ventures and associates
4.1 Income Statement
Continuing operations
2017 first half
unaudited £m
2016 first half
unaudited2
£m
2016 year
audited2
£m
Underlying revenue1 655 649 1,433
Underlying profit from operations1 25 10 53
Investment income 69 84 135
Finance costs (62) (64) (124)
Profit before taxation1 32 30 64
Taxation (2) (4) (7)
Profit after taxation before non-underlying items 30 26 57
Share of results within non-underlying items – – 1
Profit after taxation 30 26 58
1 Before non-underlying items (Note 7).
2 Re-presented to classify the Group’s 49% interests in Dutco Balfour Beatty LLC and BK Gulf LLC as discontinued operations.
4.2 Balance Sheet
2017 first half
unaudited £m
2016 first half
unaudited3
£m
2016 year
audited^ £m
Intangible assets – goodwill 33 34 35
– Infrastructure Investments intangible 22 16 19
– other 15 11 15
Property, plant and equipment 63 70 62
Investment properties 59 52 61
Investments in joint ventures and associates 7 6 4
PPP financial assets 2,158 1,942 2,129
Military housing projects
118 111 121
Net borrowings (1,191) (1,089) (1,181)
Other net liabilities (654) (585) (637)
Share of net assets of joint ventures and associates 630 568 628
Reclassify net liabilities relating to Dutco+ to provisions – 15 –
Adjusted share of net assets of joint ventures and associates 630 583 628
+ Represents the combined results of BK Gulf LLC and Dutco Balfour Beatty LLC (“Dutco”) as both joint ventures have common ownership and report under the same
management structure.
^ Excludes the Group’s share of the balance sheets of BK Gulf LLC and Dutco Balfour Beatty LLC as this is presented within provisions. 3
Re-presented to show assets that are held by the Group to generate rental income and/or capital appreciation separately from property, plant and equipment. These
assets meet the definition of investment properties and have been reclassified accordingly.
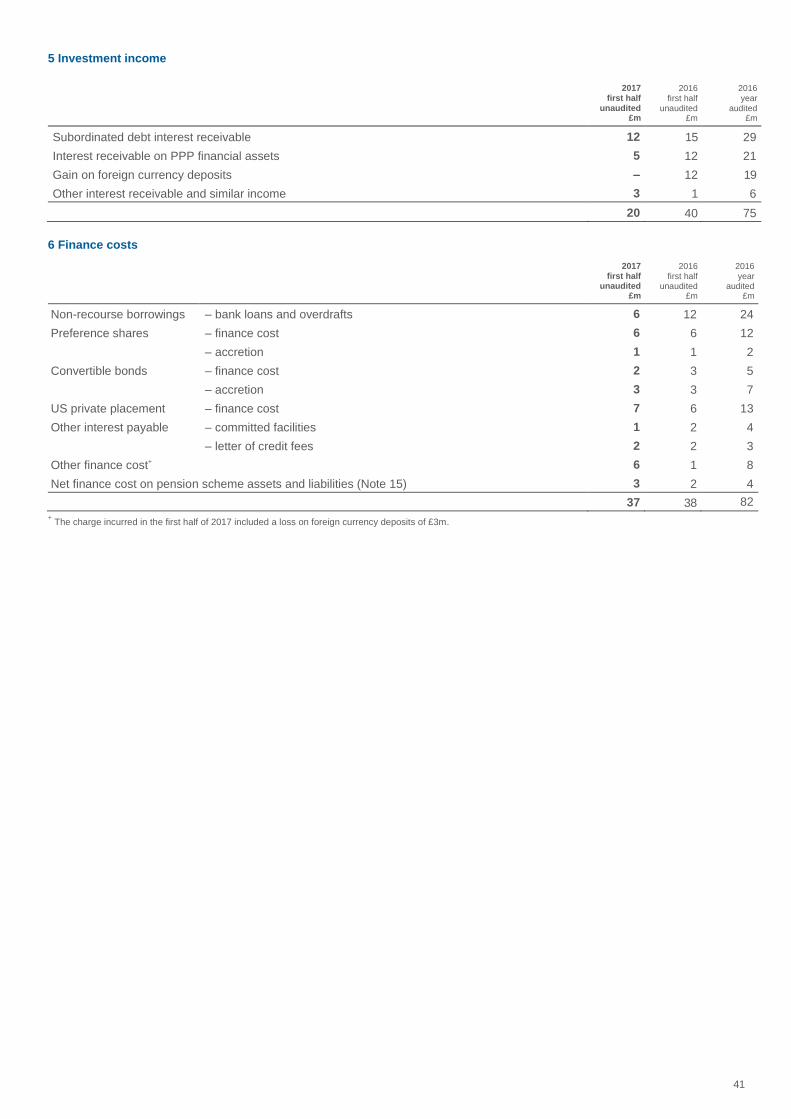
41
5 Investment income
2017 first half
unaudited £m
2016 first half
unaudited £m
2016 year
audited £m
Subordinated debt interest receivable 12 15 29
Interest receivable on PPP financial assets 5 12 21
Gain on foreign currency deposits – 12 19
Other interest receivable and similar income 3 1 6
20 40 75
6 Finance costs
2017 first half
unaudited £m
2016 first half
unaudited £m
2016 year
audited £m
Non-recourse borrowings – bank loans and overdrafts 6 12 24
Preference shares – finance cost 6 6 12
– accretion 1 1 2
Convertible bonds – finance cost 2 3 5
– accretion 3 3 7
US private placement – finance cost 7 6 13
Other interest payable – committed facilities 1 2 4
– letter of credit fees 2 2 3
Other finance cost+ 6 1 8
Net finance cost on pension scheme assets and liabilities (Note 15) 3 2 4
37 38 82
+ The charge incurred in the first half of 2017 included a loss on foreign currency deposits of £3m.
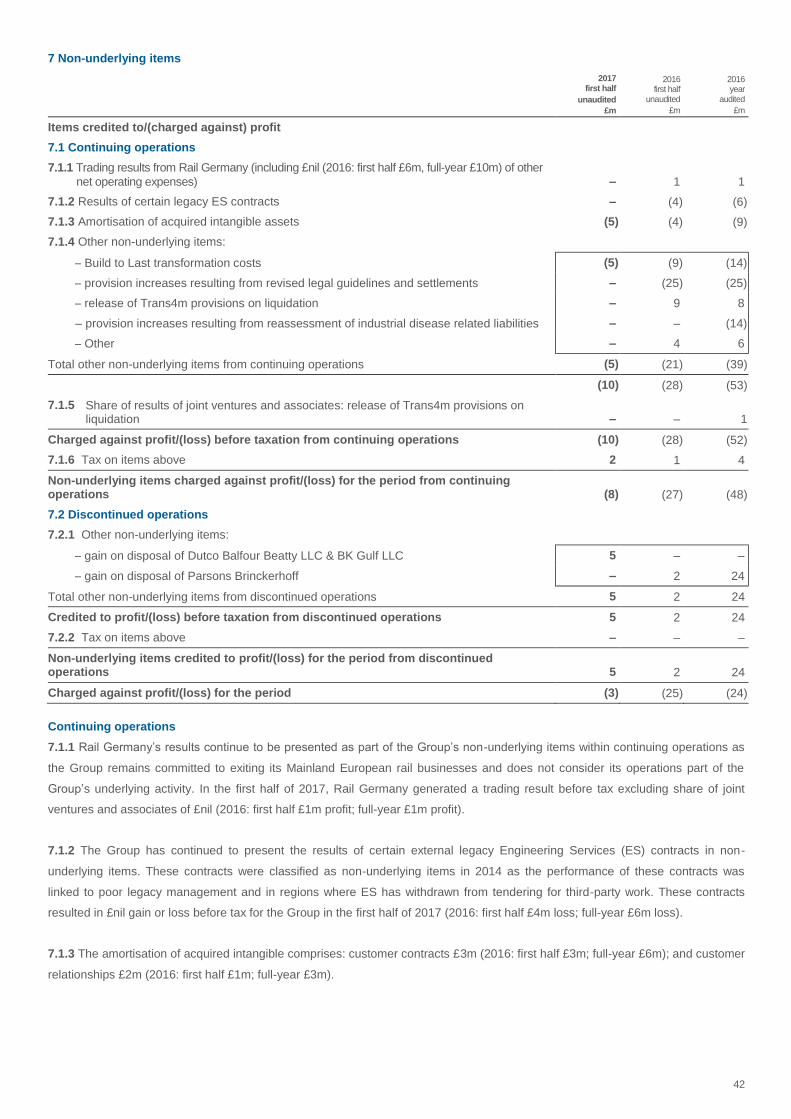
42
7 Non-underlying items
2017 first half
unaudited
£m
2016 first half
unaudited
£m
2016 year
audited
£m
Items credited to/(charged against) profit
7.1 Continuing operations
7.1.1 Trading results from Rail Germany (including £nil (2016: first half £6m, full-year £10m) of other
net operating expenses) – 1 1
7.1.2 Results of certain legacy ES contracts – (4) (6)
7.1.3 Amortisation of acquired intangible assets (5) (4) (9)
7.1.4 Other non-underlying items:
– Build to Last transformation costs (5) (9) (14)
– provision increases resulting from revised legal guidelines and settlements – (25) (25)
– release of Trans4m provisions on liquidation – 9 8
– provision increases resulting from reassessment of industrial disease related liabilities – – (14)
– Other – 4 6
Total other non-underlying items from continuing operations (5) (21) (39)
(10) (28) (53)
7.1.5 Share of results of joint ventures and associates: release of Trans4m provisions on liquidation – – 1
Charged against profit/(loss) before taxation from continuing operations (10) (28) (52)
7.1.6 Tax on items above 2 1 4
Non-underlying items charged against profit/(loss) for the period from continuing operations (8) (27) (48)
7.2 Discontinued operations
7.2.1 Other non-underlying items:
– gain on disposal of Dutco Balfour Beatty LLC & BK Gulf LLC 5 – –
– gain on disposal of Parsons Brinckerhoff – 2 24
Total other non-underlying items from discontinued operations 5 2 24
Credited to profit/(loss) before taxation from discontinued operations 5 2 24
7.2.2 Tax on items above – – –
Non-underlying items credited to profit/(loss) for the period from discontinued operations 5 2 24
Charged against profit/(loss) for the period (3) (25) (24)
Continuing operations
7.1.1 Rail Germany’s results continue to be presented as part of the Group’s non-underlying items within continuing operations as
the Group remains committed to exiting its Mainland European rail businesses and does not consider its operations part of the
Group’s underlying activity. In the first half of 2017, Rail Germany generated a trading result before tax excluding share of joint
ventures and associates of £nil (2016: first half £1m profit; full-year £1m profit).
7.1.2 The Group has continued to present the results of certain external legacy Engineering Services (ES) contracts in non-
underlying items. These contracts were classified as non-underlying items in 2014 as the performance of these contracts was
linked to poor legacy management and in regions where ES has withdrawn from tendering for third-party work. These contracts
resulted in £nil gain or loss before tax for the Group in the first half of 2017 (2016: first half £4m loss; full-year £6m loss).
7.1.3 The amortisation of acquired intangible comprises: customer contracts £3m (2016: first half £3m; full-year £6m); and customer
relationships £2m (2016: first half £1m; full-year £3m).
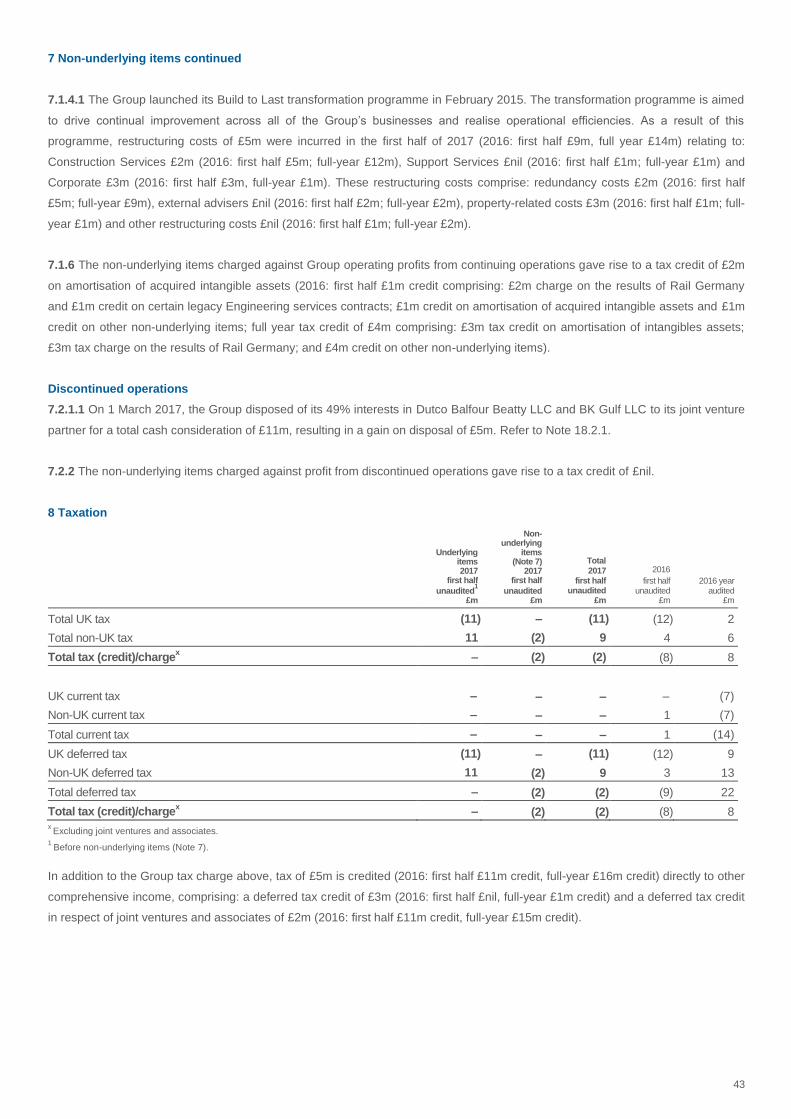
43
7 Non-underlying items continued
7.1.4.1 The Group launched its Build to Last transformation programme in February 2015. The transformation programme is aimed
to drive continual improvement across all of the Group’s businesses and realise operational efficiencies. As a result of this
programme, restructuring costs of £5m were incurred in the first half of 2017 (2016: first half £9m, full year £14m) relating to:
Construction Services £2m (2016: first half £5m; full-year £12m), Support Services £nil (2016: first half £1m; full-year £1m) and
Corporate £3m (2016: first half £3m, full-year £1m). These restructuring costs comprise: redundancy costs £2m (2016: first half
£5m; full-year £9m), external advisers £nil (2016: first half £2m; full-year £2m), property-related costs £3m (2016: first half £1m; full-
year £1m) and other restructuring costs £nil (2016: first half £1m; full-year £2m).
7.1.6 The non-underlying items charged against Group operating profits from continuing operations gave rise to a tax credit of £2m
on amortisation of acquired intangible assets (2016: first half £1m credit comprising: £2m charge on the results of Rail Germany
and £1m credit on certain legacy Engineering services contracts; £1m credit on amortisation of acquired intangible assets and £1m
credit on other non-underlying items; full year tax credit of £4m comprising: £3m tax credit on amortisation of intangibles assets;
£3m tax charge on the results of Rail Germany; and £4m credit on other non-underlying items).
Discontinued operations
7.2.1.1 On 1 March 2017, the Group disposed of its 49% interests in Dutco Balfour Beatty LLC and BK Gulf LLC to its joint venture
partner for a total cash consideration of £11m, resulting in a gain on disposal of £5m. Refer to Note 18.2.1.
7.2.2 The non-underlying items charged against profit from discontinued operations gave rise to a tax credit of £nil.
8 Taxation
Underlying items 2017
first half
unaudited1
£m
Non- underlying
items (Note 7)
2017 first half
unaudited £m
Total 2017
first half unaudited
£m
2016
first half unaudited
£m
2016 year audited
£m
Total UK tax (11) – (11) (12) 2
Total non-UK tax 11 (2) 9 4 6
Total tax (credit)/chargex – (2) (2) (8) 8
UK current tax – – – – (7)
Non-UK current tax – – – 1 (7)
Total current tax – – – 1 (14)
UK deferred tax (11) – (11) (12) 9
Non-UK deferred tax 11 (2) 9 3 13
Total deferred tax – (2) (2) (9) 22
Total tax (credit)/chargex – (2) (2) (8) 8
x Excluding joint ventures and associates.
1 Before non-underlying items (Note 7).
In addition to the Group tax charge above, tax of £5m is credited (2016: first half £11m credit, full-year £16m credit) directly to other
comprehensive income, comprising: a deferred tax credit of £3m (2016: first half £nil, full-year £1m credit) and a deferred tax credit
in respect of joint ventures and associates of £2m (2016: first half £11m credit, full-year £15m credit).
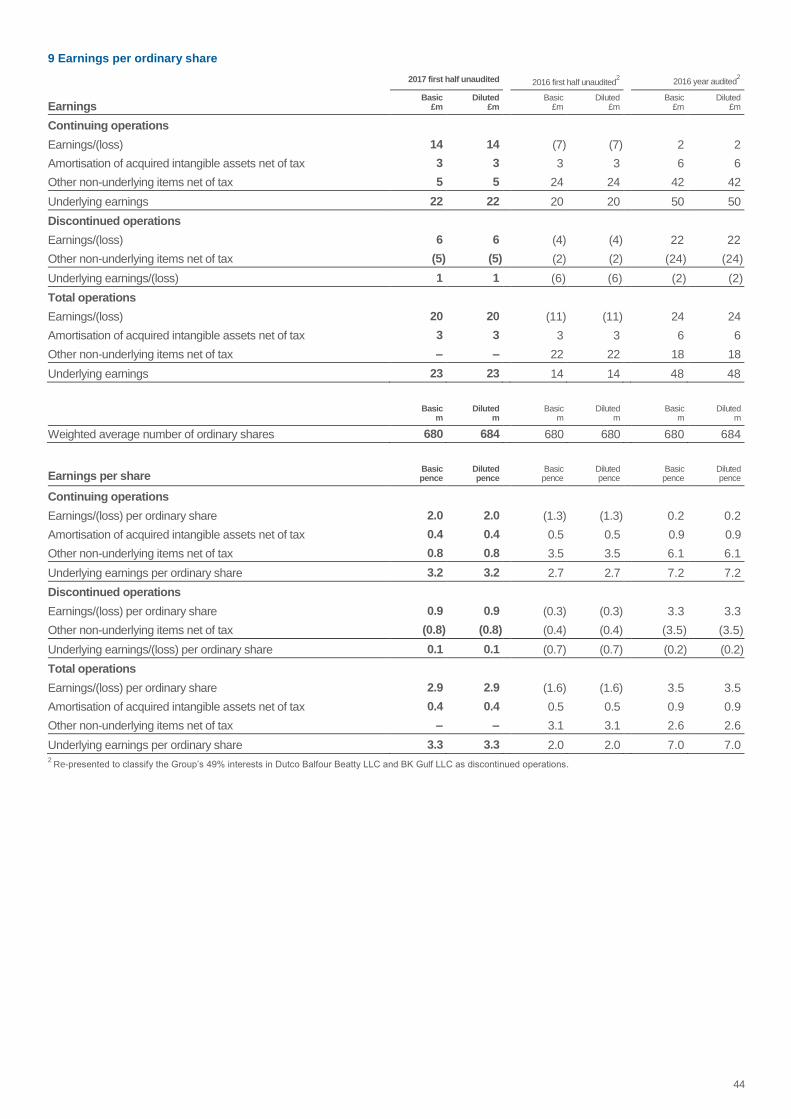
44
9 Earnings per ordinary share
2017 first half unaudited 2016 first half unaudited2 2016 year audited
2
Earnings Basic
£m Diluted
£m Basic
£m Diluted
£m Basic
£m Diluted
£m
Continuing operations
Earnings/(loss) 14 14 (7) (7) 2 2
Amortisation of acquired intangible assets net of tax 3 3 3 3 6 6
Other non-underlying items net of tax 5 5 24 24 42 42
Underlying earnings 22 22 20 20 50 50
Discontinued operations
Earnings/(loss) 6 6 (4) (4) 22 22
Other non-underlying items net of tax (5) (5) (2) (2) (24) (24)
Underlying earnings/(loss) 1 1 (6) (6) (2) (2)
Total operations
Earnings/(loss) 20 20 (11) (11) 24 24
Amortisation of acquired intangible assets net of tax 3 3 3 3 6 6
Other non-underlying items net of tax – – 22 22 18 18
Underlying earnings 23 23 14 14 48 48
Basic
m Diluted
m Basic
m Diluted
m Basic
m Diluted
m
Weighted average number of ordinary shares 680 684 680 680 680 684
Earnings per share Basic pence
Diluted pence
Basic pence
Diluted pence
Basic pence
Diluted pence
Continuing operations
Earnings/(loss) per ordinary share 2.0 2.0 (1.3) (1.3) 0.2 0.2
Amortisation of acquired intangible assets net of tax 0.4 0.4 0.5 0.5 0.9 0.9
Other non-underlying items net of tax 0.8 0.8 3.5 3.5 6.1 6.1
Underlying earnings per ordinary share 3.2 3.2 2.7 2.7 7.2 7.2
Discontinued operations
Earnings/(loss) per ordinary share 0.9 0.9 (0.3) (0.3) 3.3 3.3
Other non-underlying items net of tax (0.8) (0.8) (0.4) (0.4) (3.5) (3.5)
Underlying earnings/(loss) per ordinary share 0.1 0.1 (0.7) (0.7) (0.2) (0.2)
Total operations
Earnings/(loss) per ordinary share 2.9 2.9 (1.6) (1.6) 3.5 3.5
Amortisation of acquired intangible assets net of tax 0.4 0.4 0.5 0.5 0.9 0.9
Other non-underlying items net of tax – – 3.1 3.1 2.6 2.6
Underlying earnings per ordinary share 3.3 3.3 2.0 2.0 7.0 7.0 2
Re-presented to classify the Group’s 49% interests in Dutco Balfour Beatty LLC and BK Gulf LLC as discontinued operations.
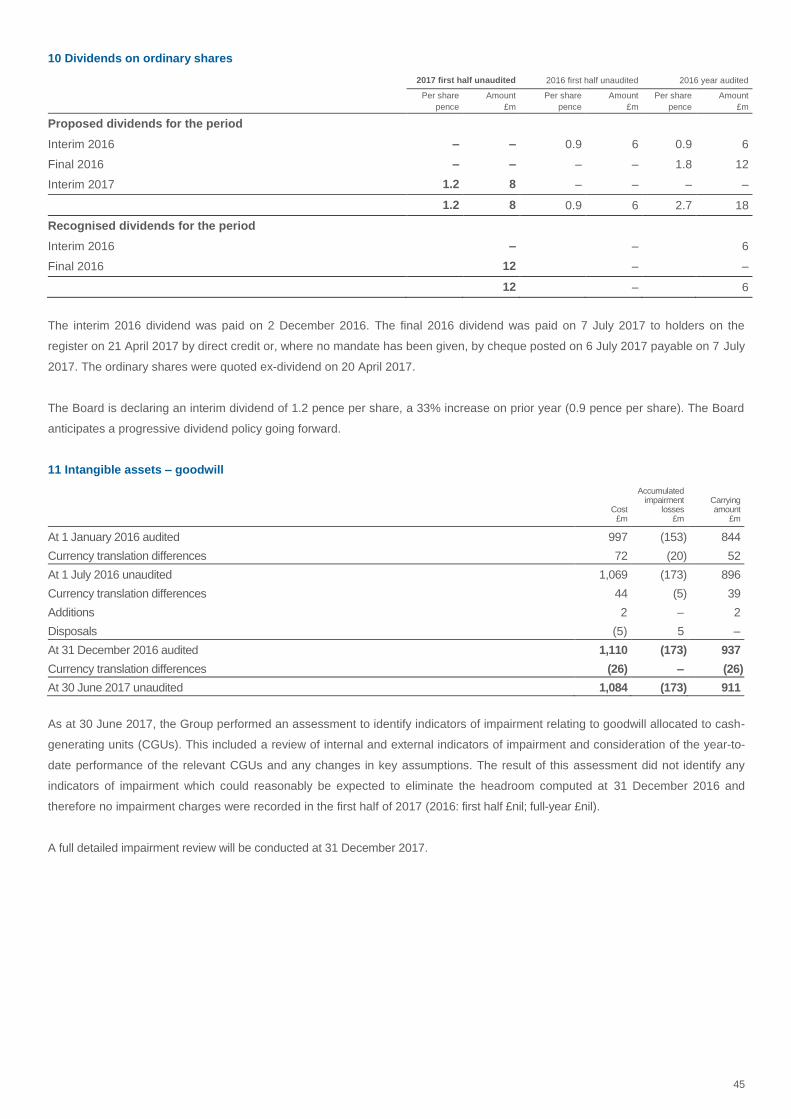
45
10 Dividends on ordinary shares
2017 first half unaudited 2016 first half unaudited 2016 year audited
Per share
pence
Amount
£m
Per share
pence
Amount
£m
Per share
pence
Amount
£m
Proposed dividends for the period
Interim 2016 – – 0.9 6 0.9 6
Final 2016 – – – – 1.8 12
Interim 2017 1.2 8 – – – –
1.2 8 0.9 6 2.7 18
Recognised dividends for the period
Interim 2016 – – 6
Final 2016 12 – –
12 – 6
The interim 2016 dividend was paid on 2 December 2016. The final 2016 dividend was paid on 7 July 2017 to holders on the
register on 21 April 2017 by direct credit or, where no mandate has been given, by cheque posted on 6 July 2017 payable on 7 July
2017. The ordinary shares were quoted ex-dividend on 20 April 2017.
The Board is declaring an interim dividend of 1.2 pence per share, a 33% increase on prior year (0.9 pence per share). The Board
anticipates a progressive dividend policy going forward.
11 Intangible assets – goodwill
Cost
£m
Accumulated impairment
losses £m
Carrying amount
£m
At 1 January 2016 audited 997 (153) 844
Currency translation differences 72 (20) 52
At 1 July 2016 unaudited 1,069 (173) 896
Currency translation differences 44 (5) 39
Additions 2 – 2
Disposals (5) 5 –
At 31 December 2016 audited 1,110 (173) 937
Currency translation differences (26) – (26)
At 30 June 2017 unaudited 1,084 (173) 911
As at 30 June 2017, the Group performed an assessment to identify indicators of impairment relating to goodwill allocated to cash-
generating units (CGUs). This included a review of internal and external indicators of impairment and consideration of the year-to-
date performance of the relevant CGUs and any changes in key assumptions. The result of this assessment did not identify any
indicators of impairment which could reasonably be expected to eliminate the headroom computed at 31 December 2016 and
therefore no impairment charges were recorded in the first half of 2017 (2016: first half £nil; full-year £nil).
A full detailed impairment review will be conducted at 31 December 2017.
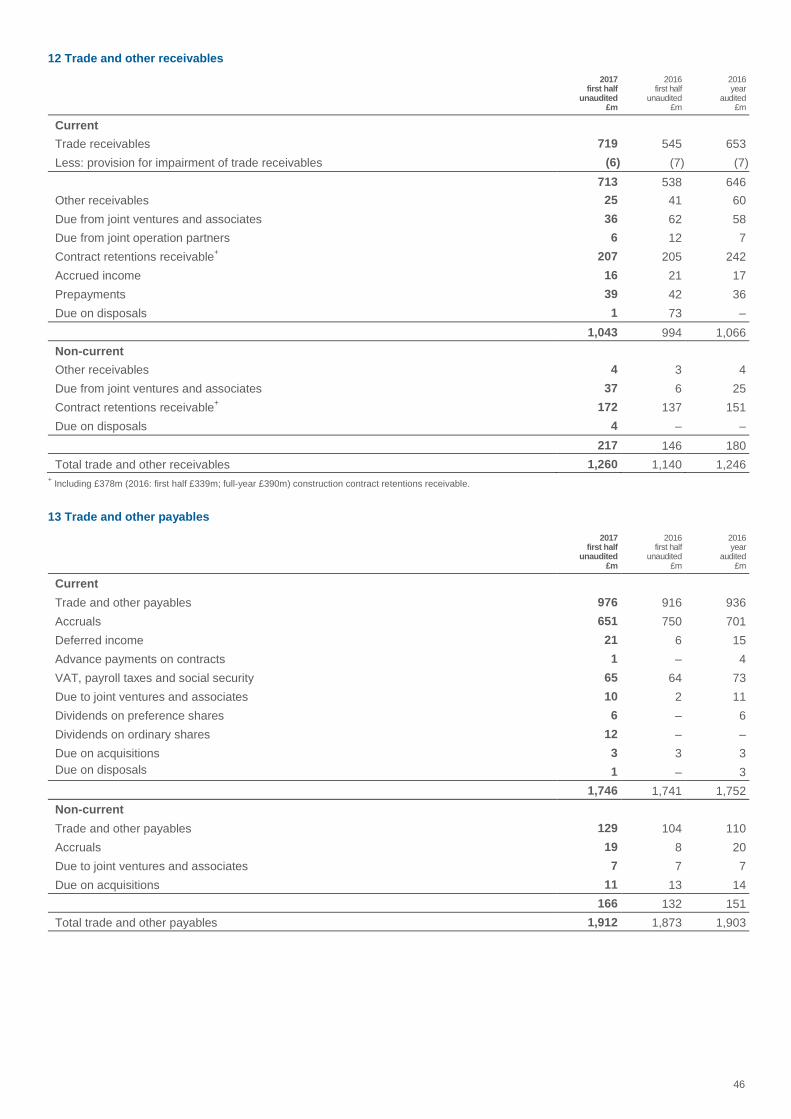
46
12 Trade and other receivables
2017 first half
unaudited £m
2016 first half
unaudited £m
2016 year
audited £m
Current
Trade receivables 719 545 653
Less: provision for impairment of trade receivables (6) (7) (7)
713 538 646
Other receivables 25 41 60
Due from joint ventures and associates 36 62 58
Due from joint operation partners 6 12 7
Contract retentions receivable+ 207 205 242
Accrued income 16 21 17
Prepayments 39 42 36
Due on disposals 1 73 –
1,043 994 1,066
Non-current
Other receivables 4 3 4
Due from joint ventures and associates 37 6 25
Contract retentions receivable+ 172 137 151
Due on disposals 4 – –
217 146 180
Total trade and other receivables 1,260 1,140 1,246 + Including £378m (2016: first half £339m; full-year £390m) construction contract retentions receivable.
13 Trade and other payables
2017 first half
unaudited £m
2016 first half
unaudited £m
2016 year
audited £m
Current
Trade and other payables 976 916 936
Accruals 651 750 701
Deferred income 21 6 15
Advance payments on contracts 1 – 4
VAT, payroll taxes and social security 65 64 73
Due to joint ventures and associates 10 2 11
Dividends on preference shares 6 – 6
Dividends on ordinary shares 12 – –
Due on acquisitions 3 3 3
Due on disposals
1 – 3
1,746 1,741 1,752
Non-current
Trade and other payables 129 104 110
Accruals 19 8 20
Due to joint ventures and associates 7 7 7
Due on acquisitions 11 13 14
166 132 151
Total trade and other payables 1,912 1,873 1,903
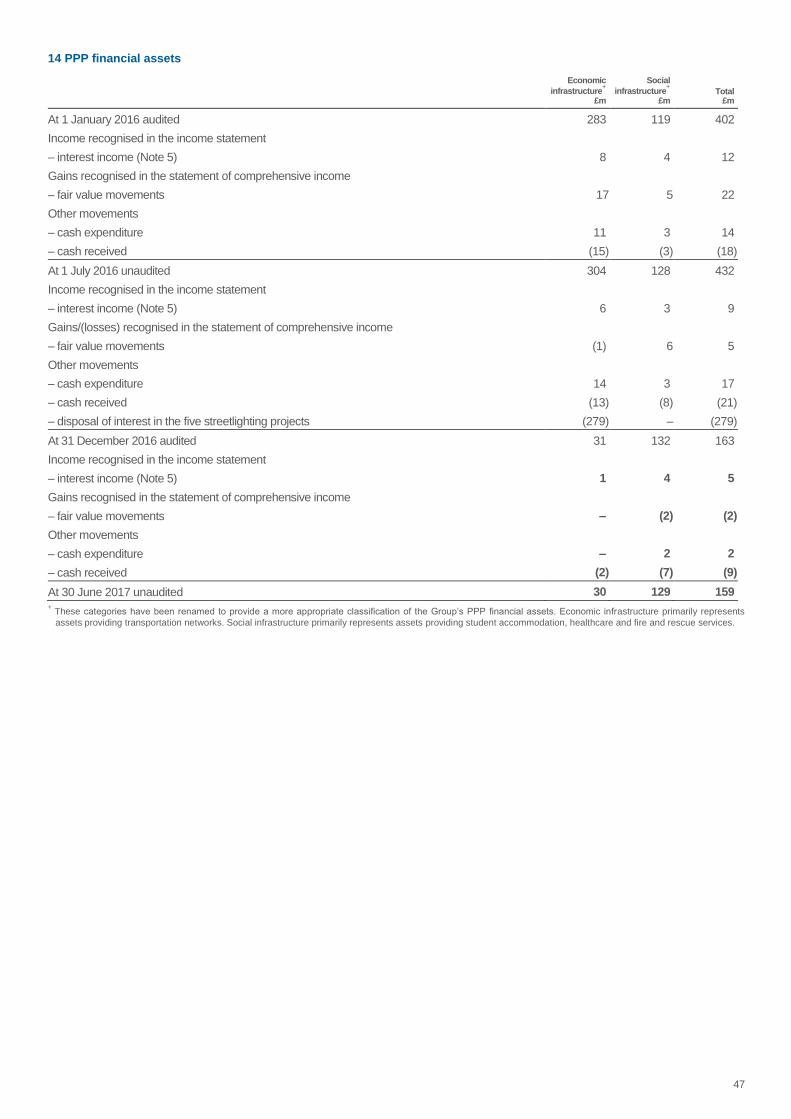
47
14 PPP financial assets
Economic
infrastructure+
£m
Social
infrastructure+
£m Total
£m
At 1 January 2016 audited 283 119 402
Income recognised in the income statement
– interest income (Note 5) 8 4 12
Gains recognised in the statement of comprehensive income
– fair value movements 17 5 22
Other movements
– cash expenditure 11 3 14
– cash received (15) (3) (18)
At 1 July 2016 unaudited 304 128 432
Income recognised in the income statement
– interest income (Note 5) 6 3 9
Gains/(losses) recognised in the statement of comprehensive income
– fair value movements (1) 6 5
Other movements
– cash expenditure 14 3 17
– cash received (13) (8) (21)
– disposal of interest in the five streetlighting projects (279) – (279)
At 31 December 2016 audited 31 132 163
Income recognised in the income statement
– interest income (Note 5) 1 4 5
Gains recognised in the statement of comprehensive income
– fair value movements – (2) (2)
Other movements
– cash expenditure – 2 2
– cash received (2) (7) (9)
At 30 June 2017 unaudited 30 129 159 +
These categories have been renamed to provide a more appropriate classification of the Group’s PPP financial assets. Economic infrastructure primarily represents
assets providing transportation networks. Social infrastructure primarily represents assets providing student accommodation, healthcare and fire and rescue services.
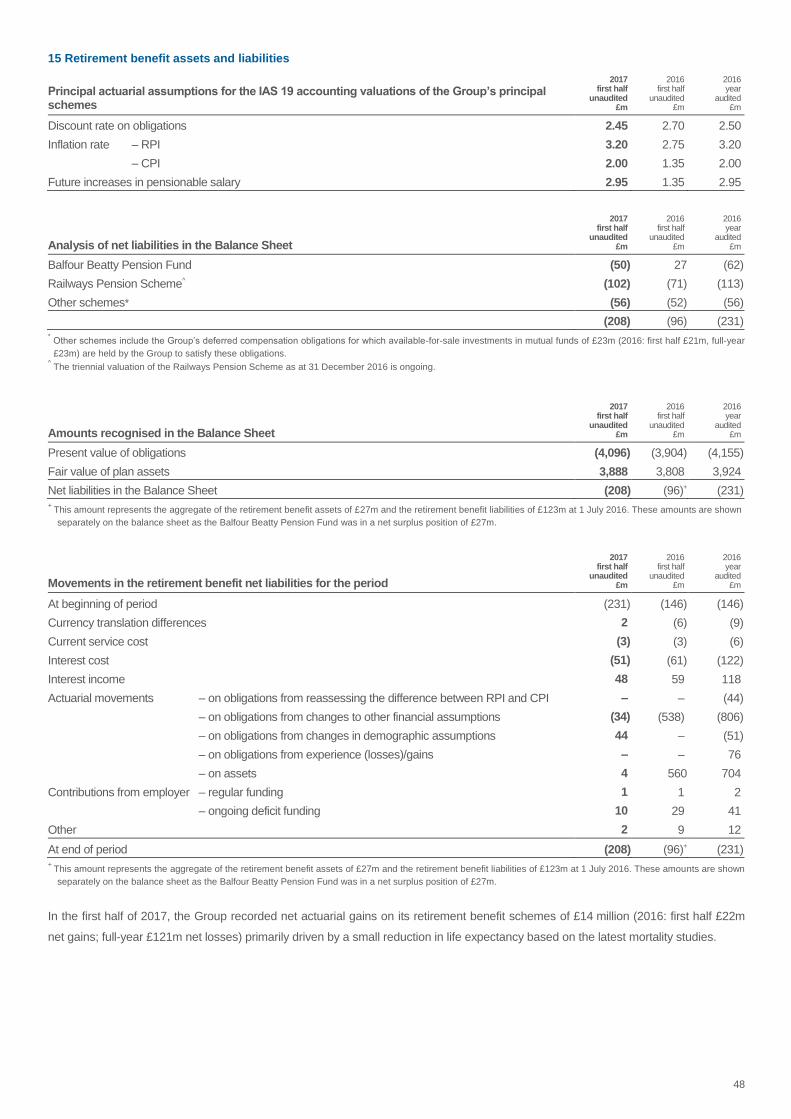
48
15 Retirement benefit assets and liabilities
Principal actuarial assumptions for the IAS 19 accounting valuations of the Group’s principal schemes
2017 first half
unaudited £m
2016 first half
unaudited £m
2016 year
audited £m
Discount rate on obligations 2.45 2.70 2.50
Inflation rate – RPI 3.20 2.75 3.20
– CPI 2.00 1.35 2.00
Future increases in pensionable salary 2.95 1.35 2.95
Analysis of net liabilities in the Balance Sheet
2017 first half
unaudited £m
2016 first half
unaudited £m
2016 year
audited £m
Balfour Beatty Pension Fund (50) 27 (62)
Railways Pension Scheme^ (102) (71) (113)
Other schemes* (56) (52) (56)
(208) (96) (231) * Other schemes include the Group’s deferred compensation obligations for which available-for-sale investments in mutual funds of £23m (2016: first half £21m, full-year
£23m) are held by the Group to satisfy these obligations. ^ The triennial valuation of the Railways Pension Scheme as at 31 December 2016 is ongoing.
Amounts recognised in the Balance Sheet
2017 first half
unaudited £m
2016 first half
unaudited £m
2016 year
audited £m
Present value of obligations (4,096) (3,904) (4,155)
Fair value of plan assets 3,888 3,808 3,924
Net liabilities in the Balance Sheet (208) (96)+ (231) +
This amount represents the aggregate of the retirement benefit assets of £27m and the retirement benefit liabilities of £123m at 1 July 2016. These amounts are shown
separately on the balance sheet as the Balfour Beatty Pension Fund was in a net surplus position of £27m.
Movements in the retirement benefit net liabilities for the period
2017 first half
unaudited £m
2016 first half
unaudited £m
2016 year
audited £m
At beginning of period (231) (146) (146)
Currency translation differences 2 (6) (9)
Current service cost (3) (3) (6)
Interest cost (51) (61) (122)
Interest income 48 59 118
Actuarial movements – on obligations from reassessing the difference between RPI and CPI – – (44)
– on obligations from changes to other financial assumptions (34) (538) (806)
– on obligations from changes in demographic assumptions 44 – (51)
– on obligations from experience (losses)/gains – – 76
– on assets 4 560 704
Contributions from employer – regular funding 1 1 2
– ongoing deficit funding 10 29 41
Other 2 9 12
At end of period (208) (96)+ (231) +
This amount represents the aggregate of the retirement benefit assets of £27m and the retirement benefit liabilities of £123m at 1 July 2016. These amounts are shown
separately on the balance sheet as the Balfour Beatty Pension Fund was in a net surplus position of £27m.
In the first half of 2017, the Group recorded net actuarial gains on its retirement benefit schemes of £14 million (2016: first half £22m
net gains; full-year £121m net losses) primarily driven by a small reduction in life expectancy based on the latest mortality studies.
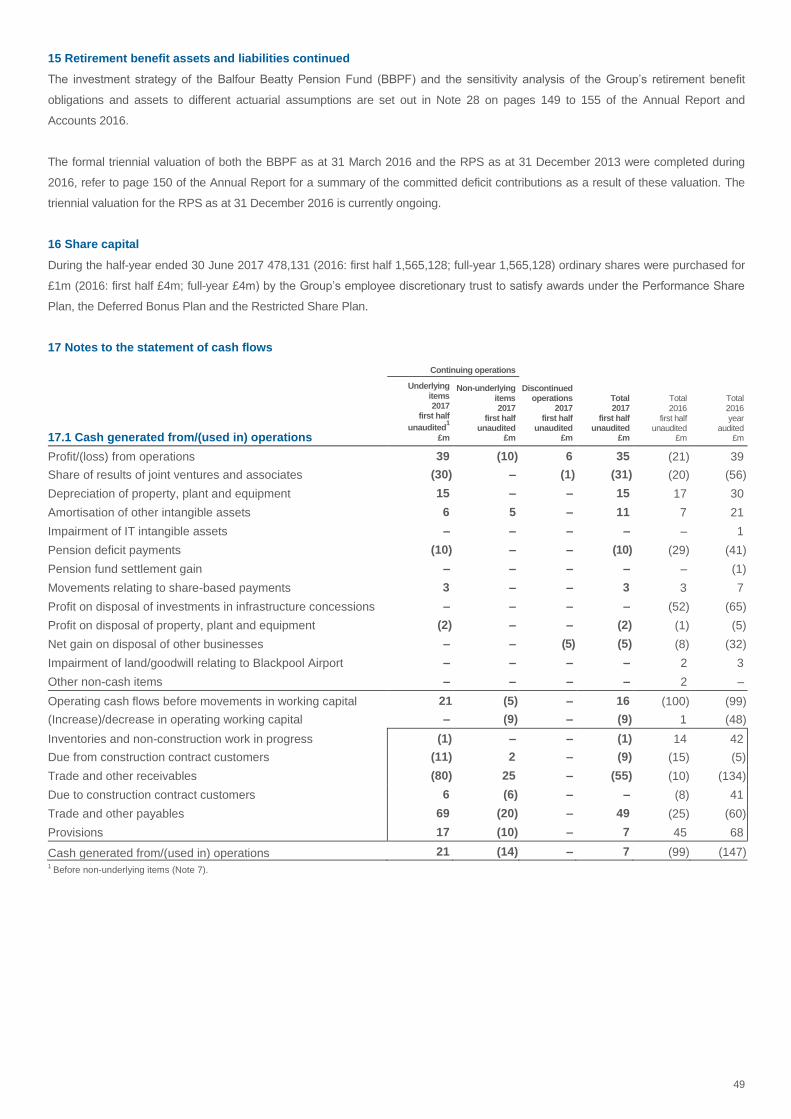
49
15 Retirement benefit assets and liabilities continued
The investment strategy of the Balfour Beatty Pension Fund (BBPF) and the sensitivity analysis of the Group’s retirement benefit
obligations and assets to different actuarial assumptions are set out in Note 28 on pages 149 to 155 of the Annual Report and
Accounts 2016.
The formal triennial valuation of both the BBPF as at 31 March 2016 and the RPS as at 31 December 2013 were completed during
2016, refer to page 150 of the Annual Report for a summary of the committed deficit contributions as a result of these valuation. The
triennial valuation for the RPS as at 31 December 2016 is currently ongoing.
16 Share capital
During the half-year ended 30 June 2017 478,131 (2016: first half 1,565,128; full-year 1,565,128) ordinary shares were purchased for
£1m (2016: first half £4m; full-year £4m) by the Group’s employee discretionary trust to satisfy awards under the Performance Share
Plan, the Deferred Bonus Plan and the Restricted Share Plan.
17 Notes to the statement of cash flows
Continuing operations
17.1 Cash generated from/(used in) operations
Underlying items 2017
first half
unaudited1
£m
Non-underlying items 2017
first half unaudited
£m
Discontinued operations
2017 first half
unaudited £m
Total 2017
first half unaudited
£m
Total 2016
first half unaudited
£m
Total 2016 year
audited £m
Profit/(loss) from operations 39 (10) 6 35 (21) 39
Share of results of joint ventures and associates (30) – (1) (31) (20) (56)
Depreciation of property, plant and equipment 15 – – 15 17 30
Amortisation of other intangible assets 6 5 – 11 7 21
Impairment of IT intangible assets – – – – – 1
Pension deficit payments (10) – – (10) (29) (41)
Pension fund settlement gain – – – – – (1)
Movements relating to share-based payments 3 – – 3 3 7
Profit on disposal of investments in infrastructure concessions – – – – (52) (65)
Profit on disposal of property, plant and equipment (2) – – (2) (1) (5)
Net gain on disposal of other businesses – – (5) (5) (8) (32)
Impairment of land/goodwill relating to Blackpool Airport – – – – 2 3
Other non-cash items – – – – 2 –
Operating cash flows before movements in working capital 21 (5) – 16 (100) (99)
(Increase)/decrease in operating working capital – (9) – (9) 1 (48)
Inventories and non-construction work in progress (1) – – (1) 14 42
Due from construction contract customers (11) 2 – (9) (15) (5)
Trade and other receivables (80) 25 – (55) (10) (134)
Due to construction contract customers 6 (6) – – (8) 41
Trade and other payables 69 (20) – 49 (25) (60)
Provisions 17 (10) – 7 45 68
Cash generated from/(used in) operations 21 (14) – 7 (99) (147) 1 Before non-underlying items (Note 7).
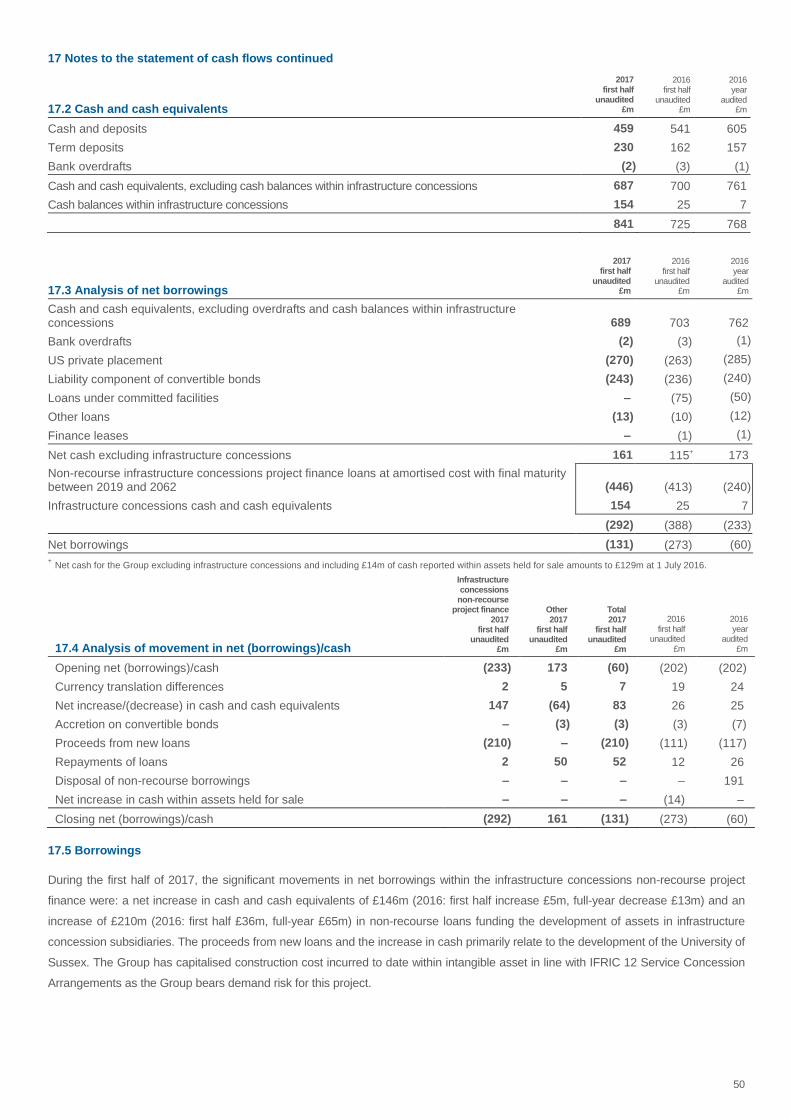
50
17 Notes to the statement of cash flows continued
17.2 Cash and cash equivalents
2017 first half
unaudited £m
2016 first half
unaudited £m
2016 year
audited £m
Cash and deposits 459 541 605
Term deposits 230 162 157
Bank overdrafts (2) (3) (1)
Cash and cash equivalents, excluding cash balances within infrastructure concessions 687 700 761
Cash balances within infrastructure concessions 154 25 7
841 725 768
17.3 Analysis of net borrowings
2017 first half
unaudited £m
2016 first half
unaudited £m
2016 year
audited £m
Cash and cash equivalents, excluding overdrafts and cash balances within infrastructure concessions 689 703
762
Bank overdrafts (2) (3) (1)
US private placement (270) (263) (285)
Liability component of convertible bonds (243) (236) (240)
Loans under committed facilities – (75) (50)
Other loans (13) (10) (12)
Finance leases – (1) (1)
Net cash excluding infrastructure concessions 161 115+ 173
Non-recourse infrastructure concessions project finance loans at amortised cost with final maturity between 2019 and 2062 (446) (413) (240)
Infrastructure concessions cash and cash equivalents 154 25 7
(292) (388) (233)
Net borrowings (131) (273) (60)
+ Net cash for the Group excluding infrastructure concessions and including £14m of cash reported within assets held for sale amounts to £129m at 1 July 2016.
17.4 Analysis of movement in net (borrowings)/cash
Infrastructure concessions
non-recourse project finance
2017 first half
unaudited £m
Other 2017
first half unaudited
£m
Total 2017
first half unaudited
£m
2016 first half
unaudited £m
2016 year
audited £m
Opening net (borrowings)/cash (233) 173 (60) (202) (202)
Currency translation differences 2 5 7 19 24
Net increase/(decrease) in cash and cash equivalents 147 (64) 83 26 25
Accretion on convertible bonds – (3) (3) (3) (7)
Proceeds from new loans (210) – (210) (111) (117)
Repayments of loans 2 50 52 12 26
Disposal of non-recourse borrowings – – – – 191
Net increase in cash within assets held for sale – – – (14) –
Closing net (borrowings)/cash (292) 161 (131) (273) (60)
17.5 Borrowings
During the first half of 2017, the significant movements in net borrowings within the infrastructure concessions non-recourse project
finance were: a net increase in cash and cash equivalents of £146m (2016: first half increase £5m, full-year decrease £13m) and an
increase of £210m (2016: first half £36m, full-year £65m) in non-recourse loans funding the development of assets in infrastructure
concession subsidiaries. The proceeds from new loans and the increase in cash primarily relate to the development of the University of
Sussex. The Group has capitalised construction cost incurred to date within intangible asset in line with IFRIC 12 Service Concession
Arrangements as the Group bears demand risk for this project.
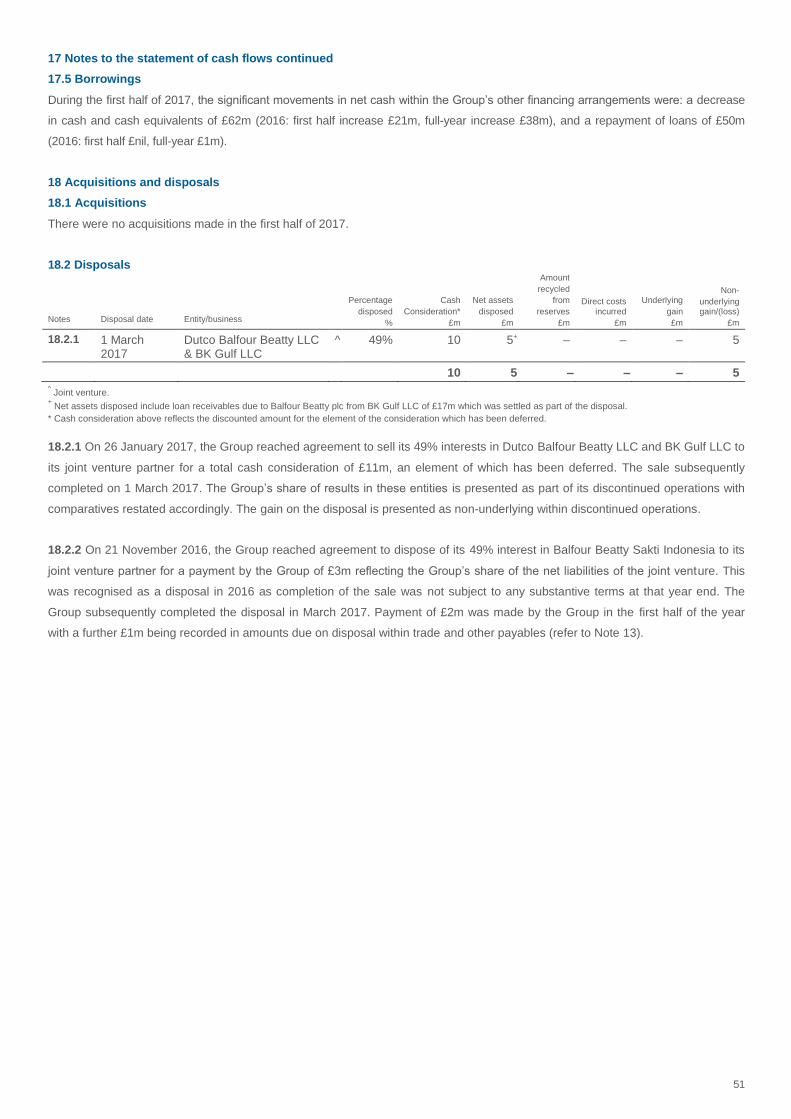
51
17 Notes to the statement of cash flows continued
17.5 Borrowings
During the first half of 2017, the significant movements in net cash within the Group’s other financing arrangements were: a decrease
in cash and cash equivalents of £62m (2016: first half increase £21m, full-year increase £38m), and a repayment of loans of £50m
(2016: first half £nil, full-year £1m).
18 Acquisitions and disposals
18.1 Acquisitions
There were no acquisitions made in the first half of 2017.
18.2 Disposals
Notes Disposal date Entity/business
Percentage
disposed
%
Cash
Consideration*
£m
Net assets
disposed
£m
Amount
recycled
from
reserves
£m
Direct costs incurred
£m
Underlying
gain
£m
Non-
underlying gain/(loss)
£m
18.2.1 1 March 2017
Dutco Balfour Beatty LLC & BK Gulf LLC
^ 49% 10 5+ – – – 5
10 5 – – – 5 ^ Joint venture.
+ Net assets disposed include loan receivables due to Balfour Beatty plc from BK Gulf LLC of £17m which was settled as part of the disposal.
* Cash consideration above reflects the discounted amount for the element of the consideration which has been deferred.
18.2.1 On 26 January 2017, the Group reached agreement to sell its 49% interests in Dutco Balfour Beatty LLC and BK Gulf LLC to
its joint venture partner for a total cash consideration of £11m, an element of which has been deferred. The sale subsequently
completed on 1 March 2017. The Group’s share of results in these entities is presented as part of its discontinued operations with
comparatives restated accordingly. The gain on the disposal is presented as non-underlying within discontinued operations.
18.2.2 On 21 November 2016, the Group reached agreement to dispose of its 49% interest in Balfour Beatty Sakti Indonesia to its
joint venture partner for a payment by the Group of £3m reflecting the Group’s share of the net liabilities of the joint venture. This
was recognised as a disposal in 2016 as completion of the sale was not subject to any substantive terms at that year end. The
Group subsequently completed the disposal in March 2017. Payment of £2m was made by the Group in the first half of the year
with a further £1m being recorded in amounts due on disposal within trade and other payables (refer to Note 13).
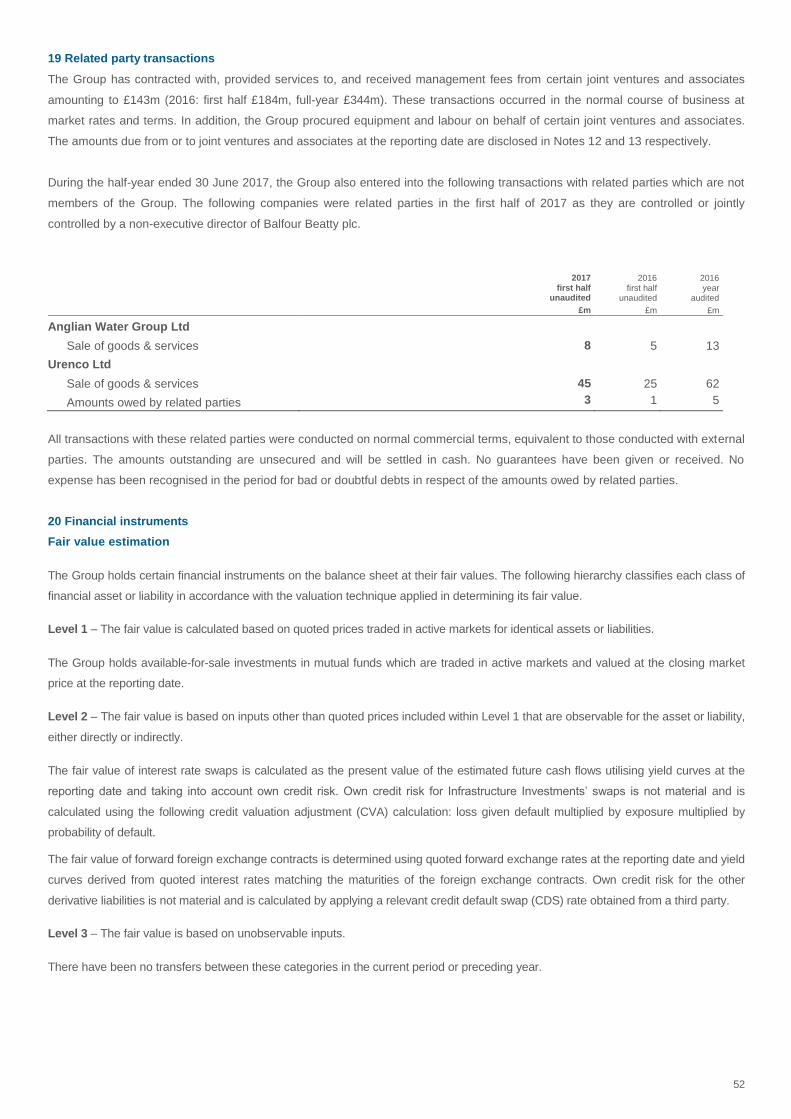
52
19 Related party transactions
The Group has contracted with, provided services to, and received management fees from certain joint ventures and associates
amounting to £143m (2016: first half £184m, full-year £344m). These transactions occurred in the normal course of business at
market rates and terms. In addition, the Group procured equipment and labour on behalf of certain joint ventures and associates.
The amounts due from or to joint ventures and associates at the reporting date are disclosed in Notes 12 and 13 respectively.
During the half-year ended 30 June 2017, the Group also entered into the following transactions with related parties which are not
members of the Group. The following companies were related parties in the first half of 2017 as they are controlled or jointly
controlled by a non-executive director of Balfour Beatty plc.
2017
first half unaudited
£m
2016
first half unaudited
£m
2016 year
audited
£m
Anglian Water Group Ltd
Sale of goods & services 8 5 13
Urenco Ltd
Sale of goods & services 45 25 62
Amounts owed by related parties 3 1 5
All transactions with these related parties were conducted on normal commercial terms, equivalent to those conducted with external
parties. The amounts outstanding are unsecured and will be settled in cash. No guarantees have been given or received. No
expense has been recognised in the period for bad or doubtful debts in respect of the amounts owed by related parties.
20 Financial instruments
Fair value estimation
The Group holds certain financial instruments on the balance sheet at their fair values. The following hierarchy classifies each class of
financial asset or liability in accordance with the valuation technique applied in determining its fair value.
Level 1 – The fair value is calculated based on quoted prices traded in active markets for identical assets or liabilities.
The Group holds available-for-sale investments in mutual funds which are traded in active markets and valued at the closing market
price at the reporting date.
Level 2 – The fair value is based on inputs other than quoted prices included within Level 1 that are observable for the asset or liability,
either directly or indirectly.
The fair value of interest rate swaps is calculated as the present value of the estimated future cash flows utilising yield curves at the
reporting date and taking into account own credit risk. Own credit risk for Infrastructure Investments’ swaps is not material and is
calculated using the following credit valuation adjustment (CVA) calculation: loss given default multiplied by exposure multiplied by
probability of default.
The fair value of forward foreign exchange contracts is determined using quoted forward exchange rates at the reporting date and yield
curves derived from quoted interest rates matching the maturities of the foreign exchange contracts. Own credit risk for the other
derivative liabilities is not material and is calculated by applying a relevant credit default swap (CDS) rate obtained from a third party.
Level 3 – The fair value is based on unobservable inputs.
There have been no transfers between these categories in the current period or preceding year.
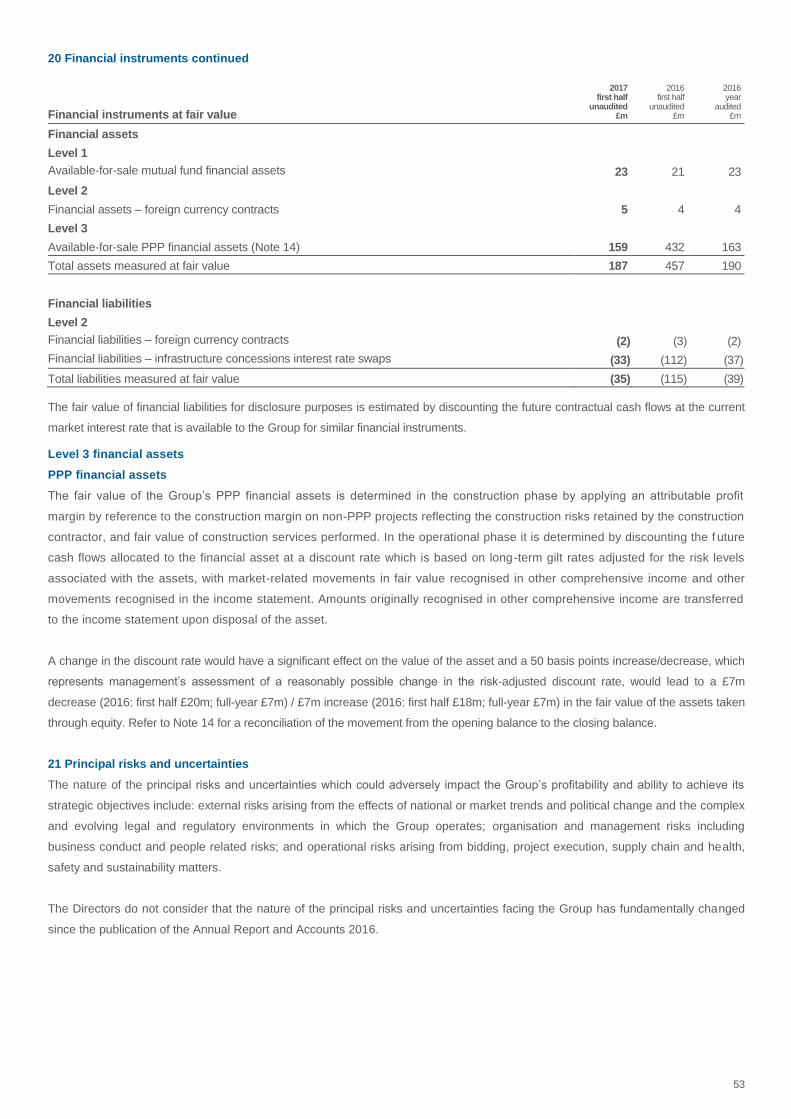
53
20 Financial instruments continued
Financial instruments at fair value
2017 first half
unaudited £m
2016 first half
unaudited £m
2016 year
audited £m
Financial assets
Level 1
Available-for-sale mutual fund financial assets 23 21 23
Level 2
Financial assets – foreign currency contracts 5 4 4
Level 3
Available-for-sale PPP financial assets (Note 14) 159 432 163
Total assets measured at fair value 187 457 190
Financial liabilities
Level 2
Financial liabilities – foreign currency contracts (2) (3) (2)
Financial liabilities – infrastructure concessions interest rate swaps (33) (112) (37)
Total liabilities measured at fair value (35) (115) (39)
The fair value of financial liabilities for disclosure purposes is estimated by discounting the future contractual cash flows at the current
market interest rate that is available to the Group for similar financial instruments.
Level 3 financial assets
PPP financial assets
The fair value of the Group’s PPP financial assets is determined in the construction phase by applying an attributable profit
margin by reference to the construction margin on non-PPP projects reflecting the construction risks retained by the construction
contractor, and fair value of construction services performed. In the operational phase it is determined by discounting the f uture
cash flows allocated to the financial asset at a discount rate which is based on long-term gilt rates adjusted for the risk levels
associated with the assets, with market-related movements in fair value recognised in other comprehensive income and other
movements recognised in the income statement. Amounts originally recognised in other comprehensive income are transferred
to the income statement upon disposal of the asset.
A change in the discount rate would have a significant effect on the value of the asset and a 50 basis points increase/decrease, which
represents management’s assessment of a reasonably possible change in the risk-adjusted discount rate, would lead to a £7m
decrease (2016: first half £20m; full-year £7m) / £7m increase (2016: first half £18m; full-year £7m) in the fair value of the assets taken
through equity. Refer to Note 14 for a reconciliation of the movement from the opening balance to the closing balance.
21 Principal risks and uncertainties
The nature of the principal risks and uncertainties which could adversely impact the Group’s profitability and ability to achieve its
strategic objectives include: external risks arising from the effects of national or market trends and political change and the complex
and evolving legal and regulatory environments in which the Group operates; organisation and management risks including
business conduct and people related risks; and operational risks arising from bidding, project execution, supply chain and health,
safety and sustainability matters.
The Directors do not consider that the nature of the principal risks and uncertainties facing the Group has fundamentally changed
since the publication of the Annual Report and Accounts 2016.

54
22 Contingent liabilities
The Group and certain subsidiary undertakings have, in the normal course of business, given guarantees and entered into counter-
indemnities in respect of bonds relating to the Group’s own contracts and given guarantees in respect of their share of certa in
contractual obligations of joint ventures and associates and certain retirement benefit liabilities of the Balfour Beatty Pension Fund
and the Railways Pension Scheme. Guarantees are treated as contingent liabilities until such time as it becomes probable payment
will be required under the terms of the guarantee.
Provision has been made for the Directors’ best estimate of known legal claims, investigations and legal actions in progress. The
Group takes legal advice as to the likelihood of success of claims and actions and no provision is made where the Directors
consider, based on that advice, that the action is unlikely to succeed, or that the Group cannot make a sufficiently reliable estimate
of the potential obligation.
23 Events after the reporting date
There are no material post balance sheet events between the balance sheet date and the date of this report.