Embed Size (px)
Citation preview

BALL CORPORATION 2014 Sustainability Report

CONTACTWe welcome your comments and questions on our sustainability efforts. Please direct them to [email protected].
BALL.COM/SUSTAINABILITY More detail on our sustainability performance, best practices and updates on our progress are available at www.ball.com/sustainability.
Throughout this report, this symbol references additional online content.
EXTERNAL ASSESSMENTSBall’s sustainability management and performance are regularly reviewed by third parties. During the reporting period, external experts again recognized the progress we have achieved thus far.
This is Ball Corporation’s fourth biennial sustainability report, covering calendar years 2012 and 2013. It complements our financial reporting and covers the sustainability topics Ball and our stakeholders confirmed in 2013 to be most material to our company. Customers, employees, investors and suppliers represent the primary audience for our reporting.
Unless otherwise stated, we are reporting information globally from operations of which we have operational control, including joint ventures where we are the majority owner and major administrative offices. An external assurance statement and further details on reporting principles, boundaries and data normalization are available at www.ball.com/sustainability.
Our reporting has been prepared in accordance with the sustainability reporting guide-lines of the Global Reporting Initiative (G4) at the “Core” level. A detailed GRI Content Index is provided online.
Climate Innovation Indexesmaplecroft™
SUSTAINABILITY MANAGEMENT
26
OPERATIONS
14
RECYCLING
22
TALENT MANAGEMENT
18
About Our Reporting
COMMUNITY
20
LIFE CYCLE PERSPECTIVE
8
CEO PERSPECTIVE 1
BALL PROFILE 2
OUR STRATEGY
6
SUPPLY CHAIN
10
INNOVATION
12

CEO Perspective
At Ball Corporation, sustainability has been a part of who we are for more than 134 years. An important aspect of Ball’s Drive for 10 vision—the careful and deliberate balance of our economic, environmental and social impacts—will help create long-term shared value for the company and its stakeholders so we can thrive for another century. While we remain grounded in our values, we continue to adapt to new situations as the world around us and the expectations of our stakehold-ers change.
Though we encountered several challenges, we have made considerable progress on our sustainability journey since issuing our last report. In fact, our commitment to sustainability has never been stronger due to the value it creates, including greater customer satisfac-tion, enhanced employee engagement and improved financial results. A few highlights from the reporting period include:
• Ball’s listing in the prestigious Dow Jones Sustain ability Index as the industry leader in the containers and packaging industry.
• More than 11,500 employees participated in Ball’s first global employee engagement survey. We learned that
employees are very engaged, truly believe in our values and feel empowered to do their jobs, but see opportu-nities for improvement in communication, performance management and recognition.
• Our employees’ creativity and commitment to our energy efficiency goals, combined with investments and sharing of best practices, contributed to a 7 percent improvement in energy efficiency in our can businesses since 2010.
• The Ball Foundation awarded approximately $2.4 million to nonprofit organizations operating in com-munities where our employees live and work, focusing on education, recycling and community engagement.
• Our company-wide 2013 total recordable incident rate of 1.6 was 63 percent better than the rates in the entire U.S. manufacturing industries as reported by the U.S. Bureau of Labor Statistics for 2012.
With our ambitious new 2020 carbon footprint reduction target, we are committing to reduce the carbon footprint of our most common beverage can formats per region by 10 percent through efforts that are in our control, includ ing our plants’ energy efficiency and can light-weighting. When combined with our supply chain partners’
efforts that we support, such as increasing packaging recycling, we strive to achieve a total reduction of 25 percent. Multiply these improvements with the 42 billion cans in these formats we manufactured in 2010 and it becomes obvious why we believe this is another mean-ingful step on our sustainability journey.
Partnerships are essential to pioneering innovative solutions that allow us to address some of the sustain-ability challenges we face. You will see many examples of this stronger, more collaborative approach through-out this report. Thanks to these partnerships and the disciplined execution of Ball’s Drive for 10 vision by our 14,500 employees, we are making excellent progress toward our business and sustainability goals, position-ing Ball for continued long-term success.
John A. Hayes Chairman, President and Chief Executive Officer
/ 1

/ 2
Ball Corporation
FOUNDED:
1880BUSINESSES:
Metal Beverage Packaging
Metal Food & Household Products Packaging
Aerospace
Drive For 10 is a mindset around perfection, with a greater sense of urgency around future success.
We know who we are. Proud of our rich history, we recognize the whole of our company is greater than the sum of its parts. Most importantly, we believe in our people, our culture and our ability to deliver value to all our stakeholders. Though we encourage and embrace our diversity of thought, business, location and language, we are “One Ball,” valuing:
• Uncompromising Integrity • Being Close to Our Customers • Focusing on Attention to Detail • Behaving Like Owners • Being Innovative
We know where we are going. We want to be the best at everything we do, and will continually strive for perfection at Ball as we pursue our strategy of:
Maximizing value in our existing businesses
Expanding into new products and capabilities
Aligning ourselves with the right customers and markets
Broadening our geographic reach
Leveraging our know-how and technological expertise to provide a competitive advantage
We know what is important. In order to reach our goals, we must excel in these areas:
Customer Focus We must be viewed as a strategic partner at each of our key customers.
Operational Excellence We must be the most competitive in terms of cost, quality and service in all the markets in which we compete by continually driving for efficiencies in all our processes.
Innovation and Business Development We must identify and drive profitable growth.
People and Culture Focus We must have the best people, providing them with the right support, rewards and growth opportunities to thrive.
Sustainability We must balance our economic, environmental and social impacts for greater long-term success.
398
7
21
Locations (Year-End 2013)
37 Metal Beverage Packaging Plants 22 Metal Food & Household Products
Packaging Plants 2 Plastic Packaging Plants 2 Packaging Innovation Centers 6 Major Aerospace Locations 6 Major Offices
71%
18%
11%
BALL EMPLOYEES BY REGION
8,500 North America 3,300 Europe 1,600 Asia 1,100 South America
14,500 EMPLOYEES 59%
23%
10%
8%
2013 NET SALES 14,500 EMPLOYEES
8,200 Metal Beverage Packaging
3,100 Metal Food & Household Products Packaging
2,900 Aerospace
300 Corporate Offices
$8.5 BILLION
71% Metal Beverage Packaging
18% Metal Food & Household Products Packaging
11% Aerospace

• The Joint Polar Satellite System satellite will enable essential data for civil and military weather fore-casting, storm tracking and climate monitoring.
• The Suomi National Polar-orbiting Partnership (Suomi NPP) satellite contributes vital information for severe weather warnings, search and rescue operations, military contingency planning and environmental monitoring.
• The Ozone Mapping and Profiler Suite is one of five instruments flying aboard the Suomi NPP satellite returning detailed information about the Earth’s ozone layer.
• The Global Precipitation Measurement-Microwave Imager improves climate, weather and hydrological predictions by providing more accurate precipitation measurements from space.
• The Geostationary Environment Monitoring Spec-trometer monitors pollution for the Asia-Pacific region. Hourly measurements will improve early warnings for potentially dangerous pollution events and monitor climate change.
• The Operational Land Imager enables the management of natural resources effectively, including helping experts to make routine drought assessments and fire prevention plans and better understand the Earth’s ecosystem.
• A lidar technology instrument is used to study forest carbon and monitor the Earth’s vegetation. When the instrument is flown over forested regions, scien-tists can estimate biomass and investigate biodiver-sity trends.
• Imagery from the WorldView satellites is used for civil government mapping, land-use planning, disaster relief, exploration, defense and intelligence, visualization and simulation environments, and navi-gation technology such as Google Maps.
• The Green Propellant Infusion Mission will demon-strate and test the capabilities of a high-performance, nontoxic, “green” fuel on orbit.
Ball Aerospace is a leader in designing, developing and manufacturing innovative aerospace systems. We produce spacecraft, instruments and sensors, radio frequency and microwave technologies, data exploitation solutions, and a variety of advanced aerospace technologies and products that enable exciting missions.
Ball is known for its contributions in support of space and Earth science, exploration, national security and intelligence programs since 1956. We were also a pioneer in the development of the commercial remote sensing market, producing imaging systems and spacecraft that helped spawn a new market-driven demand for imagery. We employ approximately 2,900 talented engineers, scientists, technicians and support staff.
Rob StrainSenior Vice President,
Ball CorporationPresident,
Ball Aerospace & Technologies Corp.
Full statement available online
“ We develop ground-breaking and innovative spacecraft, sensors, systems and compo-nents that provide critical climate and environmental data to assist policymakers in decision making.”
Ball Aerospace
Ball Aerospace Programs & Sustainability
/ 3

/ 4
• Aluminum and steel cans are 100 percent recyclable and can be infinitely recycled with no loss of quality
• Worldwide, no other packaging container achieves recycling rates as high as those of metal cans
• With the longest shelf life of any package, cans help minimize food and beverage waste
• In just 60 days, cans can be recycled and returned to a store shelf as a new can
• One kilogram of aluminum makes 75 12-ounce beverage cans—one kilogram of glass makes only four 12-ounce bottles
• Due to the high scrap value of metal, cans often subsidize the recovery of other materials
Ball is the world’s largest manufacturer of metal beverage containers. Each year, we produce more than 65 billion aluminum and steel cans in the Americas, Europe and Asia for beverages like beer, carbonated soft drinks, energy drinks, tea, water and wine.
In every step, from concept, design, manufacturing and filling to delivery of the final product to the consumer, innovation helps us identify and drive profitable growth. We work closely with our customers to understand their businesses and consumer demand, as well as the chal-lenges and trends they encounter so we can develop industry-leading packaging solutions and graphics to help them grow their businesses. Ball’s innovation centers, located in the U.S. and Germany, are ideally equipped to meet evolving customer needs.
“ The dedication of our employees is also the reason why I am confident that we will achieve our new Cut/4 CArboN target, which—by the way—also positions us very well when talking to our customers about sustainability.”
Scott Morrison Senior Vice President and Chief Financial OfficerBall Corporation Full statement available online
Global Metal Beverage Packaging
Metal Cans and Sustainability
65 BILLION CONTAINERS MORE THAN
8,200 EMPLOYEES
71% OF 2013 NET SALES
PLANTS IN 10 COUNTRIES
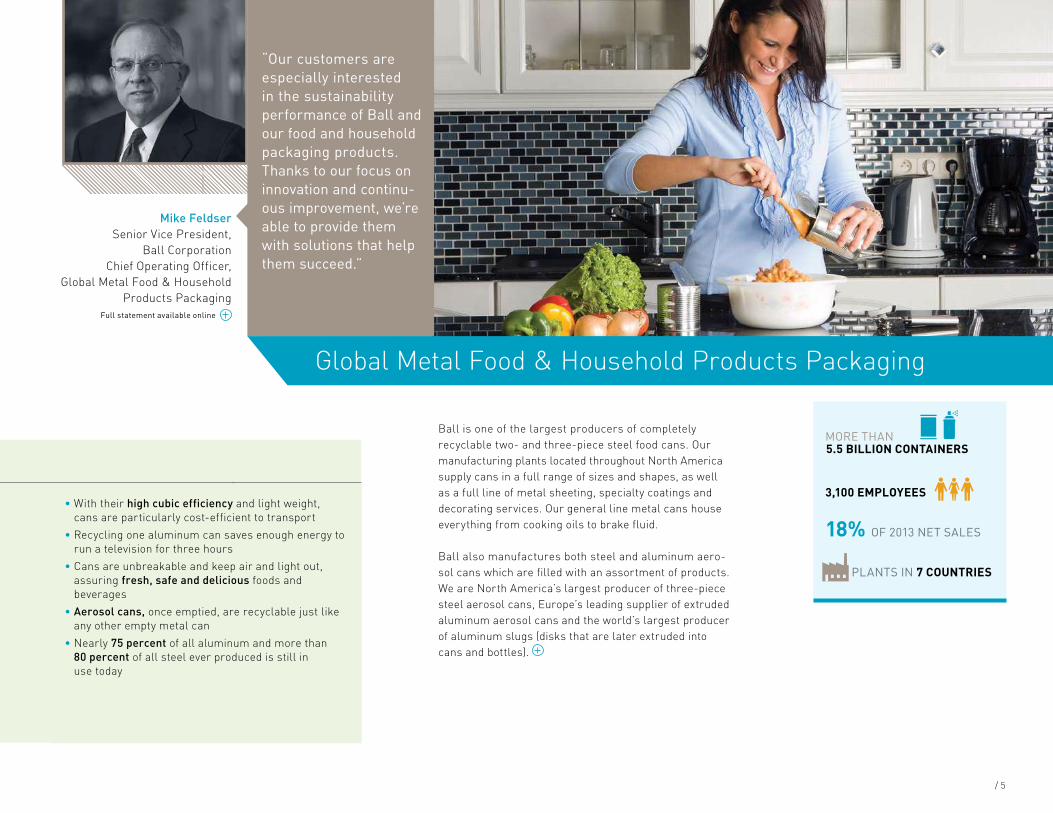
Ball is one of the largest producers of completely recyclable two- and three-piece steel food cans. Our manufacturing plants located throughout North America supply cans in a full range of sizes and shapes, as well as a full line of metal sheeting, specialty coatings and decorating services. Our general line metal cans house everything from cooking oils to brake fluid.
Ball also manufactures both steel and aluminum aero-sol cans which are filled with an assortment of products. We are North America’s largest producer of three-piece steel aerosol cans, Europe’s leading supplier of extruded aluminum aerosol cans and the world’s largest producer of aluminum slugs (disks that are later extruded into cans and bottles).
Mike FeldserSenior Vice President,
Ball CorporationChief Operating Officer,
Global Metal Food & Household Products Packaging
Full statement available online
“Our customers are especially interested in the sustainability performance of Ball and our food and household packaging products. Thanks to our focus on innovation and continu-ous improvement, we’re able to provide them with solutions that help them succeed.”
Global Metal Food & Household Products Packaging
• With their high cubic efficiency and light weight, cans are particularly cost-efficient to transport
• Recycling one aluminum can saves enough energy to run a television for three hours
• Cans are unbreakable and keep air and light out, assuring fresh, safe and delicious foods and beverages
• Aerosol cans, once emptied, are recyclable just like any other empty metal can
• Nearly 75 percent of all aluminum and more than 80 percent of all steel ever produced is still in use today
Metal Cans and Sustainability
5.5 BILLION CONTAINERS MORE THAN
3,100 EMPLOYEES
18% OF 2013 NET SALES
PLANTS IN 7 COUNTRIES
/ 5

/ 6
Our Sustainability Vision
Our Strategy
We create win-win situations for Ball, our employees, customers, shareholders, suppli-ers and communities where we operate.
We empower our talented employees to make the right decisions and support them with resources that enable them to grow their talent and our success.
goal achieved / on track to achieve on time goal not fully achieved, positive trend
2012–2013 Sustainability Goals
Goal By When Progress
Market launch of lighter aerosol can with recycled aluminum in major markets 2013
Reduce our aluminum use by about 6,800 metric tons in our North American beverage operations, saving approximately 75,200 metric tons of CO2 equivalents (assuming stable production volumes) 2013
Launch of the “Operational Land Imager” satellite to obtain data and imagery to be used in agriculture, education, business, science and government 2013
Reduce total recordable incident rate by 15 percent each year 2013
Initiate safety culture change process in at least six more plants 2013
Reduce global greenhouse gas emissions by 10 percent (2010 baseline) 2015
Improve energy efficiency by 5.1 percent in our can businesses, by 1.3 percent in our slug business and maintain growth below 2.3 percent in our aerospace business 2013
Improve water efficiency by 7.2 percent in our can businesses, by 6.1 percent in our slug business, by 11.1 percent in our extruded aluminum packaging business and maintain 0 percent growth in our aerospace business 2013
Reduce waste to landfill by another 10 percentage points, increase recycling by 10 percentage points and add 10 more facilities to our zero waste to landfill list in North America 2013
Reduce total waste generated per unit of production in our European beverage can business by 10 percent 2013
Keep the amount of released VOC emissions on a per unit of production basis in our can businesses at the 2011 level 2013
Conduct first global, biennial employee engagement survey 2012
Determine and enhance overall employee engagement index (monitored via employee engagement survey) 2012
Evaluate employees’ perceptions on our diversity and our efforts to create a more diverse and inclusive environment at Ball (monitored via survey) 2012
Complete roll out of a global human resource information system 2013
Fully deploy an integrated succession planning process across each of our businesses 2013
Work with industry partners to increase the U.S. beverage can recycling rate to 75 percent, the goal established by the Aluminum Association 2015
Expand the geographic reach of “every can counts” programs in several European countries 2013
Extend “metalmatters” to approximately 2 million households in the U.K. 2013
Implement robust supply chain sustainability program, including metrics and goals 2013
Global alignment of our sustainability related standards for all key suppliers 2013
Expand and further enhance collaboration with stakeholders in our supply chain 2013
Measure community impact achieved through Ball Foundation grants 2013
Drive global community engagement strategy 2013
Enhance employee matching gift, giving and volunteer programs to increase participation and better measure the diversity of our community engagement 2013
INNOVATION
OPERATIONS
TALENT MANAGEMENT
RECYCLING
COMMUNITY
SUPPLY CHAIN
/ 6
We evaluate the financial implications of our actions and strive to put them into perspective by understand-ing our impacts on the environment and society.
We aim to achieve 10 to 15 percent diluted earnings per share growth over time while also delivering value to society.
By balancing economic,
environmental and social impacts in
our decision making and activities,
we will create long-term shared value
for our stake holders and for Ball Corporation.
Our past and future steps to get there.

2014–2015 Sustainability Goals
Goal By When Drive for 10 Link
Reduce aluminum use in our global beverage can operations by 30,000 metric tons through further lightweighting, saving approximately 240,000 metric tons of greenhouse gas emissions 2015
By introducing product innovations and embracing new technologies, we create opportunities for Ball and its customers. This drives profitable growth and reduces our products’ environmental footprint.
Commercialize a new, shaped aluminum bottle that weighs 15 percent less than the competitive product on the market in 2013 2015
Launch 10 percent lighter aerosol can with recycled aluminum in the Americas 2015
Roll out internal life cycle assessment (LCA) tool to innovation and engineering teams 2015
Work with industry partners to update LCA for beverage cans in North America 2015
Reduce total recordable incident rate by 10 percent annual By measuring, managing and continuously improving the safety performance and environmental impacts of our operations, we increase efficiencies, reduce costs, minimize risks and align with stakeholder expectations.
Improve greenhouse gas emissions intensity from our operations by 10 percent (compared to a 2010 baseline) 2015
Improve energy efficiency by 2 percent in our global can businesses 2015
Improve water efficiency by 3.2 percent in our global can businesses 2015
Reduce total waste by 4.5 percent and waste to landfill by 22 percent per unit of production in our global can businesses 2015
Realize 70 percent recycling/reuse rate for all waste generated in our global can businesses 2015
Maintain or improve employee engagement scores in our second global employee engagement survey 2014
By developing and inspiring great talent at Ball, we create tremen dous long-term success for our employees, our company and our stake holders. This enables us to acquire, retain, develop and engage the best talent to help us succeed and grow.
Review, harmonize, and improve tools and processes for onboarding new employees and transitioning current employees into leadership roles 2015
Meet or exceed high-performing companies’ scores in diversity and inclusion in our third global employee engagement survey 2016
Support the achievement of a 75 percent recycling rate for aluminum beverage cans in the U.S. and Europe 2015
By supporting innovative, effective recycling programs, we reduce our products’ environmental footprint. This positively influences the perception of metal packaging.
Support the achievement of an 80 percent recycling rate for all metal packaging in Europe
2020
Support development of a global standard that promotes sustainable prac-tices across the aluminum value chain (Aluminium Stewardship Initiative) 2015
By understanding environmental and social impacts in our supply chain, we balance commercial and sustainability imperatives. This enhances our ability to create value for Ball and our stakeholders.
Formalize sustainability into Ball’s new global sourcing organization and strategic sourcing process 2015
Triple the number of employees participating in Ball’s Community Ambassadors program 2015
A healthy business depends on thriving communities. Through corporate giving and volunteerism we invest in the future of the communities that sustain us.
Achieve 100 percent plant participation in community program 2015
Refine and standardize impact measurement tools for Ball Foundation grants 2015
10%
25%
Cut/4 CArboN
Combined with efforts of industry partners, like our suppliers and customers, to increase beverage can recycling rates (Recycling) as
well as to reduce the energy intensity of aluminum production (Supply Chain), we expect the carbon footprint of our beverage cans
to be reduced by 25 percent by 2020.
Ball is committed to reducing the carbon footprint of our most common beverage can formats per region by 10 percent from 2010 to 2020 through
efforts that are in our control, such as lightweighting our cans (Innovation) and our plants’ energy efficiency (Operations).
By 2020, we strive to cut the carbon footprint of our beverage cans by one-fourth
/ 7

/ 8
Through a compilation of industry standards, insights from stakeholders like nongovernmental organizations and suppliers, and our more than 25 years of experience with life cycle assessments, we identified the most significant environmental and social impacts of Ball’s packaging products at each stage of their life. The value chain map on the next page simplifies the packaging product life cycle and shows the significant impact areas. By knowing where these “hot spots” are, we can manage improvements more effectively.
While the environmental and social impacts of our operations are important, those of our supply chain are significantly larger. For example, can manufacturing makes up approximately one-fourth of an aluminum beverage can’s overall energy consumption throughout its life. Most energy consumption occurs during metal production, which our suppliers strive to make more efficient. The energy needed to produce a single metric ton of aluminum, for instance, declined 26 percent in the U.S. and Canada between 1995 and 2010.
Cut/4 CArboN Increasingly our global customers are committing to ambitious product carbon footprint reduction targets and ask us to quantify our contribu-tion. To better support our customers and reduce risk, we increased our knowledge and capabilities to assess our products’ environmental footprints and developed our own target, which includes carbon emissions across the value chain (excluding the beverage): By 2020, we strive to cut the carbon footprint of our beverage cans by one-fourth.
The target reflects a two-pronged approach:
• Ball is committed to reducing the product carbon foot-print of our most common beverage can format per region by 10 percent from 2010 to 2020 through efforts that are in our control, such as lightweighting our cans (Page 12) and making our plants more energy efficient (Page 14).
• Combined with actions of industry partners, including our suppliers and customers, to increase beverage can recycling rates (Page 22) and to reduce the energy
intensity of aluminum production (Page 10), we expect to reduce the carbon footprint of our beverage cans by 25 percent by 2020.
All calculations were extensively reviewed and are based on ISO 14044 compliant LCA models, the inter national standard for LCA, as well as the GHG Protocol Product Life Cycle Accounting and Reporting Standard.
Carbon dioxide emissions are only one aspect of our products’ sustainability profiles. For a more holistic perspective, we monitor other relevant impacts like water and safety. Carbon, however, is the aspect our stakeholders are most interested in and where stand-ards for accounting and reporting exist.
Fresher for Longer Food production and growing agricultural products that go into beverages requires significant resources, energy, water, time and money. If these products do not survive the journey from farm to table, all of those resources are wasted. Worldwide, an estimated 1.3 billion metric tons of food is wasted each year.
Life Cycle Perspective
“ Ball has joined us in improving the environ-mental and social impact that both businesses have along our value chains. Thus, Ball is contributing to HEINEKEN’s ‘Brewing a Better Future’ sustainability strategy.”
Michael Dickstein Director, Global Sustainable Development HEINEKEN International
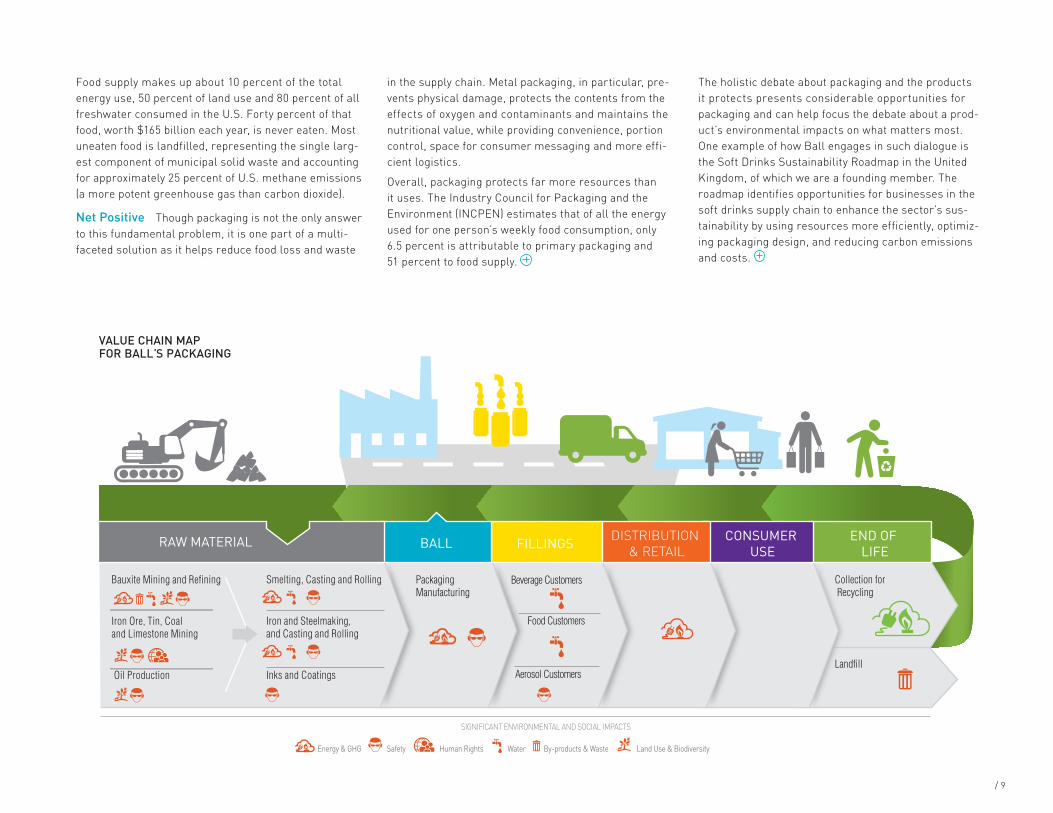
VALUE CHAIN MAP FOR BALL’S PACKAGING
Packaging Manufacturing
SIGNIFICANT ENVIRONMENTAL AND SOCIAL IMPACTS
Smelting, Casting and Rolling
Iron and Steelmaking, and Casting and Rolling
Inks and Coatings
Beverage Customers
Food Customers
Aerosol Customers
Bauxite Mining and Refining
Iron Ore, Tin, Coal and Limestone Mining
Oil ProductionLandfill
Collection for Recycling
DISTRIBUTION & RETAIL
CONSUMER USE
END OF LIFE FILLINGSRAW MATERIAL
SafetyEnergy & GHG Human Rights By-products & WasteWater Land Use & Biodiversity
BALL
Food supply makes up about 10 percent of the total energy use, 50 percent of land use and 80 percent of all freshwater consumed in the U.S. Forty percent of that food, worth $165 billion each year, is never eaten. Most uneaten food is landfilled, representing the single larg-est component of municipal solid waste and accounting for approximately 25 percent of U.S. methane emissions (a more potent greenhouse gas than carbon dioxide).
Net Positive Though packaging is not the only answer to this fundamental problem, it is one part of a multi-faceted solution as it helps reduce food loss and waste
in the supply chain. Metal packaging, in particular, pre-vents physical damage, protects the contents from the effects of oxygen and contaminants and maintains the nutritional value, while providing convenience, portion control, space for consumer messaging and more effi-cient logistics.
Overall, packaging protects far more resources than it uses. The Industry Council for Packaging and the Environment (INCPEN) estimates that of all the energy used for one person’s weekly food consumption, only 6.5 percent is attributable to primary packaging and 51 percent to food supply.
The holistic debate about packaging and the products it protects presents considerable opportunities for packaging and can help focus the debate about a prod-uct’s environmental impacts on what matters most. One example of how Ball engages in such dialogue is the Soft Drinks Sustainability Roadmap in the United Kingdom, of which we are a founding member. The roadmap identifies opportunities for businesses in the soft drinks supply chain to enhance the sector’s sus-tainability by using resources more efficiently, optimiz-ing packaging design, and reducing carbon emissions and costs.
/ 9

/ 10
Around the globe, more than 10,000 companies supply goods and services to Ball Corporation. The top 100 suppliers represent the majority of money we spend, primarily in three categories: aluminum, steel and coatings. The supply chains for these categories are very complex, global and diverse. Ninety percent of our global sourcing volume comes from countries within the Organisation for Economic Cooperation and Development (OECD).
Strategic and Responsible Sourcing We utilize strategic, rather than tactical, sourcing and have developed stable and proven relationships with the majority of our suppliers over the past decades. Crucial to building sustainable supply chains, these long-lasting partnerships enable us to discuss our sustainability-related expectations with suppliers and to collaborate successfully on new technologies, product innovations and recycling programs.
Most metal and some coating suppliers are significantly larger than Ball, and their business activities can result in major environmental and social impacts (Page 9). Mining, for example, is associated with safety, bio-diversity and human rights issues. Metal smelting, casting and rolling require vast amounts of energy, which releases significant greenhouse gas emissions. Due to the scale of their impact and risk exposure, many of our metal and coating suppliers established formal sustainability programs prior to 2000. Eighty-nine percent of our global metal suppliers, for example, published environmental and social metrics in formal sustainability reports or on their websites in 2013.
We engage in various cross-industry collaboration plat-forms to develop and implement common sustainability standards (see “Supply Chain in Action”). Also, in com-bination with resources and expertise from different stakeholders, we work to achieve common goals like increasing metal packaging recycling rates (Page 24).
In line with our global sourcing strategy, our supply chain sustainability efforts help us to:
• Utilize lean supply chains that support our Drive for 10 and sustainability strategies
• Create shared value and reduce risk for our business and relevant stakeholders, including customers, suppliers and shareholders
• Build sourcing solutions in line with stakeholder expectations
• Enhance our products’ sustainability profile
Responsible Sourcing Framework In 2013, we introduced our Responsible Sourcing Framework, which includes a four-step approach that combines individual tools developed over the previous five years.
• The Category Sustainability Profiles primarily serve as a risk filter and describe potential environmental, social and governance (ESG) related risks for alumi-num, steel and coatings. We generate the profiles based on our extensive experience with life cycle
SUPPLY CHAIN

In 2013, Ball joined the Aluminium Stewardship Initiative (ASI). ASI’s objective is to develop a standard to foster responsible environmental, social and governance principles and performance throughout the aluminum value chain. The standard will apply to all aluminum value chain stages, from bauxite mining to smelting, material conversion, consumer/commercial goods suppliers and recycling. It addresses critical industry issues, including energy and greenhouse gas emis-sions, waste management, biodiversity and land management, pollution, resource efficiency, recycling, labor rights, indigenous rights and transparency.
The International Union for Conservation of Nature (IUCN) coordinates the ASI standard-setting process, which is based on public multi-stakeholder consulta-tions. The Standard Setting Group is comprised of ASI member companies and 13 nonindustry orga-nizations with expertise in various environmental, social and governance issues, including the World Wide Fund for Nature (WWF) and Social Accountability International.
assessments (Page 8), industry standards, and media and stakeholder screening. They list high-risk countries because certain ESG risks, like human rights abuses or climate change impacts, are more prevalent in certain regions of the world.
• With our Onboarding Requirements, we communicate and align the way our suppliers consider ESG aspects, and aim to receive written confirmation that responsi-ble business practices are maintained throughout our supply chain. For example, we require our suppliers to comply with Ball’s Supplier Guiding Principles, which cover employment practices, human rights, environment, health and safety, antitrust, bribery and corruption. New contracts also include clauses on human trafficking and—for our steel, coating and aerospace suppliers—conflict minerals.
• Supplier Sustainability Profiles are based on media screening, direct dialogue with suppliers and a sus-tainability self-assessment questionnaire, which we rolled out globally during the reporting period. The
17 questions, covering management systems and transparency, ESG risks, supply chain management and product stewardship, provide a self-evaluation of each supplier, which populates a supplier scorecard. In 2013, we achieved a 93 percent response rate.
• If a supplier scores below expectations, we jointly develop a Continuous Improvement plan. By develop-ing and approving cooperative programs and time-tables, both partners can be successful for the long term. Business relations may be terminated if a supplier violates a fundamental aspect of our requirements and is unwilling to change.
SUPPLY CHAIN IN ACTION
93% RESPONSE RATE TO FIRST GLOBAL SUPPLIER SUSTAINABILITY SELF-ASSESSMENT SURVEY
CATEGORY SUSTAINABILITY PROFILES
• Life cycle assessments • Industry standards • Media and stakeholder
analysis
ONBOARDING REQUIREMENTS
• Supplier Guiding Principles • Contracts (include human
trafficking, conflict minerals requirements)
CONTINUOUS IMPROVEMENT
• Best practice transfer • Improvement plans • Audits (if required)
SUPPLIER SUSTAINABILITY PROFILES
• Sustainability self- assessment questionnaire
• Media and stakeholder analysis
• Supplier scorecards
BALL’S RESPONSIBLE SOURCING FRAMEWORK
/ 11

/ 12
Though they are often invisible to the outside world, many of Ball’s successful product and process innovations—such as lightweighting our containers or increasing manufacturing speeds—provide significant environmen-tal and economic benefits to the company, our customers and consumers. Additionally, we are constantly devel-oping packaging innovations designed to appeal to and add convenience or functional benefits for consumers. The Dynamark™ variable printing technology that we introduced in 2013 and our reclosable Alumi-Tek® bottle are prime examples. We evaluate innovations through multiple lenses, including consumer benefits, carbon footprints, costs and the impact of new products on the recycling process.
Sustainability Breakthrough in Aluminum Aerosol Packaging In 2013, Ball’s lighter weight aerosol can with recycled material hit store shelves in Europe. This new, innovative can is 10 percent lighter than previous cans and contains 25 percent recycled aluminum. We expect to launch the can in the Americas
in 2015. Our engineering and innovation teams are work-ing on further lightweighting opportunities, and suc-cessfully manufactured and tested cans that provided material savings of 15 percent and more.
Our new lightweight aerosol can demonstrates Ball’s global and cross-business innovation capabilities. We are the world’s largest producer of aluminum slugs, which are impact extruded to create aerosol or bever-age containers. Previously, almost all aluminum slugs in the world were produced from virgin aluminum con-taining no recycled material. By leveraging the exper-tise of our global metal packaging businesses, we developed a solution that allows the use of recycled material in slug manufacturing. The resulting new metal alloy exhibits increased strength and enables Ball to significantly lightweight aluminum aerosol cans.
Less Weight, Smaller Footprint We aim to make the lightest metal containers possible while meeting the performance requirements of our customers and consumers. Even small lightweighting improvements
save significant amounts of metal when multiplied by the billions of containers that Ball produces annually. Lightweighting represents a major contribution to our 2020 beverage can carbon footprint reduction target (Page 7). Success stories from the reporting period include:
• Through lightweighting, we reduced our aluminum use by about 6,600 metric tons in our North American beverage operations, saving more than 52,000 metric tons of carbon dioxide emissions, equivalent to the amount created by 10,800 U.S. passenger vehicles per year.
• In 2013, Ball introduced an ultra-light can in Europe. A step change in can manufacturing, this first-ever 33-centiliter aluminum can body weighs less than 10 grams. Compared to its predecessor, this ultra-light can saves approximately 5 percent metal.
• In Asia, we began the conversion to a smaller diame-ter can end, resulting in an end that is approximately 25 percent lighter.
“ By staying close to its customers, under-standing their needs and restrictions, even anticipating them, Ball gains insights that benefit the innovation process.”
Douglas Costa Marketing DirectorGrupo Petrópolis Full statement available online
INNOVATION

• By reducing the weight of an end used with millions of our two-piece food cans in North America by 15 percent, we save more than 210 metric tons of steel annually, equivalent to the amount of steel used in 250 cars.
In 2014 and 2015, we aim to save 30,000 metric tons of aluminum in our global beverage can operations through our lightweighting efforts, saving approximately 240,000 metric tons of carbon dioxide emissions.
Aluminum Bottles Ball manufactures the lightest 16-ounce aluminum beverage bottles on the market and we successfully converted several customers to Alumi-Tek® from other available bottle technologies. When compared to these alternatives, our Alumi-Tek® bottles use approximately 50 percent less aluminum, resulting in significantly fewer environmental impacts.
Building on the knowledge we gained through the Alumi-Tek® development, our innovation teams have been working to develop a new, shaped aluminum bev-erage bottle since 2011. This bottle weighs approximately
15 percent less than the competitive product that was on the market in 2013. We plan to commercialize this advanced bottle by 2015.
Smaller Cans, Smaller Footprint Ball supplies aerosol cans that are roughly half the size of regular deodorant cans that, due to a reengineered spray sys-tem, give consumers the same performance as regular cans. The compressed can is made of 25 percent less aluminum and contains 50 percent less propellant, while holding exactly the same amount of antiperspirant.
Disruptive Technologies Ball’s technology team identifies innovative new technologies, equipment, materials and processes that will simplify manufactur-ing processes, eliminate barriers when broadening our geographic reach, and contribute to our sustainability goals as well as our customers’.
Bisphenol A Nearly all aluminum and steel beverage and food cans made today use epoxy-based resin coat-ings as a barrier between the metal and the products in
the can, extending the shelf life of the canned product. The epoxy resin that gives these coatings their durability may include trace amounts of bisphenol A (BPA).
Regulatory agencies from around the world have con-ducted extensive research on epoxy-based can coatings containing BPA and have consistently found them to be safe. Ball is committed to responding to customer needs and we will continue to work proactively with our sup-pliers and customers to evaluate next generation coat-ings. While alternative coatings are in various stages of development, challenges still remain with respect to matching the current performance capabilities of epoxy-based can coatings, regulatory approvals, supply capacity and distribution issues.
INTRODUCED A
10% LIGHTER AEROSOL CAN IN EUROPE IN 2013
ABSOLUTE AND NORMALIZED ENERGY USE
Cans Slugs Impact Extruded Plastic Aerospace
2012
3,488,147
2010 20112009 2013
39.0542.50
3,322,564
-8.1%ENERGY INTENSITY(kWh/1,000 cans produced)
TOTAL ENERGY USE(MWh)
WASTE PER DISPOSAL ROUTE(percentage of total metric tons)
Recycling/Reuse Energy Recovery Other Waste Treatment Landfill
2012
58%
10%10%
22%
42,335
2011
54%
10%
12%
25%
44,865
2010
44%
11%
14%
31%
36,178
2013
65%
12%10%
13%
41,585
AVERAGE WEIGHT 12-OUNCE CAN AND END (U.S.)(grams)
20101990 2000 2013
13.3
19801970
13.513.715.4
18.7
22.0
-40%
Energy intensity for product other than cans avaiable online
TOTAL METRIC TONS
0
500000
1000000
1500000
2000000
2500000
3000000
3500000
4000000
/ 13

/ 14
ENERGYBall used 3.49 million megawatt hours of energy in 2013, 4 percent less than in 2012. Our metal beverage, as well as tinplate food and aerosol can businesses, accounted for 88 percent of our total energy consumption. We increased the energy efficiency in these businesses (measured per unit of production) by 4 percent in the reporting period and by 8 percent since 2009. We focus on six energy conservation areas: employee engage-ment, machinery and equipment, heating and cooling, heat recovery, lighting and energy management.
Most Ball plants have energy management systems in place, typically aligned with the ISO 50001 energy management standard. By defining plant- and manage-ment-level responsibilities, these systems enable us to systematically reduce our energy use, energy costs and greenhouse gas (GHG) emissions.
Managing Change Opposing trends, like increases in can sizes, shapes and labels, line or plant curtailments, and new line startups, often offset progress toward
our energy efficiency goals. As manufacturing line stoppages increase due to reduced demand or a greater number of height, diameter or label changes, our effi-ciency decreases. During the reporting period, our beverage packaging business experienced significant changes, including the double-digit volume growth of our specialty can business and the continued decline of standard 12-ounce cans in North America. We invested in our businesses to manage efficiently through these challenges, and expect additional energy performance gains in 2014 and beyond.
Committed at All Levels Ball’s management team is committed to energy improvements and invested approximately $18.5 million in energy-saving projects in 2012 and 2013. These measures will generate esti-mated electricity savings of 51 million kilowatt hours and natural gas savings of approximately 110 million kilowatt hours per year, exceeding the annual energy consumption of 6,100 average U.S. households.
Every Ball plant commits to annual energy efficiency goals supported by detailed action plans. Real-time energy information systems enable us to better understand, manage and report on the performance of energy-consuming operations, and to better benchmark processes so we can identify and exchange best practices.
Oven Assessments Ball uses ovens to enable further processing after washing cans and applying coatings and inks. These ovens comprise up to 75 percent of a beverage can plant’s natural gas usage and up to 20 percent of its electricity usage. In Europe, we conducted oven audits in 2011 and implemented improvement projects, contributing to natural gas efficiency gains of 11 percent during the reporting period. Building on this experience, we performed extensive audits in all North American beverage can plants in 2013, identifying and implementing several low-cost opportunities to reduce gas consumption. These projects, combined with increased employee awareness about oven energy use and related costs, allowed us to realize some of the gas
ABSOLUTE AND NORMALIZED ENERGY USE
Cans Slugs Impact Extruded Plastic Aerospace
2012
3,488,147
2010 20112009 2013
39.0542.50
3,322,564
-8.1%ENERGY INTENSITY(kWh/1,000 cans produced)
TOTAL ENERGY USE(MWh)
WASTE PER DISPOSAL ROUTE(percentage of total metric tons)
Recycling/Reuse Energy Recovery Other Waste Treatment Landfill
2012
58%
10%10%
22%
42,335
2011
54%
10%
12%
25%
44,865
2010
44%
11%
14%
31%
36,178
2013
65%
12%10%
13%
41,585
AVERAGE WEIGHT 12-OUNCE CAN AND END (U.S.)(grams)
20101990 2000 2013
13.3
19801970
13.513.715.4
18.7
22.0
-40%
Energy intensity for product other than cans avaiable online
TOTAL METRIC TONS
0
500000
1000000
1500000
2000000
2500000
3000000
3500000
4000000
OPERATIONS

Our Rome, Georgia, beverage can plant opened in 1993 and had not optimized the main gas consumers, pri-marily ovens and boilers, since then. In 2013, employees installed digital meters on the equipment, and con-ducted oven assessments with an external consultant. Real-time monitoring now allows employees to identify energy-related issues with the machines quickly and to test new equipment settings to decrease energy use. The energy monitoring helped quantify energy savings at the regenerative thermal oxidizer (RTO) of several million kilowatt hours annually, which will be realized in 2014 when the old RTO will be replaced by state-of-the-art technology.
The oven assessments provided various recommen-dations and the Rome team immediately addressed several major issues, including a decrease in the ovens’ exhaust air flow. Overall, the plant reduced its gas use by 7 percent in 2013, saving GHG emissions equivalent to the amount 227 cars release per year. Additional energy saving opportunities will be addressed in 2014, such as replacing inefficient burners and add-ing variable frequency drives.
ENERGY IN ACTION
savings of approximately 36 million kilowatt hours per year, equal to more than 6,600 metric tons of carbon dioxide emissions, or taking 1,380 cars off the road.
Compressed Air In our plants, air compressors typically consume the most electricity. We conduct audits of our compressed air systems and optimize performance by reducing system pressure, minimizing wasteful air use and leaks, and decreasing manufactur-ing equipment demand. We installed more efficient compressors and connected additional equipment to low-pressure systems during the reporting period. At the end of 2013, 58 percent of our beverage can plants used dual-air systems that supply equipment with either high- or low-pressure air.
GHG Emissions In 2013, Ball’s operations emitted 1.26 million metric tons of GHG emissions (Scope 1 and 2). We committed to improving our GHG emission inten-sity by 10 percent by 2015 (compared to a 2010 baseline). By year-end 2013, we achieved a 7.8 percent reduction. As part of the CDP investor initiatives (formerly the
Carbon Disclosure Project), Ball annually discloses GHG emissions. An external assurance statement is available online.
WATERWater is fundamental to Ball’s manufacturing processes, as well as to our suppliers and customers. A growing world population with greater demands for water- intensive food and energy, combined with increasing water needs and severe pollution of water resources in emerging economies, pose significant water supply constraints in some regions. As responsible corporate citizens, we continue implementing projects to better understand and manage regional and local water impacts.
Improving Water Efficiency We aim to be responsi-ble stewards of water, using as little as possible for each product produced. In 2013, Ball used 6.6 million cubic meters of water worldwide, primarily for forming, washing, rinsing and cooling. Our can businesses account for 92 percent of our total water consumption and they improved water efficiency by 2 percent in
“ I believe that tracking and reporting supply chain GHG statistics would further differen tiate Ball from competitors and competing substrates when explaining their value proposition to customers, retailers and consumers who are all placing increased emphasis on sustainability.”
Brian Demain, CFA Portfolio ManagerJanus Capital Group Inc. Full statement available online
17 PLANTS INCREASED ENERGY EFFICIENCY BY 5% OR MORE DURING 2012–2013
/ 15

/ 16
the reporting period (detailed water data and assurance statement available online).
Through the years, plant-level improvement initiatives focused on reducing, reusing and recycling water with-out compromising water discharge quality. Between 2011 and 2013, 22 Ball plants increased water efficiency by 10 percent or more. We equipped most of our wash-ers with water sub-meters to monitor real-time water use and to increase employee awareness. During the reporting period, we started benchmarking our global operations at the equipment level to identify and share projects with the greatest impact on reducing water usage. We also invested in wastewater treatment tech-nologies, evaluated advanced treatment options for effluents and installed several pilot systems to enable water reuse. Additionally, our corporate technology team is examining breakthrough technologies and innovative equipment that will allow us to change how and how much water we use in our operations.
Understanding Risks In 2012, we began using tools developed by the World Business Council for Sustainable Development and the World Resources Institute to map our facilities against watershed stress areas. Based on 2025 projections, 96 percent of our production facili-ties, as of year-end 2013, will be located in areas with a sufficient water supply—where the amount of water available meets the demand. We will intensify our focus on reducing water in the plants where water scarcity is likely to become an issue. We will also use these insights when planning new sites or when introducing new products at existing sites.
WASTEOur long-term goals include reducing the amount of waste we generate, minimizing waste sent to landfill and recycling as much waste as possible. By the end of 2013, 33 of our 61 manufacturing locations worldwide sent zero waste to landfill—an increase of 20 plants since 2011. Only 13 percent of the total amount of waste
that Ball generated in 2013 was sent to landfills. In the reporting period, we increased the amount of waste reused and recycled from 54 to 65 percent. Diverting waste from landfills is a challenge in some regions, especially when landfill costs are low or when waste would need to be shipped over long distances for alter-native treatment options.
Standardized Reporting Reporting accurate waste data in a timely and consistent way throughout our global operations is a complex task because waste classifications and disposal methods vary from country to country based on legal requirements and local infrastructure. In cooperation with waste management contractors across the globe, we started to standardize our waste data collection process globally in 2008. 2013 waste data has been externally verified for the first time.
Since 2008, we have been working to divert the filter cake in our operations from landfills. Filter cake accu-mulates during wastewater filtration, representing
33 MANUFACTURING LOCATIONS SENT ZERO WASTE TO LANDFILL AT YEAR-END 2013
ABSOLUTE AND NORMALIZED ENERGY USE
Cans Slugs Impact Extruded Plastic Aerospace
2012
3,488,147
2010 20112009 2013
39.0542.50
3,322,564
-8.1%ENERGY INTENSITY(kWh/1,000 cans produced)
TOTAL ENERGY USE(MWh)
WASTE PER DISPOSAL ROUTE(percentage of total metric tons)
Recycling/Reuse Energy Recovery Other Waste Treatment Landfill
2012
58%
10%10%
22%
42,335
2011
54%
10%
12%
25%
44,865
2010
44%
11%
14%
31%
36,178
2013
65%
12%10%
13%
41,585
AVERAGE WEIGHT 12-OUNCE CAN AND END (U.S.)(grams)
20101990 2000 2013
13.3
19801970
13.513.715.4
18.7
22.0
-40%
Energy intensity for product other than cans avaiable online
TOTAL METRIC TONS
0
500000
1000000
1500000
2000000
2500000
3000000
3500000
4000000

Through our water scarcity analysis, we identified that our Beijing, China, facility is located in a water-scarce area. As a responsible community member, the plant identified various opportunities to become more water efficient. During the reporting period, the plant reduced its water consumption per can produced by 18 percent. The annual water savings could fill an Olympic-sized swimming pool 11 times.
Daily water usage monitoring, which allows plant engineers to react quickly if there are changes in water usage trends, has been a key improvement driver. The plant achieved its biggest improvement by collecting overflow water from washers for reuse and by implementing a spray system optimization program. The plant also inspected all water piping with an ultrasonic detector to identify and fix leakages. In 2013, to further reduce water usage, the plant installed a pilot system to treat overflow water from washers so it can be reused to wash cans.
the largest waste stream by weight in our aluminum beverage can plants, accounting for up to 60 percent of a plant’s total waste. In 2013, we diverted 98 percent of all filter cake, or 6,132 metric tons, in our North American beverage can plants to beneficial reuse sites, such as commercial composting facilities. We utilize the savings from other waste optimization programs to partially off-set the additional costs of our landfill diversion efforts.
SAFETYAt Ball, maintaining a safe work environment is our highest priority. We strive to reach our long-term vision of zero work-related incidents, and maintain our interim goal of reducing our Total Recordable Incident Rate (TRIR, recordable incidents per 200,000 hours worked) by 10 percent year over year.
While we reduced our TRIR by 5 percent during the reporting period and finished 2013 with a TRIR of 1.6, we did not achieve our interim goal. However, Ball has
a successful safety performance record, with incident rates consistently lower than the manufacturing (4.3) and metal can manufacturing (3.8) industries as reported by the U.S. Bureau of Labor Statistics for 2012.
• In 2013, 7 of our 61 packaging manufacturing loca-tions worldwide reported zero recordable accidents.
• In 2012, our European beverage division experienced a TRIR increase to 1.2. A robust risk management strategy, the introduction of a “one minute safety self-assessment” and the standardization of Personal Protective Equipment, all contributed to a TRIR decrease of 37 percent in 2013.
• Our North American slug manufacturing business reduced their TRIR more than 25 percent in 2013. This reduction was primarily driven by the implementation of employee engagement programs focused on safety culture change, behavior-based safety and the stand-ardization of work procedures.
WATER IN ACTION
GLOBAL INVESTMENT IN ENERGY EFFICIENCY MEASURES IN 2012–2013
$18.5 MILLION
/ 17

/ 18
Lisa Barker Program ManagerBall Aerospace & Technologies Corp. Full statement available online
At Ball, the engagement of our workforce is a key competitive advantage and vital to our success. We continually invest in our more than 14,500 employees worldwide and help them thrive by providing the right support, linkage to the business, rewards, growth opportunities and an exceptional work environment. Through global talent management, we strive to recruit, develop, retain, and engage talented, diverse employees who share our core values and reflect our communities.
Performance Management To achieve our mission we must have a strong focus on performance manage-ment. We link individual objectives to the organizational goals to ensure alignment and overall efficiency. Our performance management framework consists of four ongoing performance management activities:
• Setting and reviewing objectives and competencies
• Managing, coaching and providing feedback
• Supporting individual development
• Recognizing and rewarding performance
To assist in the performance management process, we provide comprehensive employee and manager toolkits, which clearly describe their roles and responsibilities. For example, Ball has used a competency model for more than 10 years to define and evaluate an observable collection of skills, knowledge, abilities and behaviors that individuals need to perform their roles successfully. A competency development guide helps our employees identify personal development areas and resources to address them.
Talent Development Our employees are in charge of creating their Individual Development Plan. While we assist them through that process and provide guidance on development opportunities, they are responsible and accountable for their own development. They develop specific learning objectives for growth within their current position and to prepare for the next step in their career.
With the adoption of the 70:20:10 principle, we acknowl-edge that the most valuable learning (70 percent)
happens on the job, as real-life challenges trigger the motivation and best atmosphere to learn. Consistent dialogue with peers and supervisors that includes shar-ing experiences and insights, as well as receiving con-structive feedback, represents 20 percent of effective learning. Formal training classes and eLearning, pro-vided either internally or by external experts, represent the remaining 10 percent.
Employee Engagement It is important to us that our employees enjoy, value, find meaning in and are committed to what they do at Ball. An engaged employee is one who is committed, actively involved in and enthu-siastic about work, and who will act in a way that fur-thers the organization’s success. The engagement of our workforce is a critical part of our success.
In 2012, we launched Ball’s first global employee engage-ment survey, which covered empowerment, leadership, sustainability, diversity and inclusion, customer focus and more. Participation from more than 11,500 Ball employees allowed us to learn about our strengths and
“ To ensure we retain talented employees, our functional managers must facilitate the personal growth of their colleagues. For Ball leaders, one key to success is to make regular performance review discussions with their direct reports a top priority.”
TALENT MANAGEMENT

improvement opportunities. Overall, we learned that the engagement level of our employees is very high. In fact, it was at the same level as for companies that conduct comparable surveys and that constitute the high performance benchmark. Ball’s global businesses acted on their unique, local opportunities during the reporting period. The biennial survey will be conducted again in 2014, allowing us to monitor our progress, benchmark against other leading companies and iden-tify further areas for improvement.
Diversity and Inclusion The most successful com-panies employ people with various backgrounds, expe-riences, perspectives, competencies, cultures and aspirations. As a growing global enterprise, Ball values an inclusive culture with a greater diversity of thought. We aim to provide an environment that unlocks the unique qualities, values and potential of each employee to bring about every individual’s best work.
In 2011 we implemented a corporate-wide, systematic process to improve awareness and leverage the diver-sity of individuals and teams in order to unleash ideas, encourage innovation and drive growth at Ball. This is critical as we expand into new markets, broaden our geographic reach and maximize value in our existing businesses. A global diversity steering committee, made up of senior leaders, coordinates our global diversity efforts. We focus on creating an inclusive environment, establishing a workforce that reflects the representa-tion of the markets where we do business, and develop-ing a diverse group of leaders and employees.
In 2013, for example, we implemented additional poli-cies and practices focused on lesbian, gay, bisexual, transgender and allies (LGBTA) workplace equality and formed a LGBTA employee resource group. The Human Rights Campaign Foundation recognized our efforts and scored Ball an 85 on the 2014 Corporate Equality Index, underlining our commitment to create an inclusive environment for everyone.
TALENT MANAGEMENT IN ACTION
Ball and Thai Beverage Can Ltd (TBC) joined forces to seize opportunities in the attractive Vietnam market and officially broke ground on a new plant in June 2011. The recruitment and development of strong team members was critical to the joint venture’s success. Seventy-two new hires were sent to Ball’s can plants across China as well as to the TBC plant in Thailand to learn everything about beverage can making. Adminis-trative employees in finance, logistics, sales and sourcing also visited partner locations to receive training in their respective areas. In early 2012, 12 top performing TBC-Ball trainees were rewarded with a visit to Ball’s Beijing plant, where they gained addi-tional insights into efficient operation of high-speed can making equipment.
Hands-on training and experiential learning were instrumental in developing a talented and high- performing workforce, which guaranteed a successful start of commercial beverage can production in March 2012. Our team continues to fine-tune its talent man-agement program to ensure we have highly talented, dedicated and engaged employees who can succeed in an excellent work environment.
76% OF OUR EMPLOYEES PARTICIPATED IN BALL’S FIRST GLOBAL EMPLOYEE ENGAGEMENT SURVEY
71%
18%
11%
BALL EMPLOYEES BY REGION
8,500 North America 3,300 Europe 1,600 Asia 1,100 South America
14,500 EMPLOYEES 59%
23%
10%
8%
/ 19

/ 20
Globally, Ball is committed to investing in the com-munities where we live and work. Though we enrich communities through traditional economic investments such as jobs, benefits and local taxes, our company and employees also donate money and time to organizations, programs and civic initiatives that advance sustainable livelihoods.
The Ball Foundation In the U.S., Ball established a private foundation for philanthropic activity. The Ball Foundation’s mission is to provide financial support to U.S. nonprofit organizations that promote education, recycling and community engagement. Effective educa-tional programs are vital to Ball’s competitiveness and to our future workforce. Increasing our products’ recy-cling rates reduces material costs and the environmen-tal impact of manufac turing. Lastly, canned food and beverages are ideal for food security and disaster relief efforts. The link between these giving areas and our business allows us to focus our investments where they make the greatest impact.
The Ball Foundation awarded nearly $1.1 million in grants in 2012 and more than $2.4 million in 2013. After the devastating floods that impacted Ball’s home state of Colorado in 2013, the Ball Foundation pledged $1 million to support community relief efforts. The flood caused more than $1 billion in damage and is considered the worst disaster in state history.
Through structured grants and required reporting guidelines, we maximized the impact of our investments. During the reporting period, the Ball Foundation invested in mentoring, hands-on learning opportunities and educational materials for thousands of students. The Foundation supported a program that helped nearly 40 schools transition to zero waste to landfill. The grant focused on decreasing waste in participating schools by 66 percent through waste reduction projects, com-posting and increased recycling. In the community engagement area, the Ball Foundation supported vari-ous self-sufficiency programs and, through partner-ships with local agencies, addressed the immediate
survival needs for thousands of homeless or underpriv-ileged citizens in our communities.
Ball Community Ambassadors Ball’s Community Ambassadors program is designed to maximize employee participation in the community. The pro-gram’s support structure provides employees with opportunities to begin or expand their volunteer efforts. In 2013, we established new employee-focused pro-grams, including a revamped employee matching gifts program and a new volunteer program, “Dollars for Doers,” which offers an additional contribution to nonprofits based on employee volunteer hours.
During the reporting period, we created a corporate giving and community engagement campaign for all U.S. and Canadian employees that raised more than $1.4 million for charities. During a one-month cam-paign, Ball employees volunteered more than 2,400 hours for community activities, far exceeding our goal of 1,000 hours. The Community Ambassadors’ website
“ Ball is a partner that is integral to our community, be it in Broomfield, Colorado, across the United States or around the world. Ball provides the American Red Cross with proactive funding before disasters strike.”
Gino Greco Regional CEO American Red Cross Full statement available online
COMMUNITY

allows employees to find and/or organize volunteer opportunities, track volunteer hours and donate to charities. The enhanced employee volunteer program supported more involvement and volunteer activities. Momentum achieved during the giving campaign continued into the final months of 2013. Our European employees also participate in a regional matching gifts plan, and the enhanced program and volunteer support structure implemented in the U.S. and Canada in 2013 will expand into other regions by 2015.
Plant Participation in Community Programs Our commitment to the communities where we live and operate spans the globe. Our plants and employees contribute to their communities financially and through service projects. In 2012 and 2013, the financial impact of plant giving was significant—totaling more than $1 million. Ball’s plants also contributed their time. Employees at our four Latapack-Ball plants in Brazil
vol unteered at Praça Ativa, an environmental education and sustainability event held in cities around the country. In Belgrade, Serbia, employees supported a humanitar-ian organization dedicated to helping children from dis-advantaged families succeed academically. The program augments math and Serbian language coursework for primary school. Ball Aerospace employees volunteered to coach students in designing and building a robot for competitions. The experience engaged students in hands-on technology and engineering projects.
To continue improving our ability to illustrate and quan-tify our global giving programs, Ball added community metrics into our plants’ existing monthly sustainability reporting in late 2013. This allows us to strategically measure the total investments made in all Ball com-munities around the world. In 2014 and 2015, Ball will implement a support and awareness program that aims to increase global plant participation to 100 percent.
COMMUNITY IN ACTION
Food security is a key focus area for Ball’s community engagement efforts because it is closely tied to our business. Canned food provides safe, nutritious food to those who need it. In Broomfield and Boulder counties, where Ball’s corporate and packaging headquarters and the majority of its aerospace operations are located, one in six people live in poverty. Each year, Community Food Share (CFS), a local nonprofit organization, pro-vides food to an estimated 33,000 people.
In 2013, we revamped our “Let’s Can Hunger” food drive by organizing teams to drive success and com-pete in canned food collection to donate to CFS. Teams were free to select a team name, establish incentives, and participate in a can sculpture contest.
With each team able to customize their collection experience and connect Ball’s products to a meaning-ful cause, “Let’s Can Hunger” successfully collected more food cans than ever before—13.2 metric tons. When combined with The Ball Foundation’s $1 per pound match, CFS provided more than 145,200 meals to people in need.
$2.4 MILLION AWARDED BY THE BALL FOUNDATION IN 2013
/ 21

/ 22
Metal—A Permanent Material Metals are com-pletely and infinitely recyclable. Because metals are ele-ments and never lose their intrinsic properties, they are recognized as “permanent materials,” a resource that can be used again and again without loss of quality. When metal products reach the end of their useful life, the product application (like a can) ends, but the metal endures. Other packaging substrates such as plastic and paper do not share this unique sustainability feature.
Aluminum and iron are the third and fourth most abun-dant elements on Earth. They are mined as minerals, bauxite and iron ore. Transforming these ores into alu-minum and steel is an energy-intensive process. Recycling metals saves large amounts of resources and energy because mining, refining and especially smelting processes are not required.
Recycling steel saves 74 percent of the energy required to produce primary steel. When compared to primary aluminum production, using recycled aluminum requires
only 5 percent of the energy and reduces greenhouse gas (GHG) emissions accordingly, which is why can recycling also plays an important role for Ball’s Cut/4 CArboN target (Page 7). Recycling a can (or any other metal product) reduces the need for an equal amount of more energy-intensive virgin metal and saves resources, energy, GHG emissions and landfill-space—no matter the end use of the resulting new product.
Highest Recycling Rates Metal cans are the most recycled packaging containers in the world. In several countries, such as Brazil, China, Germany and Switzerland, metal packaging recycling rates are at or above 90 percent. However, collection programs in some other countries are not performing as well, so we focus our support in these regions (Page 24).
The metal containers we manufacture are collected through multiple channels, such as local government recycling programs (e.g., curbside), industry recovery efforts and our direct recovery initiatives. The most
convenient program for consumers typically is curbside recycling, where all common household recyclables can be recycled at the curb, requiring only the separation of materials into recycling bins. Because the majority of collection systems are locally managed, the tremendous amount of variation that occurs can be challenging.
Recovery programs depend on reliable markets for recycled materials and sufficient revenues to offset col-lection and processing costs. Metal cans are the most valuable packaging container in the recycling stream, often subsidizing the recovery of other packages that have little or no value.
Truly Recyclable Packaging Collection schemes accept many different packaging types today, but that does not necessarily mean that the material will be recycled into a new product. The actual recycling rate is determined by numerous factors such as the use of composite materials in one package, how the package behaves in a material recovery facility and the existence
METAL CANS ARE
100% AND INFINITELY RECYCLABLE
RECYCLING

“ We expect Ball to support our efforts to develop innovative styling products. By providing packag-ing materials and recycling solutions that deliver more value to Henkel, our consumers and society at a reduced environmental footprint, Ball enables Henkel to achieve more with less.”
Dr. Rolf Bayersdörfer Corporate Director, Henkel Beauty Care, R&D Hair Styling/AerosolsHenkel AG & Co. KGaA Full statement available online
of a viable end market for the material. Metal cans are easily separated from other materials, either through magnets or through “eddy current” technology that effi-ciently sorts out aluminum.
Recycling is an essential part of metal packaging’s life cycle and the metal industry is characterized by a fully integrated recycling business. Aluminum and steel have enjoyed enormous growth rates in their main end-use markets, including packaging, over the past hundred years. Demand for secondary metal far exceeds the sup-ply and empty cans have a high market value—making them the perfect example of truly recyclable packaging.
Need for Change Ball is just one stakeholder in this vastly complex collection and recycling system that typi-cally consist of material and packaging suppliers, con-sumer brands, local governments, waste haulers and actual recyclers. Because each of these organizations has an interest in packaging recycling and, therefore,
a role to help improve recycling rates, we utilize a col-laborative approach to enhance packaging collection and recycling.
Many believe that local governments are responsible for collecting and recovering packaging materials. However, in many cases, they do not have the funding to develop and maintain effective recovery schemes. As a result, existing public and private resources must be better lev-eraged and coordinated to optimize packaging recovery and create positive change.
Higher recycling rates help make economies more resource efficient, encourage job creation, reduce packaging’s environmental impacts, help realize gov-ernments’ environmental expectations, and thereby directly benefit our customers, retailers and the metal packaging industry.
Aerosol Recycling Aluminum and steel aerosol cans are recyclable, just like any other metal container. Ball worked with customers and other partners for the last decade to promote the collection of empty aerosol cans. While challenges with accurate data on actual recycling rates and consumer access to recycling remain, we have made significant progress. For example, in the United Kingdom, the consumer education program MetalMatters (Page 25), which Ball developed and supports, was instrumental in doubling the number of local authorities that accept aerosols in their recycling schemes between 2011 and 2013, achieving a 91 percent acceptance rate. Also, more than two-thirds of Americans have access to recycling programs that accept steel aerosol containers.
ONCE EMPTIED, BEVERAGE CANS CAN BE BACK ON THE SHELF AS A NEW CAN IN AS LITTLE AS
60 DAYS
/ 23

/ 24
North America• The Curbside Value Partnership (CVP) launches and
evaluates education programs to increase participation in U.S. community curbside programs, while striving to make them more financially sustainable. Thirty-one cities and counties, and four states have been engaged, and 15 additional communities were awarded grants by CVP in 2013 to help with their local education efforts. CVP partners increased recycling volumes by 23 per-cent and participation by 18 percent on average.
• The Southeast Recycling Development Council (SERDC) promotes effective recycling programs and coordinates educational activities in the southeastern U.S. In late 2013, SERDC gathered a group of companies, trade associations and public entities to identify strategic interventions that will significantly increase the recov-ery of household recyclables. Subsequently, SERDC launched a 120-day process to define models to jointly engage in voluntary public-private partnerships to make strategic, one-time investments that sustain higher recovery levels by adopting proven municipal recycling program best practices.
RECYCLING RATES IN BALL’S MAJOR MARKETS
Aluminum Beverage Cans
Steel Packaging
91%
49%
(2012)
67% 71%
(2012)
• The Colorado Association for Recycling (CAFR) is a non-profit organization that actively works to promote and encourage recycling through educational programs for Colorado residents, local governments, businesses and elected officials.
• The 2013 Great American Can Roundup (GACR) School Challenge engaged more than half a million U.S. students, diverting more than seven million beverage cans from landfills. Schools competing in the GACR School Challenge raised $160,000 for future activities and local charities.
As part of the annual GACR Industry Challenge, can manufacturers and aluminum suppliers engage their U.S. facilities and surrounding communities to collect cans. In 2013, more than six million cans were collected, raising more than $130,000 for charities. Ball collected nearly three million cans for the industry challenge.
• Several Ball facilities sponsor a recycling scholarship contest, which offers five $2,000 scholarships to high school seniors who collect the most cans in a six-month period. In 2013, four schools near our Findlay, Ohio, plant collected 280,000 cans. During the contest, Ball employees visited the schools and explained the benefits of recycling.
• Ball supports several local customer-led recycling pro-grams. In Golden, Colorado, for example, which is home to significant production locations for Ball and one of our customers, residents annually collect approximately 560 metric tons of recyclables at a public drop-off recycling center that is co-financed by the partners.
South America• In Brazil, Latapack-Ball sponsors the annual Praça Ativa
project, organized by Instituto Ativa Brasil, a nongovern-mental organization. Residents are invited to free festi-vals throughout the country that provide art, culture, sustainable lifestyles and environmental education, including workshops on the importance of recycling.
• Escola Ativa is an environmental education project that provides schools, children and teachers with information on how to lessen their environmental impacts. Latapack-Ball supports Escola Ativa in the four regions where we operate plants. Each school receives educational materi-als and a day-long environmental class so it can serve as a role model to other regional schools. In 2012, Latapack-Ball supported a similar program, which held classes for 200 teachers and provided “It’s Time to Recycle” books and games for children.
PROGRAMS BALL SUPPORTS TO INCREASE RECYCLING
SOUTH AMERICANORTH AMERICA
98%

ASIA
68% 74%
(2011)
90%
(2010)
Europe• Every Can Counts (ECC) encourages consumers to
recycle cans when away from home—whether at work, college or other “on the go” locations like festivals, shopping centers or tourist attractions. To create behavioral change, ECC provides eye-catching recy-cling bins accompanied by creative posters and other promotional tools. Originally developed in 2008 in the U.K., ECC was such a success that similar programs were active in France, Austria, Hungary, Romania, Ireland and Montenegro by year-end 2013. More south-ern European markets will be targeted in 2014. In the U.K., 1,300 organizations with more than 3,500 sites signed up for ECC by the end of 2013, creating more than 9,000 collection points. In France, 930 partici-pating sites nationwide, active programs in 25 of the largest cities and promotional activities at 450 events during 2013 contributed to ECC’s success in collecting 12 million cans.
• Launched in 2011, MetalMatters helps U.K. local governments educate residents about the value and benefits of metal packaging recycling, motivating them to get involved and recycle more at home. While 97
percent of U.K. municipalities provide curbside metal collection, only about 40 percent of the available metal was captured. Ball initiated a project to better under-stand why participation lagged. The findings were sur-prising: people wanted reassurance that their recycling efforts really made a difference. To alleviate those engagement barriers, Ball and its partners crafted an innovative communication campaign. Implemented in 33 municipalities in two years, MetalMatters reached more than two million households, the largest industry-led recycling communication campaign in the country. Communities engaged in the program noted an aver-age 13 percent increase in metal packaging recycling. Governments and local authorities have recognized the award-winning program as a best practice in recycling education.
• The recan fund, founded in 2005 when Ball opened its beverage can plant in Serbia, aims to increase envi-ronmental awareness, educate consumers about the advantages of recycling, and instill recycling as a daily habit. The “Can by Can” program continued its success during 2013 and reached children in 170 schools, employees and visitors in 77 office and restaurant
locations, and members of 12 fitness clubs. During the 2012–2013 school year, participating schools col-lected 380,000 cans. Additionally, 8,000 children and their parents visited recan’s annual theater project, where kids pay the entrance fee of five cans and learn about the environment during the play.
• The recal foundation pursues the same goals as the recan fund and contributed to Poland’s increase in beverage can recycling from 2 percent in 1995 to 76 percent in 2012. During 2013, recal supported 84 sporting events with more than 85,000 participants. With the Polish Ministry for Sport and Tourism and The Association for International Sport for All (TAFISA), recal promotes healthy living and environ-mental stewardship. For example, the group pro-vided tens of thousands of canned beverages with labels containing recycling messages to 2013 World Walking Day participants in Poland.
• The recan organization operates four recycling centers in Poland and processed more than 25,000 metric tons of used beverage cans (UBCs) during the reporting period. In 2013, the organization, wholly owned by Ball, developed new quality stan-dards to ensure the high quality of UBC bales that are shipped to Ball’s suppliers for remelting.
Asia• Because official packaging recycling statistics for
China are not yet available, Ball and its customers and industry partners initiated a research project to study the characteristics of packaging waste sent to landfills. After the initial survey in 2010, a follow-up study in 2013 allowed scientists at the Chinese Research Academy of Environmental Science to evaluate trends.
• Though Chinese beverage can recycling rates are estimated to be around 90 percent, consumers are not familiar with the environmental benefits of can recycling. To educate consumers—especially chil-dren—about the positive impacts of recycling, Ball launched recan Asia in 2007.
EUROPE
/ 25

/ 26
SUSTAINABILITY MANAGEMENT
“ Our employees understand the important role they play in making Ball a more successful and sustainable company. We aim to engage them even more in our sustainability efforts going forward so we can accelerate improvements, increase produc-tivity and create innovative solutions.”
Lisa A. PauleySenior Vice President Human Resources, and Administration, Ball Corporation and Chair of Ball’s Sustainability Steering Committee Full statement available online
At Ball, we believe in our people, our culture and our ability to deliver value to all of our stakeholders. Like uncompromising integrity and customer focus, being sustainable is part of our Drive for 10 vision, which leverages Ball’s strengths to achieve continued long-term success (Page 2). We are committed to managing sustainability and strive to put the right people, pro-cesses and partners in place to help us achieve our vision (Page 6).
Since we began a formal approach to sustainability in 2006, we have broadened and deepened our efforts by embedding sustainability within our operations and our supply chain. Our extensive framework of policies and management systems is well established and continues to evolve as we face new challenges. For example, we established a new company-wide human rights policy in 2013 to ensure that we foster and maintain a respon-sible and safe work environment for our employees and in our supply chain.
Many of the sustainability challenges we encounter are too complex to be tackled by one organization alone. We
therefore participate in several multi-stakeholder pro-grams that allow us to bundle resources and expertise to develop effective solutions.
Engaging our Stakeholders Engaging our stake-holders is essential in how we do business. By listening to their ideas and needs, we better understand their expectations and can identify emerging opportunities and challenges in our markets.
In 2013, we further evolved our formal sustainability materiality process, which helps us to understand the sustainability issues material to Ball and our stake-holders so we are better able to focus our resources, reporting and stakeholder engagement. Around 200 global stakeholders—customers, shareholders, sup-pliers, trade associations, academia and employees— participated in our 2013 materiality survey. The issues they identified as high priorities correspond to the pri-orities we identified in our first formal survey in 2009 and to those we address in this sustainability report.
One unexpected result was that stakeholders indicated they do not consider our community engagement efforts
to be very important for Ball’s success. We remain con-vinced there is value in being a good corporate citizen in the regions where we operate. It strengthens our repu-tation, inspires employee engagement and supports our goal to be the employer of choice in our regions.
Sustainability Governance Since 2009, Ball’s Sustainability Steering Committee (SSC) ensures that sustainability is fully aligned with and integrated into our strategies, as well as balanced with stakeholder expectations. The SSC, composed of corporate and operations senior executives responsible for imple-menting our sustainability strategy, meets quarterly.
Risk Management We systematically identify and assess risks and develop management plans in each of our businesses, encompassing major risks like supply chain, commodity and currency volatility, human capi-tal, financial risk and legislative action. Sustainability issues addressed within this framework include risks related to natural resources, climate change, human rights and regulations related to packaging.

Forward-Looking StatementsThis report contains “forward-looking” statements concerning future events and financial performance. Words such as “expects,” “anticipates,” “estimates” and similar expressions identify forward-looking statements. Such statements are subject to risks and uncertainties, which could cause actual results to differ materially from those expressed or implied. The company undertakes no obligation to publicly update or revise any forward-looking statements, whether as a result of new information, future events or otherwise. Key risks and uncertainties are summarized in filings with the Securities and Exchange Commission, including Exhibit 99 in our Form 10-K, which are available on our website and at www.sec.gov. Factors that might affect: a) our packaging segments include product demand fluctuations; availability/cost of raw materials; competitive packaging, pricing and substitution; changes in climate and weather; crop yields; competitive activity; failure to achieve productivity improvements or cost reductions; mandatory deposit or other restrictive packaging laws; changes in major customer or supplier contracts or loss of a major customer or supplier; political instability and sanctions; and changes in foreign exchange or tax rates; b) our aerospace segment include funding, authorization, availability and returns of government and commercial contracts; and delays, extensions and technical uncertainties affecting segment contracts; c) the company as a whole include those listed plus: changes in senior management; successful or unsuccessful acquisitions and divestitures; regulatory action or issues including tax, environmental, health and workplace safety, including U.S. FDA and other actions or public concerns affecting products filled in our containers, or chemicals or substances used in raw materials or in the manufacturing process; technological developments and innovations; litigation; strikes; labor cost changes; rates of return on assets of the company’s defined benefit retirement plans; pension changes; uncertainties surrounding the U.S. government budget, sequestration and debt limit; reduced cash flow; ability to achieve cost-out initiatives; interest rates affecting our debt.
CONTACTSInvestor Relations +1 (303) 460-3537www.ball.com/investors
Corporate Communications+1 (303) [email protected]/media-room
Sustainability+1 (303) [email protected]/sustainability
Follow Us Online www.facebook.com/BallCorpHQ www.twitter.com/BallCorpHQ www.linkedin.com/company/ball www.youtube.com/user/BallCorp
You can download this report along with additional sustainability information at www.ball.com/sustainability

Ball Corporation10 Longs Peak DriveBroomfield, CO 80021USA+1 (303) 469-3131www.ball.com
© Ball Corporation 2014. All rights reserved. Ball and the Ball logo and names of Ball products are trademarks or registered trademarks of Ball Corporation.


![Horizontal Motion: [1] - · PDF fileHorizontal Motion: The horizontal ... then tangential and normal components of acceleration are ... determine the ball’s velocity and the normal](https://img.pdfslide.net/doc/110x75/5a7ea5497f8b9ae9398ea3e8/horizontal-motion-1-motion-the-horizontal-then-tangential-and-normal-components.jpg)