Embed Size (px)
Citation preview
Ball Diamonds per 10,000 Residents
FY 2009
Diamonds per 10,000 Residents City Population
Number of Ball Diamonds
5.7Portland, Ore. 557,706 3185.5St. Paul 279,590 1545.1Minneapolis 382,605 1955.0Baton Rouge 223,689 1114.1Pittsburgh 310,037 1283.9Scottsdale 235,371 923.7Cincinnati 333,336 1253.7Norfolk 234,220 863.5Jacksonville 807,815 2853.2Cleveland 433,748 1393.2Baltimore 636,919 2043.2St. Louis 356,730 1133.2Kansas City, Mo. 480,129 1523.2Virginia Beach 433,746 1373.1Tampa 340,882 1073.1Omaha 438,646 1373.0Colorado Springs 397,317 1213.0Buffalo 270,919 813.0Toledo 293,201 872.7Philadelphia 1,540,351 4122.7Plano 267,480 712.5Corpus Christi 286,462 732.5Honolulu/Honolulu County 877,024 2212.5Greensboro, N.C. 250,642 622.4Lexington/Fayette 292,240 712.4Detroit 912,062 2192.4Boston 620,535 1482.3Anchorage/Anchorage Borough 279,243 652.2Denver 598,707 1342.2Henderson 252,064 562.2San Diego 1,305,754 2902.2Sacramento 463,794 1012.1Glendale, Ariz. 251,522 532.0Washington, D.C. 591,833 120
7/16/2010 Page 1 of 3Center for City Park Excellencewww.tpl.org/ccpe
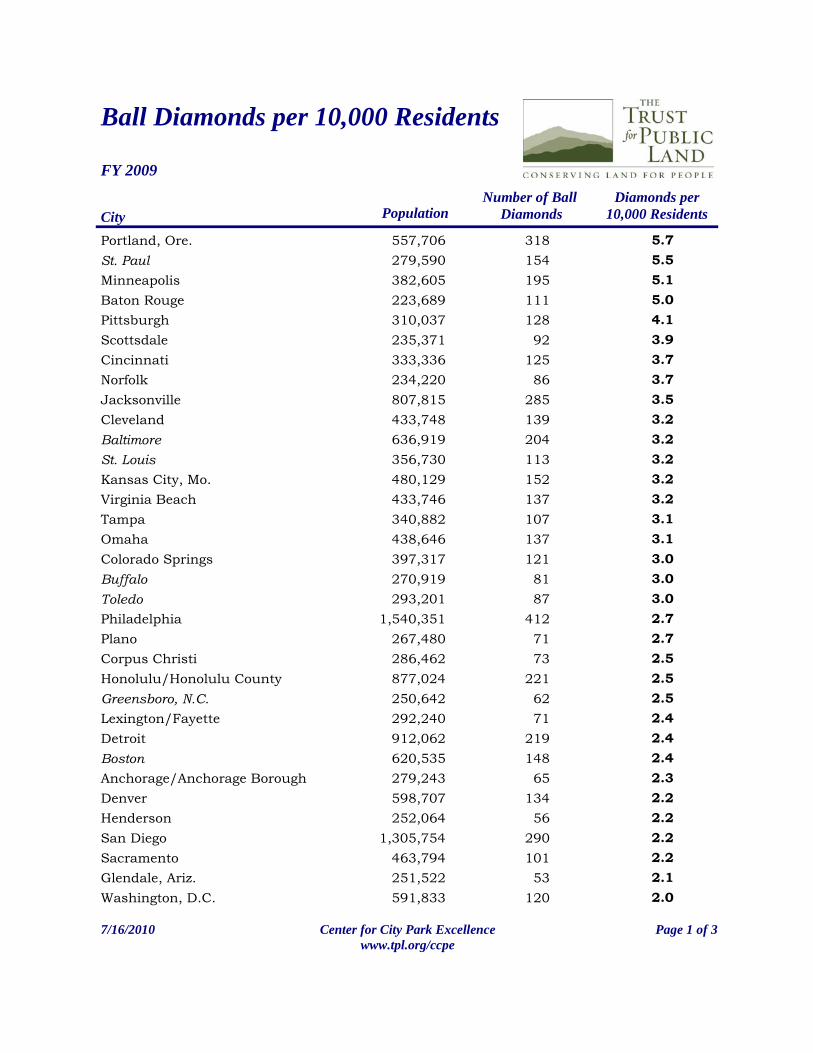
Diamonds per 10,000 Residents City Population
Number of Ball Diamonds
2.0Tucson 541,811 1061.9Seattle 598,541 1141.9Chicago 2,853,114 5341.7Orlando 230,519 401.7St. Petersburg 245,314 421.7Memphis 669,651 1141.7Stockton 287,037 481.7Birmingham 228,798 381.6Riverside, Calif. 295,357 461.6Fort Wayne 251,591 391.5Raleigh 392,552 601.5Atlanta 537,958 811.5Nashville/Davidson 596,462 891.5Lincoln 251,624 371.4Wichita 366,046 531.4Newark, NJ 278,980 391.3Long Beach 463,789 621.3Durham 223,284 291.3Anaheim 335,288 431.3Arlington, Tex. 374,417 481.3Milwaukee/Milwaukee County 953,328 1221.3Santa Ana 339,130 431.3Aurora, Colo. 319,057 401.2Columbus 754,885 901.2Albuquerque 521,999 621.2Louisville 713,877 841.1Fresno 476,050 541.1Chandler, Ariz. 247,140 281.1Madison 231,916 261.1Houston 2,242,193 2501.1Oakland 404,155 441.0El Paso 613,190 600.9San Francisco 808,976 720.9Tulsa 385,635 340.9New York 8,363,710 7250.9Las Vegas 558,383 480.8Austin 757,688 630.8Charlotte/Mecklenburg 890,515 720.8Mesa 463,552 35
7/16/2010 Page 2 of 3Center for City Park Excellencewww.tpl.org/ccpe
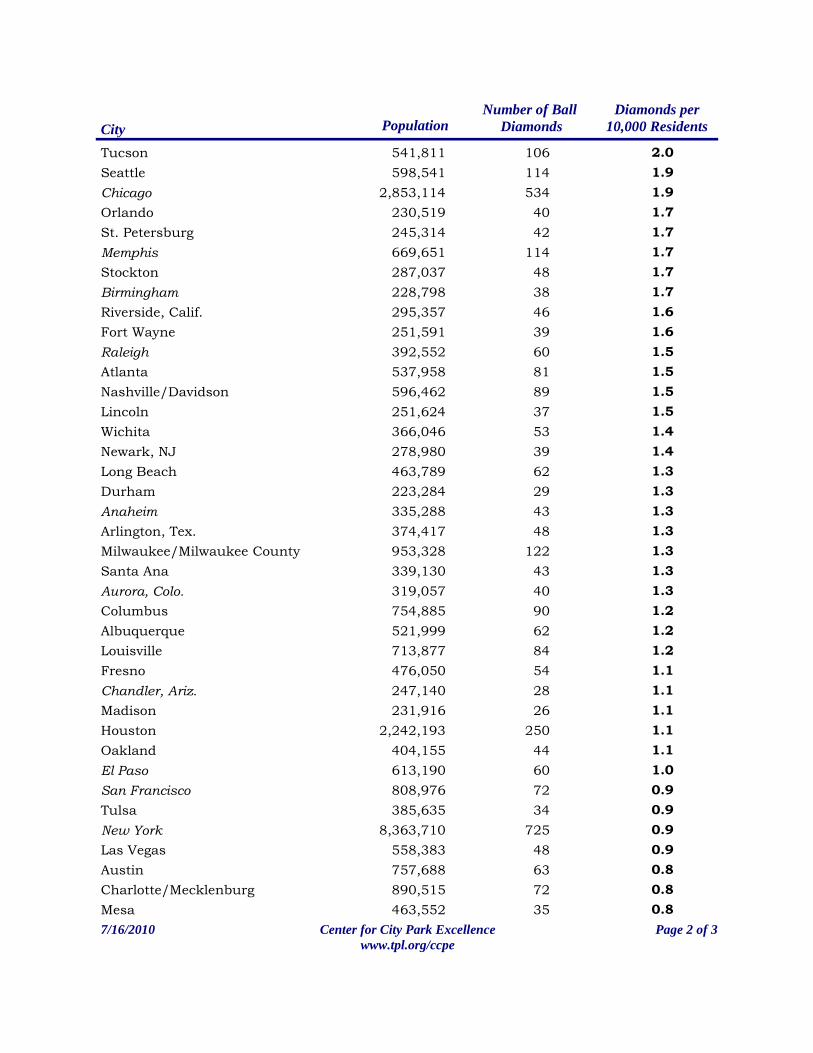
Diamonds per 10,000 Residents City Population
Number of Ball Diamonds
0.7Phoenix 1,567,924 1160.7Indianapolis 798,382 560.7Los Angeles 3,833,995 2590.6Fort Worth 703,073 450.6Miami 413,201 260.5San Jose 948,279 460.4Jersey City 241,114 100.4San Antonio 1,351,305 540.4Bakersfield 321,078 120.4Oklahoma City 551,789 200.3New Orleans 311,853 90.3Dallas 1,279,910 32
Average, All Cities: 1.9
Ball diamonds include both baseball and softball diamonds. If a city has more than one agency, ball diamonds are combined.
Median, All Cities: 1.6
9,167Total, All Cities:
Italic indicates estimate based on prior year information.
7/16/2010 Page 3 of 3Center for City Park Excellencewww.tpl.org/ccpe
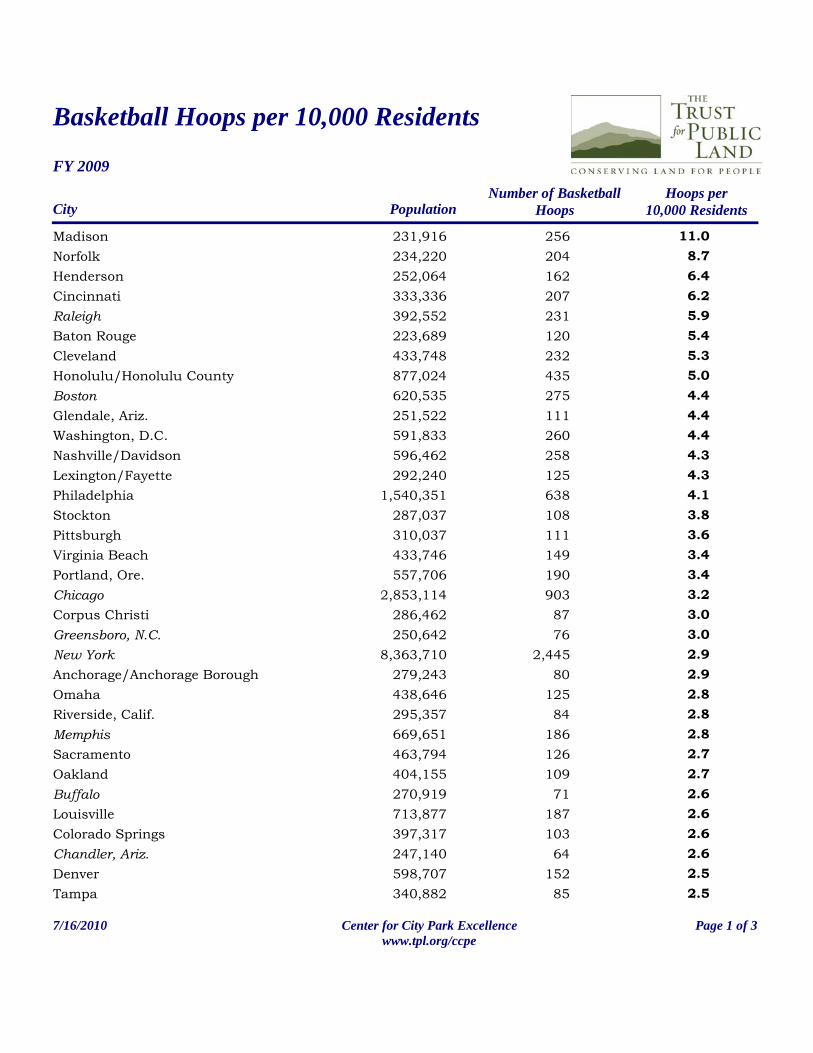
Basketball Hoops per 10,000 Residents
FY 2009
CityNumber of Basketball
HoopsPopulationHoops per
10,000 Residents
Madison 231,916 256 11.0Norfolk 234,220 204 8.7Henderson 252,064 162 6.4Cincinnati 333,336 207 6.2Raleigh 392,552 231 5.9Baton Rouge 223,689 120 5.4Cleveland 433,748 232 5.3Honolulu/Honolulu County 877,024 435 5.0Boston 620,535 275 4.4Glendale, Ariz. 251,522 111 4.4Washington, D.C. 591,833 260 4.4Nashville/Davidson 596,462 258 4.3Lexington/Fayette 292,240 125 4.3Philadelphia 1,540,351 638 4.1Stockton 287,037 108 3.8Pittsburgh 310,037 111 3.6Virginia Beach 433,746 149 3.4Portland, Ore. 557,706 190 3.4Chicago 2,853,114 903 3.2Corpus Christi 286,462 87 3.0Greensboro, N.C. 250,642 76 3.0New York 8,363,710 2,445 2.9Anchorage/Anchorage Borough 279,243 80 2.9Omaha 438,646 125 2.8Riverside, Calif. 295,357 84 2.8Memphis 669,651 186 2.8Sacramento 463,794 126 2.7Oakland 404,155 109 2.7Buffalo 270,919 71 2.6Louisville 713,877 187 2.6Colorado Springs 397,317 103 2.6Chandler, Ariz. 247,140 64 2.6Denver 598,707 152 2.5Tampa 340,882 85 2.5
7/16/2010 Page 1 of 3Center for City Park Excellencewww.tpl.org/ccpe
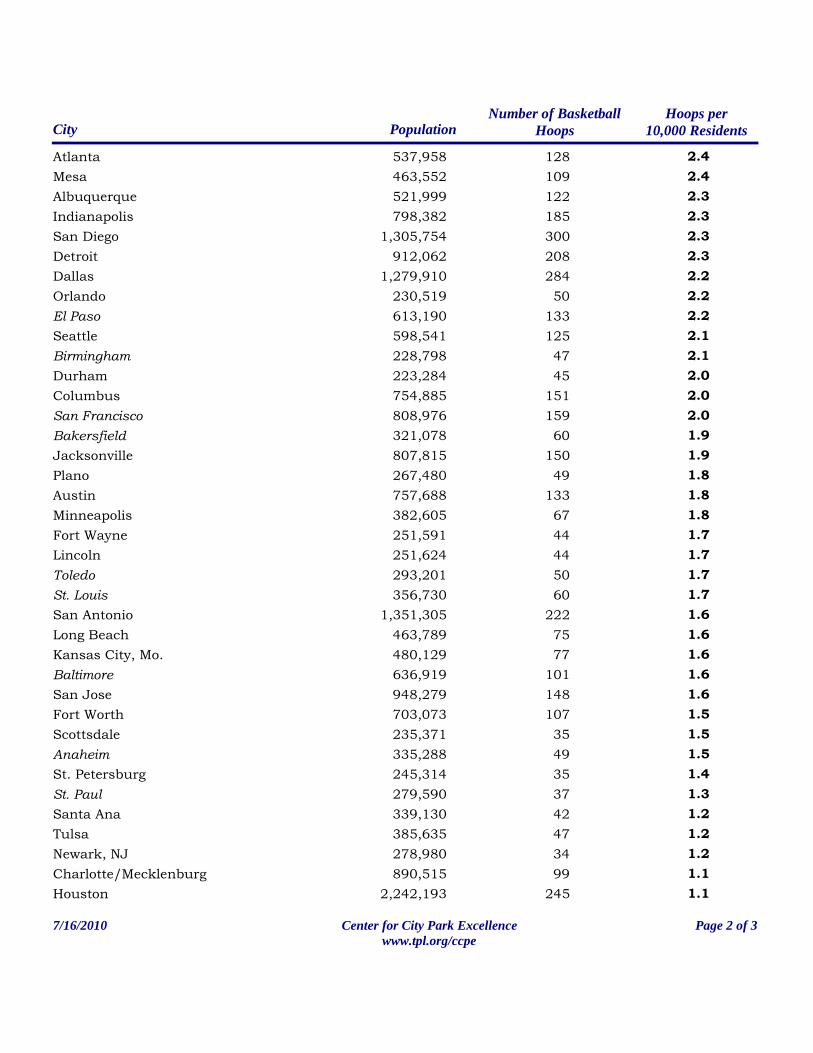
CityNumber of Basketball
HoopsPopulationHoops per
10,000 Residents
Atlanta 537,958 128 2.4Mesa 463,552 109 2.4Albuquerque 521,999 122 2.3Indianapolis 798,382 185 2.3San Diego 1,305,754 300 2.3Detroit 912,062 208 2.3Dallas 1,279,910 284 2.2Orlando 230,519 50 2.2El Paso 613,190 133 2.2Seattle 598,541 125 2.1Birmingham 228,798 47 2.1Durham 223,284 45 2.0Columbus 754,885 151 2.0San Francisco 808,976 159 2.0Bakersfield 321,078 60 1.9Jacksonville 807,815 150 1.9Plano 267,480 49 1.8Austin 757,688 133 1.8Minneapolis 382,605 67 1.8Fort Wayne 251,591 44 1.7Lincoln 251,624 44 1.7Toledo 293,201 50 1.7St. Louis 356,730 60 1.7San Antonio 1,351,305 222 1.6Long Beach 463,789 75 1.6Kansas City, Mo. 480,129 77 1.6Baltimore 636,919 101 1.6San Jose 948,279 148 1.6Fort Worth 703,073 107 1.5Scottsdale 235,371 35 1.5Anaheim 335,288 49 1.5St. Petersburg 245,314 35 1.4St. Paul 279,590 37 1.3Santa Ana 339,130 42 1.2Tulsa 385,635 47 1.2Newark, NJ 278,980 34 1.2Charlotte/Mecklenburg 890,515 99 1.1Houston 2,242,193 245 1.1
7/16/2010 Page 2 of 3Center for City Park Excellencewww.tpl.org/ccpe
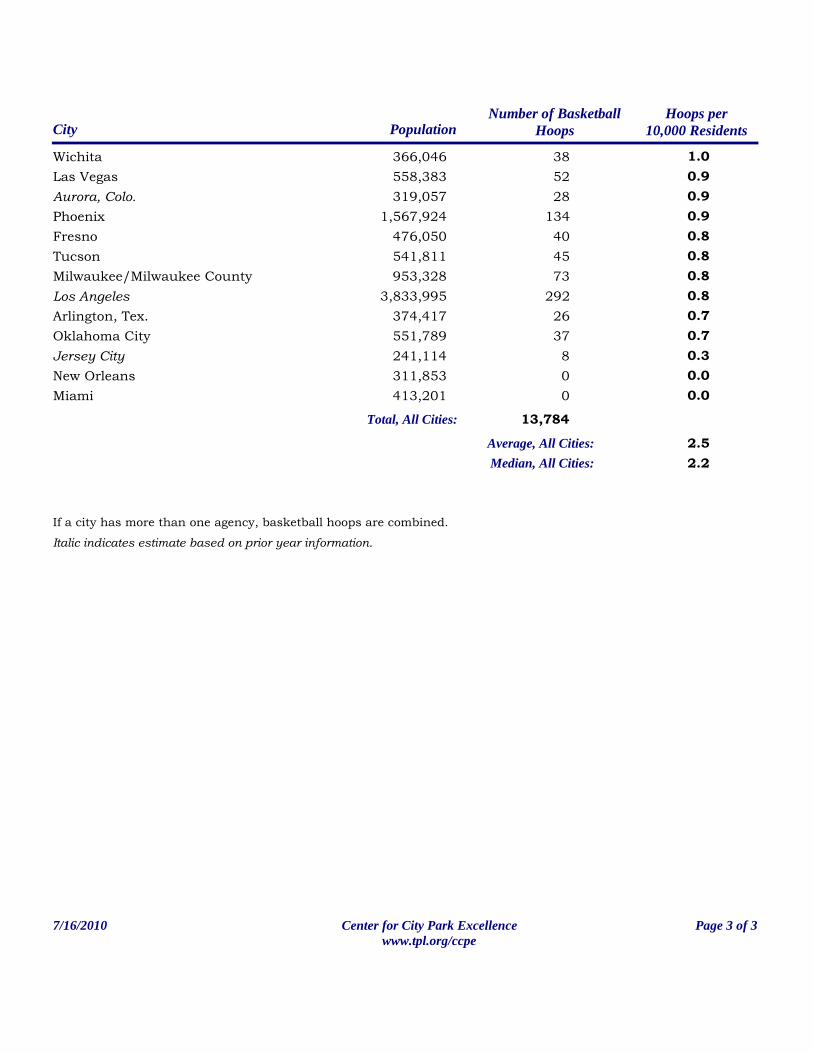
CityNumber of Basketball
HoopsPopulationHoops per
10,000 Residents
Wichita 366,046 38 1.0Las Vegas 558,383 52 0.9Aurora, Colo. 319,057 28 0.9Phoenix 1,567,924 134 0.9Fresno 476,050 40 0.8Tucson 541,811 45 0.8Milwaukee/Milwaukee County 953,328 73 0.8Los Angeles 3,833,995 292 0.8Arlington, Tex. 374,417 26 0.7Oklahoma City 551,789 37 0.7Jersey City 241,114 8 0.3New Orleans 311,853 0 0.0Miami 413,201 0 0.0
13,784
2.52.2
Average, All Cities:Median, All Cities:
Total, All Cities:
If a city has more than one agency, basketball hoops are combined.
Italic indicates estimate based on prior year information.
7/16/2010 Page 3 of 3Center for City Park Excellencewww.tpl.org/ccpe
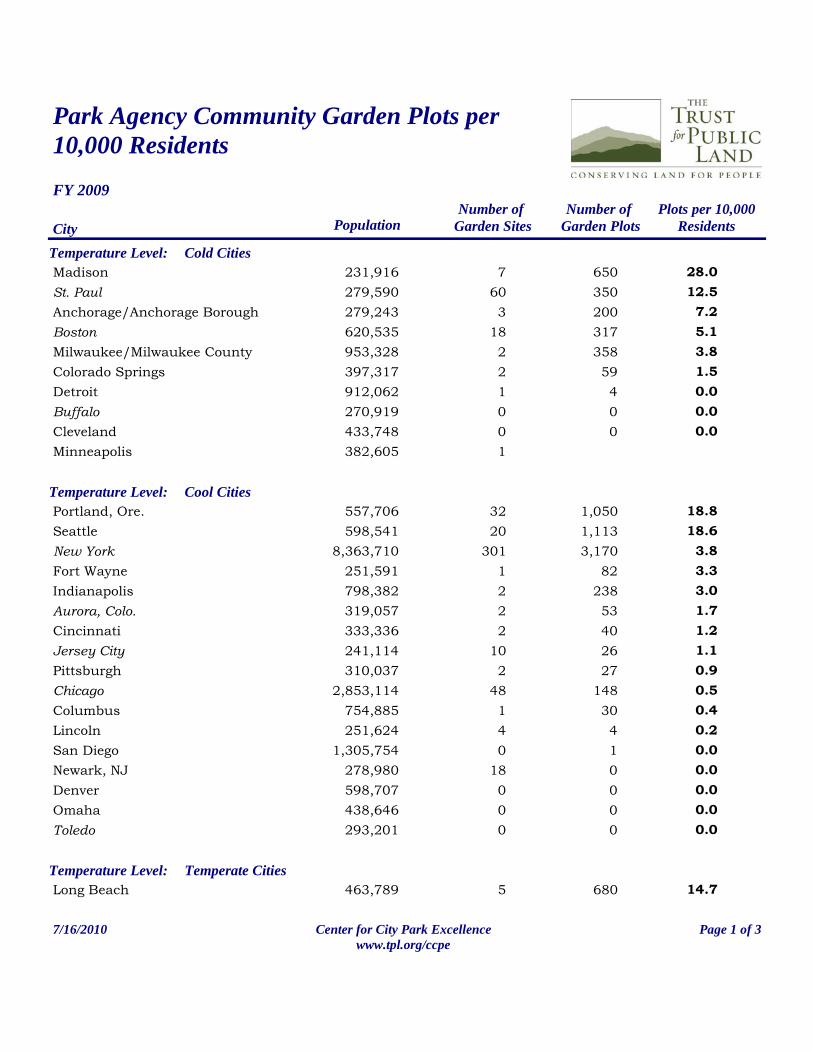
Park Agency Community Garden Plots per 10,000 Residents
FY 2009Plots per 10,000
Residents City PopulationNumber of
Garden SitesNumber of
Garden Plots
Cold CitiesTemperature Level:28.0Madison 231,916 650712.5St. Paul 279,590 350607.2Anchorage/Anchorage Borough 279,243 20035.1Boston 620,535 317183.8Milwaukee/Milwaukee County 953,328 35821.5Colorado Springs 397,317 5920.0Detroit 912,062 410.0Buffalo 270,919 000.0Cleveland 433,748 00
Minneapolis 382,605 1
Cool CitiesTemperature Level:18.8Portland, Ore. 557,706 1,0503218.6Seattle 598,541 1,113203.8New York 8,363,710 3,1703013.3Fort Wayne 251,591 8213.0Indianapolis 798,382 23821.7Aurora, Colo. 319,057 5321.2Cincinnati 333,336 4021.1Jersey City 241,114 26100.9Pittsburgh 310,037 2720.5Chicago 2,853,114 148480.4Columbus 754,885 3010.2Lincoln 251,624 440.0San Diego 1,305,754 100.0Newark, NJ 278,980 0180.0Denver 598,707 000.0Omaha 438,646 000.0Toledo 293,201 00
Temperate CitiesTemperature Level:14.7Long Beach 463,789 6805
7/16/2010 Page 1 of 3Center for City Park Excellencewww.tpl.org/ccpe
Plots per 10,000 Residents City Population
Number of Garden Sites
Number of Garden Plots
9.9San Jose 948,279 938198.6Baltimore 636,919 55078.1Washington, D.C. 591,833 477136.4Louisville 713,877 45646.3Philadelphia 1,540,351 97145.1Lexington/Fayette 292,240 150153.8Kansas City, Mo. 480,129 18423.7Oakland 404,155 150132.6Wichita 366,046 9510.2Norfolk 234,220 530.1Nashville/Davidson 596,462 330.0San Francisco 808,976 1350.0Albuquerque 521,999 010.0St. Louis 356,730 000.0Virginia Beach 433,746 00
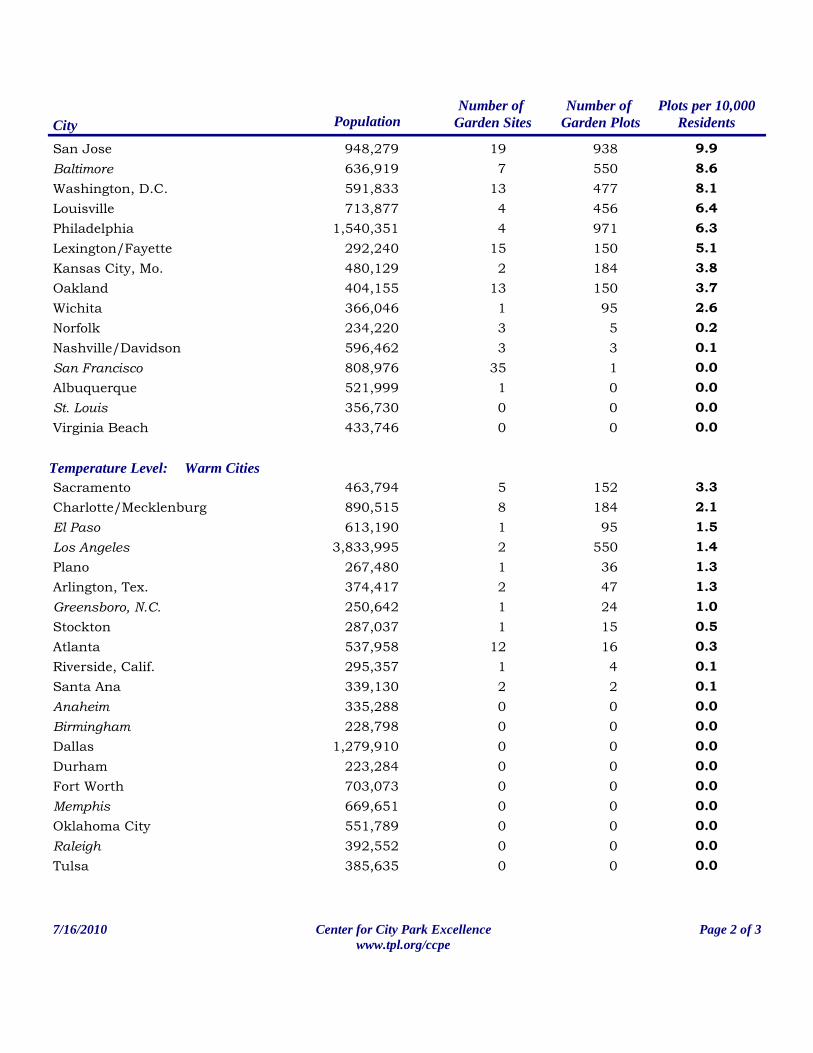
Warm CitiesTemperature Level:3.3Sacramento 463,794 15252.1Charlotte/Mecklenburg 890,515 18481.5El Paso 613,190 9511.4Los Angeles 3,833,995 55021.3Plano 267,480 3611.3Arlington, Tex. 374,417 4721.0Greensboro, N.C. 250,642 2410.5Stockton 287,037 1510.3Atlanta 537,958 16120.1Riverside, Calif. 295,357 410.1Santa Ana 339,130 220.0Anaheim 335,288 000.0Birmingham 228,798 000.0Dallas 1,279,910 000.0Durham 223,284 000.0Fort Worth 703,073 000.0Memphis 669,651 000.0Oklahoma City 551,789 000.0Raleigh 392,552 000.0Tulsa 385,635 00
7/16/2010 Page 2 of 3Center for City Park Excellencewww.tpl.org/ccpe
Plots per 10,000 Residents City Population
Number of Garden Sites
Number of Garden Plots
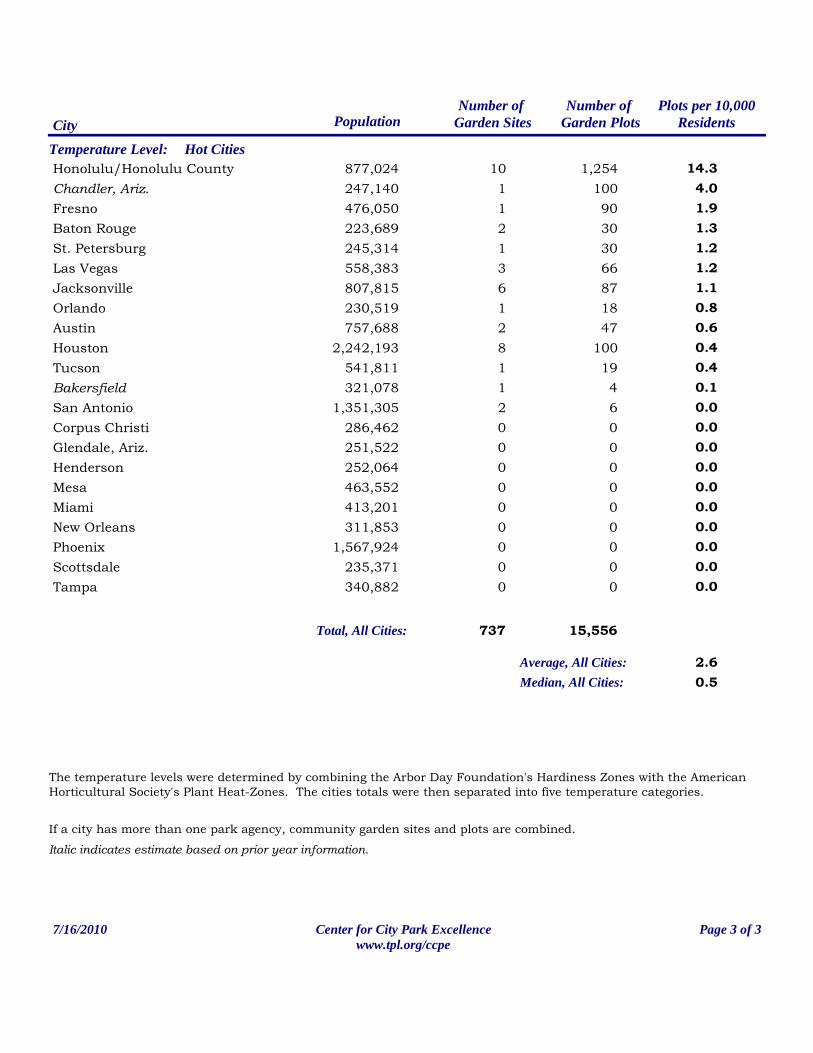
Hot CitiesTemperature Level:14.3Honolulu/Honolulu County 877,024 1,254104.0Chandler, Ariz. 247,140 10011.9Fresno 476,050 9011.3Baton Rouge 223,689 3021.2St. Petersburg 245,314 3011.2Las Vegas 558,383 6631.1Jacksonville 807,815 8760.8Orlando 230,519 1810.6Austin 757,688 4720.4Houston 2,242,193 10080.4Tucson 541,811 1910.1Bakersfield 321,078 410.0San Antonio 1,351,305 620.0Corpus Christi 286,462 000.0Glendale, Ariz. 251,522 000.0Henderson 252,064 000.0Mesa 463,552 000.0Miami 413,201 000.0New Orleans 311,853 000.0Phoenix 1,567,924 000.0Scottsdale 235,371 000.0Tampa 340,882 00
Average, All Cities: 2.6Median, All Cities: 0.5
15,556Total, All Cities: 737
If a city has more than one park agency, community garden sites and plots are combined.
The temperature levels were determined by combining the Arbor Day Foundation's Hardiness Zones with the American Horticultural Society's Plant Heat-Zones. The cities totals were then separated into five temperature categories.
Italic indicates estimate based on prior year information.
7/16/2010 Page 3 of 3Center for City Park Excellencewww.tpl.org/ccpe
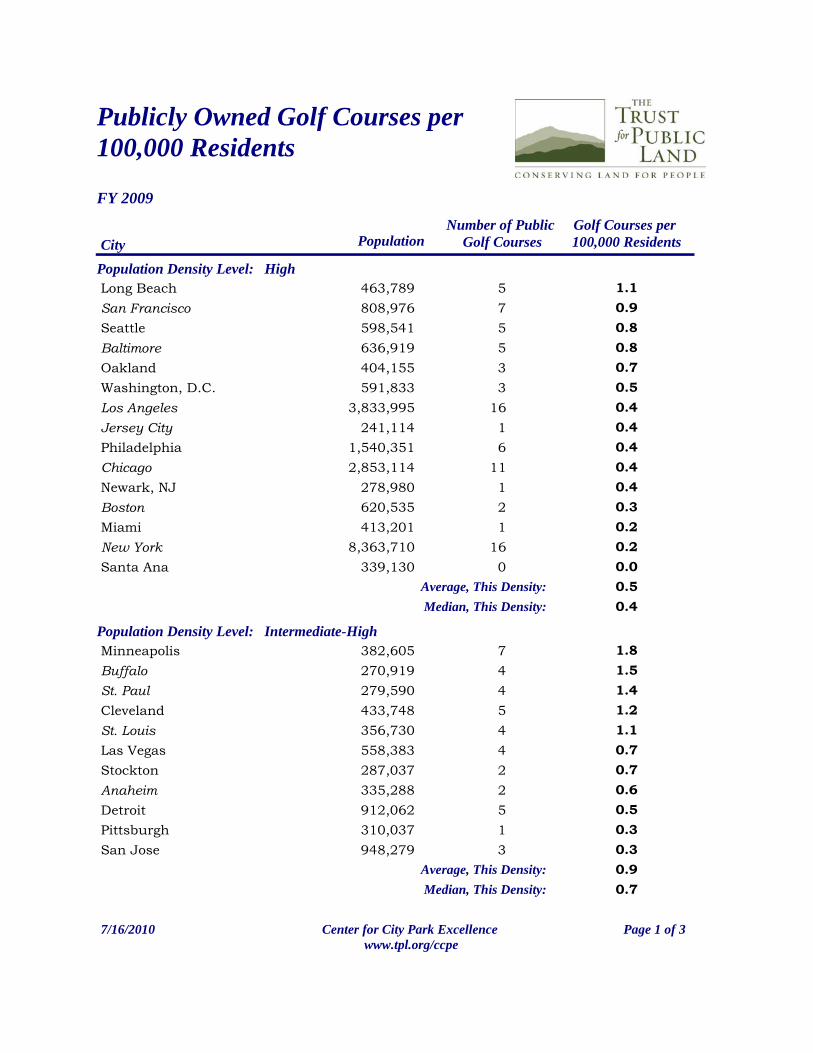
Publicly Owned Golf Courses per 100,000 Residents
FY 2009
Golf Courses per 100,000 ResidentsCity Population
Number of Public Golf Courses
Population Density Level: High1.1Long Beach 463,789 50.9San Francisco 808,976 70.8Seattle 598,541 50.8Baltimore 636,919 50.7Oakland 404,155 30.5Washington, D.C. 591,833 30.4Los Angeles 3,833,995 160.4Jersey City 241,114 10.4Philadelphia 1,540,351 60.4Chicago 2,853,114 110.4Newark, NJ 278,980 10.3Boston 620,535 20.2Miami 413,201 10.2New York 8,363,710 160.0Santa Ana 339,130 0
Average, This Density: 0.5Median, This Density: 0.4
Population Density Level: Intermediate-High1.8Minneapolis 382,605 71.5Buffalo 270,919 41.4St. Paul 279,590 41.2Cleveland 433,748 51.1St. Louis 356,730 40.7Las Vegas 558,383 40.7Stockton 287,037 20.6Anaheim 335,288 20.5Detroit 912,062 50.3Pittsburgh 310,037 10.3San Jose 948,279 3
Average, This Density: 0.9Median, This Density: 0.7
7/16/2010 Page 1 of 3Center for City Park Excellence www.tpl.org/ccpe
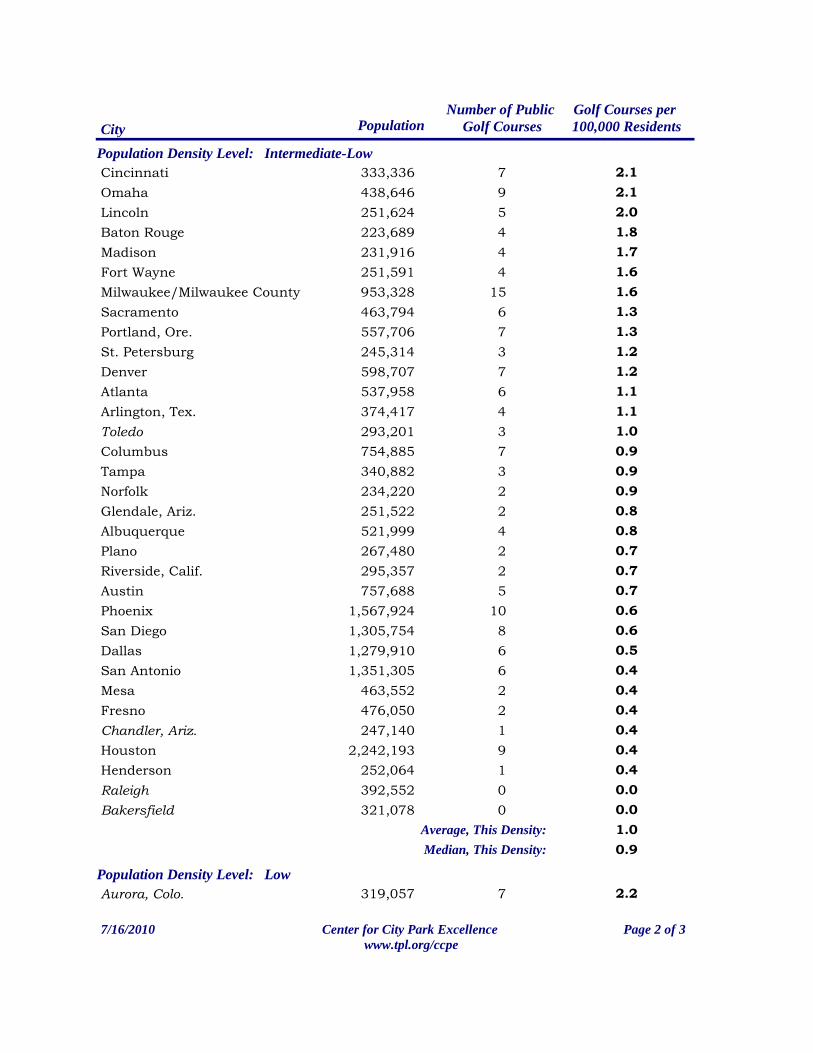
Golf Courses per 100,000 ResidentsCity Population
Number of Public Golf Courses
Population Density Level: Intermediate-Low2.1Cincinnati 333,336 72.1Omaha 438,646 92.0Lincoln 251,624 51.8Baton Rouge 223,689 41.7Madison 231,916 41.6Fort Wayne 251,591 41.6Milwaukee/Milwaukee County 953,328 151.3Sacramento 463,794 61.3Portland, Ore. 557,706 71.2St. Petersburg 245,314 31.2Denver 598,707 71.1Atlanta 537,958 61.1Arlington, Tex. 374,417 41.0Toledo 293,201 30.9Columbus 754,885 70.9Tampa 340,882 30.9Norfolk 234,220 20.8Glendale, Ariz. 251,522 20.8Albuquerque 521,999 40.7Plano 267,480 20.7Riverside, Calif. 295,357 20.7Austin 757,688 50.6Phoenix 1,567,924 100.6San Diego 1,305,754 80.5Dallas 1,279,910 60.4San Antonio 1,351,305 60.4Mesa 463,552 20.4Fresno 476,050 20.4Chandler, Ariz. 247,140 10.4Houston 2,242,193 90.4Henderson 252,064 10.0Raleigh 392,552 00.0Bakersfield 321,078 0
Average, This Density: 1.0Median, This Density: 0.9
Population Density Level: Low2.2Aurora, Colo. 319,057 7
7/16/2010 Page 2 of 3Center for City Park Excellence www.tpl.org/ccpe
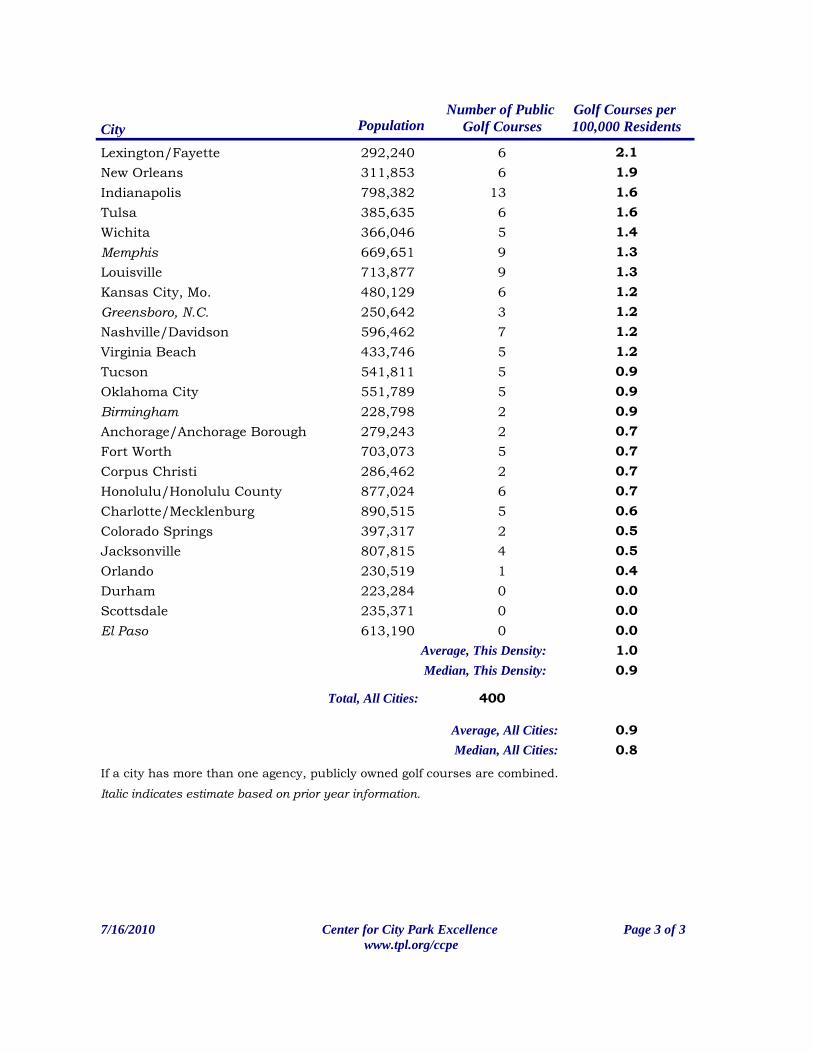
Golf Courses per 100,000 ResidentsCity Population
Number of Public Golf Courses
2.1Lexington/Fayette 292,240 61.9New Orleans 311,853 61.6Indianapolis 798,382 131.6Tulsa 385,635 61.4Wichita 366,046 51.3Memphis 669,651 91.3Louisville 713,877 91.2Kansas City, Mo. 480,129 61.2Greensboro, N.C. 250,642 31.2Nashville/Davidson 596,462 71.2Virginia Beach 433,746 50.9Tucson 541,811 50.9Oklahoma City 551,789 50.9Birmingham 228,798 20.7Anchorage/Anchorage Borough 279,243 20.7Fort Worth 703,073 50.7Corpus Christi 286,462 20.7Honolulu/Honolulu County 877,024 60.6Charlotte/Mecklenburg 890,515 50.5Colorado Springs 397,317 20.5Jacksonville 807,815 40.4Orlando 230,519 10.0Durham 223,284 00.0Scottsdale 235,371 00.0El Paso 613,190 0
Average, This Density: 1.0Median, This Density: 0.9
Average, All Cities: 0.9Median, All Cities: 0.8
If a city has more than one agency, publicly owned golf courses are combined.
400Total, All Cities:
Italic indicates estimate based on prior year information.
7/16/2010 Page 3 of 3Center for City Park Excellence www.tpl.org/ccpe
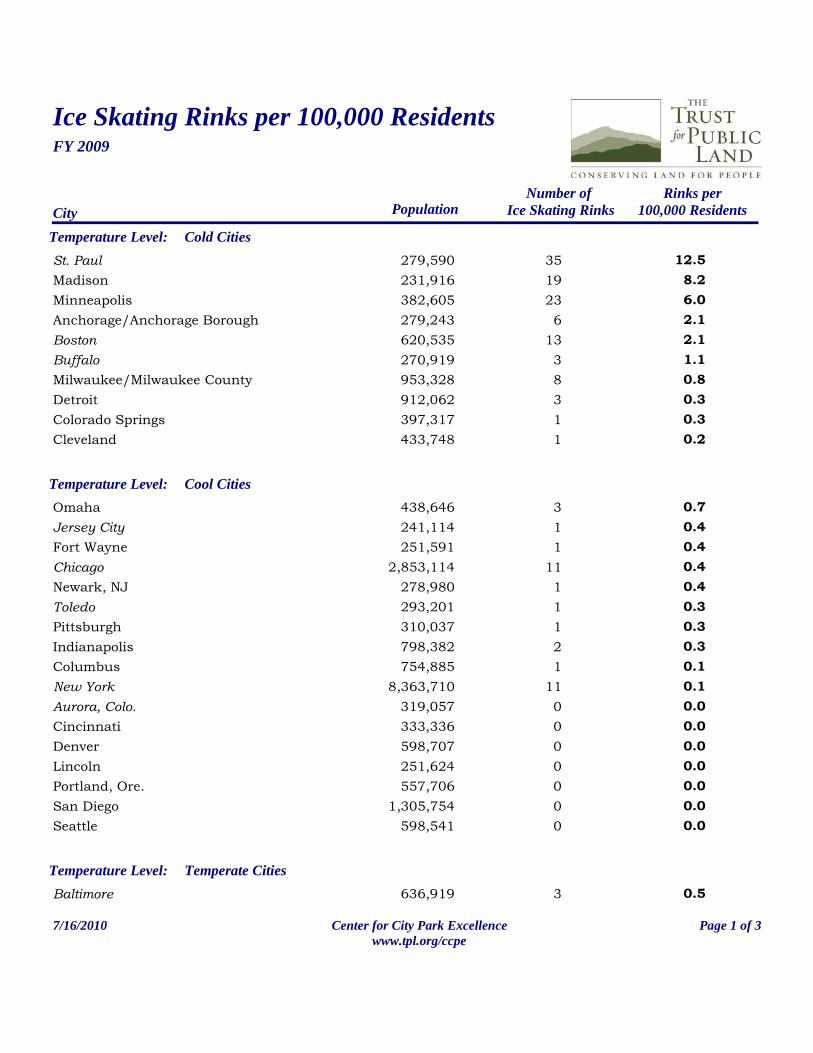
Ice Skating Rinks per 100,000 ResidentsFY 2009
CityNumber of
Ice Skating RinksPopulationRinks per
100,000 Residents
Cold CitiesTemperature Level:St. Paul 279,590 35 12.5Madison 231,916 19 8.2Minneapolis 382,605 23 6.0Anchorage/Anchorage Borough 279,243 6 2.1Boston 620,535 13 2.1Buffalo 270,919 3 1.1Milwaukee/Milwaukee County 953,328 8 0.8Detroit 912,062 3 0.3Colorado Springs 397,317 1 0.3Cleveland 433,748 1 0.2
Cool CitiesTemperature Level:Omaha 438,646 3 0.7Jersey City 241,114 1 0.4Fort Wayne 251,591 1 0.4Chicago 2,853,114 11 0.4Newark, NJ 278,980 1 0.4Toledo 293,201 1 0.3Pittsburgh 310,037 1 0.3Indianapolis 798,382 2 0.3Columbus 754,885 1 0.1New York 8,363,710 11 0.1Aurora, Colo. 319,057 0 0.0Cincinnati 333,336 0 0.0Denver 598,707 0 0.0Lincoln 251,624 0 0.0Portland, Ore. 557,706 0 0.0San Diego 1,305,754 0 0.0Seattle 598,541 0 0.0
Temperate CitiesTemperature Level:Baltimore 636,919 3 0.5
7/16/2010 Page 1 of 3Center for City Park Excellencewww.tpl.org/ccpe
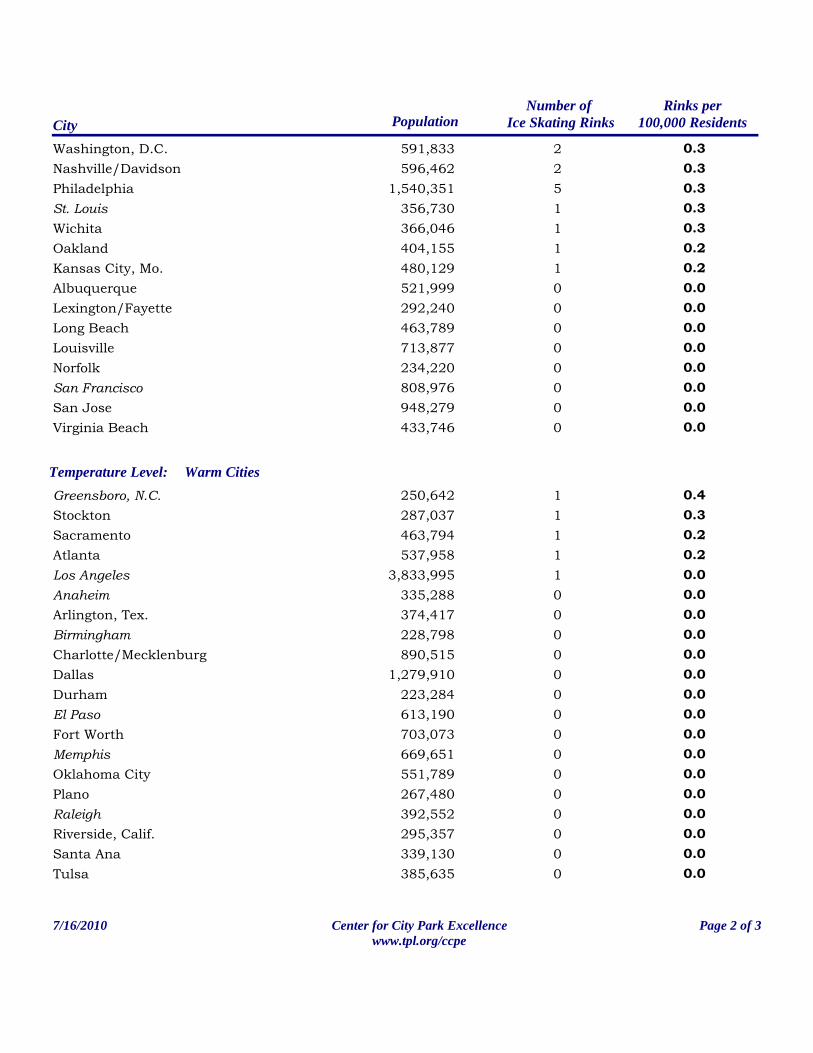
CityNumber of
Ice Skating RinksPopulationRinks per
100,000 Residents
Washington, D.C. 591,833 2 0.3Nashville/Davidson 596,462 2 0.3Philadelphia 1,540,351 5 0.3St. Louis 356,730 1 0.3Wichita 366,046 1 0.3Oakland 404,155 1 0.2Kansas City, Mo. 480,129 1 0.2Albuquerque 521,999 0 0.0Lexington/Fayette 292,240 0 0.0Long Beach 463,789 0 0.0Louisville 713,877 0 0.0Norfolk 234,220 0 0.0San Francisco 808,976 0 0.0San Jose 948,279 0 0.0Virginia Beach 433,746 0 0.0
Warm CitiesTemperature Level:Greensboro, N.C. 250,642 1 0.4Stockton 287,037 1 0.3Sacramento 463,794 1 0.2Atlanta 537,958 1 0.2Los Angeles 3,833,995 1 0.0Anaheim 335,288 0 0.0Arlington, Tex. 374,417 0 0.0Birmingham 228,798 0 0.0Charlotte/Mecklenburg 890,515 0 0.0Dallas 1,279,910 0 0.0Durham 223,284 0 0.0El Paso 613,190 0 0.0Fort Worth 703,073 0 0.0Memphis 669,651 0 0.0Oklahoma City 551,789 0 0.0Plano 267,480 0 0.0Raleigh 392,552 0 0.0Riverside, Calif. 295,357 0 0.0Santa Ana 339,130 0 0.0Tulsa 385,635 0 0.0
7/16/2010 Page 2 of 3Center for City Park Excellencewww.tpl.org/ccpe
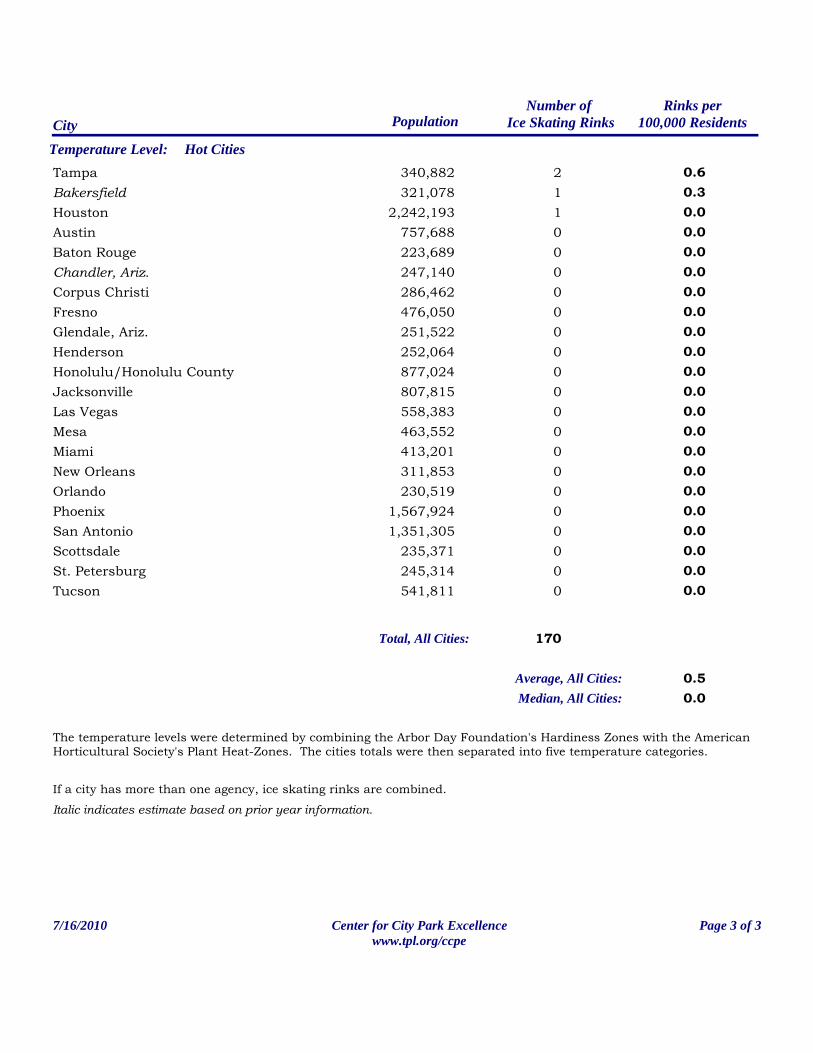
CityNumber of
Ice Skating RinksPopulationRinks per
100,000 Residents
Hot CitiesTemperature Level:Tampa 340,882 2 0.6Bakersfield 321,078 1 0.3Houston 2,242,193 1 0.0Austin 757,688 0 0.0Baton Rouge 223,689 0 0.0Chandler, Ariz. 247,140 0 0.0Corpus Christi 286,462 0 0.0Fresno 476,050 0 0.0Glendale, Ariz. 251,522 0 0.0Henderson 252,064 0 0.0Honolulu/Honolulu County 877,024 0 0.0Jacksonville 807,815 0 0.0Las Vegas 558,383 0 0.0Mesa 463,552 0 0.0Miami 413,201 0 0.0New Orleans 311,853 0 0.0Orlando 230,519 0 0.0Phoenix 1,567,924 0 0.0San Antonio 1,351,305 0 0.0Scottsdale 235,371 0 0.0St. Petersburg 245,314 0 0.0Tucson 541,811 0 0.0
170Total, All Cities:
If a city has more than one agency, ice skating rinks are combined.
The temperature levels were determined by combining the Arbor Day Foundation's Hardiness Zones with the American Horticultural Society's Plant Heat-Zones. The cities totals were then separated into five temperature categories.
Italic indicates estimate based on prior year information.
Average, All Cities: 0.50.0Median, All Cities:
7/16/2010 Page 3 of 3Center for City Park Excellencewww.tpl.org/ccpe
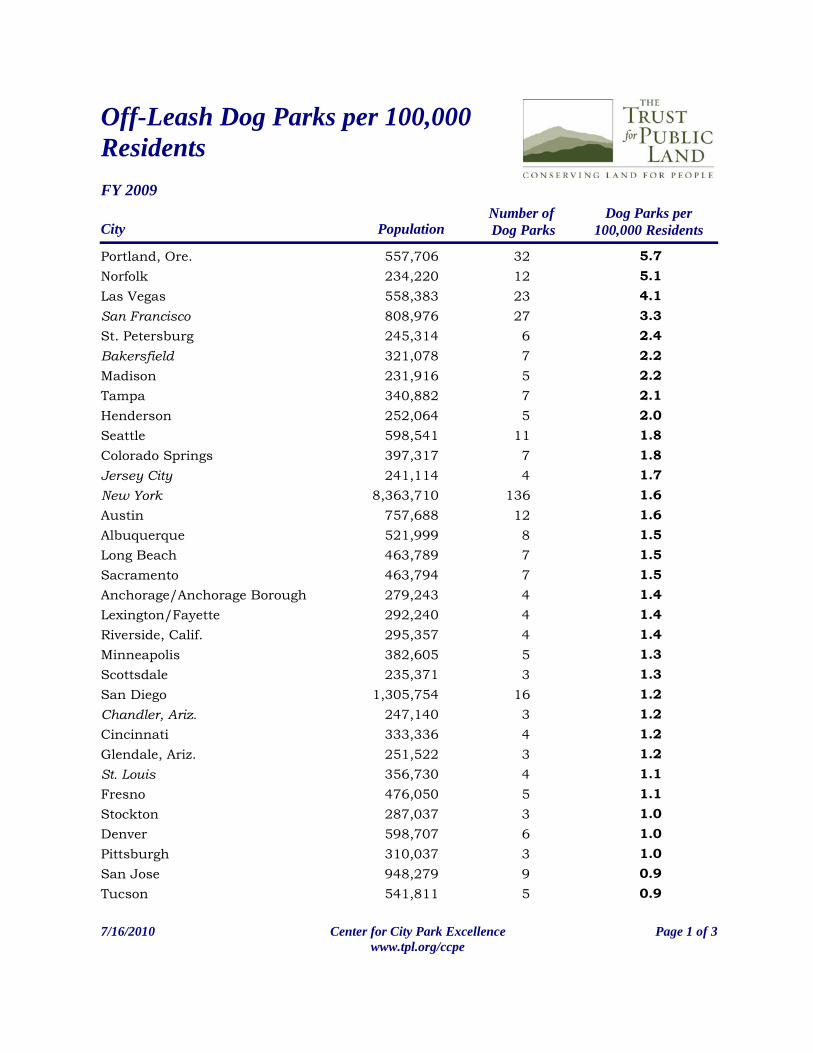
Off-Leash Dog Parks per 100,000 ResidentsFY 2009
Dog Parks per 100,000 Residents City Population
Number of Dog Parks
5.7Portland, Ore. 557,706 325.1Norfolk 234,220 124.1Las Vegas 558,383 233.3San Francisco 808,976 272.4St. Petersburg 245,314 62.2Bakersfield 321,078 72.2Madison 231,916 52.1Tampa 340,882 72.0Henderson 252,064 51.8Seattle 598,541 111.8Colorado Springs 397,317 71.7Jersey City 241,114 41.6New York 8,363,710 1361.6Austin 757,688 121.5Albuquerque 521,999 81.5Long Beach 463,789 71.5Sacramento 463,794 71.4Anchorage/Anchorage Borough 279,243 41.4Lexington/Fayette 292,240 41.4Riverside, Calif. 295,357 41.3Minneapolis 382,605 51.3Scottsdale 235,371 31.2San Diego 1,305,754 161.2Chandler, Ariz. 247,140 31.2Cincinnati 333,336 41.2Glendale, Ariz. 251,522 31.1St. Louis 356,730 41.1Fresno 476,050 51.0Stockton 287,037 31.0Denver 598,707 61.0Pittsburgh 310,037 30.9San Jose 948,279 90.9Tucson 541,811 5
7/16/2010 Page 1 of 3Center for City Park Excellencewww.tpl.org/ccpe
Dog Parks per 100,000 Residents City Population
Number of Dog Parks
0.9Durham 223,284 20.9Baton Rouge 223,689 20.8Lincoln 251,624 20.8Raleigh 392,552 30.7Oakland 404,155 30.7Miami 413,201 30.6Charlotte/Mecklenburg 890,515 50.5Tulsa 385,635 20.5Washington, D.C. 591,833 30.5Nashville/Davidson 596,462 30.5Houston 2,242,193 110.5Boston 620,535 30.5Virginia Beach 433,746 20.5Honolulu/Honolulu County 877,024 40.5Omaha 438,646 20.4Chicago 2,853,114 120.4Louisville 713,877 30.4Milwaukee/Milwaukee County 953,328 40.4Greensboro, N.C. 250,642 10.4Fort Wayne 251,591 10.4Indianapolis 798,382 30.4Plano 267,480 10.4Atlanta 537,958 20.4Buffalo 270,919 10.4St. Paul 279,590 10.3Philadelphia 1,540,351 50.3New Orleans 311,853 10.3Phoenix 1,567,924 50.3Aurora, Colo. 319,057 10.3Arlington, Tex. 374,417 10.3Columbus 754,885 20.3Los Angeles 3,833,995 100.2Cleveland 433,748 10.2Mesa 463,552 10.2Kansas City, Mo. 480,129 10.2Oklahoma City 551,789 10.2El Paso 613,190 10.2Baltimore 636,919 1
7/16/2010 Page 2 of 3Center for City Park Excellencewww.tpl.org/ccpe
Dog Parks per 100,000 Residents City Population
Number of Dog Parks
0.2Dallas 1,279,910 20.1Memphis 669,651 10.1San Antonio 1,351,305 20.1Fort Worth 703,073 10.1Jacksonville 807,815 10.0Anaheim 335,288 00.0Birmingham 228,798 00.0Corpus Christi 286,462 00.0Detroit 912,062 00.0Newark, NJ 278,980 00.0Orlando 230,519 00.0Santa Ana 339,130 00.0Toledo 293,201 00.0Wichita 366,046 0
Average, All Cities: 0.9Median, All Cities: 0.5
If a city has more than one agency, off-leash dog parks are combined.
514Total, All Cities:
Italic indicates estimate based on prior year information.
7/16/2010 Page 3 of 3Center for City Park Excellencewww.tpl.org/ccpe
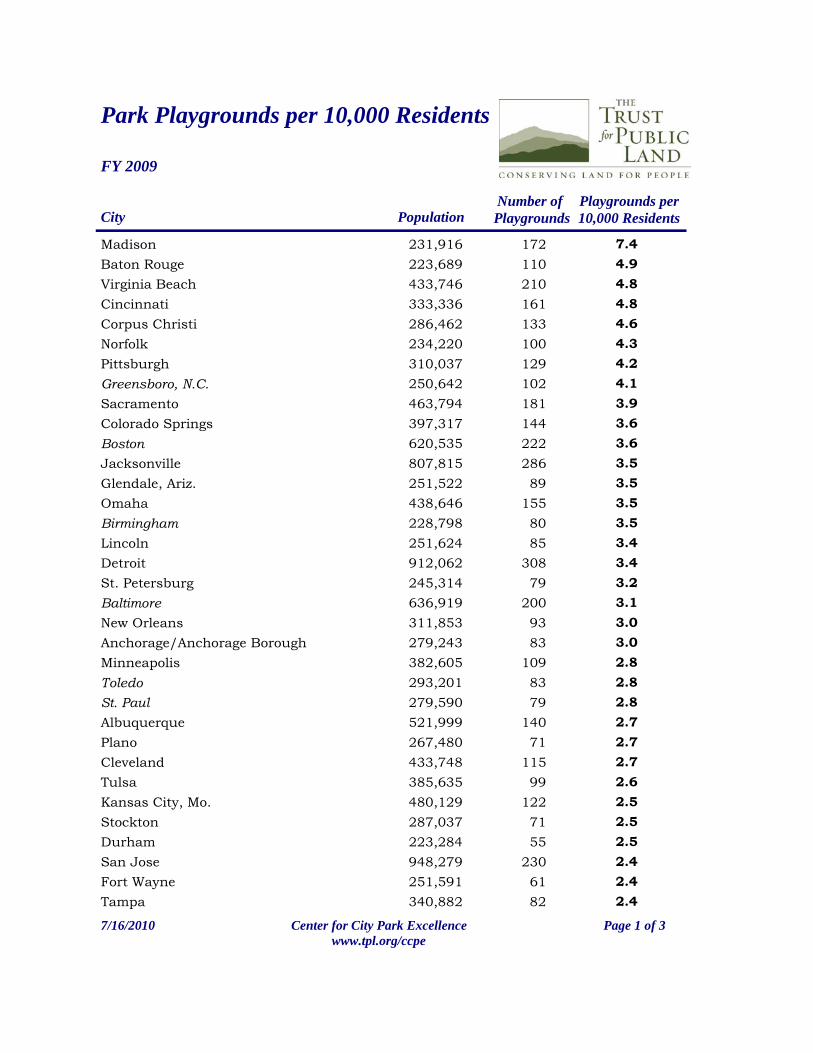
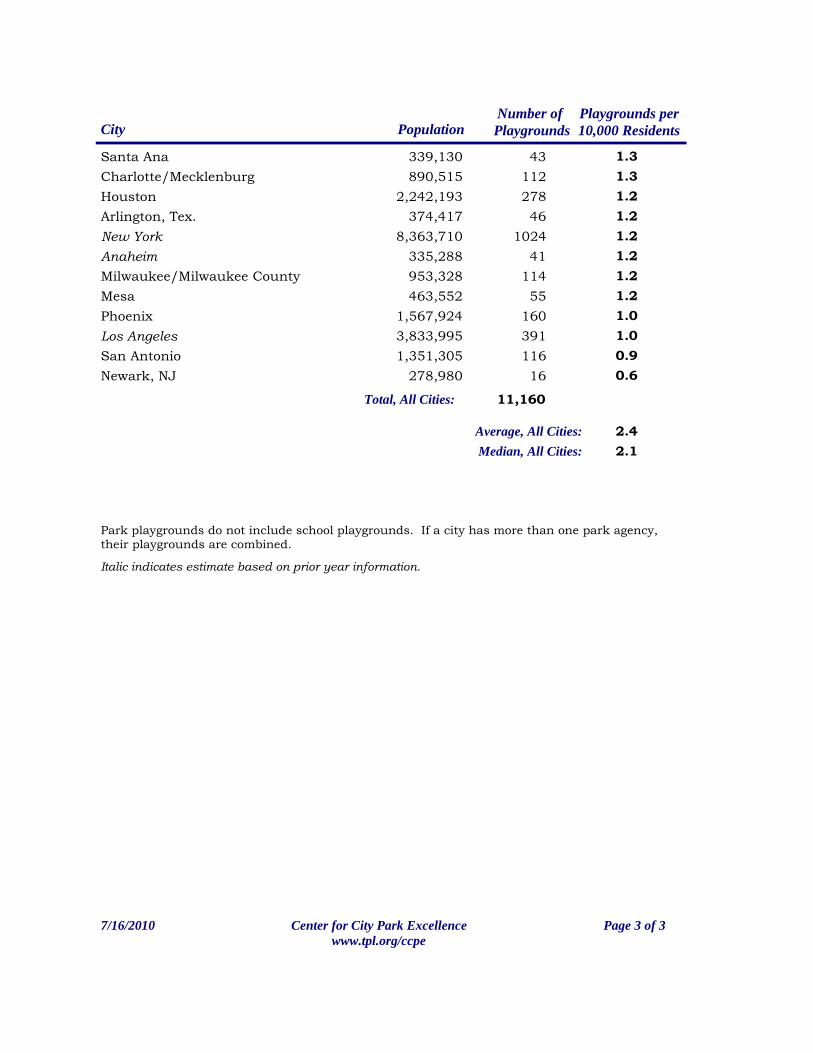
Park Playgrounds per 10,000 Residents
FY 2009
CityNumber of Playgrounds
Playgrounds per10,000 ResidentsPopulation
Madison 172 7.4231,916Baton Rouge 110 4.9223,689Virginia Beach 210 4.8433,746Cincinnati 161 4.8333,336Corpus Christi 133 4.6286,462Norfolk 100 4.3234,220Pittsburgh 129 4.2310,037Greensboro, N.C. 102 4.1250,642Sacramento 181 3.9463,794Colorado Springs 144 3.6397,317Boston 222 3.6620,535Jacksonville 286 3.5807,815Glendale, Ariz. 89 3.5251,522Omaha 155 3.5438,646Birmingham 80 3.5228,798Lincoln 85 3.4251,624Detroit 308 3.4912,062St. Petersburg 79 3.2245,314Baltimore 200 3.1636,919New Orleans 93 3.0311,853Anchorage/Anchorage Borough 83 3.0279,243Minneapolis 109 2.8382,605Toledo 83 2.8293,201St. Paul 79 2.8279,590Albuquerque 140 2.7521,999Plano 71 2.7267,480Cleveland 115 2.7433,748Tulsa 99 2.6385,635Kansas City, Mo. 122 2.5480,129Stockton 71 2.5287,037Durham 55 2.5223,284San Jose 230 2.4948,279Fort Wayne 61 2.4251,591Tampa 82 2.4340,882
7/16/2010 Page 1 of 3Center for City Park Excellencewww.tpl.org/ccpe
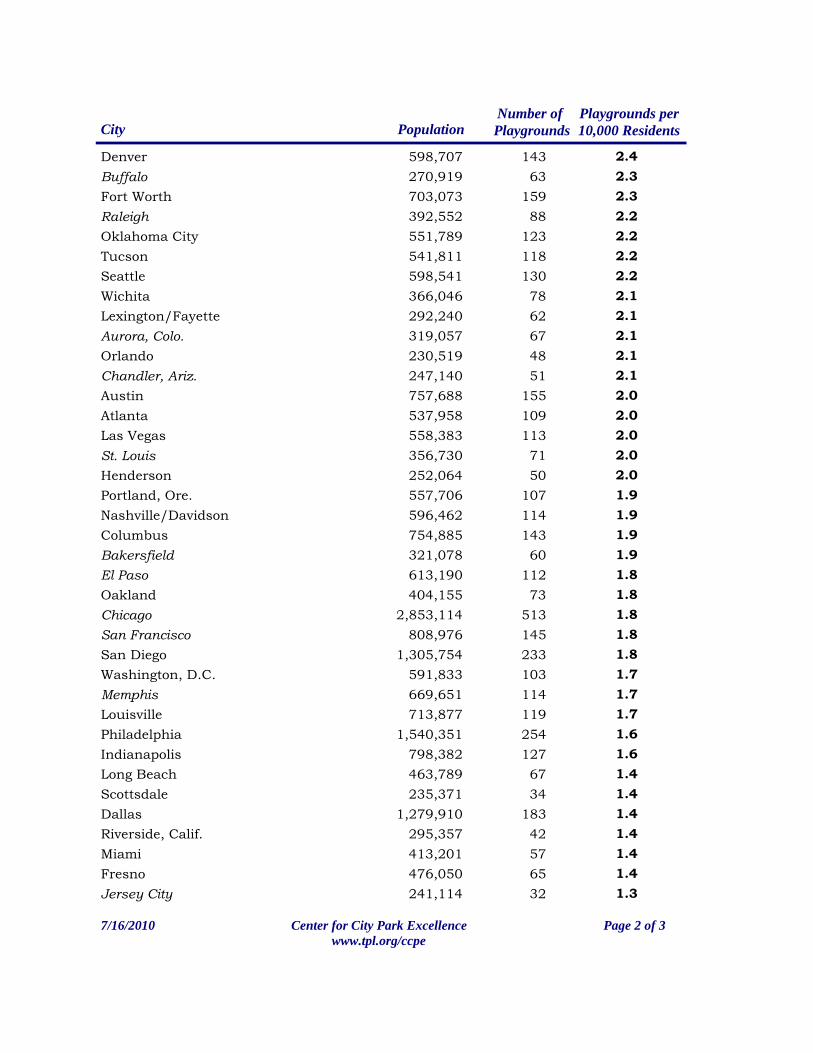
CityNumber of Playgrounds
Playgrounds per10,000 ResidentsPopulation
Denver 143 2.4598,707Buffalo 63 2.3270,919Fort Worth 159 2.3703,073Raleigh 88 2.2392,552Oklahoma City 123 2.2551,789Tucson 118 2.2541,811Seattle 130 2.2598,541Wichita 78 2.1366,046Lexington/Fayette 62 2.1292,240Aurora, Colo. 67 2.1319,057Orlando 48 2.1230,519Chandler, Ariz. 51 2.1247,140Austin 155 2.0757,688Atlanta 109 2.0537,958Las Vegas 113 2.0558,383St. Louis 71 2.0356,730Henderson 50 2.0252,064Portland, Ore. 107 1.9557,706Nashville/Davidson 114 1.9596,462Columbus 143 1.9754,885Bakersfield 60 1.9321,078El Paso 112 1.8613,190Oakland 73 1.8404,155Chicago 513 1.82,853,114San Francisco 145 1.8808,976San Diego 233 1.81,305,754Washington, D.C. 103 1.7591,833Memphis 114 1.7669,651Louisville 119 1.7713,877Philadelphia 254 1.61,540,351Indianapolis 127 1.6798,382Long Beach 67 1.4463,789Scottsdale 34 1.4235,371Dallas 183 1.41,279,910Riverside, Calif. 42 1.4295,357Miami 57 1.4413,201Fresno 65 1.4476,050Jersey City 32 1.3241,114
7/16/2010 Page 2 of 3Center for City Park Excellencewww.tpl.org/ccpe
CityNumber of Playgrounds
Playgrounds per10,000 ResidentsPopulation
Santa Ana 43 1.3339,130Charlotte/Mecklenburg 112 1.3890,515Houston 278 1.22,242,193Arlington, Tex. 46 1.2374,417New York 1024 1.28,363,710Anaheim 41 1.2335,288Milwaukee/Milwaukee County 114 1.2953,328Mesa 55 1.2463,552Phoenix 160 1.01,567,924Los Angeles 391 1.03,833,995San Antonio 116 0.91,351,305Newark, NJ 16 0.6278,980
Average, All Cities: 2.4
Park playgrounds do not include school playgrounds. If a city has more than one park agency, their playgrounds are combined.
Median, All Cities: 2.1
11,160Total, All Cities:
Italic indicates estimate based on prior year information.
7/16/2010 Page 3 of 3Center for City Park Excellencewww.tpl.org/ccpe
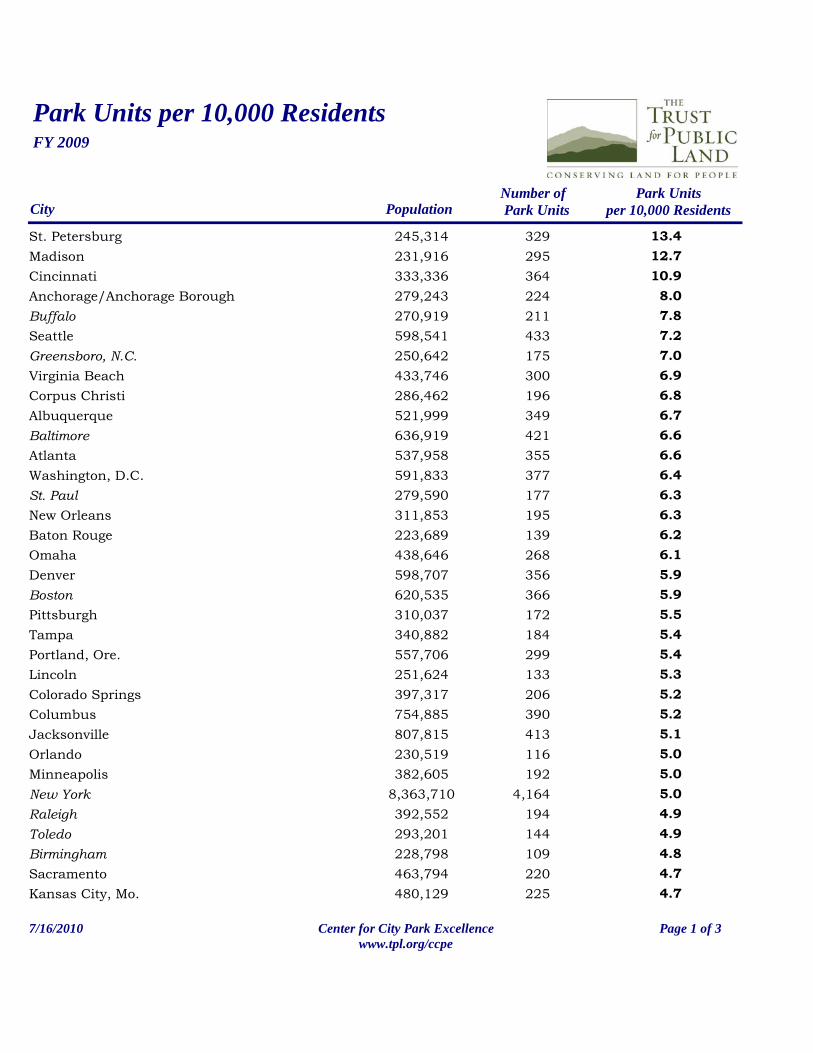
Park Units per 10,000 ResidentsFY 2009
Number of Park UnitsPopulation
Park Unitsper 10,000 ResidentsCity
St. Petersburg 329245,314 13.4Madison 295231,916 12.7Cincinnati 364333,336 10.9Anchorage/Anchorage Borough 224279,243 8.0Buffalo 211270,919 7.8Seattle 433598,541 7.2Greensboro, N.C. 175250,642 7.0Virginia Beach 300433,746 6.9Corpus Christi 196286,462 6.8Albuquerque 349521,999 6.7Baltimore 421636,919 6.6Atlanta 355537,958 6.6Washington, D.C. 377591,833 6.4St. Paul 177279,590 6.3New Orleans 195311,853 6.3Baton Rouge 139223,689 6.2Omaha 268438,646 6.1Denver 356598,707 5.9Boston 366620,535 5.9Pittsburgh 172310,037 5.5Tampa 184340,882 5.4Portland, Ore. 299557,706 5.4Lincoln 133251,624 5.3Colorado Springs 206397,317 5.2Columbus 390754,885 5.2Jacksonville 413807,815 5.1Orlando 116230,519 5.0Minneapolis 192382,605 5.0New York 4,1648,363,710 5.0Raleigh 194392,552 4.9Toledo 144293,201 4.9Birmingham 109228,798 4.8Sacramento 220463,794 4.7Kansas City, Mo. 225480,129 4.7
7/16/2010 Page 1 of 3Center for City Park Excellencewww.tpl.org/ccpe
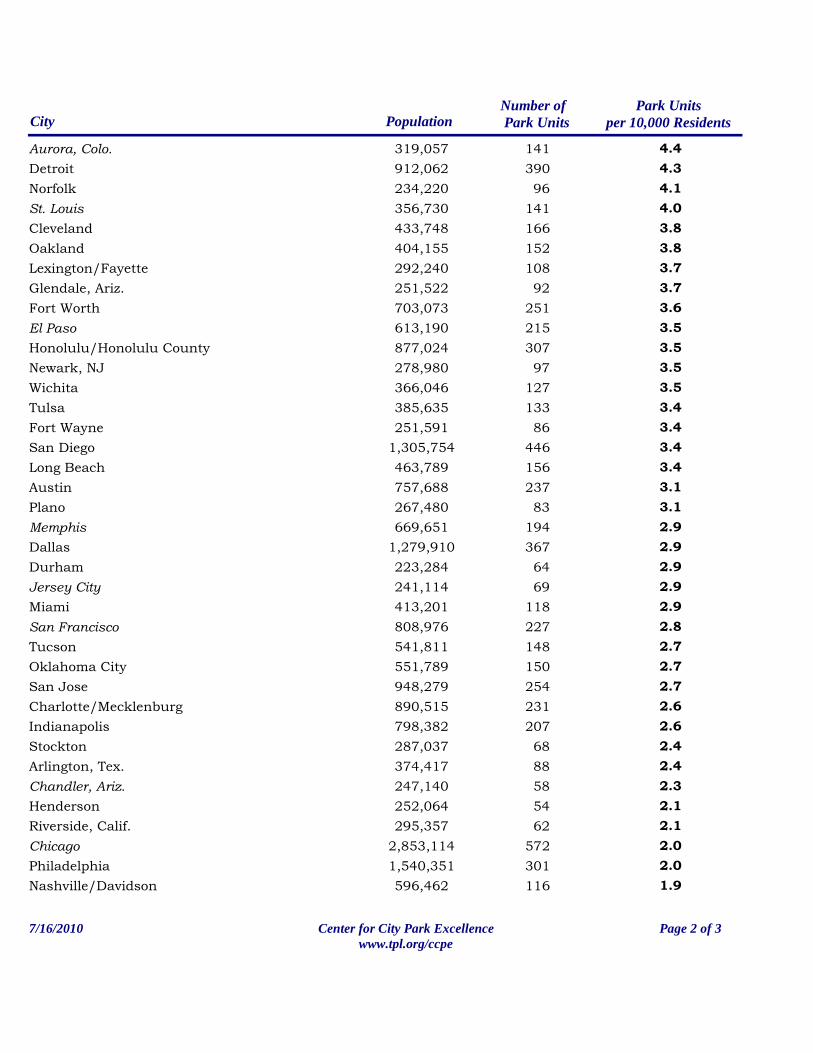
Number of Park UnitsPopulation
Park Unitsper 10,000 ResidentsCity
Aurora, Colo. 141319,057 4.4Detroit 390912,062 4.3Norfolk 96234,220 4.1St. Louis 141356,730 4.0Cleveland 166433,748 3.8Oakland 152404,155 3.8Lexington/Fayette 108292,240 3.7Glendale, Ariz. 92251,522 3.7Fort Worth 251703,073 3.6El Paso 215613,190 3.5Honolulu/Honolulu County 307877,024 3.5Newark, NJ 97278,980 3.5Wichita 127366,046 3.5Tulsa 133385,635 3.4Fort Wayne 86251,591 3.4San Diego 4461,305,754 3.4Long Beach 156463,789 3.4Austin 237757,688 3.1Plano 83267,480 3.1Memphis 194669,651 2.9Dallas 3671,279,910 2.9Durham 64223,284 2.9Jersey City 69241,114 2.9Miami 118413,201 2.9San Francisco 227808,976 2.8Tucson 148541,811 2.7Oklahoma City 150551,789 2.7San Jose 254948,279 2.7Charlotte/Mecklenburg 231890,515 2.6Indianapolis 207798,382 2.6Stockton 68287,037 2.4Arlington, Tex. 88374,417 2.4Chandler, Ariz. 58247,140 2.3Henderson 54252,064 2.1Riverside, Calif. 62295,357 2.1Chicago 5722,853,114 2.0Philadelphia 3011,540,351 2.0Nashville/Davidson 116596,462 1.9
7/16/2010 Page 2 of 3Center for City Park Excellencewww.tpl.org/ccpe
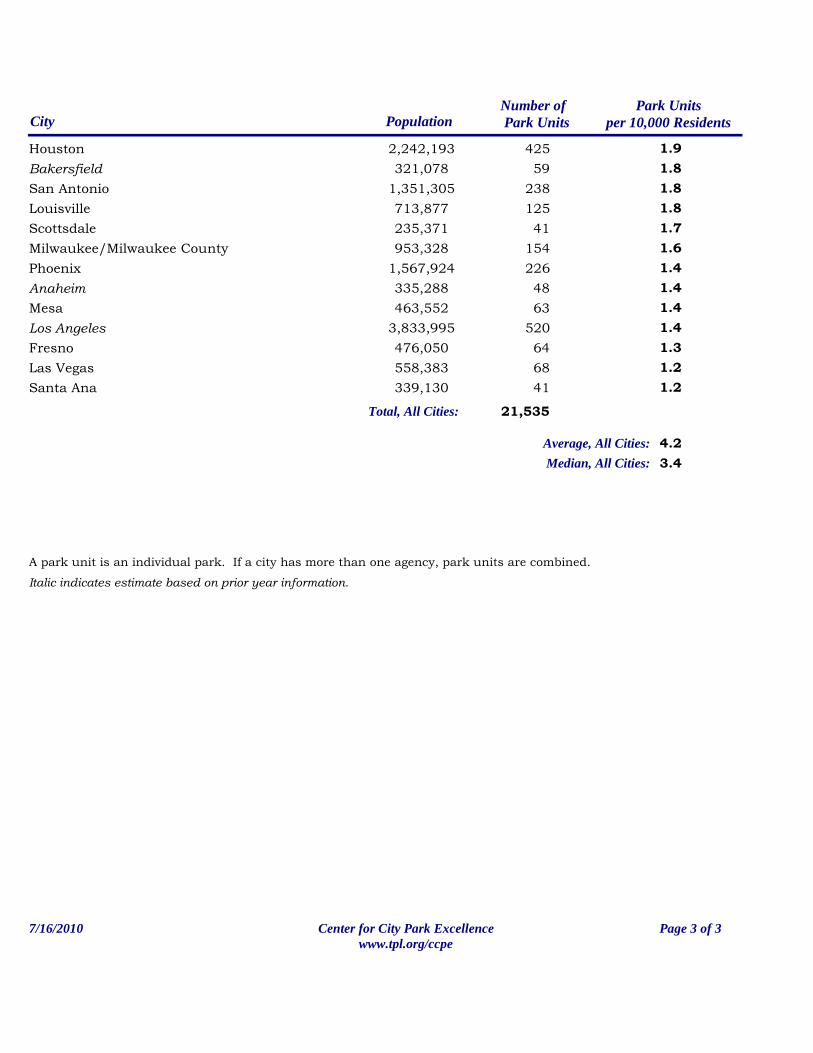
Number of Park UnitsPopulation
Park Unitsper 10,000 ResidentsCity
Houston 4252,242,193 1.9Bakersfield 59321,078 1.8San Antonio 2381,351,305 1.8Louisville 125713,877 1.8Scottsdale 41235,371 1.7Milwaukee/Milwaukee County 154953,328 1.6Phoenix 2261,567,924 1.4Anaheim 48335,288 1.4Mesa 63463,552 1.4Los Angeles 5203,833,995 1.4Fresno 64476,050 1.3Las Vegas 68558,383 1.2Santa Ana 41339,130 1.2
Average, All Cities: 4.2Median, All Cities: 3.4
A park unit is an individual park. If a city has more than one agency, park units are combined.
21,535Total, All Cities:
Italic indicates estimate based on prior year information.
7/16/2010 Page 3 of 3Center for City Park Excellencewww.tpl.org/ccpe
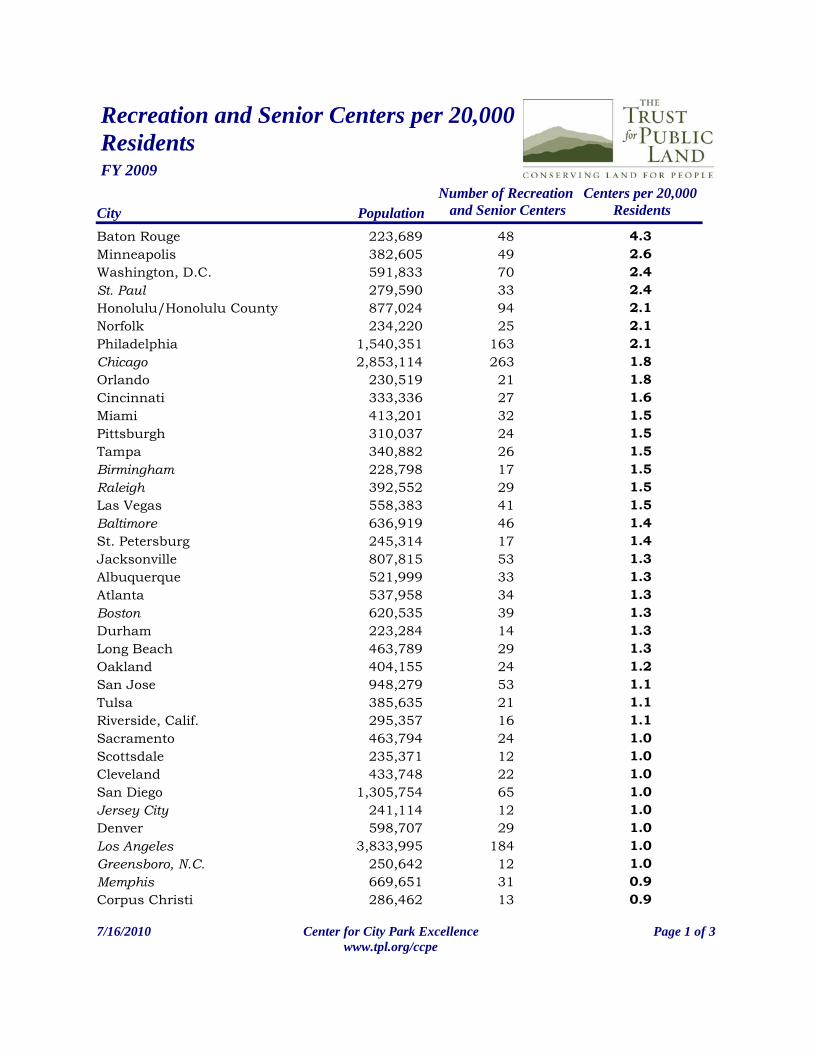
Recreation and Senior Centers per 20,000 ResidentsFY 2009
Centers per 20,000 ResidentsCity Population
Number of Recreation and Senior Centers
4.3Baton Rouge 223,689 482.6Minneapolis 382,605 492.4Washington, D.C. 591,833 702.4St. Paul 279,590 332.1Honolulu/Honolulu County 877,024 942.1Norfolk 234,220 252.1Philadelphia 1,540,351 1631.8Chicago 2,853,114 2631.8Orlando 230,519 211.6Cincinnati 333,336 271.5Miami 413,201 321.5Pittsburgh 310,037 241.5Tampa 340,882 261.5Birmingham 228,798 171.5Raleigh 392,552 291.5Las Vegas 558,383 411.4Baltimore 636,919 461.4St. Petersburg 245,314 171.3Jacksonville 807,815 531.3Albuquerque 521,999 331.3Atlanta 537,958 341.3Boston 620,535 391.3Durham 223,284 141.3Long Beach 463,789 291.2Oakland 404,155 241.1San Jose 948,279 531.1Tulsa 385,635 211.1Riverside, Calif. 295,357 161.0Sacramento 463,794 241.0Scottsdale 235,371 121.0Cleveland 433,748 221.0San Diego 1,305,754 651.0Jersey City 241,114 121.0Denver 598,707 291.0Los Angeles 3,833,995 1841.0Greensboro, N.C. 250,642 120.9Memphis 669,651 310.9Corpus Christi 286,462 13
7/16/2010 Page 1 of 3Center for City Park Excellencewww.tpl.org/ccpe
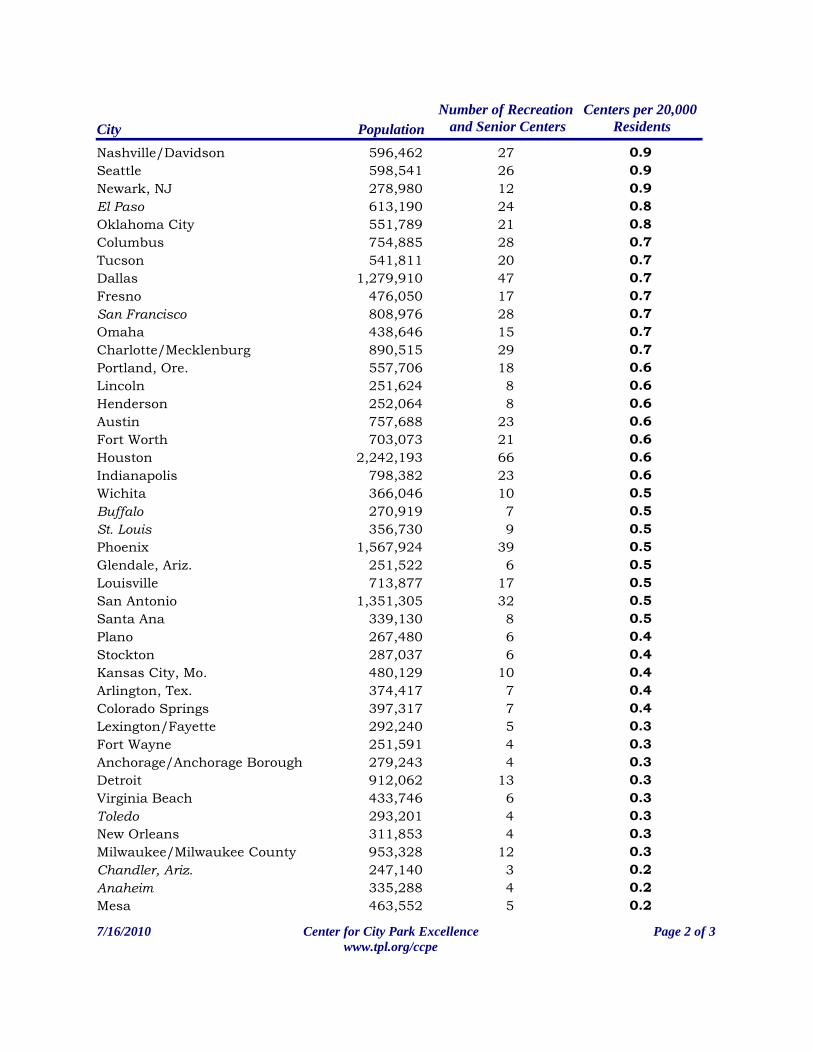
Centers per 20,000 ResidentsCity Population
Number of Recreation and Senior Centers
0.9Nashville/Davidson 596,462 270.9Seattle 598,541 260.9Newark, NJ 278,980 120.8El Paso 613,190 240.8Oklahoma City 551,789 210.7Columbus 754,885 280.7Tucson 541,811 200.7Dallas 1,279,910 470.7Fresno 476,050 170.7San Francisco 808,976 280.7Omaha 438,646 150.7Charlotte/Mecklenburg 890,515 290.6Portland, Ore. 557,706 180.6Lincoln 251,624 80.6Henderson 252,064 80.6Austin 757,688 230.6Fort Worth 703,073 210.6Houston 2,242,193 660.6Indianapolis 798,382 230.5Wichita 366,046 100.5Buffalo 270,919 70.5St. Louis 356,730 90.5Phoenix 1,567,924 390.5Glendale, Ariz. 251,522 60.5Louisville 713,877 170.5San Antonio 1,351,305 320.5Santa Ana 339,130 80.4Plano 267,480 60.4Stockton 287,037 60.4Kansas City, Mo. 480,129 100.4Arlington, Tex. 374,417 70.4Colorado Springs 397,317 70.3Lexington/Fayette 292,240 50.3Fort Wayne 251,591 40.3Anchorage/Anchorage Borough 279,243 40.3Detroit 912,062 130.3Virginia Beach 433,746 60.3Toledo 293,201 40.3New Orleans 311,853 40.3Milwaukee/Milwaukee County 953,328 120.2Chandler, Ariz. 247,140 30.2Anaheim 335,288 40.2Mesa 463,552 5
7/16/2010 Page 2 of 3Center for City Park Excellencewww.tpl.org/ccpe
Centers per 20,000 ResidentsCity Population
Number of Recreation and Senior Centers
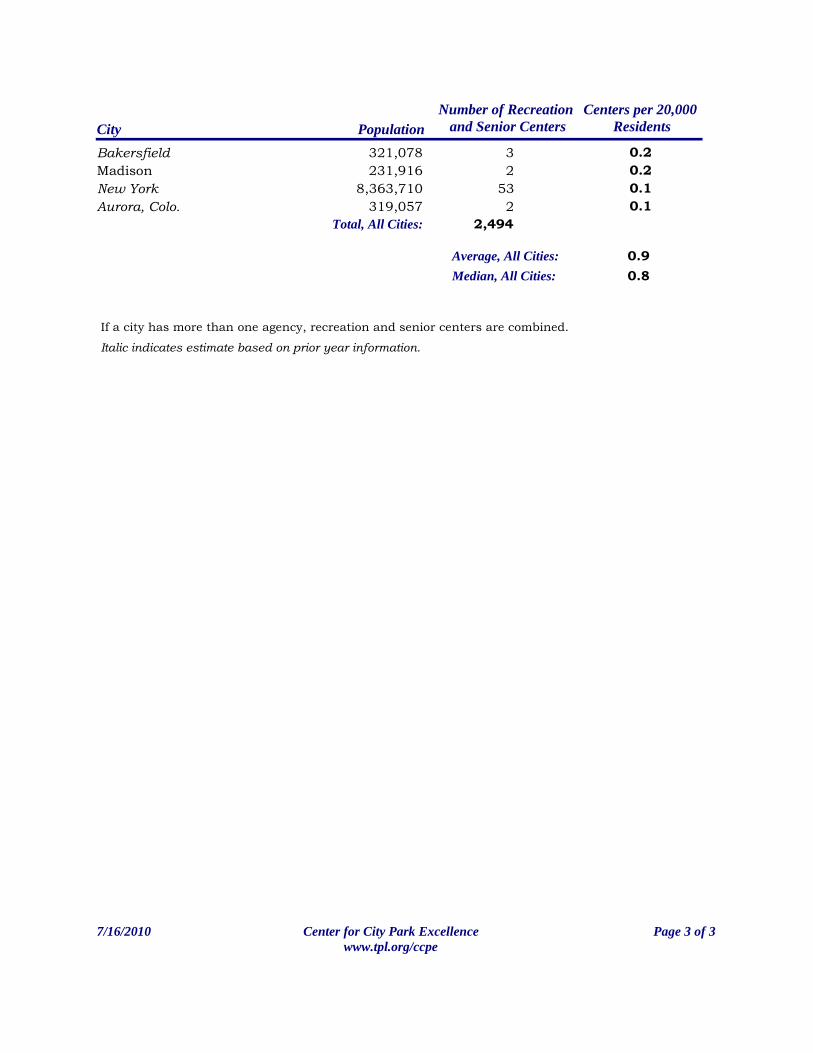
0.2Bakersfield 321,078 30.2Madison 231,916 20.1New York 8,363,710 530.1Aurora, Colo. 319,057 2
Average, All Cities: 0.9Median, All Cities: 0.8
If a city has more than one agency, recreation and senior centers are combined.
2,494Total, All Cities:
Italic indicates estimate based on prior year information.
7/16/2010 Page 3 of 3Center for City Park Excellencewww.tpl.org/ccpe
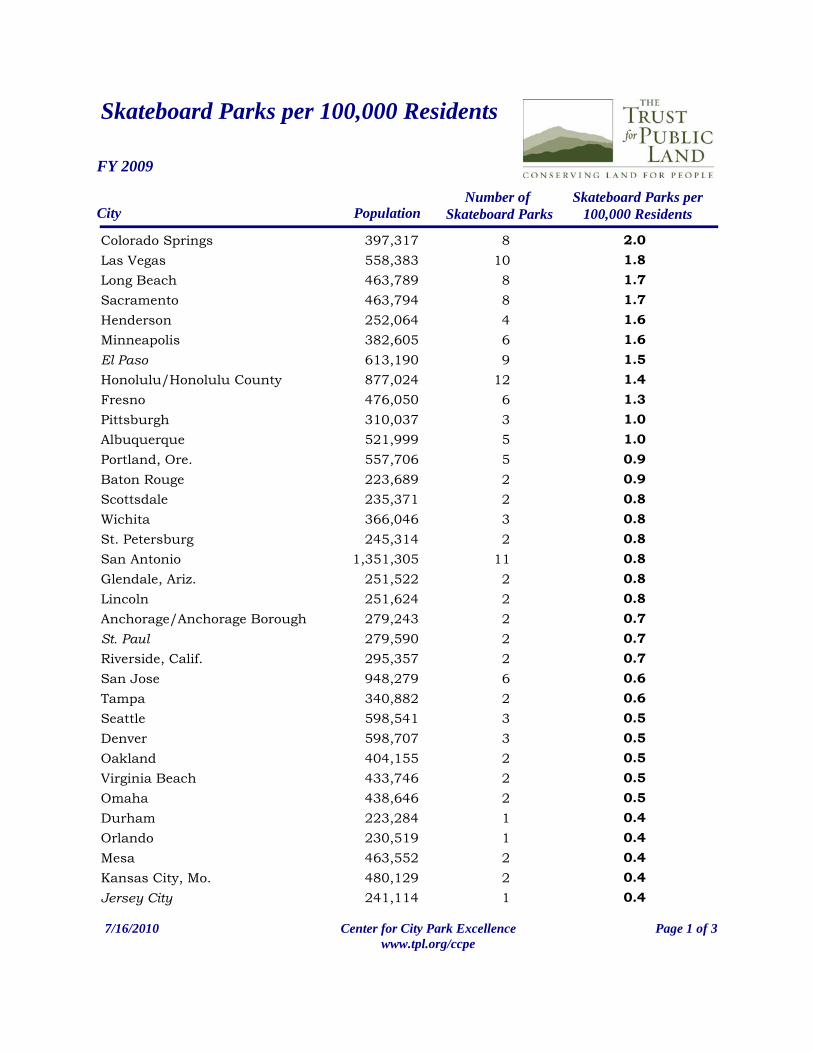
Skateboard Parks per 100,000 Residents
FY 2009
Skateboard Parks per 100,000 Residents City Population
Number of Skateboard Parks
2.0Colorado Springs 397,317 81.8Las Vegas 558,383 101.7Long Beach 463,789 81.7Sacramento 463,794 81.6Henderson 252,064 41.6Minneapolis 382,605 61.5El Paso 613,190 91.4Honolulu/Honolulu County 877,024 121.3Fresno 476,050 61.0Pittsburgh 310,037 31.0Albuquerque 521,999 50.9Portland, Ore. 557,706 50.9Baton Rouge 223,689 20.8Scottsdale 235,371 20.8Wichita 366,046 30.8St. Petersburg 245,314 20.8San Antonio 1,351,305 110.8Glendale, Ariz. 251,522 20.8Lincoln 251,624 20.7Anchorage/Anchorage Borough 279,243 20.7St. Paul 279,590 20.7Riverside, Calif. 295,357 20.6San Jose 948,279 60.6Tampa 340,882 20.5Seattle 598,541 30.5Denver 598,707 30.5Oakland 404,155 20.5Virginia Beach 433,746 20.5Omaha 438,646 20.4Durham 223,284 10.4Orlando 230,519 10.4Mesa 463,552 20.4Kansas City, Mo. 480,129 20.4Jersey City 241,114 1
7/16/2010 Page 1 of 3Center for City Park Excellencewww.tpl.org/ccpe
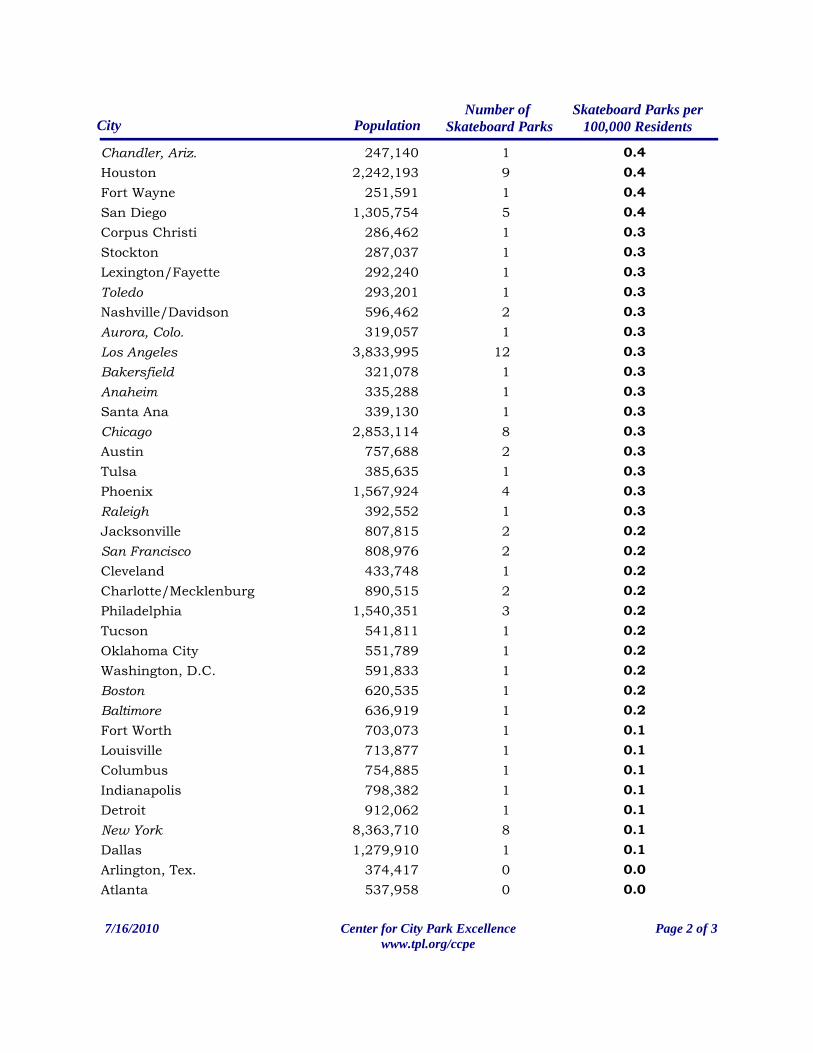
Skateboard Parks per 100,000 Residents City Population
Number of Skateboard Parks
0.4Chandler, Ariz. 247,140 10.4Houston 2,242,193 90.4Fort Wayne 251,591 10.4San Diego 1,305,754 50.3Corpus Christi 286,462 10.3Stockton 287,037 10.3Lexington/Fayette 292,240 10.3Toledo 293,201 10.3Nashville/Davidson 596,462 20.3Aurora, Colo. 319,057 10.3Los Angeles 3,833,995 120.3Bakersfield 321,078 10.3Anaheim 335,288 10.3Santa Ana 339,130 10.3Chicago 2,853,114 80.3Austin 757,688 20.3Tulsa 385,635 10.3Phoenix 1,567,924 40.3Raleigh 392,552 10.2Jacksonville 807,815 20.2San Francisco 808,976 20.2Cleveland 433,748 10.2Charlotte/Mecklenburg 890,515 20.2Philadelphia 1,540,351 30.2Tucson 541,811 10.2Oklahoma City 551,789 10.2Washington, D.C. 591,833 10.2Boston 620,535 10.2Baltimore 636,919 10.1Fort Worth 703,073 10.1Louisville 713,877 10.1Columbus 754,885 10.1Indianapolis 798,382 10.1Detroit 912,062 10.1New York 8,363,710 80.1Dallas 1,279,910 10.0Arlington, Tex. 374,417 00.0Atlanta 537,958 0
7/16/2010 Page 2 of 3Center for City Park Excellencewww.tpl.org/ccpe
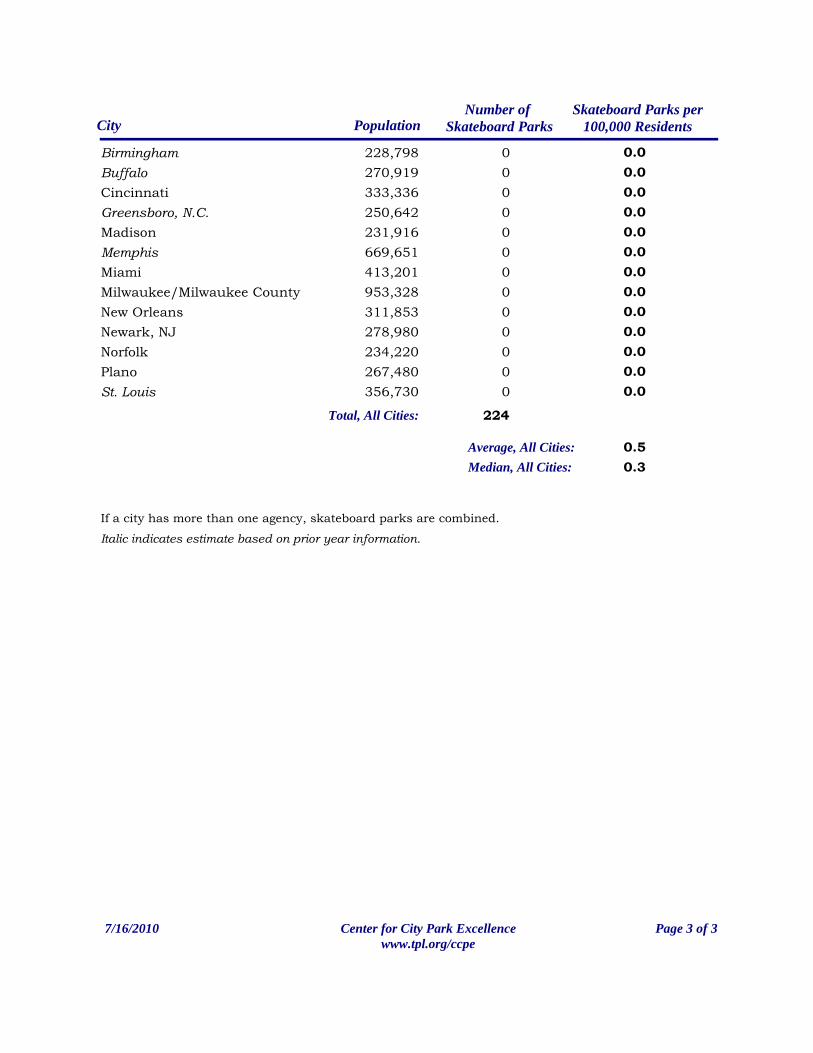
Skateboard Parks per 100,000 Residents City Population
Number of Skateboard Parks
0.0Birmingham 228,798 00.0Buffalo 270,919 00.0Cincinnati 333,336 00.0Greensboro, N.C. 250,642 00.0Madison 231,916 00.0Memphis 669,651 00.0Miami 413,201 00.0Milwaukee/Milwaukee County 953,328 00.0New Orleans 311,853 00.0Newark, NJ 278,980 00.0Norfolk 234,220 00.0Plano 267,480 00.0St. Louis 356,730 0
0.5Average, All Cities:Median, All Cities: 0.3
If a city has more than one agency, skateboard parks are combined.
224Total, All Cities:
Italic indicates estimate based on prior year information.
7/16/2010 Page 3 of 3Center for City Park Excellencewww.tpl.org/ccpe
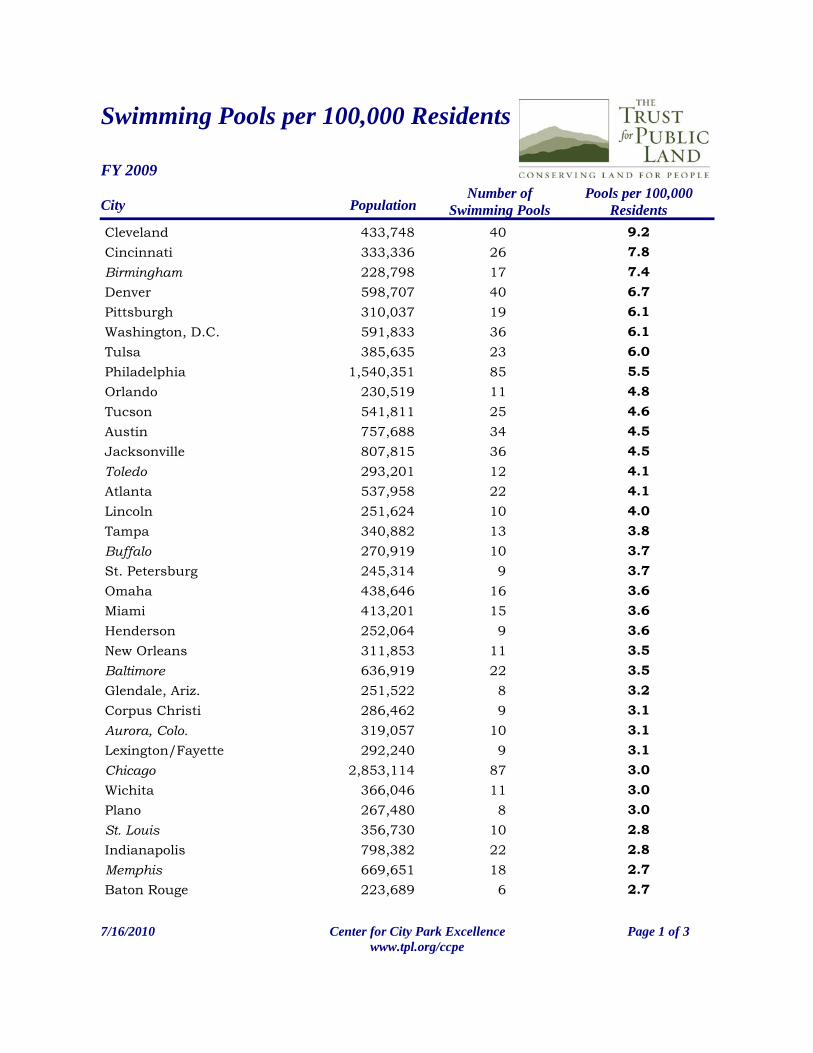
Swimming Pools per 100,000 Residents
FY 2009Pools per 100,000
Residents City Number of
Swimming PoolsPopulation
9.2433,748Cleveland 407.8333,336Cincinnati 267.4228,798Birmingham 176.7598,707Denver 406.1310,037Pittsburgh 196.1591,833Washington, D.C. 366.0385,635Tulsa 235.51,540,351Philadelphia 854.8230,519Orlando 114.6541,811Tucson 254.5757,688Austin 344.5807,815Jacksonville 364.1293,201Toledo 124.1537,958Atlanta 224.0251,624Lincoln 103.8340,882Tampa 133.7270,919Buffalo 103.7245,314St. Petersburg 93.6438,646Omaha 163.6413,201Miami 153.6252,064Henderson 93.5311,853New Orleans 113.5636,919Baltimore 223.2251,522Glendale, Ariz. 83.1286,462Corpus Christi 93.1319,057Aurora, Colo. 103.1292,240Lexington/Fayette 93.02,853,114Chicago 873.0366,046Wichita 113.0267,480Plano 82.8356,730St. Louis 102.8798,382Indianapolis 222.7669,651Memphis 182.7223,689Baton Rouge 6
7/16/2010 Page 1 of 3Center for City Park Excellencewww.tpl.org/ccpe
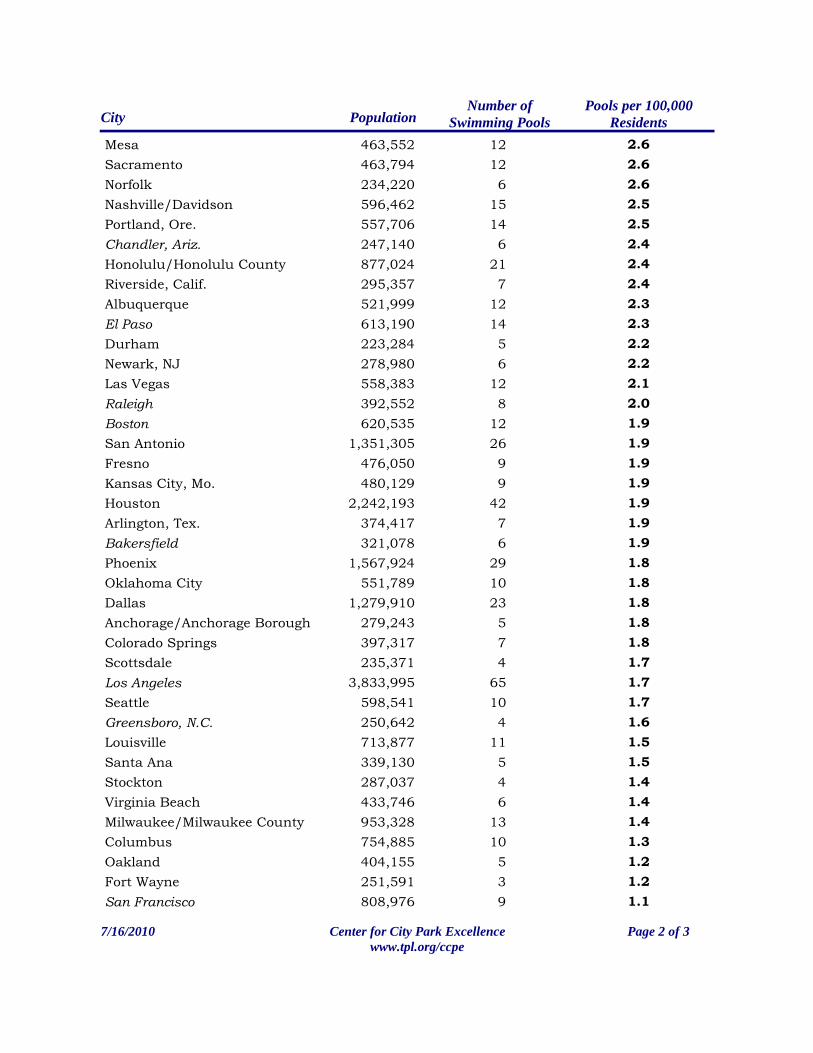
Pools per 100,000 Residents City
Number of Swimming PoolsPopulation
2.6463,552Mesa 122.6463,794Sacramento 122.6234,220Norfolk 62.5596,462Nashville/Davidson 152.5557,706Portland, Ore. 142.4247,140Chandler, Ariz. 62.4877,024Honolulu/Honolulu County 212.4295,357Riverside, Calif. 72.3521,999Albuquerque 122.3613,190El Paso 142.2223,284Durham 52.2278,980Newark, NJ 62.1558,383Las Vegas 122.0392,552Raleigh 81.9620,535Boston 121.91,351,305San Antonio 261.9476,050Fresno 91.9480,129Kansas City, Mo. 91.92,242,193Houston 421.9374,417Arlington, Tex. 71.9321,078Bakersfield 61.81,567,924Phoenix 291.8551,789Oklahoma City 101.81,279,910Dallas 231.8279,243Anchorage/Anchorage Borough 51.8397,317Colorado Springs 71.7235,371Scottsdale 41.73,833,995Los Angeles 651.7598,541Seattle 101.6250,642Greensboro, N.C. 41.5713,877Louisville 111.5339,130Santa Ana 51.4287,037Stockton 41.4433,746Virginia Beach 61.4953,328Milwaukee/Milwaukee County 131.3754,885Columbus 101.2404,155Oakland 51.2251,591Fort Wayne 31.1808,976San Francisco 9
7/16/2010 Page 2 of 3Center for City Park Excellencewww.tpl.org/ccpe
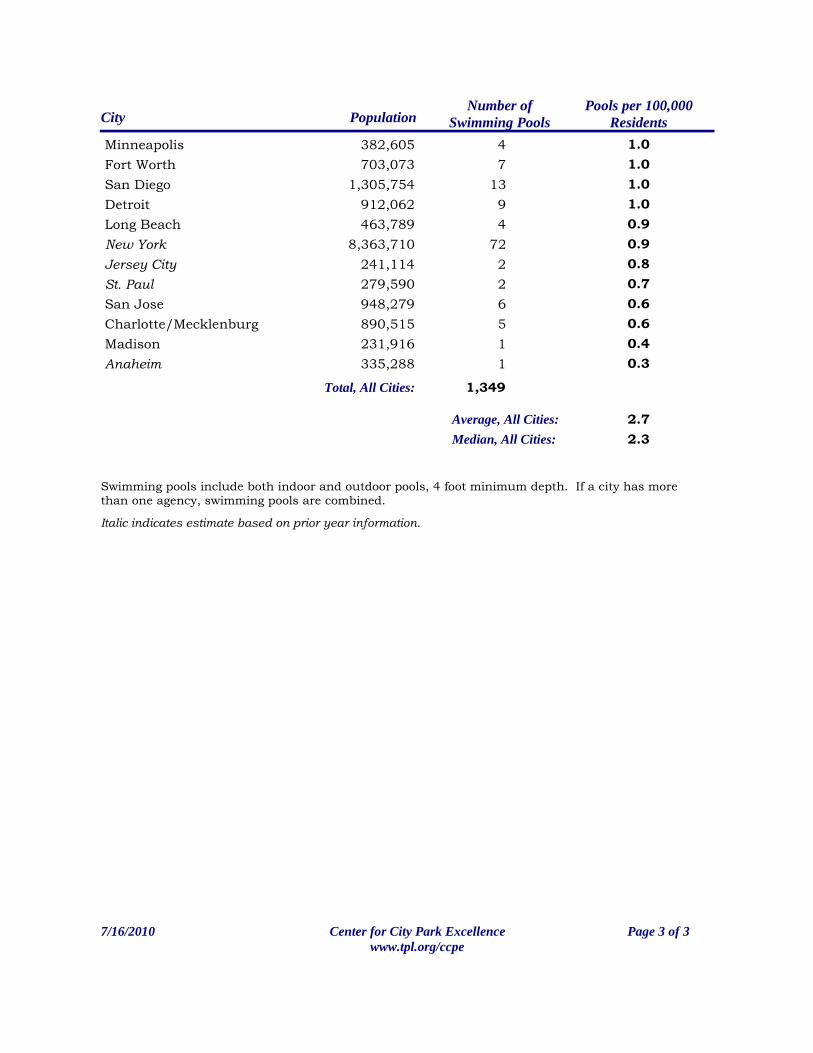
Pools per 100,000 Residents City
Number of Swimming PoolsPopulation
1.0382,605Minneapolis 41.0703,073Fort Worth 71.01,305,754San Diego 131.0912,062Detroit 90.9463,789Long Beach 40.98,363,710New York 720.8241,114Jersey City 20.7279,590St. Paul 20.6948,279San Jose 60.6890,515Charlotte/Mecklenburg 50.4231,916Madison 10.3335,288Anaheim 1
2.7Average, All Cities:
Swimming pools include both indoor and outdoor pools, 4 foot minimum depth. If a city has more than one agency, swimming pools are combined.
Median, All Cities: 2.3
1,349Total, All Cities:
Italic indicates estimate based on prior year information.
7/16/2010 Page 3 of 3Center for City Park Excellencewww.tpl.org/ccpe
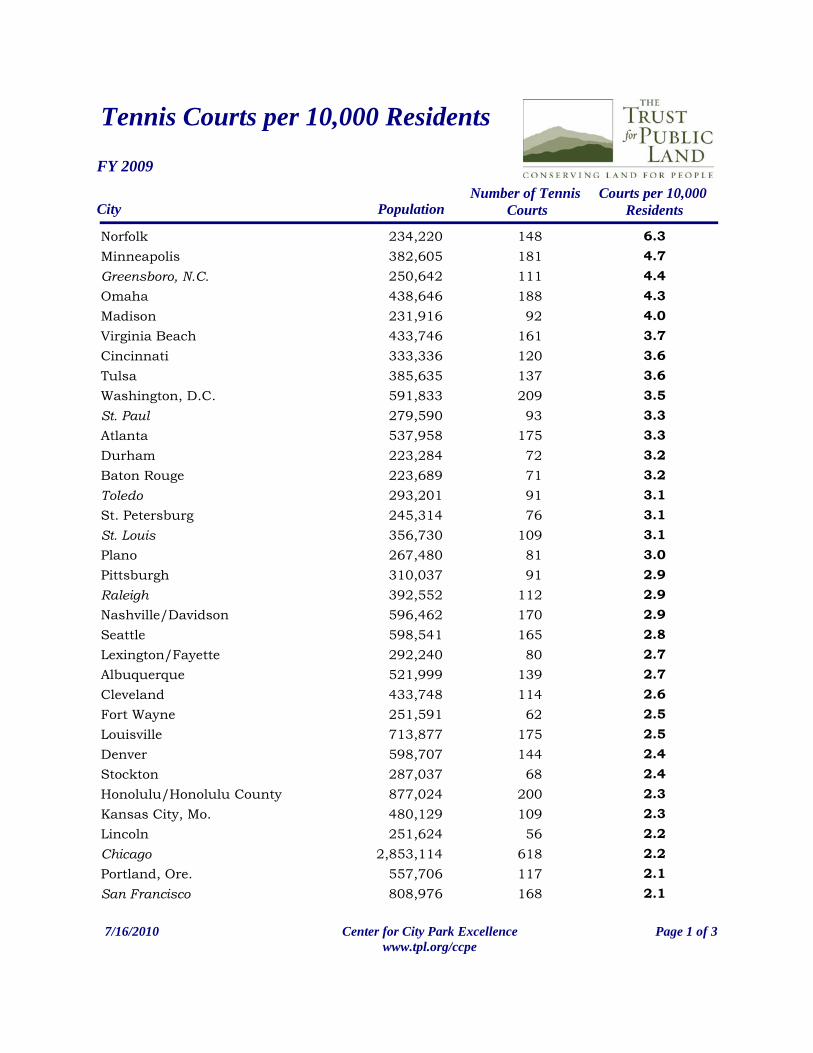
Tennis Courts per 10,000 Residents
FY 2009
Courts per 10,000 ResidentsCity Population
Number of Tennis Courts
6.3Norfolk 234,220 1484.7Minneapolis 382,605 1814.4Greensboro, N.C. 250,642 1114.3Omaha 438,646 1884.0Madison 231,916 923.7Virginia Beach 433,746 1613.6Cincinnati 333,336 1203.6Tulsa 385,635 1373.5Washington, D.C. 591,833 2093.3St. Paul 279,590 933.3Atlanta 537,958 1753.2Durham 223,284 723.2Baton Rouge 223,689 713.1Toledo 293,201 913.1St. Petersburg 245,314 763.1St. Louis 356,730 1093.0Plano 267,480 812.9Pittsburgh 310,037 912.9Raleigh 392,552 1122.9Nashville/Davidson 596,462 1702.8Seattle 598,541 1652.7Lexington/Fayette 292,240 802.7Albuquerque 521,999 1392.6Cleveland 433,748 1142.5Fort Wayne 251,591 622.5Louisville 713,877 1752.4Denver 598,707 1442.4Stockton 287,037 682.3Honolulu/Honolulu County 877,024 2002.3Kansas City, Mo. 480,129 1092.2Lincoln 251,624 562.2Chicago 2,853,114 6182.1Portland, Ore. 557,706 1172.1San Francisco 808,976 168
7/16/2010 Page 1 of 3Center for City Park Excellencewww.tpl.org/ccpe
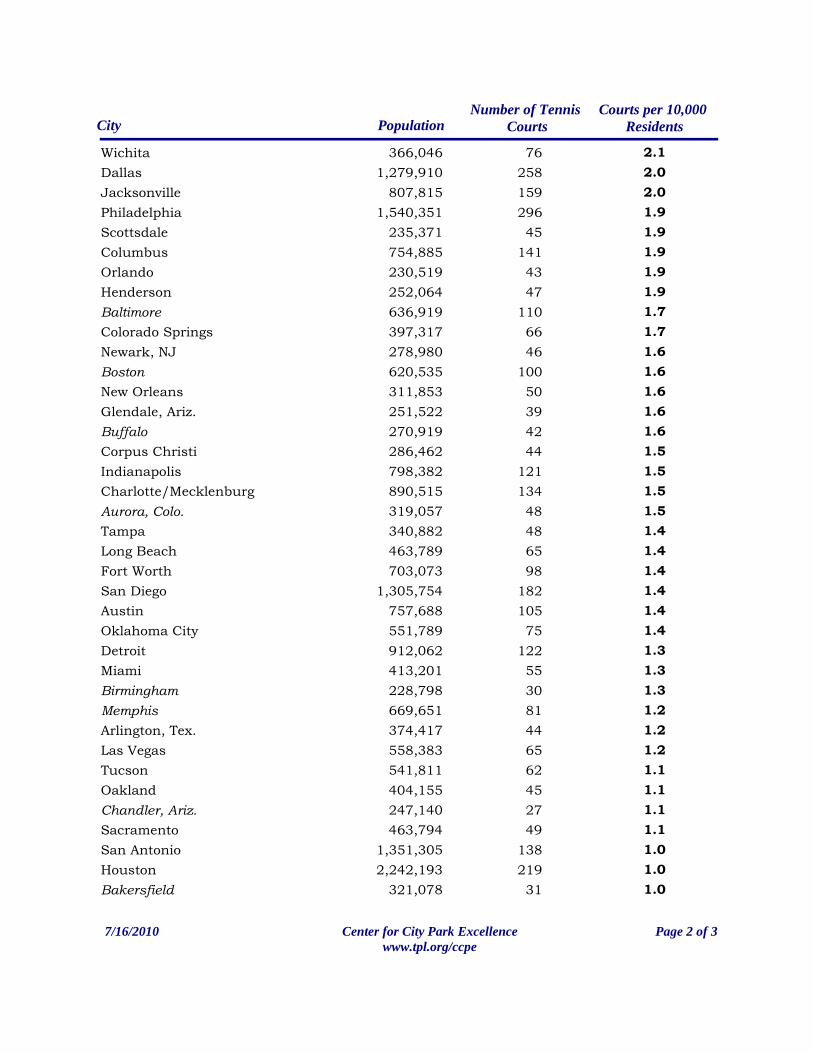
Courts per 10,000 ResidentsCity Population
Number of Tennis Courts
2.1Wichita 366,046 762.0Dallas 1,279,910 2582.0Jacksonville 807,815 1591.9Philadelphia 1,540,351 2961.9Scottsdale 235,371 451.9Columbus 754,885 1411.9Orlando 230,519 431.9Henderson 252,064 471.7Baltimore 636,919 1101.7Colorado Springs 397,317 661.6Newark, NJ 278,980 461.6Boston 620,535 1001.6New Orleans 311,853 501.6Glendale, Ariz. 251,522 391.6Buffalo 270,919 421.5Corpus Christi 286,462 441.5Indianapolis 798,382 1211.5Charlotte/Mecklenburg 890,515 1341.5Aurora, Colo. 319,057 481.4Tampa 340,882 481.4Long Beach 463,789 651.4Fort Worth 703,073 981.4San Diego 1,305,754 1821.4Austin 757,688 1051.4Oklahoma City 551,789 751.3Detroit 912,062 1221.3Miami 413,201 551.3Birmingham 228,798 301.2Memphis 669,651 811.2Arlington, Tex. 374,417 441.2Las Vegas 558,383 651.1Tucson 541,811 621.1Oakland 404,155 451.1Chandler, Ariz. 247,140 271.1Sacramento 463,794 491.0San Antonio 1,351,305 1381.0Houston 2,242,193 2191.0Bakersfield 321,078 31
7/16/2010 Page 2 of 3Center for City Park Excellencewww.tpl.org/ccpe
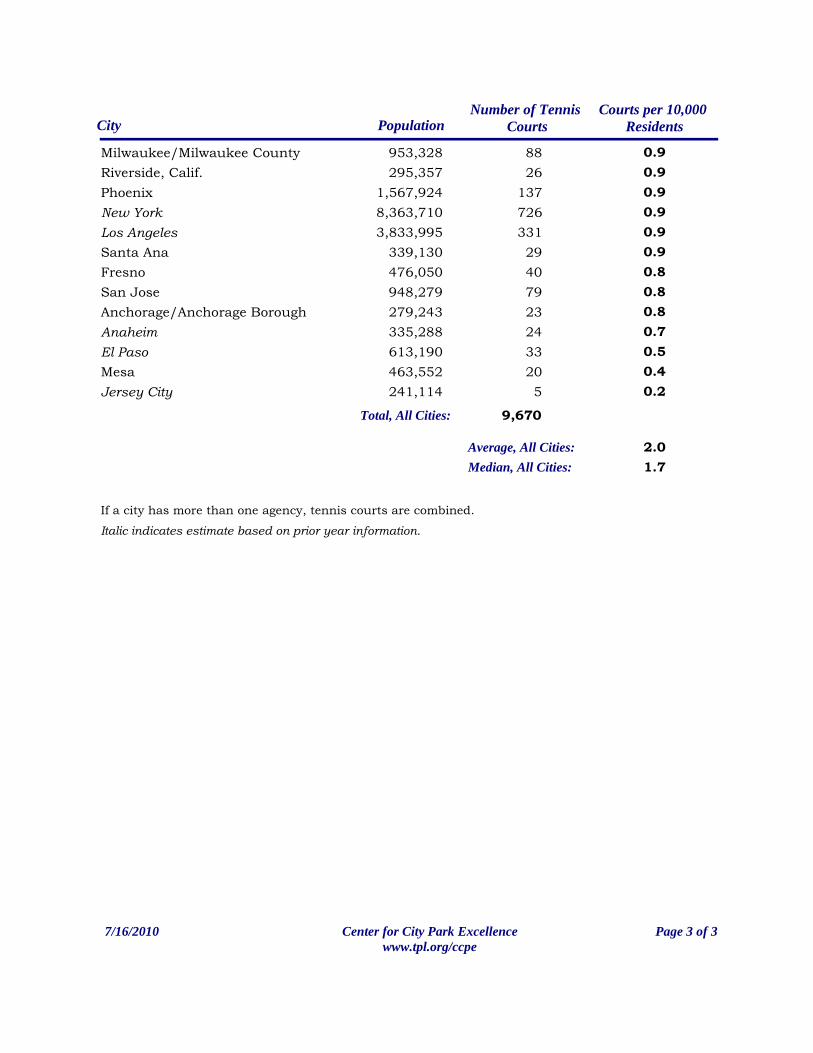
Courts per 10,000 ResidentsCity Population
Number of Tennis Courts
0.9Milwaukee/Milwaukee County 953,328 880.9Riverside, Calif. 295,357 260.9Phoenix 1,567,924 1370.9New York 8,363,710 7260.9Los Angeles 3,833,995 3310.9Santa Ana 339,130 290.8Fresno 476,050 400.8San Jose 948,279 790.8Anchorage/Anchorage Borough 279,243 230.7Anaheim 335,288 240.5El Paso 613,190 330.4Mesa 463,552 200.2Jersey City 241,114 5
Average, All Cities: 2.0Median, All Cities: 1.7
If a city has more than one agency, tennis courts are combined.
9,670Total, All Cities:
Italic indicates estimate based on prior year information.
7/16/2010 Page 3 of 3Center for City Park Excellencewww.tpl.org/ccpe