Embed Size (px)
Citation preview
Baltic fishing: is there a future?
Lysekil 25 May 2006
Bengt Sjöstrand
Inst. of Marine Research.
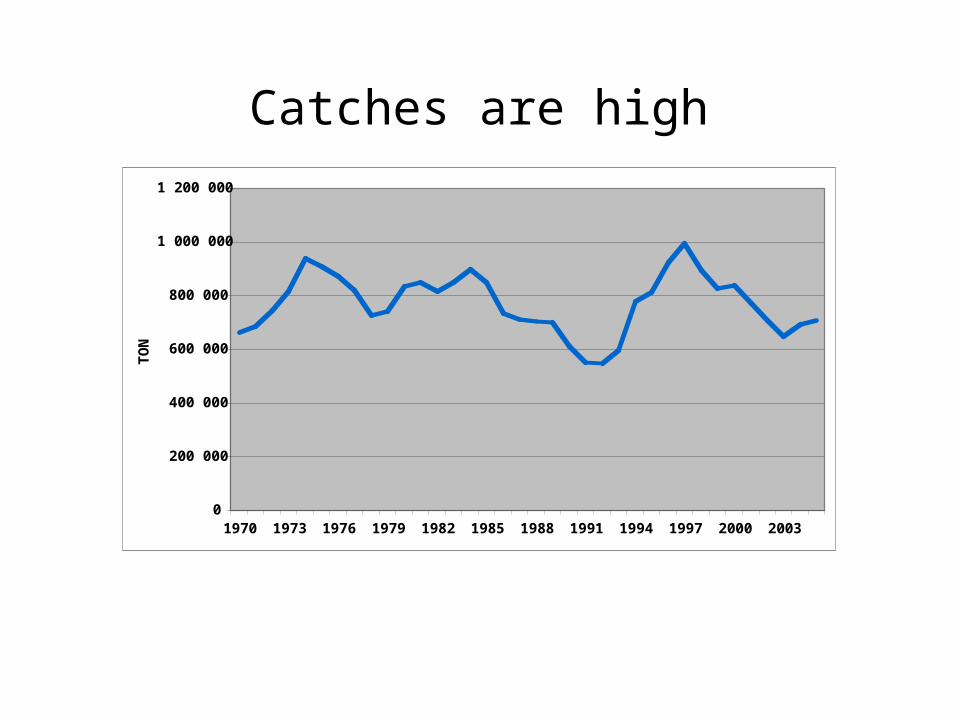
Catches are high
0
200 000
400 000
600 000
800 000
1 000 000
1 200 000
1970 1973 1976 1979 1982 1985 1988 1991 1994 1997 2000 2003
TO
N
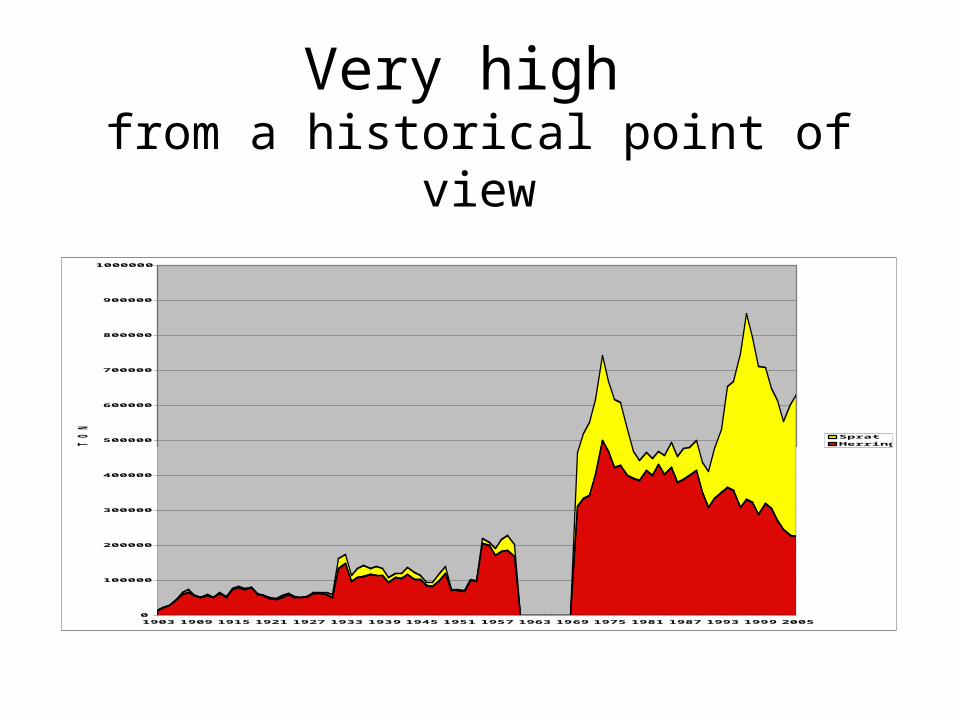
Very high from a historical point of view
0
100000
200000
300000
400000
500000
600000
700000
800000
900000
1000000
1903 1909 1915 1921 1927 1933 1939 1945 1951 1957 1963 1969 1975 1981 1987 1993 1999 2005
TO
N
SpratHerring
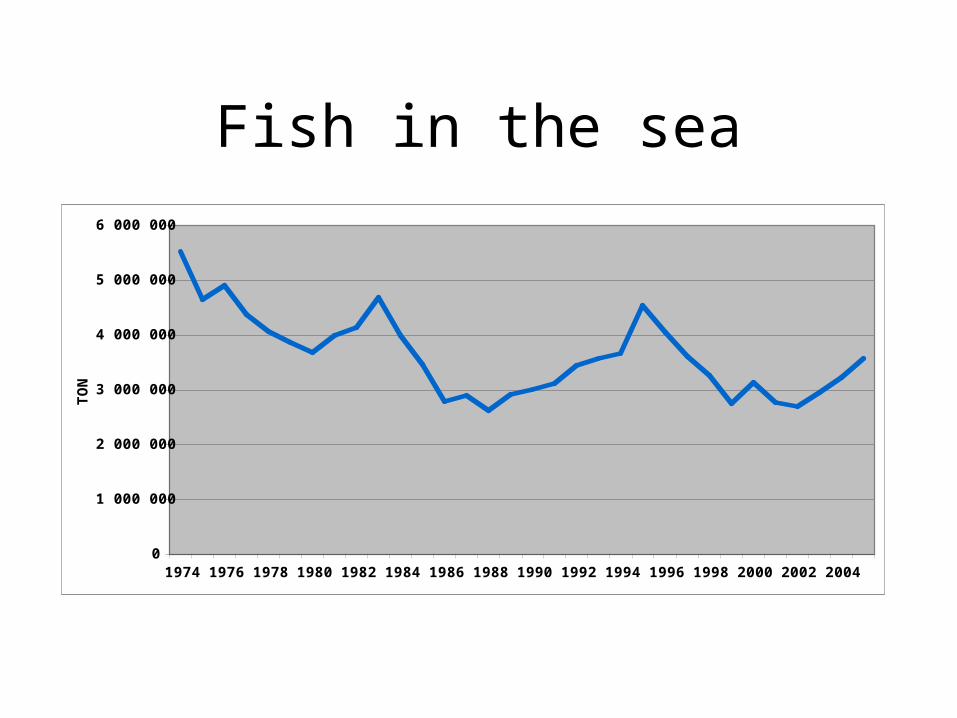
Fish in the sea
0
1 000 000
2 000 000
3 000 000
4 000 000
5 000 000
6 000 000
1974 1976 1978 1980 1982 1984 1986 1988 1990 1992 1994 1996 1998 2000 2002 2004
TO
N
Any problems?
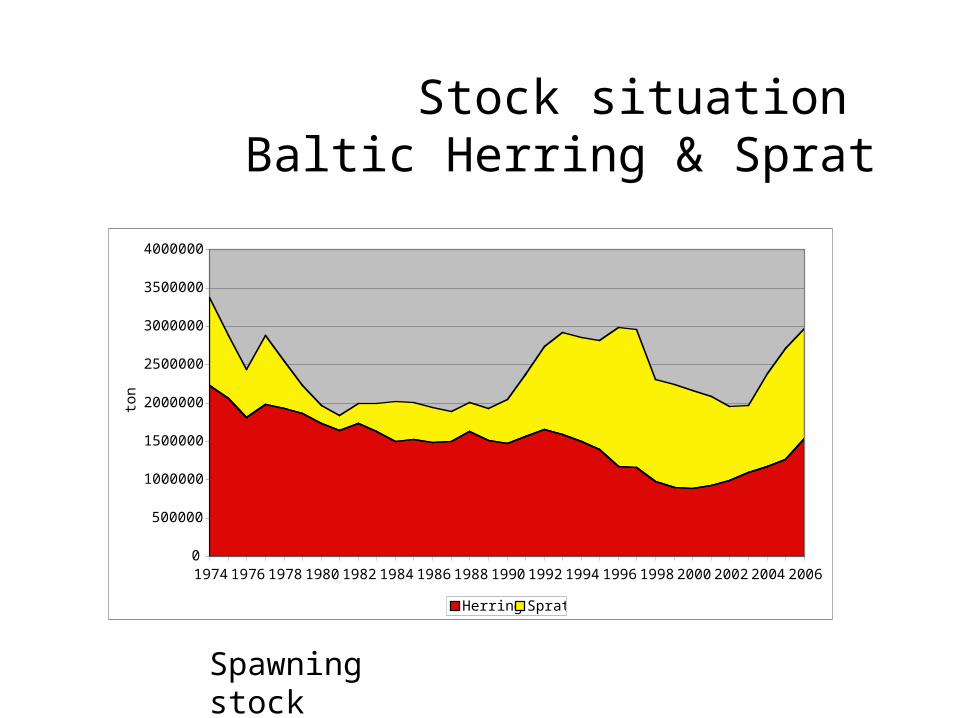
Stock situation Baltic Herring & Sprat
0
500000
1000000
1500000
2000000
2500000
3000000
3500000
4000000
1974 1976 1978 1980 1982 1984 1986 1988 1990 1992 1994 1996 1998 2000 2002 2004 2006
ton
Herring Sprat
Spawning stock
0
100000
200000
300000
400000
500000
600000
700000
800000
1966 1969 1972 1975 1978 1981 1984 1987 1990 1993 1996 1999 2002 2005
TO
N
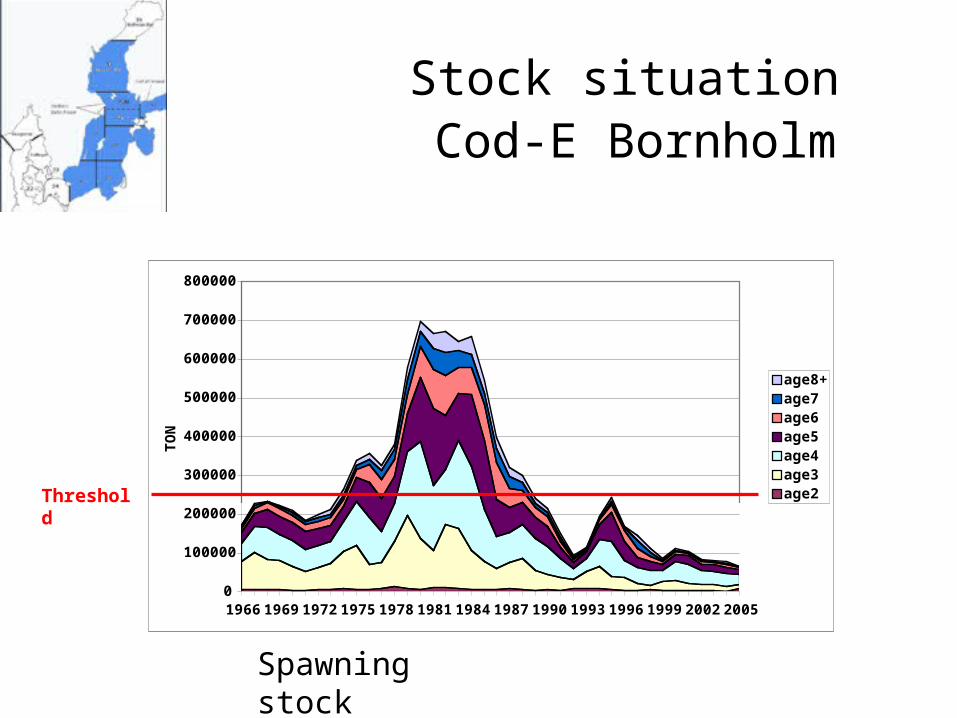
age8+age7age6age5age4age3age2Threshol
d
Stock situation Cod-E Bornholm
Spawning stock
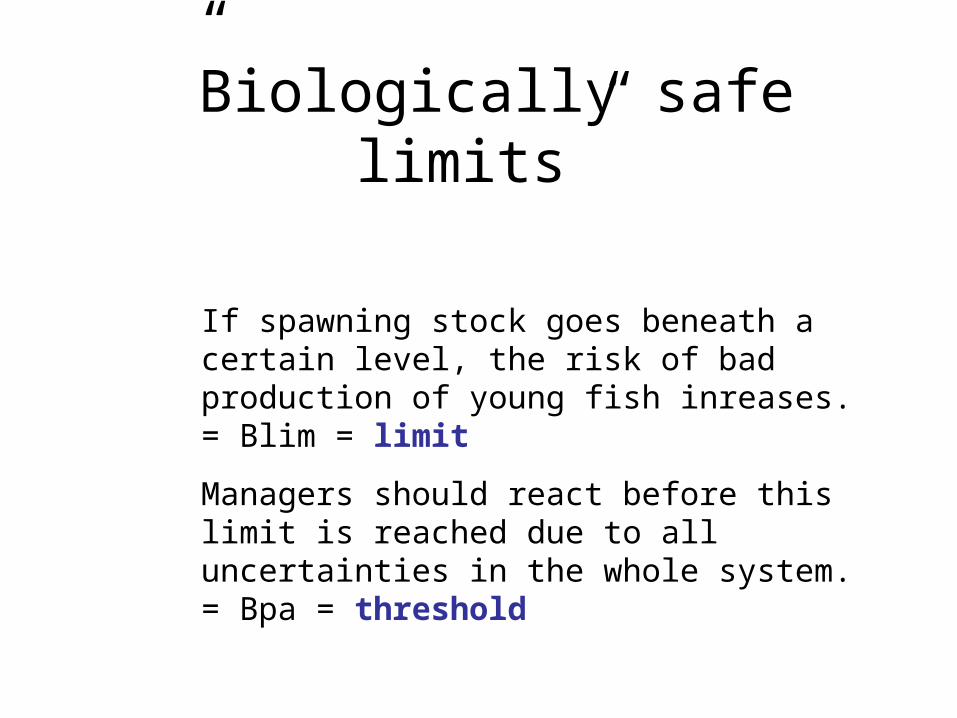
”Biologically safe limits”
If spawning stock goes beneath a certain level, the risk of bad production of young fish inreases. = Blim = limit
Managers should react before this limit is reached due to all uncertainties in the whole system. = Bpa = threshold
0
100000
200000
300000
400000
500000
600000
700000
800000
900000
0 100000 200000 300000 400000 500000 600000 700000 800000
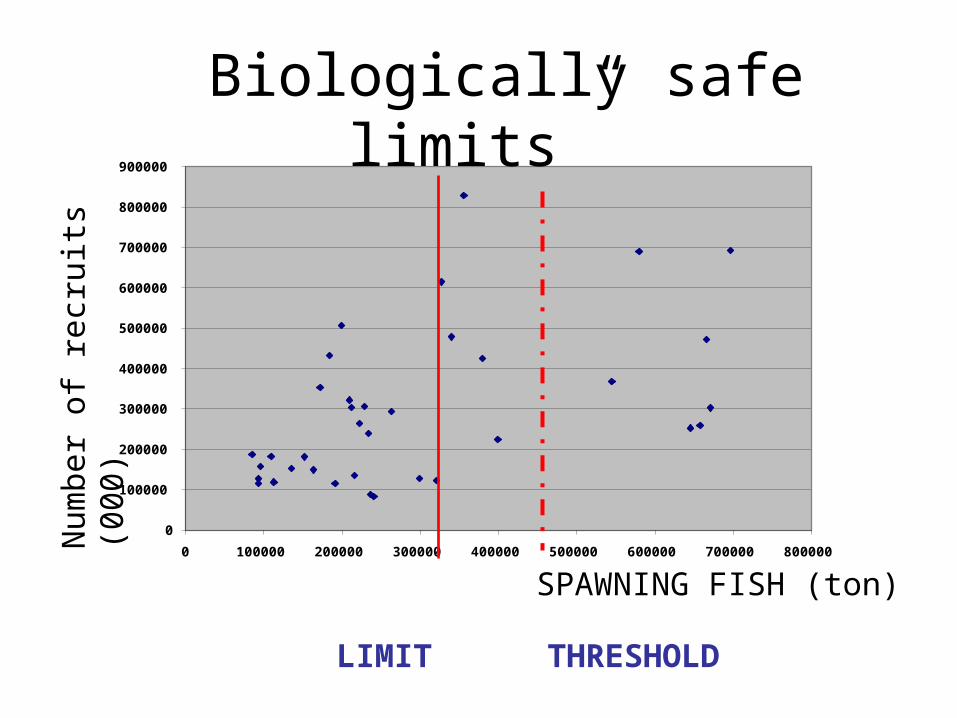
LIMIT THRESHOLD
” Biologically safe limits”
SPAWNING FISH (ton)
Nu
mb
er
of
recr
uit
s (
00
0)
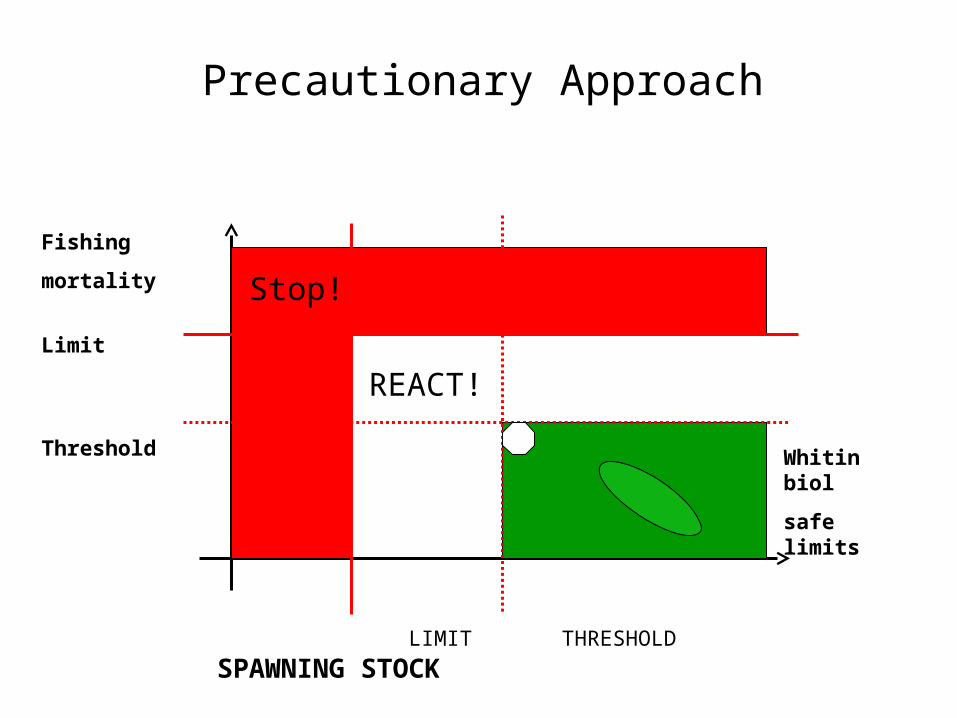
Precautionary Approach
LIMIT THRESHOLD SPAWNING STOCK
REACT!
Stop!
Fishing
mortality
Limit
Threshold
Whitin biol
safe limits
Cod in the Baltic, E Bornholm
This stock is outside safe biological limits
Cod is in trouble. Only in the Baltic?
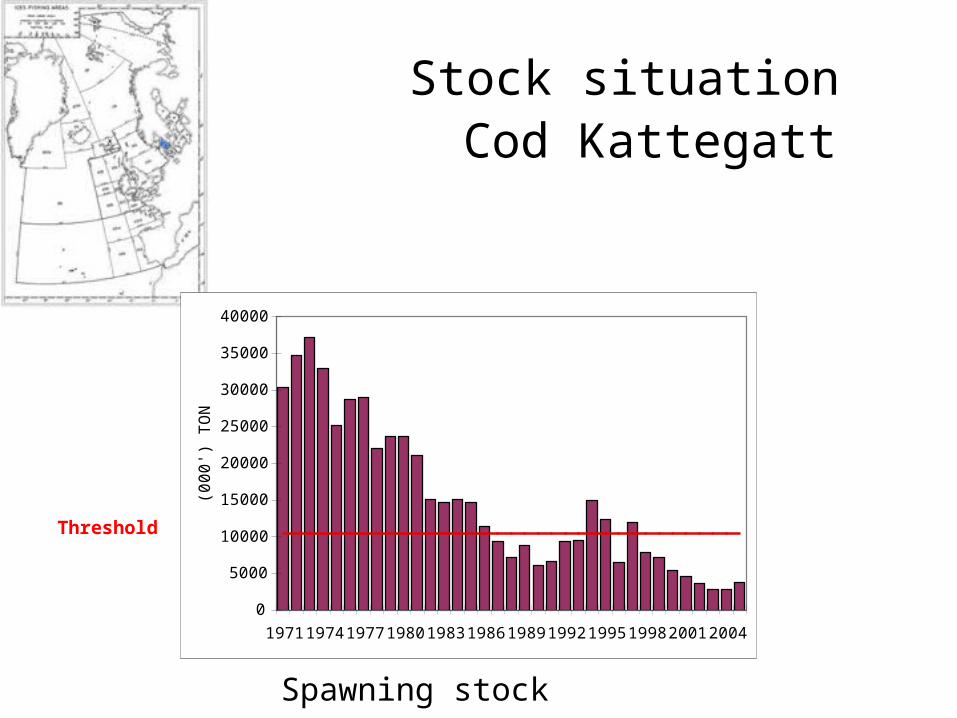
Threshold
Stock situation Cod Kattegatt
0
5000
10000
15000
20000
25000
30000
35000
40000
1971 1974 1977 1980 1983 1986 1989 1992 1995 1998 2001 2004
(00
0')
TO
N
Spawning stock
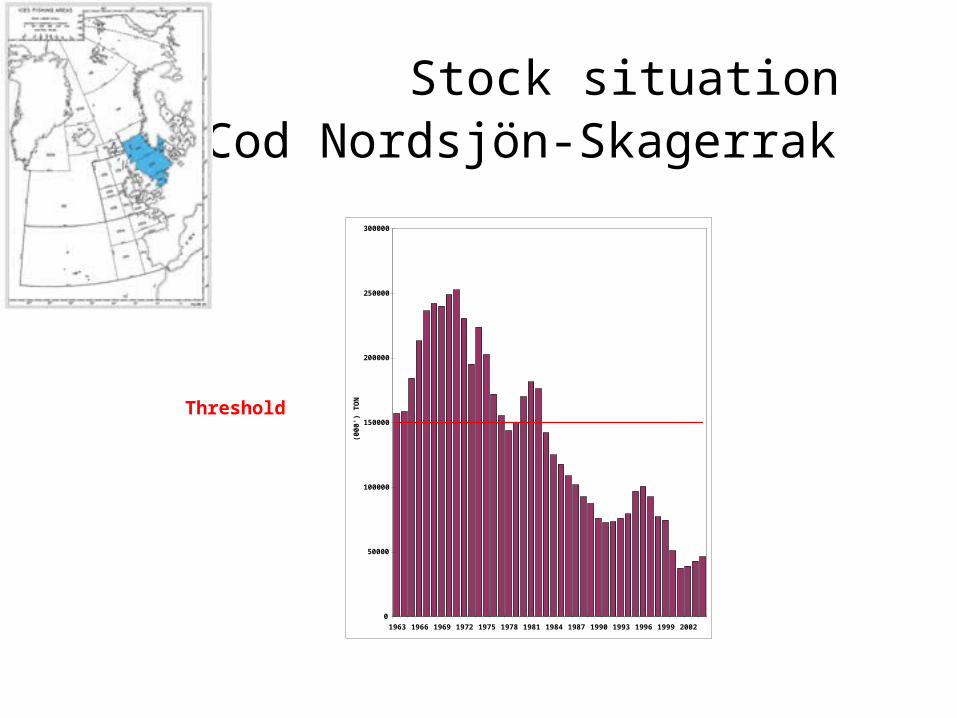
Stock situation Cod Nordsjön-Skagerrak
Threshold
0
50000
100000
150000
200000
250000
300000
1963 1966 1969 1972 1975 1978 1981 1984 1987 1990 1993 1996 1999 2002
(000
') T
ON
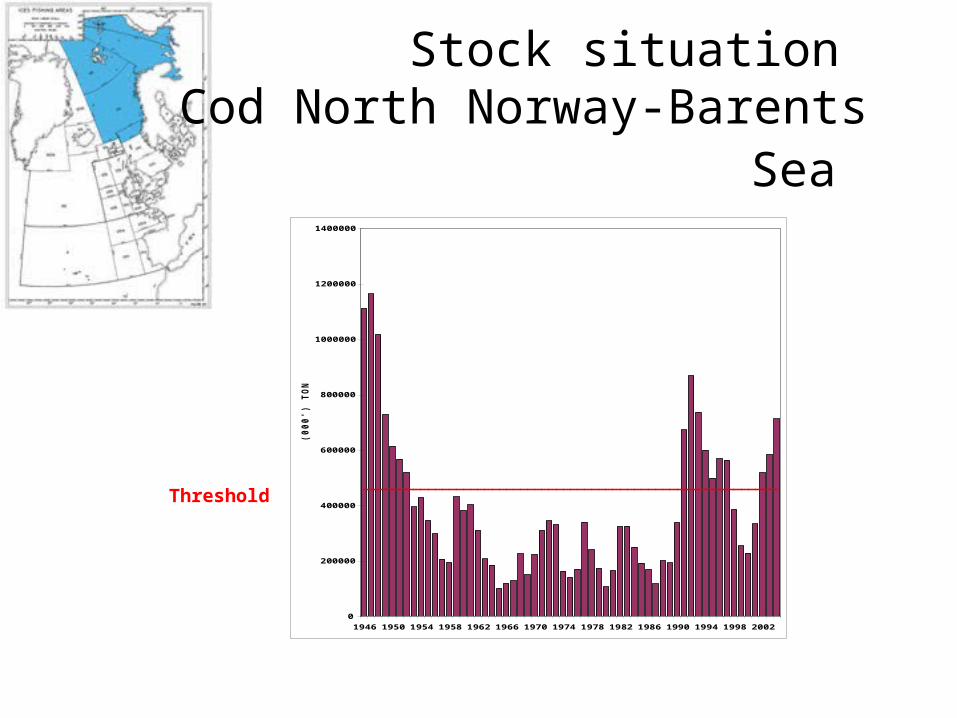
Threshold
Stock situation Cod North Norway-Barents Sea
0
200000
400000
600000
800000
1000000
1200000
1400000
1946 1950 1954 1958 1962 1966 1970 1974 1978 1982 1986 1990 1994 1998 2002
(000')
TO
N
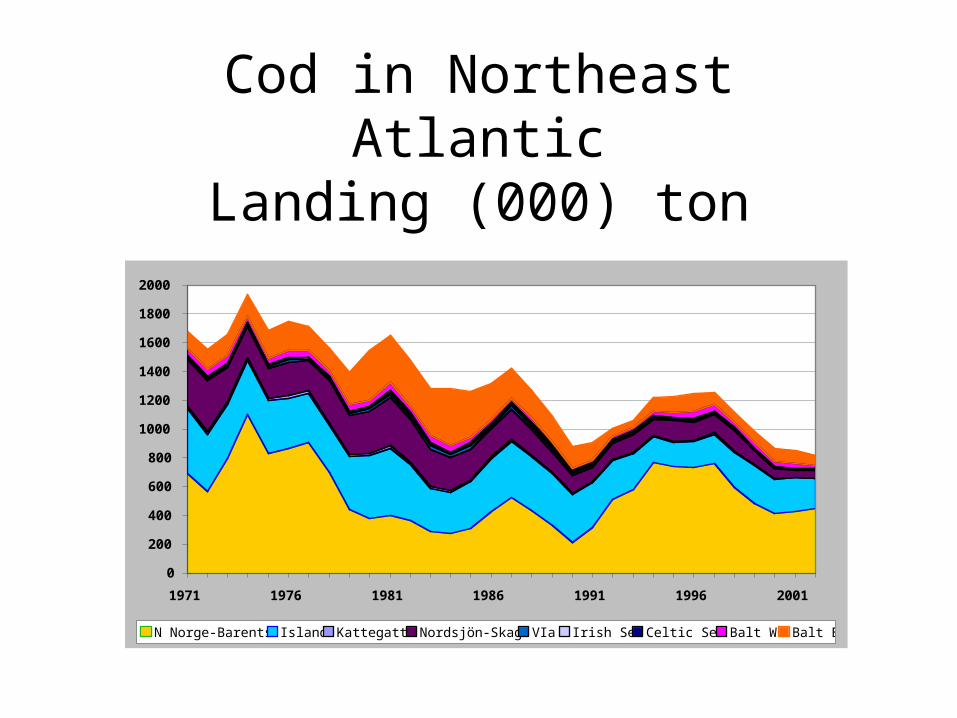
Cod in Northeast AtlanticLanding (000) ton
0
200
400
600
800
1000
1200
1400
1600
1800
2000
1971 1976 1981 1986 1991 1996 2001
N Norge-Barents Island Kattegatt Nordsjön-Skag VIa Irish Sea Celtic Sea Balt W Balt E
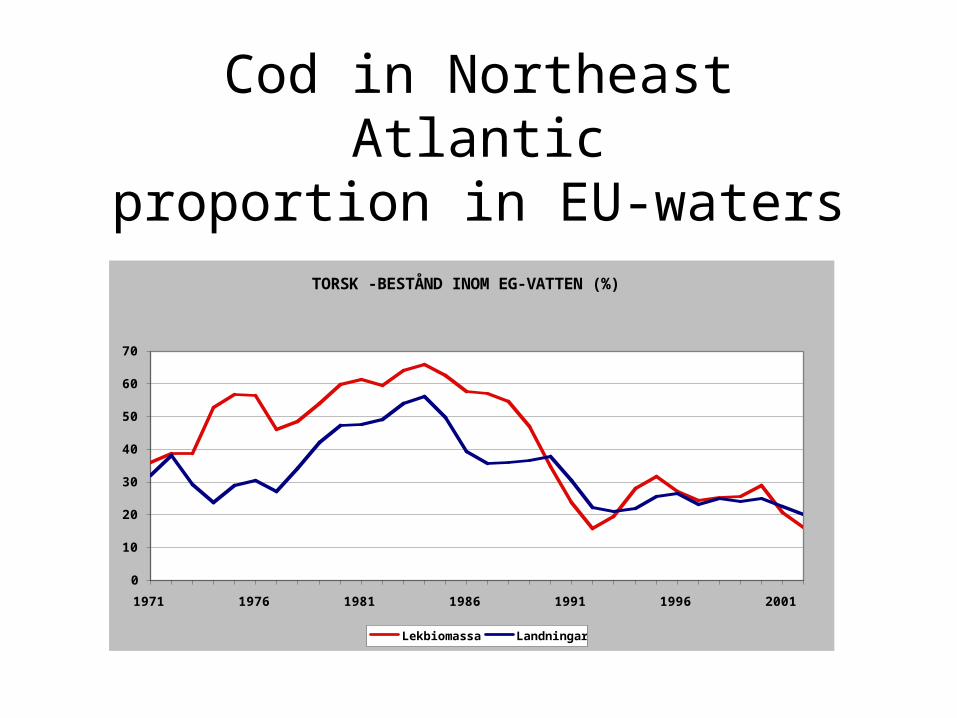
Cod in Northeast Atlanticproportion in EU-waters
TORSK -BESTÅND INOM EG-VATTEN (%)
0
10
20
30
40
50
60
70
1971 1976 1981 1986 1991 1996 2001
Lekbiomassa Landningar
Why are there so few old fishes now?
An effect of high fishing mortality
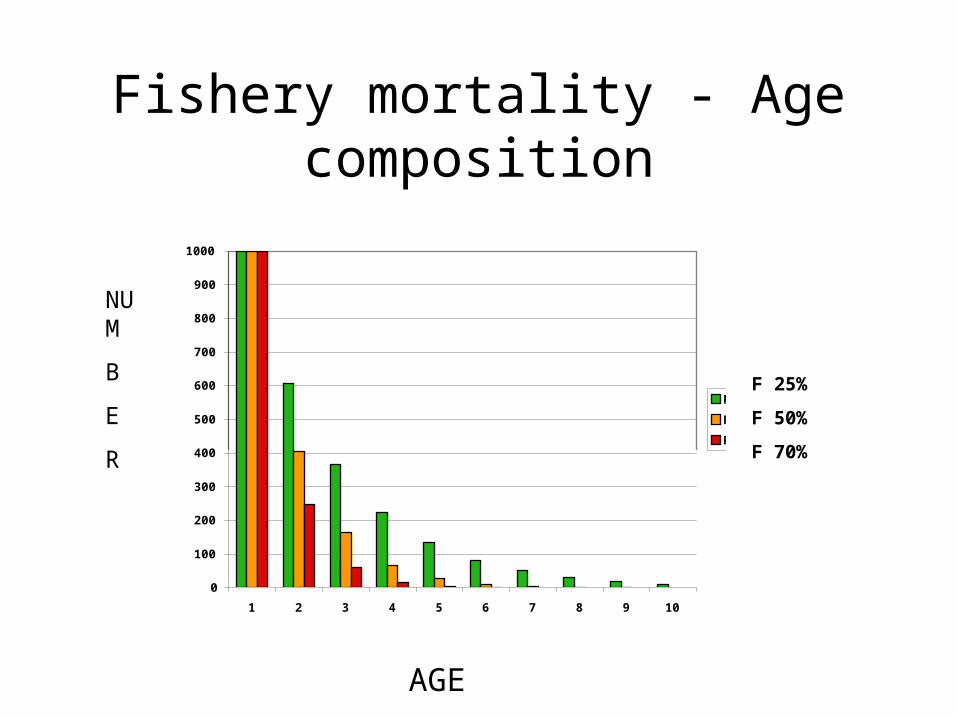
Fishery mortality - Age composition
F 25%
F 50%
F 70%
0
100
200
300
400
500
600
700
800
900
1000
1 2 3 4 5 6 7 8 9 10
F (25%)
F (50%)
F (70%)
AGE
NUM
B
E
R
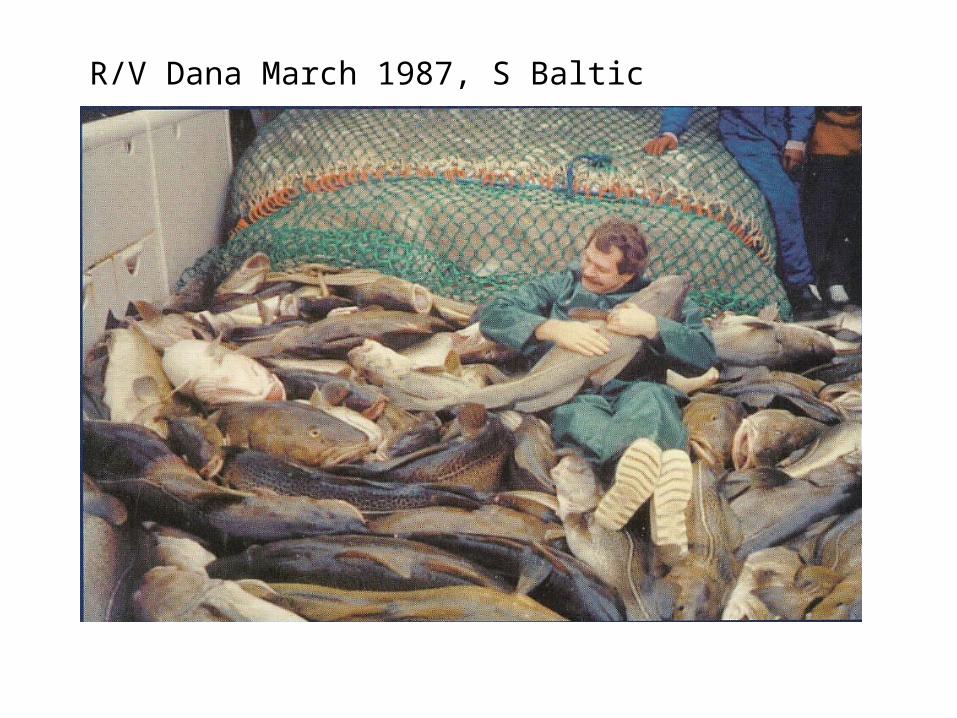
R/V Dana March 1987, S Baltic
The importance of old females(of cod)
They produce more eggs : 4 y 45-50 cm, 1 kg - 0.7 miljon egg
10 y ca 100 cm ,7 kg - 5 miljon egg
They produce bigger egg: better survival, better boyancy
Bigger eggs give longer larvæ with better survival.
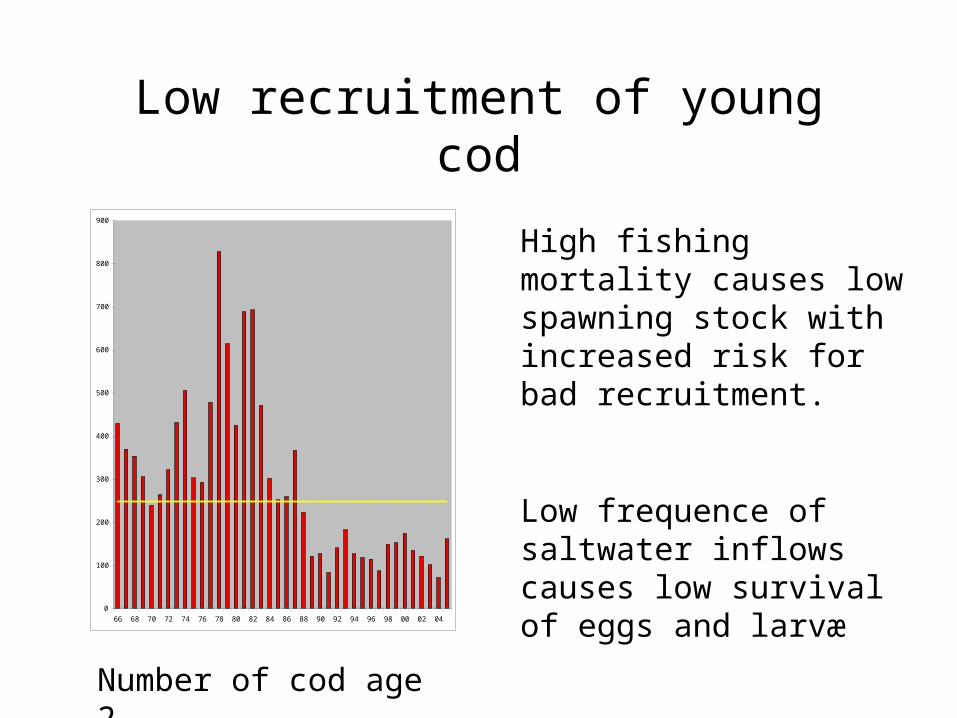
Low recruitment of young cod
0
100
200
300
400
500
600
700
800
900
66 68 70 72 74 76 78 80 82 84 86 88 90 92 94 96 98 00 02 04
High fishing mortality causes low spawning stock with increased risk for bad recruitment.
Low frequence of saltwater inflows causes low survival of eggs and larvæ
Number of cod age 2
EFFECTS on the ECOSYSTEM
LARGE PREDATORS LACKING
PREY SPECIES NUMEROUSTHEY EAT MORE:
ZOOPLANKTON, EGG, LARVÆ
LESS ALGÆ ARE CONSUMED.
Top-down effects?, Bottom-up effects?
Has the system flipped?
Are the processes reversibel?
Are the prospects for a recovery of cod in EU-waters good?

NO
Cod will not make the basis for a fishery of
resonable size within the coming 10 years
(E Baltic, Kattegatt, North Sea-Skagerrak)
What are needed to restore fish stocks?
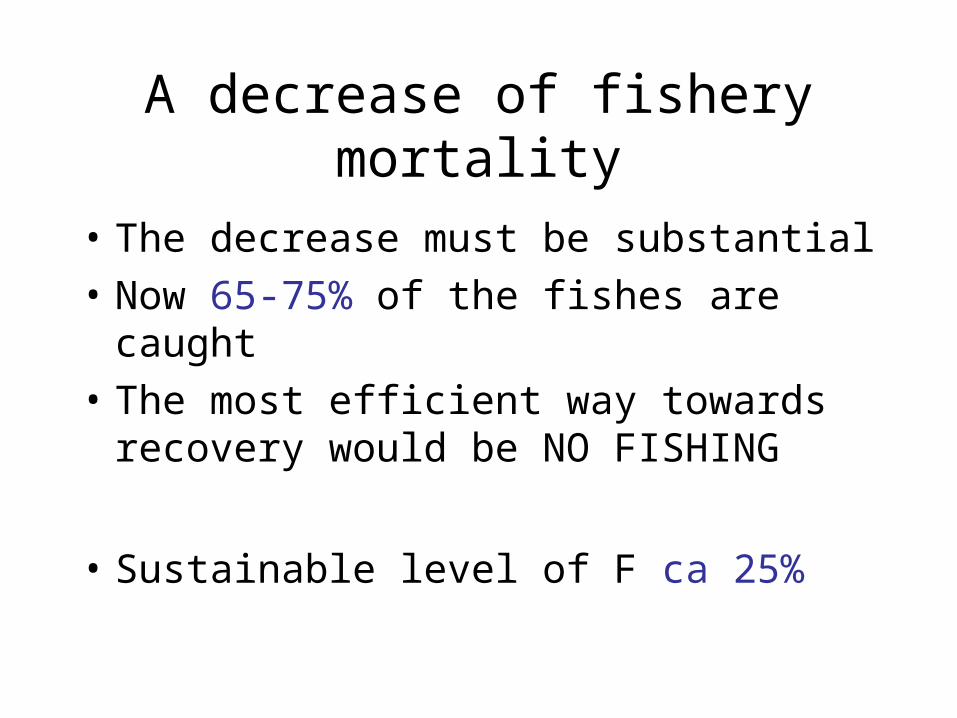
• The decrease must be substantial• Now 65-75% of the fishes are
caught• The most efficient way towards
recovery would be NO FISHING
• Sustainable level of F ca 25%
A decrease of fishery mortality
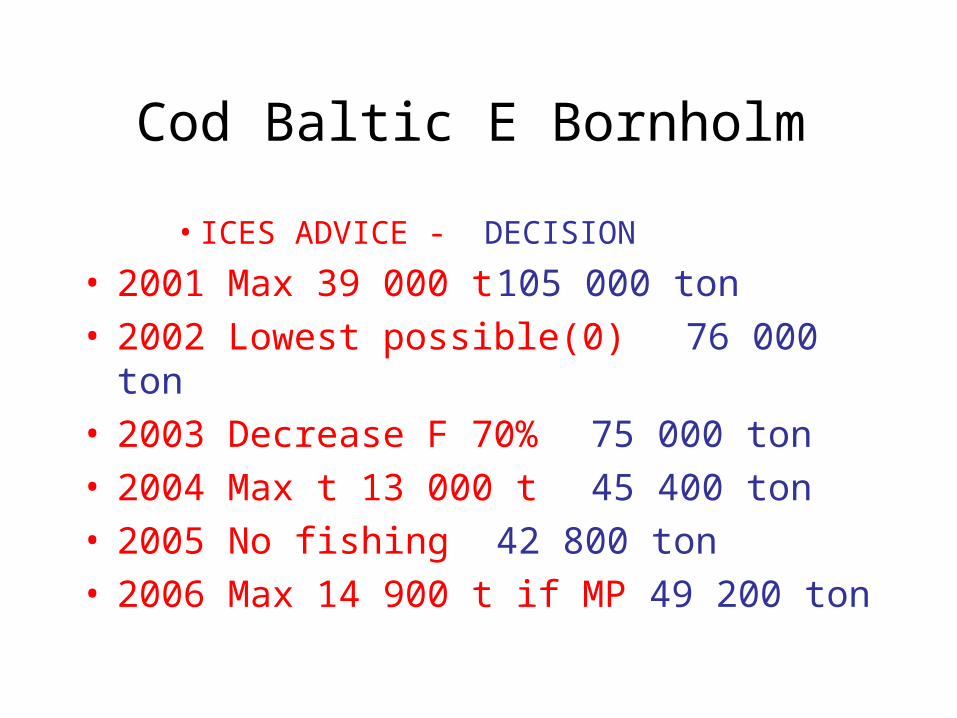
Cod Baltic E Bornholm
• ICES ADVICE - DECISION
• 2001 Max 39 000 t 105 000 ton• 2002 Lowest possible(0) 76 000 ton• 2003 Decrease F 70% 75 000 ton• 2004 Max t 13 000 t 45 400 ton• 2005 No fishing 42 800 ton• 2006 Max 14 900 t if MP 49 200 ton
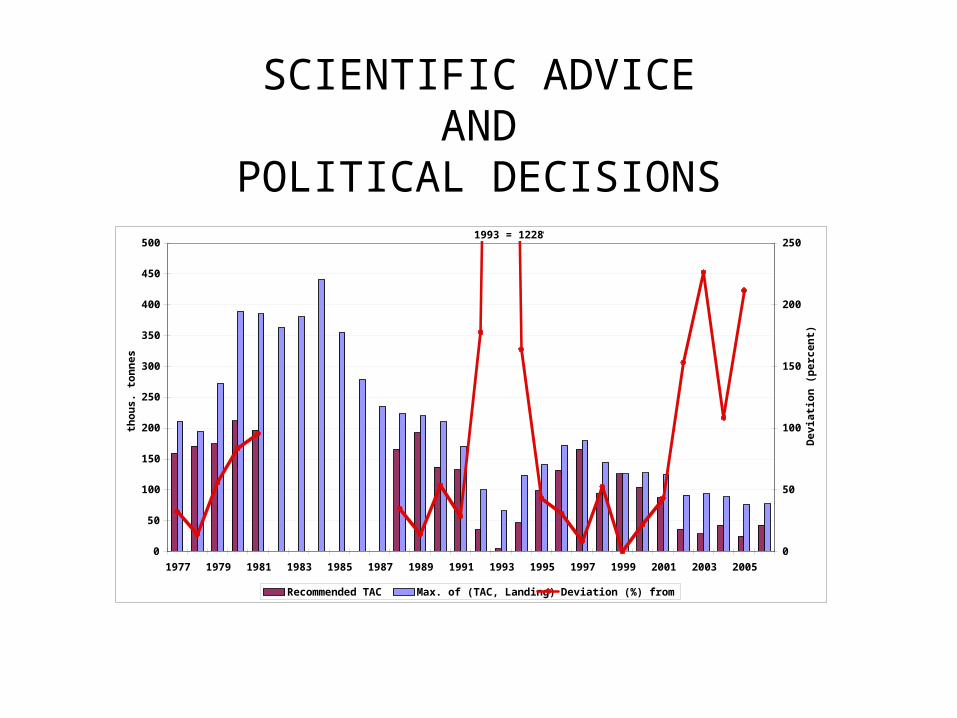
SCIENTIFIC ADVICEAND
POLITICAL DECISIONS
0
50
100
150
200
250
300
350
400
450
500
1977 1979 1981 1983 1985 1987 1989 1991 1993 1995 1997 1999 2001 2003 2005
tho
us.
to
nn
es
0
50
100
150
200
250
Dev
iati
on
(p
erce
nt)
Recommended TAC Max. of (TAC, Landing) Deviation (%) from rec.
1993 = 1228%
Why are the advice not followed?
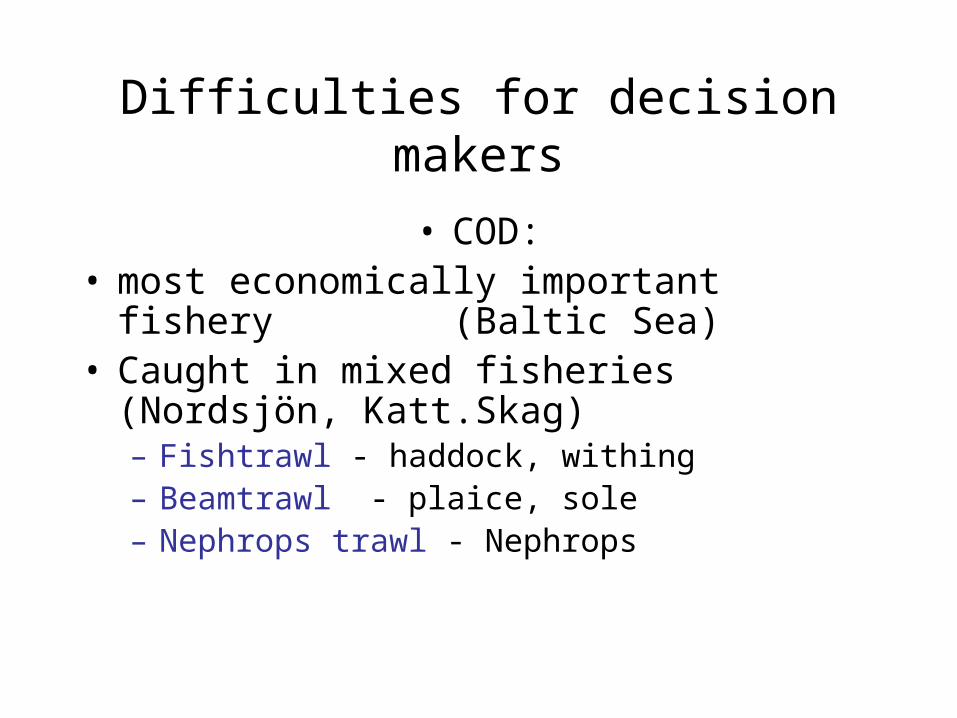
Difficulties for decision makers
• COD:• most economically important fishery
(Baltic Sea)• Caught in mixed fisheries (Nordsjön,
Katt.Skag)– Fishtrawl - haddock, withing – Beamtrawl - plaice, sole – Nephrops trawl - Nephrops
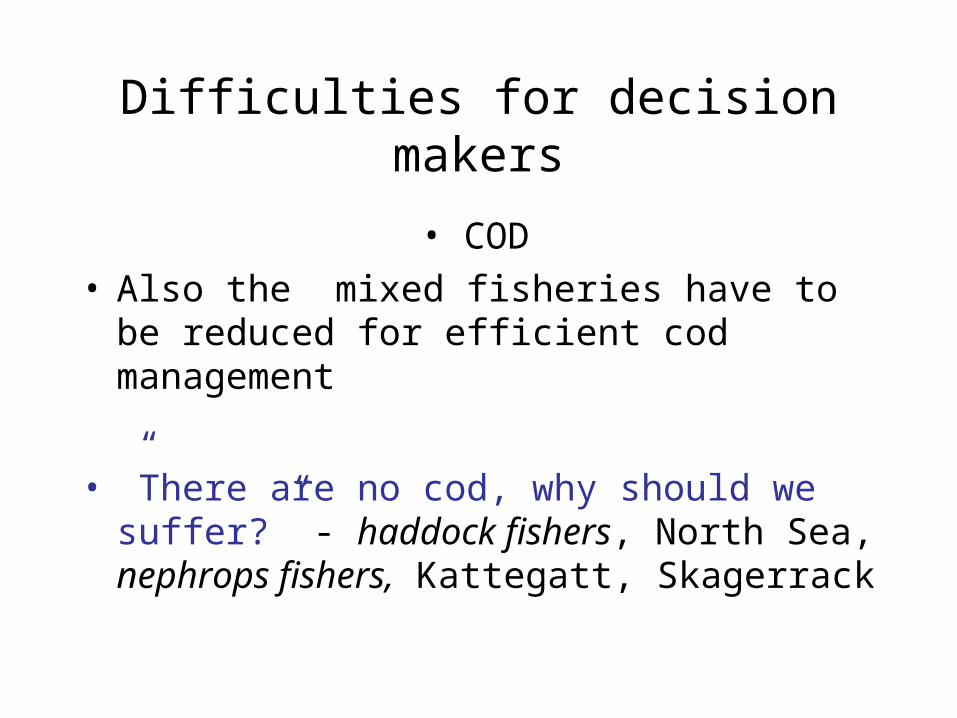
Difficulties for decision makers
• COD• Also the mixed fisheries have to be
reduced for efficient cod management
• ”There are no cod, why should we suffer?” - haddock fishers, North Sea, nephrops fishers, Kattegatt, Skagerrack
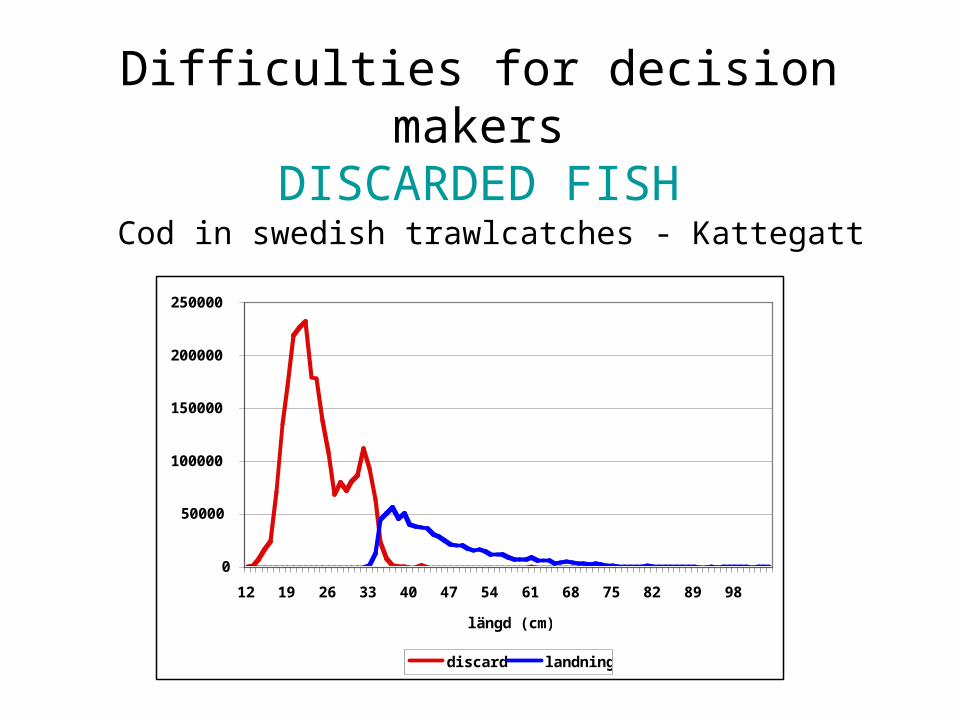
Difficulties for decision makersDISCARDED FISH
Cod in swedish trawlcatches - Kattegatt
0
50000
100000
150000
200000
250000
12 19 26 33 40 47 54 61 68 75 82 89 98
längd (cm)
discard landning
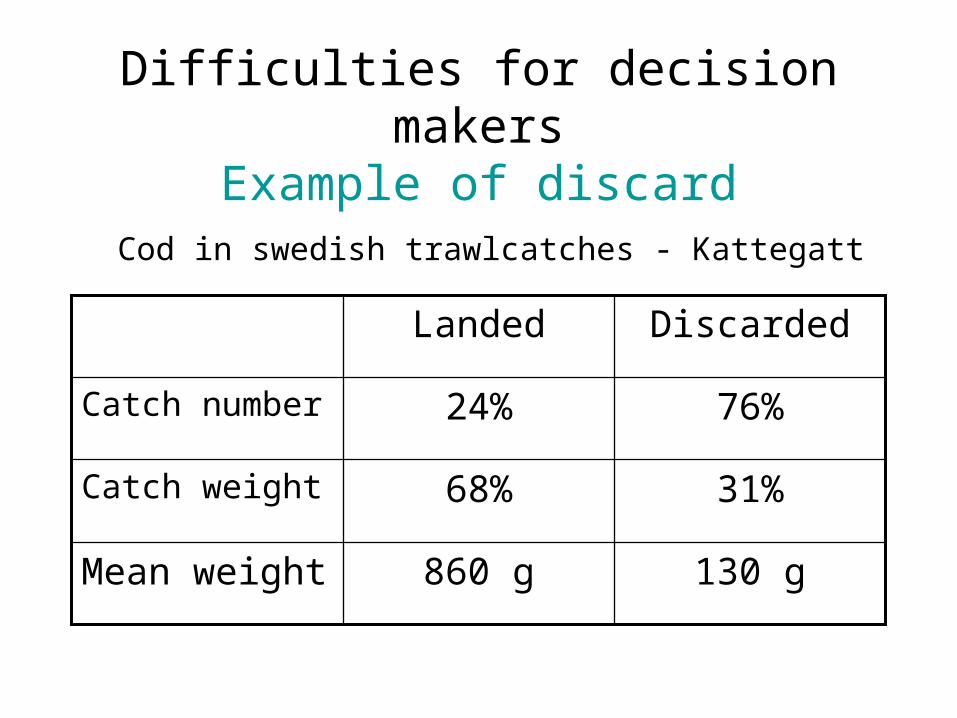
Difficulties for decision makersExample of discard
31%68%Catch weight
76%24%Catch number
DiscardedLanded
Mean weight 130 g860 g
Cod in swedish trawlcatches - Kattegatt
Difficulties for decision makers
• COD• To reach international agreements when a
certain regulatory measure hits differently among countries
• To handle bankruptcies, unemployment among fishers
• To withstand preassure from demonstrations, blocades etc
• To agree with regional och local decision makers in the country
Why is fish discarded?
◊They are too small (unlegal to land)
◊The quotum is filled (unlegal to land)
◊You want to fill your quotum/ration with bigger, more valuable fish (high-grading)
Who is to be blamed?
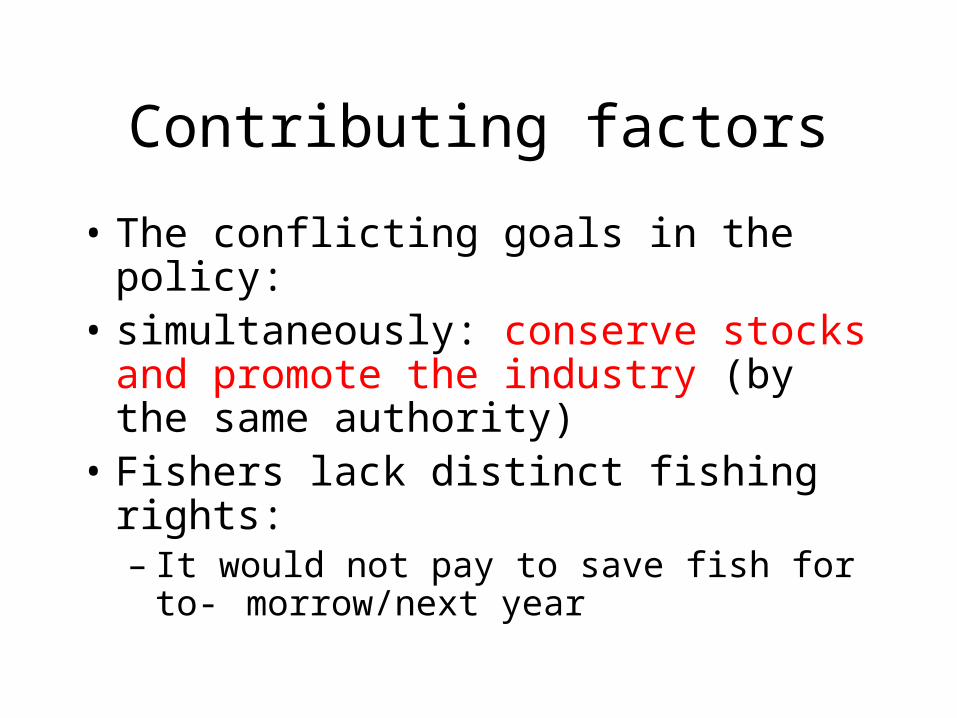
Contributing factors
• The conflicting goals in the policy:• simultaneously: conserve stocks
and promote the industry (by the same authority)
• Fishers lack distinct fishing rights:– It would not pay to save fish for to-
morrow/next year
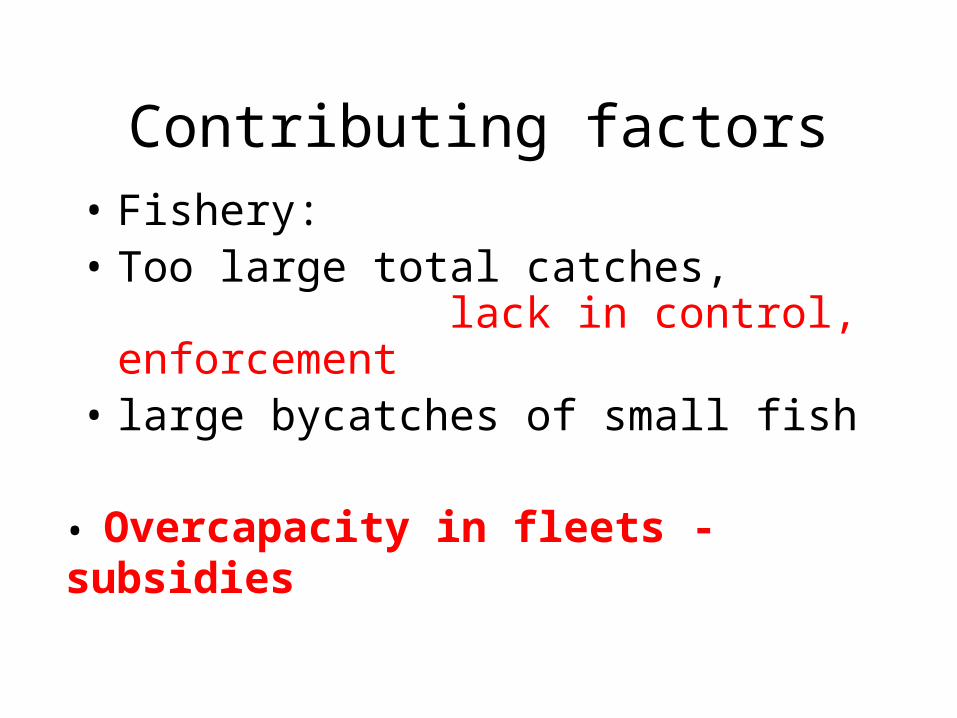
Contributing factors• Fishery:• Too large total catches,
lack in control, enforcement• large bycatches of small fish
• Overcapacity in fleets - subsidies
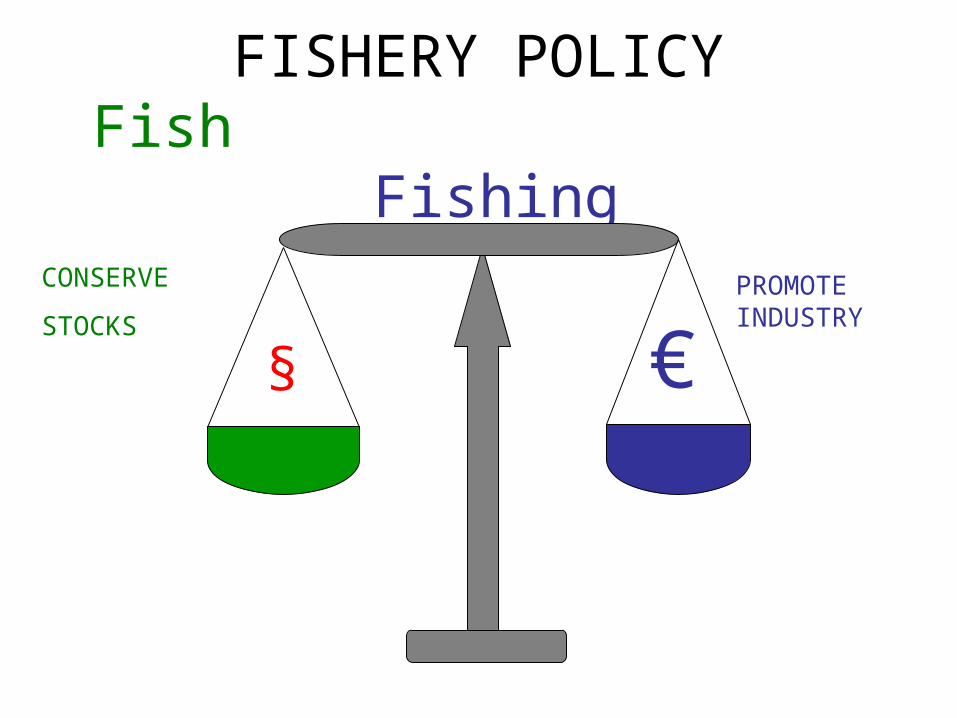
FISHERY POLICYFish Fishing
CONSERVE
STOCKS
PROMOTE INDUSTRY
§ €
0
1 000 000
2 000 000
3 000 000
4 000 000
5 000 000
6 000 000
7 000 000
8 000 000
9 000 000
10 000 000
1990 1991 1992 1993 1994 1995 1996 1997 1998
Tonnage kW
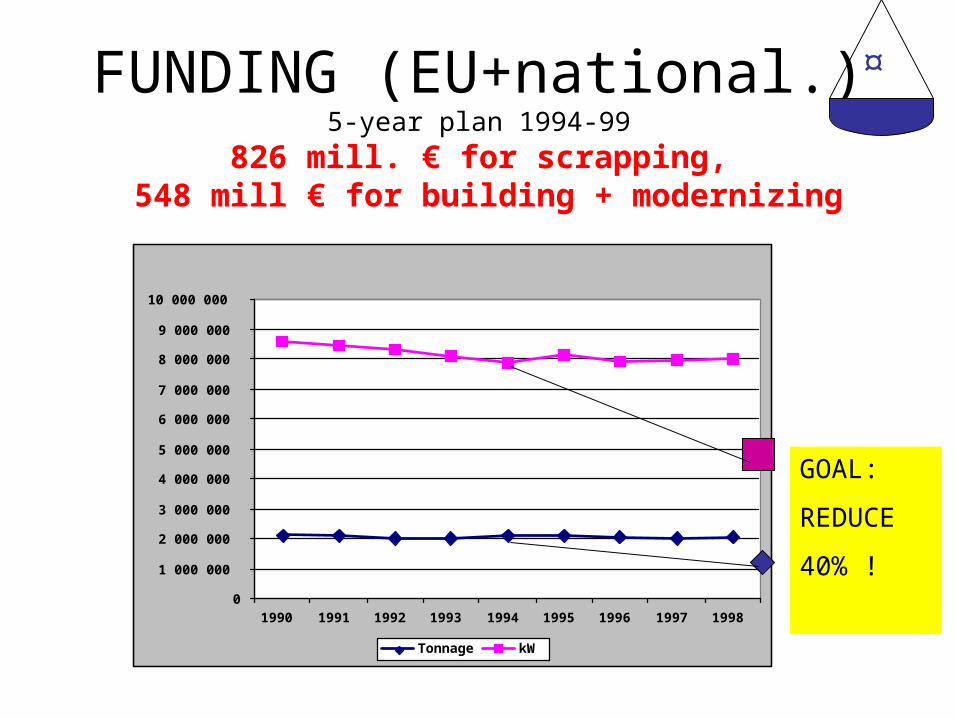
FUNDING (EU+national.)5-year plan 1994-99
826 mill. € for scrapping, 548 mill € for building + modernizing
GOAL:
REDUCE
40% !
¤
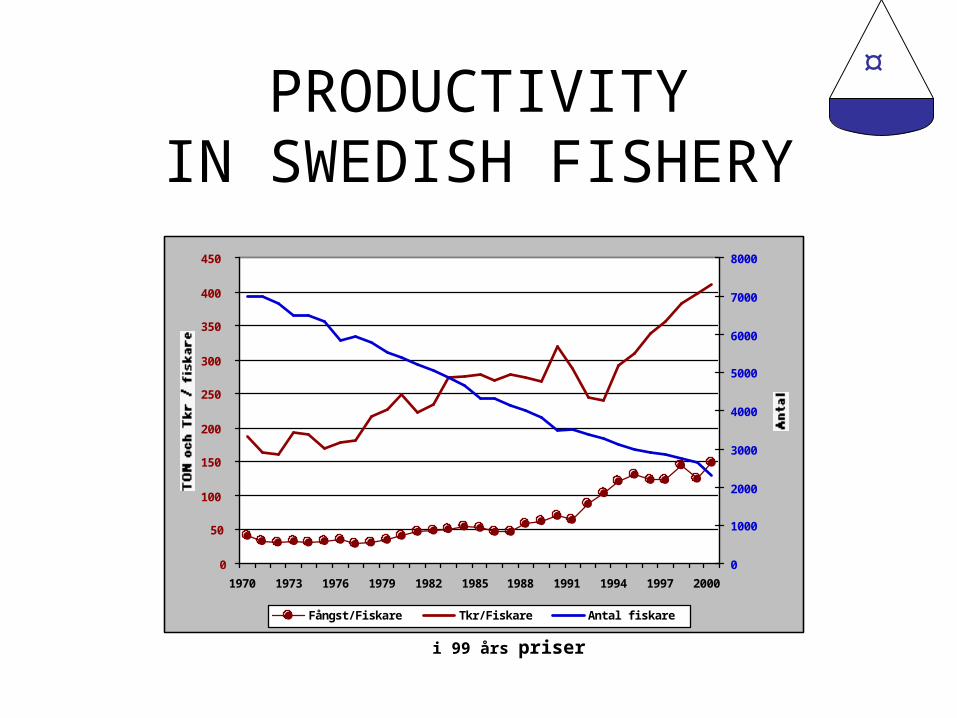
PRODUCTIVITYIN SWEDISH FISHERY
0
50
100
150
200
250
300
350
400
450
1970 1973 1976 1979 1982 1985 1988 1991 1994 1997 2000
0
1000
2000
3000
4000
5000
6000
7000
8000
Fångst/Fiskare Tkr/Fiskare Antal fiskare
i 99 års priser
¤
To-day :
•Stoch crises - overfishing•overcapacity in fleets•inreasing cheating, distrust, frustration
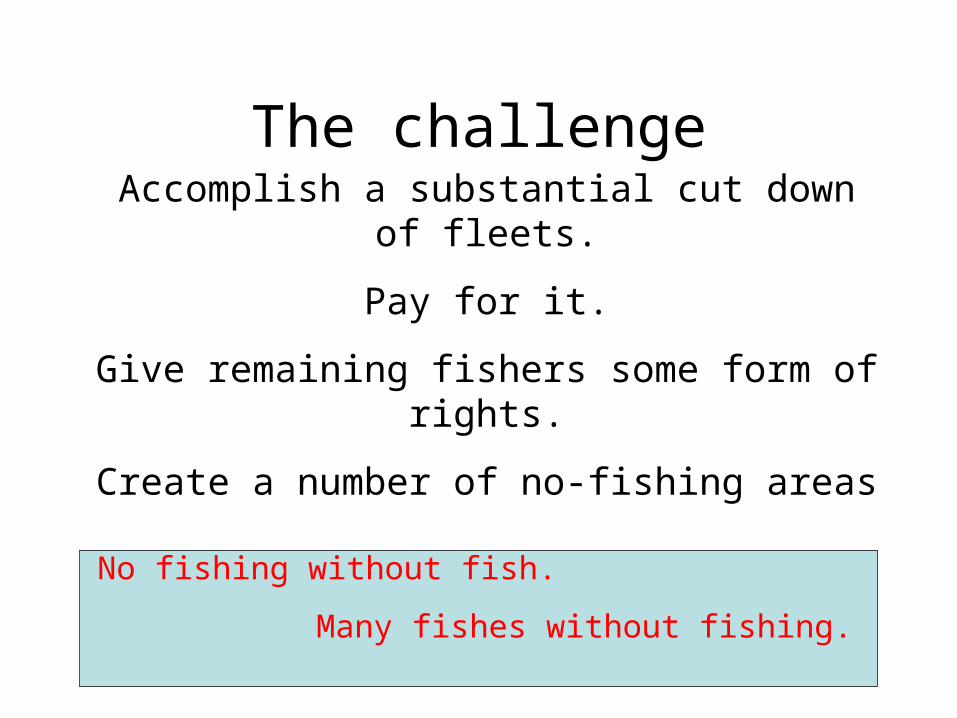
The challengeAccomplish a substantial cut down of
fleets.
Pay for it.
Give remaining fishers some form of rights.
Create a number of no-fishing areas
No fishing without fish.
Many fishes without fishing.

Thanks for your attention