Embed Size (px)
Citation preview
Band gap engineering:
the role of anions
vorgelegt von
Diplom Chemiker Björn Anke
geb. in Neubrandenburg
von der Fakultät II - Mathematik und Naturwissenschaften der Technischen Universität Berlin
zur Erlangung des akademischen Grades
Doktor der Naturwissenschaften - Dr. rer. nat. -
genehmigte Dissertation
Promotionsausschuss: Vorsitzender: Prof. Dr. Peter Strasser 1. Gutachter: Prof. Dr. Martin Lerch 2. Gutachter: Prof. Dr. Malte Behrens Tag der wissenschaftlichen Aussprache: 05. Mai 2017
Berlin 2017

Abstract II
Abstract I
Abstract
The degradation of harmful organic pollutants with the help of semiconductors is
regarded as one of the crucial solutions for waste water treatment. The main
disadvantage of extensively used photocatalysts such as SnO2, ZnO, and TiO2 is their
activity under UV illumination due to their wide band gap (~ 3.2 eV). Therefore they
can only absorb 5 – 7 % of the solar spectrum. In order to overcome this barrier,
processes for the selective influencing the optical band gap were developed: 'band gap
engineering'.
This dissertation is an exhaustive attempt for synthesis and characterization of new
anion-doped semiconductors using hydrogen fluoride and ammonia as doping suppliers.
The amorphous oxygen precursors were synthesized using a modified polymerisable
complex method (Pechini route) and a standard wet-chemical precipitation. The
experimental parameters were optimized and tuned for all materials to obtain pure
phases. Additionally a new and clean synthesis variant for fluorine incorporation was
developed. All products of this dissertation have been described using different
characterization methods to clarify the structural (Rietveld refinement), chemical
(nitrogen/oxygen content), and physical properties (spectral absorption range, density
determination). Cooperation partners also carried out quantum chemical calculations
(Prof. Dr. Bredow of the Universität Bonn) and measured photoelectrochemical
efficiency (Prof. Dr. Michael Wark of the Carl von Ossietzky Universität Oldenburg
and Prof. Dr. Anna Fischer of the Albert-Ludwigs-Universität Freiburg).
This thesis is divided into two parts: the tetragonal tungsten bronzes of the
Ba3-xLaxTa5O14-xN1+x type and O/F substitution in monoclinic scheelite-type bismuth
vanadate.
Light yellow Ba3Ta5O14N and yellow LaBa2Ta5O13N2 were successfully synthesized as
phase-pure materials crystallizing isostructurally to the well-known mixed-valence
Ba3TaV4TaIVO15. The electronic structure of both materials, Ba3Ta5O14N and
LaBa2Ta5O13N2, were studied theoretically with the range-separated hybrid method
HSE06. The most stable structure was obtained when lanthanum was placed on 2a and
nitrogen on 4h sites confirming Pauling’s second rule. By incorporating nitrogen, the
Abstract II
measured optical band gap decreases from ∼3.8 eV for the pure oxide via 2.74 eV for
Ba3Ta5O14N to 2.63 eV for LaBa2Ta5O13N2, giving rise to an absorption band well in
the visible-light region. Calculated fundamental band gaps confirm the experimental
trend. The atom-projected density of states has large contributions from N2p orbitals
close to the valence band edge. These are responsible for the observed band gap
reduction. Photocatalytic hydrogen formation was investigated, revealing significantly
higher activity for LaBa2Ta5O13N2 compared to Ba3Ta5O14N under UV-light.
Fluorine-containing bismuth vanadate powder was synthesized using a new, clean, and
simple solid-vapor reaction. Incorporation of fluorine mainly leads to the formation of
cation vacancies. Electrodes were fabricated from the pre-synthesized powder samples
by electrophoretic deposition onto fluorine-doped tin oxide coated glass slides and
subsequent calcination. The photoelectrochemical performance concerning the water
oxidation reaction was investigated and compared to pristine BiVO4, revealing strongly
enhanced photoelectrochemical behavior for the fluorine-containing bismuth vanadate.
Zusammenfassung III
Zusammenfassung
Der Abbau von schädlichen organischen Schadstoffen mit Hilfe von Halbleitern gilt als
eine der entscheidenden Lösungen für die Abwasserbehandlung. Der Hauptnachteil weit
verbreiteter Photokatalysatoren wie SnO2, ZnO und TiO2 ist, dass sie aufgrund ihrer
breiten optischen Bandlücke (~ 3,2 eV) nur unter UV-Licht aktiv sind und daher nur
5 – 7 % des Sonnenspektrums absorbieren können. Um diese Hürde zu überwinden,
wurden Methoden entwickelt, um die optische Bandlücke selektiv zu beeinflussen,
sogenanntes „Band Gap Engineering“.
Diese Dissertation befasst sich mit der Synthese und Charakterisierung neuer
Anion-dotierter Halbleiter unter Verwendung von Fluorwasserstoff und Ammoniak als
Dotierungslieferanten. Die amorphen Sauerstoff-Präkursoren wurden über eine
modifizierte Polymerkomplexmethode (Pechini-Methode) und eine übliche nass-
chemische Ausfällung synthetisiert. Die experimentellen Parameter wurden optimiert
und auf alle Materialien abgestimmt, um einphasige Produkte zu erhalten. Es wurde
außerdem eine neue und saubere Synthesevariante für die Fluorierung entwickelt. Alle
Produkte dieser Dissertation wurden mittels verschiedener Charakterisierungsmethoden
untersucht, um die strukturellen (Rietveld Verfeinerung), chemischen
(Sauerstoff/Stickstoff-Gehalt) und physikalischen (spektrale Absorptionsbereich,
Dichtebestimmung) Eigenschaften zu bestimmen. Außerdem wurden von
Kooperationspartnern quantenchemische Rechnungen getätigt (Prof. Dr. Thomas
Bredow von der Universität Bonn) und auch die photoelektrochemische Effizienz
gemessen (Prof. Dr. Michael Wark von der Carl von Ossietzky Universität Oldenburg
und Prof. Dr. Anna Fischer von der Albert-Ludwigs-Universität Freiburg).
Diese Arbeit gliedert sich in zwei Teile: Die tetragonalen Wolframbronzen vom Typ
Ba3-xLaxTa5O14-xN1+x und O/F-Substitution in monoklinen Bismutvanadat vom
Scheelit-Typ.
Hellgelbes Ba3Ta5O14N und gelbes LaBa2Ta5O13N2 wurden erfolgreich phasenrein
synthetisiert, die isostrukturell zu dem literaturbekannten, gemischtvalenten
Ba3TaV4TaIVO15 kristallisieren. Die elektronische Struktur beider Materialien,
Ba3Ta5O14N und LaBa2Ta5O13N2, wurde mit dem Hybridverfahren HSE06 untersucht.
Zusammenfassung IV
Die stabilste Struktur wurde erhalten, wenn Lanthan auf 2a und Stickstoff auf 4h
Wyckoffpositionen gesetzt wurden, was gleichzeitig im Einklang mit Paulings zweiter
Regel steht. Durch Einlagerung von Stickstoff sinkt die gemessene optische Bandlücke
von ∼ 3,8 eV für das reine Oxid über 2,74 eV für Ba3Ta5O14N auf 2,63 eV für
LaBa2Ta5O13N2, was zu einer Absorption im Bereich des sichtbaren Lichts führt. Die
berechneten Bandlücken bestätigen den experimentellen Trend. Die atom-projizierte
Dichte von Zuständen hat große Beiträge von N2p-Orbitalen nahe der Valenzbandkante,
diese sind für die beobachtete Bandlückenverringerung verantwortlich. Außerdem
wurde die photokatalytische Wasserstoffbildung untersucht, welche eine deutlich
höhere Aktivität für LaBa2Ta5O13N2 im Vergleich zu Ba3Ta5O14N im UV-Bereich zeigt.
Fluorhaltiges Bismutvanadatpulver wurde unter Verwendung einer neuartigen, sauberen
und einfachen Festkörper-Gas-Reaktion synthetisiert. Der Einbau von Fluor führte
hauptsächlich zur Bildung von Kationenleerstellen. Elektroden wurden aus den
vorsynthetisierten Pulverproben durch elektrophoretische Abscheidung auf mit Fluor
dotierte zinnoxidbeschichtete Glasplättchen und anschließender Kalzinierung
hergestellt. Die photoelektrochemische Aktivität bezüglich der
Wasseroxidationsreaktion wurde untersucht und mit der des reinen/ unfluorierten
Bismutvanadats verglichen. Die fluorhaltige Phase zeigte eine stark verbesserte
photoelektrochemische Aktivität.
Acknowledgement V
Acknowledgement
First and foremost I would like to express my heartfelt gratitude to my thesis advisor
Prof. Dr. Martin Lerch of the Technische Universität Berlin for the opportunity to work
on this interesting topic as well as for his direction and support.
Furthermore, I want to thank Prof. Dr. Malte Behrens of the University Duisburg-Essen
for being the second reviewer of this doctoral work and Prof. Dr. Peter Strasser of the
Technische Universität Berlin for taking over the chair of the doctoral committee.
Many others have contributed to the successful realization of this scientific work, whom
I want to thank very much:
Prof. Dr. Thomas Bredow of the Universität Bonn for the quantum chemical
calculations,
Dr. Julia Soldat, M. Sc. Martin Pilarski, and Prof. Dr. Michael Wark of the Carl von
Ossietzky Universität Oldenburg for the photocatalytic hydrogen formation
measurements,
M. Sc. Maika Stöbe, Astrid Müller-Klauke, and Dipl. Ing. (FH) Ulrich Gernert of the
Technische Universität Berlin for performing XRF analyses, ICP-OES investigations,
and for access to and support with SEM measurements.
A special thank goes to Dipl. Chem. Martin Rohloff (Group of Prof. Anna Fischer) of
the Technische Universität Berlin for the photocatalytic oxygen formation
measurements and the numerous meetings with fruitful discussions.
I also thank all the Lerch group members, Anna, Claudia, Dennis, Elisabeth, Eva,
Stefan, Steven, Suliman, and Tobi; the Grohmann group, Anika, Jana for all the cakes,
beers, and ice-cream.
Moreover, thanks go to my lovely friends, who have always been there for me. Many
thanks for the moral and emotional support during this work, for enriching my life, and
for all our exciting and unforgettable memories. A special big thank goes to Nadine and
Niklas for proofreading the thesis.

Acknowledgement VI
All of this could not happen without my family, I am very thankful to my parents for
their continuous encouragement, love, and full support in all matters. Last, but
definitely not least: my warmest thank goes to Eva. Thanks for being here with me,
accompanying me in my every steps. Thanks for always being supportive, for sharing
every moments of happiness and sadness, and for keeping up with me.

Acknowledgement VII
Preface VIII
Preface
The here-presented dissertation is written in a cumulative way. The overall research
question of the doctoral project is presented by a comprehensive introductory chapter
including theoretical background and methodology, describing the used scientific
methods (Part I –Introduction). This introduction completes with a corresponding
bibliography. The results (Part II – Results and Discussion) of the work are based on
following, already published journal articles.
1. B. Anke, T. Bredow, J. Soldat, M. Wark, M. Lerch; Synthesis, crystal struc-
ture, and photocatalytical properties of Ba3Ta5O14N, J. Solid State Chem., 2016, 233, 282–288.
2. B. Anke, T. Bredow, M. Pilarski, M. Wark, M. Lerch; From Ba3Ta5O14N to La Ba2Ta5O13N2: Decreasing the Optical Band Gap of a Photocatalysts, J. Solid State Chem., 2017, 246, 75–80.
3. B. Anke, M. Rohloff, M.G. Willinger, W. Hetaba, A. Fischer, M. Lerch; Im-proved photoelectrochemical performance of bismuth vanadate by partial O/F-substitution; Solid State Sci., 2017, 63, 1–8.
To have a consistent layout and good readability the formatting is kept identical for the
entire work. Thus, the display format of the papers incorporated in the thesis is not like
the published versions. Each publication has an independent introductory section;
consequently some information might be repeated within the work. Every publication
concludes with its related list of references. The subsequent section (Chapter 7 –
Conclusion and Outlook) collects the major results and relevant information discussed
in the individual publications and closes with a short outlook to possible prospective
experiments in the research area. The thesis was accomplished in the period from March
2014 to January 2017 under the supervision of Prof. Dr. Martin Lerch at the Institut für
Chemie at the Technische Universität Berlin.
Contents IX
Contents
Abstract ............................................................................................................................ I
Zusammenfassung ........................................................................................................ III
Acknowledgement ........................................................................................................... V
Preface ........................................................................................................................ VIII
Contents ......................................................................................................................... IX
I. Introduction
1. Motivation ............................................................................................................... 1
2. Theoretical Background ........................................................................................ 5 2.1. Optical band gap engineering .................................................................... 5 2.2. Tetragonal tungsten bronze structure ......................................................... 6 2.3. Bismuth vanadate ....................................................................................... 8 2.4. The Rietveld analysis ............................................................................... 13
3. Methodology ......................................................................................................... 16 3.1. Preparation ............................................................................................... 16 3.2. Furnaces ................................................................................................... 18 3.3. X-ray diffraction ...................................................................................... 21 3.4. Hot gas extraction .................................................................................... 23 3.5. UV-Vis spectroscopy ............................................................................... 24 3.6. Gas pycnometry ....................................................................................... 24 3.7. Photocatalysis .......................................................................................... 25
Bibliography ................................................................................................................... 28
II. Results and Discussion
4. Publication 1 ......................................................................................................... 32 4.1. Abstract .................................................................................................... 34 4.2. Introduction .............................................................................................. 34 4.3. Experimental Section ............................................................................... 35 4.4. Results and discussion ............................................................................. 37 4.5. Conclusion ............................................................................................... 48 References .............................................................................................................. 49
Contents X
5. Publication 2 ......................................................................................................... 52 5.1. Abstract .................................................................................................... 54 5.2. Introduction .............................................................................................. 54 5.3. Experimental Section ............................................................................... 55 5.4. Results and discussion ............................................................................. 58 5.5. Conclusion ............................................................................................... 65 References .............................................................................................................. 66
6. Publication 3 ......................................................................................................... 68 6.1. Abstract .................................................................................................... 70 6.2. Introduction .............................................................................................. 70 6.3. Experimental Section ............................................................................... 71 6.4. Results and discussion ............................................................................. 74 6.5. Conclusion ............................................................................................... 85 References .............................................................................................................. 86
7. Conclusion and Outlook ...................................................................................... 89 7.1. Conclusion ............................................................................................... 89 7.2. Outlook .................................................................................................... 91
Appendices ..................................................................................................................... 93 A Additional information, Supplementary material .................................... 93 B List of publications .................................................................................. 94 C List of conference contributions .............................................................. 96 D Awards ..................................................................................................... 96
List of Tables .................................................................................................................. 98
List of Figures ................................................................................................................ 99

Contents XI

Introduction XII
Part I.
I. Introduction
1. Motivation
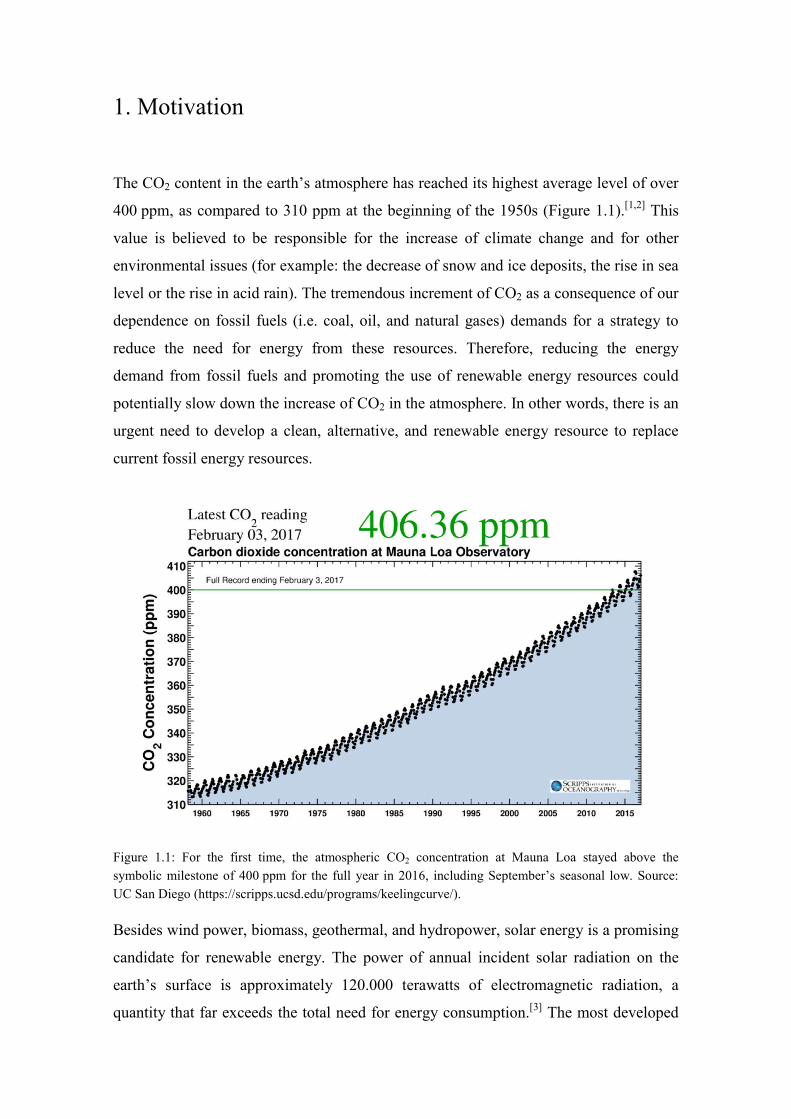
The CO2 content in the earth’s atmosphere has reached its highest average level of over
400 ppm, as compared to 310 ppm at the beginning of the 1950s (Figure 1.1).[1,2] This
value is believed to be responsible for the increase of climate change and for other
environmental issues (for example: the decrease of snow and ice deposits, the rise in sea
level or the rise in acid rain). The tremendous increment of CO2 as a consequence of our
dependence on fossil fuels (i.e. coal, oil, and natural gases) demands for a strategy to
reduce the need for energy from these resources. Therefore, reducing the energy
demand from fossil fuels and promoting the use of renewable energy resources could
potentially slow down the increase of CO2 in the atmosphere. In other words, there is an
urgent need to develop a clean, alternative, and renewable energy resource to replace
current fossil energy resources.
Figure 1.1: For the first time, the atmospheric CO2 concentration at Mauna Loa stayed above the symbolic milestone of 400 ppm for the full year in 2016, including September’s seasonal low. Source: UC San Diego (https://scripps.ucsd.edu/programs/keelingcurve/).
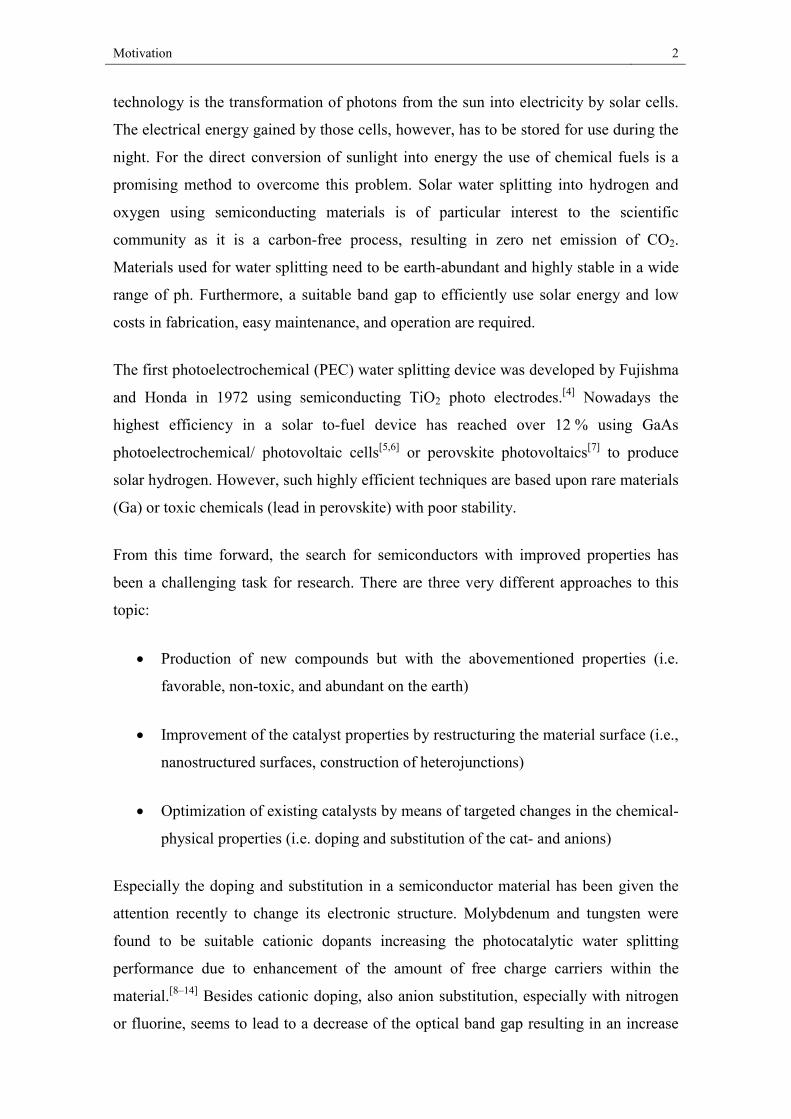
Besides wind power, biomass, geothermal, and hydropower, solar energy is a promising
candidate for renewable energy. The power of annual incident solar radiation on the
earth’s surface is approximately 120.000 terawatts of electromagnetic radiation, a
quantity that far exceeds the total need for energy consumption.[3] The most developed
Motivation 2
technology is the transformation of photons from the sun into electricity by solar cells.
The electrical energy gained by those cells, however, has to be stored for use during the
night. For the direct conversion of sunlight into energy the use of chemical fuels is a
promising method to overcome this problem. Solar water splitting into hydrogen and
oxygen using semiconducting materials is of particular interest to the scientific
community as it is a carbon-free process, resulting in zero net emission of CO2.
Materials used for water splitting need to be earth-abundant and highly stable in a wide
range of ph. Furthermore, a suitable band gap to efficiently use solar energy and low
costs in fabrication, easy maintenance, and operation are required.
The first photoelectrochemical (PEC) water splitting device was developed by Fujishma
and Honda in 1972 using semiconducting TiO2 photo electrodes.[4] Nowadays the
highest efficiency in a solar to-fuel device has reached over 12 % using GaAs
photoelectrochemical/ photovoltaic cells[5,6] or perovskite photovoltaics[7] to produce
solar hydrogen. However, such highly efficient techniques are based upon rare materials
(Ga) or toxic chemicals (lead in perovskite) with poor stability.
From this time forward, the search for semiconductors with improved properties has
been a challenging task for research. There are three very different approaches to this
topic:
• Production of new compounds but with the abovementioned properties (i.e.
favorable, non-toxic, and abundant on the earth)
• Improvement of the catalyst properties by restructuring the material surface (i.e.,
nanostructured surfaces, construction of heterojunctions)
• Optimization of existing catalysts by means of targeted changes in the chemical-
physical properties (i.e. doping and substitution of the cat- and anions)
Especially the doping and substitution in a semiconductor material has been given the
attention recently to change its electronic structure. Molybdenum and tungsten were
found to be suitable cationic dopants increasing the photocatalytic water splitting
performance due to enhancement of the amount of free charge carriers within the
material.[8–14] Besides cationic doping, also anion substitution, especially with nitrogen
or fluorine, seems to lead to a decrease of the optical band gap resulting in an increase

Motivation 3
of photocatalytic performance.[15,16] However, such materials have not been studied in
detail so far.

Motivation 4
Theoretical Background 5
2. Theoretical Background
2.1. Optical band gap engineering
The band gap is an energy range in a solid where no electron states can exist. In graphs
of the electronic band structure of solids, the band gap generally refers to the energy
difference (in electron volts) between the top of the valence band (HOMO) and the
bottom of the conduction band (LUMO) in insulators and semiconductors.
The width of the band gap is determined by the extent of overlap of the valence orbitals,
and by the difference between the electronegativities of the cations and anions involved.
Van Vechten et al.[17] established a concept derived from these factors (that is, valence-
orbital overlap and electronegativity difference) that allows a design of band gaps in
semiconductors, this concept is nowadays called “band gap engineering”. The optical
band gap of a material can be controlled or altered by adjusting the composition of
certain semiconductor alloys, such as in Ca(1-x)LaxTaO(2-x)N(1+x).[18] Jansen et al.
reported that the variation of x between 0 and 1 enables a fine-tuning of colors through
the desired range, from yellow through orange to deep red. In their theoretical work
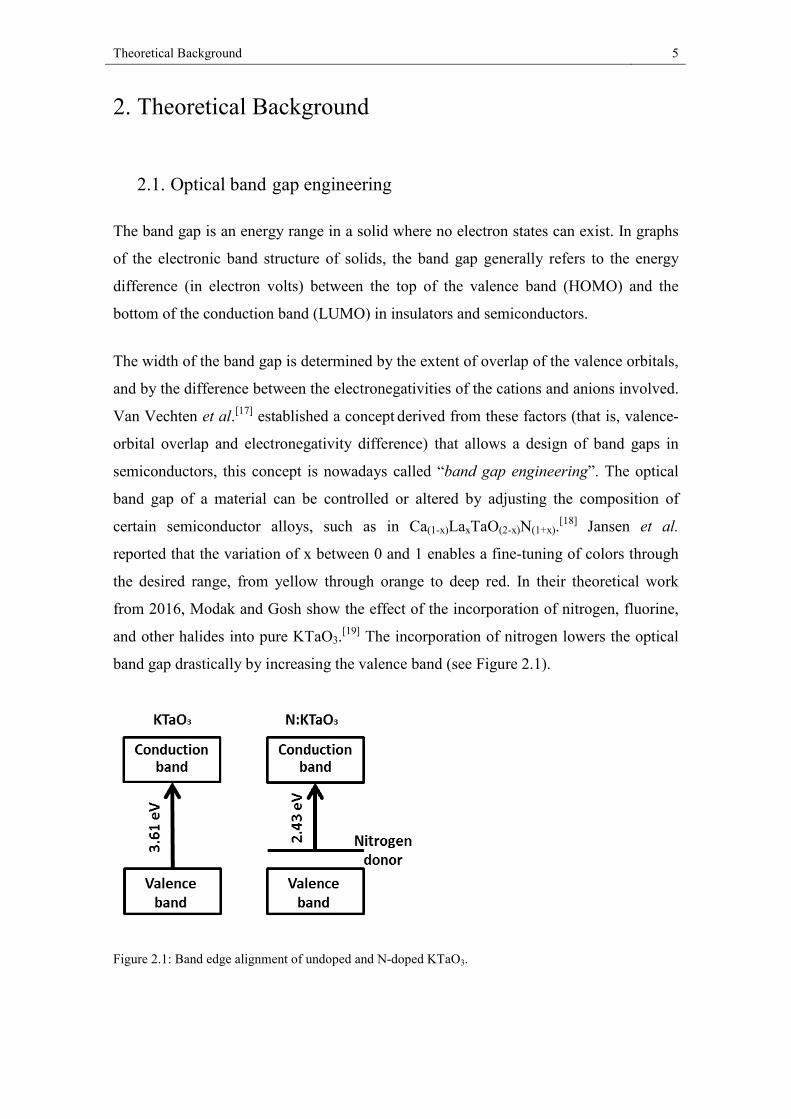
from 2016, Modak and Gosh show the effect of the incorporation of nitrogen, fluorine,
and other halides into pure KTaO3.[19] The incorporation of nitrogen lowers the optical
band gap drastically by increasing the valence band (see Figure 2.1).
Figure 2.1: Band edge alignment of undoped and N-doped KTaO3.
Theoretical Background 6
2.2. Tetragonal tungsten bronze structure
The tetragonal tungsten bronze (TTB) structure was described in 1949 by Magneli[20]
for K0.57WO3 (K2.85W5O15). In 1953, ferroelectric properties of PbNb2O6
(Pb2.5Nb5O15)[21] were demonstrated. In 1967, non-linear optics properties were studied
on TTB crystals in IBM and Bell Telephone Laboratories.[22] Since 1970, dielectric
studies were carried out simultaneously in the USA, the USSR, Japan, Great Britain,
and France. This shows the incredibly large span of this structure. The crystal structure
is described in more detail below.
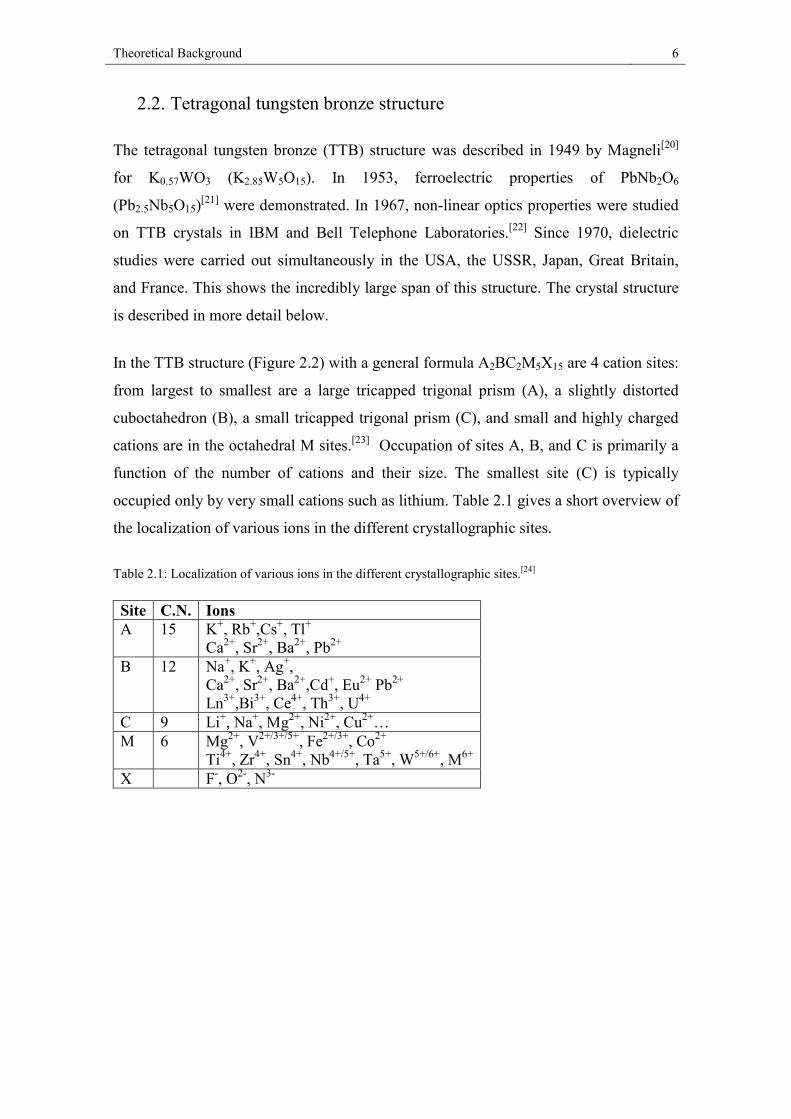
In the TTB structure (Figure 2.2) with a general formula A2BC2M5X15 are 4 cation sites:
from largest to smallest are a large tricapped trigonal prism (A), a slightly distorted
cuboctahedron (B), a small tricapped trigonal prism (C), and small and highly charged
cations are in the octahedral M sites.[23] Occupation of sites A, B, and C is primarily a
function of the number of cations and their size. The smallest site (C) is typically
occupied only by very small cations such as lithium. Table 2.1 gives a short overview of
the localization of various ions in the different crystallographic sites.
Table 2.1: Localization of various ions in the different crystallographic sites.[24]
Site C.N. Ions A 15 K+, Rb+,Cs+, Tl+
Ca2+, Sr2+, Ba2+, Pb2+
B 12 Na+, K+, Ag+, Ca2+, Sr2+, Ba2+,Cd+, Eu2+ Pb2+ Ln3+,Bi3+, Ce4+, Th3+, U4+
C 9 Li+, Na+, Mg2+, Ni2+, Cu2+… M 6 Mg2+, V2+/3+/5+, Fe2+/3+, Co2+
Ti4+, Zr4+, Sn4+, Nb4+/5+, Ta5+, W5+/6+, M6+
X F-, O2-, N3-
Theoretical Background 7
Figure 2.2: Schematic projection of the TTB crystalline network (A2BC2M5X15) along the c axis (A, B, and C correspond to cationic sites with 15, 12, and 9 coordination numbers, respectively).
The chemical stability is high when big cations (Ba2+, Sr2+) occupy the A site, small,
and low charged ions (Li+) are on the C-site and small but highly charged cations
(Ta5+,Nb5+) are on the M-site. The various types of stoichiometry depend on the
existence of vacancies (□) in either one or another site, as shown by the examples
below:
• all sites are fully occupied: K3Li2Nb5O15[25]
(A2BC2M5X15)
• half of the C-site is empty: K3NiNb5O15[26] (A2BC□M5X15)
• C-site is empty: Ba3Ta5O14N[27] (A2BM5X15)
• B and C-sites are empty: BaBiNb5O15[28] (A2□□2M5X15)
All conceivable solid solutions can also be obtained between each kind of non-
stoichiometric compositions e.g. K5-xLixTa5-yNbyO15.[29] The possibility to change the
material composition as desired makes it interesting for research. Many different fields
of application have been tested, from ferroelectricity to multiferroics[30] or the
photocatalytic properties[27,31] of these materials.
Theoretical Background 8
2.3. Bismuth vanadate
In nature BiVO4 is available as the mineral pucherite with an orthorhombic crystal
structure.[32] However, BiVO4 prepared in the laboratory does not assume the pucherite
structure but crystallizes either in a scheelite- or a zircon-type structure.[33,34] The
scheelite structure can crystallize in the monoclinic crystal system (I2/b
a = 5.1787(5) Å, b = 5.1042(5) Å, c = 11.6953(11) Å, γ = 90.260(2) °)[35] or the
tetragonal crystal system (I41/a, a = b = 5.147 Å, c = 11.721 Å) while the zircon-type
structure is tetragonal (I41/a; a = b = 7.303 Å and c = 6.584 Å).[36]
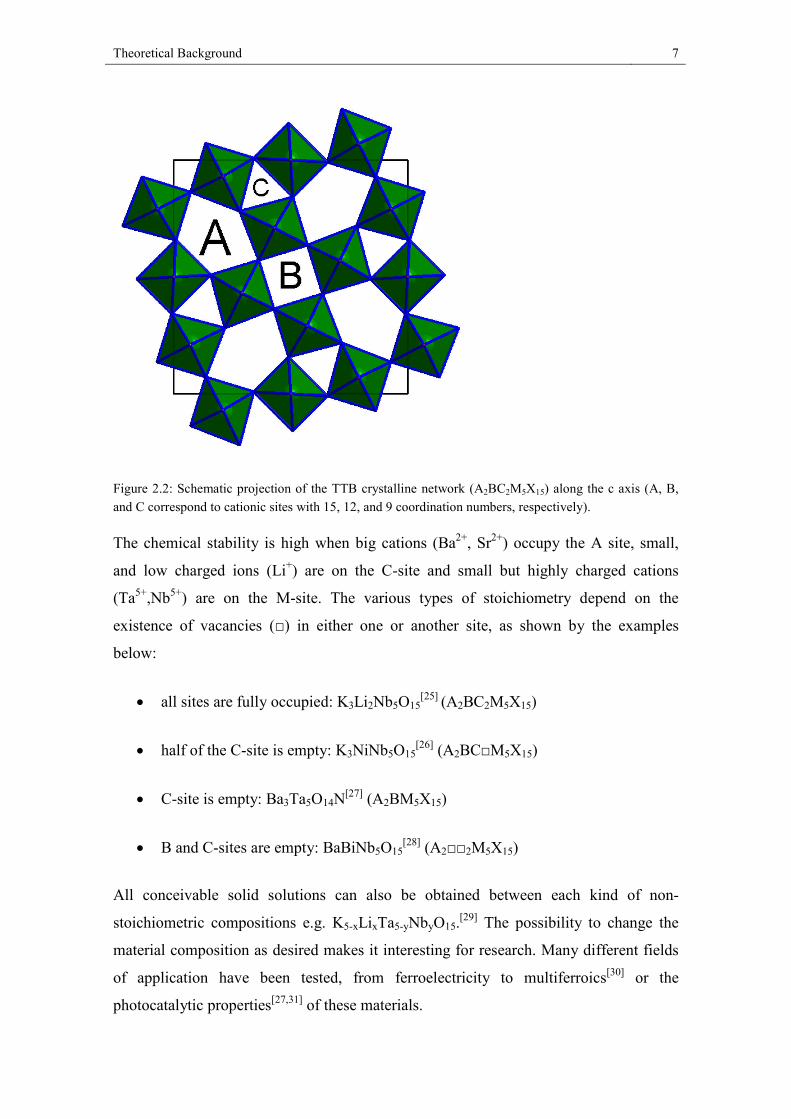
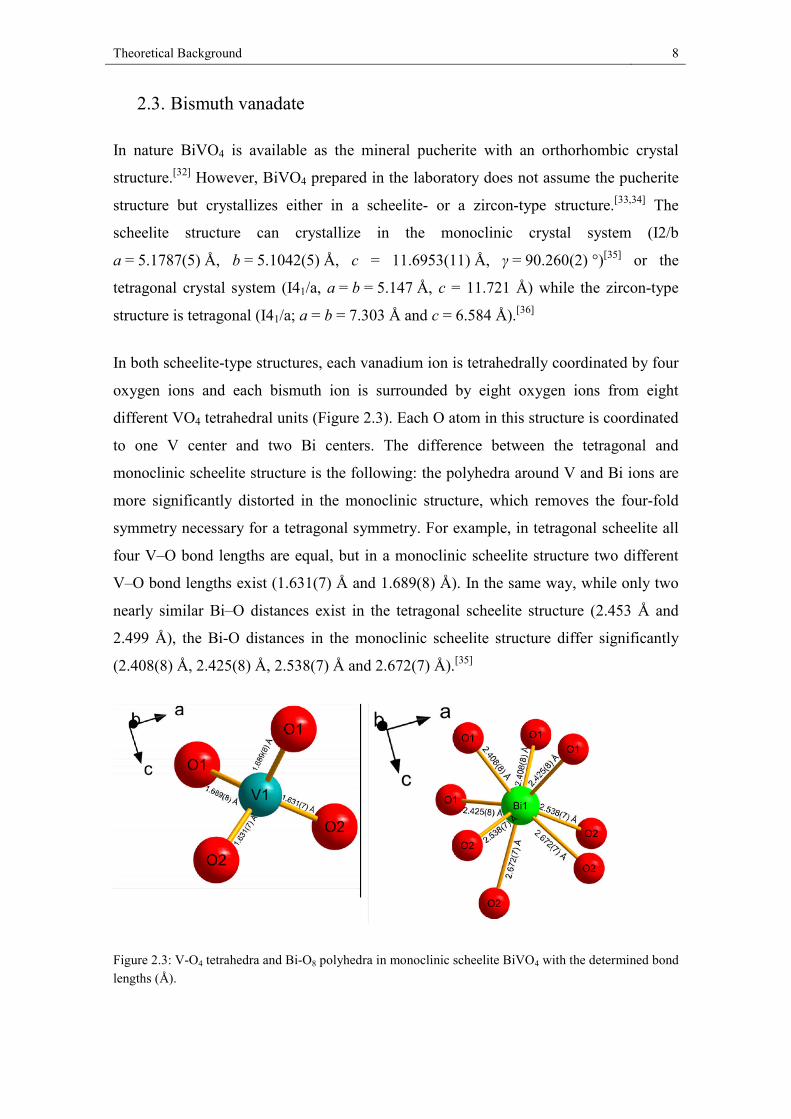
In both scheelite-type structures, each vanadium ion is tetrahedrally coordinated by four
oxygen ions and each bismuth ion is surrounded by eight oxygen ions from eight
different VO4 tetrahedral units (Figure 2.3). Each O atom in this structure is coordinated
to one V center and two Bi centers. The difference between the tetragonal and
monoclinic scheelite structure is the following: the polyhedra around V and Bi ions are
more significantly distorted in the monoclinic structure, which removes the four-fold
symmetry necessary for a tetragonal symmetry. For example, in tetragonal scheelite all
four V–O bond lengths are equal, but in a monoclinic scheelite structure two different
V–O bond lengths exist (1.631(7) Å and 1.689(8) Å). In the same way, while only two
nearly similar Bi–O distances exist in the tetragonal scheelite structure (2.453 Å and
2.499 Å), the Bi-O distances in the monoclinic scheelite structure differ significantly
(2.408(8) Å, 2.425(8) Å, 2.538(7) Å and 2.672(7) Å).[35]
Figure 2.3: V-O4 tetrahedra and Bi-O8 polyhedra in monoclinic scheelite BiVO4 with the determined bond lengths (Å).
Theoretical Background 9
It should be mentioned that the space group I2/b, which was originally reported for the
monoclinic scheelite structure of BiVO4, is a non-standard setting.[37] It can be
transformed to C2/c, which is used in some new studies of BiVO4. After this
transformation, the new cell parameters are a′ = 7.254 Å, b′ = 11.6987 Å, c′ = 5.0999 Å,
and β′ = 134.367°. The choice of the body-centered monoclinic cell, I2/b, has the
advantage of easily showing its structural relationship to the tetragonal scheelite
structure using an identical unit cell choice and crystallographic axes.[38]
In the zircon-type structure, vanadium is still surrounded by four oxygen atoms and
bismuth is coordinated by eight oxygen atoms. However, each bismuth ion is only
surrounded by six VO4 units because two VO4 units provide two oxygen atoms to
bismuth. All oxygen atoms are connected to two bismuth centers and one vanadium
center.
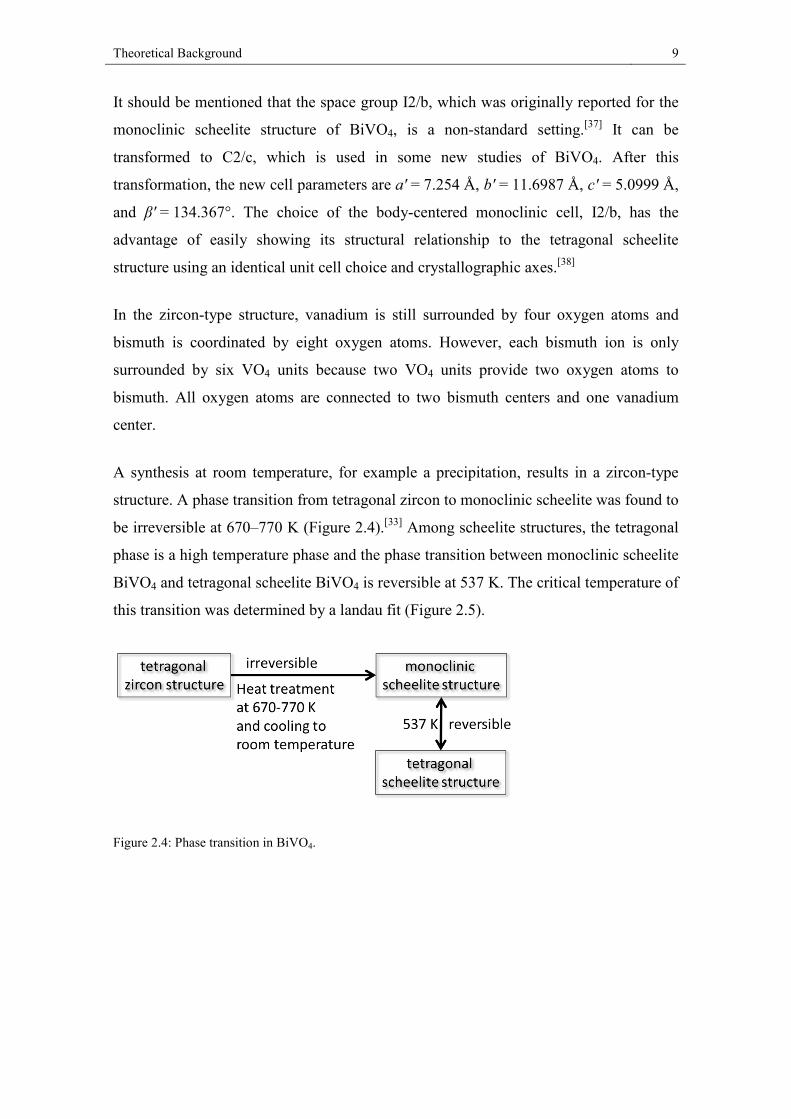
A synthesis at room temperature, for example a precipitation, results in a zircon-type
structure. A phase transition from tetragonal zircon to monoclinic scheelite was found to
be irreversible at 670–770 K (Figure 2.4).[33] Among scheelite structures, the tetragonal
phase is a high temperature phase and the phase transition between monoclinic scheelite
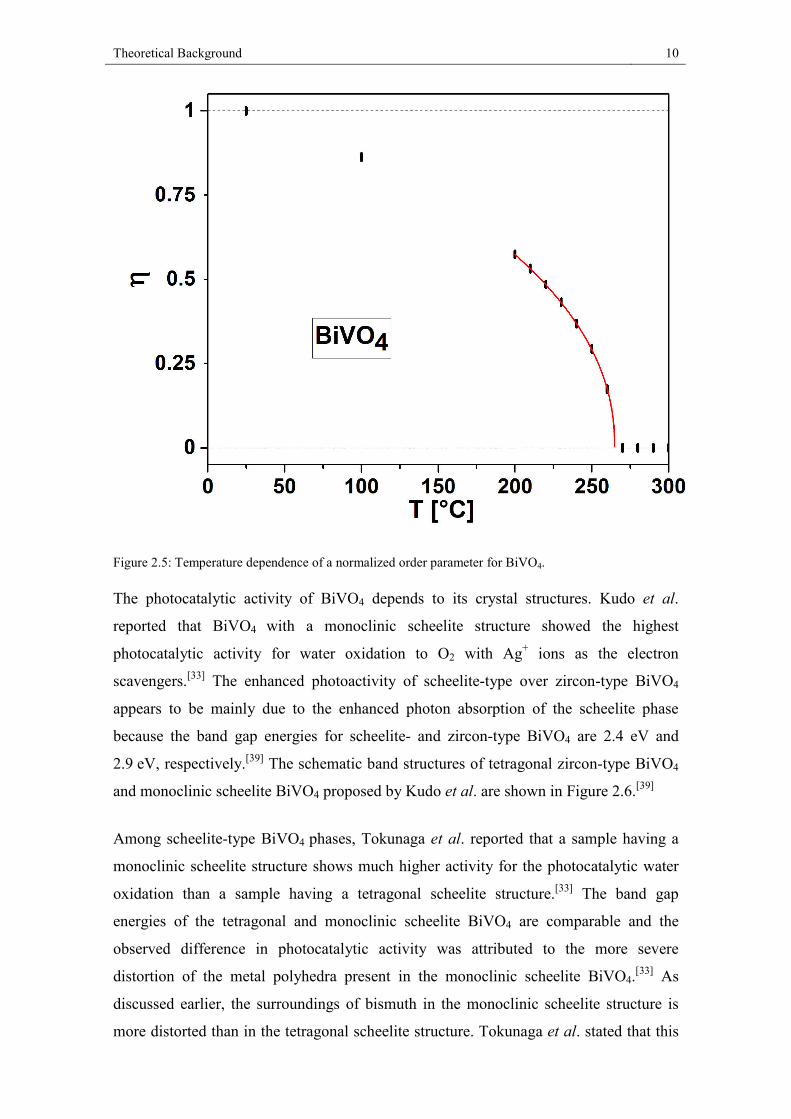
BiVO4 and tetragonal scheelite BiVO4 is reversible at 537 K. The critical temperature of
this transition was determined by a landau fit (Figure 2.5).
Figure 2.4: Phase transition in BiVO4.
Theoretical Background 10
Figure 2.5: Temperature dependence of a normalized order parameter for BiVO4.
The photocatalytic activity of BiVO4 depends to its crystal structures. Kudo et al.
reported that BiVO4 with a monoclinic scheelite structure showed the highest
photocatalytic activity for water oxidation to O2 with Ag+ ions as the electron
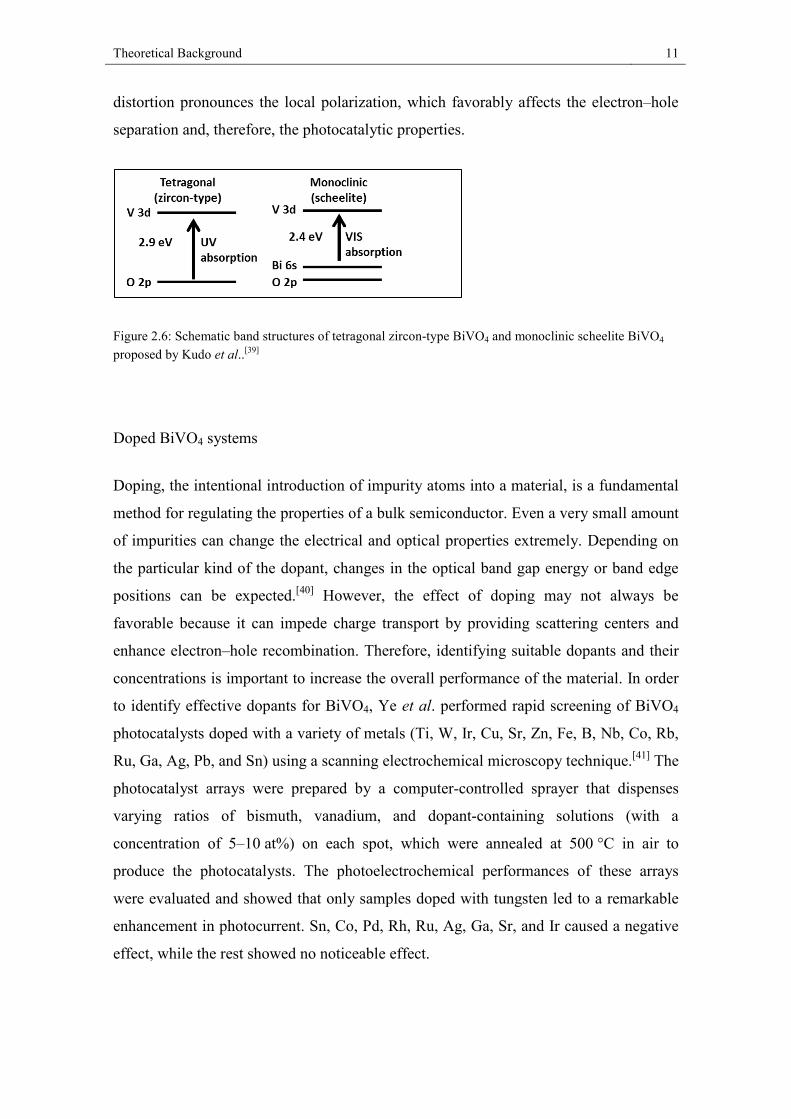
scavengers.[33] The enhanced photoactivity of scheelite-type over zircon-type BiVO4
appears to be mainly due to the enhanced photon absorption of the scheelite phase
because the band gap energies for scheelite- and zircon-type BiVO4 are 2.4 eV and
2.9 eV, respectively.[39] The schematic band structures of tetragonal zircon-type BiVO4
and monoclinic scheelite BiVO4 proposed by Kudo et al. are shown in Figure 2.6.[39]
Among scheelite-type BiVO4 phases, Tokunaga et al. reported that a sample having a
monoclinic scheelite structure shows much higher activity for the photocatalytic water
oxidation than a sample having a tetragonal scheelite structure.[33] The band gap
energies of the tetragonal and monoclinic scheelite BiVO4 are comparable and the
observed difference in photocatalytic activity was attributed to the more severe
distortion of the metal polyhedra present in the monoclinic scheelite BiVO4.[33] As
discussed earlier, the surroundings of bismuth in the monoclinic scheelite structure is
more distorted than in the tetragonal scheelite structure. Tokunaga et al. stated that this
Theoretical Background 11
distortion pronounces the local polarization, which favorably affects the electron–hole
separation and, therefore, the photocatalytic properties.
Figure 2.6: Schematic band structures of tetragonal zircon-type BiVO4 and monoclinic scheelite BiVO4 proposed by Kudo et al..[39]
Doped BiVO4 systems
Doping, the intentional introduction of impurity atoms into a material, is a fundamental
method for regulating the properties of a bulk semiconductor. Even a very small amount
of impurities can change the electrical and optical properties extremely. Depending on
the particular kind of the dopant, changes in the optical band gap energy or band edge
positions can be expected.[40] However, the effect of doping may not always be
favorable because it can impede charge transport by providing scattering centers and
enhance electron–hole recombination. Therefore, identifying suitable dopants and their
concentrations is important to increase the overall performance of the material. In order
to identify effective dopants for BiVO4, Ye et al. performed rapid screening of BiVO4
photocatalysts doped with a variety of metals (Ti, W, Ir, Cu, Sr, Zn, Fe, B, Nb, Co, Rb,
Ru, Ga, Ag, Pb, and Sn) using a scanning electrochemical microscopy technique.[41] The
photocatalyst arrays were prepared by a computer-controlled sprayer that dispenses
varying ratios of bismuth, vanadium, and dopant-containing solutions (with a
concentration of 5–10 at%) on each spot, which were annealed at 500 °C in air to
produce the photocatalysts. The photoelectrochemical performances of these arrays
were evaluated and showed that only samples doped with tungsten led to a remarkable
enhancement in photocurrent. Sn, Co, Pd, Rh, Ru, Ag, Ga, Sr, and Ir caused a negative
effect, while the rest showed no noticeable effect.
Theoretical Background 12
Luo et al. prepared BiVO4 electrodes doped with various metal ions (W, Mo, Ti, La, Fe,
Ta, Zr, Si, Sr, Zn, and Ag) by a modified metal-organic decomposition method and
observed that only Mo6+ or W6+ doping enhanced the photocurrent.[42] Especially,
molybdenum-doped BiVO4 samples prepared from a 3 at% molybdenum solution
showed the best increase in photocurrent. The observed enhancement was attributed to a
possible increase in the hole diffusion length and the enhanced conductivity. A Raman
study validated that Mo6+ ions were located at the V5+ sites. The increase in carrier
density by Mo-doping was confirmed by the slope change in the Mott–Schottky plots
but the change in the flat band potential was insignificant. The performance of
Mo-doped BiVO4 was further improved by surface electrochemical pretreatment, in
order to remove Mo-rich accumulations (for example MoOx) on the surface which could
act as recombination centers.[43]
A non-metal element, P, was also incorporated into BiVO4 by the urea-precipitation
method where PO43- anions were added as a phosphor precursor to substitute a small
fraction of VO43− ions in the precursor solution.[40] Samples of Bi(VO4)1−x(PO4)x with
x = 0.019, 0.006, and 0.002 were produced. The incorporation of phosphor into the host
structure causes shifts of the XRD reflections to smaller 2θ values, indicating an
increase in cell volume. Even a negligible increase in the band gap energy was observed
in the UV-vis absorption spectra. When the BiVO4 and Bi(VO4)1−x(PO4)x powder
samples were prepared as electrodes using electrophoretic deposition,
Bi(VO4)0.998(PO4)0.002 showed the best performance by generating a significantly higher
photocurrent than the pristine BiVO4 electrode. DFT calculations by the same authors
confirmed that the reduced charge transfer resistance could be the result of phosphor
doping which increases the charge carrier density.
In this work a simple route to phase-pure fluorine-modified BiVO4 is reported.
Incorporation of fluorine into BiVO4 generates cation vacancies leading to the
formation of Bi0.94V0.94O3.54F0.46. Investigations of the photoelectrochemical behavior
show that F-incorporation significantly improves the performance of BiVO4
photoanodes for photo(electro-)catalytic water oxidation.
Theoretical Background 13
2.4. The Rietveld analysis
The Rietveld analysis or Rietveld refinement is a mathematical technique, devised by
Hugo Rietveld, for the analysis and evaluation of powder diffraction data.[44–47] Using a
theoretical line profile with the similar structure as the measured sample, which serves
as a reference, a theoretical powder diffraction diagram is created and iteratively
compared to the measured data. The comparison is based on the least square method.
The Rietveld analysis consists of two segments, i) the profile and ii) structure fitting
combined with the background adjustment. Certain functions are available for the
reflection shape fitting, a linear combination of a Gauß and Lorentz function is
commonly used, the Pseudo-Voigt function. The Gauß part is describing the sample
specific influences on the form of the reflection and the Lorentz part the effects
resulting from the measurement setup.[44] Simultaneously, it is possible to determine
changes of the unit cell parameters, such as lattice parameters, atomic position, thermal
displacement or occupation. The Rietveld analysis makes it also possible to determine
the composition of multi-phased materials due to the use of integral intensities.
Important for the profile functions are the integral intensities of the k reflection Ik, the
reflex position 2θk and the full width at half maximum H (FWHM).
The FWHM is described through the parameters U, V, and W as such
𝐻𝐻 = (𝑈𝑈𝑈𝑈𝑈𝑈𝑛𝑛2θ + 𝑉𝑉𝑈𝑈𝑈𝑈𝑛𝑛θ + 𝑊𝑊)12 (1)
During the refinement, the parameters U, V, and W are used to fit the profile. The
quality of a Rietveld refinement is evaluated according to the agreement of the observed
values yi(obs) with the calculated values yi(calc), and is given by residual values
(R-values). The value Rwp (weighted R-value) indicates the mean deviation of the
calculated data to the observed diffraction pattern and is minimized during the
refinement.
𝑅𝑅𝑤𝑤𝑤𝑤 = �∑𝑤𝑤𝑖𝑖(𝑦𝑦𝑖𝑖(𝑜𝑜𝑜𝑜𝑜𝑜)−𝑦𝑦𝑖𝑖(𝑐𝑐𝑐𝑐𝑐𝑐𝑐𝑐))²
∑𝑤𝑤𝑖𝑖(𝑦𝑦𝑖𝑖(𝑜𝑜𝑜𝑜𝑜𝑜))² (2)
wi - weighting factor at point I
yi(obs) - measured intensity at point i
yi(calc) - calculated intensity at point i
Theoretical Background 14
Ideally this value is zero, which can never be achieved due to the signal to noise ratio,
thus the Rexp value is calculated, indicating the best possible value and the accuracy of
the measurement.
𝑅𝑅𝑒𝑒𝑒𝑒𝑤𝑤 = �𝑁𝑁−𝑃𝑃+𝐶𝐶
∑𝑤𝑤𝑖𝑖(𝑦𝑦𝑖𝑖(𝑜𝑜𝑜𝑜𝑜𝑜))² (3)
N - Number of measured points
P - Number of parameters
C - Number of parameter linkings
In contrast, the value RBragg is calculated from the intensities of the n reflections that are
present in the pattern.
𝑅𝑅𝐵𝐵𝐵𝐵𝑐𝑐𝐵𝐵𝐵𝐵 = �∑ |𝐼𝐼𝑛𝑛(𝑜𝑜𝑜𝑜𝑜𝑜)−𝐼𝐼𝑛𝑛(𝑐𝑐𝑐𝑐𝑐𝑐𝑐𝑐)|
∑ 𝐼𝐼𝑛𝑛(𝑜𝑜𝑜𝑜𝑜𝑜) (4)
In(obs) - measured integral intensity of the n reflection
In(calc) - calculated integral intensity of the n reflection
The goodness of fit S is formed by the ratio of the two former R-values Rwp and Rexp. In
the ideal case S should approach a value of 1.
𝑆𝑆 = 𝑅𝑅𝑤𝑤𝑤𝑤𝑅𝑅𝑒𝑒𝑒𝑒𝑤𝑤
(5)
In this work the program package Fullprof Suite [46] was used for the Rietveld analysis.

Theoretical Background 15
Methodology 16
3. Methodology
3.1. Preparation
The precursors used for this work were produced in two different ways, by a modified
polymerizable complex method (Pechini route) and a standard wet-chemical
precipitation.
3.1.1. Pechini
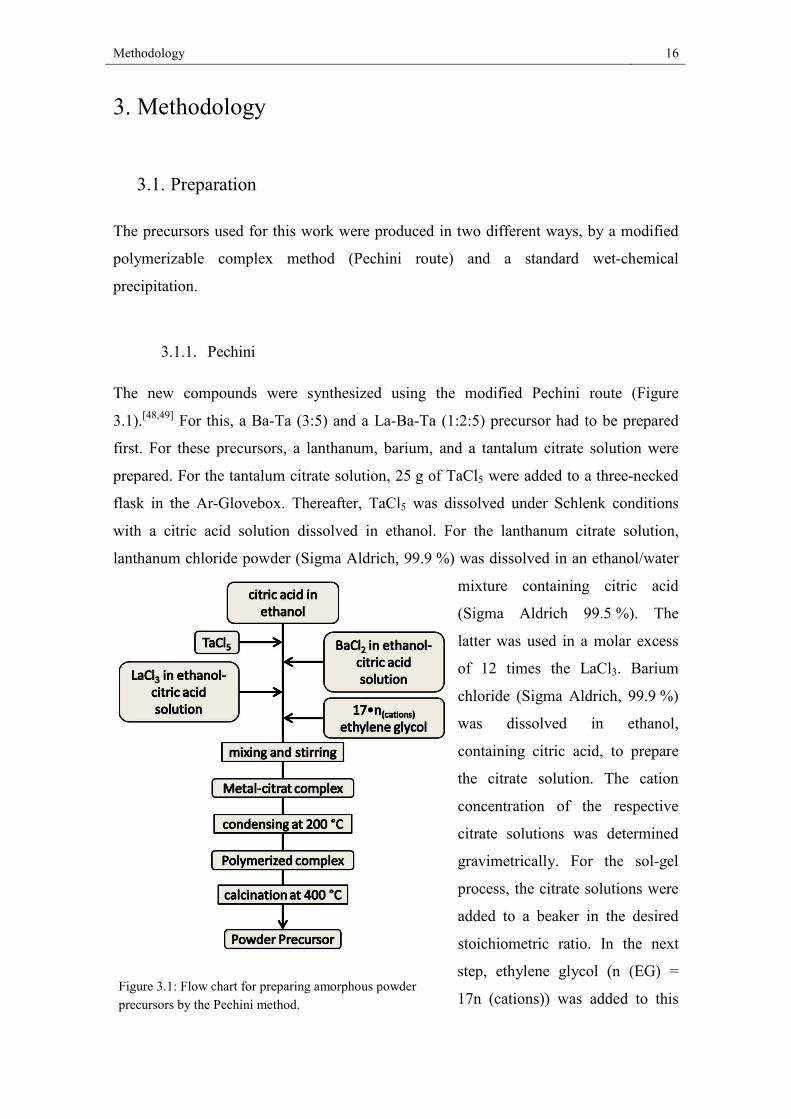
The new compounds were synthesized using the modified Pechini route (Figure
3.1).[48,49] For this, a Ba-Ta (3:5) and a La-Ba-Ta (1:2:5) precursor had to be prepared
first. For these precursors, a lanthanum, barium, and a tantalum citrate solution were
prepared. For the tantalum citrate solution, 25 g of TaCl5 were added to a three-necked
flask in the Ar-Glovebox. Thereafter, TaCl5 was dissolved under Schlenk conditions
with a citric acid solution dissolved in ethanol. For the lanthanum citrate solution,
lanthanum chloride powder (Sigma Aldrich, 99.9 %) was dissolved in an ethanol/water
mixture containing citric acid
(Sigma Aldrich 99.5 %). The
latter was used in a molar excess
of 12 times the LaCl3. Barium
chloride (Sigma Aldrich, 99.9 %)
was dissolved in ethanol,
containing citric acid, to prepare
the citrate solution. The cation
concentration of the respective
citrate solutions was determined
gravimetrically. For the sol-gel
process, the citrate solutions were
added to a beaker in the desired
stoichiometric ratio. In the next
step, ethylene glycol (n (EG) =
17n (cations)) was added to this Figure 3.1: Flow chart for preparing amorphous powder precursors by the Pechini method.
Methodology 17
solution. The mixture was then gradually heated to 200 °C under ambient conditions
until a gel was formed. In the last step, the resin-like mass was transferred from the
beaker to a corundum crucible and placed in a chamber furnace for 16 hours at a
temperature of 400 °C. The resulting precursor was colorless and amorphous.
For the nitration of the precursor, the ammonolysis step was carried out with an
ammonia-oxygen mixture. Numerous tests using different variations of temperature,
holding time, gas mixing ratio, and calcination temperature were performed. The
temperature was varied between 700 °C and 900 °C. Additionally, holding times
between 1 h and 48 h as well as heating rates between 200 K/h and 600 K/h were
carried out. The ammonia and oxygen gas volume flows (5 L/h – 15 L/h NH3, 0.01 L/h
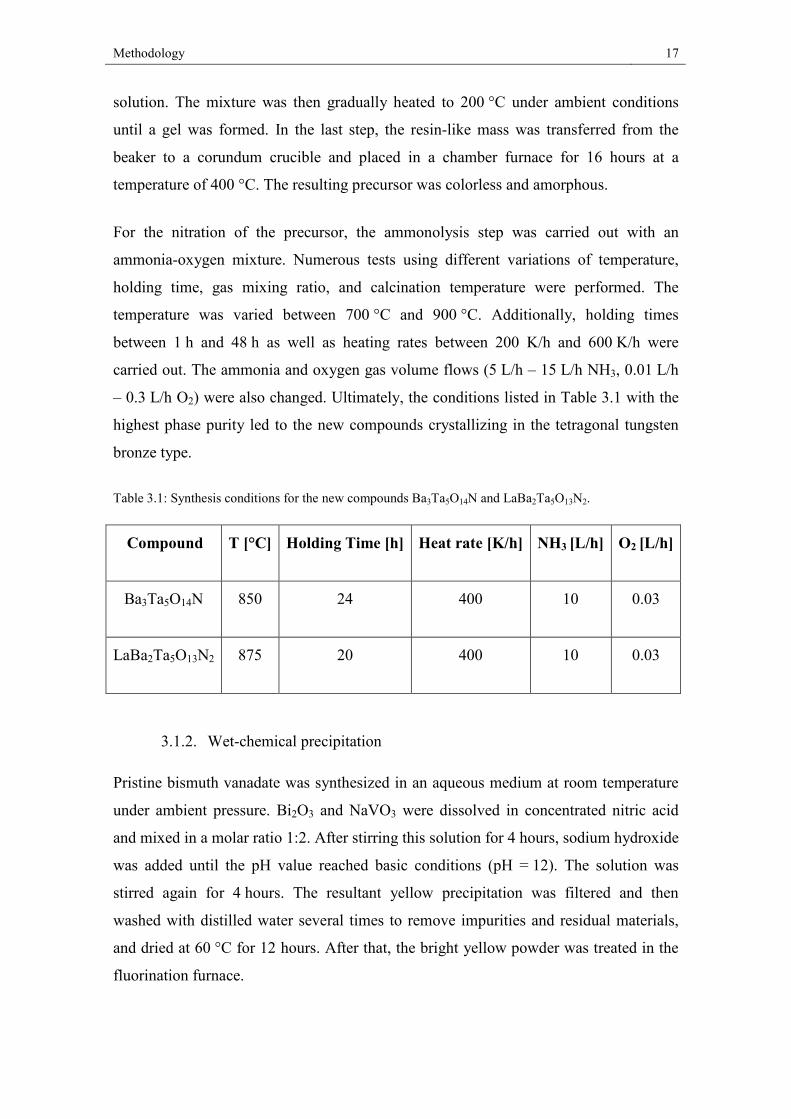
– 0.3 L/h O2) were also changed. Ultimately, the conditions listed in Table 3.1 with the
highest phase purity led to the new compounds crystallizing in the tetragonal tungsten
bronze type.
Table 3.1: Synthesis conditions for the new compounds Ba3Ta5O14N and LaBa2Ta5O13N2.
Compound T [°C] Holding Time [h] Heat rate [K/h] NH3 [L/h] O2 [L/h]
Ba3Ta5O14N 850 24 400 10 0.03
LaBa2Ta5O13N2 875 20 400 10 0.03
3.1.2. Wet-chemical precipitation
Pristine bismuth vanadate was synthesized in an aqueous medium at room temperature
under ambient pressure. Bi2O3 and NaVO3 were dissolved in concentrated nitric acid
and mixed in a molar ratio 1:2. After stirring this solution for 4 hours, sodium hydroxide
was added until the pH value reached basic conditions (pH = 12). The solution was
stirred again for 4 hours. The resultant yellow precipitation was filtered and then
washed with distilled water several times to remove impurities and residual materials,
and dried at 60 °C for 12 hours. After that, the bright yellow powder was treated in the
fluorination furnace.
Methodology 18
3.2. Furnaces
Two different types of ovens were used for the syntheses of the samples, for the oxide
nitrides an ammonolysis furnace with direct gasification was selected and for the O/F
substitution in the BiVO4-samples a fluorination apparatus with an inner corundum tube
was used.
The ammonolysis furnace
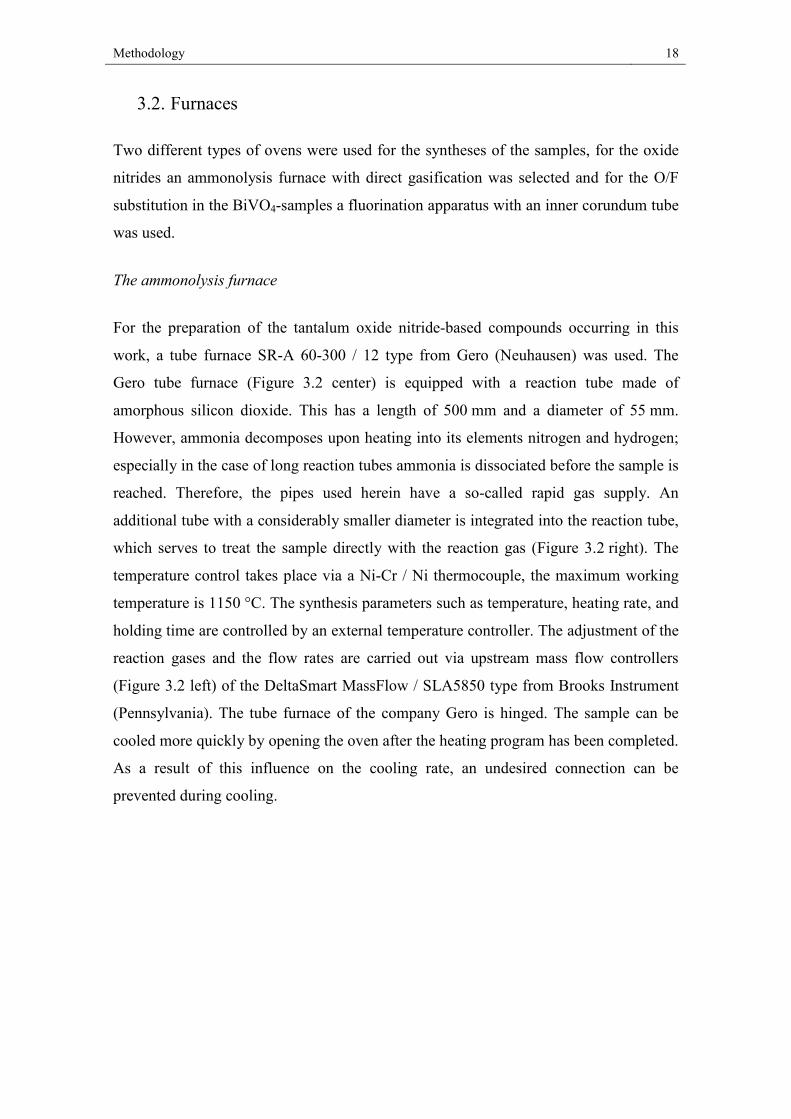
For the preparation of the tantalum oxide nitride-based compounds occurring in this
work, a tube furnace SR-A 60-300 / 12 type from Gero (Neuhausen) was used. The
Gero tube furnace (Figure 3.2 center) is equipped with a reaction tube made of
amorphous silicon dioxide. This has a length of 500 mm and a diameter of 55 mm.
However, ammonia decomposes upon heating into its elements nitrogen and hydrogen;
especially in the case of long reaction tubes ammonia is dissociated before the sample is
reached. Therefore, the pipes used herein have a so-called rapid gas supply. An
additional tube with a considerably smaller diameter is integrated into the reaction tube,
which serves to treat the sample directly with the reaction gas (Figure 3.2 right). The
temperature control takes place via a Ni-Cr / Ni thermocouple, the maximum working
temperature is 1150 °C. The synthesis parameters such as temperature, heating rate, and
holding time are controlled by an external temperature controller. The adjustment of the
reaction gases and the flow rates are carried out via upstream mass flow controllers
(Figure 3.2 left) of the DeltaSmart MassFlow / SLA5850 type from Brooks Instrument
(Pennsylvania). The tube furnace of the company Gero is hinged. The sample can be
cooled more quickly by opening the oven after the heating program has been completed.
As a result of this influence on the cooling rate, an undesired connection can be
prevented during cooling.
Methodology 19
Figure 3.2: left: gas flow controller for NH3, O2 and N2; mid: tube furnace from Gero Typ SR-A 60-300/12; right: reaction space under the rapid gas supply.
Methodology 20
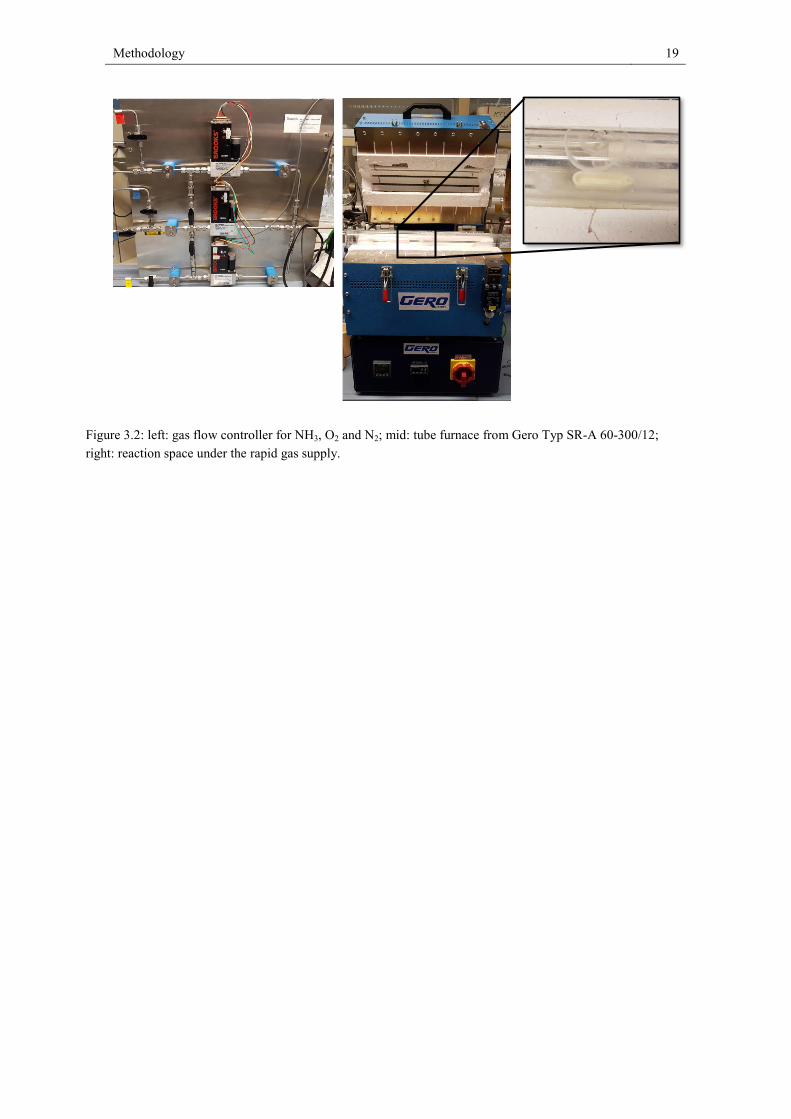
The fluorination furnace
Fluorine-containing samples were prepared by a solid-vapor reaction using an indirect
gas flow apparatus (see Figure 3.3). Loose powder of the sample was loaded in a small
corundum boat, which in turn was placed inside a larger corundum boat containing
varying amounts of polyvinylidene fluoride (PVDF). This arrangement advantageously
prevents contact between the reagents in either solid or liquid form. It is very important
to prevent the photocatalysts from any carbon pollution in order to achieve good results;
the final product is without any of the several contaminations. The nested boats were
then placed inside a corundum tube with one closed end and then placed in a horizontal
tube furnace with a low nitrogen gas flow of ~5 L/h. With this configuration an
overpressure could be avoided. The temperature was set to 380 °C for 24 hours.
Thermogravimetric and mass spectroscopy studies revealed that the PVDF
decomposition only emits HF under inert gas.
Figure 3.3: Sketch of fluorination apparatus. The inner corundum boat contains the sample to be fluori-nated and the outer boat is filled with PVDF.
Methodology 21
3.3. X-ray diffraction
In solid state chemistry diffraction methods are among the most important analytical
characterization techniques.[50,51] They are employed for structure determination in
crystalline materials and can be used to identify structural properties such as phase
composition, lattice parameters, grain size, or preferred orientation. The technique is
based on the diffraction of X-rays at the atoms of the crystal. The crystal lattice consists
of parallel planes with distance d that are identified by Miller indices (h, k, l). Because
of the interatomic distances in the order of magnitude of ∼10-10 m, especially X-rays are
suitable for scattering experiments. The fundamental principle is based on the
interaction between X-ray photons and the electron shell, respectively. The theoretical
principle of the diffraction is described by Bragg’s law (Equation 6)[52]:
𝑛𝑛𝑛𝑛 = 2𝑑𝑑ℎ𝑘𝑘𝑐𝑐 ∗ sinθ (6)
λ - wavelength of incident beam
d - distance between the lattice planes (hkl)
θ - diffraction angle
n - describes the order of diffraction and is always an integer
The equation describes the interaction of the incident beam (i.e. 1.54 Å for Cu Kα1) with
the sample and defines the general condition for constructive interference. It is assumed
that the crystal consists of layers, on which the radiation is reflected, and constructive
interference occurs when the path length difference is an integer number of the
wavelength. The diffracted waves of different lattice planes cause a certain diffraction
pattern, which contains information about the atomic arrangement in the crystalline
material.
As mentioned above, X-rays are scattered at the electrons of the shell, the scattering
power of an atom is described by the atomic form factor fi, which depends linearly on
the number of electrons in the atom. Hence, it is easy to distinguish between elements
with a large difference in electron number. Furthermore, the atomic form factor is a
Methodology 22
function of the wavelength and the diffraction angle, resulting in decreasing intensities
with increasing angles. A disadvantage in X-ray diffraction is that the distinction
between elements with similar atomic number, such as nitrogen and oxygen is not
possible, neutron scattering is used in these cases.
The X-ray powder diffraction experiments were conducted with the X’Pert Pro system
from PANalytical (PANalytical B.V, Almelo, Netherlands). It consists of a θ/θ setup in
Bragg-Brentano geometry.[52,53] The X-ray source consists of copper. The
Bremsstrahlung and the radiation below the Kα wavelength are filtered through a
Ni-filter. The setup uses no monochromatic light, which results in the presence of
Cu Kα1 and Cu Kα2 radiation (with a ratio of 2 to 1). An automatic divergence aperture
is used to keep the irradiated sample area constant with varying angles. This must be
taken to account for the following Rietveld analysis. As a detector, a
Si(Li)-semiconducting detector was used. The supplied software X`Pert Highscore Plus
v.2.2.1 was used for a first quick evaluation of the measurement through the Inorganic
Structure Database (ICSD, FIZ Karlsruhe, Germany and US Department of Commerce,
USA).
Methodology 23
3.4. Hot gas extraction
The elemental analysis for the determination of the nitrogen and oxygen content of a
substance is carried out by hot gas extraction (LECO TC-300/EF-300). For this purpose
3 to 4 mg of the sample are heated in the helium stream at 2700 °C for 50 seconds. Thus
elementary nitrogen and oxygen are released from the sample. The oxygen from the
sample reacts with the graphite to form carbon monoxide, which is then catalytically
converted to carbon dioxide by copper oxide. The amount of CO2 is detected by
absorption spectroscopy in an infrared measuring cell, whereby ultimately the oxygen
content can be determined.[54] The nitrogen content is determined in a thermal
conductivity measuring cell. The helium–nitrogen–gas mixture has a lower thermal
conductivity than pure helium, an integrated “Wheatstone bridge” measures the
electrical resistance in the cell, and the change of the electrical resistance is proportional
to the nitrogen content.[54] For calibration, ZrO2, and steel (LECO calibration sample, N:
5000 ppm) were used as standard materials. The accuracy is ~ 2 % of the N/O content.
Methodology 24
3.5. UV-Vis spectroscopy
Diffuse reflectance spectra were collected with a Jasco V670 spectrometer. Absorbance
spectra in the wavelength range from 200 nm to 1000 nm were calculated from the
measured diffuse reflectance with the Kubelka-Munk function (Equation 7).
(𝑅𝑅) = (1−𝑅𝑅)²2𝑅𝑅
= 𝜀𝜀c 1𝑜𝑜 (7)
where R is the reflectance, ε is the absorption coefficient, c the concentration of
absorbing species, and s the scattering coefficient. The optical band gap was
determined using the modified Tauc equation, [𝐹𝐹(𝑅𝑅)ℎ𝜈𝜈]1𝑛𝑛 = 𝐴𝐴�ℎ𝜈𝜈 − 𝐸𝐸𝐵𝐵�,with F(R) the
Kubelka-Munk function, hν the photon energy, Eg the optical band gap, and A a
proportionality constant. The value of the exponent n denotes the nature of the transition
(2= indirect; ½= direct).
With the phenomenological Kubelka-Munk theory,[55] it is possible to establish a
relationship between scattered and absorbed light. However, it applies only to low-
absorbing and optically infinitely thick samples. The non-absorbing material was
magnesium oxide (ABCR, 99.95%) added to all samples in a 1: 1 ratio.
3.6. Gas pycnometry
Experimental density values of the samples were measured using a Quantachrome
helium multipycnometer, where the pressure change of helium in a calibrated volume is
measured to calculate the sample volume. Helium penetrates into smallest pores and
crevices and permits to approach the real volume of the sample.
Methodology 25
3.7. Photocatalysis
Photocatalytic hydrogen generation
Photocatalytic hydrogen generation was measured in the working group of Michael
Wark using a home-made air-free closed gas system and a double-walled inner
irradiation-type quartz reactor. As a light source, a 700 W Hg mid-pressure immersion
lamp (Peschl UV-Consulting, set to a power of 500 W) was used for irradiation and
cooled with a double-walled quartz mantle using a thermostat (LAUDA). Gas evolution
was detected online using a multi-channel analyzer (Emerson) equipped with a detector
for the determination of the concentration of hydrogen (thermal conductivity detector),
oxygen (paramagnetism), and carbon dioxide (IR). Argon was used as carrier gas, the
continuous gas flow was controlled by a Brockhorst mass flow controller. The gas flow
was set to 50 NmL/min (normal flow throughput: gas flow at ambient temperature and
pressure per minute).
All reactions were performed at 13 °C. 300 mg of photocatalyst is suspended in 550 mL
water and 50 mL methanol (aqueous methanol photo reforming). For a homogeneous
suspension a subsequent pre-treatment in the ultrasonication bath for 10 minutes at
30 °C was performed. Before any photocatalytic reaction was initiated, the whole
system including the photocatalyst was flushed with argon at 100 NmL/min for 30
minutes to remove any trace of air. In previous measurements Rh was obtained as the
most effective co-catalyst for barium tantalates with an optimum loading of only
0.0125 wt.-%. Rh[56] nanoparticles were deposited onto the photocatalyst materials via
reductive photo deposition with a specific amount of Na3RhCl6 (99.999%, Aldrich)
precursor solution using the setup described below. For measurements under visible
light an aqueous 2 M NaNO2 solution was used as filter.
Photocatalytic oxygen generation
Electrochemical measurements were carried out in the working group of Anna Fischer.
A home-built 3-electrode-setup consisting of the working electrode (Photoanode), a Pt-
wire counter electrode, and a reversible hydrogen reference electrode (RHE) provided
by Gaskatel were used for the electrochemical measurement. The potential of the
working electrode with respect to the reference electrode was controlled by a
potentiostat (Biologic SP‑150). The Photoanode was illuminated by a 150 W Xe-lamp
(Lumatec Superlite equipped with UV cut-off filter, illuminating spectral range = 400-
Methodology 26
700 nm), mounted at a reproducible and constant distant of 5 cm from the photoanode
surface. The light intensity at the electrode surface was adjusted to 100 mW/cm² using a
Si-diode light meter (Extech). J-V-measurements were conducted in 0.1 M potassium
phosphate buffer at pH 7.3 using a scan rate of 20 mV/s.
Electrode preparation
Electrode preparations were accomplished in the working group of Anna Fischer. A
photo-assisted electrodeposition method based on the procedure reported by Durrant et
al. was used to deposit a cobalt phosphate-based water oxidation catalyst (CoPi) onto
the working-electrode surface.[57] The working electrode was immersed in 0.1 M
potassium phosphate buffer at pH 7.3 containing 0.5 mM cobalt nitrate and a constant
potential of 1.2 V vs. RHE was applied under illumination. To ensure a comparable
amount of deposited CoPi for all samples, the deposition was stopped after a charge of
130 mC was flown.

Methodology 27
Bibliography 28
Bibliography
[1] J. Rogelj, W. Hare, J. Lowe, D. P. van Vuuren, K. Riahi, B. Matthews, T. Hanaoka, K. Jiang, M. Meinshausen, Nature Climate change 2011, 1, 413.
[2] State of the Climate: Global Analysis for Annual 2016, NOAA National Centers for Environmental Information 2017, http://www.ncdc.noaa.gov/sotc/global/201613.
[3] N. Armaroli, V. Balzani, Angew. Chem. Int. Ed. Engl. 2007, 46, 52. [4] A. Fujishima, K. Honda, Nature 1972, 238, 37. [5] O. Khaselev, Science 1998, 280, 425. [6] J. Y. Kim, G. Magesh, D. H. Youn, J.-W. Jang, J. Kubota, K. Domen, J. S. Lee,
Scientific reports 2013, 3, 2681. [7] M. Higashi, K. Domen, R. Abe, J. Am. Chem. Soc. 2013, 135, 10238. [8] F. F. Abdi, N. Firet, R. van de Krol, ChemCatChem 2013, 5, 490. [9] S. P. Berglund, A. J. E. Rettie, S. Hoang, C. B. Mullins, Phys. Chem. Chem. Phys.
2012, 14, 7065. [10] H. W. Jeong, T. H. Jeon, J. S. Jang, W. Choi, H. Park, J. Phys. Chem. C 2013, 117,
9104. [11] Y. Park, K. J. McDonald, K.-S. Choi, Chem. Soc. Rev. 2013, 42, 2321. [12] K. P. S. Parmar, H. J. Kang, A. Bist, P. Dua, J. S. Jang, J. S. Lee, ChemSusChem
2012, 5, 1926. [13] S. K. Pilli, T. E. Furtak, L. D. Brown, T. G. Deutsch, J. A. Turner, A. M. Herring,
Energy Environ. Sci. 2011, 4, 5028. [14] W. Yao, H. Iwai, J. Ye, Dalton Trans. 2008. [15] Y. Park, K. J. McDonald, K.-S. Choi, Chem. Soc. Rev. 2013, 42, 2321. [16] H. Jiang, H. Dai, J. Deng, Y. Liu, L. Zhang, K. Ji, Solid State Sci. 2013, 17, 21. [17] J. A. van Vechten, J. C. Phillips, Phys. Rev. B 1970, 2, 2160. [18] M. Jansen, H. P. Letschert, Nature 2000, 404, 980. [19] B. Modak, S. K. Ghosh, J. Phys. Chem. C 2016, 120, 6920. [20] A. Magneli, Arkiv for Kemi 1949, 1, 213. [21] M. H. Francombe, B. Lewis, Acta Cryst. 1958, 11, 696. [22] J. E. Geusic, H. J. Levinstein, J. J. Rubin, S. Singh, L. G. van Uitert, Appl. Phys.
Lett. 1967, 11, 269. [23] C. R. Feger, R. P. Ziebarth, Chem. Mater. 1995, 7, 373. [24] A. Simon, J. Ravez, Comptes Rendus Chimie 2006, 9, 1268. [25] A. J. Paula, R. Parra, M. A. Zaghete, J. A. Varela, Solid State Com. 2009, 149,
1587. [26] A. Perron-Simon, G. Demazeau, J. Ravez, P. Hagenmuller, Sciences Chimiques
1975. [27] B. Anke, T. Bredow, J. Soldat, M. Wark, M. Lerch, J. Solid State Chem. 2016, 233,
282. [28] H. Ma, K. Lin, L. Fan, Y. Rong, J. Chen, J. Deng, L. Liu, S. Kawaguchi, K. Kato,
X. Xing, RSC Adv 2015, 5, 71890. [29] V. S. Vikhnin, S. E. Kapphahn, V. V. Lemanov, Ferroelectrics Lett. 2006, 28, 123. [30] T. Hajlaoui, M. Josse, C. Harnagea, A. Pignolet, Mat. Res. Bull. 2017, 86, 30. [31] B. Anke, T. Bredow, M. Pilarski, M. Wark, M. Lerch, J. Solid State Chem. 2017,
246, 75. [32] J. D. Bierlein, A. W. Sleight, Solid State Com. 1975, 16, 69. [33] S. Tokunaga, H. Kato, A. Kudo, Chem. Mater. 2001, 13, 4624. [34] Y. Park, K. J. McDonald, K.-S. Choi, Chem. Soc. Rev. 2013, 42, 2321.
Bibliography 29
[35] B. Anke, M. Rohloff, M. G. Willinger, W. Hetaba, A. Fischer, M. Lerch, Solid State Sci. 2017, 63, 1.
[36] M. Long, W. Cai, J. Cai, B. Zhou, X. Chai, Y. Wu, J. Phys. Chem. B 2006, 110, 20211.
[37] A. W. Sleight, H.-y. Chen, A. Ferretti, D. E. Cox, Mat. Res. Bull. 1979, 14, 1571. [38] W. J. Jo, H. J. Kang, K.-J. Kong, Y. S. Lee, H. Park, Y. Lee, T. Buonassisi, K. K.
Gleason, J. S. Lee, Proc. Natl. Acad. Sci. U.S.A. 2015, 112, 13774. [39] A. Kudo, K. Omori, H. Kato, J. Am. Chem. Soc. 1999, 121, 11459. [40] W. J. Jo, J.-W. Jang, K.-J. Kong, H. J. Kang, J. Y. Kim, H. Jun, K. P. S. Parmar, J.
S. Lee, Angew. Chem. Int. Ed. Engl. 2012, 51, 3147. [41] H. Ye, J. Lee, J. S. Jang, A. J. Bard, J. Phys. Chem. C 2010, 114, 13322. [42] W. Luo, J. Wang, X. Zhao, Z. Zhao, Z. Li, Z. Zou, Phys. Chem. Chem. Phys. 2013,
15, 1006. [43] W. Luo, Z. Li, T. Yu, Z. Zou, J. Phys. Chem. C 2012, 116, 5076. [44] R. Allmann, Röntgen-Pulverdiffraktometrie: Rechnergestützte Auswertung, Pha-
senanalyse und Strukturbestimmung, Springer Berlin Heidelberg, Berlin, Heidel-berg 2003.
[45] E. Prince, H. Fuess, T. Hahn, H. Wondratschek, U. Müller, U. Shmueli, A. Authier, V. Kopský, D. B. Litvin, M. G. Rossmann, E. Arnold, S. Hall, B. McMahon, Inter-national Tables for Crystallography, International Union of Crystallography, Ches-ter, England 2006.
[46] J. Rodríguez-Carvajal, Phys. B: Cond. Mat. 1993, 192, 55. [47] G. Will, Powder diffraction: The Rietveld method and the two-stage method to de-
termine and refine crystal structures from powder diffraction data, Springer, Ber-lin, New York 2006.
[48] A. M. Huízar-Félix, T. Hernández, S. de La Parra, J. Ibarra, B. Kharisov, Powder Tec. 2012, 229, 290.
[49] L. Smart, E. Moore, Einführung in die Festkörperchemie, Vieweg, Braunschweig, Wiesbaden 1997.
[50] W. Massa, Kristallstrukturbestimmung, B.G. Teubner Verlag / GWV Fachverlage GmbH, Wiesbaden, Wiesbaden 2007.
[51] P. Paufler, Cryst. Res. Technol. 1994, 29, 808. [52] W. H. Bragg, W. L. Bragg, Proc. Camb. Phil. Soc. 1913, 88, 428. [53] J. C. M. Brentano, Proc. Phys. Soc. 1937, 49, 61. [54] Instruction Manual, TC-300 1998. [55] P. Kubelka, F. Munk, Z. Tech. Phys 1931, 12, 593. [56] R. Marschall, J. Soldat, G. W. Busser, M. Wark, Photochem. Photobiol. Sci. 2013,
12, 671. [57] Y. Ma, F. Le Formal, A. Kafizas, S. R. Pendlebury, J. R. Durrant, J. Mater. Chem.
A Mater. Energy Sustain. 2015, 3, 20649.

Bibliography 30

Results and Discussion 31
Part II.
II. Results and Discussion
Publication 1 32
4. Publication 1
Synthesis, crystal structure, and photocatalytical properties of Ba3Ta5O14N B. Anke, T. Bredow, J. Soldat, M. Wark, M. Lerch published Journal of Solid State Chemistry 233 (2016) 282–288 doi: 10.1016/j.jssc.2015.10.042 https://doi.org/10.1016/j.jssc.2015.10.042 Contribution to publication: B. Anke: Sample preparation, chemical analysis and crystal structure analysis, UV-Vis interpretation, and writing. T. Bredow: Quantum-chemical calculations. J. Soldat: Measurements (photocatalysis), evaluation. M. Wark: General discussion, proofreading. M. Lerch: General advice and helpful comments, proofreading
Publication 1 33
Authors: B. Anke,1 T. Bredow,2 J. Soldat,3,4 M. Wark,4 M. Lerch*1 1Institut für Chemie, Technische Universität Berlin, Straße des 17. Juni 135, 10623 Berlin 2 Mulliken Center for Theoretical Chemistry, Institut für Physikalische und Theoretische Chemie, Universität Bonn, Beringstr. 4, 53115 Bonn 3 Lehrstuhl für Technische Chemie, Ruhr-Universität Bochum, Universitätsstr. 150, 44801 Bochum 4 Institut für Chemie, Carl von Ossietzky Universität Oldenburg, Carl-von-Ossietzky-Str. 9-11, 26129 Oldenburg *corresponding author Keywords: barium tantalum oxide, oxide nitrides, synthesis, crystal structure, quan-tum-chemical calculations, photocatalysis
Publication 1 34
4.1. Abstract
Light yellow Ba3TaV5O14N was successfully synthesized as phase-pure material
crystallizing isostructurally to well-known mixed-valence Ba3TaV4TaIVO15. The
electronic structure of Ba3Ta5O14N was studied theoretically with a hybrid Hartree–
Fock-DFT method. The most stable structure was obtained when nitrogen atoms were
placed at 4h sites having fourfold coordination. By incorporating nitrogen, the band gap
decreases from ∼3.8 eV commonly known for barium tantalum(V) oxides to 2.8 eV for
the oxide nitride, giving rise to an absorption band well in the visible-light region.
Ba3Ta5O14N was also tested for photocatalytic hydrogen formation.
4.2. Introduction
Taking a look on ternary barium tantalum oxides reported in literature, a variety of
phases with different compositions is reported: BaTa2O6,[1] Ba2Ta5O32,[2]
Ba5Ta4O15,[3] and Ba4Ta2O9[4] have been already described. It is worth mentioning that
also two mixed-valent compounds, Ba1.88Ta15O32[5] and Ba3Ta5O15,[6] are known.
Interestingly, remarkable photocatalytic activity (water splitting, H2-evolution) is
observed for Ba3TaV4TaIVO15-containing composites.[7] Ba3Ta5O15 exhibits the well-
known tetragonal tungsten bronze structure (space group P4/mbm[6]) and can be
described as vertex-sharing framework of TaO6-octahedra forming huge sites where
larger metal cations are located.
Photocatalytic activity under visible light (420 nm < λ < 800 nm) requires optical band
gaps of Eg < 2.9 eV. Barium tantalum oxides typically have values above 3.5 eV. A
common strategy to narrow the optical band gap in oxides is the partial substitution of
oxygen by aliovalent anions. In 2001, Asahi et al. predicted a reduction of the band gap
of titania maintaining the conduction band (CB) minimum level and shifting the valence
band (VB) maximum to a position with more negative potential.[8] Their studies
initiated a lot of efforts in investigating anion substitution in photocatalysts using a
number of ‘dopant elements’ such as B[9–11], C[12–16], F[17–21], N[22–26], P[12], or
S[27–30] to narrow optical band gaps to the visible-light region for various
semiconductor materials. Among these, nitrogen has been reported to be the most
Publication 1 35
effective dopant so far. Also several visible light-driven semiconductors containing
photocatalysts including tantalum oxide nitrides are known to perform photocatalytic
water splitting.[31–33] In the present contribution, we report on synthesis, crystal
structure incl. N/O distribution, optical properties, and photocatalytic activity of the new
compound Ba3TaV5O14N formally derived from Ba3TaV
4TaIVO15 by substituting one
oxygen by nitrogen combined with an oxidation of TaIV to TaV. It should be mentioned
that first attempts preparing such an oxide nitride phase have been carried out by
Assabaa-Boultif [34] but never been published in a regular journal.
4.3. Experimental Section
4.3.1. Synthesis
An amorphous ternary Ba-Ta-O phase was synthesized via the sol-gel based Pechini
route.[35] Citrate complexes of tantalum and barium were prepared. For the barium
citrate solution barium chloride powder (Sigma Aldrich, 99.9 %) was dissolved in an
ethanol/water mixture containing citric acid (Sigma Aldrich 99.5 %). Citric acid was
used in a molar excess of 12 times the BaCl2. Tantalum citrate solution was prepared
using tantalum(V) chloride powder (Sigma Aldrich, 99.999 %) by dissolving it in
ethanol containing citric acid as well. Both solutions were mixed in a molar ratio of 3:5
with ethylene glycol and polymerized at 200 °C in a batch furnace. After calcination at
400 °C, an amorphous oxide was obtained. This precursor was treated with a mixture of
NH3 and O2 at 850 °C for 24 h in a tube furnace with flow rates of 10 L · h–1 and
0.03 L · h–1 for ammonia and oxygen, respectively.
4.3.2. Chemical and structural characterization
The products were characterized by X-ray powder diffraction using a PANalytical
X'Pert PRO diffractometer (Bragg-Brentano geometry, Cu-Kα radiation). All structural
refinements were performed with the program FullProf Suite Version 2009, by applying
a pseudo-Voigt function for the microstructural analysis.[36] Nitrogen and oxygen
contents were determined by hot gas extraction method (LECO TC-300/EF-300), for
calibration ZrO2 and steel (LECO calibration sample, N: 5000 ppm) were used as
standard materials. The accuracy is ~ 2 % of the presented N/O content. X-ray
Publication 1 36
fluorescence spectrometry (XRF) was performed using a PANalytical Axios
spectrometer with an Rh-tube.
4.3.3. UV-vis spectroscopy
UV-Vis diffuse reflectance spectra were measured using a Perkin Elmer Lambda 650
UV-Vis spectrometer equipped with a Praying-Mantis mirror construction. The
obtained spectra were converted by the Kubelka-Munk function F(R) into absorption
spectra, using MgO nanopowder as a white standard. Optical band gaps (Eg) were
obtained via the Tauc plot method [30,37–41] using the calculation α = A(hν - Eg)n/hν,
where α is the absorption coefficient, A is a constant, hν is the energy of light, and n = 2
is valid for materials with indirect band gap transition, respectively. Assuming the
absorption coefficient α being proportional to the Kubelka-Munk function F(R), Eg can
be obtained from the plot of [F(R)hν]1/n versus hν, by extrapolation of the linear part
near the onset of the absorption edge to intersect the energy axis.
4.3.4. Quantum-chemical methods
The effect of O/N distribution on the stability and electronic structure of Ba3Ta5O14N
was calculated from first principles employing hybrid density functional theory (DFT)
methods implemented in the crystalline-orbital program CRYSTAL14.[42] Similar to
our previous studies on TaON[43] the method PW1PW[44] was employed for the
structure optimizations. For the structure optimizations standard basis sets (std) from the
CRYSTAL homepage were used.[45] For the calculation of the electronic structure we
employed the recently developed hybrid method HSE06 with screened exchange[46]
which was demonstrated to provide improved band gaps of oxides. Since also the
atomic basis set affects the band positions, we switched from standard to extended basis
sets of triple-zeta valence plus polarization (tzvp) quality. For O and N, we employed
the pob basis sets,[47] and for Ta and Ba Stuttgart/Dresden effective core potentials
plus modified triple-zeta basis sets[48,49] where diffuse functions were removed.
Publication 1 37
4.3.5. Photocatalysis
Photocatalytic hydrogen generation was measured in a home-made air-free closed gas
system using a double-walled inner irradiation-type quartz reactor. As a light source, a
700 W Hg mid-pressure immersion lamp (Peschl UV-Consulting, set to a power of
500 W) was used for irradiation and cooled with a double-walled quartz mantle using a
thermostat (LAUDA). Gas evolution was detected online using a multi-channel analyzer
(Emerson) equipped with a detector for the determination of the concentration of
hydrogen (thermal conductivity detector), oxygen (paramagnetism) and carbon dioxide
(IR). Argon was used as carrier gas, the continuous gas flow was controlled by a
Brockhorst mass flow controller. The gas flow was set to 50 NmL/min (normal flow
throughput: gas flow at ambient temperature and pressure per minute).
All reactions were performed at 13 °C. 300 mg of photocatalyst is suspended in 550 mL
water and 50 mL methanol (aqueous methanol photoreforming). For a homogeneous
suspension a subsequent pre-treatment in the ultrasonication bath for 10 minutes at
30 °C was performed. Before any photocatalytic reaction was initiated, the whole
system including the photocatalyst was flushed with argon at 100 NmL/min for 30
minutes to remove any trace of air. In previous measurements Rh was obtained as the
most effective co-catalyst for barium tantalates with an optimum loading of only
0.0125 wt.-%. Rh [7,50] nanoparticles were deposited onto the photocatalyst materials
via reductive photodeposition with a specific amount of Na3RhCl6 (99.999%, Aldrich)
precursor solution using the setup described below. For measurements under visible
light an aqueous 2 M NaNO2 solution was used as filter.
4.4. Results and discussion
4.4.1. Chemical analysis and crystal structure
We successfully synthesized light yellow Ba3Ta5O14N as phase-pure material: XRF
analysis proved the Ba/Ta content of 26 wt% Ba and 58 wt% Ta (expected: 26.5 wt%
Ba, 58.1 wt% Ta). Quantitative chemical analysis by hot gas extraction delivered the
following values: 15.0 wt% O, 0.9 wt% N (expected: 14.4 wt% O, 0.9 wt% N).
Publication 1 38
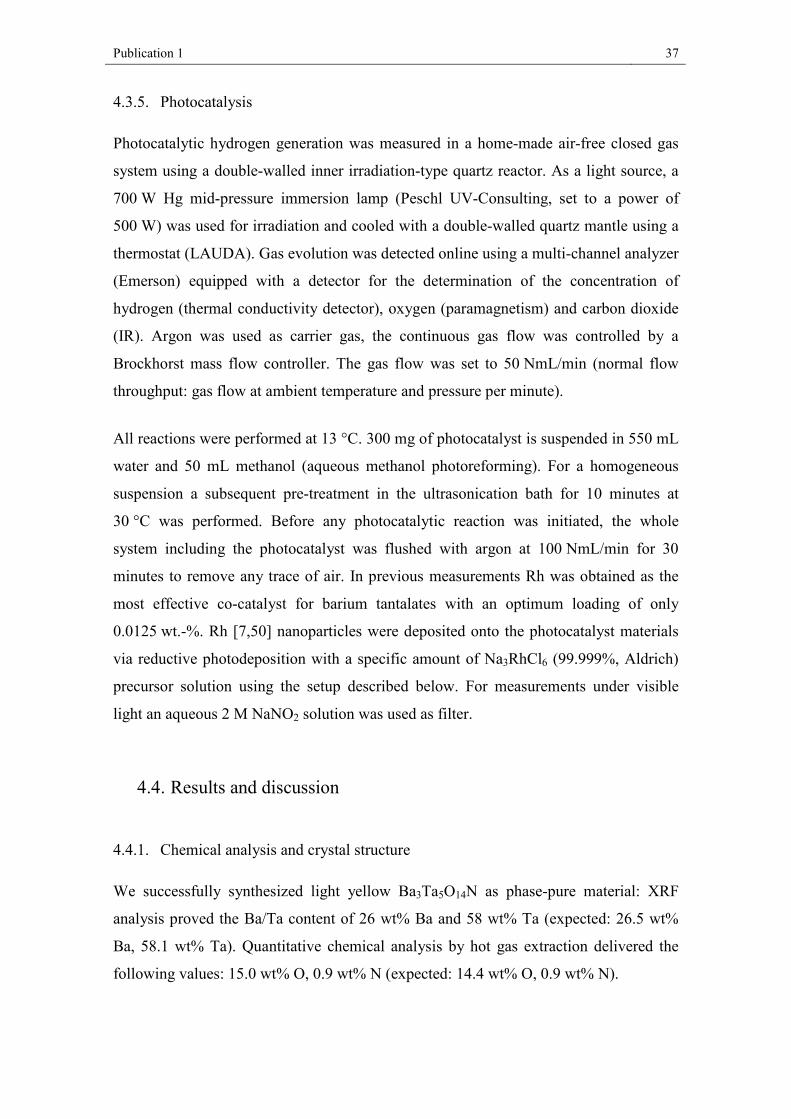
Figure 4.1: X-ray powder diffraction pattern of Ba3Ta5O14N with the results of the Rietveld refinement.
The structural refinement of Ba3Ta5O14N was started from the coordinates reported for
Ba3Ta5O15.[6] Figure 4.1 depicts the X-ray powder diffractogram of the new phase
Ba3Ta5O14N with the results of the Rietveld refinement. Further structural parameters
are listed in Table 4.1 with a comparison to Ba3Ta5O15. Atomic coordinates and
isotropic Debye-Waller factors are presented in Table 4.2. For comparison, we also
prepared Ba3Ta5O15, following the work of Feger and Ziebarth.[6] The refined structural
parameters are in good agreement. Finally, we decided to use the parameters from
literature for discussion because of the higher quality of the single crystal data.
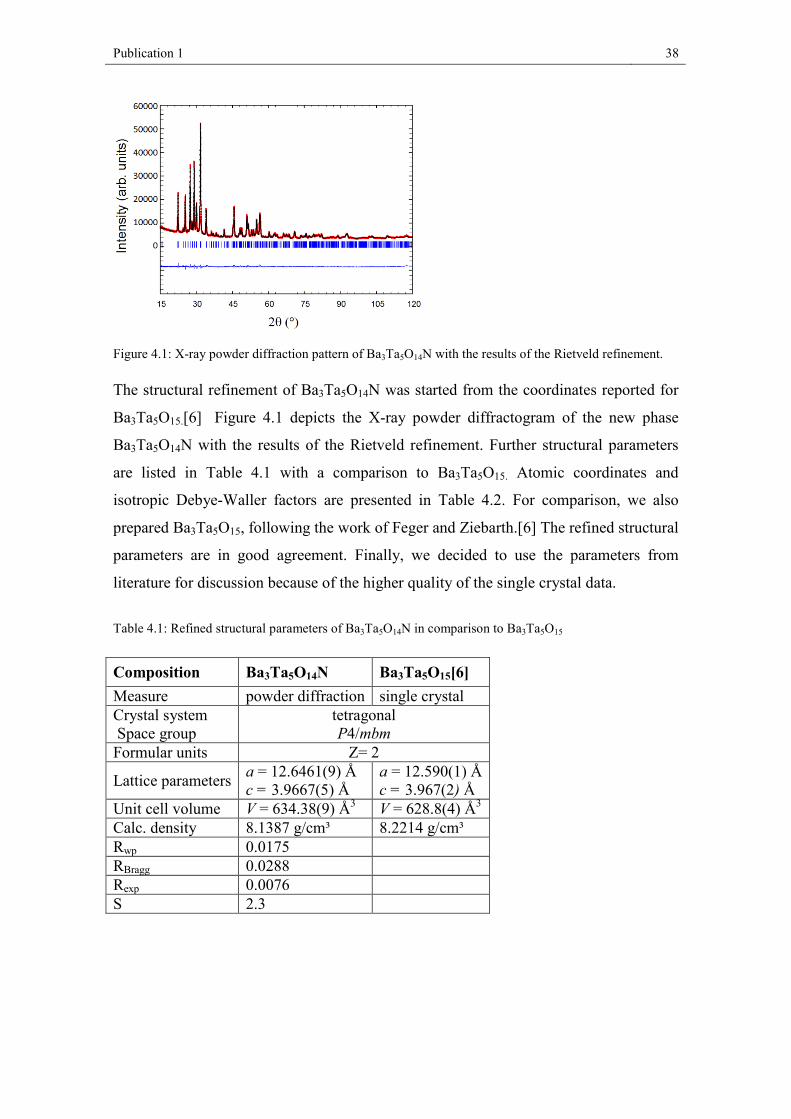
Table 4.1: Refined structural parameters of Ba3Ta5O14N in comparison to Ba3Ta5O15
Composition Ba3Ta5O14N Ba3Ta5O15[6]
Measure powder diffraction single crystal Crystal system Space group
tetragonal P4/mbm
Formular units Z= 2
Lattice parameters a = 12.6461(9) Å c = 3.9667(5) Å
a = 12.590(1) Å c = 3.967(2) Å
Unit cell volume V = 634.38(9) Å3 V = 628.8(4) Å3 Calc. density 8.1387 g/cm³ 8.2214 g/cm³ Rwp 0.0175 RBragg 0.0288 Rexp 0.0076 S 2.3
Publication 1 39
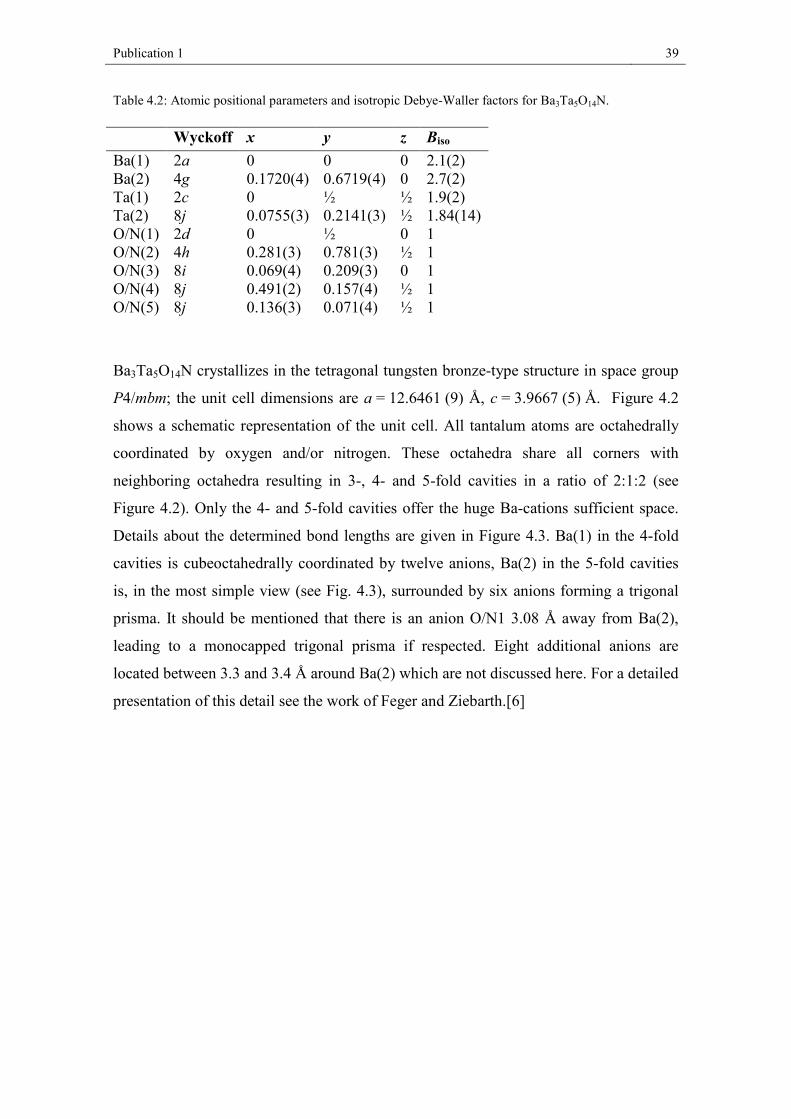
Table 4.2: Atomic positional parameters and isotropic Debye-Waller factors for Ba3Ta5O14N.
Wyckoff x y z Biso
Ba(1) 2a 0 0 0 2.1(2) Ba(2) 4g 0.1720(4) 0.6719(4) 0 2.7(2) Ta(1) 2c 0 ½ ½ 1.9(2) Ta(2) 8j 0.0755(3) 0.2141(3) ½ 1.84(14) O/N(1) 2d 0 ½ 0 1 O/N(2) 4h 0.281(3) 0.781(3) ½ 1 O/N(3) 8i 0.069(4) 0.209(3) 0 1 O/N(4) 8j 0.491(2) 0.157(4) ½ 1 O/N(5) 8j 0.136(3) 0.071(4) ½ 1
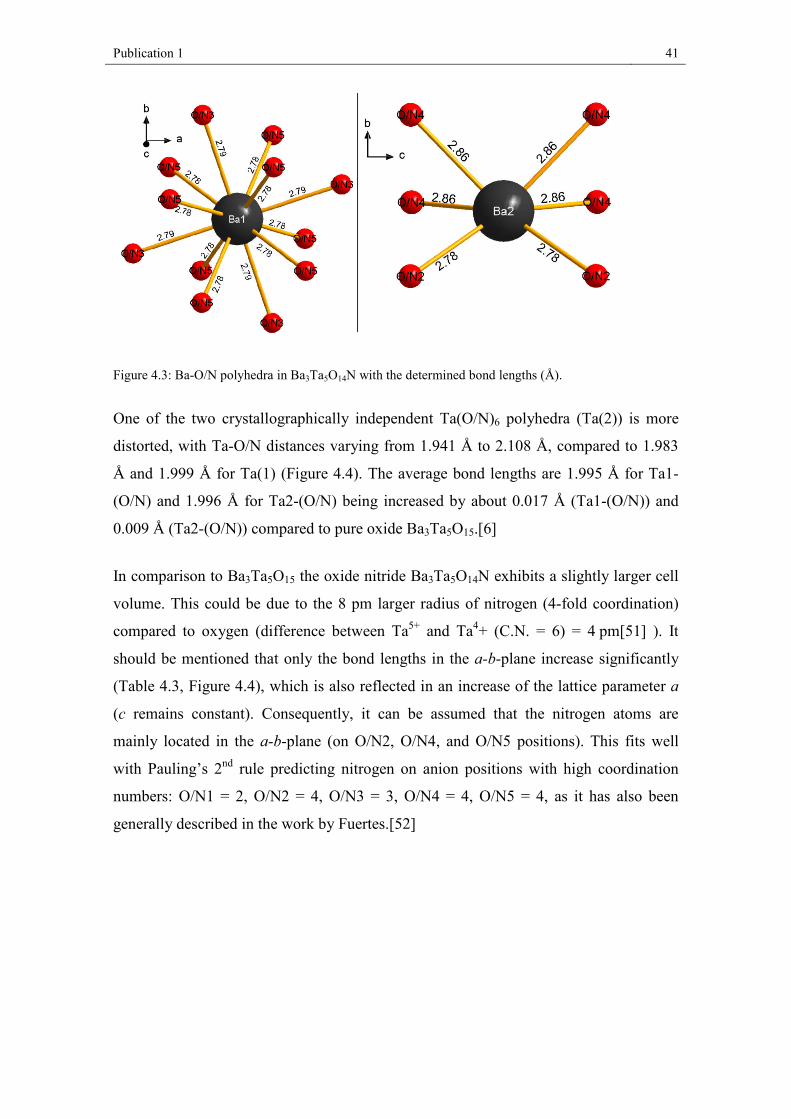
Ba3Ta5O14N crystallizes in the tetragonal tungsten bronze-type structure in space group
P4/mbm; the unit cell dimensions are a = 12.6461 (9) Å, c = 3.9667 (5) Å. Figure 4.2
shows a schematic representation of the unit cell. All tantalum atoms are octahedrally
coordinated by oxygen and/or nitrogen. These octahedra share all corners with
neighboring octahedra resulting in 3-, 4- and 5-fold cavities in a ratio of 2:1:2 (see
Figure 4.2). Only the 4- and 5-fold cavities offer the huge Ba-cations sufficient space.
Details about the determined bond lengths are given in Figure 4.3. Ba(1) in the 4-fold
cavities is cubeoctahedrally coordinated by twelve anions, Ba(2) in the 5-fold cavities
is, in the most simple view (see Fig. 4.3), surrounded by six anions forming a trigonal
prisma. It should be mentioned that there is an anion O/N1 3.08 Å away from Ba(2),
leading to a monocapped trigonal prisma if respected. Eight additional anions are
located between 3.3 and 3.4 Å around Ba(2) which are not discussed here. For a detailed
presentation of this detail see the work of Feger and Ziebarth.[6]
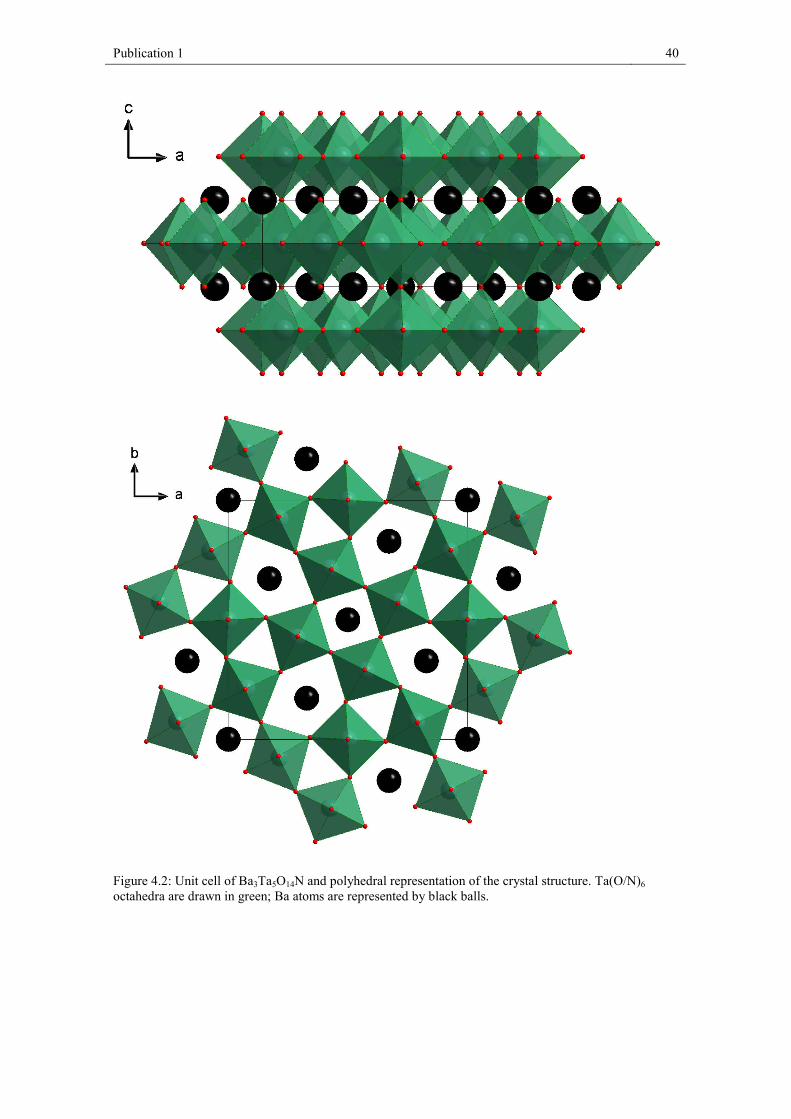
Publication 1 40
Figure 4.2: Unit cell of Ba3Ta5O14N and polyhedral representation of the crystal structure. Ta(O/N)6 octahedra are drawn in green; Ba atoms are represented by black balls.
Publication 1 41
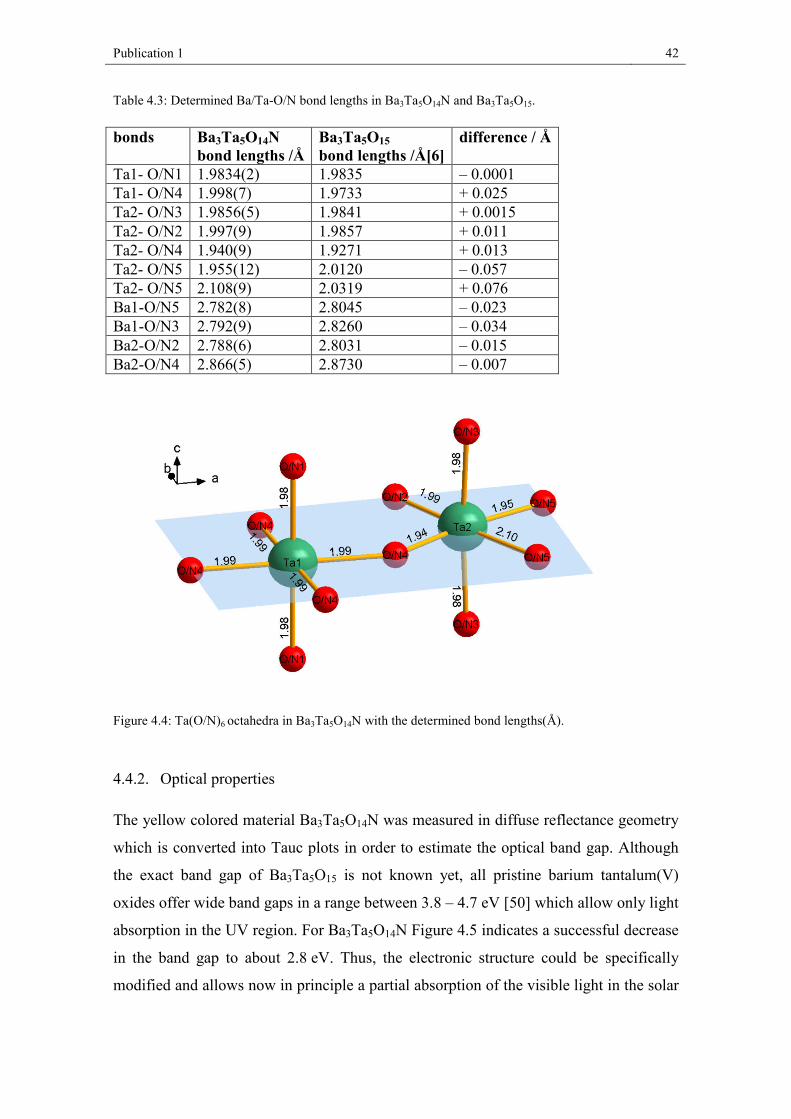
One of the two crystallographically independent Ta(O/N)6 polyhedra (Ta(2)) is more
distorted, with Ta-O/N distances varying from 1.941 Å to 2.108 Å, compared to 1.983
Å and 1.999 Å for Ta(1) (Figure 4.4). The average bond lengths are 1.995 Å for Ta1-
(O/N) and 1.996 Å for Ta2-(O/N) being increased by about 0.017 Å (Ta1-(O/N)) and
0.009 Å (Ta2-(O/N)) compared to pure oxide Ba3Ta5O15.[6]
In comparison to Ba3Ta5O15 the oxide nitride Ba3Ta5O14N exhibits a slightly larger cell
volume. This could be due to the 8 pm larger radius of nitrogen (4-fold coordination)
compared to oxygen (difference between Ta5+ and Ta4+ (C.N. = 6) = 4 pm[51] ). It
should be mentioned that only the bond lengths in the a-b-plane increase significantly
(Table 4.3, Figure 4.4), which is also reflected in an increase of the lattice parameter a
(c remains constant). Consequently, it can be assumed that the nitrogen atoms are
mainly located in the a-b-plane (on O/N2, O/N4, and O/N5 positions). This fits well
with Pauling’s 2nd rule predicting nitrogen on anion positions with high coordination
numbers: O/N1 = 2, O/N2 = 4, O/N3 = 3, O/N4 = 4, O/N5 = 4, as it has also been
generally described in the work by Fuertes.[52]
Figure 4.3: Ba-O/N polyhedra in Ba3Ta5O14N with the determined bond lengths (Å).
Publication 1 42
Table 4.3: Determined Ba/Ta-O/N bond lengths in Ba3Ta5O14N and Ba3Ta5O15.
bonds Ba3Ta5O14N bond lengths /Å
Ba3Ta5O15 bond lengths /Å[6]
difference / Å
Ta1- O/N1 1.9834(2) 1.9835 – 0.0001 Ta1- O/N4 1.998(7) 1.9733 + 0.025 Ta2- O/N3 1.9856(5) 1.9841 + 0.0015 Ta2- O/N2 1.997(9) 1.9857 + 0.011 Ta2- O/N4 1.940(9) 1.9271 + 0.013 Ta2- O/N5 1.955(12) 2.0120 – 0.057 Ta2- O/N5 2.108(9) 2.0319 + 0.076 Ba1-O/N5 2.782(8) 2.8045 – 0.023 Ba1-O/N3 2.792(9) 2.8260 – 0.034 Ba2-O/N2 2.788(6) 2.8031 – 0.015 Ba2-O/N4 2.866(5) 2.8730 – 0.007
Figure 4.4: Ta(O/N)6 octahedra in Ba3Ta5O14N with the determined bond lengths(Å).
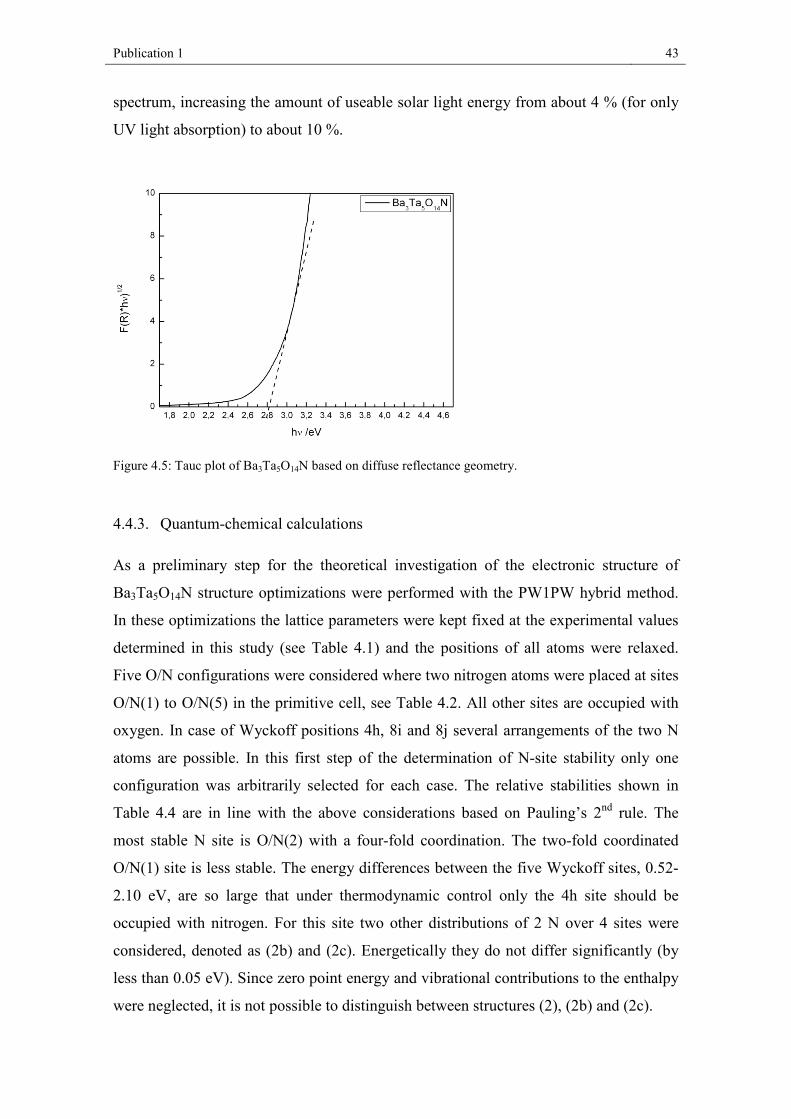
4.4.2. Optical properties
The yellow colored material Ba3Ta5O14N was measured in diffuse reflectance geometry
which is converted into Tauc plots in order to estimate the optical band gap. Although
the exact band gap of Ba3Ta5O15 is not known yet, all pristine barium tantalum(V)
oxides offer wide band gaps in a range between 3.8 – 4.7 eV [50] which allow only light
absorption in the UV region. For Ba3Ta5O14N Figure 4.5 indicates a successful decrease
in the band gap to about 2.8 eV. Thus, the electronic structure could be specifically
modified and allows now in principle a partial absorption of the visible light in the solar
Publication 1 43
spectrum, increasing the amount of useable solar light energy from about 4 % (for only
UV light absorption) to about 10 %.
Figure 4.5: Tauc plot of Ba3Ta5O14N based on diffuse reflectance geometry.
4.4.3. Quantum-chemical calculations
As a preliminary step for the theoretical investigation of the electronic structure of
Ba3Ta5O14N structure optimizations were performed with the PW1PW hybrid method.
In these optimizations the lattice parameters were kept fixed at the experimental values
determined in this study (see Table 4.1) and the positions of all atoms were relaxed.
Five O/N configurations were considered where two nitrogen atoms were placed at sites
O/N(1) to O/N(5) in the primitive cell, see Table 4.2. All other sites are occupied with
oxygen. In case of Wyckoff positions 4h, 8i and 8j several arrangements of the two N
atoms are possible. In this first step of the determination of N-site stability only one
configuration was arbitrarily selected for each case. The relative stabilities shown in
Table 4.4 are in line with the above considerations based on Pauling’s 2nd rule. The
most stable N site is O/N(2) with a four-fold coordination. The two-fold coordinated
O/N(1) site is less stable. The energy differences between the five Wyckoff sites, 0.52-
2.10 eV, are so large that under thermodynamic control only the 4h site should be
occupied with nitrogen. For this site two other distributions of 2 N over 4 sites were
considered, denoted as (2b) and (2c). Energetically they do not differ significantly (by
less than 0.05 eV). Since zero point energy and vibrational contributions to the enthalpy
were neglected, it is not possible to distinguish between structures (2), (2b) and (2c).
Publication 1 44
Table 4.4: Relative stability (eV) of different O/N configurations of Ba3Ta5O14N; two nitrogen atoms are placed at particular lattice sites, and all other sites are occupied by oxygen. Comparison of two hybrid DFT functionals and basis sets, see text.
N on lattice site PW1PW/std HSE06/tzvp O/N(1) 2.10 2.10 O/N(2) 0.00 0.00 (2b) 0.00 0.01 (2c) 0.05 0.05 O/N(3) 1.51 1.51 O/N(4) 0.70 0.71 O/N(5) 0.52 0.53
The optimized N-Ta and N-Ba distances are presented in Table 4.5. They are quite
similar to the averaged values for O/N, see Table 4.3. After optimization, the
configuration where N occupies two O/N(3) sites changes the coordination number
from three to four (with a slightly larger N-Ba distance of 2.90 Å compare to the other
configurations). In the most stable configuration the nitrogen coordination is rather
symmetric with two identical N-Ta and N-Ba distances of 1.92 Å and 2.80 Å,
respectively. Configurations with N on sites (3), (4), and (5) are less stable than with N
on (2) because they also contain a relatively small N-O distance (in the range 2.6-2.7 Å)
which leads to repulsive interactions. Trivalent nitrogen is unstable on the two-
coordinated site in (1) as discussed above.
Table 4.5: Optimized nearest-neighbor distances around the N atoms (Å) obtained for five configurations. Results obtained with PW1PW/std.
N on lattice site Distances to Ta Distances to Ba O/N(1) 1.98, 1.98 >3 O/N(2) 1.92, 1.92 2.80, 2.80 O/N(3) 2.00, 2.00 2.77, 2.90 O/N(4) 1.84, 2.01 2.82, 2.82 O/N(5) 1.94, 1.97 2.82, 2.82
In order to check the method and basis set dependence of the calculated electronic
structure we compared the PW1PW/std results with the screened-exchange hybrid
method HSE06, combined with extended pob basis sets. The HSE06/pob band structure
calculations were performed for the structures optimized with PW1PW/std. It has to be
mentioned that the relative stabilities of the O/N configurations obtained with the two
theoretical approaches almost perfectly agree, see Table 4.4. The calculated direct and
indirect band gaps are presented in Table 4.6.
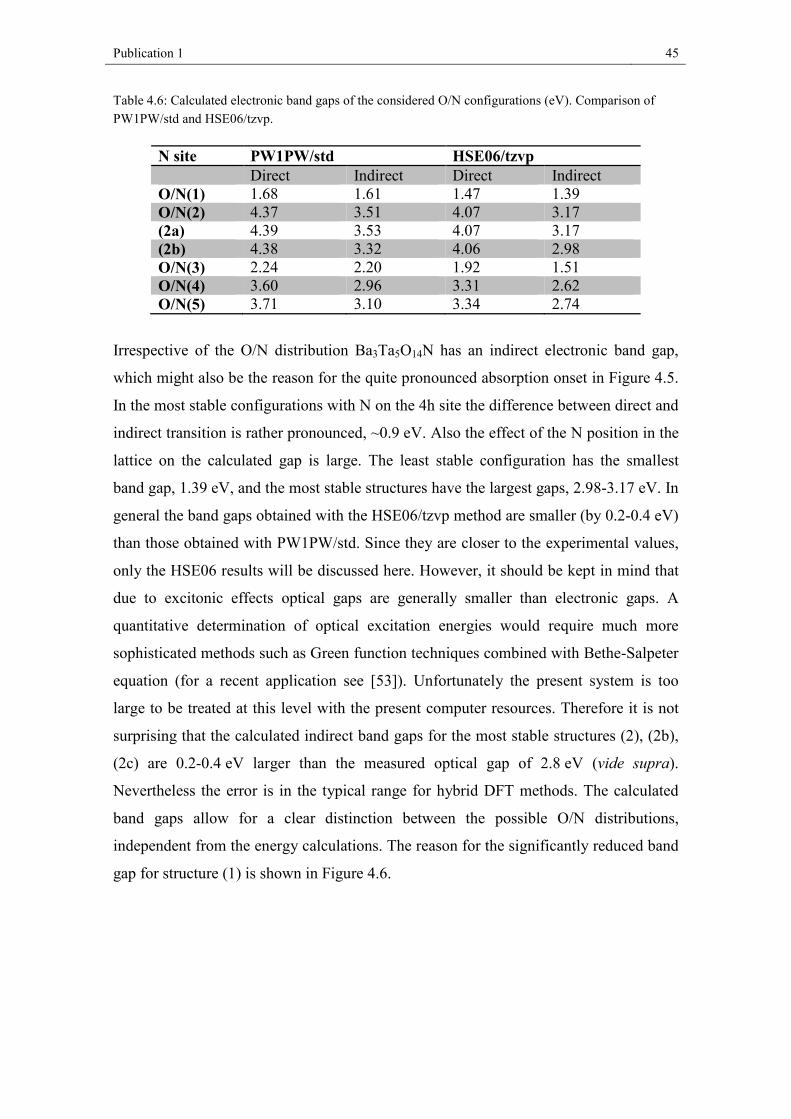
Publication 1 45
Table 4.6: Calculated electronic band gaps of the considered O/N configurations (eV). Comparison of PW1PW/std and HSE06/tzvp.
N site PW1PW/std HSE06/tzvp Direct Indirect Direct Indirect O/N(1) 1.68 1.61 1.47 1.39 O/N(2) 4.37 3.51 4.07 3.17 (2a) 4.39 3.53 4.07 3.17 (2b) 4.38 3.32 4.06 2.98 O/N(3) 2.24 2.20 1.92 1.51 O/N(4) 3.60 2.96 3.31 2.62 O/N(5) 3.71 3.10 3.34 2.74
Irrespective of the O/N distribution Ba3Ta5O14N has an indirect electronic band gap,
which might also be the reason for the quite pronounced absorption onset in Figure 4.5.
In the most stable configurations with N on the 4h site the difference between direct and
indirect transition is rather pronounced, ~0.9 eV. Also the effect of the N position in the
lattice on the calculated gap is large. The least stable configuration has the smallest
band gap, 1.39 eV, and the most stable structures have the largest gaps, 2.98-3.17 eV. In
general the band gaps obtained with the HSE06/tzvp method are smaller (by 0.2-0.4 eV)
than those obtained with PW1PW/std. Since they are closer to the experimental values,
only the HSE06 results will be discussed here. However, it should be kept in mind that
due to excitonic effects optical gaps are generally smaller than electronic gaps. A
quantitative determination of optical excitation energies would require much more
sophisticated methods such as Green function techniques combined with Bethe-Salpeter
equation (for a recent application see [53]). Unfortunately the present system is too
large to be treated at this level with the present computer resources. Therefore it is not
surprising that the calculated indirect band gaps for the most stable structures (2), (2b),
(2c) are 0.2-0.4 eV larger than the measured optical gap of 2.8 eV (vide supra).
Nevertheless the error is in the typical range for hybrid DFT methods. The calculated
band gaps allow for a clear distinction between the possible O/N distributions,
independent from the energy calculations. The reason for the significantly reduced band
gap for structure (1) is shown in Figure 4.6.
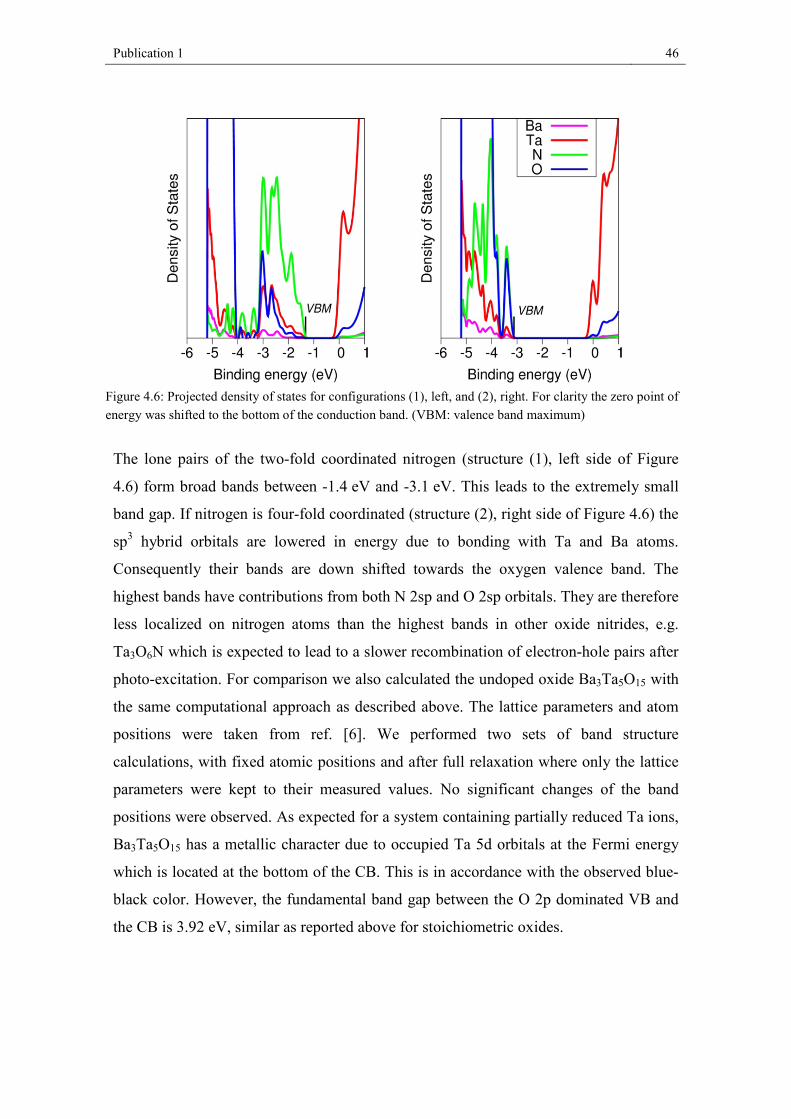
Publication 1 46
The lone pairs of the two-fold coordinated nitrogen (structure (1), left side of Figure
4.6) form broad bands between -1.4 eV and -3.1 eV. This leads to the extremely small
band gap. If nitrogen is four-fold coordinated (structure (2), right side of Figure 4.6) the
sp3 hybrid orbitals are lowered in energy due to bonding with Ta and Ba atoms.
Consequently their bands are down shifted towards the oxygen valence band. The
highest bands have contributions from both N 2sp and O 2sp orbitals. They are therefore
less localized on nitrogen atoms than the highest bands in other oxide nitrides, e.g.
Ta3O6N which is expected to lead to a slower recombination of electron-hole pairs after
photo-excitation. For comparison we also calculated the undoped oxide Ba3Ta5O15 with
the same computational approach as described above. The lattice parameters and atom
positions were taken from ref. [6]. We performed two sets of band structure
calculations, with fixed atomic positions and after full relaxation where only the lattice
parameters were kept to their measured values. No significant changes of the band
positions were observed. As expected for a system containing partially reduced Ta ions,
Ba3Ta5O15 has a metallic character due to occupied Ta 5d orbitals at the Fermi energy
which is located at the bottom of the CB. This is in accordance with the observed blue-
black color. However, the fundamental band gap between the O 2p dominated VB and
the CB is 3.92 eV, similar as reported above for stoichiometric oxides.
Figure 4.6: Projected density of states for configurations (1), left, and (2), right. For clarity the zero point of energy was shifted to the bottom of the conduction band. (VBM: valence band maximum)
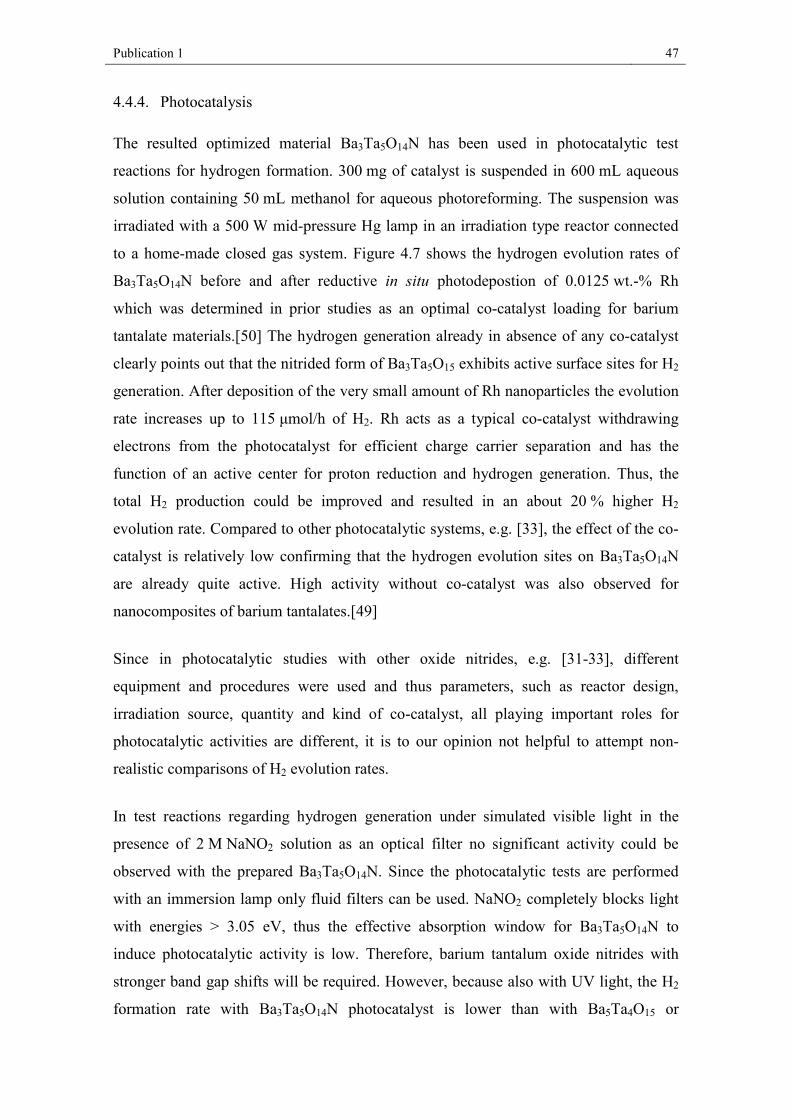
Publication 1 47
4.4.4. Photocatalysis
The resulted optimized material Ba3Ta5O14N has been used in photocatalytic test
reactions for hydrogen formation. 300 mg of catalyst is suspended in 600 mL aqueous
solution containing 50 mL methanol for aqueous photoreforming. The suspension was
irradiated with a 500 W mid-pressure Hg lamp in an irradiation type reactor connected
to a home-made closed gas system. Figure 4.7 shows the hydrogen evolution rates of
Ba3Ta5O14N before and after reductive in situ photodepostion of 0.0125 wt.-% Rh
which was determined in prior studies as an optimal co-catalyst loading for barium
tantalate materials.[50] The hydrogen generation already in absence of any co-catalyst
clearly points out that the nitrided form of Ba3Ta5O15 exhibits active surface sites for H2
generation. After deposition of the very small amount of Rh nanoparticles the evolution
rate increases up to 115 μmol/h of H2. Rh acts as a typical co-catalyst withdrawing
electrons from the photocatalyst for efficient charge carrier separation and has the
function of an active center for proton reduction and hydrogen generation. Thus, the
total H2 production could be improved and resulted in an about 20 % higher H2
evolution rate. Compared to other photocatalytic systems, e.g. [33], the effect of the co-
catalyst is relatively low confirming that the hydrogen evolution sites on Ba3Ta5O14N
are already quite active. High activity without co-catalyst was also observed for
nanocomposites of barium tantalates.[49]
Since in photocatalytic studies with other oxide nitrides, e.g. [31-33], different
equipment and procedures were used and thus parameters, such as reactor design,
irradiation source, quantity and kind of co-catalyst, all playing important roles for
photocatalytic activities are different, it is to our opinion not helpful to attempt non-
realistic comparisons of H2 evolution rates.
In test reactions regarding hydrogen generation under simulated visible light in the
presence of 2 M NaNO2 solution as an optical filter no significant activity could be
observed with the prepared Ba3Ta5O14N. Since the photocatalytic tests are performed
with an immersion lamp only fluid filters can be used. NaNO2 completely blocks light
with energies > 3.05 eV, thus the effective absorption window for Ba3Ta5O14N to
induce photocatalytic activity is low. Therefore, barium tantalum oxide nitrides with
stronger band gap shifts will be required. However, because also with UV light, the H2
formation rate with Ba3Ta5O14N photocatalyst is lower than with Ba5Ta4O15 or
Publication 1 48
Ba3Ta5O15 containing nanocomposites [7], also the presence of defects in the lattice
acting as unwanted recombination centers cannot be ruled out. Deeper investigations to
decrease the probability of increased recombination of electron-hole pairs and to
enhance the photocatalytic activity are still ongoing. Nevertheless the present results
provide a proficient basis for a route to photoactive materials active under visible light.
Figure 4.7: Photocatalytic hydrogen evolution rates of Ba3Ta5O14N before and after reductive in situ pho-todeposition of 0.0125 wt.-% Rh.
4.5. Conclusion
We were successful in synthesizing light yellow Ba3Ta5O14N (tantalum(V) only) with
an optical band gap of ∼2.8 eV as pure-phase material by an ammonolysis reaction. The
oxide nitride crystallizes isostructurally to the known mixed-valence oxide
Ba3Ta4VTaIVO15. Quantum chemical calculations at hybrid DFT level provide band gaps
of 2.98-3.17 eV, close to the measured value. The effect of N/O distribution on the
optical properties was calculated to be very pronounced. First measurements of the
photocatalytical activity exhibited significant but not outstanding performance. In a next
step, a further narrowing of the band gap using co-doping concepts seems to be
promising. Keep in mind that an increase of the nitrogen content should result in a
decrease of the band gap. One strategy may be the co-substitution Ba2+/O2- → La3+/N3-:
Ba3Ta5O15 → Ba3Ta5O14N → LaBa2Ta5O13N2 → La2BaTa5O12N3 → La3Ta5O11N4.
Publication 1 49
Acknowledgment
The authors would like to thank M. Stöbe (TU Berlin) for performing XRF analyses.
This work is supported by the Deutsche Forschungsgemeinschaft (DFG) within the
priority program SPP 1613 (LE 781/13-2, BR 1768/9-1, WA 1116/28).
References
[1] G. K. Layden, Mat. Res. Bull. 1968, 3, 349. [2] T. Siegrist, R. J. Cava, J. J. Krajewski, Mat. Res. Bull. 1997, 32, 881. [3] F. Galasso, L. Katz, Acta Cryst 1961, 14, 647. [4] C. D. Ling, M. Avdeev, V. V. Kharton, A. A. Yaremchenko, R. B. Macquart, M.
Hoelzel, Chem. Mater. 2010, 22, 532. [5] A. Ritter, T. Lydssan, B. Harbrecht, Z. Anorg. Allg. Chem. 1998, 624, 1791. [6] C. R. Feger, R. P. Ziebarth, Chem. Mater. 1995, 7, 373. [7] R. Marschall, J. Soldat, G. W. Busser, M. Wark, Photochem. Photobiol. Sci. 2013,
12, 671. [8] R. Asahi, T. Morikawa, T. Ohwaki, K. Aoki, Y. Taga, Science (New York, N.Y.)
2001, 293, 269. [9] W. Zhao, W. Ma, C. Chen, J. Zhao, Z. Shuai, J. Am. Chem. Soc. 2004, 126, 4782. [10] S. In, A. Orlov, R. Berg, F. García, S. Pedrosa-Jimenez, M. S. Tikhov, D. S.
Wright, R. M. Lambert, J. Am. Chem. Soc. 2007, 129, 13790. [11] G. Liu, C. Sun, L. Cheng, Y. Jin, H. Lu, L. Wang, S. C. Smith, G. Q. Lu, H.-M.
Cheng, J. Phys. Chem. C 2009, 113, 12317. [12] Khan, Shahed U M, M. Al-Shahry, W. B. Ingler, Science (New York, N.Y.) 2002,
297, 2243. [13] S. Sakthivel, H. Kisch, Angew. Chem. Int. Ed. Eng. 2003, 42, 4908. [14] K. Nagaveni, M. S. Hegde, N. Ravishankar, G. N. Subbanna, G. Madras, Langmuir
2004, 20, 2900. [15] Y. Choi, T. Umebayashi, M. Yoshikawa, Journal of Materials Science 2004, 39,
1837. [16] S. K. Mohapatra, M. Misra, V. K. Mahajan, K. S. Raja, J. Phys. Chem. C 2007,
111, 8677. [17] J. C. Yu, Yu, Ho, Jiang, Zhang, Chem. Mater. 2002, 14, 3808. [18] Di Li, H. Haneda, S. Hishita, N. Ohashi, Chem. Mater. 2005, 17, 2596. [19] W. Ho, J. C. Yu, S. Lee, Chem. Commun. (Camb. ) 2006. [20] K. Maeda, Y. Shimodaira, B. Lee, K. Teramura, D. Lu, H. Kobayashi, K. Domen,
J. Phys. Chem. C 2007, 111, 18264. [21] X. Zong, Z. Xing, H. Yu, Z. Chen, F. Tang, J. Zou, G. Q. Lu, L. Wang, Chem.
Commun. (Camb. ) 2011, 47, 11742. [22] J. L. Gole, J. D. Stout, C. Burda, Y. Lou, X. Chen, J. Phys. Chem. B 2004, 108,
1230. [23] I. N. Martyanov, S. Uma, S. Rodrigues, K. J. Klabunde, Chem. Commun. (Camb. )
2004. [24] S. Livraghi, M. C. Paganini, E. Giamello, A. Selloni, C. Di Valentin, G. Pacchioni,
J. Am. Chem. Soc. 2006, 128, 15666. [25] Y. Cong, J. Zhang, F. Chen, M. Anpo, J. Phys. Chem. C 2007, 111, 6976.
Publication 1 50
[26] J. Fang, F. Wang, K. Qian, H. Bao, Z. Jiang, W. Huang, J. Phys. Chem. C 2008, 112, 18150.
[27] T. Umebayashi, T. Yamaki, H. Itoh, K. Asai, Appl. Phys. Lett. 2002, 81, 454. [28] T. Umebayashi, T. Yamaki, S. Tanaka, K. Asai, Chem. Lett. 2003, 32, 330. [29] T. Ohno, M. Akiyoshi, T. Umebayashi, K. Asai, T. Mitsui, M. Matsumura, Applied
Catalysis A: General 2004, 265, 115. [30] Y. Izumi, T. Itoi, S. Peng, K. Oka, Y. Shibata, J. Phys. Chem. C 2009, 113, 6706. [31] M. Higashi, K. Domen, R. Abe, J. Am. Chem. Soc. 2013, 135, 10238. [32] K. Maeda, D. Lu, K. Domen, ACS Catal. 2013, 3, 1026. [33] M. Yoshida, K. Maeda, D. Lu, J. Kubota, K. Domen, J. Phys. Chem. C 2013, 117,
14000. [34] R. Assabaa-Boultif, thesis #912, the University of Rennes 1, France 1993,
https://books.google.de/books?id=28psOQAACAAJ. [35] M. P. Pechini, US Pat. No.3.330.697 1967. [36] J. Rodriguez-Carvajal, Physica B 1993, 55, 192. [37] I. Bannat, K. Wessels, T. Oekermann, J. Rathousky, D. Bahnemann, M. Wark,
Chem. Mater. 2009, 21, 1645. [38] L. Bi, J. Y. Feng, J. Lumin. 2006, 121, 95. [39] J. Tauc, Mat. Res. Bull. 1968, 3, 37. [40] Van Leeuwen, Robert A., C.-J. Hung, D. R. Kammler, J. A. Switzer, J. Phys.
Chem. 1995, 99, 15247. [41] Y. Zhang, G. Li, Y. Wu, Y. Luo, L. Zhang, J. Phys. Chem. B 2005, 109, 5478. [42] R. Dovesi, R. Orlando, A. Erba, C. M. Zicovich-Wilson, B. Civalleri, S. Casassa,
L. Maschio, M. Ferrabone, De La Pierre, Marco, P. D'Arco, Y. Noël, M. Causà, M. Rérat, B. Kirtman, Int. J. Quantum Chem. 2014, 114, 1287.
[43] S. Nakhal, M.-W. Lumey, T. Bredow, R. Dronskowski, M. Lerch, Z. Anorg. Allg. Chem. 2010, 636, 1006.
[44] T. Bredow, A. R. Gerson, Phys. Rev. B 2000, 61, 5194. [45] www.crystal.unito.it/basis-sets.php. [46] A. V. Krukau, O. A. Vydrov, A. F. Izmaylov, G. E. Scuseria, J. Chem. Phys. 2006,
125, 224106. [47] M. F. Peintinger, D. V. Oliveira, T. Bredow, J. Comput. Chem. 2013, 34, 451. [48] D. Andrae, U. Häußermann, M. Dolg, H. Stoll, H. Preuß, Theoret. Chim. Acta
1990, 77, 123. [49] M. Kaupp, Schleyer, P. v. R., H. Stoll, H. Preuss, J. Chem. Phys. 1991, 94, 1360. [50] J. Soldat, R. Marschall, M. Wark, Chem. Sci. 2014, 5, 3746. [51] R. D. Shannon, Acta Cryst A 1976, 32, 751. [52] A. Fuertes, Inorg. Chem. 2006, 45, 9640. [53] T. Lüdtke, A. Schmidt, C. Göbel, A. Fischer, N. Becker, C. Reimann, T. Bredow,
R. Dronskowski, M. Lerch, Inorg. Chem. 2014, 53, 11691.

Publication 1 51
Publication 2 52
5. Publication 2
From Ba3Ta5O14N to La Ba2Ta5O13N2: Decreasing the Optical Band Gap of a Photocatalysts
B. Anke, T. Bredow, M. Pilarski, M. Wark, M. Lerch published Journal of Solid State Chemistry 246 (2017) 75–80 doi: 10.1016/j.jssc.2016.11.001 https://doi.org/10.1016/j.jssc.2016.11.001 Contribution to publication: B. Anke: Sample preparation, chemical analysis and crystal structure analysis, UV-Vis interpretation, and writing. T. Bredow: Quantum-chemical calculations. M. Pilarski: Measurements (photocatalysis), evaluation. M. Wark: General discussion, proofreading. M. Lerch: General advice and helpful comments, proofreading
Publication 2 53
Authors: B. Anke,1 T. Bredow,2 M. Pilarski,3 M. Wark,3 M. Lerch*1
1Institut für Chemie, Technische Universität Berlin, Straße des 17. Juni 135, 10623 Berlin 2 Mulliken Center for Theoretical Chemistry, Institut für Physikalische und Theoretische Chemie, Universität Bonn, Beringstr. 4, 53115 Bonn 3 Institut für Chemie, Carl von Ossietzky Universität Oldenburg, Carl-von-Ossietzky-Str. 9-11, 26129 Oldenburg *corresponding author Keywords: barium tantalum oxide, oxide nitrides, synthesis, crystal structure, quantum-chemical calculations, photocatalysis
Publication 2 54
5.1. Abstract
Yellow LaBa2Ta5O13N2 was successfully synthesized as phase-pure material
crystallizing isostructurally to previously reported Ba3Ta5O14N and mixed-valence
Ba3TaV4TaIVO15. The electronic structure of LaBa2Ta5O13N2 was studied theoretically
with the range-separated hybrid method HSE06. The most stable structure was obtained
when lanthanum was placed on 2a and nitrogen on 4h sites confirming Pauling’s second
rule. By incorporating nitrogen, the measured band gap decreases from ∼3.8 eV for the
oxide via 2.74 eV for Ba3Ta5O14N to 2.63 eV for the new oxide nitride, giving rise to an
absorption band well in the visible-light region. Calculated fundamental band gaps
confirm the experimental trend. The atom-projected density of states has large
contributions from N2p orbitals close to the valence band edge. These are responsible
for the observed band gap reduction. Photocatalytic hydrogen formation was
investigated and compared with that of Ba3Ta5O14N revealing significantly higher
activity for LaBa2Ta5O13N2.
5.2. Introduction
Reductive photocatalytic splitting of water using sunlight has received a lot of attention
because of its potential to convert solar energy into chemical energy. So far, most
investigations have focused on transition metal oxide-based photocatalysts containing
zirconium, titanium, niobium, or tantalum.[1–3] These materials show relatively good
photocatalytic activity under UV-light and sufficient chemical stability. Unfortunately,
the band gap energies of these oxides are too large to allow the efficient absorption of
visible light. Even though non-oxide photocatalysts such as Ta3N5 or CdSe have smaller
optical band gaps that match the spectral distribution of the sunlight, the biggest
disadvantage of these materials is their instability under irradiation.[4,5] Respecting all
these aspects, the development of stable photocatalysts with high activity under visible
light (λ > 400 nm) is a very challenging and important subject of research for the
efficient utilization of solar energy.
In contrast to the oxide semiconductors, transition metal oxide nitrides such as ß-TaON,
BaTaO2N, and LaTaON2,[6–9] exhibit narrower band gaps due to a mixing of N 2p
Publication 2 55
states with O 2p states.[10] Although these oxide nitrides have attracted great interest in
the water splitting community, the number of nitrogen-containing photocatalysts with
significant activity is limited. Consequently, the search of new compounds seems to be
worth the efforts. Derived from the well-known mixed-valent oxide Ba3TaV4TaIVO15,
we recently reported an oxide nitride catalyst (Ba3TaV5O14N) exhibiting an optical band
gap of 2.74 eV. For a further narrowing of the band gap the amount of nitrogen has to
be increased. As all tantalum in Ba3TaV5O14N is in the highest possible formal oxidation
state, combined cation/anion substitution has to be taken into account. In the following,
the results of our attempts in carrying out Ba2+/O2- → La3+/N3- co-substitution, leading
to LaBa2TaV5O13N2, are presented.
5.3. Experimental Section
5.3.1. Synthesis
An amorphous quaternary La-Ba-Ta-O phase was synthesized via a sol-gel based
Pechini route.[11] Citrate complexes of tantalum, lanthanum, and barium were
prepared. For the lanthanum citrate solution, lanthanum chloride powder (Sigma
Aldrich, 99.9 %) was dissolved in an ethanol/water mixture containing citric acid
(Sigma Aldrich 99.5 %). The latter was used in a molar excess of 12 times the LaCl3.
Barium and tantalum citrate solutions were prepared using barium chloride (Sigma
Aldrich, 99.9 %) and tantalum(V) chloride powder (Sigma Aldrich, 99.999 %) by
dissolving them in ethanol containing citric acid as well. All solutions were mixed in a
molar ratio of 1:2:5 with ethylene glycol and polymerized at 200 °C in a batch furnace.
After calcination at 400 °C an amorphous oxide was obtained. This precursor was
treated with a mixture of NH3 and O2 at 875 °C for 24 h in a tube furnace with flow
rates of 10 L·h–1 and 0.03 L·h–1 for ammonia and oxygen, respectively. After that
treatment the sample was cooled down rapidly to ambient temperature (~ 30 min).
5.3.2. Chemical and structural characterization
The products were characterized by X-ray powder diffraction using a PANalytical
X'Pert PRO diffractometer (Bragg-Brentano geometry, Cu-Kα radiation). All structural
refinements were performed with the program FullProf Suite Version 2009 by applying
Publication 2 56
a pseudo-Voigt function.[12] Nitrogen and oxygen contents were determined using the
hot gas extraction method (LECO TC-300/EF-300). For calibration, ZrO2 and steel
(LECO calibration sample, N: 5000 ppm) were used as standard materials. The accuracy
is ~ 2 % for the presented N/O content. X-ray fluorescence spectrometry (XRF) was
performed using a PANalytical Axios spectrometer with an Rh-tube.
5.3.3. UV-vis spectroscopy
Diffuse reflectance spectra were collected with a Jasco V670 spectrometer using MgO
as white standard. Absorbance spectra were calculated from the measured diffuse
reflectance with the Kubelka-Munk function. The optical band gap was determined
using the Derivation of absorption spectrum fitting (DASF) method of Souiri et al.,
which is described in detail elsewhere. [13–16] The final equations for this method are:
ln �𝐴𝐴(𝜆𝜆)𝜆𝜆� = ln(𝐷𝐷) + 𝑚𝑚ln (1
𝜆𝜆− 1
𝜆𝜆𝑏𝑏𝑏𝑏) (1)
and 𝑑𝑑{ln[𝐴𝐴(𝜆𝜆) 𝜆𝜆⁄ ]}
𝑑𝑑(1 𝜆𝜆⁄ )= 𝑚𝑚
(1𝜆𝜆 − 1𝜆𝜆𝑏𝑏𝑏𝑏
) (2)
A(λ) is the absorbance calculated from the Kubelka-Munk function, the value of m
denotes the nature (direct, indirect, forbidden) of the transition, D is a proportional
constant, and λbg the wavelength corresponding to the band gap energy.
5.3.4. Quantum-chemical methods
The electronic structure of Ba3Ta5O15, Ba3Ta5O14N, and LaBa2Ta5O13N2 was calculated
with the crystalline-orbital program CRYSTAL14 [17] applying the range-separated
hybrid method HSE06.[18] This approach was found to provide best agreement
between theory and experiment for the band gap of Ba3Ta5O14N in a previous study.[19]
The present calculations differ from those of Ref. [19] by slight variations in the atomic
basis sets. The following basis sets were used: O and N were described with slightly
modified pob-TZVP all-electron basis sets;[20] for the heavy elements (Ba, La, and Ta)
effective core potentials and valence basis sets of the Stuttgart-Dresden group were
employed.[21–23] The most diffuse shells had to be removed in order to obtain
numerically stable results in the self-consistent field procedure. The dependence of the
calculated band gaps from computational accuracy parameters was checked, and
Publication 2 57
converged Monkhorst-Pack grids (8×8×8) and integral truncation thresholds
(7,7,7,14,42) were used. The lattice parameters of the three compounds were taken from
this work, from Ref. [19], and from Ref. [24].
5.3.5. Photocatalysis
Photocatalytic hydrogen evolution tests were performed in a self-made semi-batch
reactor with a total reactor volume of 600 mL. The photoreactor system, consisting of a
double-walled inner lamp cooling part made out of fused silica and a double-walled
reactor reservoir made of borosilicate glass, being connected to each other, was cooled
by a cryostat (LAUDA) to a temperature of 10 °C. A 700 W Hg mid-pressure
immersion lamp (UV-Consulting Peschl®; TQ 718), set to a power of 500 W, was
utilized as irradiation source. Evolved gases were analyzed online with a multi
component detection unit (XStream Emerson Process Management). Concentrations of
produced hydrogen, oxygen, and carbon dioxide were determined via thermal
conductivity, magnetic measurements, and infrared spectroscopy, respectively. A
constant argon carrier gas flow of 50 NmL/min was adjusted by a mass flow controller
(Bronkhorst) for a steady transport of produced gases from the photoreactor to the
detection unit.[19]
300 mg of LaBa2Ta5O13N2 were suspended in a reaction solution containing 550 mL
water and 50 mL methanol. Prior, LaBa2Ta5O13N2 was pretreated in the ultrasonic bath
for 10 min at 30 °C in order to obtain complete dispersion of the photocatalyst material
in the reaction solution. The photoreactor system was purged by an argon stream of 100
NmL/min for 30 min to remove all atmospheric contaminations from the tubings as well
as from the photoreactor itself. A Rh co-catalyst loading of 0.0125 wt%, found as being
optimum in previous studies with comparable photocatalysts [19,25,26] was in-situ
deposited on the LaBa2Ta5O13N2 surface via reductive photodeposition by injecting a
specific amount of a 1 mM precursor solution containing Na3RhCl6 (99.999 %, Aldrich)
into the photocatalyst suspension. In order to simulate visible light irradiation a lamp
cooling device consisting of borosilicate glass, which cuts off UV light emission from
the used irradiation source, was used. In all experiments the suspension temperature was
held at 13 °C.
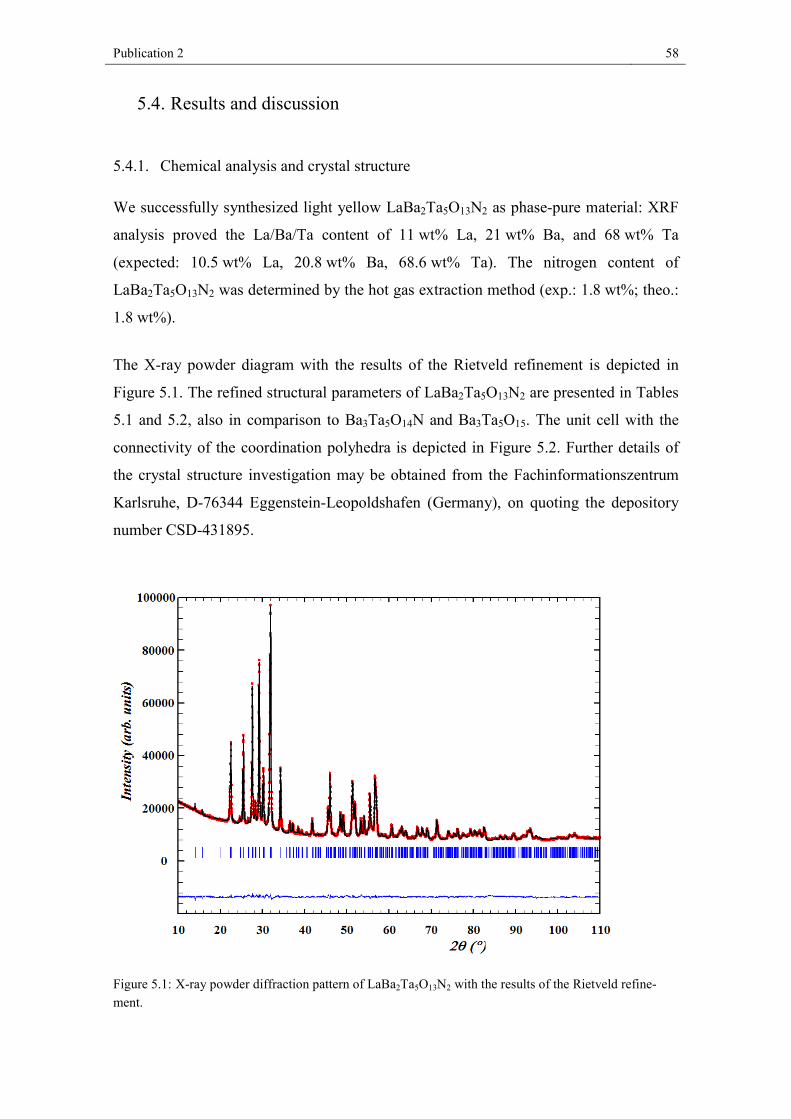
Publication 2 58
5.4. Results and discussion
5.4.1. Chemical analysis and crystal structure
We successfully synthesized light yellow LaBa2Ta5O13N2 as phase-pure material: XRF
analysis proved the La/Ba/Ta content of 11 wt% La, 21 wt% Ba, and 68 wt% Ta
(expected: 10.5 wt% La, 20.8 wt% Ba, 68.6 wt% Ta). The nitrogen content of
LaBa2Ta5O13N2 was determined by the hot gas extraction method (exp.: 1.8 wt%; theo.:
1.8 wt%).
The X-ray powder diagram with the results of the Rietveld refinement is depicted in
Figure 5.1. The refined structural parameters of LaBa2Ta5O13N2 are presented in Tables
5.1 and 5.2, also in comparison to Ba3Ta5O14N and Ba3Ta5O15. The unit cell with the
connectivity of the coordination polyhedra is depicted in Figure 5.2. Further details of
the crystal structure investigation may be obtained from the Fachinformationszentrum
Karlsruhe, D-76344 Eggenstein-Leopoldshafen (Germany), on quoting the depository
number CSD-431895.
Figure 5.1: X-ray powder diffraction pattern of LaBa2Ta5O13N2 with the results of the Rietveld refine-ment.
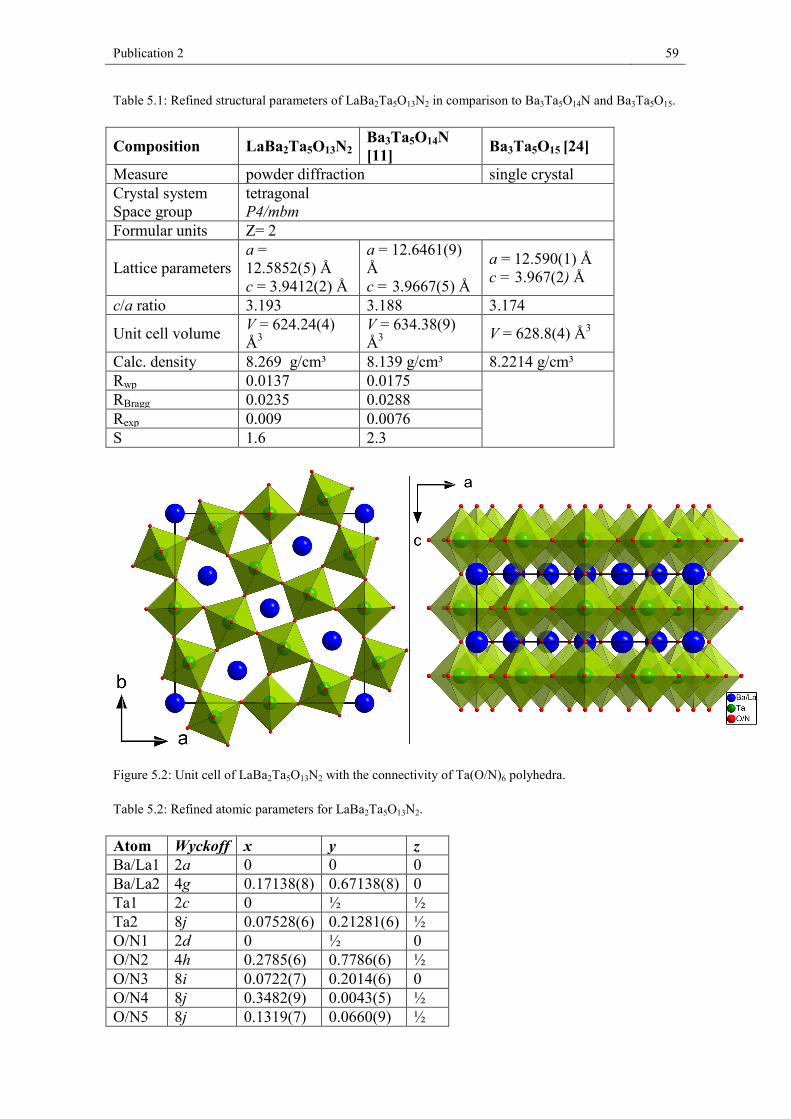
Publication 2 59
Table 5.1: Refined structural parameters of LaBa2Ta5O13N2 in comparison to Ba3Ta5O14N and Ba3Ta5O15.
Composition LaBa2Ta5O13N2 Ba3Ta5O14N [11] Ba3Ta5O15 [24]
Measure powder diffraction single crystal Crystal system Space group
tetragonal P4/mbm
Formular units Z= 2
Lattice parameters a = 12.5852(5) Å c = 3.9412(2) Å
a = 12.6461(9) Å c = 3.9667(5) Å
a = 12.590(1) Å c = 3.967(2) Å
c/a ratio 3.193 3.188 3.174
Unit cell volume V = 624.24(4) Å3
V = 634.38(9) Å3 V = 628.8(4) Å3
Calc. density 8.269 g/cm³ 8.139 g/cm³ 8.2214 g/cm³ Rwp 0.0137 0.0175
RBragg 0.0235 0.0288 Rexp 0.009 0.0076 S 1.6 2.3
Figure 5.2: Unit cell of LaBa2Ta5O13N2 with the connectivity of Ta(O/N)6 polyhedra.
Table 5.2: Refined atomic parameters for LaBa2Ta5O13N2.
Atom Wyckoff x y z Ba/La1 2a 0 0 0 Ba/La2 4g 0.17138(8) 0.67138(8) 0 Ta1 2c 0 ½ ½ Ta2 8j 0.07528(6) 0.21281(6) ½ O/N1 2d 0 ½ 0 O/N2 4h 0.2785(6) 0.7786(6) ½ O/N3 8i 0.0722(7) 0.2014(6) 0 O/N4 8j 0.3482(9) 0.0043(5) ½ O/N5 8j 0.1319(7) 0.0660(9) ½
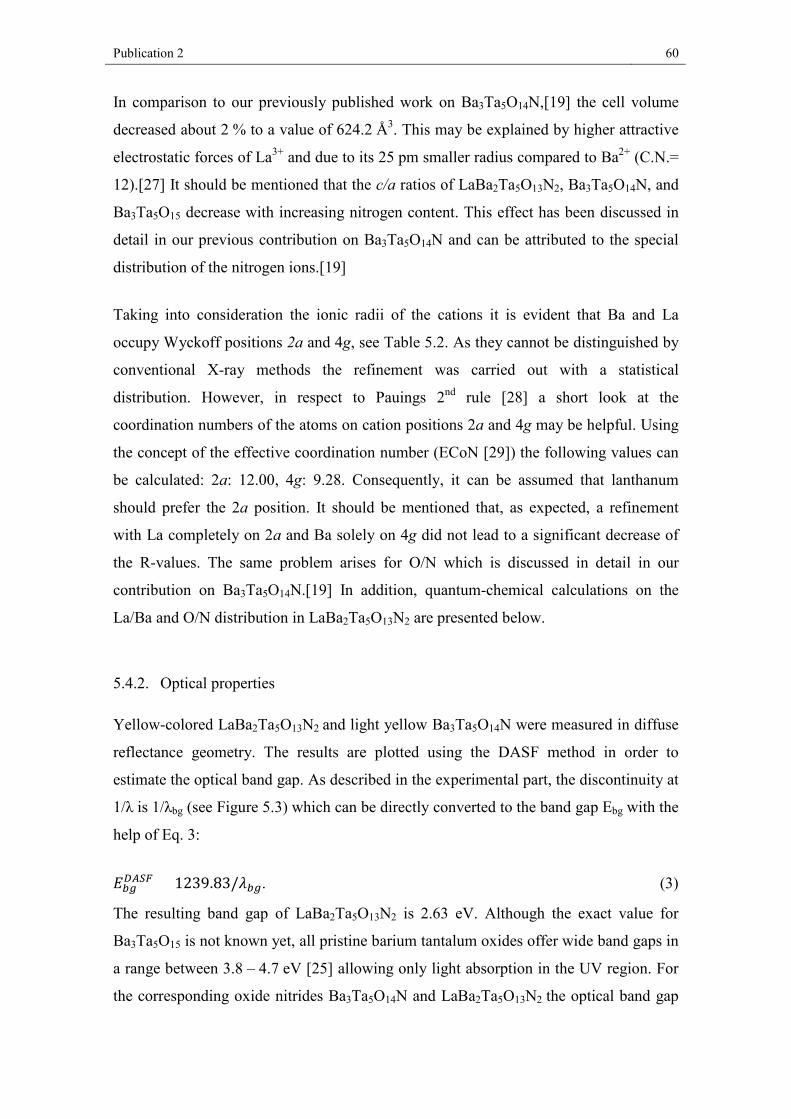
Publication 2 60
In comparison to our previously published work on Ba3Ta5O14N,[19] the cell volume
decreased about 2 % to a value of 624.2 Å3. This may be explained by higher attractive
electrostatic forces of La3+ and due to its 25 pm smaller radius compared to Ba2+ (C.N.=
12).[27] It should be mentioned that the c/a ratios of LaBa2Ta5O13N2, Ba3Ta5O14N, and
Ba3Ta5O15 decrease with increasing nitrogen content. This effect has been discussed in
detail in our previous contribution on Ba3Ta5O14N and can be attributed to the special
distribution of the nitrogen ions.[19]
Taking into consideration the ionic radii of the cations it is evident that Ba and La
occupy Wyckoff positions 2a and 4g, see Table 5.2. As they cannot be distinguished by
conventional X-ray methods the refinement was carried out with a statistical
distribution. However, in respect to Pauings 2nd rule [28] a short look at the
coordination numbers of the atoms on cation positions 2a and 4g may be helpful. Using
the concept of the effective coordination number (ECoN [29]) the following values can
be calculated: 2a: 12.00, 4g: 9.28. Consequently, it can be assumed that lanthanum
should prefer the 2a position. It should be mentioned that, as expected, a refinement
with La completely on 2a and Ba solely on 4g did not lead to a significant decrease of
the R-values. The same problem arises for O/N which is discussed in detail in our
contribution on Ba3Ta5O14N.[19] In addition, quantum-chemical calculations on the
La/Ba and O/N distribution in LaBa2Ta5O13N2 are presented below.
5.4.2. Optical properties
Yellow-colored LaBa2Ta5O13N2 and light yellow Ba3Ta5O14N were measured in diffuse
reflectance geometry. The results are plotted using the DASF method in order to
estimate the optical band gap. As described in the experimental part, the discontinuity at
1/λ is 1/λbg (see Figure 5.3) which can be directly converted to the band gap Ebg with the
help of Eq. 3:
𝐸𝐸𝑜𝑜𝐵𝐵𝐷𝐷𝐴𝐴𝐷𝐷𝐷𝐷 = 1239.83/𝑛𝑛𝑜𝑜𝐵𝐵. (3)
The resulting band gap of LaBa2Ta5O13N2 is 2.63 eV. Although the exact value for
Ba3Ta5O15 is not known yet, all pristine barium tantalum oxides offer wide band gaps in
a range between 3.8 – 4.7 eV [25] allowing only light absorption in the UV region. For
the corresponding oxide nitrides Ba3Ta5O14N and LaBa2Ta5O13N2 the optical band gap
Publication 2 61
is reduced to 2.74 eV and 2.63 eV, respectively. Such a narrowing is the expected
behavior for increasing the nitrogen content in oxide-based materials. [10]
Figure 5.3: Plot of d{ln(A/λ)}/d(1/λ) versus (1/λ) for Ba3Ta5O14N (black) and LaBa2Ta5O13N2 (red).
5.4.3. Quantum-chemical calculations
In the previous study on Ba3Ta5O14N [19] a strong dependence of the calculated
fundamental band gap from the O/N distribution was found. The values ranged from
1.4 eV to 3.2 eV, with a monotonous decrease with decreasing stability. The most stable
configuration (denoted as O/N(2)) contained both nitrogen atoms on 4h sites. All other
distributions were less stable by more than 0.5 eV. It is therefore not likely that these
will play an important role under ambient conditions unless they are kinetically
stabilized during preparation. For this reason the computational study of
LaBa2Ta5O13N2 focused on the O/N configuration where all 4h sites are occupied by N
atoms. Test calculations with selected other O/N configurations confirmed that these
have a much higher energy, with an energy difference comparable to Ba3Ta5O14N. Also
the Ba/La distribution was studied with HSE06. The theoretical results confirmed
Pauling’s second rule (vide supra). The configuration with both La atoms occupying the
2a site is by 1.3 eV more stable that a 2a/4g distribution. Therefore only the most stable
anion and cation configuration were considered for band gap calculations. The
optimized atom positions are given in Table 5.3. The deviations from the measured
coordinates are not larger than 0.007, which could be considered as a reasonable
agreement. However, while the calculated M-O distances agree with the measured
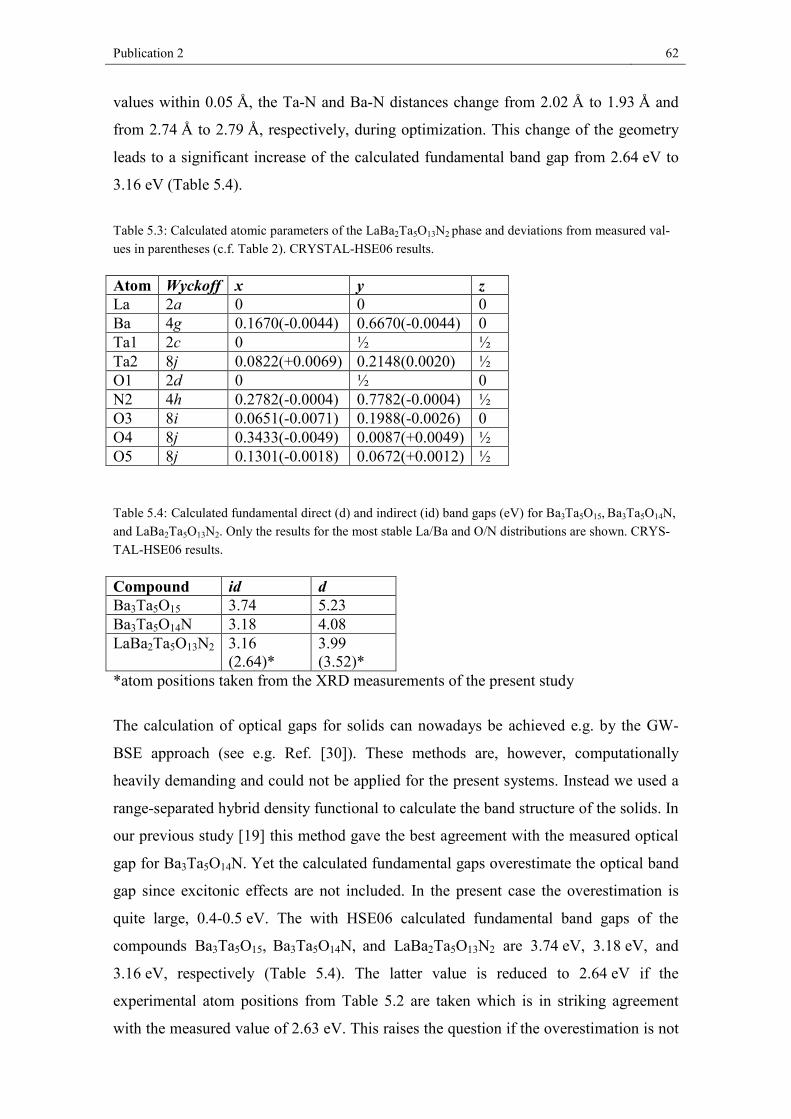
Publication 2 62
values within 0.05 Å, the Ta-N and Ba-N distances change from 2.02 Å to 1.93 Å and
from 2.74 Å to 2.79 Å, respectively, during optimization. This change of the geometry
leads to a significant increase of the calculated fundamental band gap from 2.64 eV to
3.16 eV (Table 5.4).
Table 5.3: Calculated atomic parameters of the LaBa2Ta5O13N2 phase and deviations from measured val-ues in parentheses (c.f. Table 2). CRYSTAL-HSE06 results.
Atom Wyckoff x y z La 2a 0 0 0 Ba 4g 0.1670(-0.0044) 0.6670(-0.0044) 0 Ta1 2c 0 ½ ½ Ta2 8j 0.0822(+0.0069) 0.2148(0.0020) ½ O1 2d 0 ½ 0 N2 4h 0.2782(-0.0004) 0.7782(-0.0004) ½ O3 8i 0.0651(-0.0071) 0.1988(-0.0026) 0 O4 8j 0.3433(-0.0049) 0.0087(+0.0049) ½ O5 8j 0.1301(-0.0018) 0.0672(+0.0012) ½
Table 5.4: Calculated fundamental direct (d) and indirect (id) band gaps (eV) for Ba3Ta5O15, Ba3Ta5O14N, and LaBa2Ta5O13N2. Only the results for the most stable La/Ba and O/N distributions are shown. CRYS-TAL-HSE06 results.
Compound id d Ba3Ta5O15 3.74 5.23 Ba3Ta5O14N 3.18 4.08 LaBa2Ta5O13N2 3.16
(2.64)* 3.99 (3.52)*
*atom positions taken from the XRD measurements of the present study
The calculation of optical gaps for solids can nowadays be achieved e.g. by the GW-
BSE approach (see e.g. Ref. [30]). These methods are, however, computationally
heavily demanding and could not be applied for the present systems. Instead we used a
range-separated hybrid density functional to calculate the band structure of the solids. In
our previous study [19] this method gave the best agreement with the measured optical
gap for Ba3Ta5O14N. Yet the calculated fundamental gaps overestimate the optical band
gap since excitonic effects are not included. In the present case the overestimation is
quite large, 0.4-0.5 eV. The with HSE06 calculated fundamental band gaps of the
compounds Ba3Ta5O15, Ba3Ta5O14N, and LaBa2Ta5O13N2 are 3.74 eV, 3.18 eV, and
3.16 eV, respectively (Table 5.4). The latter value is reduced to 2.64 eV if the
experimental atom positions from Table 5.2 are taken which is in striking agreement
with the measured value of 2.63 eV. This raises the question if the overestimation is not
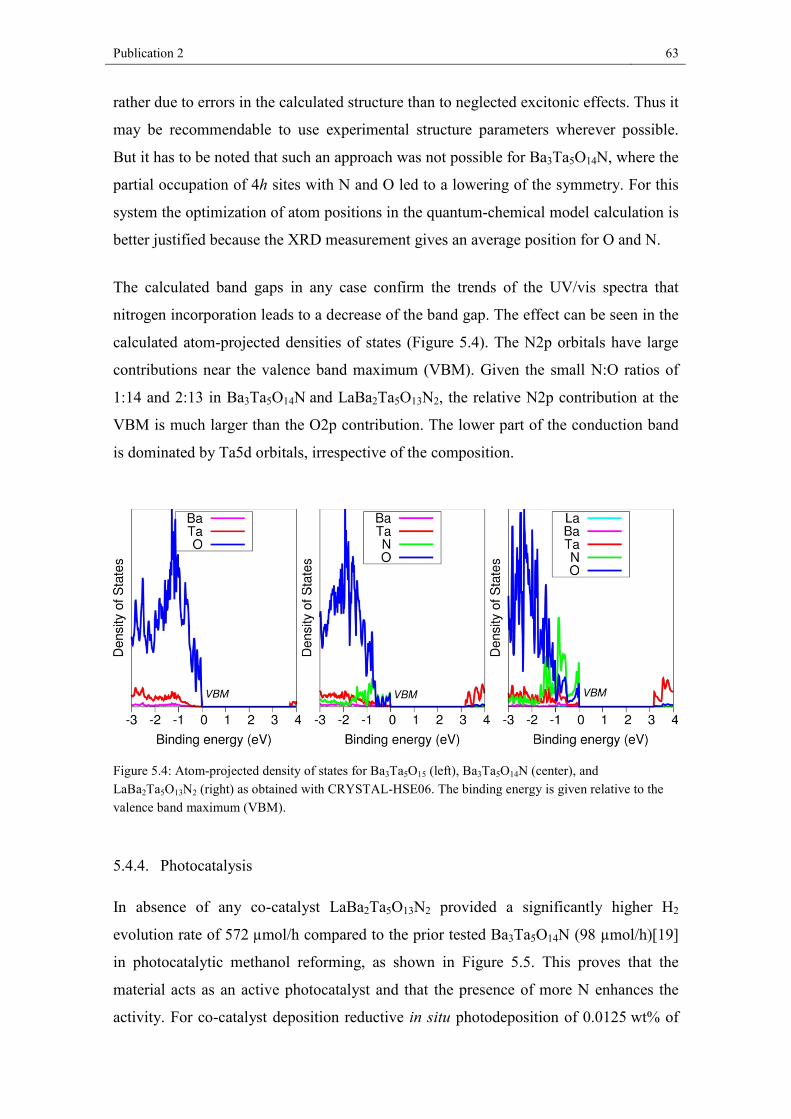
Publication 2 63
rather due to errors in the calculated structure than to neglected excitonic effects. Thus it
may be recommendable to use experimental structure parameters wherever possible.
But it has to be noted that such an approach was not possible for Ba3Ta5O14N, where the
partial occupation of 4h sites with N and O led to a lowering of the symmetry. For this
system the optimization of atom positions in the quantum-chemical model calculation is
better justified because the XRD measurement gives an average position for O and N.
The calculated band gaps in any case confirm the trends of the UV/vis spectra that
nitrogen incorporation leads to a decrease of the band gap. The effect can be seen in the
calculated atom-projected densities of states (Figure 5.4). The N2p orbitals have large
contributions near the valence band maximum (VBM). Given the small N:O ratios of
1:14 and 2:13 in Ba3Ta5O14N and LaBa2Ta5O13N2, the relative N2p contribution at the
VBM is much larger than the O2p contribution. The lower part of the conduction band
is dominated by Ta5d orbitals, irrespective of the composition.
Figure 5.4: Atom-projected density of states for Ba3Ta5O15 (left), Ba3Ta5O14N (center), and LaBa2Ta5O13N2 (right) as obtained with CRYSTAL-HSE06. The binding energy is given relative to the valence band maximum (VBM).
5.4.4. Photocatalysis
In absence of any co-catalyst LaBa2Ta5O13N2 provided a significantly higher H2
evolution rate of 572 µmol/h compared to the prior tested Ba3Ta5O14N (98 µmol/h)[19]
in photocatalytic methanol reforming, as shown in Figure 5.5. This proves that the
material acts as an active photocatalyst and that the presence of more N enhances the
activity. For co-catalyst deposition reductive in situ photodeposition of 0.0125 wt% of
Publication 2 64
Rh was executed on the LaBa2Ta5O13N2 surface. However, this photodeposition of Rh
particles only led to a slight increase in the H2 rate of approximately 654 µmol/h. A
corresponding small effect of the photocatalyst surface modification on the
photocatalytic performance was also observed in case of Ba3Ta5O14N.[19] This similar
behavior of both photocatalysts leads to the assumption that the incorporation of La and
the involved enhanced nitrogen incorporation do not lead to significant changes in the
chemistry of their surface states. The present surface states, e.g. oxygen vacancies,
determine the amount of reaction sites as well as the adsorption properties of the
photocatalyst material. Rhodium nanoparticles are typically deposited at sites on the
tantalate surface at which electrons are exposed and also hydrogen is formed. Typically,
the rhodium attracts the electrons and thus enhances the charge carrier separation
suppressing partly the unwanted electron-hole recombination in the
photocatalyst.[25,26] However, for Ba3Ta5O14N as well as LaBa2Ta5O13N2 this charge
separation seems not to be very attractive possibly because a high Schottky barrier is
formed.
The activity increase of LaBa2Ta5O13N2 compared to Ba3Ta5O14N originates from
changed bulk properties manifested in a decreased band gap and improved light
absorption ability. Nevertheless, the improved photocatalytic activity of LaBa2Ta5O13N2
could only be observed under UV light irradiation. Activity investigations under
simulated visible light conditions, realized by use of a lamp cooling device consisting of
borosilicate glass and absorbing the UV emitted by the lamp, were not successful. The
reduced band gap of LaBa2Ta5O13N2 compared to Ba3Ta5O14N should favor the visible
light activity, but on the other hand the progressed nitrogen incorporation might
increase the amount of crystal defects acting as trap states and increasing the
recombination probability of electrons and holes. The bulk and surface recombination
rates are so high that almost no electrons reach surface sites at which they can react with
the water and methanol molecules.
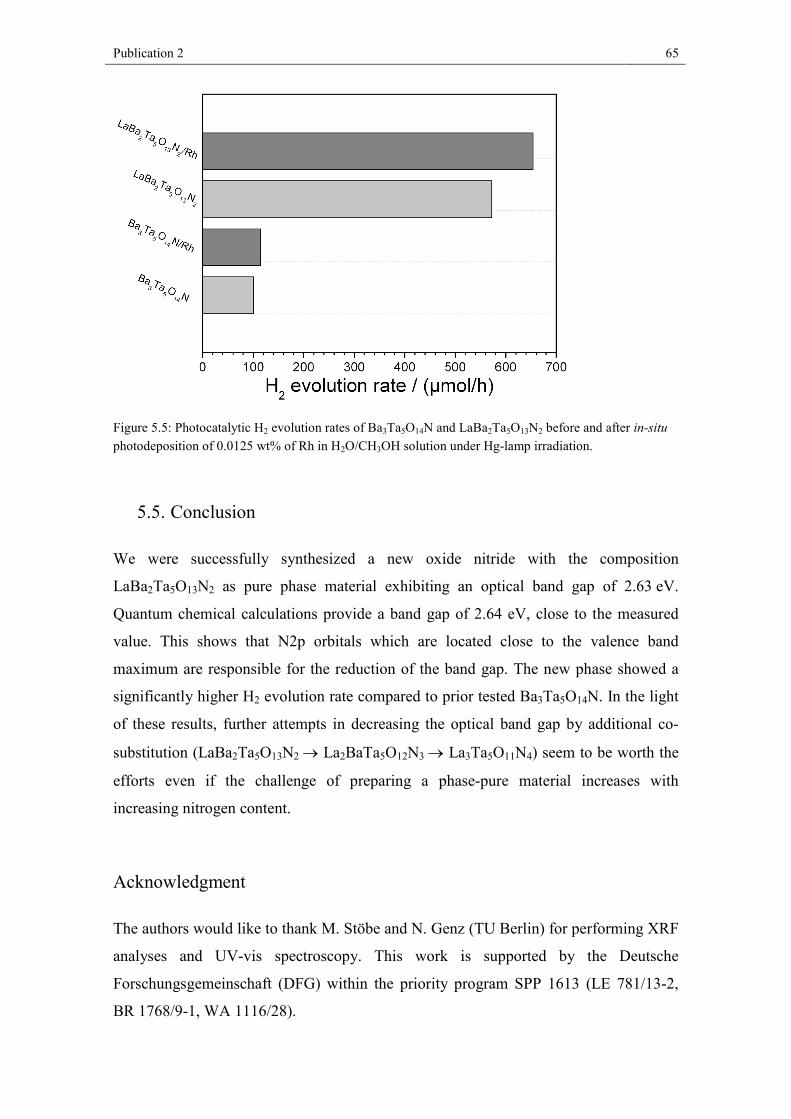
Publication 2 65
Figure 5.5: Photocatalytic H2 evolution rates of Ba3Ta5O14N and LaBa2Ta5O13N2 before and after in-situ photodeposition of 0.0125 wt% of Rh in H2O/CH3OH solution under Hg-lamp irradiation.
5.5. Conclusion
We were successfully synthesized a new oxide nitride with the composition
LaBa2Ta5O13N2 as pure phase material exhibiting an optical band gap of 2.63 eV.
Quantum chemical calculations provide a band gap of 2.64 eV, close to the measured
value. This shows that N2p orbitals which are located close to the valence band
maximum are responsible for the reduction of the band gap. The new phase showed a
significantly higher H2 evolution rate compared to prior tested Ba3Ta5O14N. In the light
of these results, further attempts in decreasing the optical band gap by additional co-
substitution (LaBa2Ta5O13N2 → La2BaTa5O12N3 → La3Ta5O11N4) seem to be worth the
efforts even if the challenge of preparing a phase-pure material increases with
increasing nitrogen content.
Acknowledgment
The authors would like to thank M. Stöbe and N. Genz (TU Berlin) for performing XRF
analyses and UV-vis spectroscopy. This work is supported by the Deutsche
Forschungsgemeinschaft (DFG) within the priority program SPP 1613 (LE 781/13-2,
BR 1768/9-1, WA 1116/28).
Publication 2 66
References
[1] K. Domen, J. Catal. 1986, 102, 92. [2] H. Kato, K. Asakura, A. Kudo, J. Am. Chem. Soc. 2003, 125, 3082. [3] A. Kudo, J. Catal. 1988, 111, 67. [4] D. Yokoyama, H. Hashiguchi, K. Maeda, T. Minegishi, T. Takata, R. Abe, J. Ku-
bota, K. Domen, Thin Solid Films 2011, 519, 2087. [5] L. Xi, J. Y. Lek, Y. N. Liang, C. Boothroyd, W. Zhou, Q. Yan, X. Hu, F. B. Y.
Chiang, Y. M. Lam, Nanotechnology 2011, 22, 275706. [6] M. Higashi, Y. Yamanaka, O. Tomita, R. Abe, APL Mater. 2015, 3, 104418. [7] M. Higashi, K. Domen, R. Abe, J. Am. Chem. Soc. 2013, 135, 10238. [8] M. Hara, J. Nunoshige, T. Takata, J. N. Kondo, K. Domen, Chem. Commun. 2003. [9] K. Ueda, H. Kato, M. Kobayashi, M. Hara, M. Kakihana, J. Mater. Chem. A 2013,
1, 3667. [10] K. Domen, M. Hara, J. N. Kondo, T. Takata, A. Kudo, H. Kobayashi, Y. Inoue,
Korean J. Chem. Eng. 2001, 18, 862. [11] M. P. Pechini, US Pat. No.3.330.697 1967. [12] J. Rodriguez-Carvajal, Physica B 1993, 55, 192. [13] D. Souri, K. Shomalian, J. Non-Cryst. Solids 2009, 355, 1597. [14] D. Souri, Z. E. Tahan, Appl. Phys. B 2015, 119, 273. [15] L. Escobar-Alarcón, A. Arrieta, E. Camps, S. Muhl, S. Rodil, E. Vigueras-
Santiago, Appl. Surf. Sci. 2007, 254, 412. [16] N. Ghobadi, M. Ganji, C. Luna, A. Arman, A. Ahmadpourian, J Mater Sci: Mater
Electron 2016, 27, 2800. [17] R. Dovesi, R. Orlando, A. Erba, C. M. Zicovich-Wilson, B. Civalleri, S. Casassa,
L. Maschio, M. Ferrabone, M. de La Pierre, P. D'Arco, Y. Noël, M. Causà, M. Ré-rat, B. Kirtman, Int. J. Quantum Chem. 2014, 114, 1287.
[18] J. Heyd, G. E. Scuseria, M. Ernzerhof, J. Chem. Phys. 2006, 124, 219906. [19] B. Anke, T. Bredow, J. Soldat, M. Wark, M. Lerch, J. Solid State Chem. 2016, 233,
282. [20] M. F. Peintinger, D. V. Oliveira, T. Bredow, J. Comput. Chem. 2013, 34, 451. [21] D. Andrae, U. Haeussermann, M. Dolg, H. Stoll, H. Preuss, Theoret. Chim. Acta
1990, 77, 123. [22] M. Kaupp, P. v. R. Schleyer, H. Stoll, H. Preuss, J. Chem. Phys. 1991, 94, 1360. [23] J. Yang, M. Dolg, Theor Chem Acc 2005, 113, 212. [24] C. R. Feger, R. P. Ziebarth, Chem. Mater. 1995, 7, 373. [25] J. Soldat, R. Marschall, M. Wark, Chem. Sci. 2014, 5, 3746. [26] R. Marschall, J. Soldat, G. W. Busser, M. Wark, Photochem. Photobiol. Sci. 2013,
12, 671. [27] R. D. Shannon, Acta Cryst A 1976, 32, 751. [28] A. Fuertes, Inorg. Chem. 2006, 45, 9640. [29] R. Hoppe, Angew. Chem. 1970, 82, 7. [30] R. Starke, G. Kresse, Phys. Rev. B 2012, 85.

Publication 2 67
Publication 3 68
6. Publication 3
Improved photoelectrochemical performance of bismuth van-adate by partial O/F-substitution B. Anke, M. Rohloff, M.G. Willinger, W. Hetaba, A. Fischer, M. Lerch
published Solid State Sciences 63 (2017) 1–8 doi: 10.1016/j.solidstatesciences.2016.11.004 https://doi.org/10.1016/j.solidstatesciences.2016.11.004 Contribution to publication: B. Anke: Sample preparation, chemical analysis and crystal structure analysis, UV-Vis interpretation, density determination, and writing. M. Rohloff: Measurements (photocatalysis), evaluation. M. G. Willinger: General discussion, proofreading. W. Hetaba: Measurements (EDX / TEM) A. Fischer: General discussion, proofreading. M. Lerch: General advice and helpful comments, proofreading
Publication 3 69
Authors: B. Anke,a,1 M. Rohloff,a,b,1 M.G. Willinger,c W. Hetaba,c,d A. Fischer,*b M. Lerch*a
a Institut für Chemie, Technische Universität Berlin, Straße des 17. Juni 135, 10623 Berlin b Institut für Anorganische Chemie, Albert-Ludwigs-Universität Freiburg, Albertstraße 21, 79104 Freiburg c Department of Inorganic Chemistry, Fritz Haber Institute of the Max Planck Society, Faradayweg 4-6, 14195 Berlin d Department of Heterogeneous Reactions, Max-Planck-Institute for Chemical Energy Conversion, Stiftstraße 34-36, 45470 Mülheim an der Ruhr 1 These authors contributed equally to the research
*corresponding authors
Keywords: BiVO4; O/F-substitution; crystal structure; optical properties;
water oxidation; photoelectrochemical water splitting
Publication 3 70
6.1. Abstract
Fluorine-containing bismuth vanadate (F:BiVO4) powder was synthesized using a new,
clean, and simple solid-vapor reaction. Incorporation of fluorine mainly leads to the
formation of cation vacancies. Electrodes were fabricated from the pre-synthesized
powder samples by electrophoretic deposition onto fluorine-doped tin oxide coated
glass slides and subsequent calcination. The photoelectrochemical performance
concerning the water oxidation reaction was investigated and compared to pristine
BiVO4 revealing strongly enhanced photoelectrochemical behaviour for the F-
containing BiVO4.
6.2. Introduction
In the past years a lot of attention was paid to the semiconductor bismuth vanadate
BiVO4, because of its outstanding catalytic properties. Since Kudo et al.[1] discovered
BiVO4 to be a photoactive material it is not only used as brilliant, non-toxic yellow
pigment[2,3] but also as catalyst for the photodegradation of organic pollutants.[4-7]
Today, most attention is paid to the use of BiVO4 as photoanode material for water
splitting under visible-light irradiation.[8]
There are many parameters influencing the photoelectrochemical performance of
semiconductors with respect to water splitting.[9] For instance, the crystal structure of a
semiconductor material like BiVO4 is a very important factor to be considered. At
ambient pressure BiVO4 exhibits three important polymorphs crystallizing either in the
scheelite-type structure (monoclinic, tetragonal) or in the tetragonal zirkon-type
structure. Among these three polymorphs, the monoclinic phase shows the highest
photoelectrochemical performance for water oxidation: a result which is ascribed to the
smaller band gap of the monoclinic phase (2.4 eV) compared to the one of tetragonal
zircon-type structure (3.1 eV).[10]
Another way to influence the photoelectrochemical behaviour of a semiconductor is to
change its electronic structure by, for example, partial cation substitution. Molybdenum
and tungsten were found to be suitable cationic dopants improving the
photoelectrochemical properties due to enhancement of the amount of free charge
carriers within the BiVO4 material.[11-17] Besides cationic doping, also anion
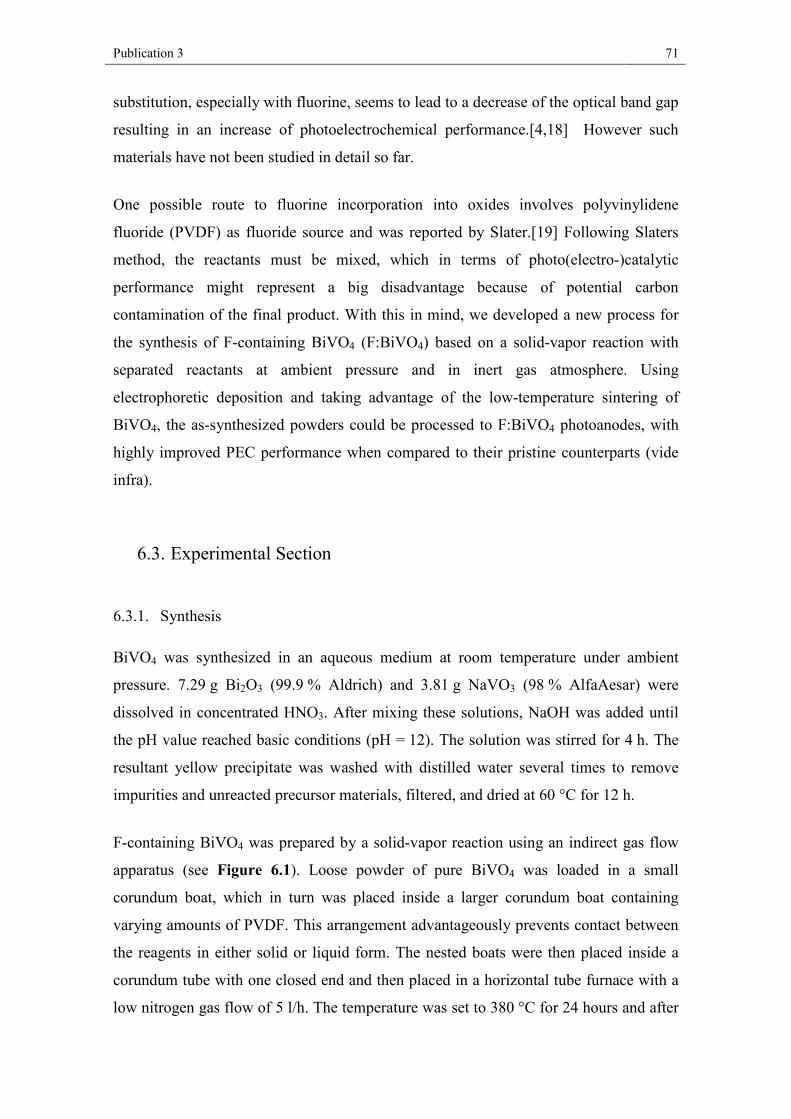
Publication 3 71
substitution, especially with fluorine, seems to lead to a decrease of the optical band gap
resulting in an increase of photoelectrochemical performance.[4,18] However such
materials have not been studied in detail so far.
One possible route to fluorine incorporation into oxides involves polyvinylidene
fluoride (PVDF) as fluoride source and was reported by Slater.[19] Following Slaters
method, the reactants must be mixed, which in terms of photo(electro-)catalytic
performance might represent a big disadvantage because of potential carbon
contamination of the final product. With this in mind, we developed a new process for
the synthesis of F-containing BiVO4 (F:BiVO4) based on a solid-vapor reaction with
separated reactants at ambient pressure and in inert gas atmosphere. Using
electrophoretic deposition and taking advantage of the low-temperature sintering of
BiVO4, the as-synthesized powders could be processed to F:BiVO4 photoanodes, with
highly improved PEC performance when compared to their pristine counterparts (vide
infra).
6.3. Experimental Section
6.3.1. Synthesis
BiVO4 was synthesized in an aqueous medium at room temperature under ambient
pressure. 7.29 g Bi2O3 (99.9 % Aldrich) and 3.81 g NaVO3 (98 % AlfaAesar) were
dissolved in concentrated HNO3. After mixing these solutions, NaOH was added until
the pH value reached basic conditions (pH = 12). The solution was stirred for 4 h. The
resultant yellow precipitate was washed with distilled water several times to remove
impurities and unreacted precursor materials, filtered, and dried at 60 °C for 12 h.
F-containing BiVO4 was prepared by a solid-vapor reaction using an indirect gas flow
apparatus (see Figure 6.1). Loose powder of pure BiVO4 was loaded in a small
corundum boat, which in turn was placed inside a larger corundum boat containing
varying amounts of PVDF. This arrangement advantageously prevents contact between
the reagents in either solid or liquid form. The nested boats were then placed inside a
corundum tube with one closed end and then placed in a horizontal tube furnace with a
low nitrogen gas flow of 5 l/h. The temperature was set to 380 °C for 24 hours and after
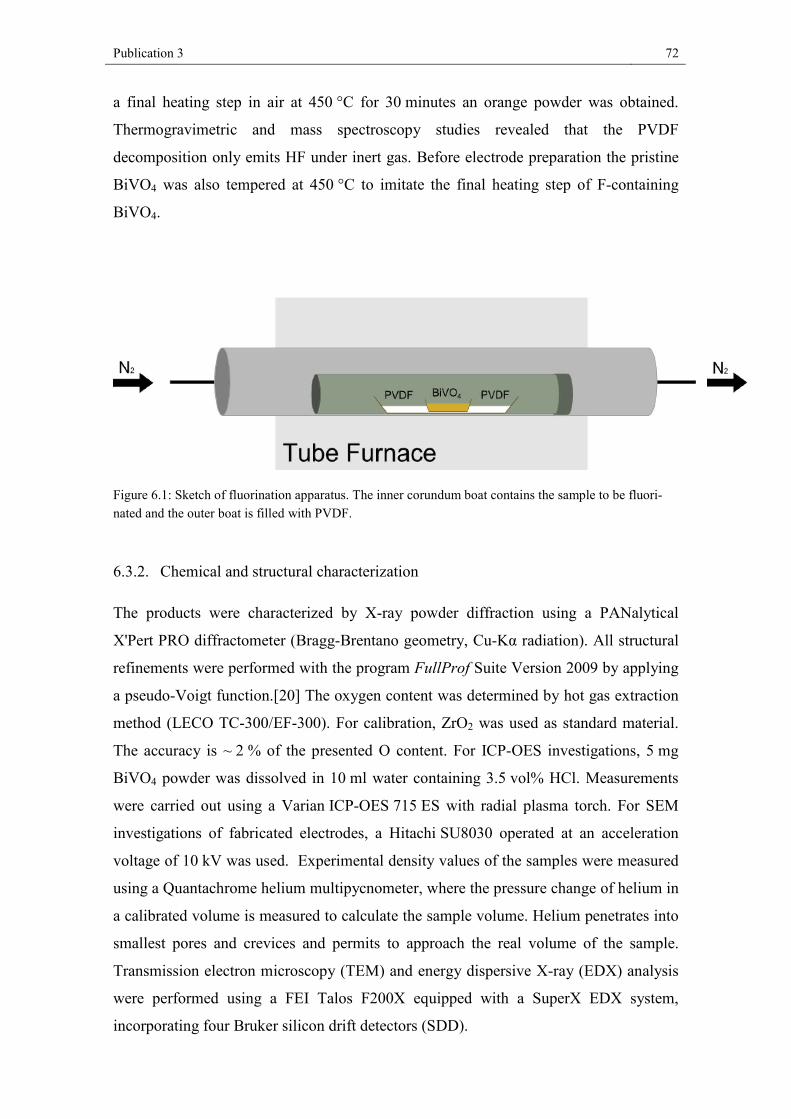
Publication 3 72
a final heating step in air at 450 °C for 30 minutes an orange powder was obtained.
Thermogravimetric and mass spectroscopy studies revealed that the PVDF
decomposition only emits HF under inert gas. Before electrode preparation the pristine
BiVO4 was also tempered at 450 °C to imitate the final heating step of F-containing
BiVO4.
Figure 6.1: Sketch of fluorination apparatus. The inner corundum boat contains the sample to be fluori-nated and the outer boat is filled with PVDF.
6.3.2. Chemical and structural characterization
The products were characterized by X-ray powder diffraction using a PANalytical
X'Pert PRO diffractometer (Bragg-Brentano geometry, Cu-Kα radiation). All structural
refinements were performed with the program FullProf Suite Version 2009 by applying
a pseudo-Voigt function.[20] The oxygen content was determined by hot gas extraction
method (LECO TC-300/EF-300). For calibration, ZrO2 was used as standard material.
The accuracy is ~ 2 % of the presented O content. For ICP-OES investigations, 5 mg
BiVO4 powder was dissolved in 10 ml water containing 3.5 vol% HCl. Measurements
were carried out using a Varian ICP-OES 715 ES with radial plasma torch. For SEM
investigations of fabricated electrodes, a Hitachi SU8030 operated at an acceleration
voltage of 10 kV was used. Experimental density values of the samples were measured
using a Quantachrome helium multipycnometer, where the pressure change of helium in
a calibrated volume is measured to calculate the sample volume. Helium penetrates into
smallest pores and crevices and permits to approach the real volume of the sample.
Transmission electron microscopy (TEM) and energy dispersive X-ray (EDX) analysis
were performed using a FEI Talos F200X equipped with a SuperX EDX system,
incorporating four Bruker silicon drift detectors (SDD).
Publication 3 73
6.3.3. UV–vis spectroscopy
Diffuse reflectance spectra were collected with a Jasco V670 spectrometer using MgO
as white standard. Absorbance spectra were calculated from the measured diffuse
reflectance with the Kubelka-Munk function: (𝑅𝑅) = (1−𝑅𝑅)²2𝑅𝑅
= 𝜀𝜀c 1𝑜𝑜 ,
where R is the reflectance, ε is the absorption coefficient, c the concentration of
absorbing species, and s the scattering coefficient. The optical band gap was
determined using the modified Tauc equation, [𝐹𝐹(𝑅𝑅)ℎ𝜈𝜈]1𝑛𝑛 = 𝐴𝐴�ℎ𝜈𝜈 − 𝐸𝐸𝐵𝐵�,with F(R) the
Kubelka-Munk function, hν the photon energy, Eg the optical band gap, and A a
proportionality constant.[21,22] The value of the exponent n denotes the nature of the
transition. A direct allowed transition is present in BiVO4: n = ½.[23,24]
6.3.4. Electrode Fabrication
An electrophoretic deposition method (EPD) based on a procedure Domen et al.
reported was used to fabricate electrodes for photoelectrochemical investigations.[25] In
a first step, the pristine as well as the F-containing powder was treated for 15 min in a
mixer mill (Retsch GmbH MM301) to provide a comparable particle size distribution
(verified by SEM-investigations). 80 mg of the respective BiVO4 powder was dispersed
in 50 ml iodine-containing acetone (2 mg I2/ml acetone) by extended ultrasonification
(27 kHz) at room temperature. Two fluorine-doped tin oxide coated glass slides (FTO)
were immersed parallel in the dispersion with 1.0 cm of distance. Particles were
deposited by application of a potential of 10 V for 5 min. This procedure was repeated
twice in total. After electrophoretic deposition, the as-prepared electrodes were calcined
at 450 °C for 30 min under air. Additionally, electrodes were also calcined at 550 °C for
30 min under air to improve PEC performance by enhanced sintering of the electrode
particles (see SI).
In order to ensure that the fluorine content of the material did not change during the
described procedures, hot gas extraction measurements were carried out after the
milling step, as well as after the heat treatment steps at 450 °C and 550 °C for 30
minutes, respectively. The determined oxygen contents are the same (18.2 wt%) for all
samples; a result which is a clear indication for the good thermal stability of the
fluorine-containing material.
Publication 3 74
6.3.5. Electrochemical Investigations
Photoelectrochemical (PEC) measurements were carried out in a 3-electrode-setup
consisting of the BiVO4- working electrode, a Pt-wire counter electrode, and a
reversible hydrogen reference electrode. The potential of the working electrode was
controlled by a potentiostat (Biologic SP‑150). Electrodes were illuminated by a
150 W Xe-lamp at a spectral range of 400-700 nm. The light intensity at the electrode
surface was adjusted to 100 mW/cm² using a Si-diode light meter. If not stated
otherwise, backside illumination (i.e. illumination via the FTO-coated glass side of the
BiVO4 photoanode) was used.
A photo-assisted electrodeposition method based on the procedure reported by Durrant
et al. was used to deposit a cobalt phosphate based water oxidation catalyst (CoPi) onto
the F:BiVO4 electrode surface.[26] The working electrode was immersed in 0.1 M
potassium phosphate buffer at pH 7.3 containing 0.5 mM cobalt nitrate and a constant
potential of 1.2 V vs. RHE was applied under illumination. To ensure a comparable
amount of deposited CoPi for all samples, the deposition was stopped after a charge of
130 mC was flown.
All j-V-measurements were conducted in a 0.1 M potassium phosphate (KPi) buffer at
pH 7.3 using a scan rate of 20 mV/s. For chronoamperometric measurements of the
photocurrent transients a potential of 1.23 V vs. RHE was applied and blue light
(440 nm) at an intensity of 1 mW/cm² was used. Staircase potentio-electrochemical
impedance spectroscopy (PEIS, Mott-Schottky Analysis) was carried out in 0.5 M KPi
buffer at pH 7.3 scanning from anodic to cathodic potentials and using a sinusoidal
modulation of 10 mV at frequencies of 500 Hz and 1 kHz.[27] An area of 0.5 cm² of
each electrode was used for measurements.
6.4. Results and discussion
6.4.1. Chemical analysis and crystal structure
We successfully synthesized orange-colored F:BiVO4 as phase-pure material. ICP-OES
analysis showed a Bi:V ratio of 0.999:1. Quantitative chemical analysis by hot gas
extraction was used to measure the amount of oxygen. In the case of pristine BiVO4 the
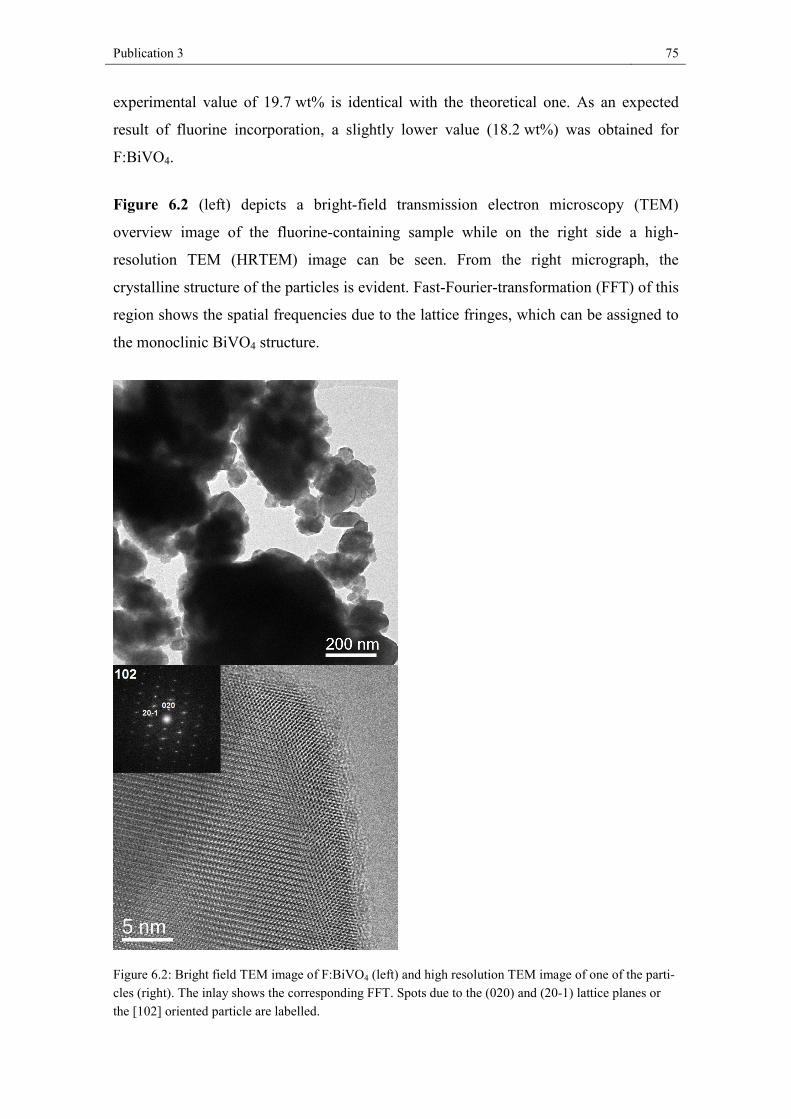
Publication 3 75
experimental value of 19.7 wt% is identical with the theoretical one. As an expected
result of fluorine incorporation, a slightly lower value (18.2 wt%) was obtained for
F:BiVO4.
Figure 6.2 (left) depicts a bright-field transmission electron microscopy (TEM)
overview image of the fluorine-containing sample while on the right side a high-
resolution TEM (HRTEM) image can be seen. From the right micrograph, the
crystalline structure of the particles is evident. Fast-Fourier-transformation (FFT) of this
region shows the spatial frequencies due to the lattice fringes, which can be assigned to
the monoclinic BiVO4 structure.
Figure 6.2: Bright field TEM image of F:BiVO4 (left) and high resolution TEM image of one of the parti-cles (right). The inlay shows the corresponding FFT. Spots due to the (020) and (20-1) lattice planes or the [102] oriented particle are labelled.
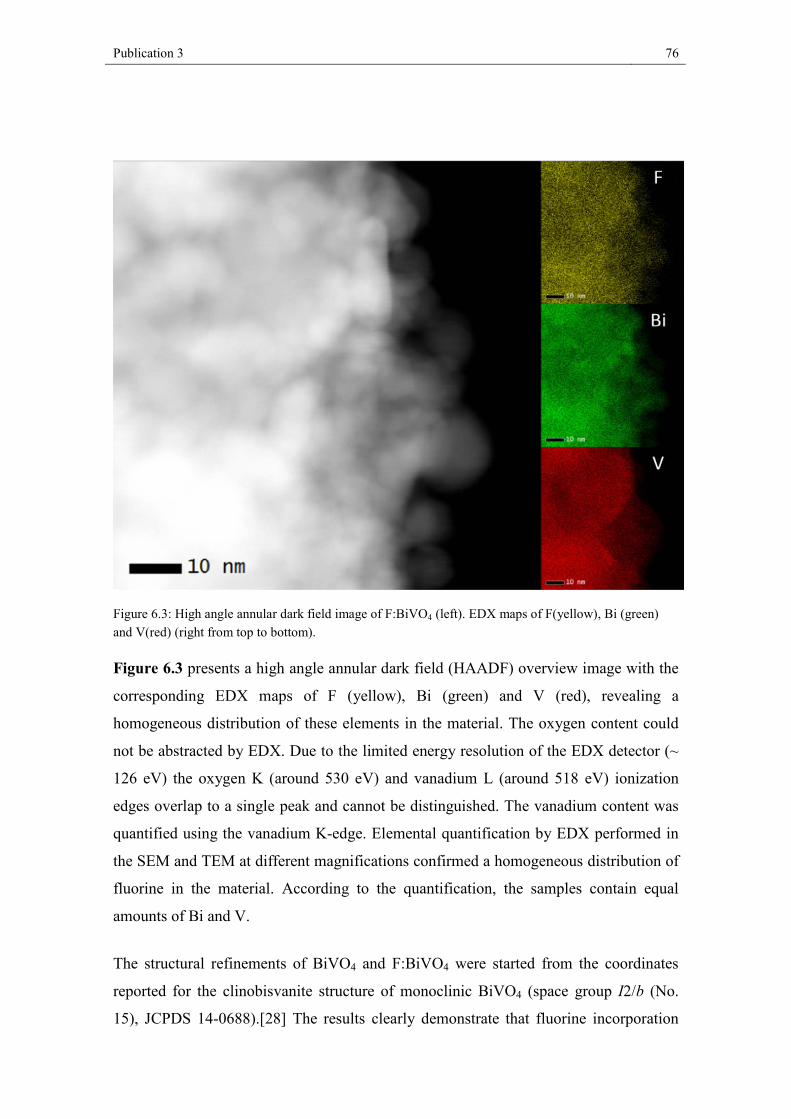
Publication 3 76
Figure 6.3: High angle annular dark field image of F:BiVO4 (left). EDX maps of F(yellow), Bi (green) and V(red) (right from top to bottom).
Figure 6.3 presents a high angle annular dark field (HAADF) overview image with the
corresponding EDX maps of F (yellow), Bi (green) and V (red), revealing a
homogeneous distribution of these elements in the material. The oxygen content could
not be abstracted by EDX. Due to the limited energy resolution of the EDX detector (~
126 eV) the oxygen K (around 530 eV) and vanadium L (around 518 eV) ionization
edges overlap to a single peak and cannot be distinguished. The vanadium content was
quantified using the vanadium K-edge. Elemental quantification by EDX performed in
the SEM and TEM at different magnifications confirmed a homogeneous distribution of
fluorine in the material. According to the quantification, the samples contain equal
amounts of Bi and V.
The structural refinements of BiVO4 and F:BiVO4 were started from the coordinates
reported for the clinobisvanite structure of monoclinic BiVO4 (space group I2/b (No.
15), JCPDS 14-0688).[28] The results clearly demonstrate that fluorine incorporation
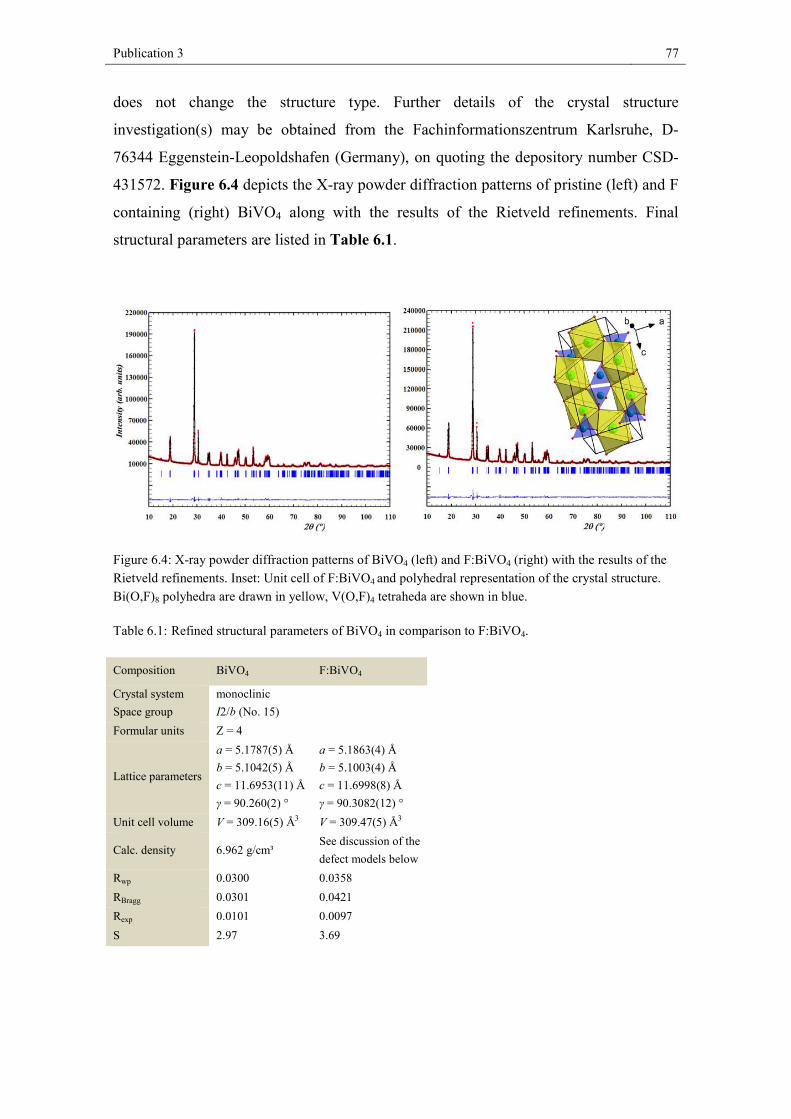
Publication 3 77
does not change the structure type. Further details of the crystal structure
investigation(s) may be obtained from the Fachinformationszentrum Karlsruhe, D-
76344 Eggenstein-Leopoldshafen (Germany), on quoting the depository number CSD-
431572. Figure 6.4 depicts the X-ray powder diffraction patterns of pristine (left) and F
containing (right) BiVO4 along with the results of the Rietveld refinements. Final
structural parameters are listed in Table 6.1.
Table 6.1: Refined structural parameters of BiVO4 in comparison to F:BiVO4.
Composition BiVO4 F:BiVO4
Crystal system Space group
monoclinic I2/b (No. 15)
Formular units Z = 4
Lattice parameters
a = 5.1787(5) Å b = 5.1042(5) Å c = 11.6953(11) Å γ = 90.260(2) °
a = 5.1863(4) Å b = 5.1003(4) Å c = 11.6998(8) Å γ = 90.3082(12) °
Unit cell volume V = 309.16(5) Å3 V = 309.47(5) Å3
Calc. density 6.962 g/cm³ See discussion of the defect models below
Rwp 0.0300 0.0358 RBragg 0.0301 0.0421 Rexp 0.0101 0.0097 S 2.97 3.69
Figure 6.4: X-ray powder diffraction patterns of BiVO4 (left) and F:BiVO4 (right) with the results of the Rietveld refinements. Inset: Unit cell of F:BiVO4 and polyhedral representation of the crystal structure. Bi(O,F)8 polyhedra are drawn in yellow, V(O,F)4 tetraheda are shown in blue.
Publication 3 78
Table 6.2: Structural parameters for BiVO4 and F:BiVO4.
The Debye-Waller factors were not refined and set identically for both phases. Whereas
the z parameters for both materials are comparable, it should be noted that x and y show
small but significant deviations. The resulting bond lengths for BiVO4 and F:BiVO4 are
given in the SI. The values can be described as more or less identical with no systematic
trend. The refined site occupation factors are most interesting. For pristine bismuth
vanadate a small but significant underoccupation for bismuth and an overoccupation for
vanadium are observed. In contrast, severe underoccupations for both cations were the
result of the refinement of the F-containing material. This gives us a clear hint to the
correct defect model for fluorine incorporation into BiVO4, which will be discussed
below. In addition, it should be stated that, unfortunately, the elements oxygen and
fluorine cannot be distinguished using X-ray or even neutron diffraction methods.
Because both anion positions are coordinated by three cations, Paulings second rule
cannot be used to predict a preferred position for fluorine, as it has also been generally
described in the work by Fuertes.[29]
For a deeper understanding of the fluorine-containing material a closer look at possible
mechanisms of fluorine incorporation is helpful. In principle, there are three different
sensible defect models according to which fluorine incorporation can take place: a)
formation of cation vacancies; b) fluorine on interstitial sites, and c) partial reduction of
vanadium. For the following explanations we use the notation of Kröger and Vink.[30]
a) Formation of cation (vanadium and bismuth) vacancies is described by
BiBix + VVx + 8OOx + 8HF = VBi′′′ + VV′′′′′ + 8FO• + BiVO4 (sf) + 4H2O.
Taking into consideration the experimentally determined oxygen content of 18.2 wt%, a
chemical formula of Bi0.94V0.94O3.54F0.46 can be calculated. The corresponding
BiVO4 Wyckoff x y z Biso occ. Bi 4e 0 ¼ 0.63277(10) 0.9 0.480(2) V 4e 0 ¼ 0.1297(4) 0.6 0.507(2) O1 8f 0.1349(18) 0.4906(15) 0.2061(8) 1.2 1 O2 8f 0.2680(13) 0.3729(18) 0.4477(8) 1.2 1 F:BiVO4 Wyckoff x y z Biso occ. Bi 4e 0 ¼ 0.63283(10) 0.9 0.465(3) V 4e 0 ¼ 0.1302(4) 0.6 0.461(3) O1 8f 0.1444(18) 0.4969(14) 0.2082(8) 1.2 1 O2 8f 0.2733(51) 0.3765(18) 0.4438(7) 1.2 1
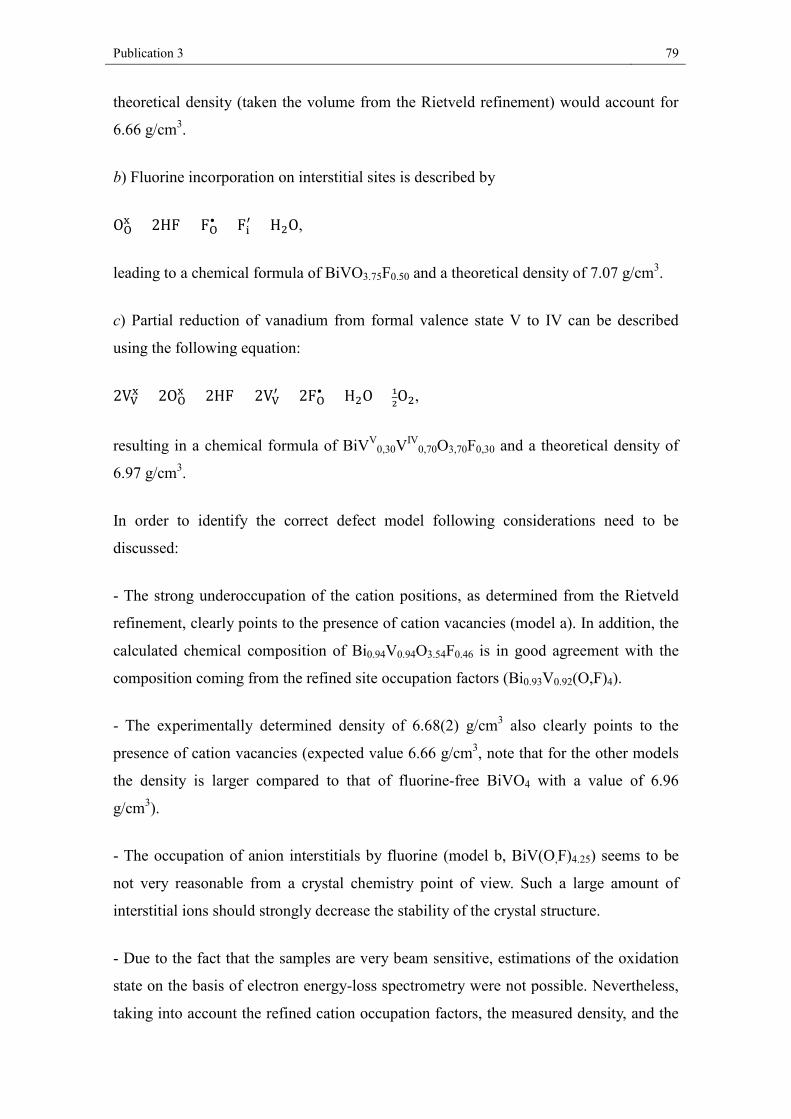
Publication 3 79
theoretical density (taken the volume from the Rietveld refinement) would account for
6.66 g/cm3.
b) Fluorine incorporation on interstitial sites is described by
OOx + 2HF = FO• + Fi′ + H2O,
leading to a chemical formula of BiVO3.75F0.50 and a theoretical density of 7.07 g/cm3.
c) Partial reduction of vanadium from formal valence state V to IV can be described
using the following equation:
2VVx + 2OOx + 2HF = 2VV′ + 2FO• + H2O + 1
2O2,
resulting in a chemical formula of BiVV0,30VIV
0,70O3,70F0,30 and a theoretical density of
6.97 g/cm3.
In order to identify the correct defect model following considerations need to be
discussed:
- The strong underoccupation of the cation positions, as determined from the Rietveld
refinement, clearly points to the presence of cation vacancies (model a). In addition, the
calculated chemical composition of Bi0.94V0.94O3.54F0.46 is in good agreement with the
composition coming from the refined site occupation factors (Bi0.93V0.92(O,F)4).
- The experimentally determined density of 6.68(2) g/cm3 also clearly points to the
presence of cation vacancies (expected value 6.66 g/cm3, note that for the other models
the density is larger compared to that of fluorine-free BiVO4 with a value of 6.96
g/cm3).
- The occupation of anion interstitials by fluorine (model b, BiV(O,F)4.25) seems to be
not very reasonable from a crystal chemistry point of view. Such a large amount of
interstitial ions should strongly decrease the stability of the crystal structure.
- Due to the fact that the samples are very beam sensitive, estimations of the oxidation
state on the basis of electron energy-loss spectrometry were not possible. Nevertheless,
taking into account the refined cation occupation factors, the measured density, and the
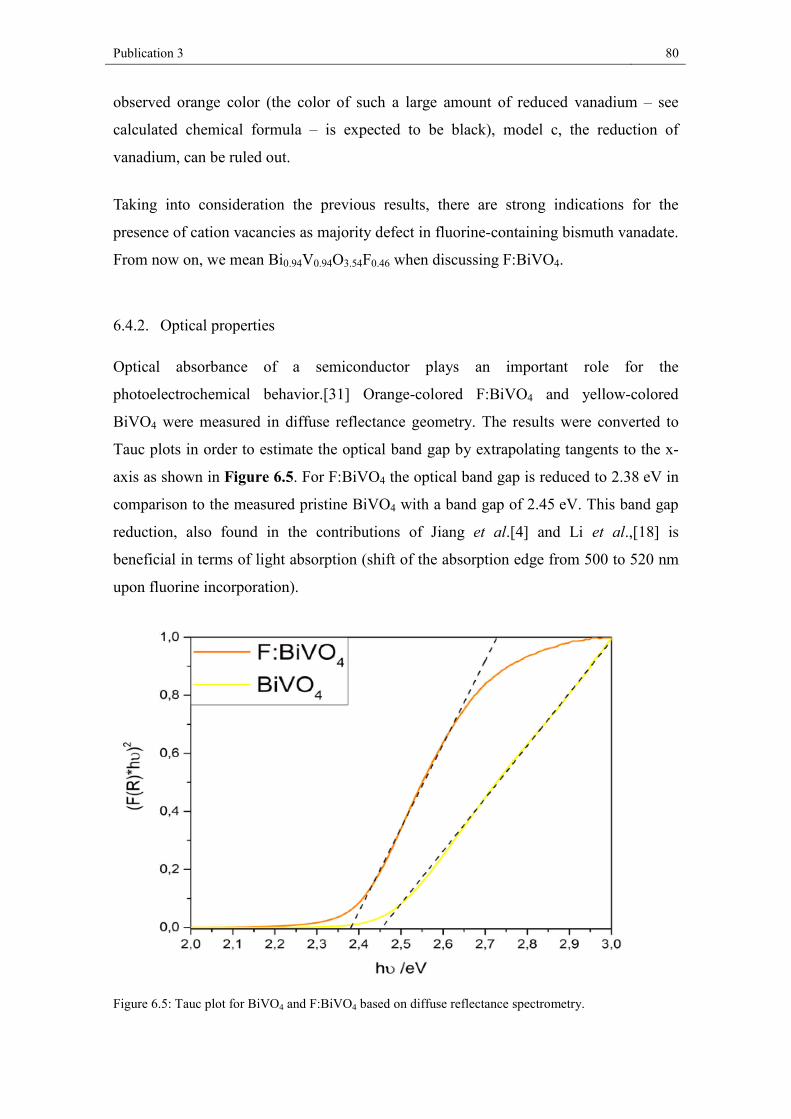
Publication 3 80
observed orange color (the color of such a large amount of reduced vanadium – see
calculated chemical formula – is expected to be black), model c, the reduction of
vanadium, can be ruled out.
Taking into consideration the previous results, there are strong indications for the
presence of cation vacancies as majority defect in fluorine-containing bismuth vanadate.
From now on, we mean Bi0.94V0.94O3.54F0.46 when discussing F:BiVO4.
6.4.2. Optical properties
Optical absorbance of a semiconductor plays an important role for the
photoelectrochemical behavior.[31] Orange-colored F:BiVO4 and yellow-colored
BiVO4 were measured in diffuse reflectance geometry. The results were converted to
Tauc plots in order to estimate the optical band gap by extrapolating tangents to the x-
axis as shown in Figure 6.5. For F:BiVO4 the optical band gap is reduced to 2.38 eV in
comparison to the measured pristine BiVO4 with a band gap of 2.45 eV. This band gap
reduction, also found in the contributions of Jiang et al.[4] and Li et al.,[18] is
beneficial in terms of light absorption (shift of the absorption edge from 500 to 520 nm
upon fluorine incorporation).
Figure 6.5: Tauc plot for BiVO4 and F:BiVO4 based on diffuse reflectance spectrometry.
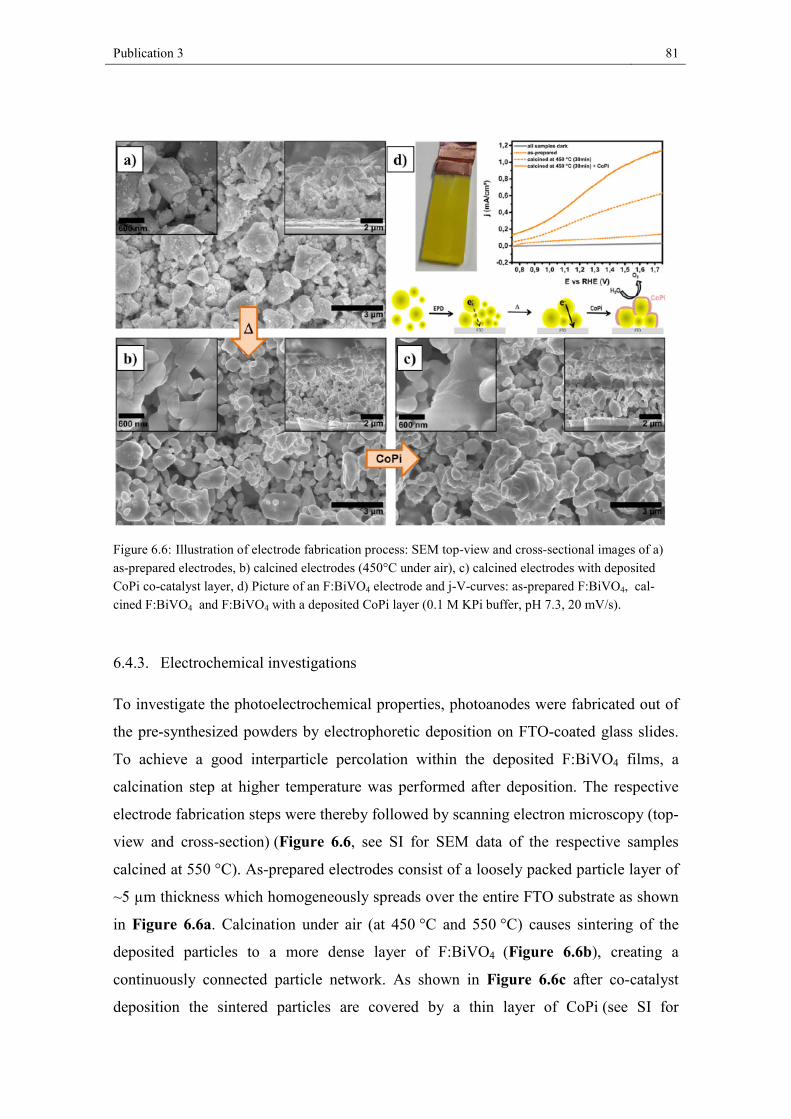
Publication 3 81
Figure 6.6: Illustration of electrode fabrication process: SEM top-view and cross-sectional images of a) as-prepared electrodes, b) calcined electrodes (450°C under air), c) calcined electrodes with deposited CoPi co-catalyst layer, d) Picture of an F:BiVO4 electrode and j-V-curves: as-prepared F:BiVO4, cal-cined F:BiVO4 and F:BiVO4 with a deposited CoPi layer (0.1 M KPi buffer, pH 7.3, 20 mV/s).
6.4.3. Electrochemical investigations
To investigate the photoelectrochemical properties, photoanodes were fabricated out of
the pre-synthesized powders by electrophoretic deposition on FTO-coated glass slides.
To achieve a good interparticle percolation within the deposited F:BiVO4 films, a
calcination step at higher temperature was performed after deposition. The respective
electrode fabrication steps were thereby followed by scanning electron microscopy (top-
view and cross-section) (Figure 6.6, see SI for SEM data of the respective samples
calcined at 550 °C). As-prepared electrodes consist of a loosely packed particle layer of
~5 µm thickness which homogeneously spreads over the entire FTO substrate as shown
in Figure 6.6a. Calcination under air (at 450 °C and 550 °C) causes sintering of the
deposited particles to a more dense layer of F:BiVO4 (Figure 6.6b), creating a
continuously connected particle network. As shown in Figure 6.6c after co-catalyst
deposition the sintered particles are covered by a thin layer of CoPi (see SI for
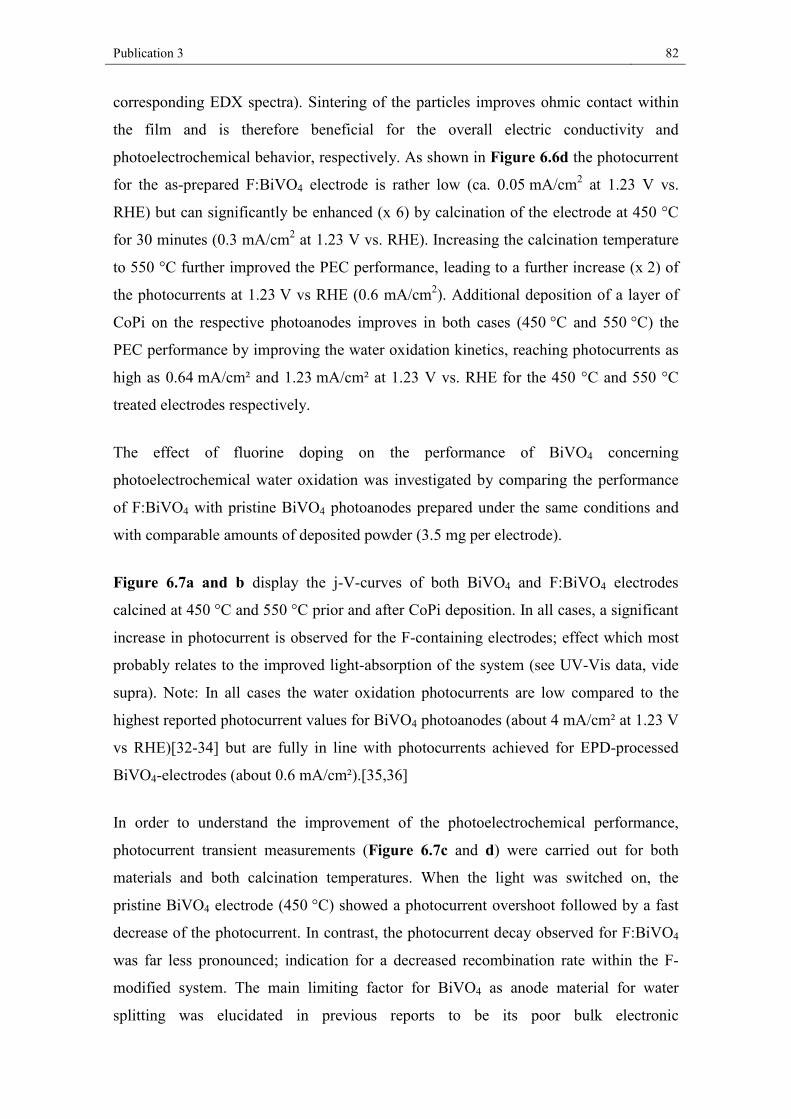
Publication 3 82
corresponding EDX spectra). Sintering of the particles improves ohmic contact within
the film and is therefore beneficial for the overall electric conductivity and
photoelectrochemical behavior, respectively. As shown in Figure 6.6d the photocurrent
for the as-prepared F:BiVO4 electrode is rather low (ca. 0.05 mA/cm2 at 1.23 V vs.
RHE) but can significantly be enhanced (x 6) by calcination of the electrode at 450 °C
for 30 minutes (0.3 mA/cm2 at 1.23 V vs. RHE). Increasing the calcination temperature
to 550 °C further improved the PEC performance, leading to a further increase (x 2) of
the photocurrents at 1.23 V vs RHE (0.6 mA/cm2). Additional deposition of a layer of
CoPi on the respective photoanodes improves in both cases (450 °C and 550 °C) the
PEC performance by improving the water oxidation kinetics, reaching photocurrents as
high as 0.64 mA/cm² and 1.23 mA/cm² at 1.23 V vs. RHE for the 450 °C and 550 °C
treated electrodes respectively.
The effect of fluorine doping on the performance of BiVO4 concerning
photoelectrochemical water oxidation was investigated by comparing the performance
of F:BiVO4 with pristine BiVO4 photoanodes prepared under the same conditions and
with comparable amounts of deposited powder (3.5 mg per electrode).
Figure 6.7a and b display the j-V-curves of both BiVO4 and F:BiVO4 electrodes
calcined at 450 °C and 550 °C prior and after CoPi deposition. In all cases, a significant
increase in photocurrent is observed for the F-containing electrodes; effect which most
probably relates to the improved light-absorption of the system (see UV-Vis data, vide
supra). Note: In all cases the water oxidation photocurrents are low compared to the
highest reported photocurrent values for BiVO4 photoanodes (about 4 mA/cm² at 1.23 V
vs RHE)[32-34] but are fully in line with photocurrents achieved for EPD-processed
BiVO4-electrodes (about 0.6 mA/cm²).[35,36]
In order to understand the improvement of the photoelectrochemical performance,
photocurrent transient measurements (Figure 6.7c and d) were carried out for both
materials and both calcination temperatures. When the light was switched on, the
pristine BiVO4 electrode (450 °C) showed a photocurrent overshoot followed by a fast
decrease of the photocurrent. In contrast, the photocurrent decay observed for F:BiVO4
was far less pronounced; indication for a decreased recombination rate within the F-
modified system. The main limiting factor for BiVO4 as anode material for water
splitting was elucidated in previous reports to be its poor bulk electronic
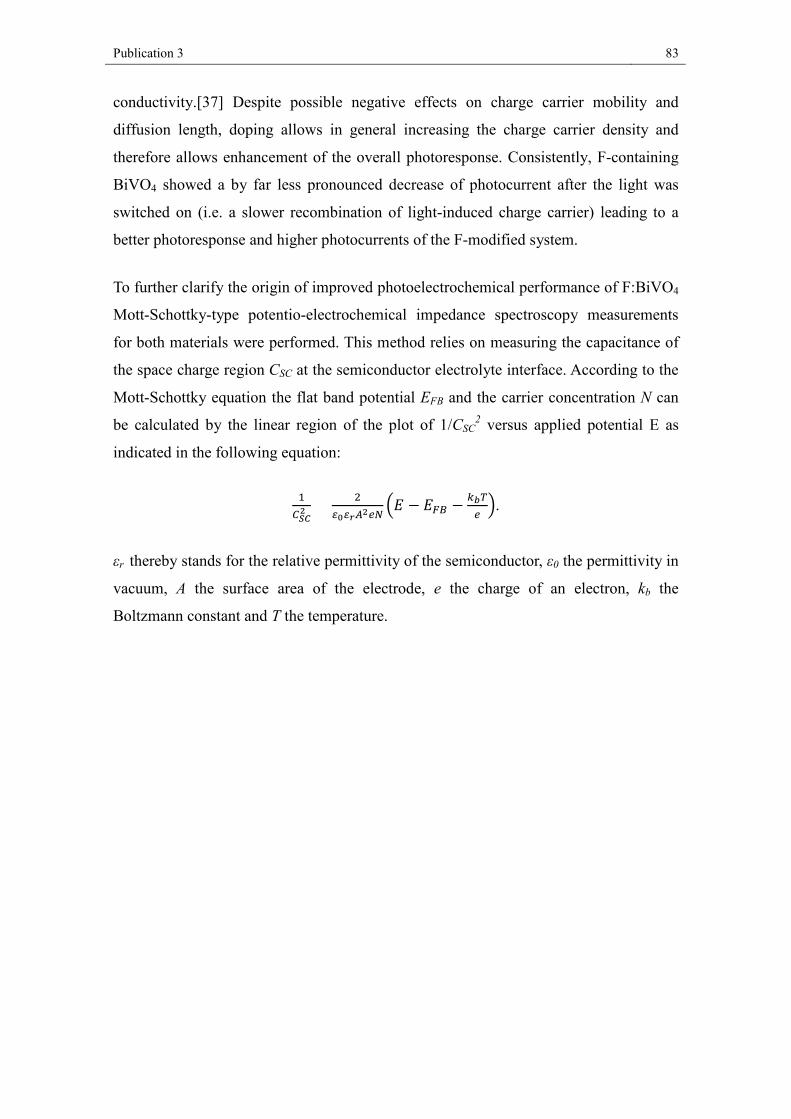
Publication 3 83
conductivity.[37] Despite possible negative effects on charge carrier mobility and
diffusion length, doping allows in general increasing the charge carrier density and
therefore allows enhancement of the overall photoresponse. Consistently, F-containing
BiVO4 showed a by far less pronounced decrease of photocurrent after the light was
switched on (i.e. a slower recombination of light-induced charge carrier) leading to a
better photoresponse and higher photocurrents of the F-modified system.
To further clarify the origin of improved photoelectrochemical performance of F:BiVO4
Mott-Schottky-type potentio-electrochemical impedance spectroscopy measurements
for both materials were performed. This method relies on measuring the capacitance of
the space charge region CSC at the semiconductor electrolyte interface. According to the
Mott-Schottky equation the flat band potential EFB and the carrier concentration N can
be calculated by the linear region of the plot of 1/CSC2 versus applied potential E as
indicated in the following equation:
1𝐶𝐶𝑆𝑆𝑆𝑆2 = 2
𝜀𝜀0𝜀𝜀𝑟𝑟𝐴𝐴2𝑒𝑒𝑁𝑁�𝐸𝐸 − 𝐸𝐸𝐷𝐷𝐵𝐵 −
𝑘𝑘𝑏𝑏𝑇𝑇𝑒𝑒�.
εr thereby stands for the relative permittivity of the semiconductor, ε0 the permittivity in
vacuum, A the surface area of the electrode, e the charge of an electron, kb the
Boltzmann constant and T the temperature.
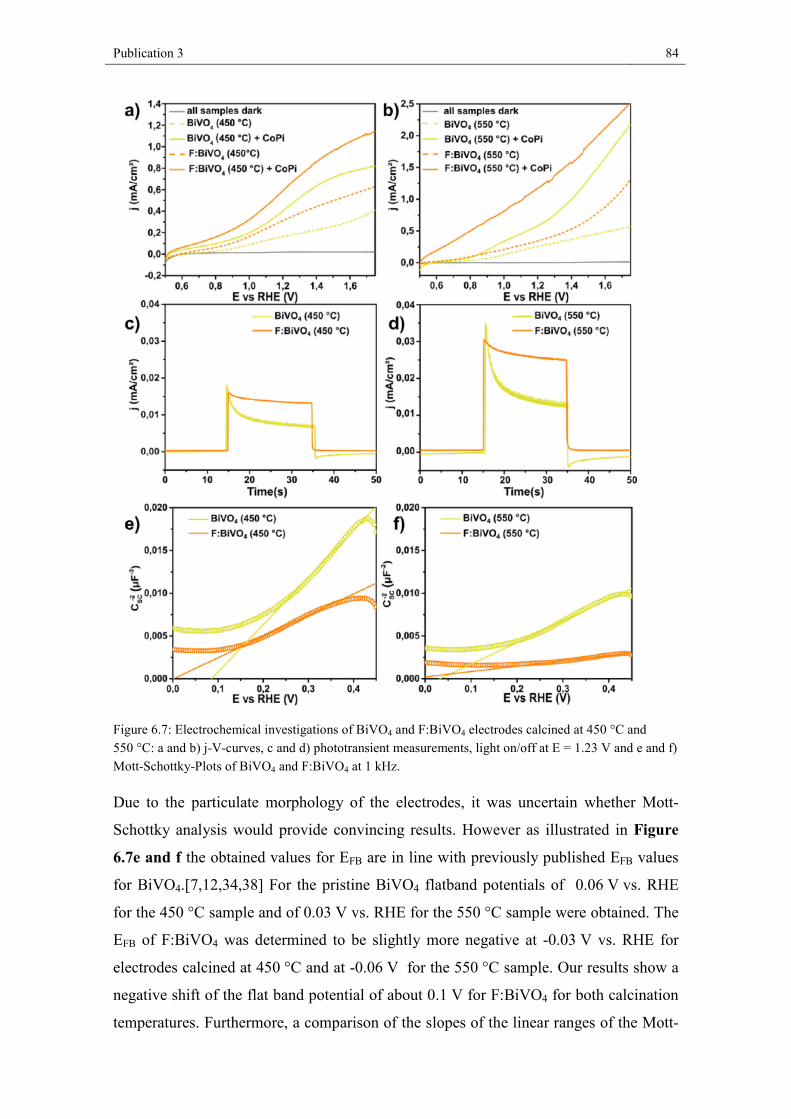
Publication 3 84
Figure 6.7: Electrochemical investigations of BiVO4 and F:BiVO4 electrodes calcined at 450 °C and 550 °C: a and b) j-V-curves, c and d) phototransient measurements, light on/off at E = 1.23 V and e and f) Mott-Schottky-Plots of BiVO4 and F:BiVO4 at 1 kHz.
Due to the particulate morphology of the electrodes, it was uncertain whether Mott-
Schottky analysis would provide convincing results. However as illustrated in Figure
6.7e and f the obtained values for EFB are in line with previously published EFB values
for BiVO4.[7,12,34,38] For the pristine BiVO4 flatband potentials of 0.06 V vs. RHE
for the 450 °C sample and of 0.03 V vs. RHE for the 550 °C sample were obtained. The
EFB of F:BiVO4 was determined to be slightly more negative at -0.03 V vs. RHE for
electrodes calcined at 450 °C and at -0.06 V for the 550 °C sample. Our results show a
negative shift of the flat band potential of about 0.1 V for F:BiVO4 for both calcination
temperatures. Furthermore, a comparison of the slopes of the linear ranges of the Mott-
Publication 3 85
Schottky plots reveals a much smaller slope for F:BiVO4 and hence - taken the surface
area of the electrode as constant into account, as a result of comparable particle sizes,
identical amount of deposited powder and same electrolyte exposed electrode area of
0.5 cm² (see SI) - a higher carrier concentration. As such, these findings are in good
agreement with our results on the light-induced water oxidation properties of pristine
and F-containing BiVO4.
6.5. Conclusion
In here a simple route to phase pure fluorine modified BiVO4 is reported (F:BiVO4).
Incorporation of fluorine into BiVO4 results in the formation of cation vacancies leading
to the formation of Bi0.94V0.94O3.54F0.46. Investigations of the photoelectrochemical
behavior show that F-incorporation significantly improves the performance of BiVO4
photoanodes for PEC water oxidation. Mott-Schottky analysis and photocurrent
transient measurements further indicate a favorable displacement of the flat-band
potential and an increase of charge carrier density as well as a substantial suppression of
charge-carrier recombination in the fluorine modified system, respectively:
improvements, which results in higher PEC performance. As such, fluorine
incorporation into BiVO4 turns out to be an effective way to optimize its performance
for PEC water oxidation and might be in general a promising strategy to further tune the
photo(electro-)catalytic activity of other oxide based photoactive materials.
Acknowledgments
The authors would like to thank S. Kühn (TU Berlin) for performing UV/Vis
measurements and A. Müller-Klauke (TU Berlin) for performing ICP-OES
investigations. The authors would like to thank the ZELMI (TU Berlin) and in particular
Ulrich Gernert for access to and support with SEM measurements. This work is
supported by the Deutsche Forschungsgemeinschaft (DFG) within the priority program
SPP 1613 (LE 781/13-2, FI 1885/1-2) as well as by the DFG cluster of Excellence
UniCat.
Publication 3 86
References
[1] A. Kudo, K. Ueda, H. Kato, I. Mikami, Catal. Lett. 1998, 53, 229. [2] M. Gotić, S. Musić, M. Ivanda, M. Šoufek, S. Popović, J. Mol. Struct. 2005, 744-
747, 535. [3] M. C. Neves, M. Lehocky, R. Soares, L. Lapcik, T. Trindade, Dyes Pigm. 2003, 59,
181. [4] M. J. Nalbandian, M. Zhang, J. Sanchez, Y.-H. Choa, D. M. Cwiertny, N. V.
Myung, J. Mol. Catal. A: Chem. 2015, 404-405, 18. [5] M. Zhou, J. Bao, W. Bi, Y. Zeng, R. Zhu, M. Tao, Y. Xie, ChemSusChem 2012, 5,
1420. [6] H. Jiang, H. Dai, J. Deng, Y. Liu, L. Zhang, K. Ji, Solid State Sci. 2013, 17, 21. [7] C. Karunakaran, S. Kalaivani, Mater. Sci. Semicond. Process. 2014, 27, 352. [8] Y. Park, K. J. McDonald, K.-S. Choi, Chem. Soc. Rev. 2013, 42, 2321. [9] M. G. Walter, E. L. Warren, J. R. McKone, S. W. Boettcher, Q. Mi, E. A. Santori,
N. S. Lewis, Chem. Rev. 2010, 110, 6446. [10] S. Tokunaga, H. Kato, A. Kudo, Chem. Mater. 2001, 13, 4624. [11] S. K. Pilli, T. E. Furtak, L. D. Brown, T. G. Deutsch, J. A. Turner, A. M. Herring,
Energy Environ. Sci. 2011, 4, 5028. [12] W. Yao, H. Iwai, J. Ye, Dalton Trans. 2008. [13] F. F. Abdi, N. Firet, R. van de Krol, ChemCatChem 2013, 5, 490. [14] H. W. Jeong, T. H. Jeon, J. S. Jang, W. Choi, H. Park, J. Phys. Chem. C 2013, 117,
9104. [15] K. P. S. Parmar, H. J. Kang, A. Bist, P. Dua, J. S. Jang, J. S. Lee, ChemSusChem
2012, 5, 1926. [16] H. S. Park, K. E. Kweon, H. Ye, E. Paek, G. S. Hwang, A. J. Bard, J. Phys. Chem.
C 2011, 115, 17870. [17] S. P. Berglund, A. J. E. Rettie, S. Hoang, C. B. Mullins, Phys. Chem. Chem. Phys.
2012, 14, 7065. [18] J.-Q. Li, Z.-Y. Guo, H. Liu, J. Du, Z.-F. Zhu, J. Alloys Comp. 2013, 581, 40. [19] P. R. Slater, J. Fluor. Chem. 2002, 117, 43. [20] J. Rodriguez-Carvajal, Physica B 1993, 55, 192. [21] Y. Izumi, T. Itoi, S. Peng, K. Oka, Y. Shibata, J. Phys. Chem. C 2009, 113, 6706. [22] J. Tauc, Mat. Res. Bull. 1968, 3, 37. [23] M. W. Stoltzfus, P. M. Woodward, R. Seshadri, J.-H. Klepeis, B. Bursten, Inorg.
Chem. 2007, 46, 3839. [24] A. Walsh, Y. Yan, M. N. Huda, M. M. Al-Jassim, S.-H. Wei, Chem. Mater. 2009,
21, 547. [25] R. Abe, M. Higashi, K. Domen, Journal of the American Chemical Society 2010,
132, 11828. [26] Y. Ma, F. Le Formal, A. Kafizas, S. R. Pendlebury, J. R. Durrant, J. Mater. Chem.
A 2015, 3, 20649. [27] Z. Chen, H. N. Dinh, E. Miller, Photoelectrochemical Water Splitting, Springer
New York, New York, NY 2013. [28] A. W. Sleight, H.-y. Chen, A. Ferretti, D. E. Cox, Mat. Res. Bull. 1979, 14, 1571. [29] A. Fuertes, Inorganic chemistry 2006, 45, 9640. [30] F. A. Kröger, H. J. Vink, in Sammelwerk kröger-vink, Vol. 3, Elsevier 1956, p.
307. [31] K. Lai, Y. Zhu, J. Lu, Y. Dai, B. Huang, Solid State Sci. 2013, 24, 79. [32] F. F. Abdi, L. Han, A. H. M. Smets, M. Zeman, B. Dam, R. van de Krol, Nat.
Commun. 2013, 4, 2195.

Publication 3 87
[33] M. Zhong, T. Hisatomi, Y. Kuang, J. Zhao, M. Liu, A. Iwase, Q. Jia, H. Nishiya-ma, T. Minegishi, M. Nakabayashi, N. Shibata, R. Niishiro, C. Katayama, H. Shibano, M. Katayama, A. Kudo, T. Yamada, K. Domen, J. Am. Chem. Soc. 2015, 137, 5053.
[34] T. W. Kim, K.-S. Choi, Science (New York, N.Y.) 2014, 343, 990. [35] W. J. Jo, J.-W. Jang, K.-j. Kong, H. J. Kang, J. Y. Kim, H. Jun, K. P. S. Parmar, J.
S. Lee, Angew. Chem. Int. Ed. Engl. 2012, 51, 3147. [36] D. Wang, R. Li, J. Zhu, J. Shi, J. Han, X. Zong, C. Li, J. Phys. Chem. C 2012, 116,
5082. [37] F. F. Abdi, T. J. Savenije, M. M. May, B. Dam, R. van de Krol, J. Phys. Chem.
Lett. 2013, 4, 2752. [38] A. J. E. Rettie, H. C. Lee, L. G. Marshall, J.-F. Lin, C. Capan, J. Lindemuth, J. S.
McCloy, J. Zhou, A. J. Bard, C. B. Mullins, J. Am. Chem. Soc. 2013, 135, 11389.

Publication 3 88
Conclusion and Outlook 89
7. Conclusion and Outlook
7.1. Conclusion
The main objective of this study was to show the feasibility of performing targeted
changes in the anion lattice without changing the crystal structure. On the one hand,
special emphasis has been examined for the oxygen nitrogen substitution, followed by
co-substitution (Papers 1 and 2). A further important point was the oxygen fluorine
substitution in the photocatalyst bismuth vanadate, which is known from the literature
(Paper 3).
In order to investigate both aspects of the project precisely, first of all, the development
of pure phase materials were the key issue. In the preparation of all the compounds
presented, the anion substitution by solid-vapor reaction was the medium of choice in
order to convert the precursor oxides to the corresponding oxide nitrides and oxide
fluorides.
For the accurate determination of the crystal structure, the products were characterized
by X-ray powder diffraction and refined according to the Rietveld method. The exact
composition of the compounds was determined by hot gas extraction and X-ray
fluorescence analysis. The optical band gaps of the compounds were determined on the
basis of UV/Vis reflection spectra. Information on the band gap energies of the
synthesized compounds was obtained via the Tauc deposition method or the DASF
method. Finally, the oxygen/hydrogen evolution reaction was used to check the
photocatalytic activity.
In the following, the essential results on the investigated compounds are summarized.
For this, as well as in the work, it is divided to tetragonal tungsten bronze structures and
bismuth vanadate.
Conclusion and Outlook 90
7.1.1. Ba3-xLaxTa5O14-xN1+x
This work shows the successful syntheses of light yellow – yellow powders with the
general composition Ba3-xLaxTa5O14-xN1+x (x= 0; 1) which crystallize isostructurally to
the literature-known mixed-valence oxide Ba3Ta4VTaIVO15. Quantum-chemical
calculations at hybrid DFT level were made and exhibited band gaps close to the
measured value. The effect of N/O distribution on the optical properties was calculated
to be very pronounced. Comparing Ba3Ta5O14N to LaBa2Ta5O13N2, it was shown that
the increase in the nitrogen content not only leads to a decrease of the optical band gap
but also to significantly higher H2 evolution rate.
7.1.2. F:BiVO4
In this work also a simple, new, and promising route to phase-pure fluorine-modified
BiVO4 is reported and discussed (F:BiVO4). The exact chemical composition was
determined by combining ICP-OES, Rietveld refinements, and the investigation of the
defect structure, leading to the presence of cation vacancies. Fluorine incorporation not
only reduced the optical band gap (according to the DASF method) but also the
performance of bismuth vanadate photoanodes for PEC water oxidation is significantly
enhanced. Photocurrent transient measurements and Mott-Schottky analysis further
demonstrated a favorable displacement of the flat-band potential and an increase of
charge carrier density as well as a substantial suppression of charge-carrier
recombination in the fluorine modified system, respectively: improvements, which
result in higher PEC performances.
Conclusion and Outlook 91
7.2. Outlook
In the light of these results, there are two main points that should be considered in the
near future. On the one hand further attempts in decreasing the optical band gap by
additional co-substitution (LaBa2Ta5O13N2 → La2BaTa5O12N3 → La3Ta5O11N4) seem to
be worth the efforts even if the challenge of preparing a phase-pure material increases
with increasing nitrogen content.
On the other hand, fluorine incorporation into BiVO4 turns out to be an effective way to
optimize its performance for PEC water oxidation and might be in general a promising
strategy to further tune the photo(electro-)catalytic activity of other oxide-based
photoactive materials, for example, cation-doped BiVO4 systems (e.g. molybdenum) or
even oxide nitrides such as TaON.
Despite these new findings, which have been systematically gained in this thesis, the
goal of a rational design of materials remains a major challenge. Exploratory research is
therefore of indispensable need in terms of the complex relationships in the system of
photocatalytic water splitting. This will strengthen future efforts in the field of
preparative solid state chemistry and will lead to a continuous further development of
synthetic and characterization methods. In addition, the close interdisciplinary
cooperation between solid state chemistry, surface chemistry, and catalysis, as has
already been demonstrated in the present study, will increasingly improve the
achievement of important advances in the field of photocatalytic water splitting.

92
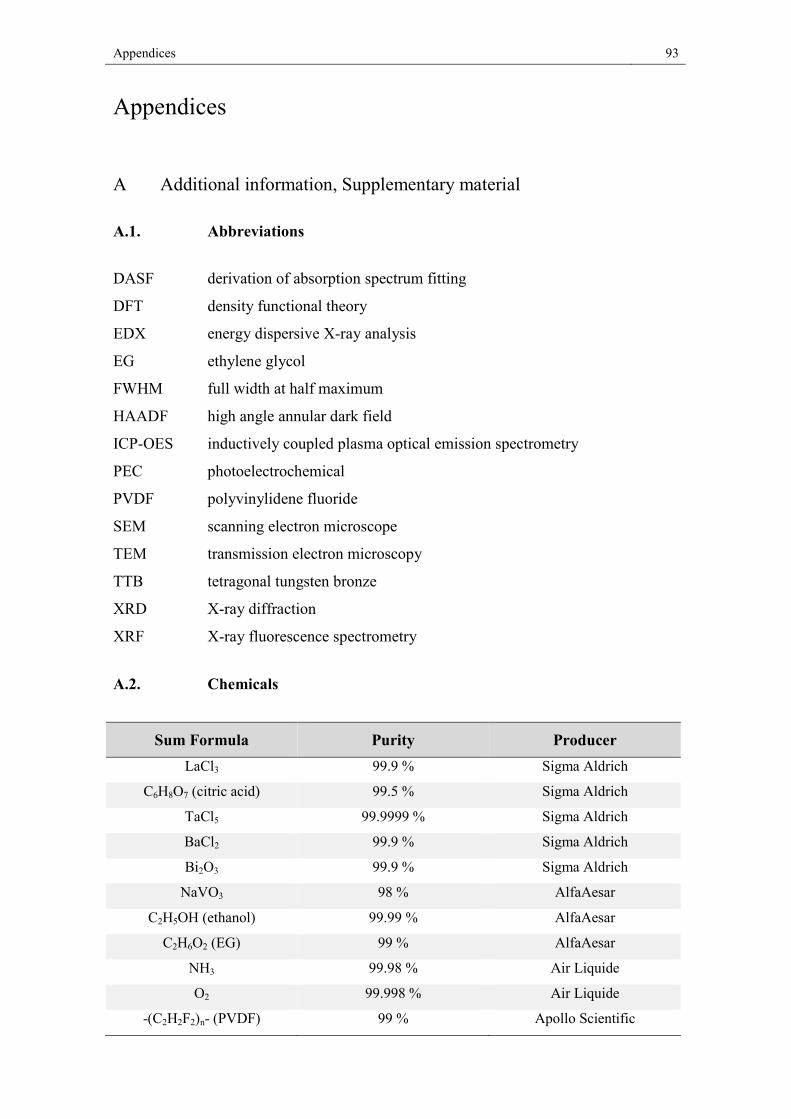
Appendices 93
Appendices
A Additional information, Supplementary material
A.1. Abbreviations
DASF derivation of absorption spectrum fitting
DFT density functional theory
EDX energy dispersive X-ray analysis
EG ethylene glycol
FWHM full width at half maximum
HAADF high angle annular dark field
ICP-OES inductively coupled plasma optical emission spectrometry
PEC photoelectrochemical
PVDF polyvinylidene fluoride
SEM scanning electron microscope
TEM transmission electron microscopy
TTB tetragonal tungsten bronze
XRD X-ray diffraction
XRF X-ray fluorescence spectrometry
A.2. Chemicals
Sum Formula Purity Producer LaCl3 99.9 % Sigma Aldrich
C6H8O7 (citric acid) 99.5 % Sigma Aldrich
TaCl5 99.9999 % Sigma Aldrich
BaCl2 99.9 % Sigma Aldrich
Bi2O3 99.9 % Sigma Aldrich
NaVO3 98 % AlfaAesar
C2H5OH (ethanol) 99.99 % AlfaAesar
C2H6O2 (EG) 99 % AlfaAesar
NH3 99.98 % Air Liquide
O2 99.998 % Air Liquide
-(C2H2F2)n- (PVDF) 99 % Apollo Scientific
Appendices 94
B List of publications
1. B. Anke, M. Rohloff, M.G. Willinger, W. Hetaba, A. Fischer, M. Lerch;
“Improved photoelectrochemical performance of bismuth vanadate by partial
O/F-substitution”, Solid State Sci. 2017, 63, 1–8.
2. B. Anke, T. Bredow, M. Pilarski, M. Wark, M. Lerch; “From Ba3Ta5O14N to
LaBa2Ta5O13N2: Decreasing the optical band gap of a photocatalyst”, J. Solid
State Chem. 2017, 246, 75–80.
3. B. Anke, T. Bredow, J. Soldat, M. Wark, M. Lerch; “Synthesis, crystal structure,
and photocatalytical properties of Ba3Ta5O14N”, J. Solid State Chem. 2016, 233,
282–288.
4. B. Anke, T. Bredow, M. Lerch; “Gezielte Beeinflussung der optischen
Bandlücke von Ba3Ta5O15”, Z. Anorg. Allg. Chem. 2016, 642, 1033.
5. B. Anke, M. Rohloff, A. Fischer, M. Lerch; “Verbesserung der
photokatalytischen Eigenschaften von BiVO4 durch partielle O/F-Substitution”,
Z. Anorg. Allg. Chem. 2016, 642, 1033.
6. B. Anke, M. Rohloff, A. Fischer, M. Lerch; “Decreasing the Optical Band Gap
in Photocatalysts: From Ba3Ta5O14N to LaBa2Ta5O13N2”, 24th Annual Conf. of
the Ger. Cryst. Soc. 2016, materials: synthesis and structure P020.
7. B. Anke, S. Hund, C. Lorent, O. Janka, T. Block, R. Pöttgen, M. Lerch;
“Synthesis, Crystal Structure, and Magnetic Properties of Pyrochlore-Type
Eu2Ta2(O,N)7+δ”, Z. Anorg. Allg. Chem. 2017, DOI: 10.1002/zaac.201700024.
8. M. Rohloff, B. Anke, S. Zhang, U. Gernert, C. Scheu, A. Thomas, M. Lerch,
A. Fischer; “Mo-doped BiVO4 Thin Films – High Photocatalytic Activity
Achieved by Tailored Structure and Morphology”, in preparation.
9. M. Rohloff, B. Anke, M. Lerch, A. Fischer; “Enhancement of
photoelectrochemical performance by anion substitution in Mo:BiVO4 thin film
electrodes”, in preparation.

Appendices 95
10. A. Ulpe, B. Anke, S. Berendts, M. Lerch, T. Bredow; “F-doping of BiVO4:
defect structures, phase stability and electronic properties from first principles”,
in preparation.
Appendices 96
C List of conference contributions
09/2016 19.Vortragstagung Fachgruppe Festkörperchemie und Materialforschung,
Innsbruck, Austria – 2 Posters
09/2016 DFG SPP1613 Solar H2 Project Meeting,
Berlin, Germany – Poster and Lecture
03/2016 24th Annual Meeting of the German Crystallographic Society (DGK),
Stuttgart, Germany – Poster
03/2015 International Conference SolarFuel15 (DFG SPP1613),
Mallorca, Spain – Poster
10/2014 Bunsen Colloquium 2014: Lithium in Solids: Structure and Dynamics,
Hannover, Germany – Poster
09/2014 18.Vortragstagung Fachgruppe Festkörperchemie und Materialforschung,
Dresden, Germany
D Awards
• 1. Posterpreis auf 19. Vortragstagung der Fachgruppe Festkörperchemie und Materialforschung Verleihung: 20. September 2016, Disziplin: Festkörperchemie und Materialforschung, Stifter: Gesellschaft Deutscher Chemiker e. V. (GDCh)

Appendices 97
List of Tables 98
List of Tables
Table 2.1: Localization of various ions in the different crystallographic sites.[24] ........... 6 Table 3.1: Synthesis conditions for the new compounds Ba3Ta5O14N and
LaBa2Ta5O13N2. .................................................................................................... 17 Table 4.1: Refined structural parameters of Ba3Ta5O14N in comparison to Ba3Ta5O15 . 38 Table 4.2: Atomic positional parameters and isotropic Debye-Waller factors for
Ba3Ta5O14N. .......................................................................................................... 39 Table 4.3: Determined Ba/Ta-O/N bond lengths in Ba3Ta5O14N and Ba3Ta5O15. ......... 42 Table 4.4: Relative stability (eV) of different O/N configurations of Ba3Ta5O14N; two
nitrogen atoms are placed at particular lattice sites, and all other sites are occupied by oxygen. Comparison of two hybrid DFT functionals and basis sets, see text. 44
Table 4.5: Optimized nearest-neighbor distances around the N atoms (Å) obtained for five configurations. Results obtained with PW1PW/std. ...................................... 44
Table 4.6: Calculated electronic band gaps of the considered O/N configurations (eV). Comparison of PW1PW/std and HSE06/tzvp. ...................................................... 45
Table 5.1: Refined structural parameters of LaBa2Ta5O13N2 in comparison to Ba3Ta5O14N and Ba3Ta5O15. ................................................................................. 59
Table 5.2: Refined atomic parameters for LaBa2Ta5O13N2. ........................................... 59 Table 5.3: Calculated atomic parameters of the LaBa2Ta5O13N2 phase and deviations
from measured values in parentheses (c.f. Table 2). CRYSTAL-HSE06 results. 62 Table 5.4: Calculated fundamental direct (d) and indirect (id) band gaps (eV) for
Ba3Ta5O15, Ba3Ta5O14N, and LaBa2Ta5O13N2. Only the results for the most stable La/Ba and O/N distributions are shown. CRYSTAL-HSE06 results. .................. 62
Table 6.1: Refined structural parameters of BiVO4 in comparison to F:BiVO4. ........... 77 Table 6.2: Structural parameters for BiVO4 and F:BiVO4. ............................................ 78
List of Figures 99
List of Figures
Figure 1.1: For the first time, the atmospheric CO2 concentration at Mauna Loa stayed above the symbolic milestone of 400 ppm for the full year in 2016, including September’s seasonal low. Source: UC San Diego (https://scripps.ucsd.edu/programs/keelingcurve/). ................................................ 1
Figure 2.1: Band edge alignment of undoped and N-doped KTaO3. ............................... 5 Figure 2.2: Schematic projection of the TTB crystalline network (A2BC2M5X15) along
the c axis (A, B, and C correspond to cationic sites with 15, 12, and 9 coordination numbers, respectively). ........................................................................................... 7
Figure 2.3: V-O4 tetrahedra and Bi-O8 polyhedra in monoclinic scheelite BiVO4 with the determined bond lengths (Å). ............................................................................ 8
Figure 2.4: Phase transition in BiVO4. ............................................................................. 9 Figure 2.5: Temperature dependence of a normalized order parameter for BiVO4. ...... 10 Figure 2.6: Schematic band structures of tetragonal zircon-type BiVO4 and monoclinic
scheelite BiVO4 proposed by Kudo et al..[39] ........................................................ 11 Figure 3.1: Flow chart for preparing amorphous powder precursors by the Pechini
method. ...................................................................................................................... Figure 3.2: left: gas flow controller for NH3, O2 and N2; mid: tube furnace from Gero
Typ SR-A 60-300/12; right: reaction space under the rapid gas supply. ................. Figure 3.3: Sketch of fluorination apparatus. The inner corundum boat contains the
sample to be fluorinated and the outer boat is filled with PVDF. ......................... 20 Figure 4.1: X-ray powder diffraction pattern of Ba3Ta5O14N with the results of the
Rietveld refinement. .............................................................................................. 38 Figure 4.2: Unit cell of Ba3Ta5O14N and polyhedral representation of the crystal
structure. Ta(O/N)6 octahedra are drawn in green; Ba atoms are represented by black balls.............................................................................................................. 40
Figure 4.3: Ba-O/N polyhedra in Ba3Ta5O14N with the determined bond lengths (Å). . 41 Figure 4.4: Ta(O/N)6 octahedra in Ba3Ta5O14N with the determined bond lengths(Å). 42 Figure 4.5: Tauc plot of Ba3Ta5O14N based on diffuse reflectance geometry. .............. 43 Figure 4.6: Projected density of states for configurations (1), left, and (2), right. For
clarity the zero point of energy was shifted to the bottom of the conduction band. (VBM: valence band maximum) ...............................................................................
Figure 4.7: Photocatalytic hydrogen evolution rates of Ba3Ta5O14N before and after reductive in situ photodeposition of 0.0125 wt.-% Rh. ........................................ 48
Figure 5.1: X-ray powder diffraction pattern of LaBa2Ta5O13N2 with the results of the Rietveld refinement. .............................................................................................. 58
Figure 5.2: Unit cell of LaBa2Ta5O13N2 with the connectivity of Ta(O/N)6 polyhedra. 59 Figure 5.3: Plot of d{ln(A/λ)}/d(1/λ) versus (1/λ) for Ba3Ta5O14N (black) and
LaBa2Ta5O13N2 (red). ............................................................................................ 61
List of Figures 100
Figure 5.4: Atom-projected density of states for Ba3Ta5O15 (left), Ba3Ta5O14N (center), and LaBa2Ta5O13N2 (right) as obtained with CRYSTAL-HSE06. The binding energy is given relative to the valence band maximum (VBM). .......................... 63
Figure 5.5: Photocatalytic H2 evolution rates of Ba3Ta5O14N and LaBa2Ta5O13N2 before and after in-situ photodeposition of 0.0125 wt% of Rh in H2O/CH3OH solution under Hg-lamp irradiation. .................................................................................... 65
Figure 6.1: Sketch of fluorination apparatus. The inner corundum boat contains the sample to be fluorinated and the outer boat is filled with PVDF. ......................... 72
Figure 6.2: Bright field TEM image of F:BiVO4 (left) and high resolution TEM image of one of the particles (right). The inlay shows the corresponding FFT. Spots due to the (020) and (20-1) lattice planes or the [102] oriented particle are labelled. . 75
Figure 6.3: High angle annular dark field image of F:BiVO4 (left). EDX maps of F(yellow), Bi (green) and V(red) (right from top to bottom). ............................... 76
Figure 6.4: X-ray powder diffraction patterns of BiVO4 (left) and F:BiVO4 (right) with the results of the Rietveld refinements. Inset: Unit cell of F:BiVO4 and polyhedral representation of the crystal structure. Bi(O,F)8 polyhedra are drawn in yellow, V(O,F)4 tetraheda are shown in blue. .................................................................... 77
Figure 6.5: Tauc plot for BiVO4 and F:BiVO4 based on diffuse reflectance spectrometry. ......................................................................................................... 80
Figure 6.6: Illustration of electrode fabrication process: SEM top-view and cross-sectional images of a) as-prepared electrodes, b) calcined electrodes (450°C under air), c) calcined electrodes with deposited CoPi co-catalyst layer, d) Picture of an F:BiVO4 electrode and j-V-curves: as-prepared F:BiVO4, calcined F:BiVO4 and F:BiVO4 with a deposited CoPi layer (0.1 M KPi buffer, pH 7.3, 20 mV/s). ...... 81
Figure 6.7: Electrochemical investigations of BiVO4 and F:BiVO4 electrodes calcined at 450 °C and 550 °C: a and b) j-V-curves, c and d) phototransient measurements, light on/off at E = 1.23 V and e and f) Mott-Schottky-Plots of BiVO4 and F:BiVO4 at 1 kHz. ................................................................................................. 84