Embed Size (px)
Citation preview
1
Bandwidth Management for Mobile Media DeliverySanjeev Mehrotra #, Hua Chen ∗, Sourabh Jain †, Jin Li #, Baochun Li ⋄, Minghua Chen ◦
# Microsoft Research – {sanjeevm,jinl}@microsoft.com ∗ University of Maryland – [email protected]† University of Minnesota – [email protected] ⋄ University of Toronto – [email protected]
◦ The Chinese University of Hong Kong – [email protected]
Abstract—Mobile broadband networks using 3G and post-3Gtechnologies (such as EV-DO, HSPA, WiMAX, LTE) are rapidlybecoming one of the prominent means to access the Internet.Multimedia consumption — requiring low delay, high bandwidth,or a combination of both — is projected to become a large portionof bandwidth utilization in mobile broadband networks. In thispaper, we study the fundamental problem of how packet lossand delay vary as a function of the transmission rate over thesenetworks. With extensive real-world measurement studies, weanalyze the performance of a number of rate control algorithmscommonly used in media transmission. We show that the variablenature of congestion signals (loss and delay) on these networksleads to an ultimate failure of existing rate control strategiesto deliver adequate performance for multimedia applications.In addition, we show how a rate control algorithm derivedfrom the utility maximization framework — which uses queuingdelay as the primary congestion signal — can be modifiedto solve the challenging issues we have observed. By using avariable threshold to define when the network is congested, ourproposed solution is able to achieve a significant improvementover algorithms that use fixed definitions of congestion.
I. INTRODUCTION
Mobile broadband Internet usage is rapidly on the rise. In
US and Europe, the proportion of mobile users that access
the Internet regularly has quadrupled and tripled over the past
four years, respectively [5]. Owners of smartphones are driving
the increase in mobile Internet usage, and most consumers
access the Web on their smartphones primarily via their
cellular connection (rather than Wi-Fi). As a result, 3G cellular
technology drives the growth of mobile broadband usage, and
is currently available to more than 20 percent of cellular users
around the world. 4G mobile broadband technologies, such as
WiMAX and LTE, are being quickly deployed as well.
Among smartphone activities, more and more users are uti-
lizing bandwidth intensive applications. Mobile video is expe-
riencing explosive growth and is driving the growth of mobile
broadband. According to [20], mobile video has represented
47% of peak hour traffic in November 2010, up from 27%
in January 2010. In addition, interactive media applications
— such as video conferencing on mobile broadband — are
quickly becoming popular. FaceTime, introduced by iPhone
4 and further adopted by iPad 2, is redefining the mobile
video conferencing experience. By October 2010, 19 million
FaceTime-enabled devices had been shipped.
For mobile broadband applications such as playing online
games, viewing video streams, browsing maps, or video
conferencing, bandwidth plays a critical role in the users’
experience, and can mean the difference between a satisfying
one vs. a frustrating one. Currently, mobile broadband users
are frequently experiencing highly fluctuating bandwidth.
Depending on the interaction between mobile devices and
the cloud, there are primarily two categories of mobile broad-
band applications: streaming and interactive. For streaming ap-
plications, such as map browsing and video-on-demand (e.g.,
YouTube, NetFlix, Hulu), the effective throughput determines
the quality of experience. Other network parameters, such as
network latency, jitter (queuing delay), and packet loss, are
less relevant. These applications either have a typical response
time of several seconds (in map browsing), or build a buffer
of several seconds (in video-on-demand apps) at the mobile
devices to absorb the jitter and packet loss. On the other
hand, interactive applications — such as games and video
conferencing — strive to achieve a good throughput with low
latency, jitter and packet loss.
As we will discuss in Sec. II, there exists an extensive body
of literature on rate and congestion control in the Internet.
However, few addresses the unique issue of bandwidth man-
agement on mobile broadband networks. Typical rate control
algorithms, such as the TCP variants, TCP Friendly Rate
Control (TFRC), and other utility maximization approaches,
attempt to maximize network throughput and ensure some
sense of fairness (to maximize network utility). Rate control is
performed by observing congestion signals, which consist of
packet loss and jitter, and then adjusting the rate as a function
of the congestion level being observed. This works well on the
wired Internet when packet loss and jitter accurately reflects
congestion. However, for mobile broadband networks, large
variations in jitter and loss are observed even when the channel
is not congested. As an example, 3G and WiMAX networks
can experience packet losses of 3-5% and jitter of 50-200
milliseconds, regardless of the transmission rate. Reducing the
transmission bit rate does not result in a reduction of the packet
loss rate or jitter level, since the existence of some packet loss
and jitter does not equate to congestion.
In this paper, we study how packet loss and jitter change as a
function of transmission rates in mobile broadband networks.
Through extensive experimental results, we show that even
at low transmission rates, there is a significant amount of
packet loss and jitter, which cannot be attributed to congestion
but which is likely due to short-term fluctuations in capacity
caused by interference. Using our experimental data, we also
show that existing rate control algorithms, which use a fixed
definition of congestion, perform relatively poorly in terms
of throughput and/or packet loss and jitter. By “definition
of congestion,” we mean jitter or packet loss boundary or
threshold between the congestion and congestion-free zone.
To address this challenge, our original contribution in this
paper is inspired by a queuing delay (jitter) based rate control
2
algorithm derived from the utility maximization framework.
We improve the algorithm to use a variable boundary or
threshold between the congestion and congestion-free zone.
The congestion zone should be one where reducing the trans-
mission rate results in a noticeable reduction in the congestion
level in terms of jitter and/or packet loss. The congestion-free
zone is one where reducing the transmission rate does not
result in a noticeable reduction in the congestion level. We
show that by using a variable threshold — which is different
for each network and learned from network measurements —
we can achieve significantly improved performance in terms of
throughput, jitter and packet loss. This allows for full wireless
link utilization, which is critically important for bandwidth-
intensive multimedia applications such as HD playback, while
maintaining a low jitter and packet loss, useful to real-time
multimedia applications such as conferencing.
The remainder of this paper is organized as follows. In
Sec. II, we examine related work on the topic of band-
width management. In Sec. III, we study an extensive set
of representative network traces collected from real network
conditions. In Sec. IV we show that existing rate control
protocols may perform very poorly in terms of link utilization
and/or packet delay and loss. In Sec. V, we present how using
variable definitions of congestion can improve the performance
of existing rate control algorithms over mobile broadband
networks. Sec. VI concludes the paper.
Although we present results for a couple of representative
mobile broadband networks — specifically for a 3G EV-DO
network (referred to as simply 3G) and for a WiMAX network
– we find that the contributions of this paper hold in most other
mobile broadband networks as well.
II. RELATED WORK
There exist two major categories of congestion control and
rate control algorithms in the literature: (1) those based on
the estimation of available bandwidth, and (2) those based
on end-to-end congestion control. An example of rate control
based on available bandwidth estimation can be found in [21].
The scheme assumes a single critical link along the path. It
sends probe packets on the link, estimates the capacity and
the cross traffic from the gaps of the incoming and outgoing
packet pairs, and calculates the available bandwidth on the
link. With one dominant critical link, the scheme can give
a quick estimate of the available bandwidth by solving an
equation that relates the available bandwidth to the packet gaps
received. However, it has been shown [13] that this category
of technologies frequently fail in a complex Internet environ-
ment, and will completely break down in mobile broadband.
Moreover, applications with available bandwidth based rate
control will usually fail to share bandwidth fairly.
End-to-end congestion control, such as the standard
Additive-Increase Multiplicative-Decrease (AIMD) algorithm
used in TCP [11], dominates the Internet. TCP uses a con-
gestion window to control the sending rate which it adjusts
using packet loss and/or increased queuing delay as the con-
gestion signal. During the congestion avoidance phase, TCP
decreases its window (usually multiplicatively) in response to
congestion, and increases its window (usually additively) when
no congestion is detected. There has been significant work
on TCP congestion control, covering various components.
For example, the initial window size could be 1, 2, 3, 4,
or even 10 packets; the slow start algorithm could be the
standard slow start, limited slow start, hybrid slow start; the
congestion avoidance algorithm could be AIMD [11], CUBIC
[9], CTCP [22]; the loss recovery mechanism could be Reno
and NewReno. In applications such as video conferencing
where it is desirable to use a rate control algorithm instead
of congestion control, TCP Friendly Rate Control (TFRC)
[10] has been developed to achieve rate fairness with TCP,
but with a relatively smooth sending rate. Many existing TCP
congestion control variants and TFRC interpret any amount of
packet loss and increased queuing delay as congestion. Thus,
for a noisy channel such as mobile broadband, TCP and TFRC
may overreact to the inherent packet loss and jitter and under-
utilize the network.
There have been attempts to improve the performance of
congestion control protocols such as TCP over networks with
wireless links, where not all loss is caused by congestion. A
good summary of existing work is provided in [2]. However,
existing work has mostly focused on loss-based protocols, with
the goal being to either hide loss from the upper layer (such as
TCP) via retransmissions at the lower layer [1], [3], or modify
the upper layer protocol to determine whether observed loss
is actually due to congestion [4], [16], [18], [22]. The former
approach has been difficult to implement as it requires changes
in the hardware or in the firmware which runs the lower
layer protocols. The latter approach involves determining what
contribution of loss is actually due to congestion. This can
be aided by hints from the lower layer, which also requires
modifications to the lower layer, or by using additional signals
such as jitter (queuing delay). These additional signals can
either directly be used in determining congestion or in aiding
the rate control algorithm in other ways. From a practical
implementation point of view, most of what is currently used
is the use of secondary signals to determine when loss is due
to congestion. As an example, TCP Westwood [18] attempts
to determine which loss is due to congestion by utilizing
bandwidth estimation techniques to set the slow start threshold
and initial congestion window. This works well when only loss
is a noisy congestion signal. However, on mobile broadband
networks, where queuing delay is also a noisy congestion
signal, bandwidth estimation techniques do not work well.
Network utility maximization has attracted significant atten-
tion since the seminal framework was introduced [15], [17]. In
the framework, network protocols are understood as distributed
algorithms that maximize aggregate user utility under network
resource constraints. The user’s utility function is typically
assumed to be a strictly concave function of user rate and
the resource constraints set is linear. This framework not only
provides a powerful tool to reverse engineer existing protocols
such as TCP [14], but can be used to develop other network
protocols.
In this paper, we revisit this fundamental challenge of
determining when observed congestion signals — such as jitter
and packet loss — are in fact due to congestion, but over
3
Server
Network
Client
High Speed
Connection
Wireless
Link
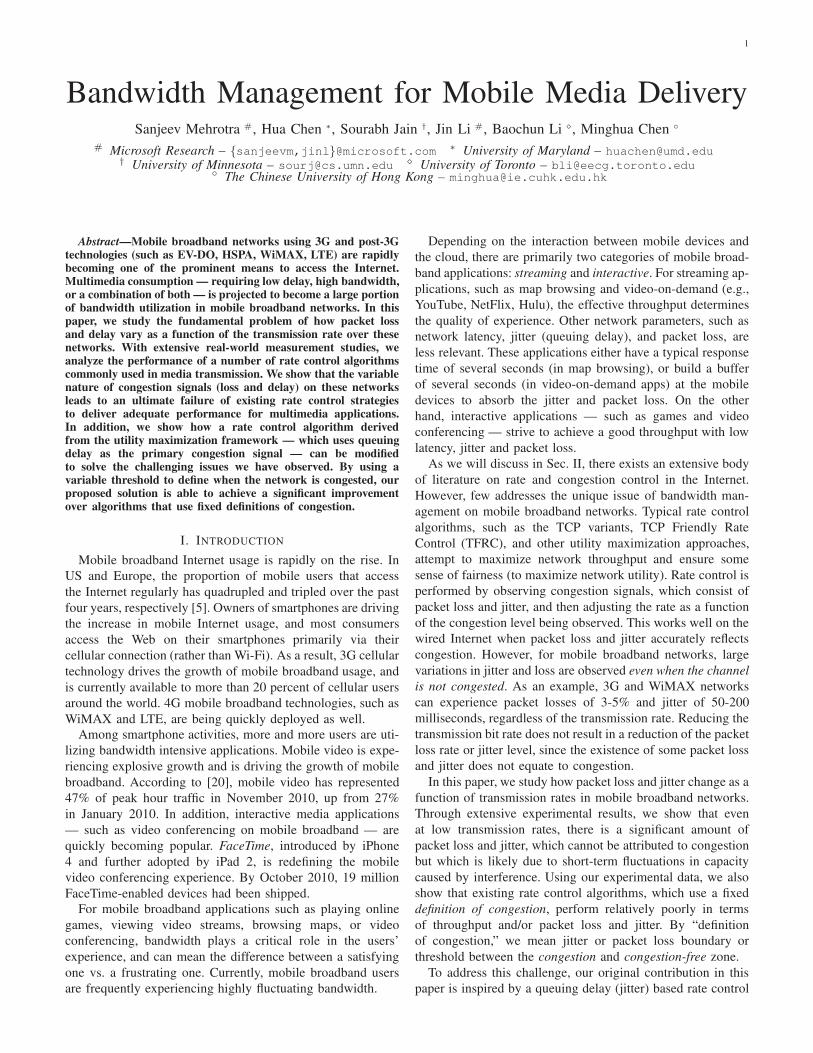
Fig. 1. The system setup for network trace collection. The server is connectedto the Internet via a high-speed connection. The client is connected to theInternet via a mobile broadband connection such as 3G or WiMAX.
mobile broadband networks where these signals are inherently
noisy. However, our work differs along several directions
with respect to previous work. First, we deal with congestion
control protocols which also use queuing delay or jitter as
primary congestion signals as opposed to just packet loss.
Second, we attempt to deal with networks which have variable
levels of noise in jitter and loss as opposed to fixed levels.
As additional contributions, we show that mobile broadband
networks have very high inherent jitter and packet loss levels,
as opposed to traditional networks. This occurs even in the
absence of congestion. This requires a variable threshold in
determining when jitter or packet loss is caused by congestion,
which has not been proposed in the literature. Although using
a high fixed threshold may result in full link utilization for
most networks, it will have a detrimental effect on real-time
applications where delay is also important.
III. EMPIRICAL OBSERVATIONS
A. Network Trace Collection
In this section, we show results from extensive network
traces that we have collected from 3G and WiMAX networks.
Our network trace collection is performed using the setup as
shown in Fig. 1, where the server is connected to the Internet
via a high-speed Internet link, and the client is connected via
a mobile broadband link such as 3G or WiMAX. In such
a setup, the most likely place for the bottleneck link is the
mobile broadband link. We refer to “upload” traffic when the
client sends data to the server and “download” traffic when the
server is sending to the client. We send packets in the upload
or download direction using a payload size of M bytes at a
rate of R bytes/sec. The receiving end observes the arriving
packets and records queuing delay and loss measurements. The
rate R is varied over various transmission rates, and packets
are sent at each rate for a duration of 20 seconds. We have
collected traces in both download and upload directions and at
different times of the day as well as for various packet sizes.
We believe that these constant bitrate “upload”/“download”
settings are the most representative settings in media delivery
and media conferencing applications in commercial wireless
broadband networks. For example, if we are doing video
conferencing at 600 kbps at 30 frames/sec using constant
bitrate video coding, each frame is coded to 2500 bytes. It
can be packetized to two 1250 byte packets or four 625 byte
packets. Note that it is possible to avoid the burst of bitrates
caused by periodic insertion of an I frame by instead using
periodic intra-macroblocks [23]. This strategy can improve
error resiliency in addition to making the video conferencing
bandwidth smooth. For variable bitrate media delivery, the
client typically has a buffer, so assuming a constant bitrate
for transmission is still valid.
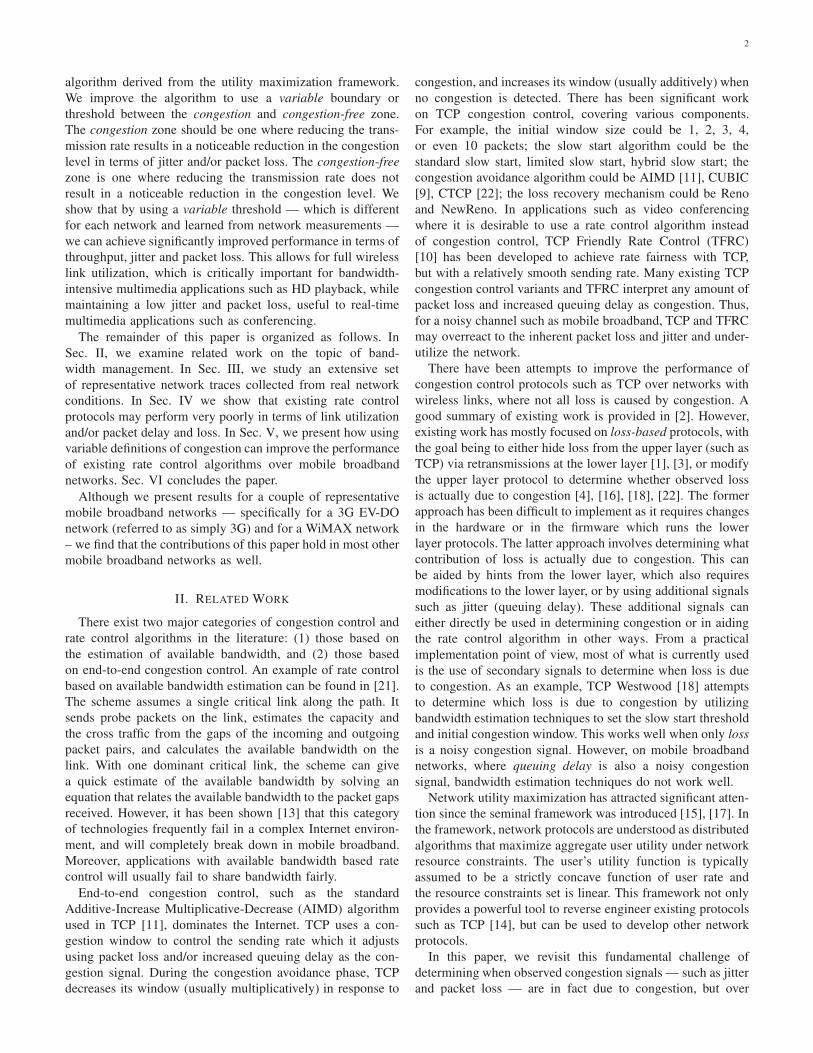
In the following figures, we show the queuing delay and
loss rate observed when sending packets at various rates. The
x-axis shows the rate in kbps and the y-axis shows the one-
way queuing delay (jitter) (OWD) in seconds for the delay
plots, and the loss rate as a fraction for the loss plots. The
OWD is estimated as one-half the RTT, although using clock
drift compensation techniques, true OWD values can also be
obtained. At each particular transmission rate, we draw a
straight vertical line, with the bottom of the line representing
the minimum queuing delay observed and the top of the line
representing the maximum queuing delay observed at that rate.
We use a circle, a diamond, and a cross to represent the
10-, 50- (median), and 90-percentile queuing delay observed,
respectively, and use a star to represent the average queuing
delay at each rate. We visualize the loss data in a similar
fashion, except each loss data point is calculated from the
packet loss rate in a sliding window of 32 packets. Thus, if
we have sent 1, 000 packets at a particular rate, we will have
1000 − 32 = 968 loss data points. We show representative
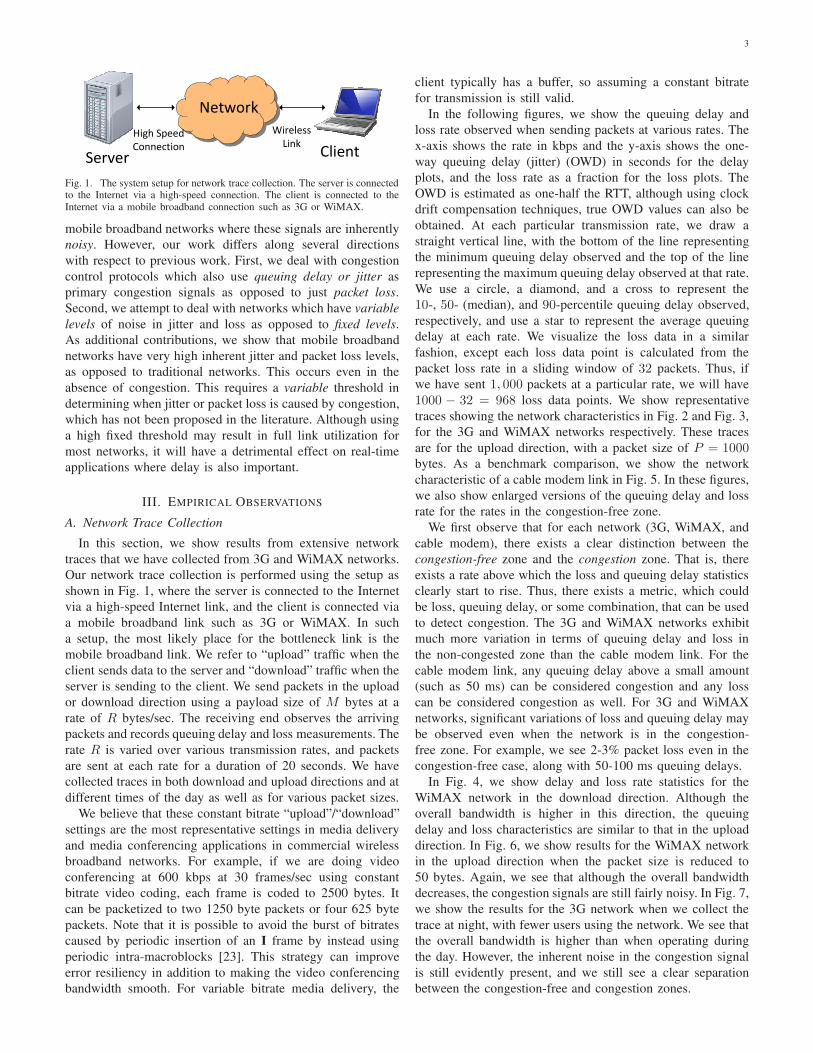
traces showing the network characteristics in Fig. 2 and Fig. 3,
for the 3G and WiMAX networks respectively. These traces
are for the upload direction, with a packet size of P = 1000bytes. As a benchmark comparison, we show the network
characteristic of a cable modem link in Fig. 5. In these figures,
we also show enlarged versions of the queuing delay and loss
rate for the rates in the congestion-free zone.
We first observe that for each network (3G, WiMAX, and
cable modem), there exists a clear distinction between the
congestion-free zone and the congestion zone. That is, there
exists a rate above which the loss and queuing delay statistics
clearly start to rise. Thus, there exists a metric, which could
be loss, queuing delay, or some combination, that can be used
to detect congestion. The 3G and WiMAX networks exhibit
much more variation in terms of queuing delay and loss in
the non-congested zone than the cable modem link. For the
cable modem link, any queuing delay above a small amount
(such as 50 ms) can be considered congestion and any loss
can be considered congestion as well. For 3G and WiMAX
networks, significant variations of loss and queuing delay may
be observed even when the network is in the congestion-
free zone. For example, we see 2-3% packet loss even in the
congestion-free case, along with 50-100 ms queuing delays.
In Fig. 4, we show delay and loss rate statistics for the
WiMAX network in the download direction. Although the
overall bandwidth is higher in this direction, the queuing
delay and loss characteristics are similar to that in the upload
direction. In Fig. 6, we show results for the WiMAX network
in the upload direction when the packet size is reduced to
50 bytes. Again, we see that although the overall bandwidth
decreases, the congestion signals are still fairly noisy. In Fig. 7,
we show the results for the 3G network when we collect the
trace at night, with fewer users using the network. We see that
the overall bandwidth is higher than when operating during
the day. However, the inherent noise in the congestion signal
is still evidently present, and we still see a clear separation
between the congestion-free and congestion zones.
4
0 200 400 6000
2
4
6
8
Rate (kbps)
OW
D (
sec)
10%50%90%Mean
0 200 400 6000
0.2
0.4
0.6
0.8
1
Rate (kbps)
Loss (
fraction)
Avg
0 50 100 150 2000
0.2
0.4
0.6
0.8
Rate (kbps)
OW
D (
sec)
10%50%90%Mean
0 50 100 150 2000
0.1
0.2
0.3
0.4
Rate (kbps)
Loss (
fraction)
Avg
(a) (b) (c) (d)
Fig. 2. Results from network traces showing (a) one-way queuing delay (OWD) and (b) loss rate for the 3G network in upload direction as a function oftransmission rate. In (c), we show enlarged version of the OWD results in the congestion-free zone, and in (d), we show the loss rate in the congestion-freezone. We show the range of values observed, with the 10%, 50%, 90% and mean marked. The loss rate shown is computed over a sliding window of 32packets. The overall average loss rate at a particular bitrate is also marked.
0 200 400 600 8000
0.5
1
1.5
2
2.5
3
Rate (kbps)
OW
D (
sec)
10%50%90%Mean
0 200 400 600 8000
0.2
0.4
0.6
0.8
Rate (kbps)
Loss (
fraction)
Avg
0 100 200 300 4000
0.05
0.1
0.15
0.2
Rate (kbps)O
WD
(sec)
10%50%90%Mean
0 100 200 300 4000
0.1
0.2
0.3
0.4
Rate (kbps)
Loss (
fraction)
Avg
Fig. 3. OWD and loss rate statistics for a WiMAX network trace in the upload direction.
0 1000 2000 3000 4000 50000
0.2
0.4
0.6
0.8
Rate (kbps)
OW
D (
sec)
10%50%90%Mean
0 1000 2000 3000 4000 50000
0.2
0.4
0.6
0.8
1
Rate (kbps)
Loss (
fraction)
Avg
0 1000 2000 3000 40000
0.05
0.1
0.15
0.2
Rate (kbps)
OW
D (
sec)
10%50%90%Mean
0 1000 2000 3000 40000
0.2
0.4
0.6
0.8
1
Rate (kbps)Loss (
fraction)
Avg
Fig. 4. OWD and loss rate statistics for a WiMAX network trace in the download direction.
500 1000 15000
0.5
1
1.5
Rate (kbps)
OW
D (
se
c)
10%50%90%Mean
500 1000 15000
0.1
0.2
0.3
0.4
0.5
Rate (kbps)
Lo
ss (
fra
ctio
n)
Avg
Fig. 5. Statistics for a cable modem connection in upload direction.
0 500 1000 15000
0.5
1
1.5
Rate (kbps)
OW
D (
se
c)
10%50%90%Mean
0 500 1000 15000
0.2
0.4
0.6
0.8
1
Rate (kbps)
Lo
ss (
fra
ctio
n)
Avg
Fig. 6. Statistics for WiMAX network in upload direction with 50B packets.
B. Cause of Noise in the Congestion Signal
The fundamental reason for the inherent and variable nature
of jitter and loss in broadband networks is due to rapid and
short-term fluctuations in short-term capacity.
We illustrate the problem with a simple example. Consider
a mobile broadband network where the mobile link attempts to
0 200 400 600 8000
0.2
0.4
0.6
0.8
Rate (kbps)
OW
D (
sec)
10%50%90%Mean
0 200 400 600 8000
0.2
0.4
0.6
0.8
1
Rate (kbps)
Lo
ss (
fra
ctio
n)
Avg
Fig. 7. Statistics for 3G network in upload direction at night.
compensate for short-term fluctuations in the network capacity
by performing link layer retransmissions up to 50 times.
Suppose the bottleneck link has capacity 500kbps, and the
packet size 512 bytes (4096 bits). Then, we may see up to
410ms additional delay (due to the 50 retransmissions) even
when the sending rate is below the average capacity of the
link due to the short-term fluctuations in capacity. Suppose
that even after the link layer retransmission, some packets are
still lost, resulting in an average loss rate of 0.5% regardless
of the transmission rate.
In this case, many rate control protocols would result in
link under-utilization. For example, a delay-based protocol
may misinterpret the additional delay caused by link layer
retransmissions as queuing delay. If such a protocol has
an operating point that declares any queuing delay above
5
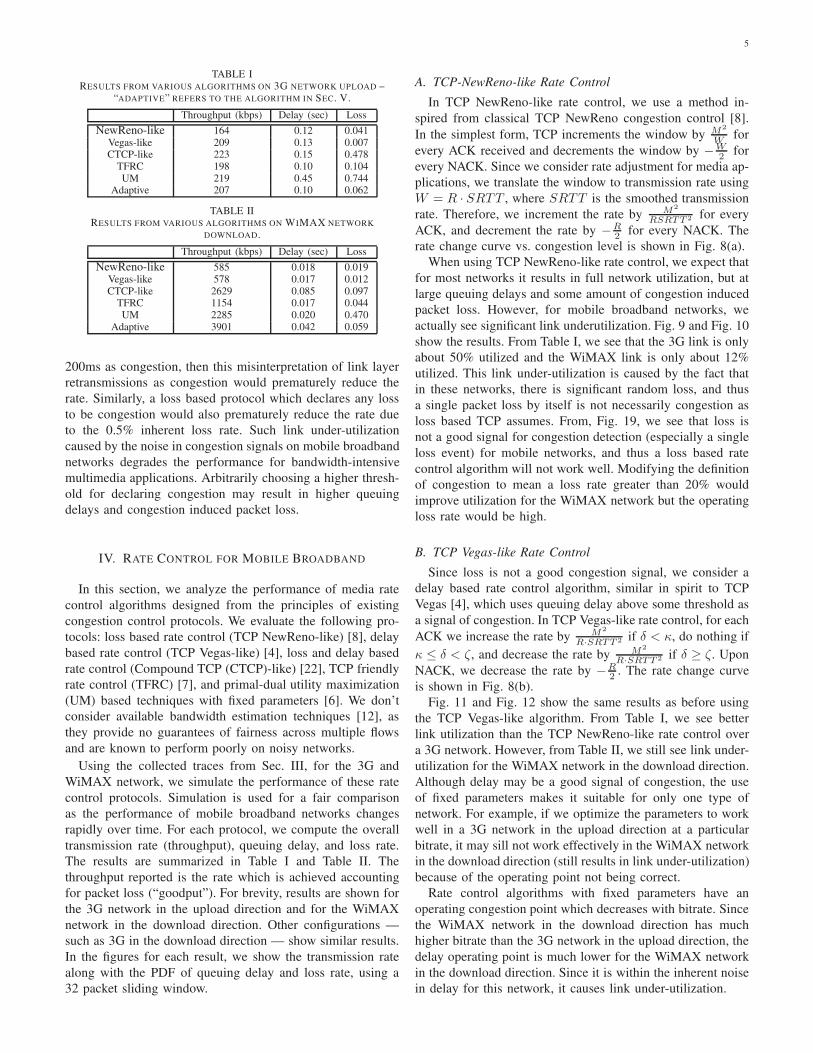
TABLE IRESULTS FROM VARIOUS ALGORITHMS ON 3G NETWORK UPLOAD –
“ADAPTIVE” REFERS TO THE ALGORITHM IN SEC. V.
Throughput (kbps) Delay (sec) Loss
NewReno-like 164 0.12 0.041Vegas-like 209 0.13 0.007CTCP-like 223 0.15 0.478
TFRC 198 0.10 0.104UM 219 0.45 0.744
Adaptive 207 0.10 0.062
TABLE IIRESULTS FROM VARIOUS ALGORITHMS ON WIMAX NETWORK
DOWNLOAD.
Throughput (kbps) Delay (sec) Loss
NewReno-like 585 0.018 0.019Vegas-like 578 0.017 0.012CTCP-like 2629 0.085 0.097
TFRC 1154 0.017 0.044UM 2285 0.020 0.470
Adaptive 3901 0.042 0.059
200ms as congestion, then this misinterpretation of link layer
retransmissions as congestion would prematurely reduce the
rate. Similarly, a loss based protocol which declares any loss
to be congestion would also prematurely reduce the rate due
to the 0.5% inherent loss rate. Such link under-utilization
caused by the noise in congestion signals on mobile broadband
networks degrades the performance for bandwidth-intensive
multimedia applications. Arbitrarily choosing a higher thresh-
old for declaring congestion may result in higher queuing
delays and congestion induced packet loss.
IV. RATE CONTROL FOR MOBILE BROADBAND
In this section, we analyze the performance of media rate
control algorithms designed from the principles of existing
congestion control protocols. We evaluate the following pro-
tocols: loss based rate control (TCP NewReno-like) [8], delay
based rate control (TCP Vegas-like) [4], loss and delay based
rate control (Compound TCP (CTCP)-like) [22], TCP friendly
rate control (TFRC) [7], and primal-dual utility maximization
(UM) based techniques with fixed parameters [6]. We don’t
consider available bandwidth estimation techniques [12], as
they provide no guarantees of fairness across multiple flows
and are known to perform poorly on noisy networks.
Using the collected traces from Sec. III, for the 3G and
WiMAX network, we simulate the performance of these rate
control protocols. Simulation is used for a fair comparison
as the performance of mobile broadband networks changes
rapidly over time. For each protocol, we compute the overall
transmission rate (throughput), queuing delay, and loss rate.
The results are summarized in Table I and Table II. The
throughput reported is the rate which is achieved accounting
for packet loss (“goodput”). For brevity, results are shown for
the 3G network in the upload direction and for the WiMAX
network in the download direction. Other configurations —
such as 3G in the download direction — show similar results.
In the figures for each result, we show the transmission rate
along with the PDF of queuing delay and loss rate, using a
32 packet sliding window.
A. TCP-NewReno-like Rate Control
In TCP NewReno-like rate control, we use a method in-
spired from classical TCP NewReno congestion control [8].
In the simplest form, TCP increments the window by M2
Wfor
every ACK received and decrements the window by −W
2for
every NACK. Since we consider rate adjustment for media ap-
plications, we translate the window to transmission rate using
W = R · SRTT , where SRTT is the smoothed transmission
rate. Therefore, we increment the rate by M2
RSRTT 2 for every
ACK, and decrement the rate by −R
2for every NACK. The
rate change curve vs. congestion level is shown in Fig. 8(a).
When using TCP NewReno-like rate control, we expect that
for most networks it results in full network utilization, but at
large queuing delays and some amount of congestion induced
packet loss. However, for mobile broadband networks, we
actually see significant link underutilization. Fig. 9 and Fig. 10
show the results. From Table I, we see that the 3G link is only
about 50% utilized and the WiMAX link is only about 12%
utilized. This link under-utilization is caused by the fact that
in these networks, there is significant random loss, and thus
a single packet loss by itself is not necessarily congestion as
loss based TCP assumes. From, Fig. 19, we see that loss is
not a good signal for congestion detection (especially a single
loss event) for mobile networks, and thus a loss based rate
control algorithm will not work well. Modifying the definition
of congestion to mean a loss rate greater than 20% would
improve utilization for the WiMAX network but the operating
loss rate would be high.
B. TCP Vegas-like Rate Control
Since loss is not a good congestion signal, we consider a
delay based rate control algorithm, similar in spirit to TCP
Vegas [4], which uses queuing delay above some threshold as
a signal of congestion. In TCP Vegas-like rate control, for each
ACK we increase the rate by M2
R·SRTT 2 if δ < κ, do nothing if
κ ≤ δ < ζ, and decrease the rate by M2
R·SRTT 2 if δ ≥ ζ. Upon
NACK, we decrease the rate by −R
2. The rate change curve
is shown in Fig. 8(b).
Fig. 11 and Fig. 12 show the same results as before using
the TCP Vegas-like algorithm. From Table I, we see better
link utilization than the TCP NewReno-like rate control over
a 3G network. However, from Table II, we still see link under-
utilization for the WiMAX network in the download direction.
Although delay may be a good signal of congestion, the use
of fixed parameters makes it suitable for only one type of
network. For example, if we optimize the parameters to work
well in a 3G network in the upload direction at a particular
bitrate, it may sill not work effectively in the WiMAX network
in the download direction (still results in link under-utilization)
because of the operating point not being correct.
Rate control algorithms with fixed parameters have an
operating congestion point which decreases with bitrate. Since
the WiMAX network in the download direction has much
higher bitrate than the 3G network in the upload direction, the
delay operating point is much lower for the WiMAX network
in the download direction. Since it is within the inherent noise
in delay for this network, it causes link under-utilization.
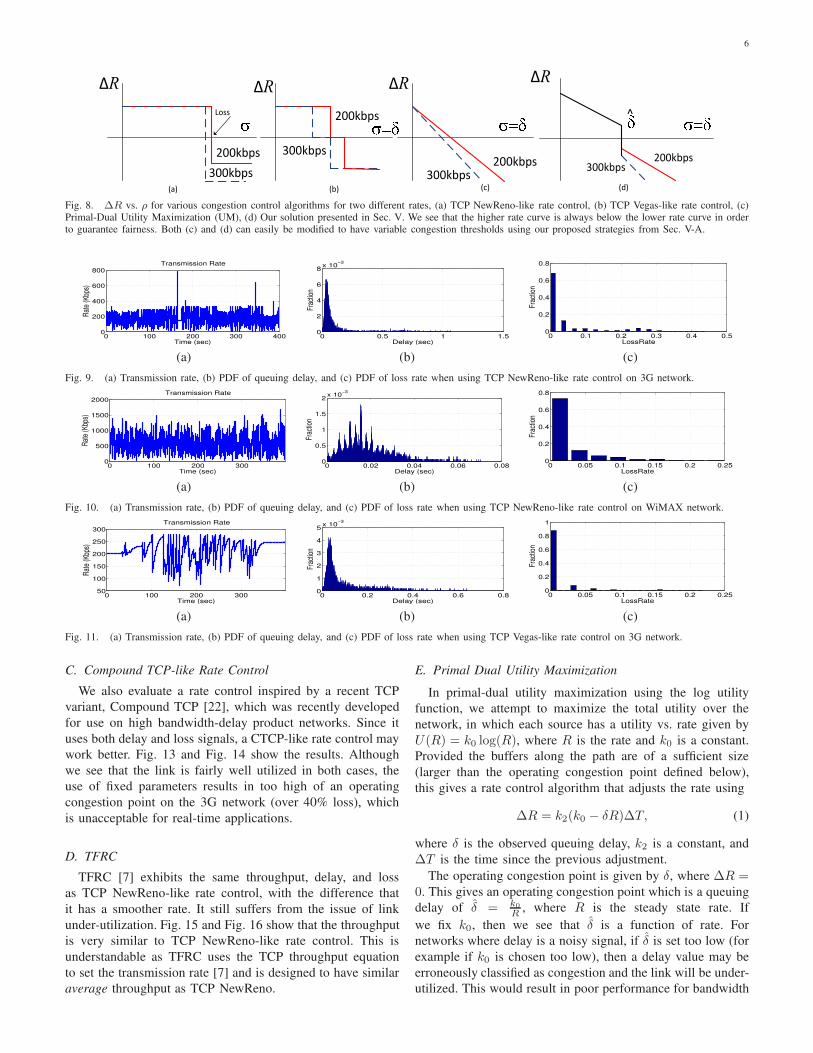
6
ΔR
300kbps200kbps
ΔR
300kbps
200kbps 300kbps
200kbpsLoss
ΔR
(a) (b) (c)
300kbps200kbps
ΔR
(d)
^
Fig. 8. ∆R vs. ρ for various congestion control algorithms for two different rates, (a) TCP NewReno-like rate control, (b) TCP Vegas-like rate control, (c)Primal-Dual Utility Maximization (UM), (d) Our solution presented in Sec. V. We see that the higher rate curve is always below the lower rate curve in orderto guarantee fairness. Both (c) and (d) can easily be modified to have variable congestion thresholds using our proposed strategies from Sec. V-A.
0 100 200 300 4000
200
400
600
800
Time (sec)
Rat
e (K
bps)
Transmission Rate
0 0.5 1 1.50
2
4
6
8x 10
−3
Delay (sec)
Frac
tion
0 0.1 0.2 0.3 0.4 0.50
0.2
0.4
0.6
0.8
LossRate
Frac
tion
(a) (b) (c)
Fig. 9. (a) Transmission rate, (b) PDF of queuing delay, and (c) PDF of loss rate when using TCP NewReno-like rate control on 3G network.
0 100 200 3000
500
1000
1500
2000
Time (sec)
Rat
e (K
bps)
Transmission Rate
0 0.02 0.04 0.06 0.080
0.5
1
1.5
2x 10
−3
Delay (sec)
Frac
tion
0 0.05 0.1 0.15 0.2 0.250
0.2
0.4
0.6
0.8
LossRate
Fra
ctio
n
(a) (b) (c)
Fig. 10. (a) Transmission rate, (b) PDF of queuing delay, and (c) PDF of loss rate when using TCP NewReno-like rate control on WiMAX network.
0 100 200 30050
100
150
200
250
300
Time (sec)
Rat
e (K
bps)
Transmission Rate
0 0.2 0.4 0.6 0.80
1
2
3
4
5x 10
−3
Delay (sec)
Frac
tion
0 0.05 0.1 0.15 0.2 0.250
0.2
0.4
0.6
0.8
1
LossRate
Fra
ctio
n
(a) (b) (c)
Fig. 11. (a) Transmission rate, (b) PDF of queuing delay, and (c) PDF of loss rate when using TCP Vegas-like rate control on 3G network.
C. Compound TCP-like Rate Control
We also evaluate a rate control inspired by a recent TCP
variant, Compound TCP [22], which was recently developed
for use on high bandwidth-delay product networks. Since it
uses both delay and loss signals, a CTCP-like rate control may
work better. Fig. 13 and Fig. 14 show the results. Although
we see that the link is fairly well utilized in both cases, the
use of fixed parameters results in too high of an operating
congestion point on the 3G network (over 40% loss), which
is unacceptable for real-time applications.
D. TFRC
TFRC [7] exhibits the same throughput, delay, and loss
as TCP NewReno-like rate control, with the difference that
it has a smoother rate. It still suffers from the issue of link
under-utilization. Fig. 15 and Fig. 16 show that the throughput
is very similar to TCP NewReno-like rate control. This is
understandable as TFRC uses the TCP throughput equation
to set the transmission rate [7] and is designed to have similar
average throughput as TCP NewReno.
E. Primal Dual Utility Maximization
In primal-dual utility maximization using the log utility
function, we attempt to maximize the total utility over the
network, in which each source has a utility vs. rate given by
U(R) = k0 log(R), where R is the rate and k0 is a constant.
Provided the buffers along the path are of a sufficient size
(larger than the operating congestion point defined below),
this gives a rate control algorithm that adjusts the rate using
∆R = k2(k0 − δR)∆T, (1)
where δ is the observed queuing delay, k2 is a constant, and
∆T is the time since the previous adjustment.
The operating congestion point is given by δ, where ∆R =0. This gives an operating congestion point which is a queuing
delay of δ̂ = k0
R, where R is the steady state rate. If
we fix k0, then we see that δ̂ is a function of rate. For
networks where delay is a noisy signal, if δ̂ is set too low (for
example if k0 is chosen too low), then a delay value may be
erroneously classified as congestion and the link will be under-
utilized. This would result in poor performance for bandwidth
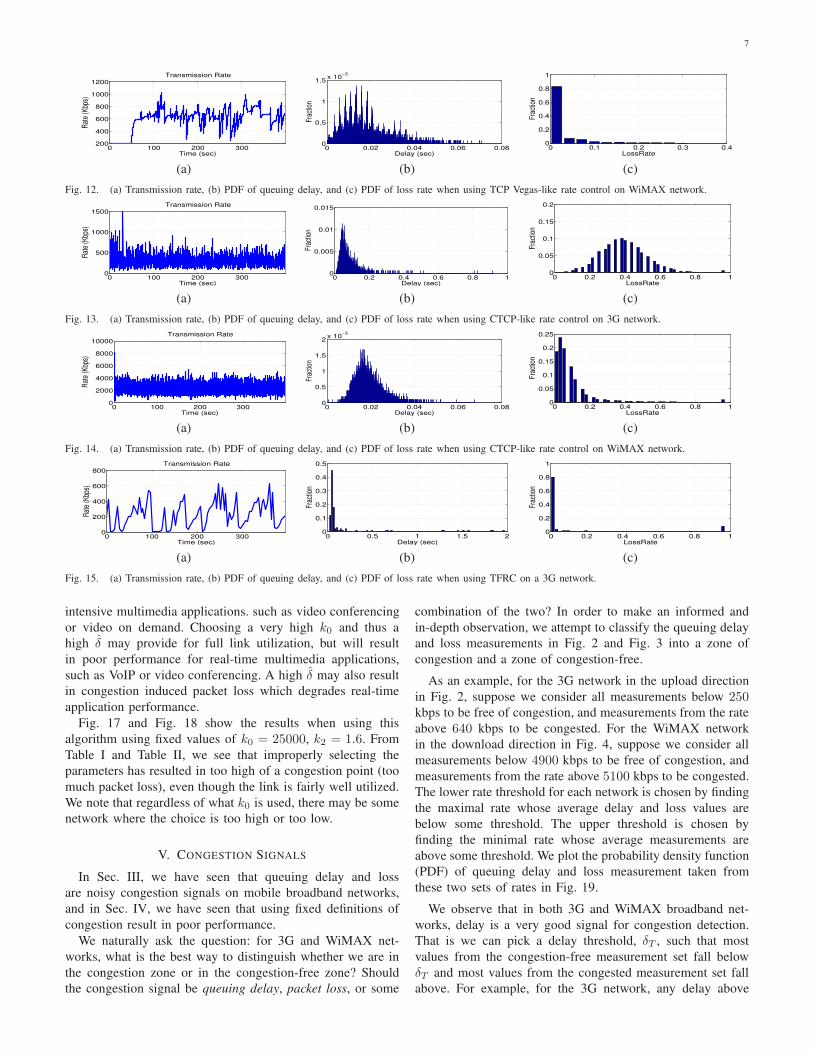
7
0 100 200 300200
400
600
800
1000
1200
Time (sec)
Rat
e (K
bps)
Transmission Rate
0 0.02 0.04 0.06 0.080
0.5
1
1.5x 10
−3
Delay (sec)
Frac
tion
0 0.1 0.2 0.3 0.40
0.2
0.4
0.6
0.8
1
LossRate
Frac
tion
(a) (b) (c)
Fig. 12. (a) Transmission rate, (b) PDF of queuing delay, and (c) PDF of loss rate when using TCP Vegas-like rate control on WiMAX network.
0 100 200 3000
500
1000
1500
Time (sec)
Rat
e (K
bps)
Transmission Rate
0 0.2 0.4 0.6 0.8 10
0.005
0.01
0.015
Delay (sec)
Frac
tion
0 0.2 0.4 0.6 0.8 10
0.05
0.1
0.15
0.2
LossRate
Frac
tion
(a) (b) (c)
Fig. 13. (a) Transmission rate, (b) PDF of queuing delay, and (c) PDF of loss rate when using CTCP-like rate control on 3G network.
0 100 200 3000
2000
4000
6000
8000
10000
Time (sec)
Rat
e (K
bps)
Transmission Rate
0 0.02 0.04 0.06 0.080
0.5
1
1.5
2x 10
−3
Delay (sec)
Frac
tion
0 0.2 0.4 0.6 0.8 10
0.05
0.1
0.15
0.2
0.25
LossRate
Frac
tion
(a) (b) (c)
Fig. 14. (a) Transmission rate, (b) PDF of queuing delay, and (c) PDF of loss rate when using CTCP-like rate control on WiMAX network.
0 100 200 3000
200
400
600
800
Time (sec)
Rat
e (K
bps)
Transmission Rate
0 0.5 1 1.5 20
0.1
0.2
0.3
0.4
0.5
Delay (sec)
Frac
tion
0 0.2 0.4 0.6 0.8 10
0.2
0.4
0.6
0.8
1
LossRate
Frac
tion
(a) (b) (c)
Fig. 15. (a) Transmission rate, (b) PDF of queuing delay, and (c) PDF of loss rate when using TFRC on a 3G network.
intensive multimedia applications. such as video conferencing
or video on demand. Choosing a very high k0 and thus a
high δ̂ may provide for full link utilization, but will result
in poor performance for real-time multimedia applications,
such as VoIP or video conferencing. A high δ̂ may also result
in congestion induced packet loss which degrades real-time
application performance.
Fig. 17 and Fig. 18 show the results when using this
algorithm using fixed values of k0 = 25000, k2 = 1.6. From
Table I and Table II, we see that improperly selecting the
parameters has resulted in too high of a congestion point (too
much packet loss), even though the link is fairly well utilized.
We note that regardless of what k0 is used, there may be some
network where the choice is too high or too low.
V. CONGESTION SIGNALS
In Sec. III, we have seen that queuing delay and loss
are noisy congestion signals on mobile broadband networks,
and in Sec. IV, we have seen that using fixed definitions of
congestion result in poor performance.
We naturally ask the question: for 3G and WiMAX net-
works, what is the best way to distinguish whether we are in
the congestion zone or in the congestion-free zone? Should
the congestion signal be queuing delay, packet loss, or some
combination of the two? In order to make an informed and
in-depth observation, we attempt to classify the queuing delay
and loss measurements in Fig. 2 and Fig. 3 into a zone of
congestion and a zone of congestion-free.
As an example, for the 3G network in the upload direction
in Fig. 2, suppose we consider all measurements below 250kbps to be free of congestion, and measurements from the rate
above 640 kbps to be congested. For the WiMAX network
in the download direction in Fig. 4, suppose we consider all
measurements below 4900 kbps to be free of congestion, and
measurements from the rate above 5100 kbps to be congested.
The lower rate threshold for each network is chosen by finding
the maximal rate whose average delay and loss values are
below some threshold. The upper threshold is chosen by
finding the minimal rate whose average measurements are
above some threshold. We plot the probability density function
(PDF) of queuing delay and loss measurement taken from
these two sets of rates in Fig. 19.
We observe that in both 3G and WiMAX broadband net-
works, delay is a very good signal for congestion detection.
That is we can pick a delay threshold, δT , such that most
values from the congestion-free measurement set fall below
δT and most values from the congested measurement set fall
above. For example, for the 3G network, any delay above
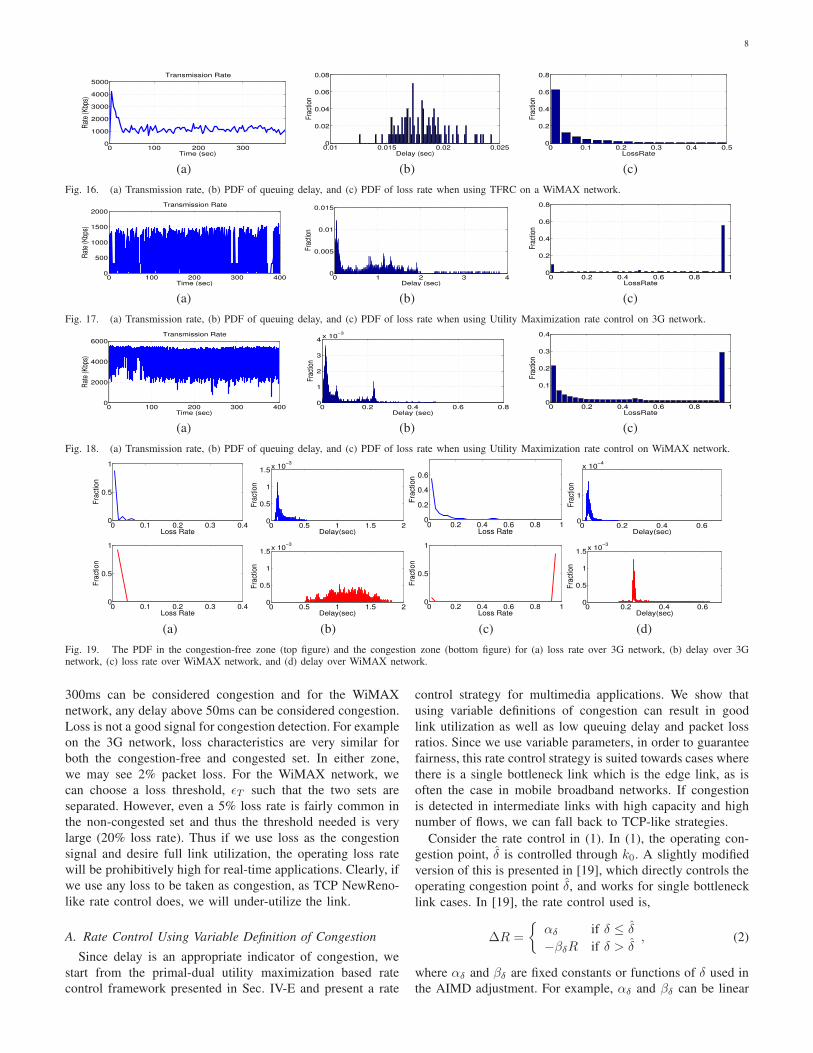
8
0 100 200 3000
1000
2000
3000
4000
5000
Time (sec)
Rat
e (K
bps)
Transmission Rate
0.01 0.015 0.02 0.0250
0.02
0.04
0.06
0.08
Delay (sec)
Fra
ctio
n
0 0.1 0.2 0.3 0.4 0.50
0.2
0.4
0.6
0.8
LossRate
Frac
tion
(a) (b) (c)
Fig. 16. (a) Transmission rate, (b) PDF of queuing delay, and (c) PDF of loss rate when using TFRC on a WiMAX network.
0 100 200 300 4000
500
1000
1500
2000
Time (sec)
Rat
e (K
bps)
Transmission Rate
0 1 2 3 40
0.005
0.01
0.015
Delay (sec)
Frac
tion
0 0.2 0.4 0.6 0.8 10
0.2
0.4
0.6
0.8
LossRate
Frac
tion
(a) (b) (c)
Fig. 17. (a) Transmission rate, (b) PDF of queuing delay, and (c) PDF of loss rate when using Utility Maximization rate control on 3G network.
0 100 200 300 4000
2000
4000
6000
Time (sec)
Rat
e (K
bps)
Transmission Rate
0 0.2 0.4 0.6 0.80
1
2
3
4x 10
−3
Delay (sec)
Frac
tion
0 0.2 0.4 0.6 0.8 10
0.1
0.2
0.3
0.4
LossRate
Frac
tion
(a) (b) (c)
Fig. 18. (a) Transmission rate, (b) PDF of queuing delay, and (c) PDF of loss rate when using Utility Maximization rate control on WiMAX network.
0 0.1 0.2 0.3 0.40
0.5
1
Loss Rate
Fra
ctio
n
0 0.5 1 1.5 20
0.5
1
1.5x 10
−3
Delay(sec)
Fra
ctio
n
0 0.2 0.4 0.6 0.8 10
0.2
0.4
0.6
Loss Rate
Fra
ctio
n
0 0.2 0.4 0.60
1
x 10−4
Delay(sec)
Fra
ctio
n
0 0.1 0.2 0.3 0.40
0.5
1
Loss Rate
Fra
ctio
n
0 0.5 1 1.5 20
0.5
1
1.5x 10
−3
Delay(sec)
Fra
ctio
n
0 0.2 0.4 0.6 0.8 10
0.5
1
Loss Rate
Fra
ctio
n
0 0.2 0.4 0.60
0.5
1
1.5x 10
−3
Delay(sec)
Fra
ctio
n
(a) (b) (c) (d)
Fig. 19. The PDF in the congestion-free zone (top figure) and the congestion zone (bottom figure) for (a) loss rate over 3G network, (b) delay over 3Gnetwork, (c) loss rate over WiMAX network, and (d) delay over WiMAX network.
300ms can be considered congestion and for the WiMAX
network, any delay above 50ms can be considered congestion.
Loss is not a good signal for congestion detection. For example
on the 3G network, loss characteristics are very similar for
both the congestion-free and congested set. In either zone,
we may see 2% packet loss. For the WiMAX network, we
can choose a loss threshold, ǫT such that the two sets are
separated. However, even a 5% loss rate is fairly common in
the non-congested set and thus the threshold needed is very
large (20% loss rate). Thus if we use loss as the congestion
signal and desire full link utilization, the operating loss rate
will be prohibitively high for real-time applications. Clearly, if
we use any loss to be taken as congestion, as TCP NewReno-
like rate control does, we will under-utilize the link.
A. Rate Control Using Variable Definition of Congestion
Since delay is an appropriate indicator of congestion, we
start from the primal-dual utility maximization based rate
control framework presented in Sec. IV-E and present a rate
control strategy for multimedia applications. We show that
using variable definitions of congestion can result in good
link utilization as well as low queuing delay and packet loss
ratios. Since we use variable parameters, in order to guarantee
fairness, this rate control strategy is suited towards cases where
there is a single bottleneck link which is the edge link, as is
often the case in mobile broadband networks. If congestion
is detected in intermediate links with high capacity and high
number of flows, we can fall back to TCP-like strategies.
Consider the rate control in (1). In (1), the operating con-
gestion point, δ̂ is controlled through k0. A slightly modified
version of this is presented in [19], which directly controls the
operating congestion point δ̂, and works for single bottleneck
link cases. In [19], the rate control used is,
∆R =
{
αδ if δ ≤ δ̂
−βδR if δ > δ̂, (2)
where αδ and βδ are fixed constants or functions of δ used in
the AIMD adjustment. For example, αδ and βδ can be linear
9
functions of δ as in
αδ = αmax + (αmin − αmax)δ
δ̂(3)
βδ = min
(
βmax, βmin + (βmax − βmin)δ − δ̂
δmax − δ̂
)
(4)
Regardless of whether (1) or (2) is used, the operating conges-
tion point is given by δ̂ and is either directly set or indirectly
set through the choice of k0. In order for the rate control
strategy to provide the lowest possible congestion point given
network characteristics while providing full link utilization, we
need to find δ̂ to properly disambiguate the boundary between
the congestion zone and the congestion-free zone.
We propose to adapt or choose δ̂ (either directly or indirectly
through k0) by learning network characteristics for various
networks. For example, for clean networks δ̂ can be chosen to
be a low value and still result in full network utilization. For
noisy networks such as mobile broadband networks, δ̂ needs
to be large enough so that the rate control algorithm does
not confuse random noise in delay as a congestion signal.
At the same time, we do not want to arbitrarily set it to
a large value as it hurts real-time multimedia applications.
For full link utilization, while maintaining a low congestion
level, an appropriate choice is to make δ̂ just slightly larger
than δT . For example, δT can be chosen using the analysis
above to minimize the misclassification of elements in the
congestion-free set as being congested. The congestion-free set
of delay measurements consists of delay values obtained when
transmitting at rates which are known to be not congested, for
example very low rates.
B. Performance
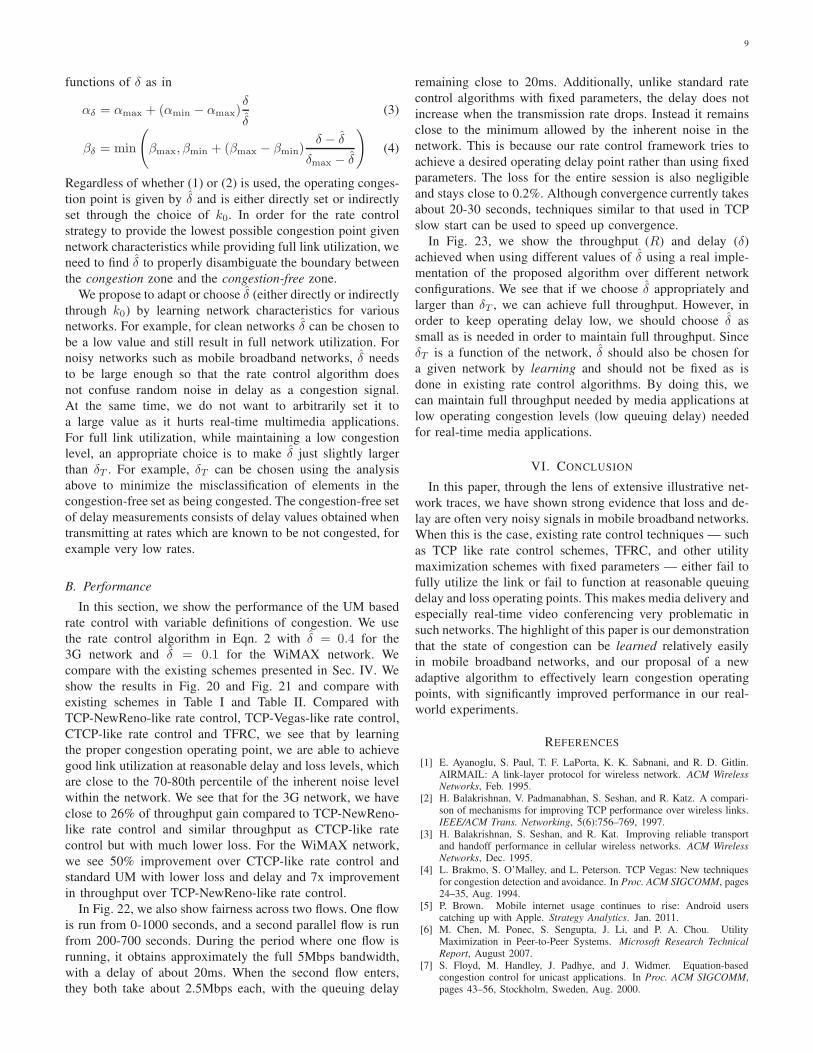
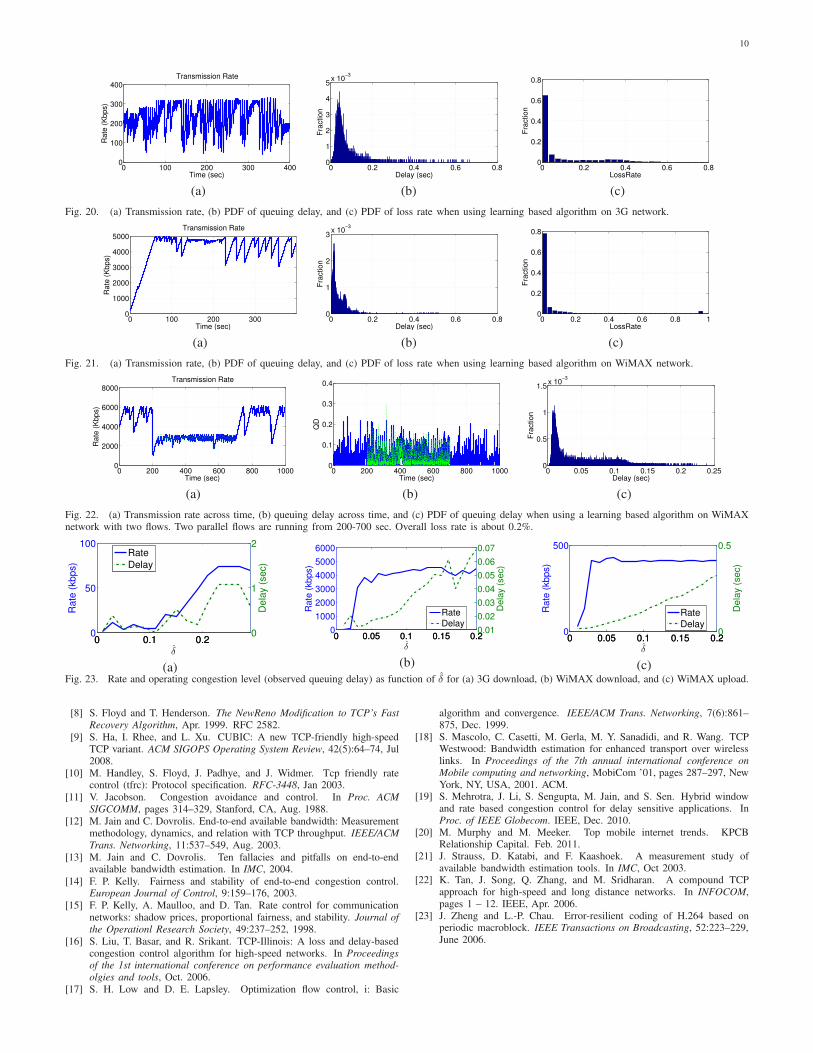
In this section, we show the performance of the UM based
rate control with variable definitions of congestion. We use
the rate control algorithm in Eqn. 2 with δ̂ = 0.4 for the
3G network and δ̂ = 0.1 for the WiMAX network. We
compare with the existing schemes presented in Sec. IV. We
show the results in Fig. 20 and Fig. 21 and compare with
existing schemes in Table I and Table II. Compared with
TCP-NewReno-like rate control, TCP-Vegas-like rate control,
CTCP-like rate control and TFRC, we see that by learning
the proper congestion operating point, we are able to achieve
good link utilization at reasonable delay and loss levels, which
are close to the 70-80th percentile of the inherent noise level
within the network. We see that for the 3G network, we have
close to 26% of throughput gain compared to TCP-NewReno-
like rate control and similar throughput as CTCP-like rate
control but with much lower loss. For the WiMAX network,
we see 50% improvement over CTCP-like rate control and
standard UM with lower loss and delay and 7x improvement
in throughput over TCP-NewReno-like rate control.
In Fig. 22, we also show fairness across two flows. One flow
is run from 0-1000 seconds, and a second parallel flow is run
from 200-700 seconds. During the period where one flow is
running, it obtains approximately the full 5Mbps bandwidth,
with a delay of about 20ms. When the second flow enters,
they both take about 2.5Mbps each, with the queuing delay
remaining close to 20ms. Additionally, unlike standard rate
control algorithms with fixed parameters, the delay does not
increase when the transmission rate drops. Instead it remains
close to the minimum allowed by the inherent noise in the
network. This is because our rate control framework tries to
achieve a desired operating delay point rather than using fixed
parameters. The loss for the entire session is also negligible
and stays close to 0.2%. Although convergence currently takes
about 20-30 seconds, techniques similar to that used in TCP
slow start can be used to speed up convergence.
In Fig. 23, we show the throughput (R) and delay (δ)
achieved when using different values of δ̂ using a real imple-
mentation of the proposed algorithm over different network
configurations. We see that if we choose δ̂ appropriately and
larger than δT , we can achieve full throughput. However, in
order to keep operating delay low, we should choose δ̂ as
small as is needed in order to maintain full throughput. Since
δT is a function of the network, δ̂ should also be chosen for
a given network by learning and should not be fixed as is
done in existing rate control algorithms. By doing this, we
can maintain full throughput needed by media applications at
low operating congestion levels (low queuing delay) needed
for real-time media applications.
VI. CONCLUSION
In this paper, through the lens of extensive illustrative net-
work traces, we have shown strong evidence that loss and de-
lay are often very noisy signals in mobile broadband networks.
When this is the case, existing rate control techniques — such
as TCP like rate control schemes, TFRC, and other utility
maximization schemes with fixed parameters — either fail to
fully utilize the link or fail to function at reasonable queuing
delay and loss operating points. This makes media delivery and
especially real-time video conferencing very problematic in
such networks. The highlight of this paper is our demonstration
that the state of congestion can be learned relatively easily
in mobile broadband networks, and our proposal of a new
adaptive algorithm to effectively learn congestion operating
points, with significantly improved performance in our real-
world experiments.
REFERENCES
[1] E. Ayanoglu, S. Paul, T. F. LaPorta, K. K. Sabnani, and R. D. Gitlin.AIRMAIL: A link-layer protocol for wireless network. ACM WirelessNetworks, Feb. 1995.
[2] H. Balakrishnan, V. Padmanabhan, S. Seshan, and R. Katz. A compari-son of mechanisms for improving TCP performance over wireless links.IEEE/ACM Trans. Networking, 5(6):756–769, 1997.
[3] H. Balakrishnan, S. Seshan, and R. Kat. Improving reliable transportand handoff performance in cellular wireless networks. ACM WirelessNetworks, Dec. 1995.
[4] L. Brakmo, S. O’Malley, and L. Peterson. TCP Vegas: New techniquesfor congestion detection and avoidance. In Proc. ACM SIGCOMM, pages24–35, Aug. 1994.
[5] P. Brown. Mobile internet usage continues to rise: Android userscatching up with Apple. Strategy Analytics. Jan. 2011.
[6] M. Chen, M. Ponec, S. Sengupta, J. Li, and P. A. Chou. UtilityMaximization in Peer-to-Peer Systems. Microsoft Research Technical
Report, August 2007.[7] S. Floyd, M. Handley, J. Padhye, and J. Widmer. Equation-based
congestion control for unicast applications. In Proc. ACM SIGCOMM,pages 43–56, Stockholm, Sweden, Aug. 2000.
10
0 100 200 300 4000
100
200
300
400
Time (sec)
Rate
(K
bps)
Transmission Rate
0 0.2 0.4 0.6 0.80
1
2
3
4
5x 10
−3
Delay (sec)
Fra
ction
0 0.2 0.4 0.6 0.80
0.2
0.4
0.6
0.8
LossRate
Fra
ction
(a) (b) (c)
Fig. 20. (a) Transmission rate, (b) PDF of queuing delay, and (c) PDF of loss rate when using learning based algorithm on 3G network.
0 100 200 3000
1000
2000
3000
4000
5000
Time (sec)
Rate
(K
bps)
Transmission Rate
0 0.2 0.4 0.6 0.80
1
2
3x 10
−3
Delay (sec)F
raction
0 0.2 0.4 0.6 0.8 10
0.2
0.4
0.6
0.8
LossRate
Fra
ction
(a) (b) (c)
Fig. 21. (a) Transmission rate, (b) PDF of queuing delay, and (c) PDF of loss rate when using learning based algorithm on WiMAX network.
0 200 400 600 800 10000
2000
4000
6000
8000
Time (sec)
Rate
(K
bps)
Transmission Rate
0 200 400 600 800 10000
0.1
0.2
0.3
0.4
Time (sec)
QD
0 0.05 0.1 0.15 0.2 0.250
0.5
1
1.5x 10
−3
Delay (sec)
Fra
ction
(a) (b) (c)
Fig. 22. (a) Transmission rate across time, (b) queuing delay across time, and (c) PDF of queuing delay when using a learning based algorithm on WiMAXnetwork with two flows. Two parallel flows are running from 200-700 sec. Overall loss rate is about 0.2%.
0 0.1 0.20
50
100
δ̂
Rate
(kbps)
0 0.1 0.20
1
2
Dela
y (
sec)
Rate
Delay
(a)
0 0.05 0.1 0.15 0.20
1000
2000
3000
4000
5000
6000
δ̂
Rate
(kbps)
0 0.05 0.1 0.15 0.20.01
0.02
0.03
0.04
0.05
0.06
0.07
Dela
y (
sec)
Rate
Delay
(b)
0 0.05 0.1 0.15 0.20
500
δ̂
Rate
(kbps)
0 0.05 0.1 0.15 0.20
0.5
Dela
y (
sec)
Rate
Delay
(c)Fig. 23. Rate and operating congestion level (observed queuing delay) as function of δ̂ for (a) 3G download, (b) WiMAX download, and (c) WiMAX upload.
[8] S. Floyd and T. Henderson. The NewReno Modification to TCP’s Fast
Recovery Algorithm, Apr. 1999. RFC 2582.
[9] S. Ha, I. Rhee, and L. Xu. CUBIC: A new TCP-friendly high-speedTCP variant. ACM SIGOPS Operating System Review, 42(5):64–74, Jul2008.
[10] M. Handley, S. Floyd, J. Padhye, and J. Widmer. Tcp friendly ratecontrol (tfrc): Protocol specification. RFC-3448, Jan 2003.
[11] V. Jacobson. Congestion avoidance and control. In Proc. ACM
SIGCOMM, pages 314–329, Stanford, CA, Aug. 1988.
[12] M. Jain and C. Dovrolis. End-to-end available bandwidth: Measurementmethodology, dynamics, and relation with TCP throughput. IEEE/ACM
Trans. Networking, 11:537–549, Aug. 2003.
[13] M. Jain and C. Dovrolis. Ten fallacies and pitfalls on end-to-endavailable bandwidth estimation. In IMC, 2004.
[14] F. P. Kelly. Fairness and stability of end-to-end congestion control.European Journal of Control, 9:159–176, 2003.
[15] F. P. Kelly, A. Maulloo, and D. Tan. Rate control for communicationnetworks: shadow prices, proportional fairness, and stability. Journal of
the Operationl Research Society, 49:237–252, 1998.
[16] S. Liu, T. Basar, and R. Srikant. TCP-Illinois: A loss and delay-basedcongestion control algorithm for high-speed networks. In Proceedingsof the 1st international conference on performance evaluation method-
olgies and tools, Oct. 2006.
[17] S. H. Low and D. E. Lapsley. Optimization flow control, i: Basic
algorithm and convergence. IEEE/ACM Trans. Networking, 7(6):861–875, Dec. 1999.
[18] S. Mascolo, C. Casetti, M. Gerla, M. Y. Sanadidi, and R. Wang. TCPWestwood: Bandwidth estimation for enhanced transport over wirelesslinks. In Proceedings of the 7th annual international conference on
Mobile computing and networking, MobiCom ’01, pages 287–297, NewYork, NY, USA, 2001. ACM.
[19] S. Mehrotra, J. Li, S. Sengupta, M. Jain, and S. Sen. Hybrid windowand rate based congestion control for delay sensitive applications. InProc. of IEEE Globecom. IEEE, Dec. 2010.
[20] M. Murphy and M. Meeker. Top mobile internet trends. KPCBRelationship Capital. Feb. 2011.
[21] J. Strauss, D. Katabi, and F. Kaashoek. A measurement study ofavailable bandwidth estimation tools. In IMC, Oct 2003.
[22] K. Tan, J. Song, Q. Zhang, and M. Sridharan. A compound TCPapproach for high-speed and long distance networks. In INFOCOM,pages 1 – 12. IEEE, Apr. 2006.
[23] J. Zheng and L.-P. Chau. Error-resilient coding of H.264 based onperiodic macroblock. IEEE Transactions on Broadcasting, 52:223–229,June 2006.


![[Mobile Content Delivery] 5 Statistics that should Prompt You to Focus on Mobile Content Delivery](https://img.pdfslide.net/doc/110x75/5577d0edd8b42ae0418b4e39/mobile-content-delivery-5-statistics-that-should-prompt-you-to-focus-on-mobile-content-delivery.jpg)