Embed Size (px)
Citation preview
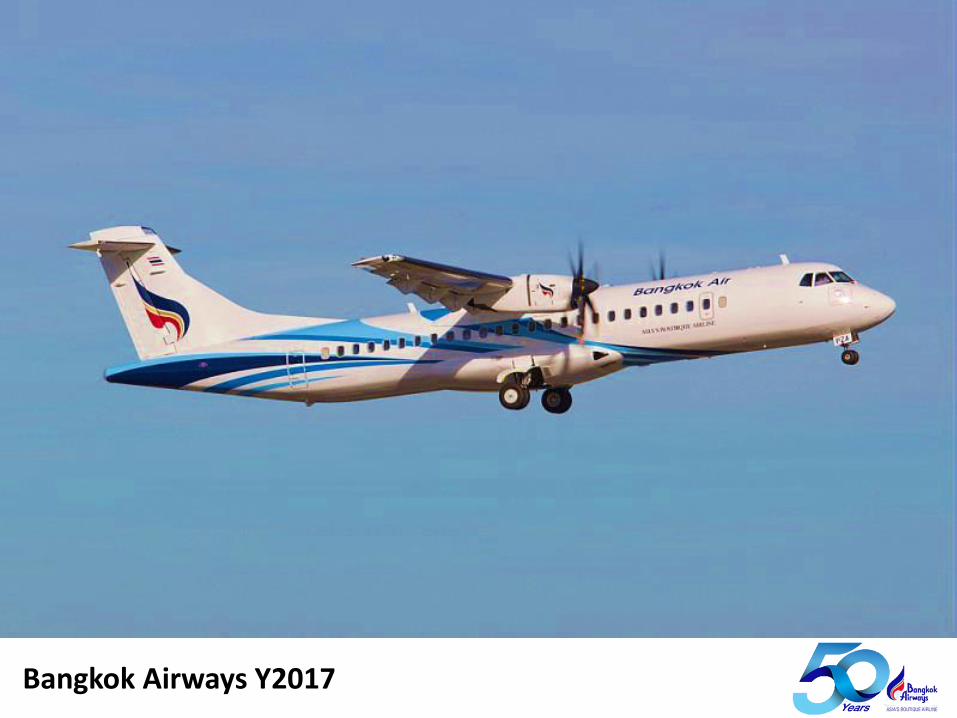
Bangkok Airways Y2017
Information contained in our presentation is intended solely for your reference.
Such information is subject to change without notice, its accuracy is not guaranteed and it may not contain all material information concerning the company.
In addition, the information contains projections and forward-looking statements that reflect the company’s current views with respect to future events and financial performance.
These views are based on assumptions subject to various risks. No assurance can be given that future events will occur, that projections will be achieved, or that the company’s assumptions are correct.
Actual results may differ materially from those projected.
Disclaimer
2
Market Overview : International Visitor Arrival to Thailand
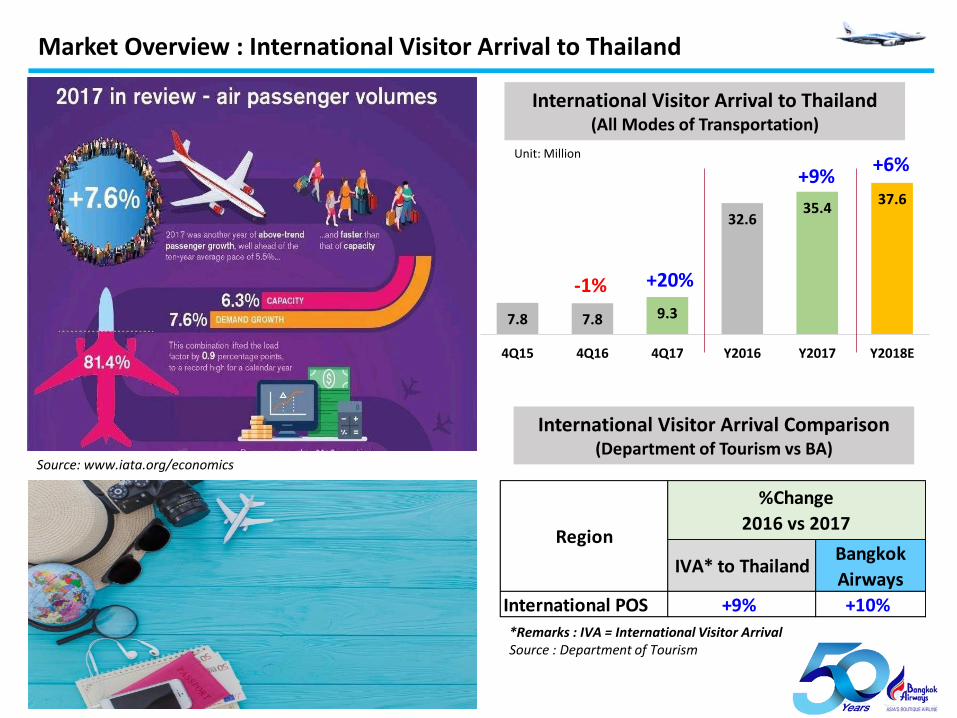
7.8 7.8 9.3
32.635.4
37.6
4Q15 4Q16 4Q17 Y2016 Y2017 Y2018E
International Visitor Arrival to Thailand(All Modes of Transportation)
Unit: Million
+20%-1%
+9%+6%
International Visitor Arrival Comparison(Department of Tourism vs BA)
*Remarks : IVA = International Visitor ArrivalSource : Department of Tourism
IVA* to ThailandBangkok
Airways
International POS +9% +10%
%Change
2016 vs 2017Region
Source: www.iata.org/economics
Operating Statistics 4Q & Y2017
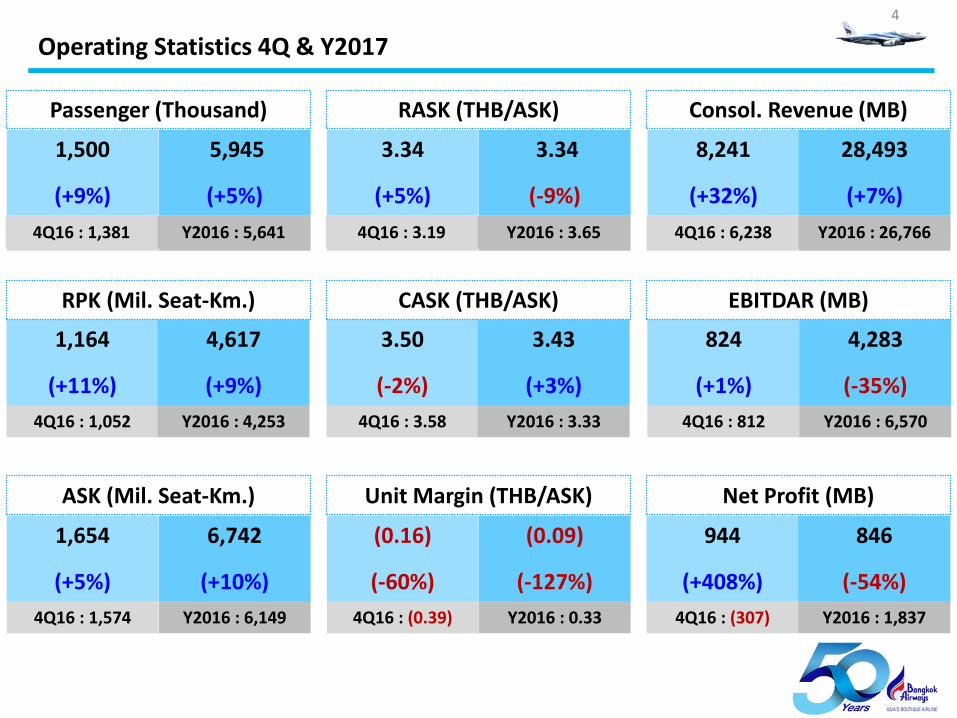
1,500
(+9%)
2Q-16 : 1,239
1,164
(+11%)
4Q16 : 1,052
1,654
(+5%)
4Q16 : 1,574
5,945
(+5%)
6M-16 : 2,819
4,617
(+9%)
Y2016 : 4,253
6,742
(+10%)
Y2016 : 6,149
Passenger (Thousand)
RPK (Mil. Seat-Km.)
ASK (Mil. Seat-Km.)
3.34
(+5%)
2Q-16 : 3.33
3.50
(-2%)
4Q16 : 3.58
(0.16)
(-60%)
4Q16 : (0.39)
3.34
(-9%)
6M-16 : 3.89
3.43
(+3%)
Y2016 : 3.33
(0.09)
(-127%)
Y2016 : 0.33
RASK (THB/ASK)
CASK (THB/ASK)
Unit Margin (THB/ASK)
8,241
(+32%)
2Q-16 : 6,055
824
(+1%)
4Q16 : 812
944
(+408%)
4Q16 : (307)
28,493
(+7%)
6M-16 : 13,830
4,283
(-35%)
Y2016 : 6,570
846
(-54%)
Y2016 : 1,837
Consol. Revenue (MB)
EBITDAR (MB)
Net Profit (MB)
4
4Q16 : 1,381 Y2016 : 5,641 4Q16 : 3.19 Y2016 : 3.65 4Q16 : 6,238 Y2016 : 26,766
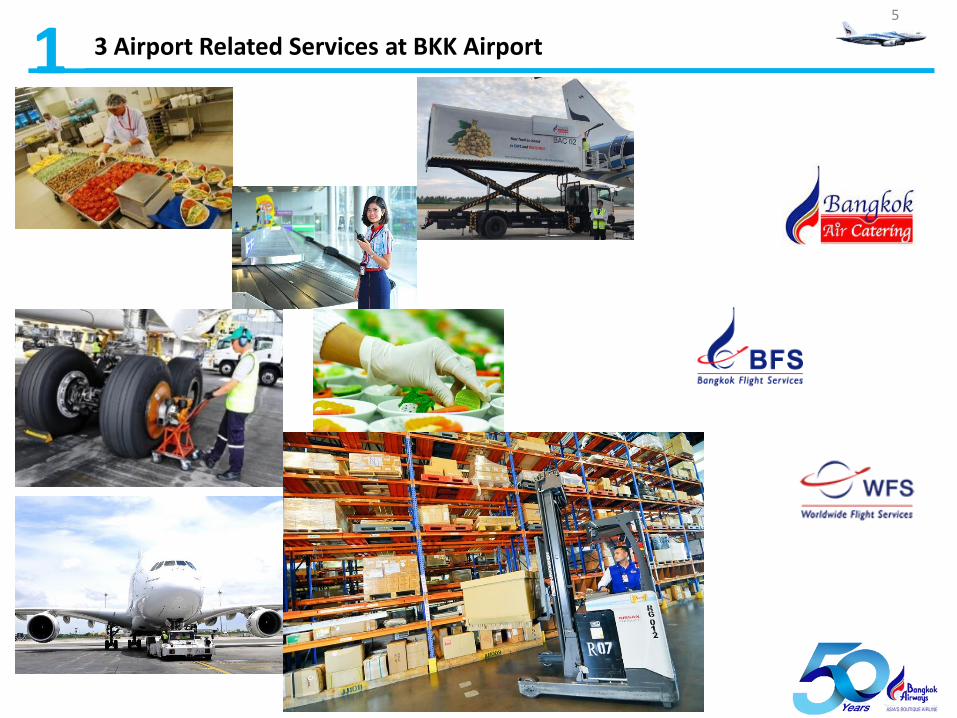
3 Airport Related Services at BKK Airport15
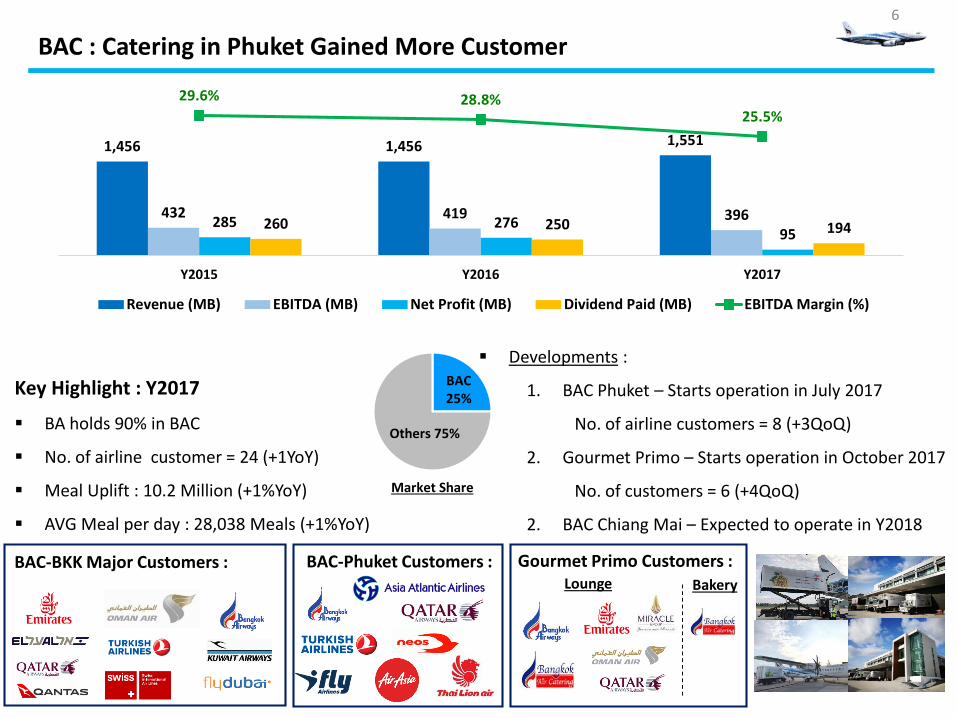
BAC : Catering in Phuket Gained More Customer
Key Highlight : Y2017
BA holds 90% in BAC
No. of airline customer = 24 (+1YoY)
Meal Uplift : 10.2 Million (+1%YoY)
AVG Meal per day : 28,038 Meals (+1%YoY)
BAC-BKK Major Customers :
BAC 25%
Others 75%
Market Share
6
Developments :
1. BAC Phuket – Starts operation in July 2017
No. of airline customers = 8 (+3QoQ)
2. Gourmet Primo – Starts operation in October 2017
No. of customers = 6 (+4QoQ)
2. BAC Chiang Mai – Expected to operate in Y2018
BAC-Phuket Customers : Gourmet Primo Customers :Lounge Bakery
1,456 1,456 1,551
432 419 396285 27695
260 250 194
29.6% 28.8%25.5%
0.0%
5.0%
10.0%
15.0%
20.0%
25.0%
30.0%
35.0%
-200
0
200
400
600
800
1,000
1,200
1,400
1,600
1,800
2,000
2,200
2,400
2,600
Y2015 Y2016 Y2017
Revenue (MB) EBITDA (MB) Net Profit (MB) Dividend Paid (MB) EBITDA Margin (%)
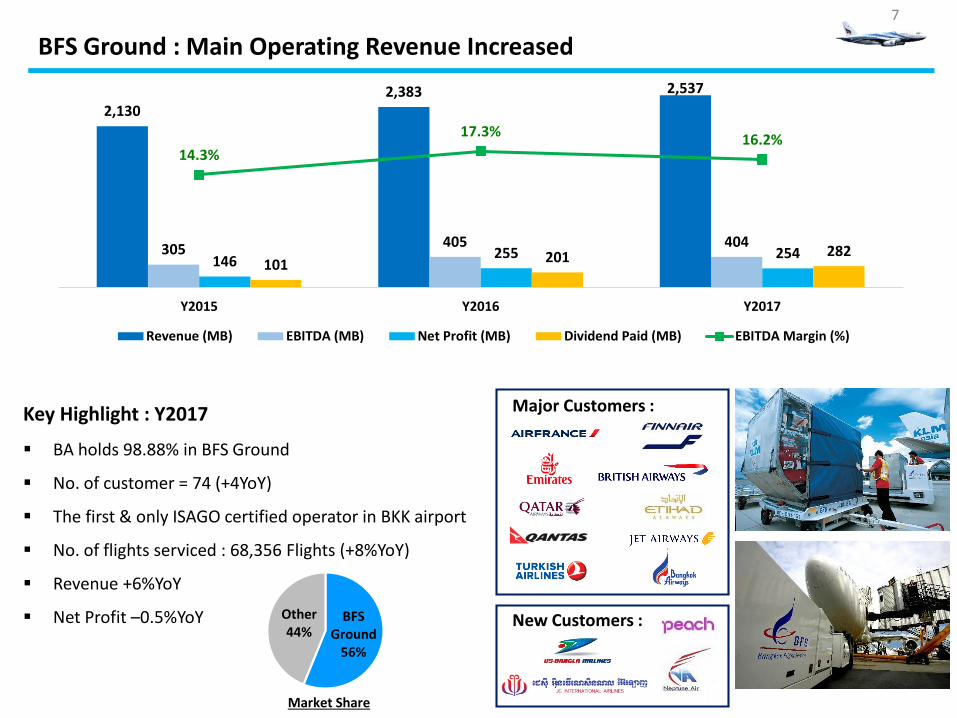
BFS Ground : Main Operating Revenue Increased
Key Highlight : Y2017
BA holds 98.88% in BFS Ground
No. of customer = 74 (+4YoY)
The first & only ISAGO certified operator in BKK airport
No. of flights serviced : 68,356 Flights (+8%YoY)
Revenue +6%YoY
Net Profit –0.5%YoY
Major Customers :
New Customers :BFS Ground
56%
Other 44%
Market Share
7
2,1302,383 2,537
305 405 404146
255 254101 201 282
14.3%
17.3%16.2%
0.0%
5.0%
10.0%
15.0%
20.0%
25.0%
0
200
400
600
800
1,000
1,200
1,400
1,600
1,800
2,000
2,200
2,400
2,600
Y2015 Y2016 Y2017
Revenue (MB) EBITDA (MB) Net Profit (MB) Dividend Paid (MB) EBITDA Margin (%)
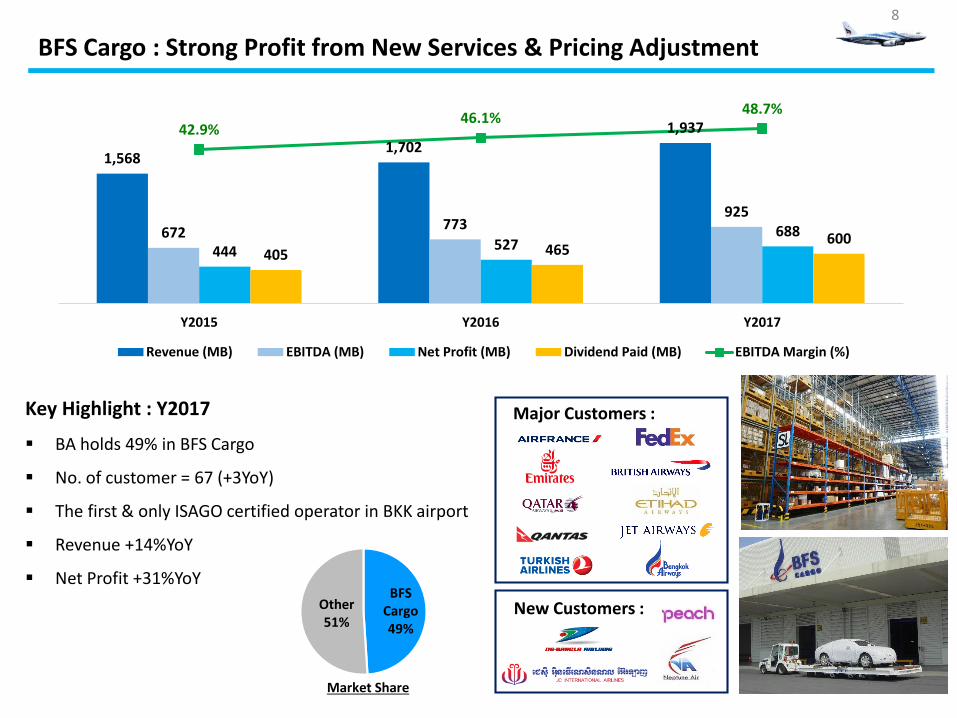
BFS Cargo : Strong Profit from New Services & Pricing Adjustment
Key Highlight : Y2017
BA holds 49% in BFS Cargo
No. of customer = 67 (+3YoY)
The first & only ISAGO certified operator in BKK airport
Revenue +14%YoY
Net Profit +31%YoY
Major Customers :
New Customers :BFS
Cargo 49%
Other 51%
Market Share
8
1,5681,702
1,937
672773
925
444 527688
405 465600
42.9%46.1%
48.7%
0.0%
10.0%
20.0%
30.0%
40.0%
50.0%
60.0%
0
200
400
600
800
1,000
1,200
1,400
1,600
1,800
2,000
2,200
2,400
2,600
Y2015 Y2016 Y2017
Revenue (MB) EBITDA (MB) Net Profit (MB) Dividend Paid (MB) EBITDA Margin (%)
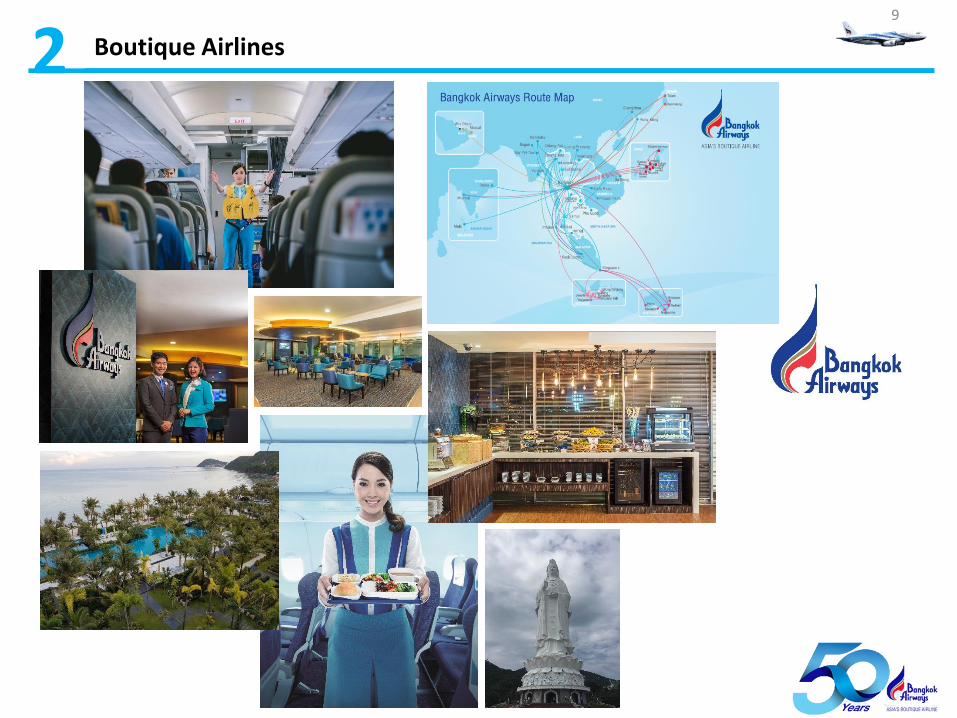
Boutique Airlines29
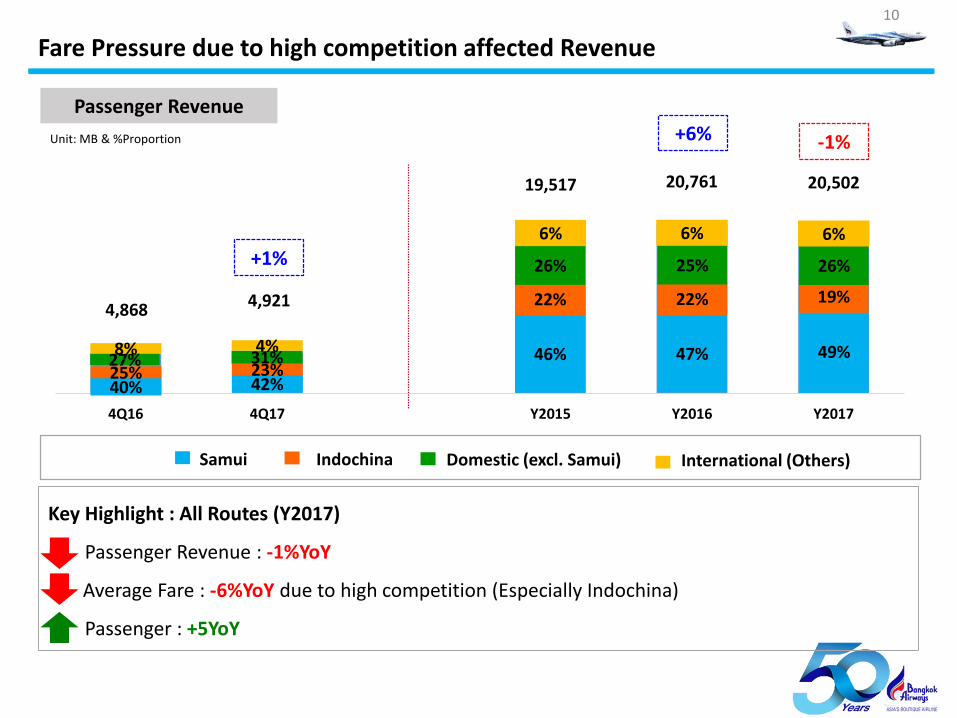
Fare Pressure due to high competition affected Revenue
Passenger Revenue
Unit: MB & %Proportion
Key Highlight : All Routes (Y2017)
Passenger Revenue : -1%YoY
Average Fare : -6%YoY due to high competition (Especially Indochina)
Passenger : +5YoY
10
Samui Indochina Domestic (excl. Samui) International (Others)
4Q16 4Q17 Y2015 Y2016 Y2017
40%25%27%8%
4,868
42%23%31%4%
4,921
46%
22%
26%
6%
19,517
47%
22%
25%
6%
20,761
49%
19%
26%
20,502
+1%
+6% -1%
6%
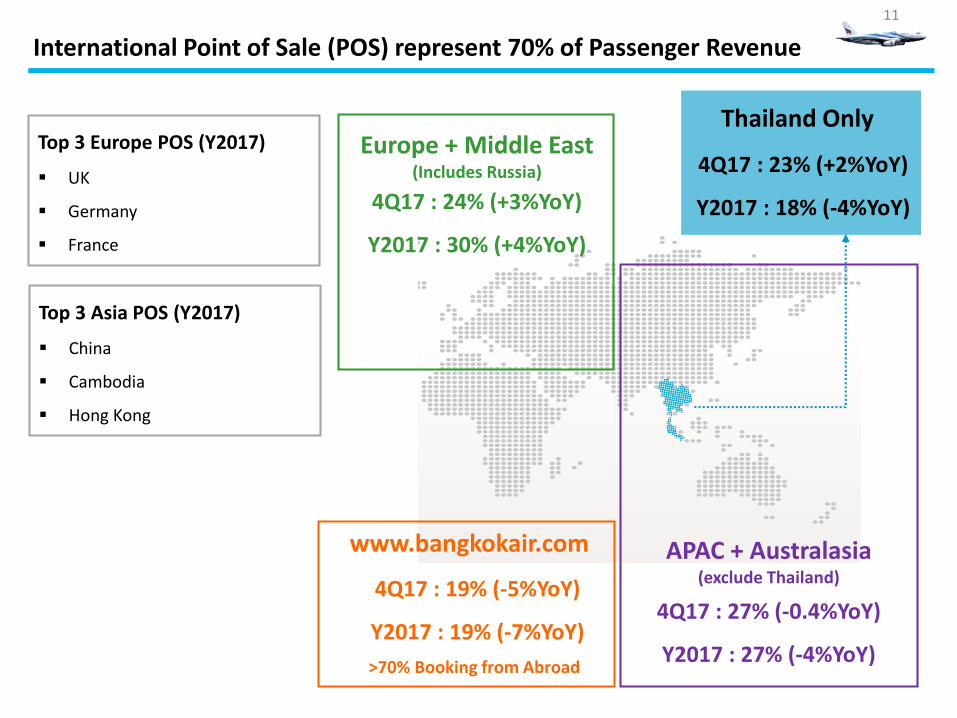
International Point of Sale (POS) represent 70% of Passenger Revenue
11
Europe + Middle East(Includes Russia)
4Q17 : 24% (+3%YoY)
Y2017 : 30% (+4%YoY)
APAC + Australasia(exclude Thailand)
4Q17 : 27% (-0.4%YoY)
Y2017 : 27% (-4%YoY)
Thailand Only
4Q17 : 23% (+2%YoY)
Y2017 : 18% (-4%YoY)
www.bangkokair.com
4Q17 : 19% (-5%YoY)
Y2017 : 19% (-7%YoY)
>70% Booking from Abroad
Top 3 Europe POS (Y2017)
UK
Germany
France
Top 3 Asia POS (Y2017)
China
Cambodia
Hong Kong
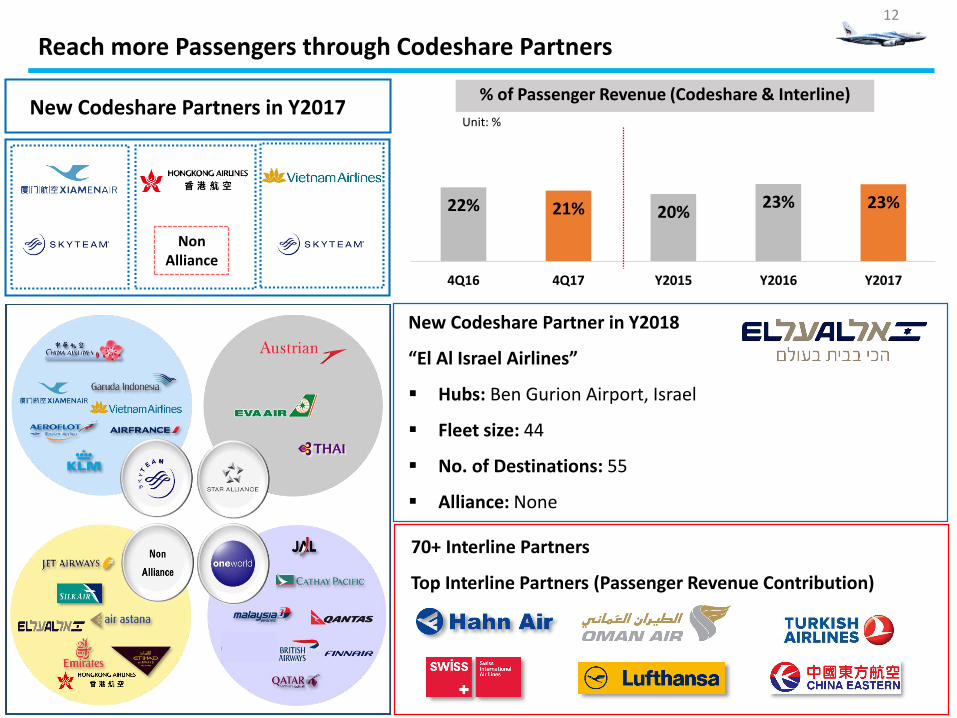
Reach more Passengers through Codeshare Partners
% of Passenger Revenue (Codeshare & Interline)
Unit: %
12
New Codeshare Partners in Y2017
Non Alliance
New Codeshare Partner in Y2018
“El Al Israel Airlines”
Hubs: Ben Gurion Airport, Israel
Fleet size: 44
No. of Destinations: 55
Alliance: None
70+ Interline Partners
Top Interline Partners (Passenger Revenue Contribution)
22% 21% 20%23% 23%
4Q16 4Q17 Y2015 Y2016 Y2017
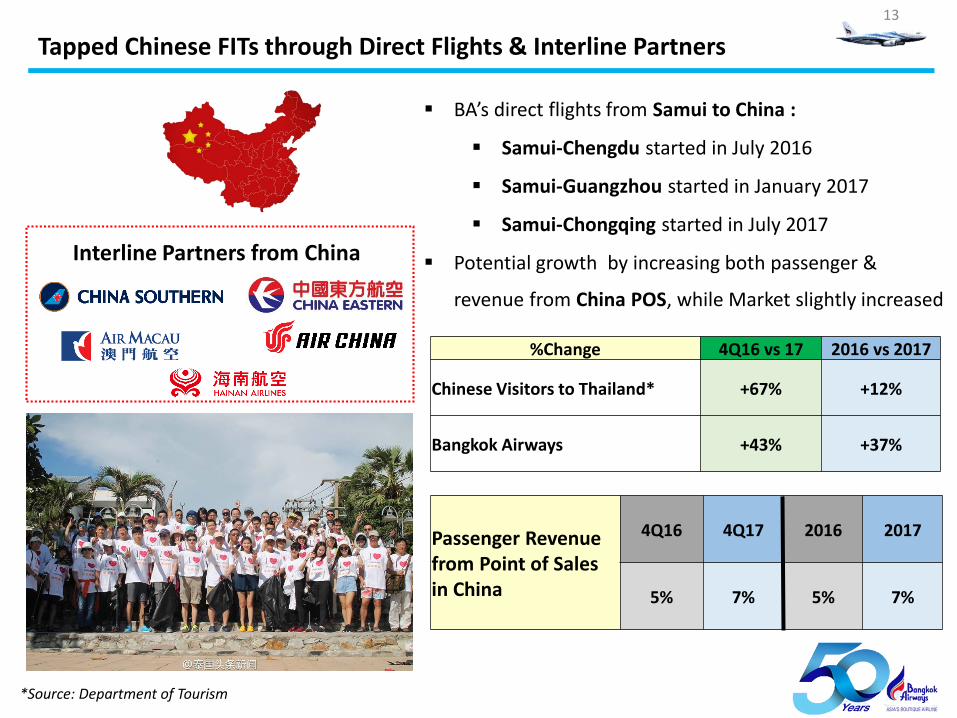
Tapped Chinese FITs through Direct Flights & Interline Partners
*Source: Department of Tourism
BA’s direct flights from Samui to China :
Samui-Chengdu started in July 2016
Samui-Guangzhou started in January 2017
Samui-Chongqing started in July 2017
Potential growth by increasing both passenger &
revenue from China POS, while Market slightly increased
%Change 4Q16 vs 17 2016 vs 2017
Chinese Visitors to Thailand* +67% +12%
Bangkok Airways +43% +37%
Passenger Revenue from Point of Sales in China
4Q16 4Q17 2016 2017
5% 7% 5% 7%
13
Interline Partners from China
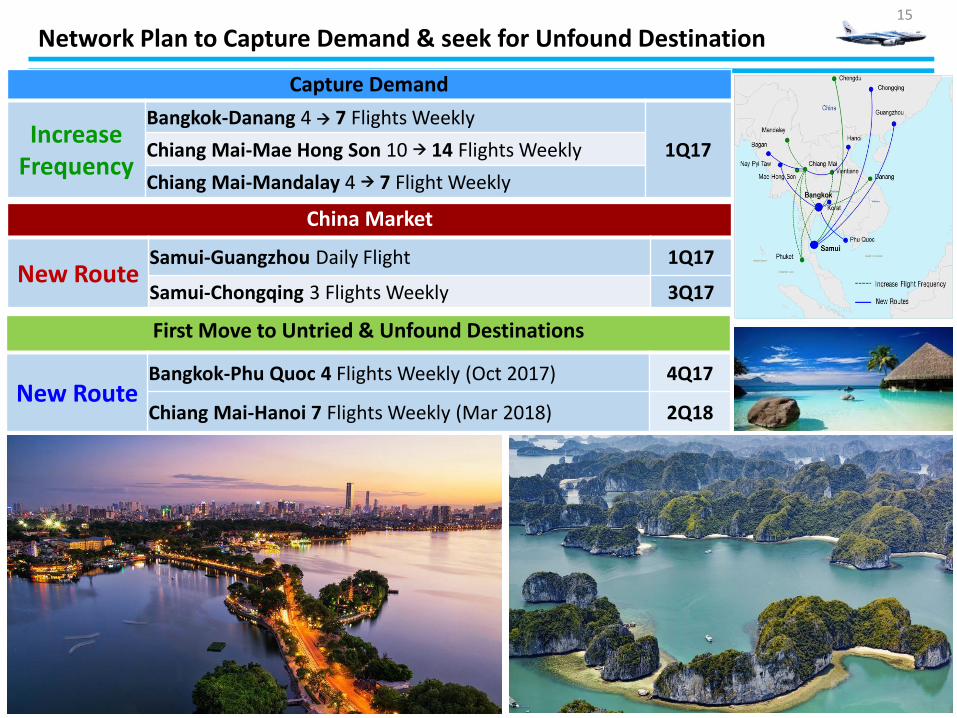
Network Plan to Capture Demand & seek for Unfound Destination
Capture Demand
Increase Frequency
Bangkok-Danang 4 7 Flights Weekly
1Q17Chiang Mai-Mae Hong Son 10 14 Flights Weekly
Chiang Mai-Mandalay 4 7 Flight Weekly
China Market
New RouteSamui-Guangzhou Daily Flight 1Q17
Samui-Chongqing 3 Flights Weekly 3Q17
First Move to Untried & Unfound Destinations
New Route Bangkok-Phu Quoc 4 Flights Weekly (Oct 2017) 4Q17
Chiang Mai-Hanoi 7 Flights Weekly (Mar 2018) 2Q18
15
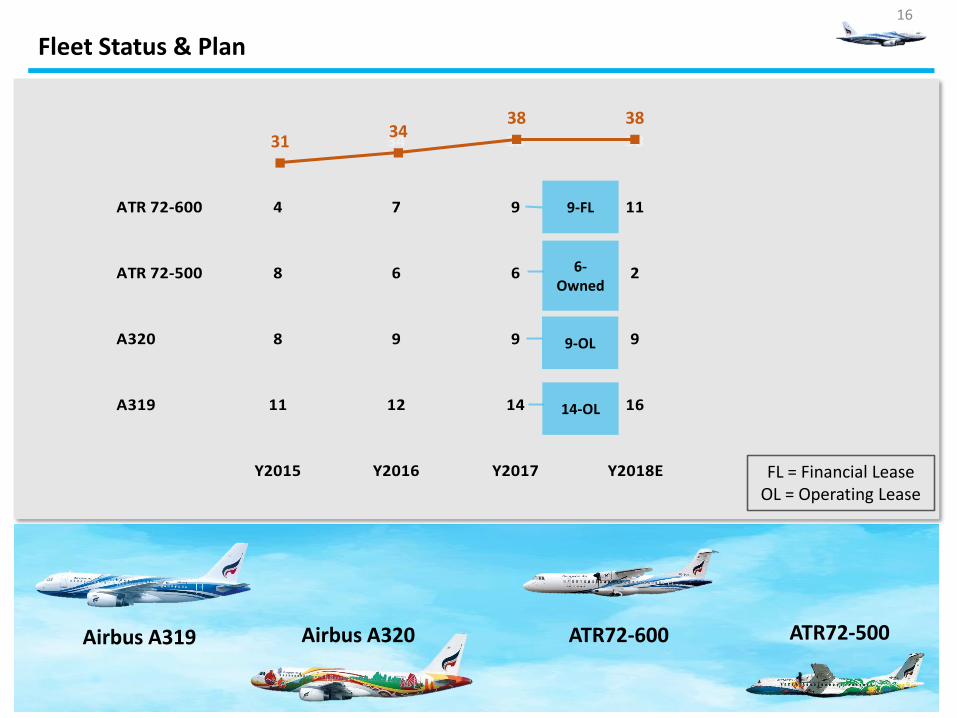
Fleet Status & Plan
Airbus A319 Airbus A320 ATR72-600 ATR72-500
FL = Financial LeaseOL = Operating Lease
16
31 34 38 38
ATR 72-600 4 7 9 11
ATR 72-500 8 6 6 2
A320 8 9 9 9
A319 11 12 14 16
Y2015 Y2016 Y2017 Y2018E
6-Owned
9-FL
9-OL
14-OL
3134
38 38
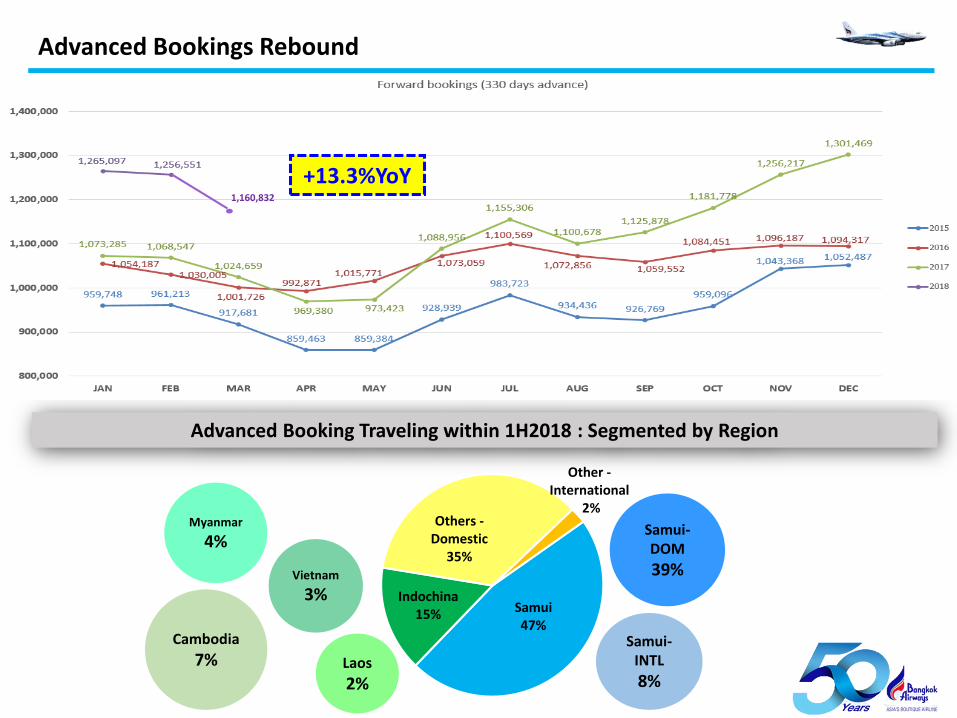
Advanced Bookings Rebound
Advanced Booking Traveling within 1H2018 : Segmented by Region
Samui-DOM
39%
Cambodia
7%
Myanmar
4%
Vietnam
3%
Samui-INTL
8%Laos
2%
Samui47%
Indochina15%
Others -Domestic
35%
Other -International
2%
1,160,832
+13.3%YoY
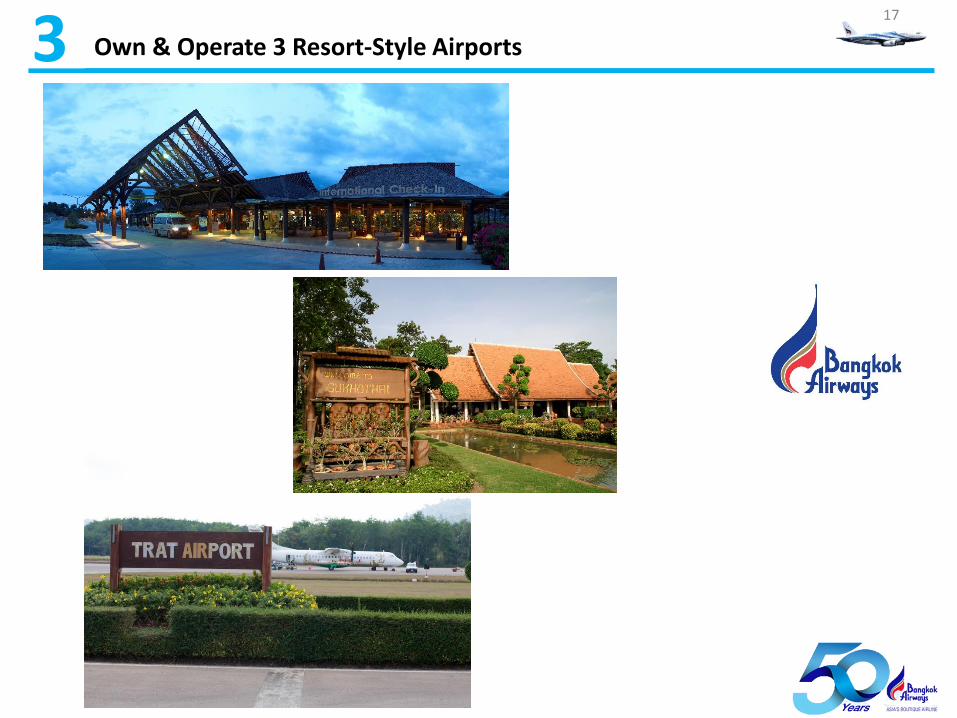
Own & Operate 3 Resort-Style Airports317
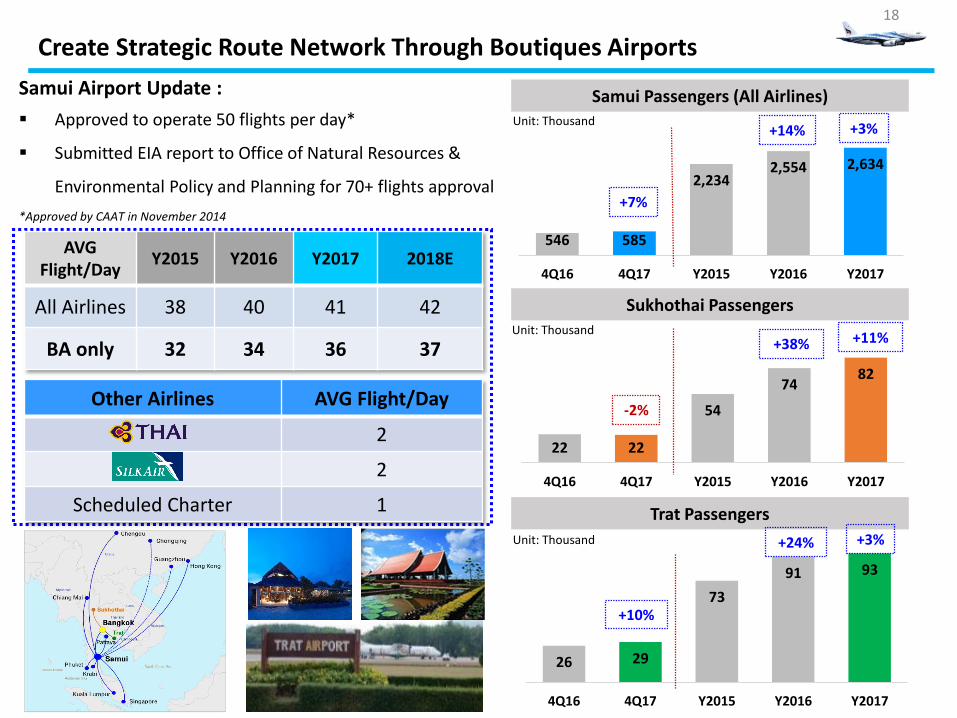
Samui Airport Update :
Approved to operate 50 flights per day*
Submitted EIA report to Office of Natural Resources &
Environmental Policy and Planning for 70+ flights approval
Create Strategic Route Network Through Boutiques Airports
Other Airlines AVG Flight/Day
2
2
Scheduled Charter 1
*Approved by CAAT in November 2014
AVGFlight/Day
Y2015 Y2016 Y2017 2018E
All Airlines 38 40 41 42
BA only 32 34 36 37
Samui Passengers (All Airlines)Unit: Thousand
Sukhothai PassengersUnit: Thousand
Trat Passengers
Unit: Thousand
18
22 22
54
7482
4Q16 4Q17 Y2015 Y2016 Y2017
-2%
+38% +11%
26 29
73
91 93
4Q16 4Q17 Y2015 Y2016 Y2017
+10%
+24% +3%
546 585
2,2342,554 2,634
4Q16 4Q17 Y2015 Y2016 Y2017
+7%
+14% +3%
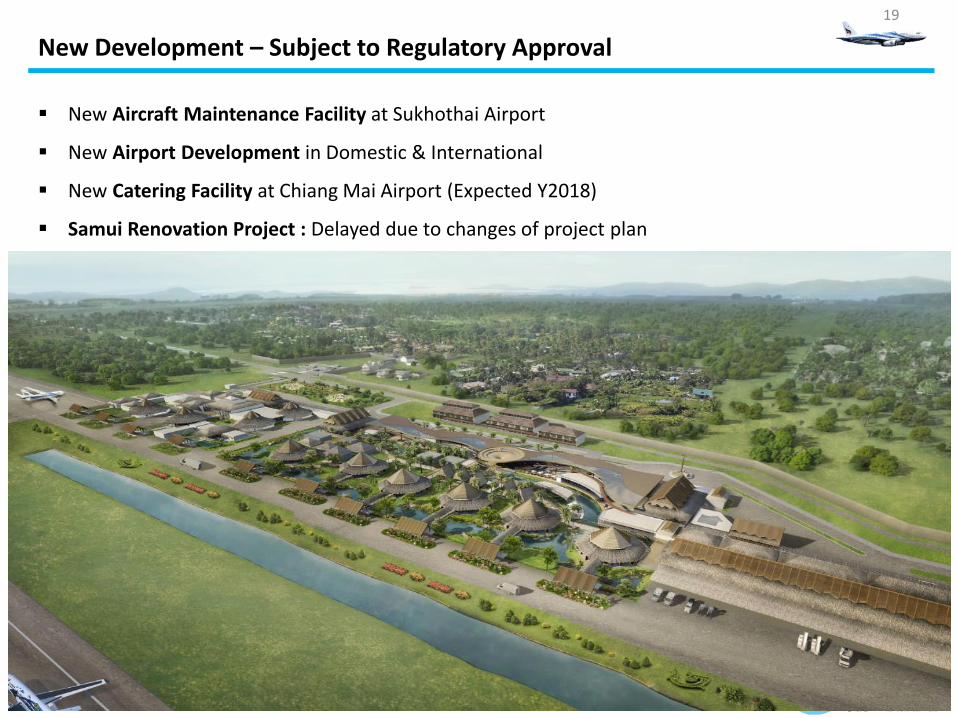
New Development – Subject to Regulatory Approval
New Aircraft Maintenance Facility at Sukhothai Airport
New Airport Development in Domestic & International
New Catering Facility at Chiang Mai Airport (Expected Y2018)
Samui Renovation Project : Delayed due to changes of project plan
19
Financial Highlight
20
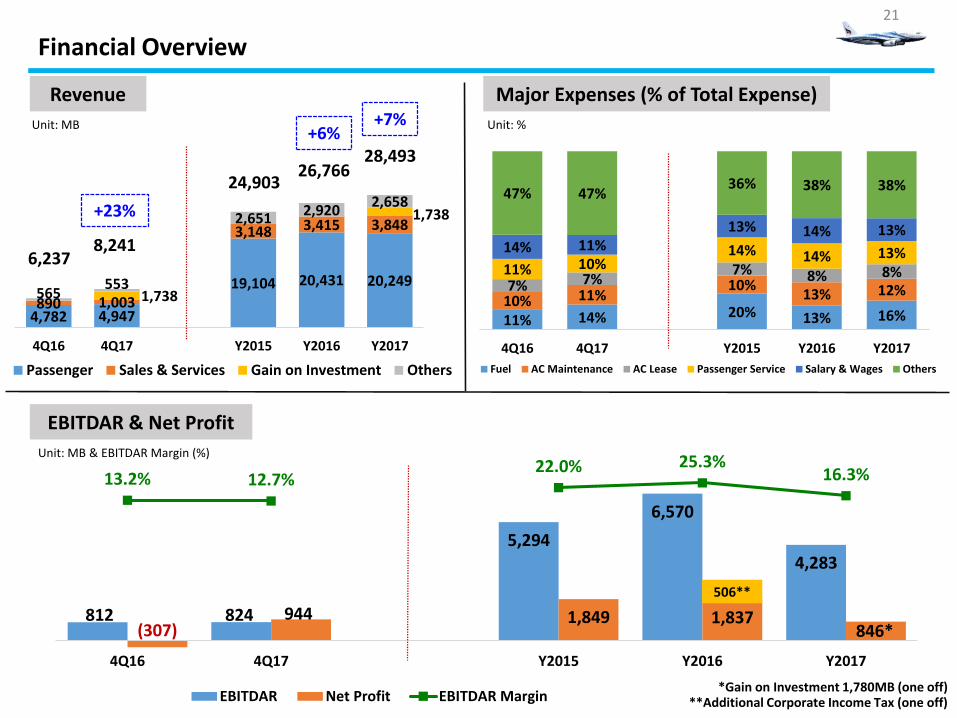
Financial Overview
Revenue
EBITDAR & Net Profit
Unit: MB & EBITDAR Margin (%)
Major Expenses (% of Total Expense)
Unit: %Unit: MB
21
812 824
5,294
6,570
4,283
(307)944 1,849 1,837
846*
13.2% 12.7%22.0% 25.3%
16.3%
-100%
-80%
-60%
-40%
-20%
0%
20%
40%
-1,000
-500
-
500
1,000
1,500
2,000
2,500
3,000
3,500
4,000
4,500
5,000
5,500
6,000
6,500
7,000
7,500
8,000
4Q16 4Q17 Y2015 Y2016 Y2017
EBITDAR Net Profit EBITDAR Margin
506**
*Gain on Investment 1,780MB (one off)**Additional Corporate Income Tax (one off)
4,782 4,947
19,104 20,431 20,249
890 1,003
3,148 3,415 3,848
1,738
1,738
565553
2,6512,920
2,658
4Q16 4Q17 Y2015 Y2016 Y2017
Passenger Sales & Services Gain on Investment Others
6,2378,241
+23%
24,90326,766
28,493
+7%+6%
11% 14% 20% 13% 16%10% 11%
10%13% 12%7% 7%
7% 8% 8%11% 10%14% 14% 13%14% 11%13% 14% 13%
47% 47%36% 38% 38%
4Q16 4Q17 Y2015 Y2016 Y2017
Fuel AC Maintenance AC Lease Passenger Service Salary & Wages Others
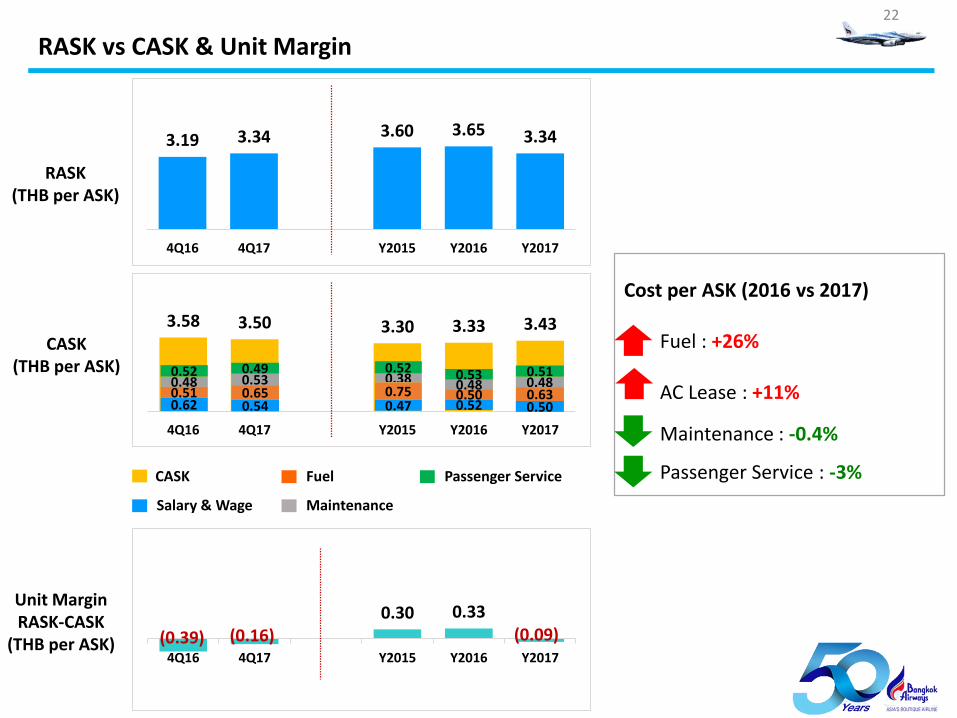
RASK vs CASK & Unit Margin
CASK Fuel
RASK (THB per ASK)
CASK(THB per ASK)
Salary & Wage Maintenance
Cost per ASK (2016 vs 2017)
Fuel : +26%
AC Lease : +11%
Maintenance : -0.4%
Passenger Service : -3%
Unit MarginRASK-CASK
(THB per ASK)
22
Passenger Service
3.19 3.34 3.60 3.65 3.34
4Q16 4Q17 Y2015 Y2016 Y2017
3.58 3.50 3.30 3.33 3.43
4Q16 4Q17 Y2015 Y2016 Y2017
(0.39) (0.16)0.30 0.33
(0.09)4Q16 4Q17 Y2015 Y2016 Y2017
0.470.750.380.52
0.520.500.480.53
0.500.630.480.51
0.620.510.480.52
0.540.650.530.49
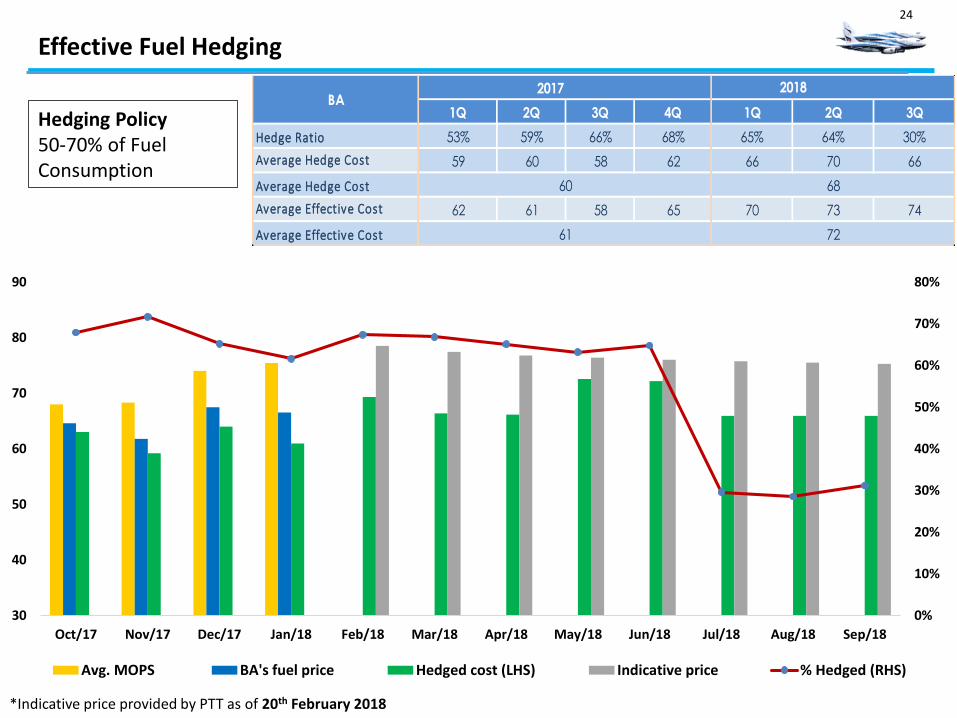
Effective Fuel Hedging
Hedging Policy50-70% of Fuel Consumption
*Indicative price provided by PTT as of 20th February 2018
24
Oct/17 Nov/17 Dec/17 Jan/18 Feb/18 Mar/18 Apr/18 May/18 Jun/18 Jul/18 Aug/18 Sep/18
30
40
50
60
70
80
90
0%
10%
20%
30%
40%
50%
60%
70%
80%
Avg. MOPS BA's fuel price Hedged cost (LHS) Indicative price % Hedged (RHS)
2017
1Q 2Q 3Q 4Q 1Q 2Q 3Q
Hedge Ratio 53% 59% 66% 68% 65% 64% 30%
Average Hedge Cost 59 60 58 62 66 70 66
Average Hedge Cost
Average Effective Cost 62 61 58 65 70 73 74
Average Effective Cost
60
61
BA2018
68
72
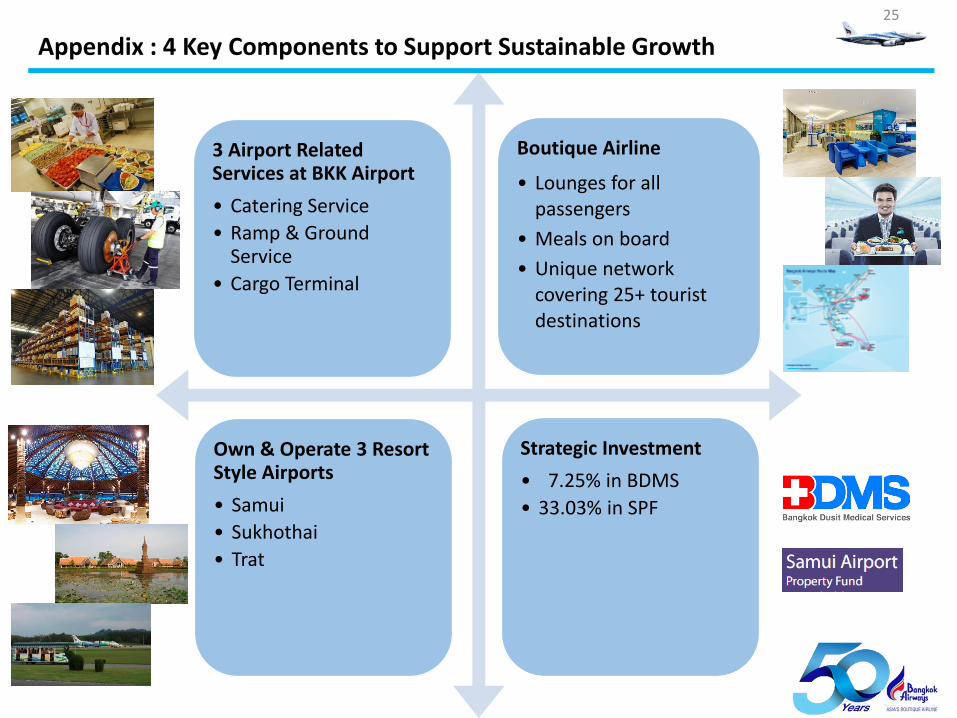
Boutique Airline
• Lounges for all passengers
• Meals on board
• Unique network covering 25+ tourist destinations
Own & Operate 3 Resort Style Airports
• Samui
• Sukhothai
• Trat
3 Airport Related Services at BKK Airport
• Catering Service
• Ramp & Ground Service
• Cargo Terminal
Strategic Investment
• 7.25% in BDMS
• 33.03% in SPF
Appendix : 4 Key Components to Support Sustainable Growth
25


![â Y2017 †fÛ ‰ 1 Ù]‚jÂ] ñ]‚Þ1€¦ · â Y2017 †fÛ ‰ 3 Ù]‚jÂ] ñ]‚Þ1 NIDA-E-AETIDAL DECEMBER - 2017 O¶Z óóóxxxxóóóssssZZZ»»»»ÇÇÇÇààààzzzgggzg—](https://img.pdfslide.net/doc/110x75/5ecc18b35d36630115296589/-y2017-af-a-1-aj-a1-y2017-af-a-3-aj-a1.jpg)

![Filles et garçons 2012...[ 12 ] fillesetgarçonssurlechemindel’égalité,del'écoleàl'enseignementsupérieur[2012] Les résultats Bac général Bac L Bac ES Bac S Bac techno Bac](https://img.pdfslide.net/doc/110x75/60dbc69bdcdd4d1dfb2b35f8/filles-et-garons-2012-12-fillesetgaronssurlechemindelagalitdelcolelenseignementsuprieur2012.jpg)