Embed Size (px)
Citation preview
i
Bangladesh Statistics
2017
Bangladesh Bureau of Statistics (BBS)
Statistics and Informatics Division (SID)
Ministry of Planning

ii
iii
PREFACE
Bangladesh Statistics 2016 is a booklet which provides important demographic and
social- economic data as well as statistical indicators of Bangladesh for the year
2016
This booklet is an extraction of information from various statistical publications and
reports compiled by BBS, other Ministries, Departments and Agencies.
These statistics give an indication of current social and economic trends in the
country. Some of the latest figures are provisional and subject to revision.
Publication in recognizing the inputs used in the compilation of this booklet, BBS would like to thank all organization in the Government, Departments and Agencies
and private sectors.
BBS is very much thankful for your continued support and cooperation for the
compilation of the future editions of this booklet and other statistical report.
Views and feedback are welcome from users in all sectors so as to enrich the next
edition of the Bangladesh Statistics.
The document can also be obtained from the website; www.bbs.gov.bd.

iv
v
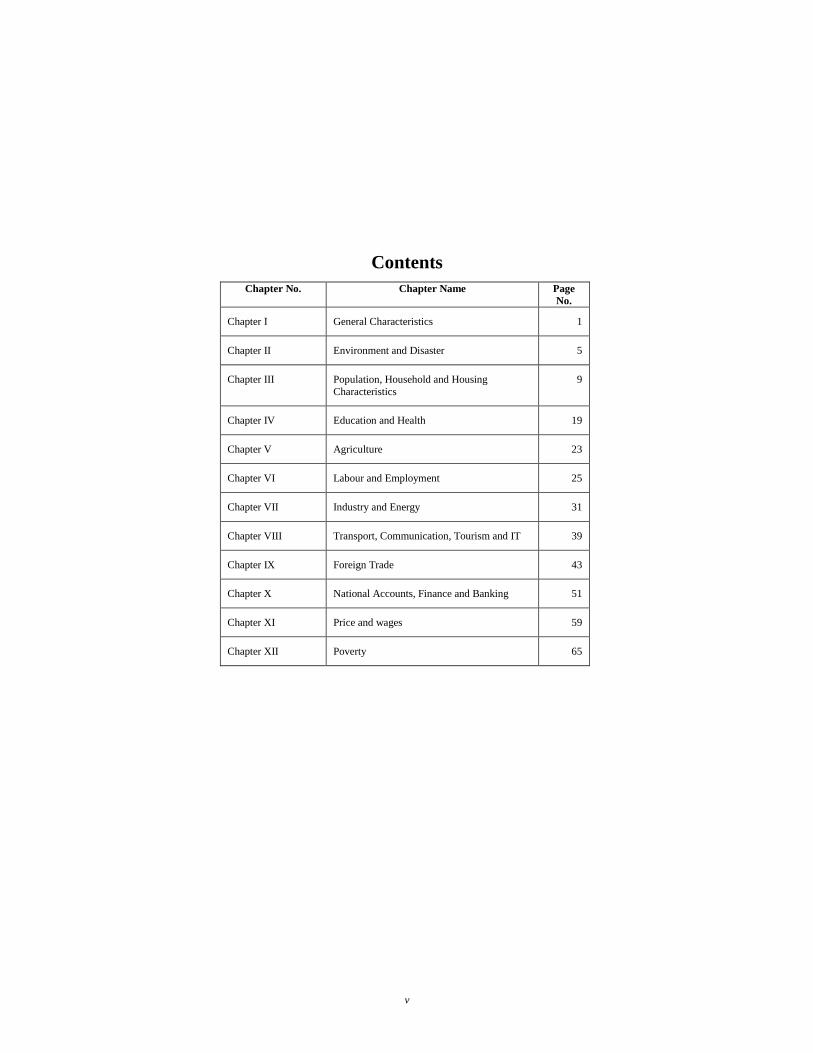
Contents
Chapter No. Chapter Name Page
No.
Chapter I General Characteristics 1
Chapter II Environment and Disaster 5
Chapter III Population, Household and Housing
Characteristics
9
Chapter IV Education and Health 19
Chapter V Agriculture 23
Chapter VI Labour and Employment 25
Chapter VII Industry and Energy 31
Chapter VIII Transport, Communication, Tourism and IT 39
Chapter IX Foreign Trade 43
Chapter X National Accounts, Finance and Banking 51
Chapter XI Price and wages 59
Chapter XII Poverty 65
vi
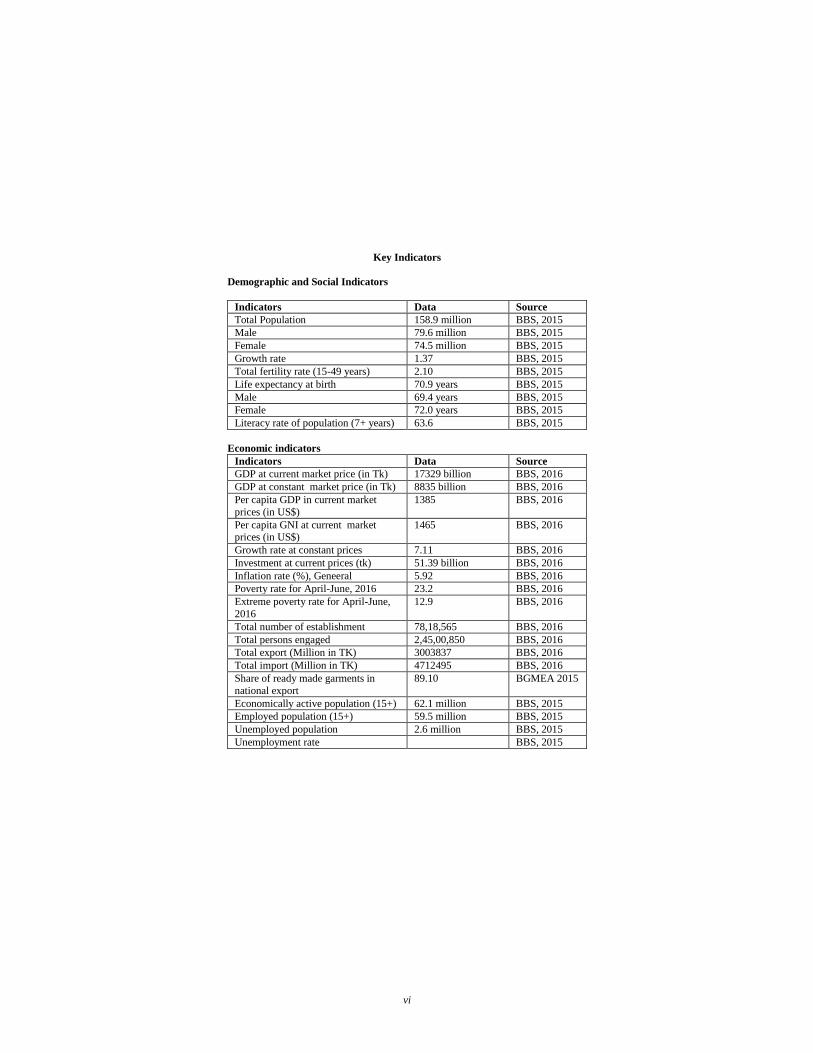
Key Indicators
Demographic and Social Indicators
Indicators Data Source
Total Population 158.9 million BBS, 2015
Male 79.6 million BBS, 2015
Female 74.5 million BBS, 2015
Growth rate 1.37 BBS, 2015
Total fertility rate (15-49 years) 2.10 BBS, 2015
Life expectancy at birth 70.9 years BBS, 2015
Male 69.4 years BBS, 2015
Female 72.0 years BBS, 2015
Literacy rate of population (7+ years) 63.6 BBS, 2015
Economic indicators
Indicators Data Source
GDP at current market price (in Tk) 17329 billion BBS, 2016
GDP at constant market price (in Tk) 8835 billion BBS, 2016
Per capita GDP in current market
prices (in US$)
1385 BBS, 2016
Per capita GNI at current market prices (in US$)
1465 BBS, 2016
Growth rate at constant prices 7.11 BBS, 2016
Investment at current prices (tk) 51.39 billion BBS, 2016
Inflation rate (%), Geneeral 5.92 BBS, 2016
Poverty rate for April-June, 2016 23.2 BBS, 2016
Extreme poverty rate for April-June,
2016
12.9 BBS, 2016
Total number of establishment 78,18,565 BBS, 2016
Total persons engaged 2,45,00,850 BBS, 2016
Total export (Million in TK) 3003837 BBS, 2016
Total import (Million in TK) 4712495 BBS, 2016
Share of ready made garments in
national export
89.10 BGMEA 2015
Economically active population (15+) 62.1 million BBS, 2015
Employed population (15+) 59.5 million BBS, 2015
Unemployed population 2.6 million BBS, 2015
Unemployment rate BBS, 2015

vii
1
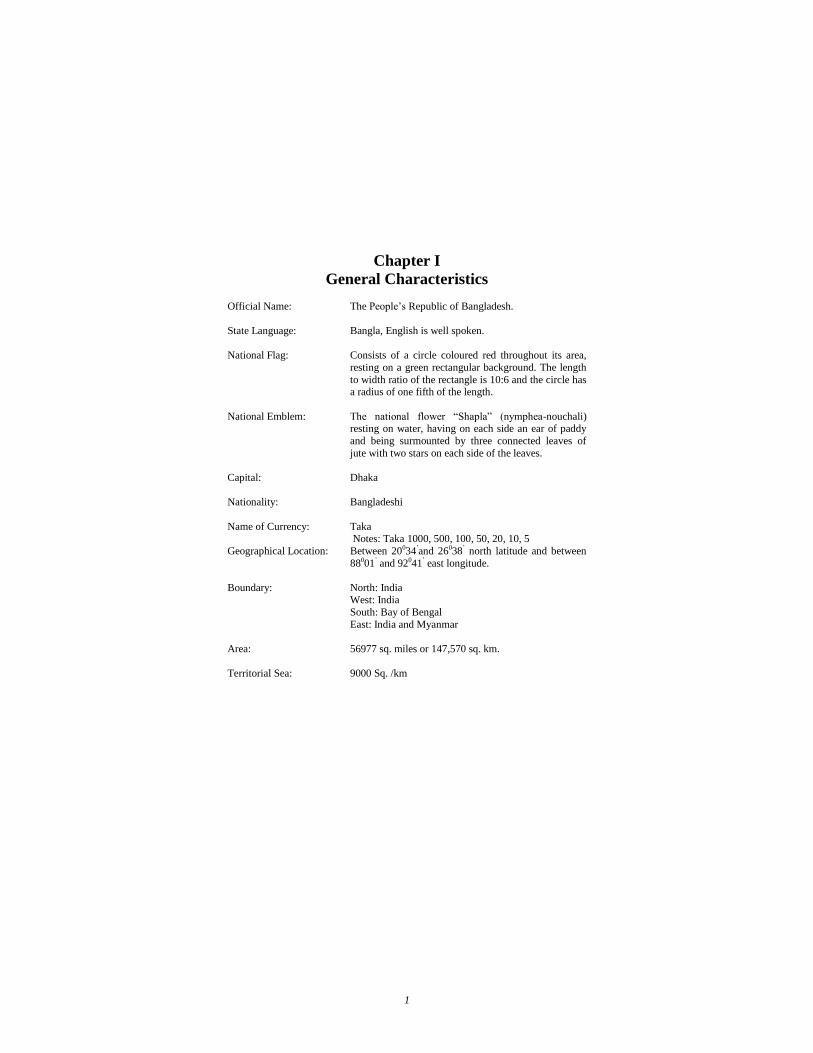
Chapter I
General Characteristics
Official Name: The People’s Republic of Bangladesh.
State Language: Bangla, English is well spoken.
National Flag: Consists of a circle coloured red throughout its area,
resting on a green rectangular background. The length
to width ratio of the rectangle is 10:6 and the circle has a radius of one fifth of the length.
National Emblem: The national flower “Shapla” (nymphea-nouchali) resting on water, having on each side an ear of paddy
and being surmounted by three connected leaves of
jute with two stars on each side of the leaves.
Capital: Dhaka
Nationality: Bangladeshi
Name of Currency: Taka Notes: Taka 1000, 500, 100, 50, 20, 10, 5
Geographical Location: Between 20034’and 26038’ north latitude and between
88001’ and 92041’ east longitude.
Boundary: North: India West: India
South: Bay of Bengal
East: India and Myanmar
Area: 56977 sq. miles or 147,570 sq. km.
Territorial Sea: 9000 Sq. /km
2
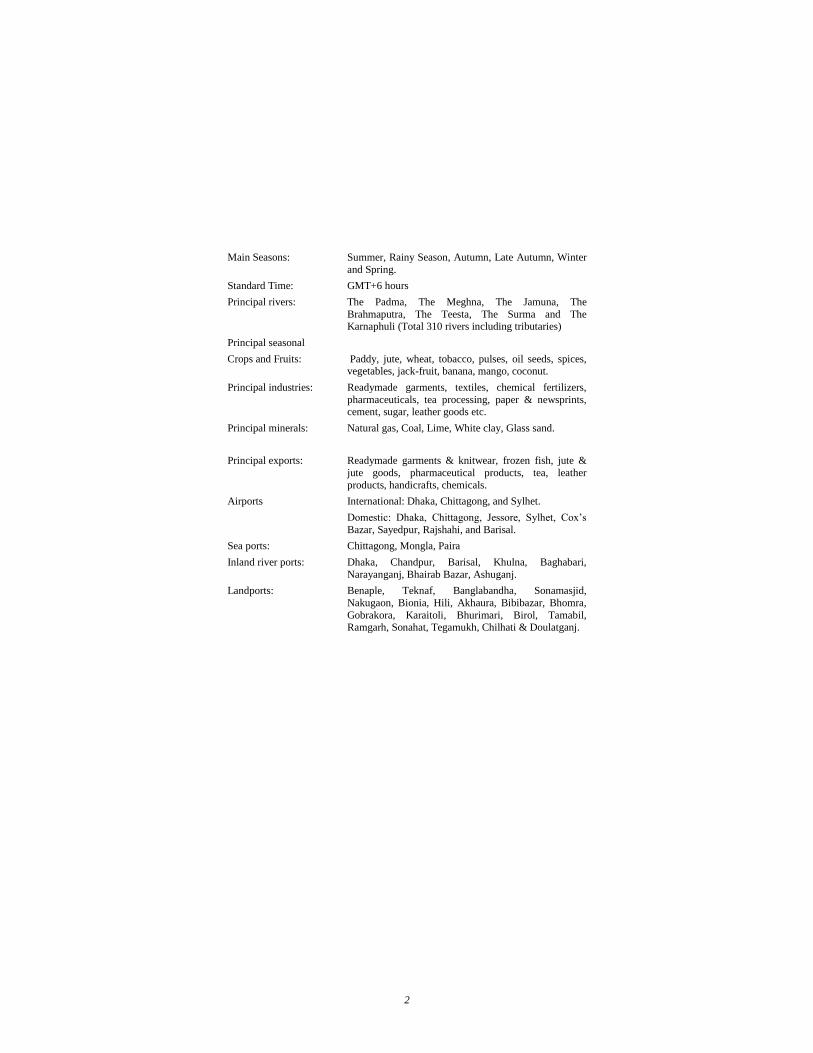
Main Seasons: Summer, Rainy Season, Autumn, Late Autumn, Winter
and Spring.
Standard Time: GMT+6 hours
Principal rivers: The Padma, The Meghna, The Jamuna, The
Brahmaputra, The Teesta, The Surma and The Karnaphuli (Total 310 rivers including tributaries)
Principal seasonal
Crops and Fruits: Paddy, jute, wheat, tobacco, pulses, oil seeds, spices, vegetables, jack-fruit, banana, mango, coconut.
Principal industries: Readymade garments, textiles, chemical fertilizers,
pharmaceuticals, tea processing, paper & newsprints, cement, sugar, leather goods etc.
Principal minerals: Natural gas, Coal, Lime, White clay, Glass sand.
Principal exports: Readymade garments & knitwear, frozen fish, jute &
jute goods, pharmaceutical products, tea, leather
products, handicrafts, chemicals.
Airports International: Dhaka, Chittagong, and Sylhet.
Domestic: Dhaka, Chittagong, Jessore, Sylhet, Cox’s
Bazar, Sayedpur, Rajshahi, and Barisal.
Sea ports: Chittagong, Mongla, Paira
Inland river ports: Dhaka, Chandpur, Barisal, Khulna, Baghabari,
Narayanganj, Bhairab Bazar, Ashuganj.
Landports: Benaple, Teknaf, Banglabandha, Sonamasjid,
Nakugaon, Bionia, Hili, Akhaura, Bibibazar, Bhomra,
Gobrakora, Karaitoli, Bhurimari, Birol, Tamabil, Ramgarh, Sonahat, Tegamukh, Chilhati & Doulatganj.
3
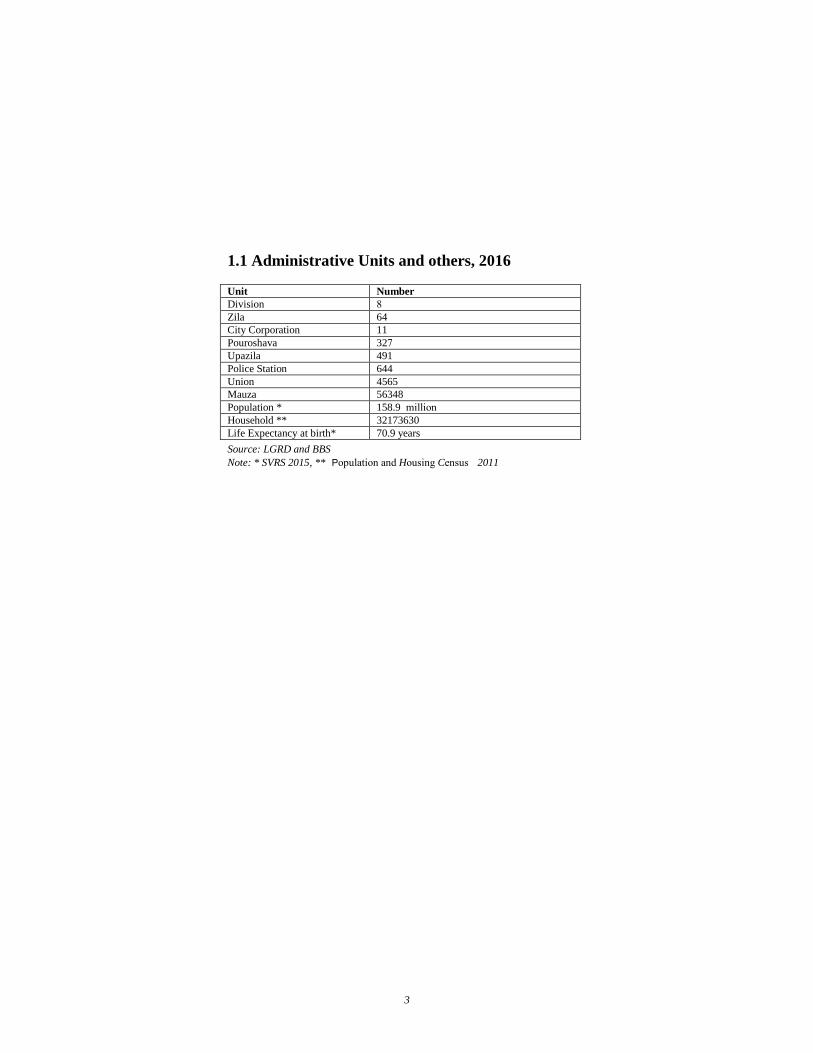
1.1 Administrative Units and others, 2016
Unit Number
Division 8
Zila 64
City Corporation 11
Pouroshava 327 Upazila 491 Police Station 644
Union 4565 Mauza 56348
Population * 158.9 million
Household ** 32173630
Life Expectancy at birth* 70.9 years
Source: LGRD and BBS
Note: * SVRS 2015, ** Population and Housing Census 2011

4
5
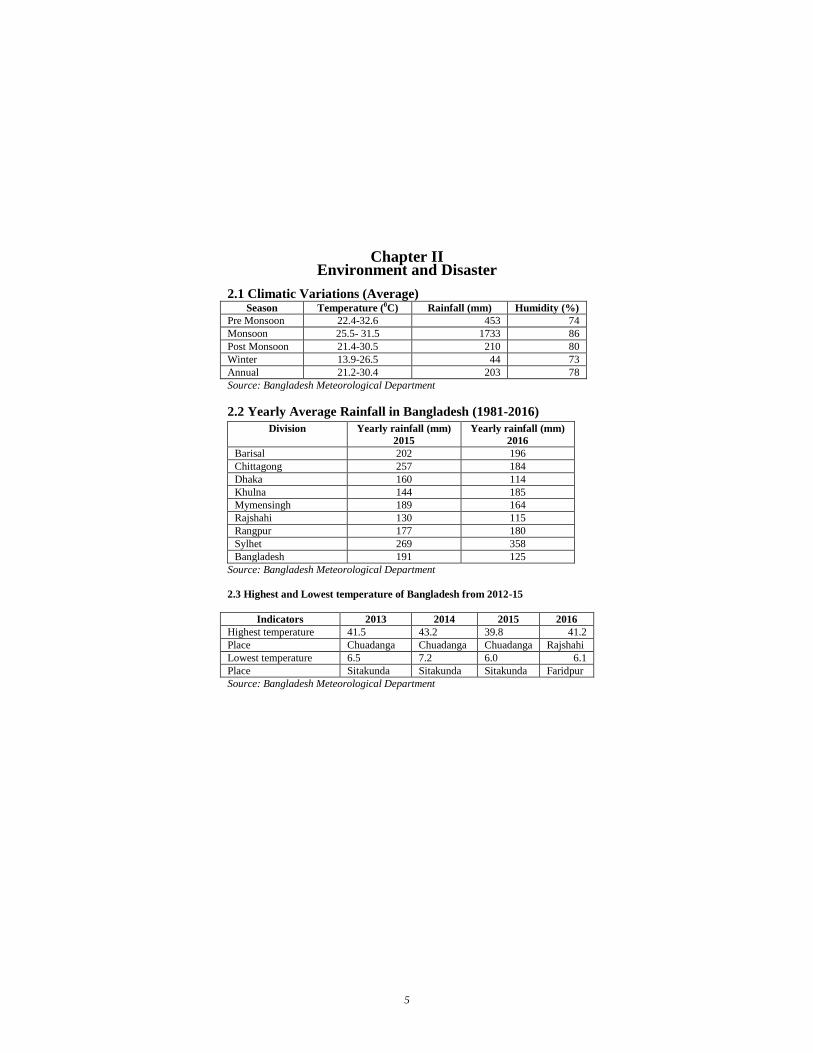
Chapter II Environment and Disaster
2.1 Climatic Variations (Average) Season Temperature (0C) Rainfall (mm) Humidity (%)
Pre Monsoon 22.4-32.6 453 74
Monsoon 25.5- 31.5 1733 86
Post Monsoon 21.4-30.5 210 80
Winter 13.9-26.5 44 73
Annual 21.2-30.4 203 78
Source: Bangladesh Meteorological Department
2.2 Yearly Average Rainfall in Bangladesh (1981-2016)
Division Yearly rainfall (mm)
2015
Yearly rainfall (mm)
2016
Barisal 202 196
Chittagong 257 184
Dhaka 160 114
Khulna 144 185
Mymensingh 189 164
Rajshahi 130 115
Rangpur 177 180
Sylhet 269 358
Bangladesh 191 125
Source: Bangladesh Meteorological Department
2.3 Highest and Lowest temperature of Bangladesh from 2012-15
Indicators 2013 2014 2015 2016
Highest temperature 41.5 43.2 39.8 41.2
Place Chuadanga Chuadanga Chuadanga Rajshahi
Lowest temperature 6.5 7.2 6.0 6.1
Place Sitakunda Sitakunda Sitakunda Faridpur
Source: Bangladesh Meteorological Department
6
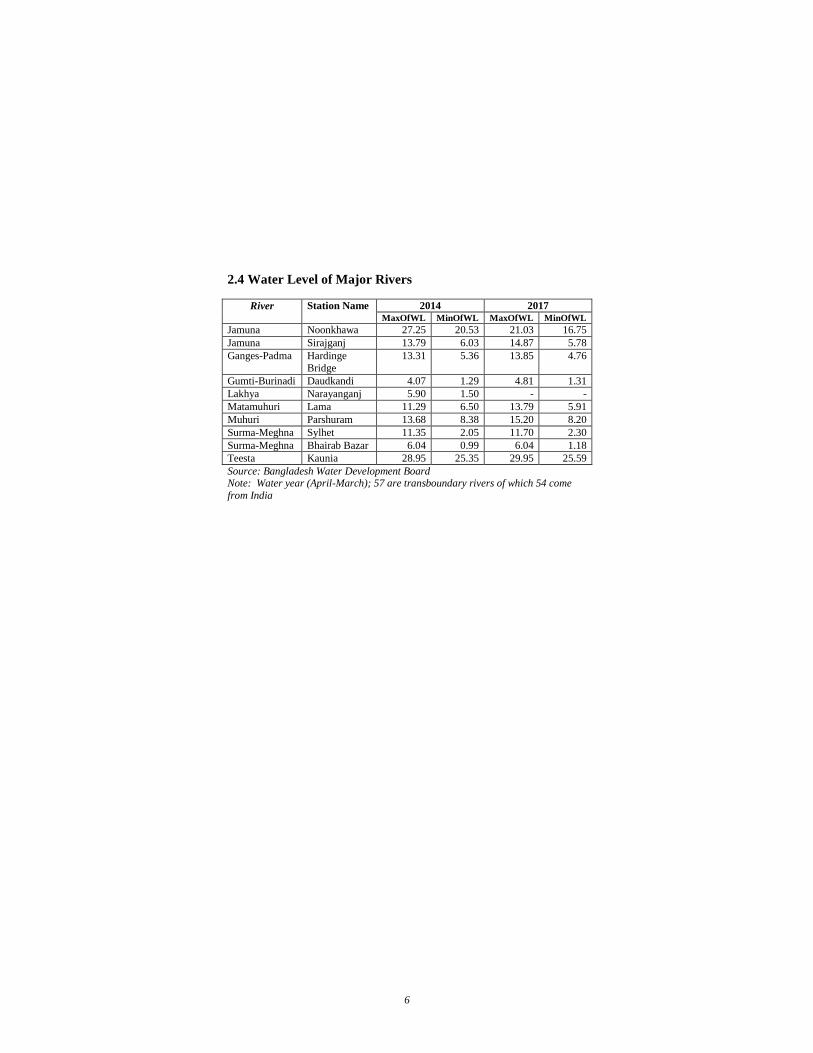
2.4 Water Level of Major Rivers
River Station Name 2014 2017 MaxOfWL MinOfWL MaxOfWL MinOfWL
Jamuna Noonkhawa 27.25 20.53 21.03 16.75
Jamuna Sirajganj 13.79 6.03 14.87 5.78
Ganges-Padma Hardinge
Bridge
13.31 5.36 13.85 4.76
Gumti-Burinadi Daudkandi 4.07 1.29 4.81 1.31
Lakhya Narayanganj 5.90 1.50 - -
Matamuhuri Lama 11.29 6.50 13.79 5.91
Muhuri Parshuram 13.68 8.38 15.20 8.20
Surma-Meghna Sylhet 11.35 2.05 11.70 2.30
Surma-Meghna Bhairab Bazar 6.04 0.99 6.04 1.18
Teesta Kaunia 28.95 25.35 29.95 25.59
Source: Bangladesh Water Development Board Note: Water year (April-March); 57 are transboundary rivers of which 54 come
from India
7
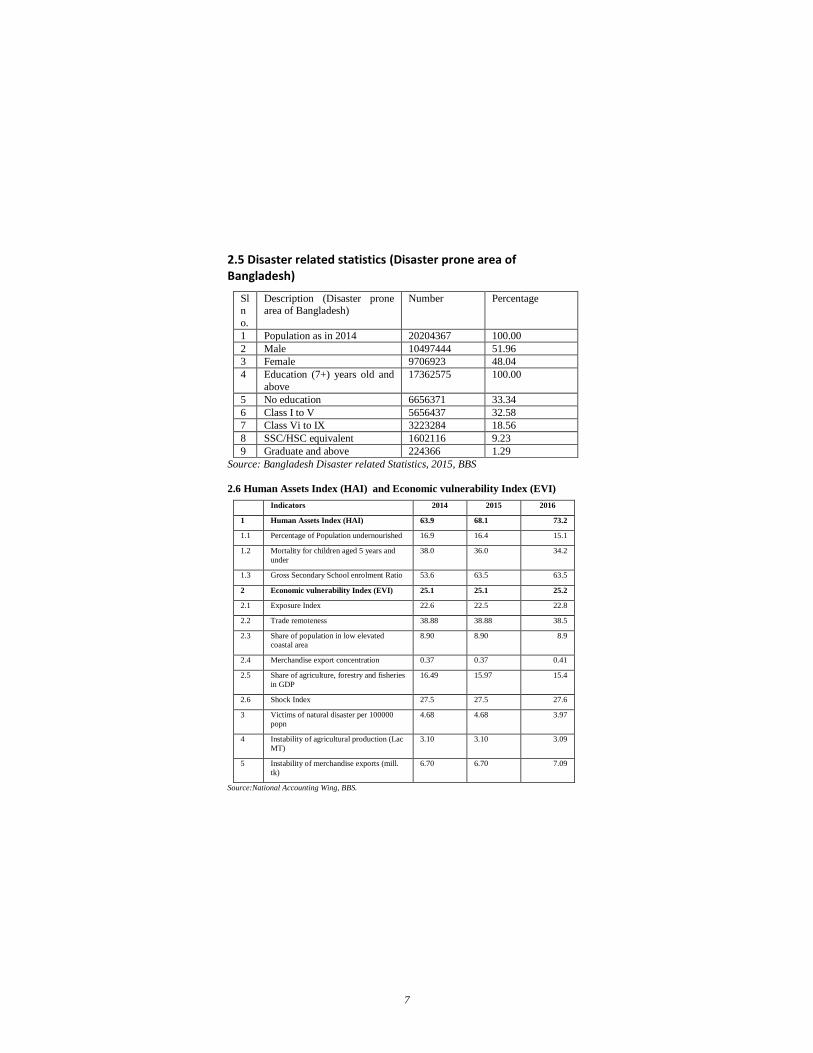
2.5 Disaster related statistics (Disaster prone area of Bangladesh)
Sl n
o.
Description (Disaster prone area of Bangladesh)
Number Percentage
1 Population as in 2014 20204367 100.00
2 Male 10497444 51.96
3 Female 9706923 48.04
4 Education (7+) years old and
above
17362575 100.00
5 No education 6656371 33.34
6 Class I to V 5656437 32.58
7 Class Vi to IX 3223284 18.56
8 SSC/HSC equivalent 1602116 9.23
9 Graduate and above 224366 1.29
Source: Bangladesh Disaster related Statistics, 2015, BBS
2.6 Human Assets Index (HAI) and Economic vulnerability Index (EVI)
Indicators 2014 2015 2016
1 Human Assets Index (HAI) 63.9 68.1 73.2
1.1 Percentage of Population undernourished 16.9 16.4 15.1
1.2 Mortality for children aged 5 years and
under
38.0 36.0 34.2
1.3 Gross Secondary School enrolment Ratio 53.6 63.5 63.5
2 Economic vulnerability Index (EVI) 25.1 25.1 25.2
2.1 Exposure Index 22.6 22.5 22.8
2.2 Trade remoteness 38.88 38.88 38.5
2.3 Share of population in low elevated
coastal area
8.90 8.90 8.9
2.4 Merchandise export concentration 0.37 0.37 0.41
2.5 Share of agriculture, forestry and fisheries
in GDP
16.49 15.97 15.4
2.6 Shock Index 27.5 27.5 27.6
3 Victims of natural disaster per 100000
popn
4.68 4.68 3.97
4 Instability of agricultural production (Lac
MT)
3.10 3.10 3.09
5 Instability of merchandise exports (mill.
tk)
6.70 6.70 7.09
Source:National Accounting Wing, BBS.

8
9
Chapter III
Population, Household and Housing Characteristics
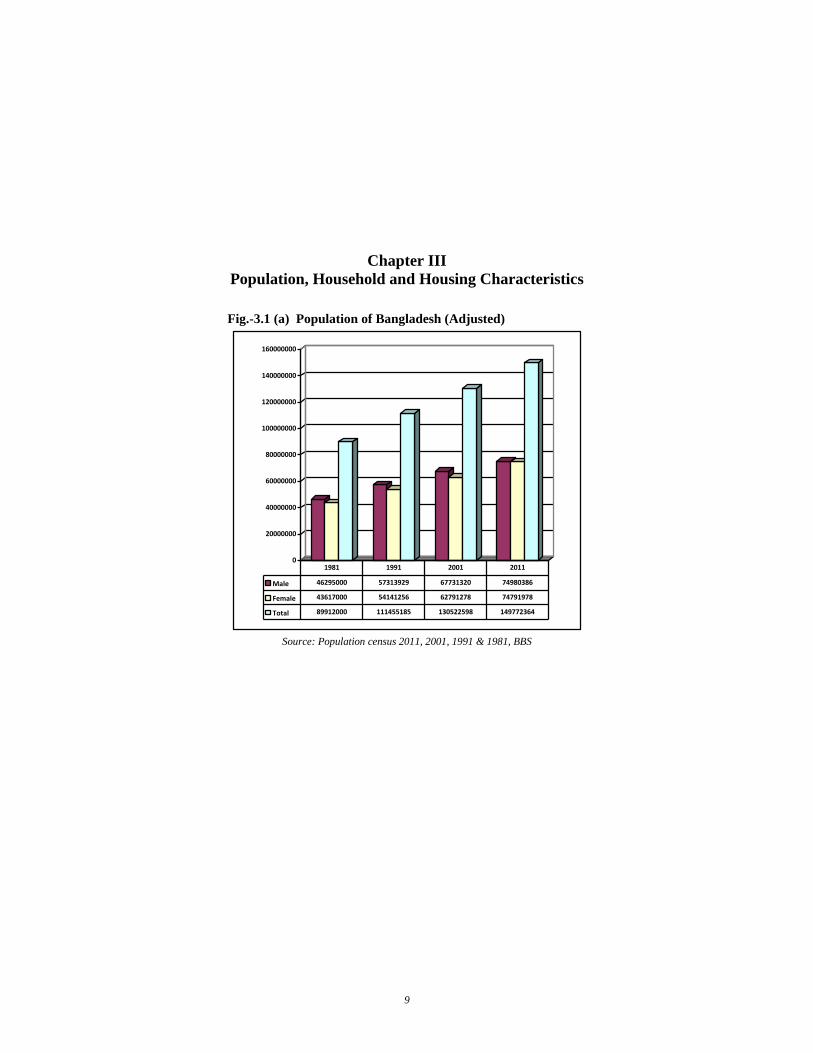
Fig.-3.1 (a) Population of Bangladesh (Adjusted)
0
20000000
40000000
60000000
80000000
100000000
120000000
140000000
160000000
Male 46295000 57313929 67731320 74980386
Female 43617000 54141256 62791278 74791978
Total 89912000 111455185 130522598 149772364
1981 1991 2001 2011
Source: Population census 2011, 2001, 1991 & 1981, BBS

10
Fig.-3.1b. Population of Bangladesh (Estimated) (in million)
0
20
40
60
80
100
120
140
160
180
Male 78.3 78.6 79.6 80.5
Female 78.2 76.4 74.5 80.3
Total 154.7 156.8 158.9 160.8
2013 2014 2015 2016
Source: Monitoring the Situation of Vital Statistics of Bangladesh (MSVSB), BBS
11
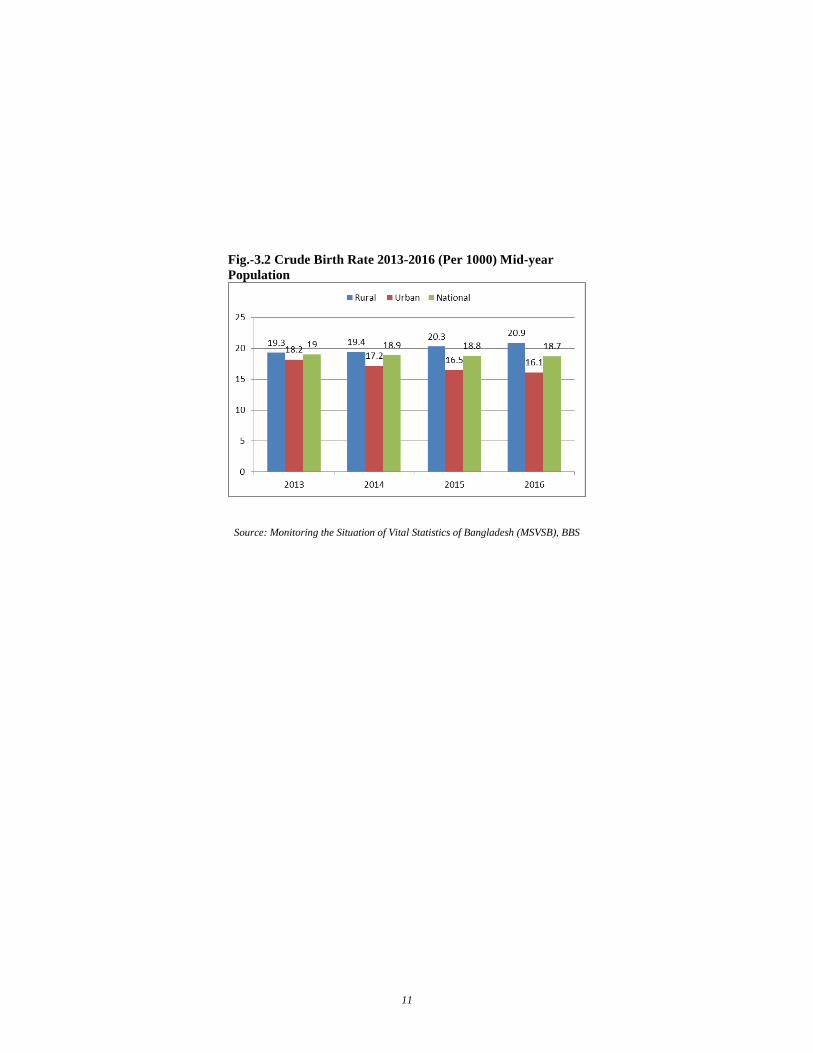
Fig.-3.2 Crude Birth Rate 2013-2016 (Per 1000) Mid-year
Population
Source: Monitoring the Situation of Vital Statistics of Bangladesh (MSVSB), BBS
12
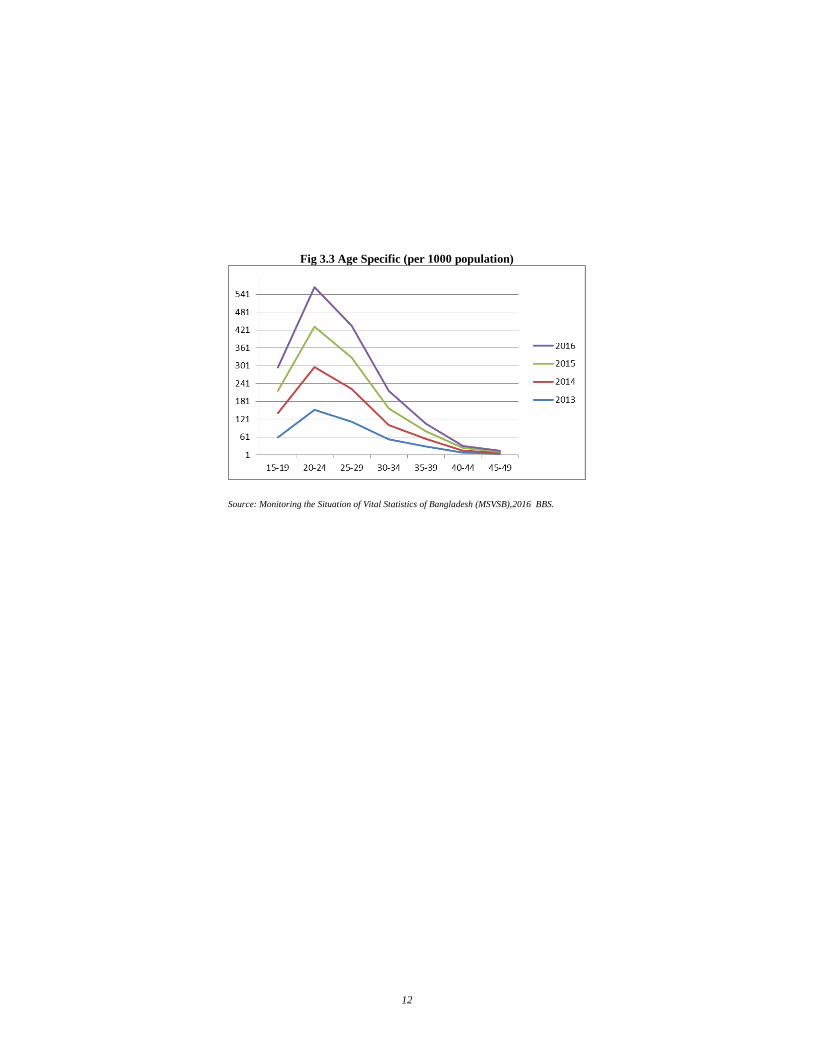
Fig 3.3 Age Specific (per 1000 population)
Source: Monitoring the Situation of Vital Statistics of Bangladesh (MSVSB),2016 BBS.
13
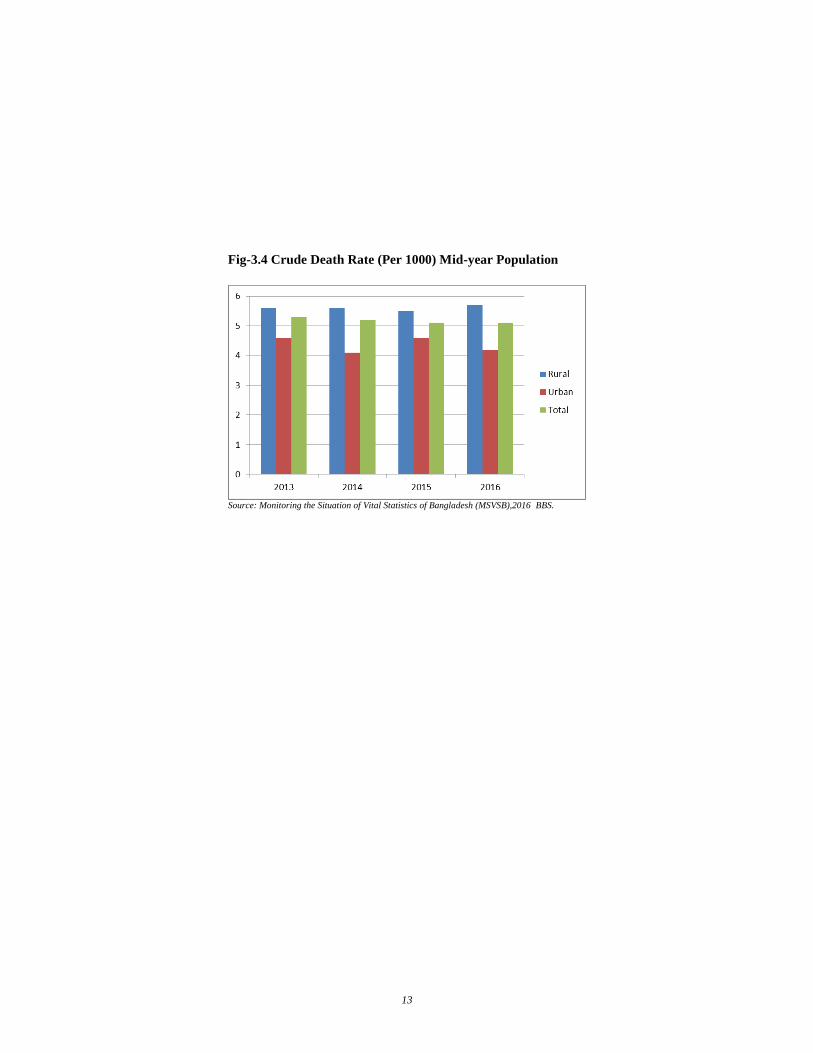
Fig-3.4 Crude Death Rate (Per 1000) Mid-year Population
Source: Monitoring the Situation of Vital Statistics of Bangladesh (MSVSB),2016 BBS.
14
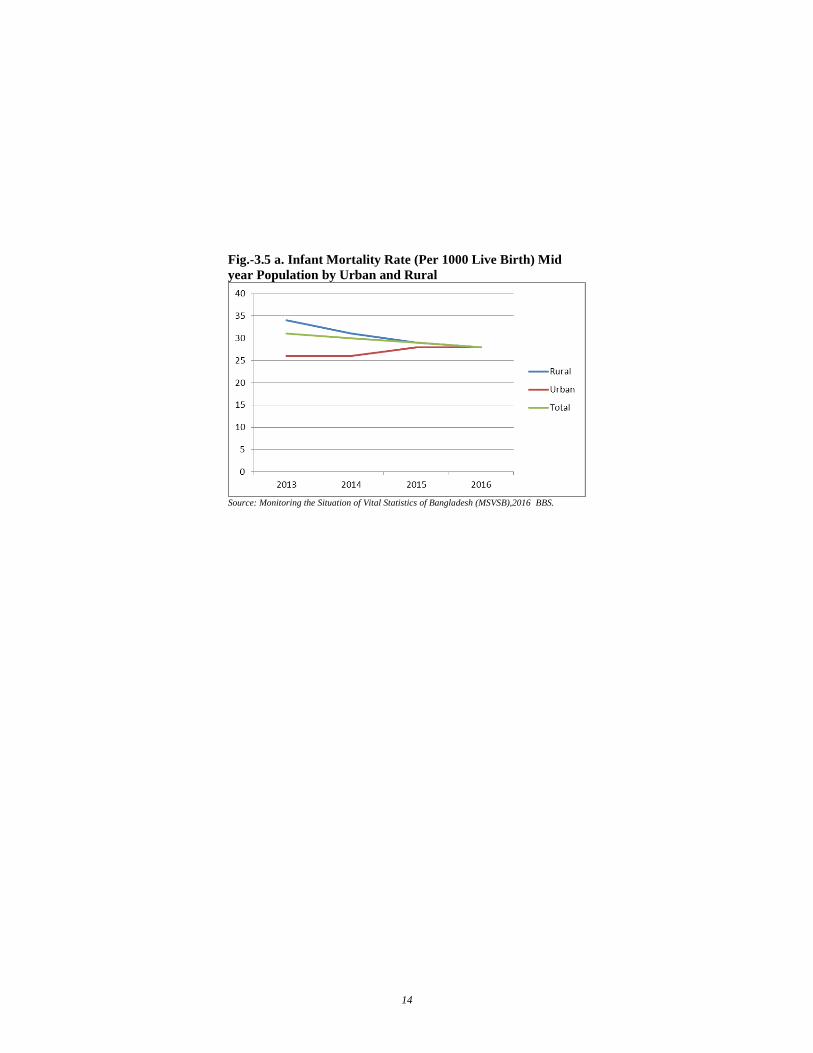
Fig.-3.5 a. Infant Mortality Rate (Per 1000 Live Birth) Mid
year Population by Urban and Rural
Source: Monitoring the Situation of Vital Statistics of Bangladesh (MSVSB),2016 BBS.
15
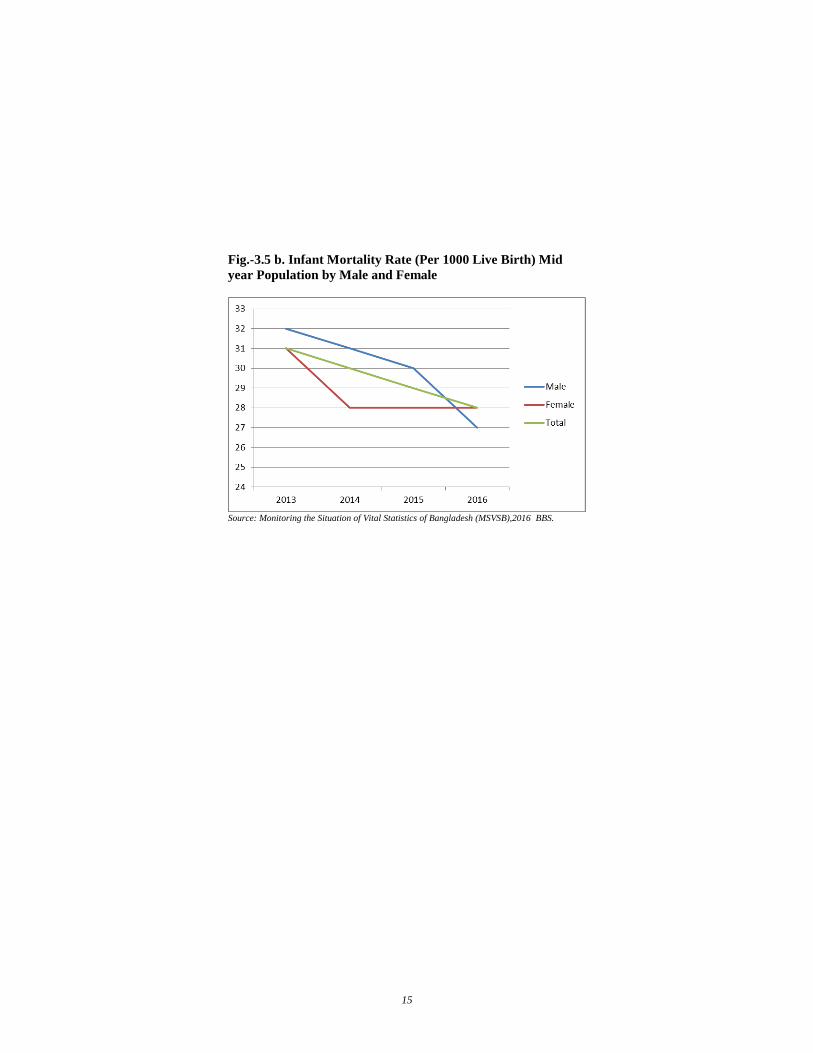
Fig.-3.5 b. Infant Mortality Rate (Per 1000 Live Birth) Mid
year Population by Male and Female
Source: Monitoring the Situation of Vital Statistics of Bangladesh (MSVSB),2016 BBS.
16
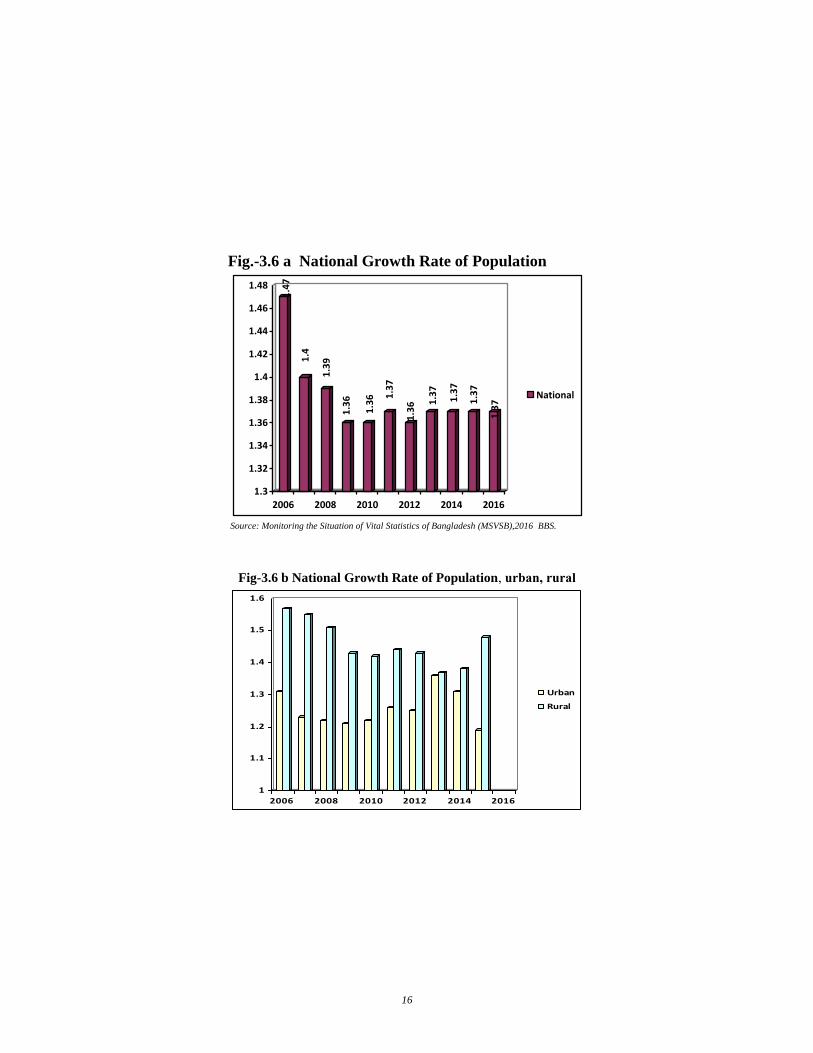
Fig.-3.6 a National Growth Rate of Population
1.4
7
1.4
1.3
9
1.3
6
1.3
6 1.3
7
1.3
6 1.3
7
1.3
7
1.3
7
1.3
71.3
1.32
1.34
1.36
1.38
1.4
1.42
1.44
1.46
1.48
2006 2008 2010 2012 2014 2016
National
Source: Monitoring the Situation of Vital Statistics of Bangladesh (MSVSB),2016 BBS.
Fig-3.6 b National Growth Rate of Population, urban, rural
1
1.1
1.2
1.3
1.4
1.5
1.6
2006 2008 2010 2012 2014 2016
Urban
Rural
17
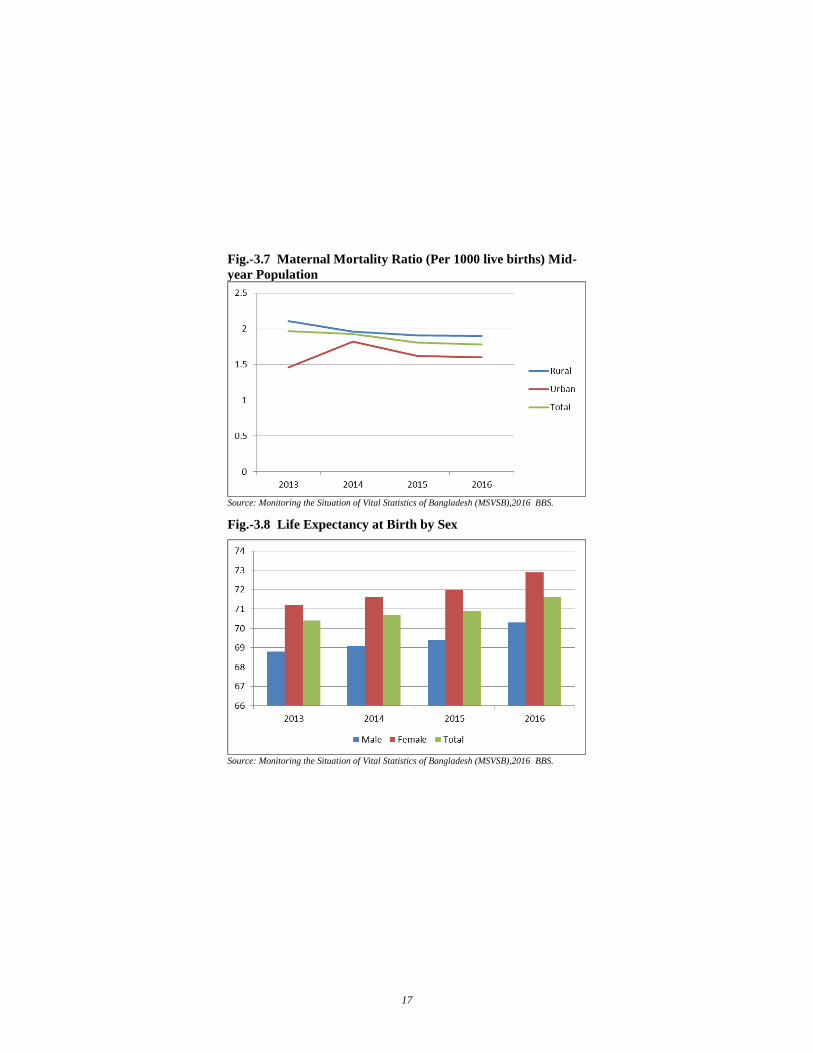
Fig.-3.7 Maternal Mortality Ratio (Per 1000 live births) Mid-
year Population
Source: Monitoring the Situation of Vital Statistics of Bangladesh (MSVSB),2016 BBS.
Fig.-3.8 Life Expectancy at Birth by Sex
Source: Monitoring the Situation of Vital Statistics of Bangladesh (MSVSB),2016 BBS.
18
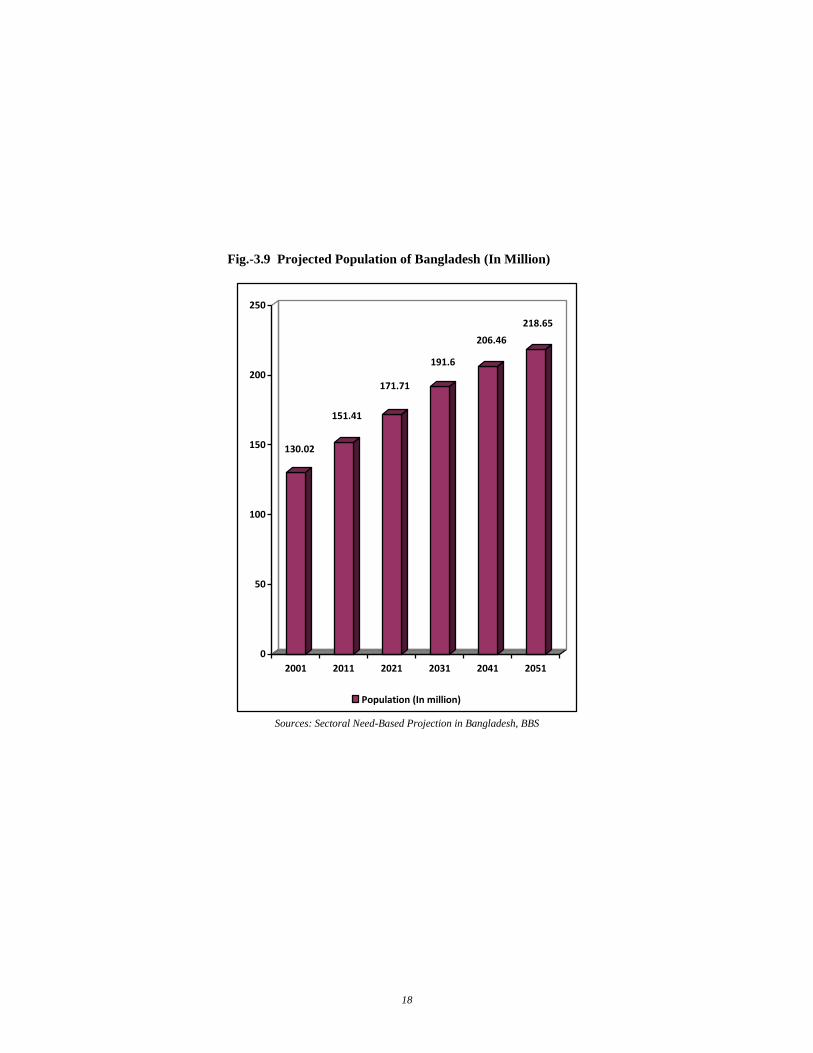
Fig.-3.9 Projected Population of Bangladesh (In Million)
130.02
151.41
171.71
191.6
206.46
218.65
0
50
100
150
200
250
2001 2011 2021 2031 2041 2051
Population (In million)
Sources: Sectoral Need-Based Projection in Bangladesh, BBS
19
Chapter IV
Education and Health
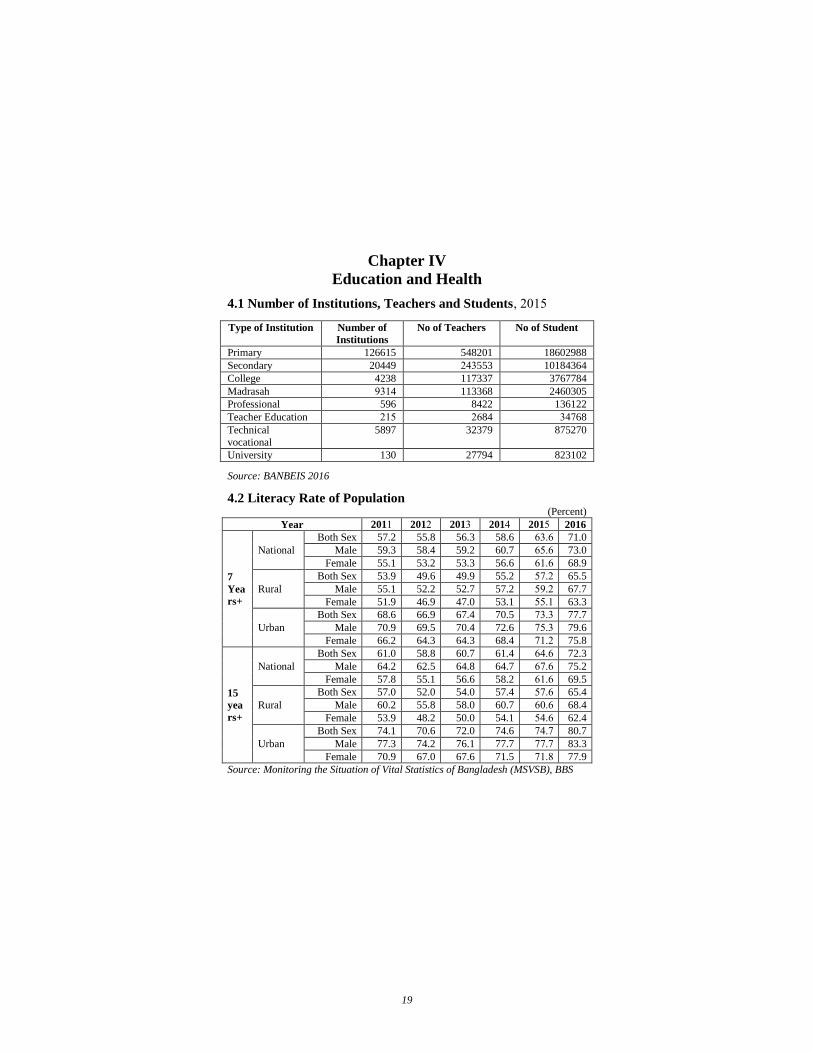
4.1 Number of Institutions, Teachers and Students, 2015
Type of Institution Number of
Institutions
No of Teachers No of Student
Primary 126615 548201 18602988
Secondary 20449 243553 10184364
College 4238 117337 3767784
Madrasah 9314 113368 2460305
Professional 596 8422 136122
Teacher Education 215 2684 34768
Technical
vocational
5897 32379 875270
University 130 27794 823102
Source: BANBEIS 2016
4.2 Literacy Rate of Population (Percent)
Year 2011 2012 2013 2014 2015 2016
7
Yea
rs+
National
Both Sex 57.2 55.8 56.3 58.6 63.6 71.0
Male 59.3 58.4 59.2 60.7 65.6 73.0
Female 55.1 53.2 53.3 56.6 61.6 68.9
Rural
Both Sex 53.9 49.6 49.9 55.2 57.2 65.5
Male 55.1 52.2 52.7 57.2 59.2 67.7
Female 51.9 46.9 47.0 53.1 55.1 63.3
Urban
Both Sex 68.6 66.9 67.4 70.5 73.3 77.7
Male 70.9 69.5 70.4 72.6 75.3 79.6
Female 66.2 64.3 64.3 68.4 71.2 75.8
15
yea
rs+
National
Both Sex 61.0 58.8 60.7 61.4 64.6 72.3
Male 64.2 62.5 64.8 64.7 67.6 75.2
Female 57.8 55.1 56.6 58.2 61.6 69.5
Rural
Both Sex 57.0 52.0 54.0 57.4 57.6 65.4
Male 60.2 55.8 58.0 60.7 60.6 68.4
Female 53.9 48.2 50.0 54.1 54.6 62.4
Urban
Both Sex 74.1 70.6 72.0 74.6 74.7 80.7
Male 77.3 74.2 76.1 77.7 77.7 83.3
Female 70.9 67.0 67.6 71.5 71.8 77.9
Source: Monitoring the Situation of Vital Statistics of Bangladesh (MSVSB), BBS
20
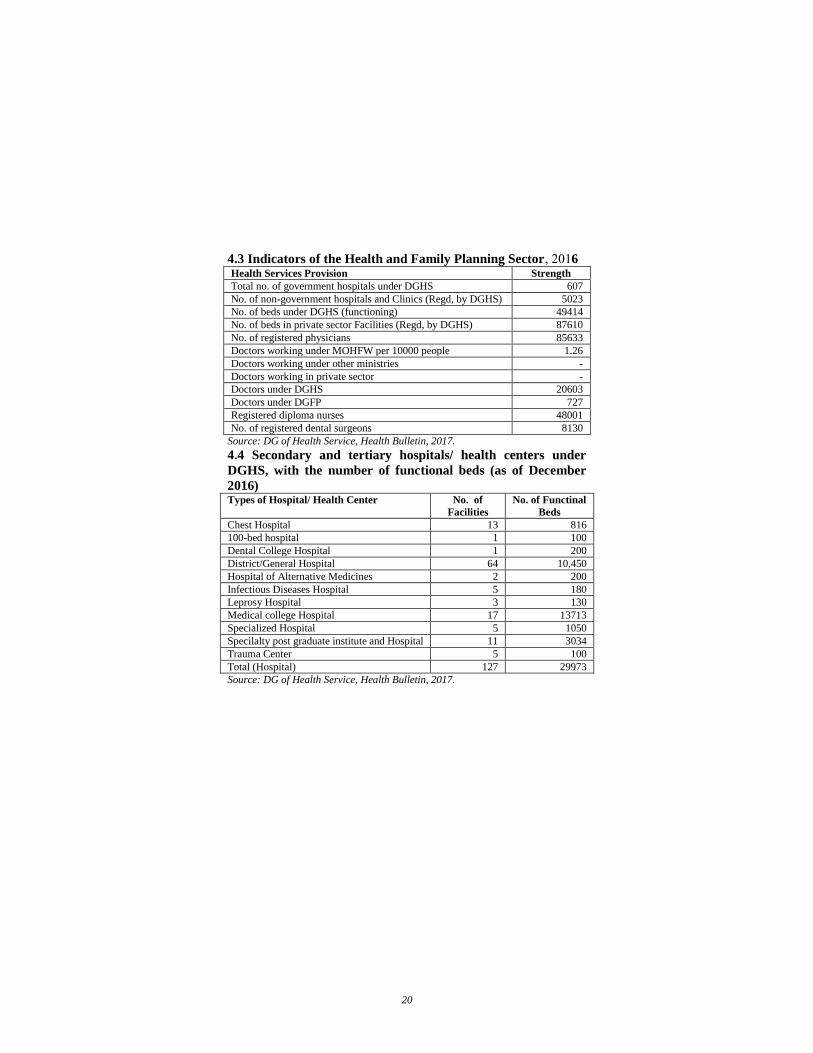
4.3 Indicators of the Health and Family Planning Sector, 2016 Health Services Provision Strength
Total no. of government hospitals under DGHS 607
No. of non-government hospitals and Clinics (Regd, by DGHS) 5023
No. of beds under DGHS (functioning) 49414
No. of beds in private sector Facilities (Regd, by DGHS) 87610
No. of registered physicians 85633
Doctors working under MOHFW per 10000 people 1.26
Doctors working under other ministries -
Doctors working in private sector -
Doctors under DGHS 20603
Doctors under DGFP 727
Registered diploma nurses 48001
No. of registered dental surgeons 8130
Source: DG of Health Service, Health Bulletin, 2017.
4.4 Secondary and tertiary hospitals/ health centers under
DGHS, with the number of functional beds (as of December
2016) Types of Hospital/ Health Center No. of
Facilities
No. of Functinal
Beds
Chest Hospital 13 816
100-bed hospital 1 100
Dental College Hospital 1 200
District/General Hospital 64 10,450
Hospital of Alternative Medicines 2 200
Infectious Diseases Hospital 5 180
Leprosy Hospital 3 130
Medical college Hospital 17 13713
Specialized Hospital 5 1050
Specilalty post graduate institute and Hospital 11 3034
Trauma Center 5 100
Total (Hospital) 127 29973
Source: DG of Health Service, Health Bulletin, 2017.
21
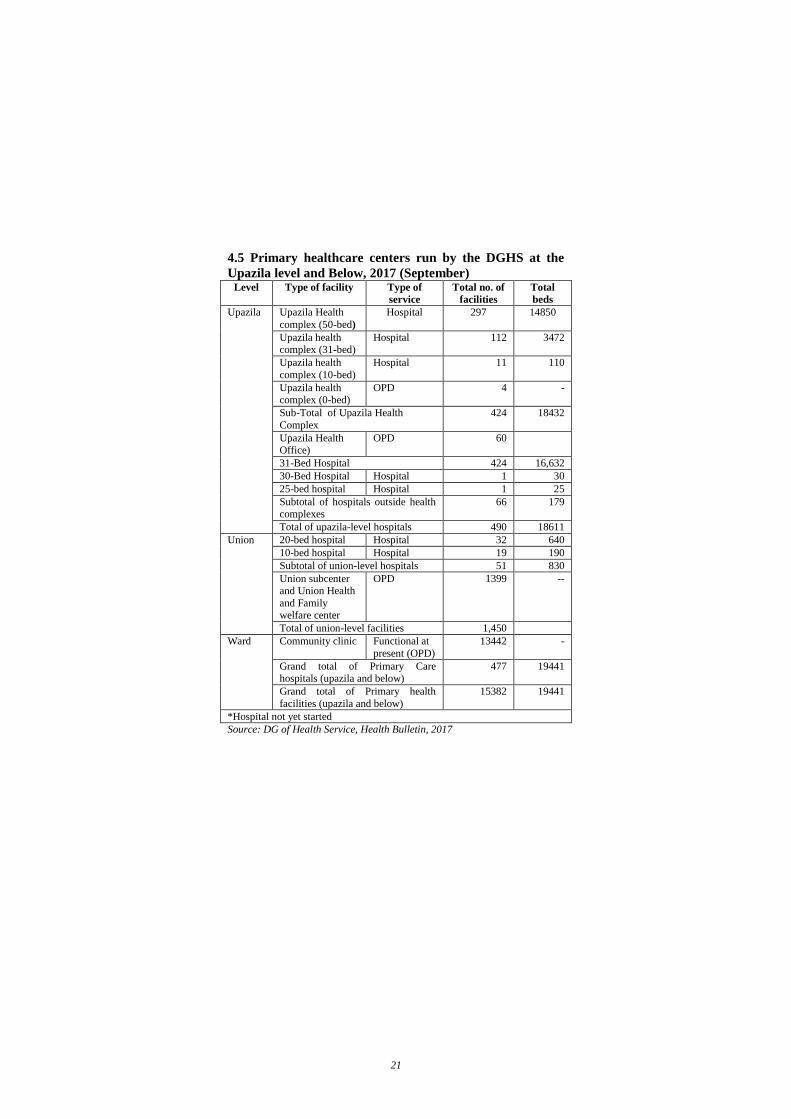
4.5 Primary healthcare centers run by the DGHS at the
Upazila level and Below, 2017 (September) Level Type of facility Type of
service
Total no. of
facilities
Total
beds
Upazila Upazila Health
complex (50-bed)
Hospital 297 14850
Upazila health complex (31-bed)
Hospital 112 3472
Upazila health
complex (10-bed)
Hospital 11 110
Upazila health complex (0-bed)
OPD 4 -
Sub-Total of Upazila Health
Complex
424 18432
Upazila Health Office)
OPD 60
31-Bed Hospital 424 16,632
30-Bed Hospital Hospital 1 30
25-bed hospital Hospital 1 25
Subtotal of hospitals outside health complexes
66 179
Total of upazila-level hospitals 490 18611
Union 20-bed hospital Hospital 32 640
10-bed hospital Hospital 19 190
Subtotal of union-level hospitals 51 830
Union subcenter and Union Health
and Family welfare center
OPD 1399 --
Total of union-level facilities 1,450
Ward Community clinic Functional at
present (OPD)
13442 -
Grand total of Primary Care hospitals (upazila and below)
477 19441
Grand total of Primary health
facilities (upazila and below)
15382 19441
*Hospital not yet started
Source: DG of Health Service, Health Bulletin, 2017

22
23
Chapter V
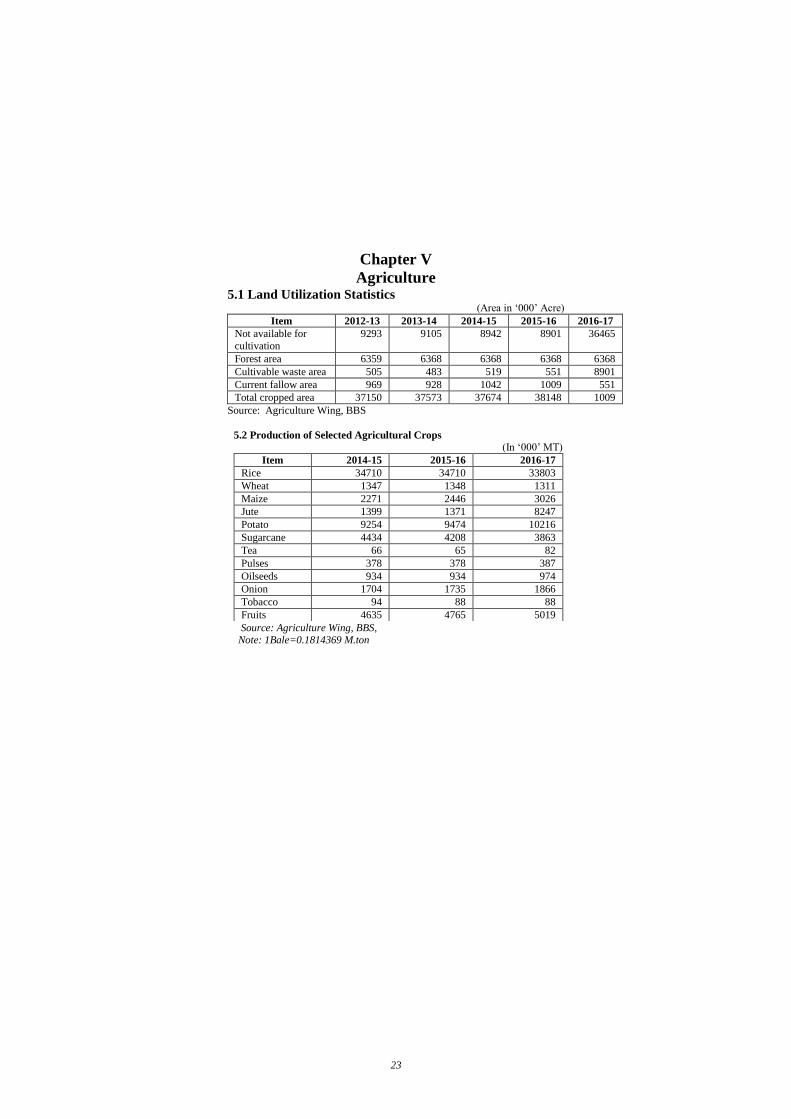
Agriculture 5.1 Land Utilization Statistics
(Area in ‘000’ Acre)
Item 2012-13 2013-14 2014-15 2015-16 2016-17
Not available for
cultivation
9293 9105 8942 8901 36465
Forest area 6359 6368 6368 6368 6368
Cultivable waste area 505 483 519 551 8901
Current fallow area 969 928 1042 1009 551
Total cropped area 37150 37573 37674 38148 1009
Source: Agriculture Wing, BBS
5.2 Production of Selected Agricultural Crops
(In ‘000’ MT)
Item 2014-15 2015-16 2016-17
Rice 34710 34710 33803
Wheat 1347 1348 1311
Maize 2271 2446 3026
Jute 1399 1371 8247
Potato 9254 9474 10216
Sugarcane 4434 4208 3863
Tea 66 65 82
Pulses 378 378 387
Oilseeds 934 934 974
Onion 1704 1735 1866
Tobacco 94 88 88
Fruits 4635 4765 5019
Source: Agriculture Wing, BBS, Note: 1Bale=0.1814369 M.ton
24
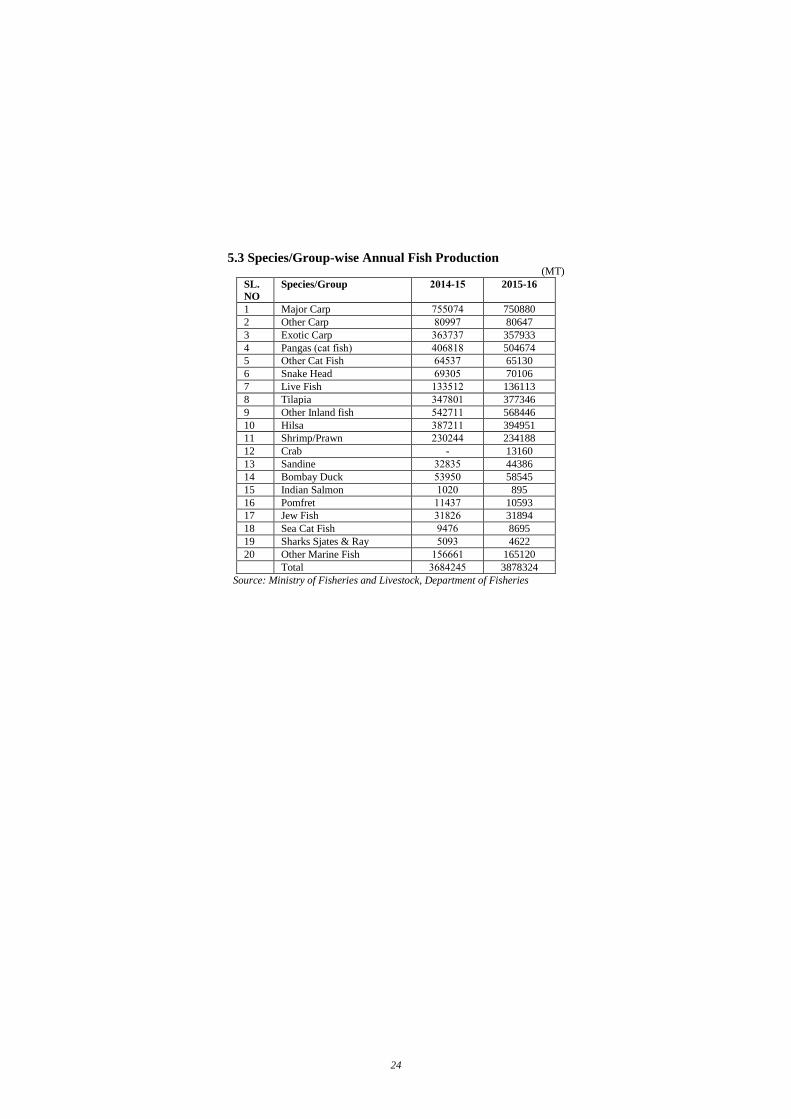
5.3 Species/Group-wise Annual Fish Production (MT)
SL.
NO
Species/Group 2014-15 2015-16
1 Major Carp 755074 750880
2 Other Carp 80997 80647
3 Exotic Carp 363737 357933
4 Pangas (cat fish) 406818 504674
5 Other Cat Fish 64537 65130
6 Snake Head 69305 70106
7 Live Fish 133512 136113
8 Tilapia 347801 377346
9 Other Inland fish 542711 568446
10 Hilsa 387211 394951
11 Shrimp/Prawn 230244 234188
12 Crab - 13160
13 Sandine 32835 44386
14 Bombay Duck 53950 58545
15 Indian Salmon 1020 895
16 Pomfret 11437 10593
17 Jew Fish 31826 31894
18 Sea Cat Fish 9476 8695
19 Sharks Sjates & Ray 5093 4622
20 Other Marine Fish 156661 165120
Total 3684245 3878324
Source: Ministry of Fisheries and Livestock, Department of Fisheries
25
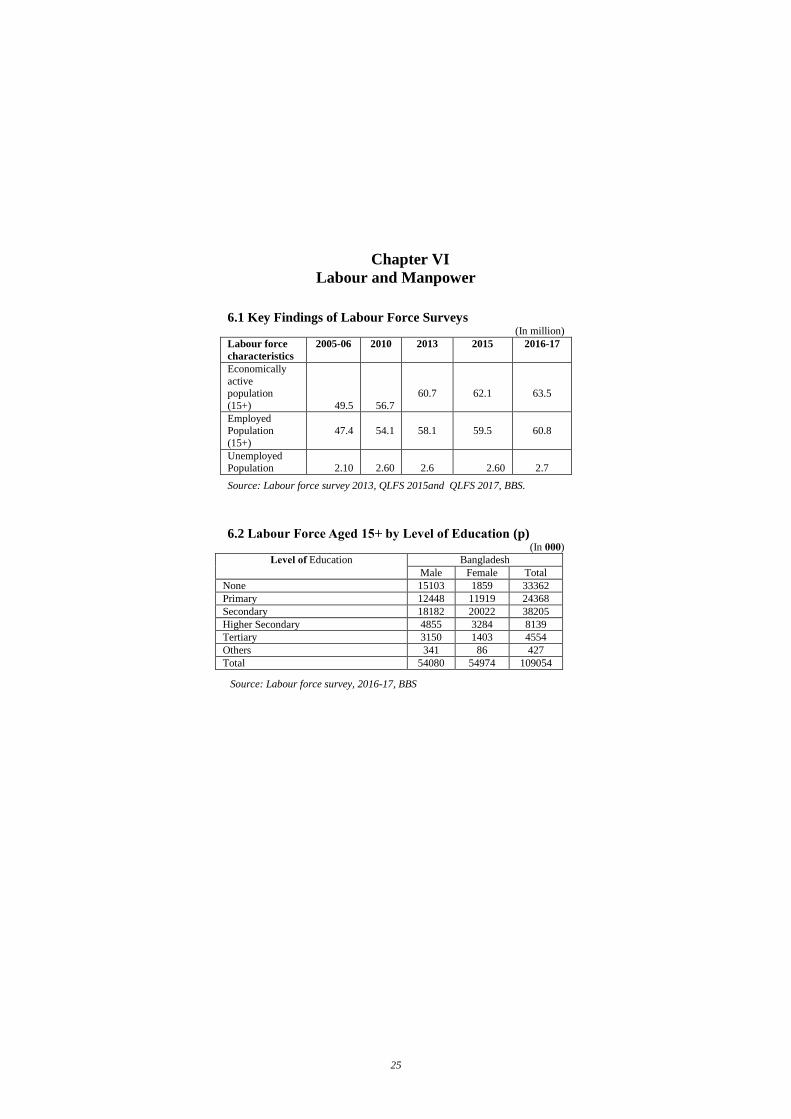
Chapter VI
Labour and Manpower
6.1 Key Findings of Labour Force Surveys
(In million)
Labour force
characteristics
2005-06 2010 2013 2015 2016-17
Economically
active population
(15+) 49.5 56.7
60.7
62.1
63.5
Employed Population
(15+)
47.4
54.1
58.1
59.5
60.8
Unemployed Population
2.10
2.60
2.6
2.60
2.7
Source: Labour force survey 2013, QLFS 2015and QLFS 2017, BBS.
6.2 Labour Force Aged 15+ by Level of Education (p) (In 000)
Level of Education Bangladesh
Male Female Total
None 15103 1859 33362
Primary 12448 11919 24368
Secondary 18182 20022 38205
Higher Secondary 4855 3284 8139
Tertiary 3150 1403 4554
Others 341 86 427
Total 54080 54974 109054
Source: Labour force survey, 2016-17, BBS
26
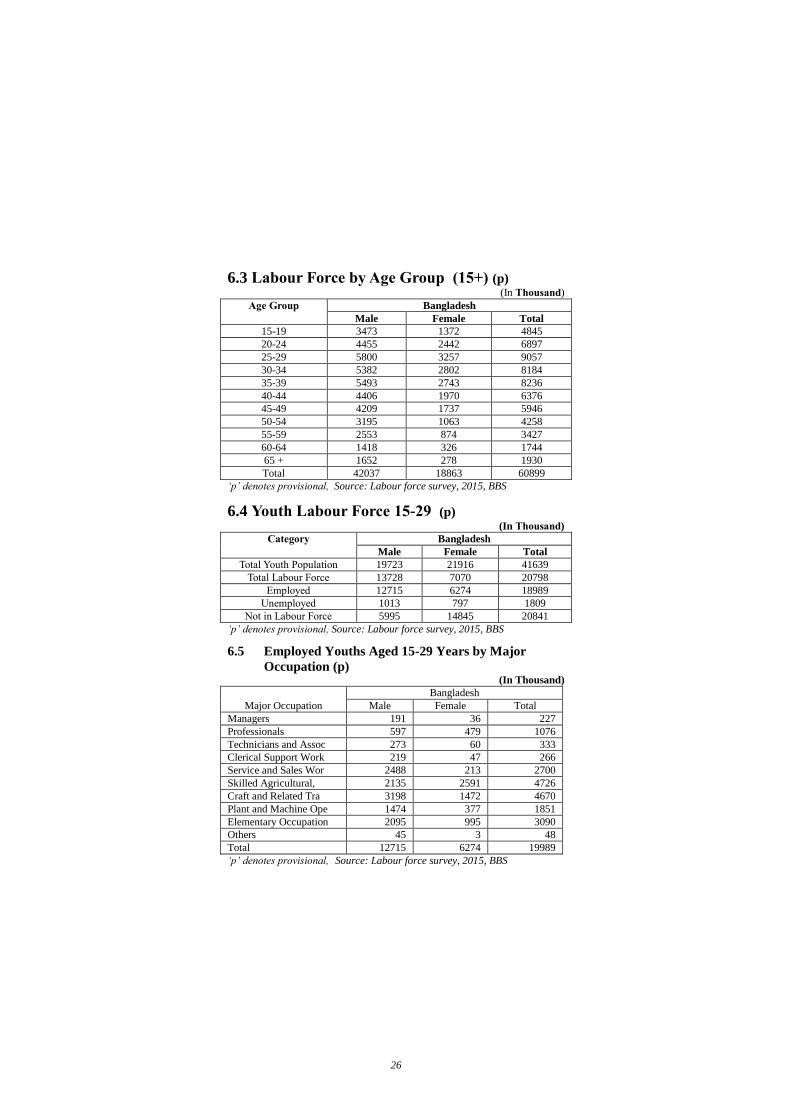
6.3 Labour Force by Age Group (15+) (p) (In Thousand)
Age Group Bangladesh
Male Female Total
15-19 3473 1372 4845
20-24 4455 2442 6897
25-29 5800 3257 9057
30-34 5382 2802 8184
35-39 5493 2743 8236
40-44 4406 1970 6376
45-49 4209 1737 5946
50-54 3195 1063 4258
55-59 2553 874 3427
60-64 1418 326 1744
65 + 1652 278 1930
Total 42037 18863 60899
‘p’ denotes provisional, Source: Labour force survey, 2015, BBS
6.4 Youth Labour Force 15-29 (p) (In Thousand)
Category Bangladesh
Male Female Total
Total Youth Population 19723 21916 41639
Total Labour Force 13728 7070 20798
Employed 12715 6274 18989
Unemployed 1013 797 1809
Not in Labour Force 5995 14845 20841
‘p’ denotes provisional, Source: Labour force survey, 2015, BBS
6.5 Employed Youths Aged 15-29 Years by Major
Occupation (p) (In Thousand)
Major Occupation
Bangladesh
Male Female Total
Managers 191 36 227
Professionals 597 479 1076
Technicians and Assoc 273 60 333
Clerical Support Work 219 47 266
Service and Sales Wor 2488 213 2700
Skilled Agricultural, 2135 2591 4726
Craft and Related Tra 3198 1472 4670
Plant and Machine Ope 1474 377 1851
Elementary Occupation 2095 995 3090
Others 45 3 48
Total 12715 6274 19989
‘p’ denotes provisional, Source: Labour force survey, 2015, BBS
27
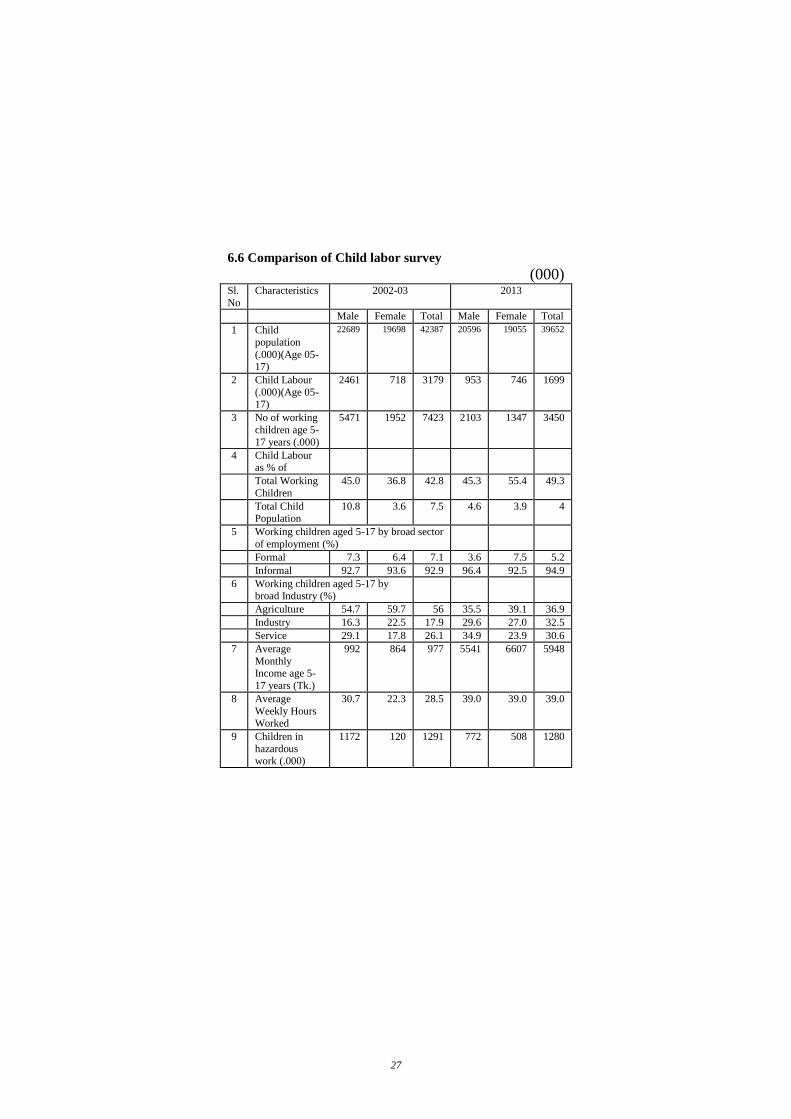
6.6 Comparison of Child labor survey (000)
Sl.
No
Characteristics 2002-03 2013
Male Female Total Male Female Total
1 Child
population
(.000)(Age 05-17)
22689 19698 42387 20596 19055 39652
2 Child Labour
(.000)(Age 05-17)
2461 718 3179 953 746 1699
3 No of working
children age 5-
17 years (.000)
5471 1952 7423 2103 1347 3450
4 Child Labour as % of
Total Working
Children
45.0 36.8 42.8 45.3 55.4 49.3
Total Child Population
10.8 3.6 7.5 4.6 3.9 4
5 Working children aged 5-17 by broad sector
of employment (%)
Formal 7.3 6.4 7.1 3.6 7.5 5.2
Informal 92.7 93.6 92.9 96.4 92.5 94.9
6 Working children aged 5-17 by broad Industry (%)
Agriculture 54.7 59.7 56 35.5 39.1 36.9
Industry 16.3 22.5 17.9 29.6 27.0 32.5
Service 29.1 17.8 26.1 34.9 23.9 30.6
7 Average
Monthly Income age 5-
17 years (Tk.)
992 864 977 5541 6607 5948
8 Average
Weekly Hours Worked
30.7 22.3 28.5 39.0 39.0 39.0
9 Children in
hazardous
work (.000)
1172 120 1291 772 508 1280
28
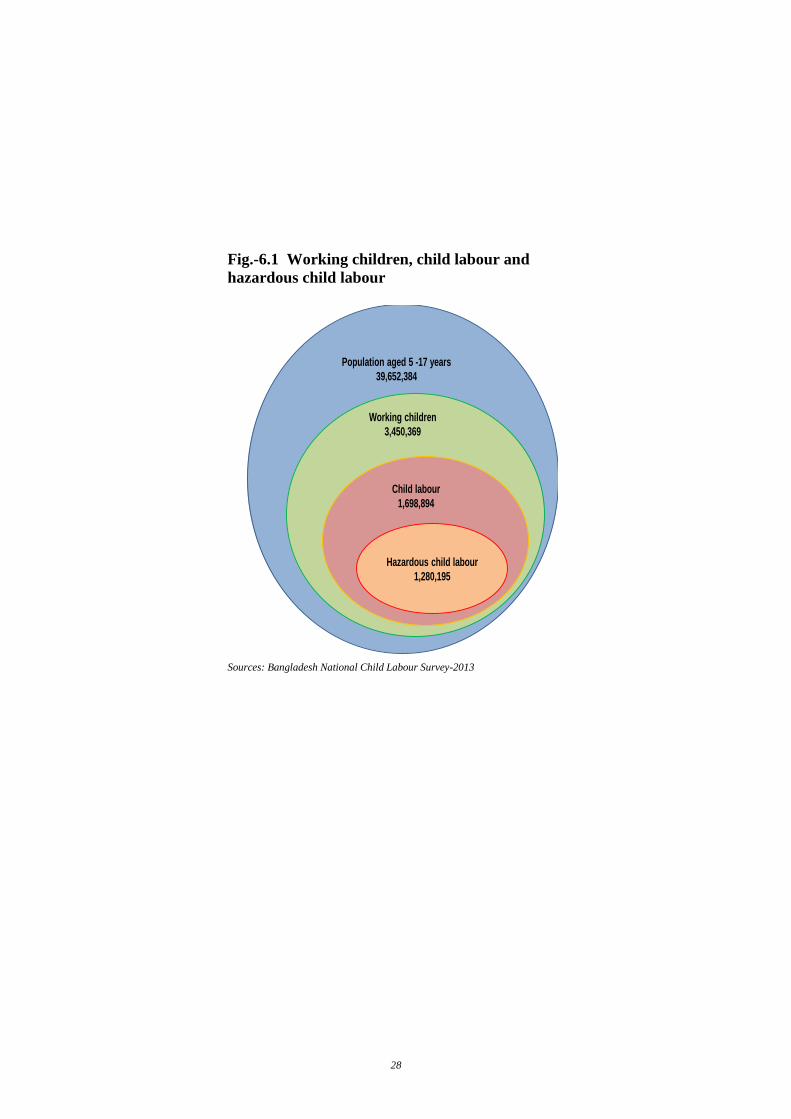
Fig.-6.1 Working children, child labour and
hazardous child labour
Hazardous child labour
1,280,195
Population aged 5 -17 years
39,652,384
Working children
3,450,369
Child labour
1,698,894
Sources: Bangladesh National Child Labour Survey-2013

29
Fig.-6.2 Overseas Employment
0
100000
200000
300000
400000
500000
600000
700000
800000
900000
Overseas Employment 187543 222686 252702 875055 475278 390702 568052 607798 409253 425684
1995 2000 2005 2008 2009 2010 2011 2012 2013 2014
Sources: Bureau of Manpower, Employment and Training (BMET)

30
31
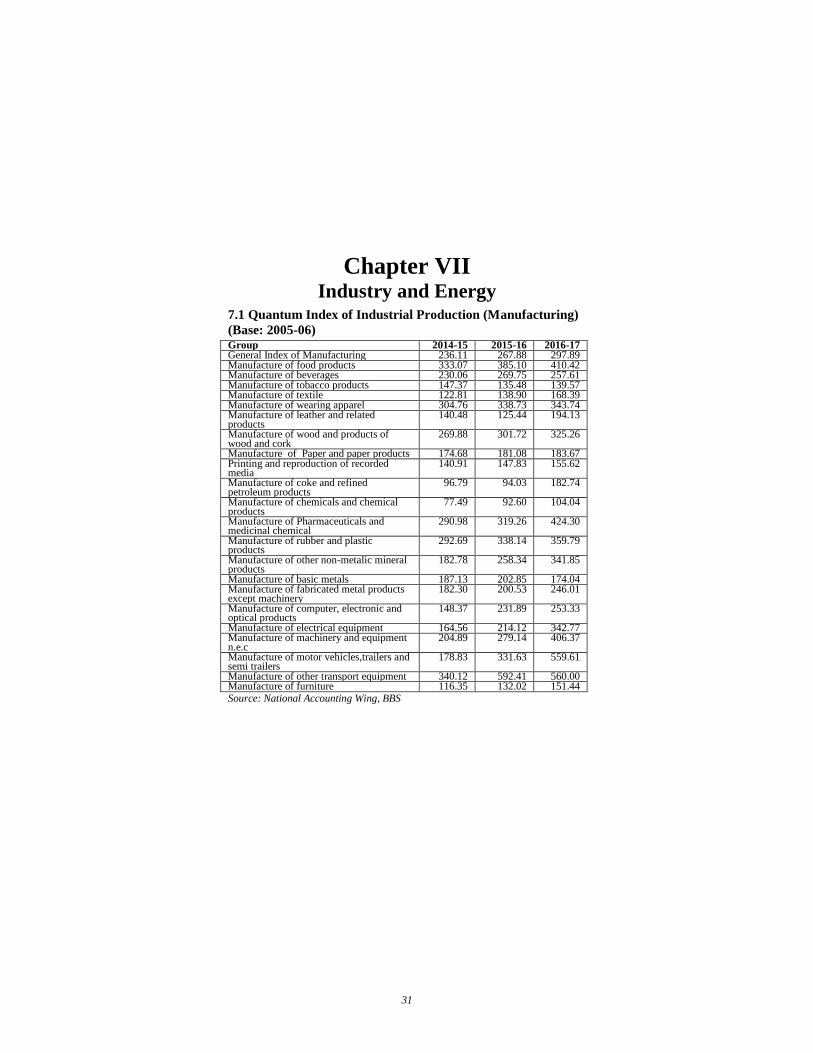
Chapter VII Industry and Energy
7.1 Quantum Index of Industrial Production (Manufacturing)
(Base: 2005-06)
Group 2014-15 2015-16 2016-17 General Index of Manufacturing 236.11 267.88 297.89 Manufacture of food products 333.07 385.10 410.42 Manufacture of beverages 230.06 269.75 257.61 Manufacture of tobacco products 147.37 135.48 139.57 Manufacture of textile 122.81 138.90 168.39 Manufacture of wearing apparel 304.76 338.73 343.74 Manufacture of leather and related products
140.48 125.44 194.13
Manufacture of wood and products of wood and cork
269.88 301.72 325.26
Manufacture of Paper and paper products 174.68 181.08 183.67 Printing and reproduction of recorded media
140.91 147.83 155.62
Manufacture of coke and refined petroleum products
96.79 94.03 182.74
Manufacture of chemicals and chemical products
77.49 92.60 104.04
Manufacture of Pharmaceuticals and medicinal chemical
290.98 319.26 424.30
Manufacture of rubber and plastic products
292.69 338.14 359.79
Manufacture of other non-metalic mineral products
182.78 258.34 341.85
Manufacture of basic metals 187.13 202.85 174.04 Manufacture of fabricated metal products except machinery
182.30 200.53 246.01
Manufacture of computer, electronic and optical products
148.37 231.89 253.33
Manufacture of electrical equipment 164.56 214.12 342.77 Manufacture of machinery and equipment n.e.c
204.89 279.14 406.37
Manufacture of motor vehicles,trailers and semi trailers
178.83 331.63 559.61
Manufacture of other transport equipment 340.12 592.41 560.00 Manufacture of furniture 116.35 132.02 151.44 Source: National Accounting Wing, BBS
32
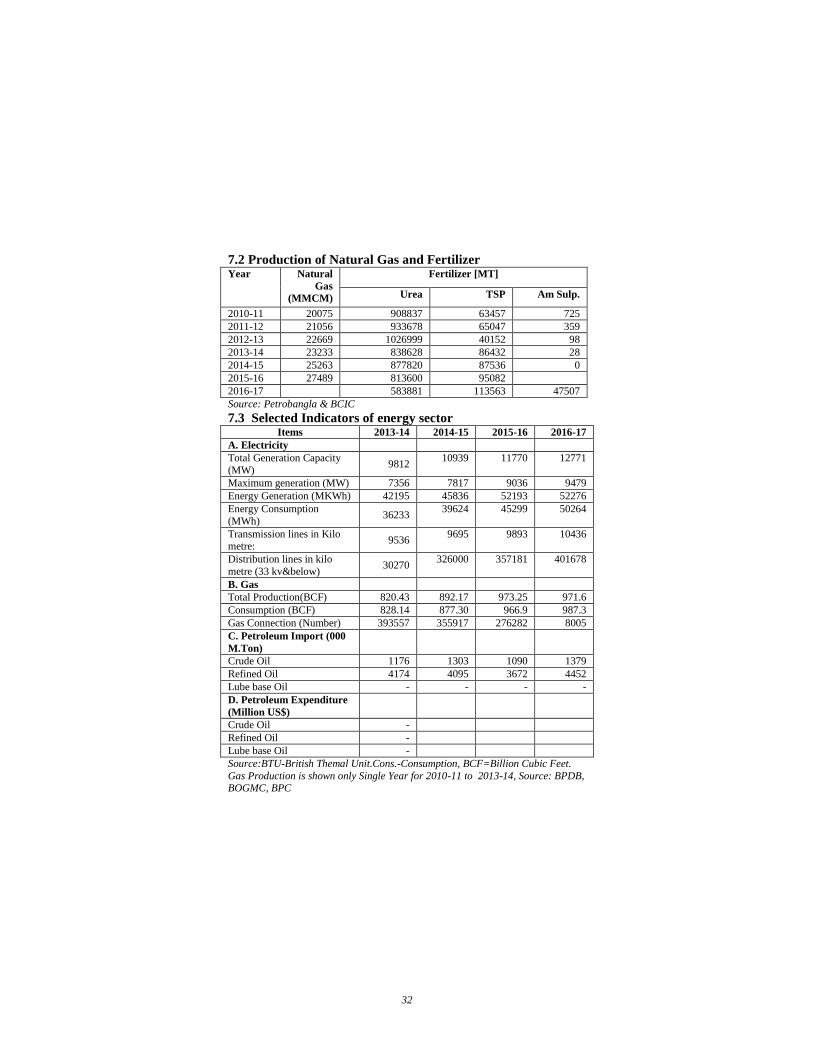
7.2 Production of Natural Gas and Fertilizer Year Natural
Gas
(MMCM)
Fertilizer [MT]
Urea TSP Am Sulp.
2010-11 20075 908837 63457 725
2011-12 21056 933678 65047 359
2012-13 22669 1026999 40152 98
2013-14 23233 838628 86432 28
2014-15 25263 877820 87536 0
2015-16 27489 813600 95082
2016-17 583881 113563 47507
Source: Petrobangla & BCIC
7.3 Selected Indicators of energy sector Items 2013-14 2014-15 2015-16 2016-17
A. Electricity
Total Generation Capacity
(MW) 9812
10939 11770 12771
Maximum generation (MW) 7356 7817 9036 9479
Energy Generation (MKWh) 42195 45836 52193 52276
Energy Consumption
(MWh) 36233
39624 45299 50264
Transmission lines in Kilo metre:
9536 9695 9893 10436
Distribution lines in kilo
metre (33 kv&below) 30270
326000 357181 401678
B. Gas
Total Production(BCF) 820.43 892.17 973.25 971.6
Consumption (BCF) 828.14 877.30 966.9 987.3
Gas Connection (Number) 393557 355917 276282 8005
C. Petroleum Import (000
M.Ton)
Crude Oil 1176 1303 1090 1379
Refined Oil 4174 4095 3672 4452
Lube base Oil - - - -
D. Petroleum Expenditure
(Million US$)
Crude Oil -
Refined Oil -
Lube base Oil -
Source:BTU-British Themal Unit.Cons.-Consumption, BCF=Billion Cubic Feet.
Gas Production is shown only Single Year for 2010-11 to 2013-14, Source: BPDB, BOGMC, BPC
33
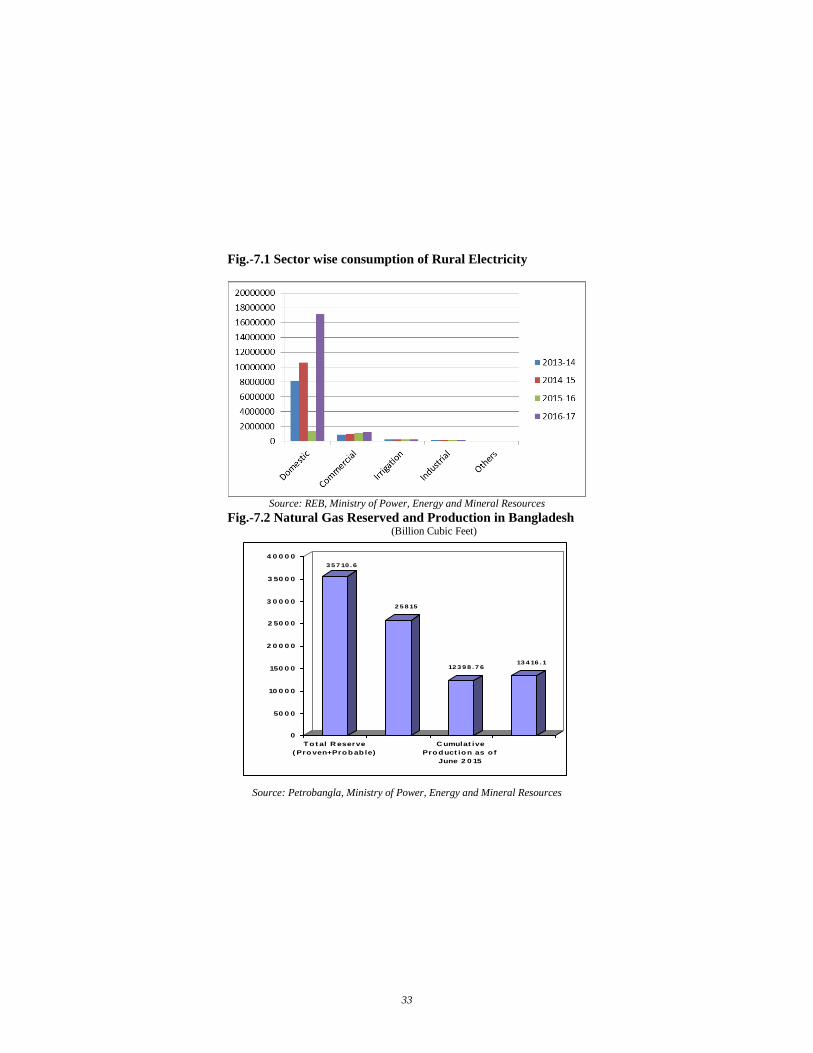
Fig.-7.1 Sector wise consumption of Rural Electricity
Source: REB, Ministry of Power, Energy and Mineral Resources
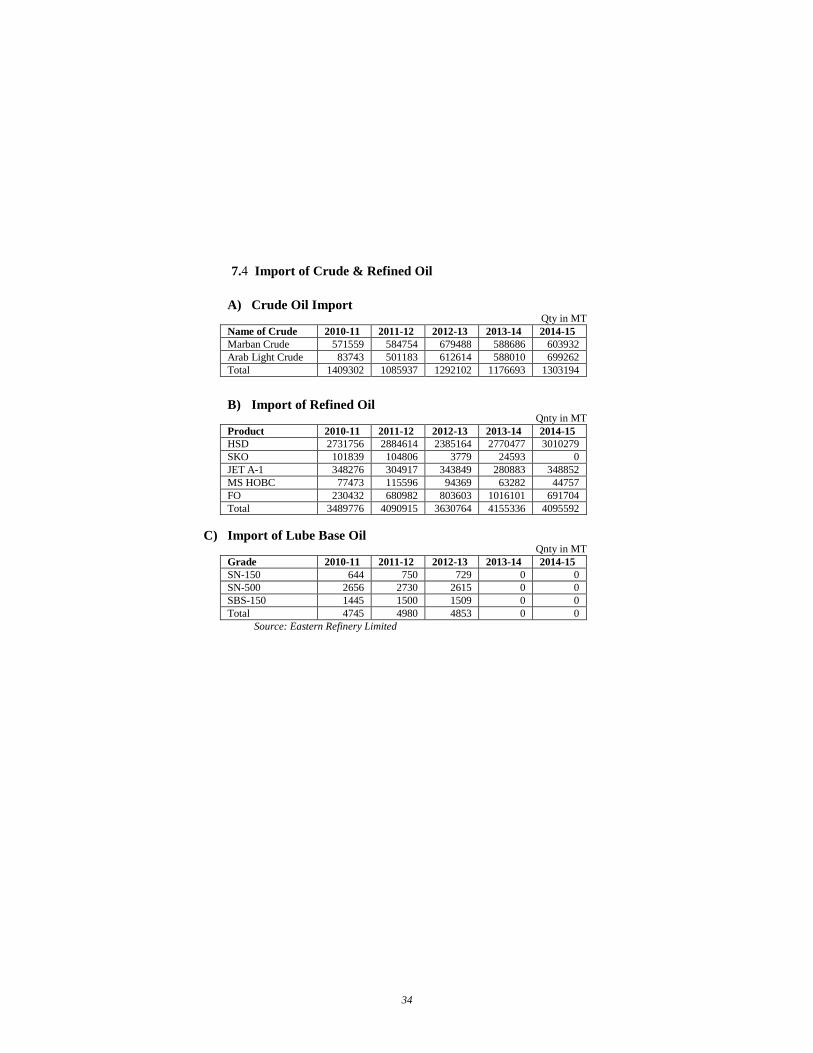
Fig.-7.2 Natural Gas Reserved and Production in Bangladesh (Billion Cubic Feet)
Source: Petrobangla, Ministry of Power, Energy and Mineral Resources
3 5 7 10 . 6
2 5 8 15
12 3 9 8 . 7 613 4 16 . 1
0
50 0 0
10 0 0 0
150 0 0
2 0 0 0 0
2 50 0 0
3 0 0 0 0
3 50 0 0
4 0 0 0 0
Tot al R eserve
( Proven+Probab le)
C umulat ive
Pro d uct ion as o f
June 2 0 15
34
7.4 Import of Crude & Refined Oil
A) Crude Oil Import
Qty in MT
Name of Crude 2010-11 2011-12 2012-13 2013-14 2014-15
Marban Crude 571559 584754 679488 588686 603932
Arab Light Crude 83743 501183 612614 588010 699262
Total 1409302 1085937 1292102 1176693 1303194
B) Import of Refined Oil
Qnty in MT
Product 2010-11 2011-12 2012-13 2013-14 2014-15
HSD 2731756 2884614 2385164 2770477 3010279
SKO 101839 104806 3779 24593 0
JET A-1 348276 304917 343849 280883 348852
MS HOBC 77473 115596 94369 63282 44757
FO 230432 680982 803603 1016101 691704
Total 3489776 4090915 3630764 4155336 4095592
C) Import of Lube Base Oil Qnty in MT
Grade 2010-11 2011-12 2012-13 2013-14 2014-15
SN-150 644 750 729 0 0
SN-500 2656 2730 2615 0 0
SBS-150 1445 1500 1509 0 0
Total 4745 4980 4853 0 0
Source: Eastern Refinery Limited
35
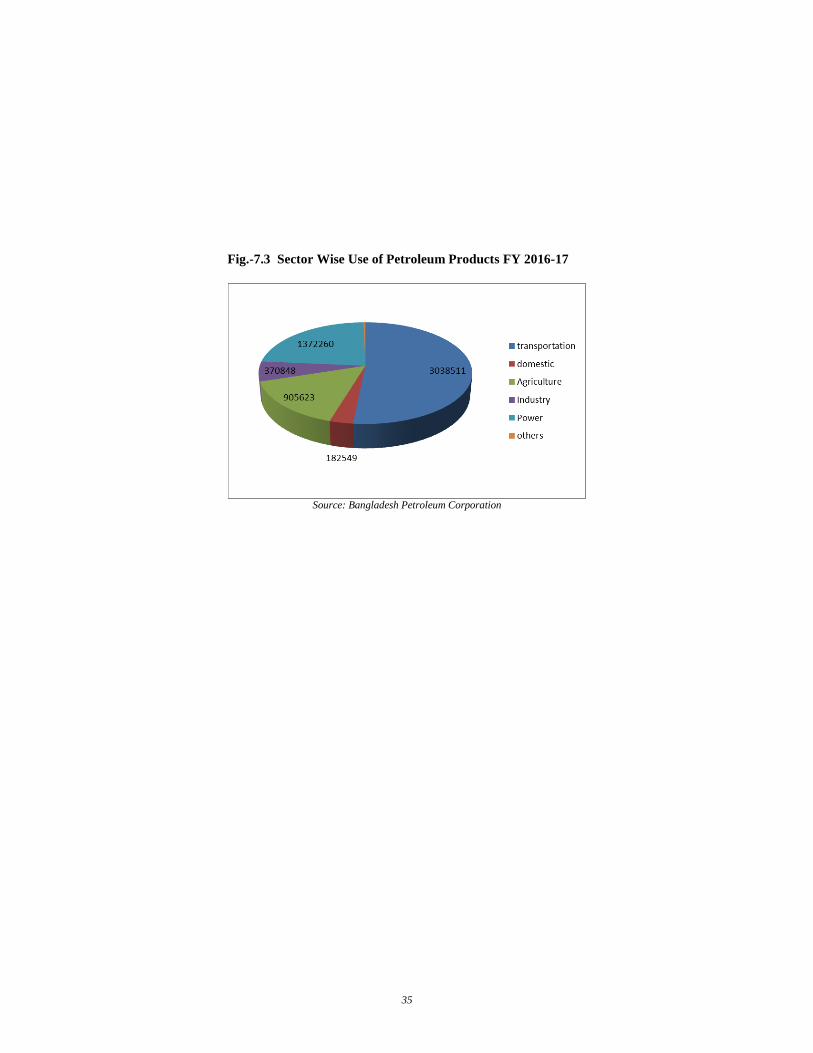
Fig.-7.3 Sector Wise Use of Petroleum Products FY 2016-17
Source: Bangladesh Petroleum Corporation
36
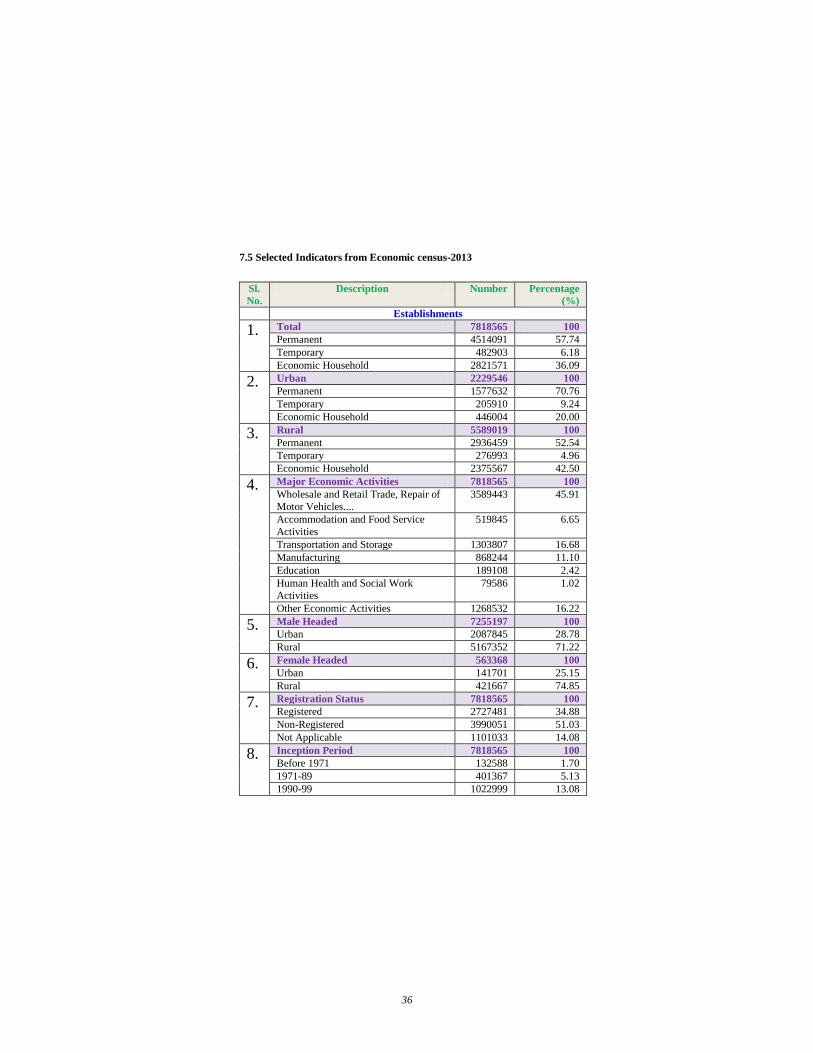
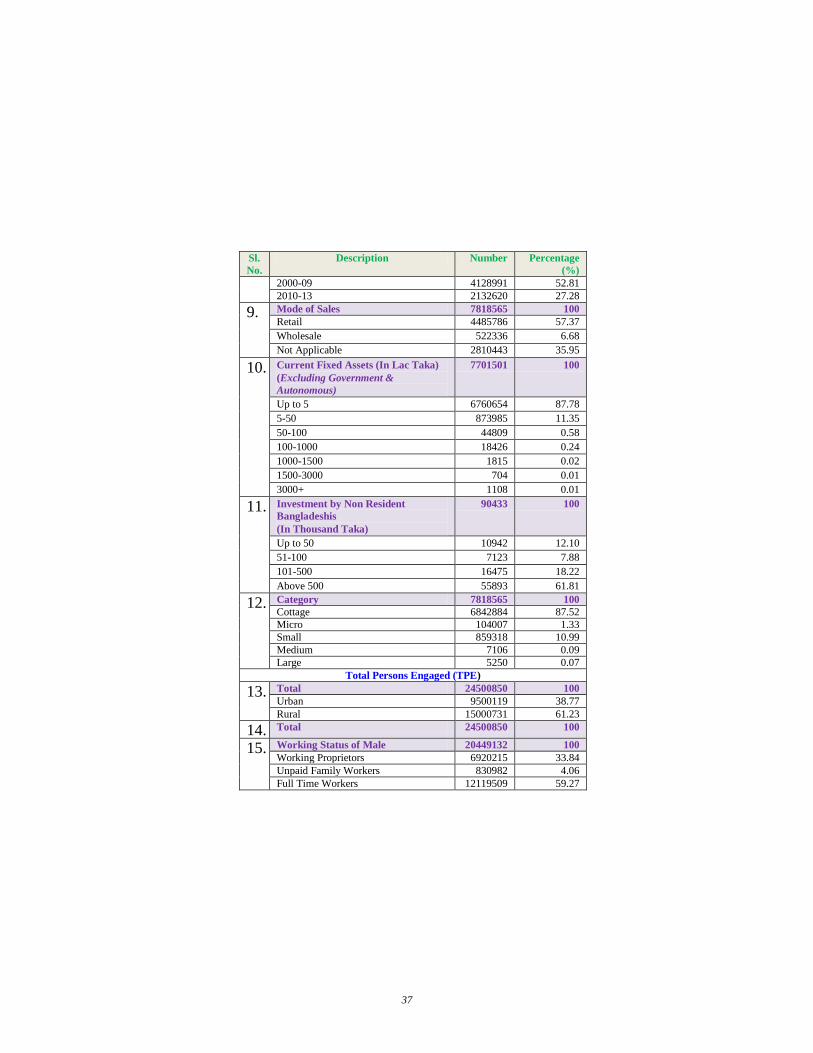
7.5 Selected Indicators from Economic census-2013
Sl.
No.
Description Number Percentage
(%)
Establishments
1. Total 7818565 100
Permanent 4514091 57.74
Temporary 482903 6.18
Economic Household 2821571 36.09
2. Urban 2229546 100
Permanent 1577632 70.76
Temporary 205910 9.24
Economic Household 446004 20.00
3. Rural 5589019 100
Permanent 2936459 52.54
Temporary 276993 4.96
Economic Household 2375567 42.50
4. Major Economic Activities 7818565 100
Wholesale and Retail Trade, Repair of
Motor Vehicles....
3589443 45.91
Accommodation and Food Service
Activities
519845 6.65
Transportation and Storage 1303807 16.68
Manufacturing 868244 11.10
Education 189108 2.42
Human Health and Social Work
Activities
79586 1.02
Other Economic Activities 1268532 16.22
5. Male Headed 7255197 100
Urban 2087845 28.78
Rural 5167352 71.22
6. Female Headed 563368 100
Urban 141701 25.15
Rural 421667 74.85
7. Registration Status 7818565 100
Registered 2727481 34.88
Non-Registered 3990051 51.03
Not Applicable 1101033 14.08
8. Inception Period 7818565 100
Before 1971 132588 1.70
1971-89 401367 5.13
1990-99 1022999 13.08
37
Sl.
No.
Description Number Percentage
(%)
2000-09 4128991 52.81
2010-13 2132620 27.28
9. Mode of Sales 7818565 100
Retail 4485786 57.37
Wholesale 522336 6.68
Not Applicable 2810443 35.95
10. Current Fixed Assets (In Lac Taka)
(Excluding Government &
Autonomous)
7701501 100
Up to 5 6760654 87.78
5-50 873985 11.35
50-100 44809 0.58
100-1000 18426 0.24
1000-1500 1815 0.02
1500-3000 704 0.01
3000+ 1108 0.01
11. Investment by Non Resident
Bangladeshis
(In Thousand Taka)
90433 100
Up to 50 10942 12.10
51-100 7123 7.88
101-500 16475 18.22
Above 500 55893 61.81
12. Category 7818565 100
Cottage 6842884 87.52
Micro 104007 1.33
Small 859318 10.99
Medium 7106 0.09
Large 5250 0.07
Total Persons Engaged (TPE)
13. Total 24500850 100
Urban 9500119 38.77
Rural 15000731 61.23
14. Total 24500850 100
15. Working Status of Male 20449132 100
Working Proprietors 6920215 33.84
Unpaid Family Workers 830982 4.06
Full Time Workers 12119509 59.27
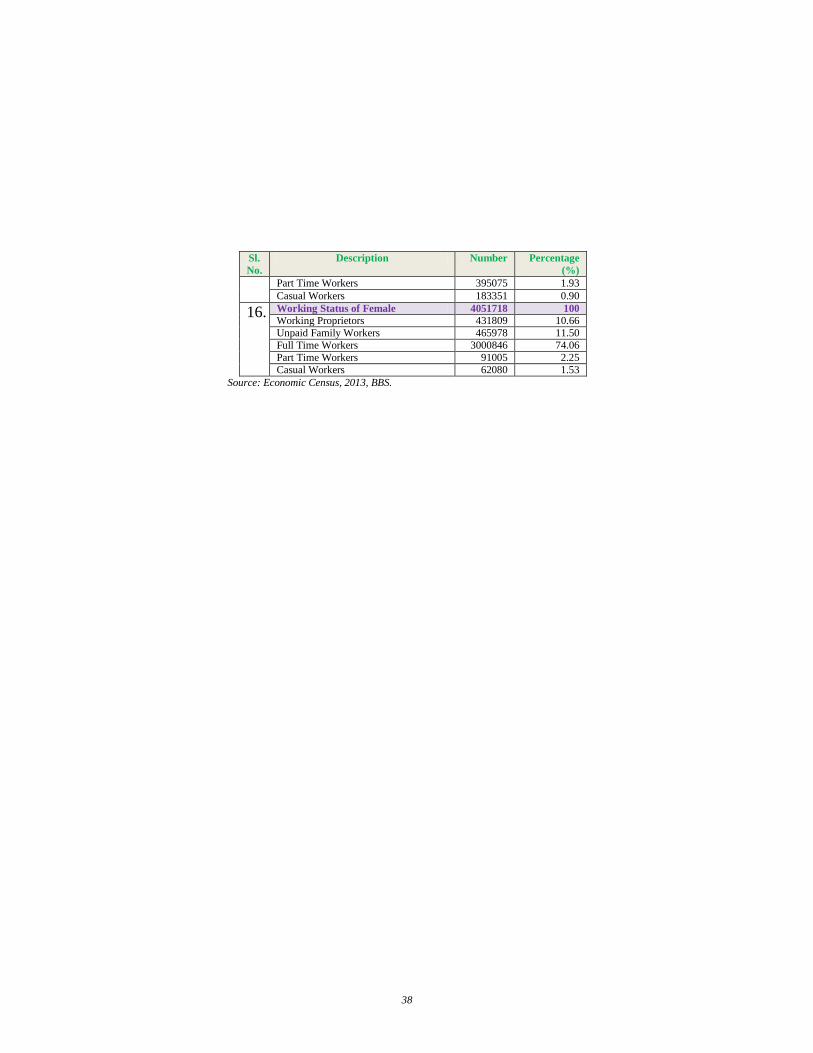
38
Sl.
No.
Description Number Percentage
(%)
Part Time Workers 395075 1.93
Casual Workers 183351 0.90
16. Working Status of Female 4051718 100
Working Proprietors 431809 10.66
Unpaid Family Workers 465978 11.50
Full Time Workers 3000846 74.06
Part Time Workers 91005 2.25
Casual Workers 62080 1.53
Source: Economic Census, 2013, BBS.
39
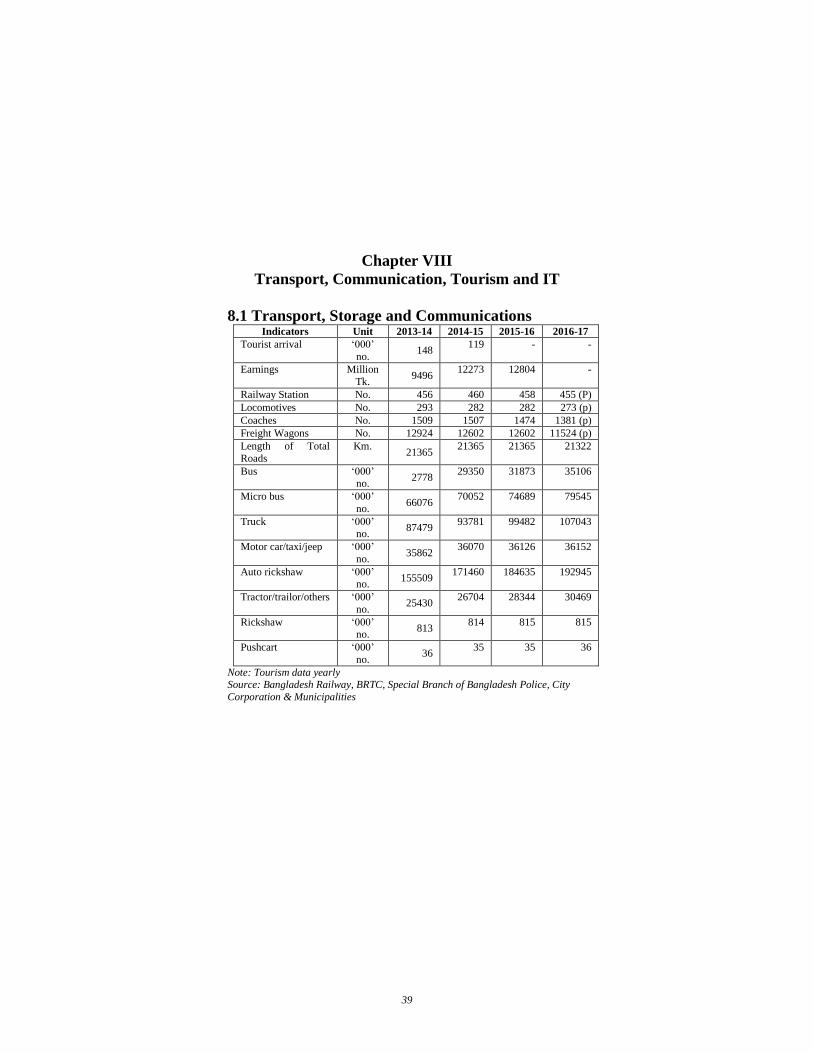
Chapter VIII
Transport, Communication, Tourism and IT
8.1 Transport, Storage and Communications Indicators Unit 2013-14 2014-15 2015-16 2016-17
Tourist arrival ‘000’
no. 148
119 - -
Earnings Million
Tk. 9496
12273 12804 -
Railway Station No. 456 460 458 455 (P)
Locomotives No. 293 282 282 273 (p)
Coaches No. 1509 1507 1474 1381 (p)
Freight Wagons No. 12924 12602 12602 11524 (p)
Length of Total
Roads
Km. 21365
21365 21365 21322
Bus ‘000’ no.
2778 29350 31873 35106
Micro bus ‘000’
no. 66076
70052 74689 79545
Truck ‘000’ no.
87479 93781 99482 107043
Motor car/taxi/jeep ‘000’
no. 35862
36070 36126 36152
Auto rickshaw ‘000’ no.
155509 171460 184635 192945
Tractor/trailor/others ‘000’
no. 25430
26704 28344 30469
Rickshaw ‘000’ no.
813 814 815 815
Pushcart ‘000’
no. 36
35 35 36
Note: Tourism data yearly Source: Bangladesh Railway, BRTC, Special Branch of Bangladesh Police, City
Corporation & Municipalities
40
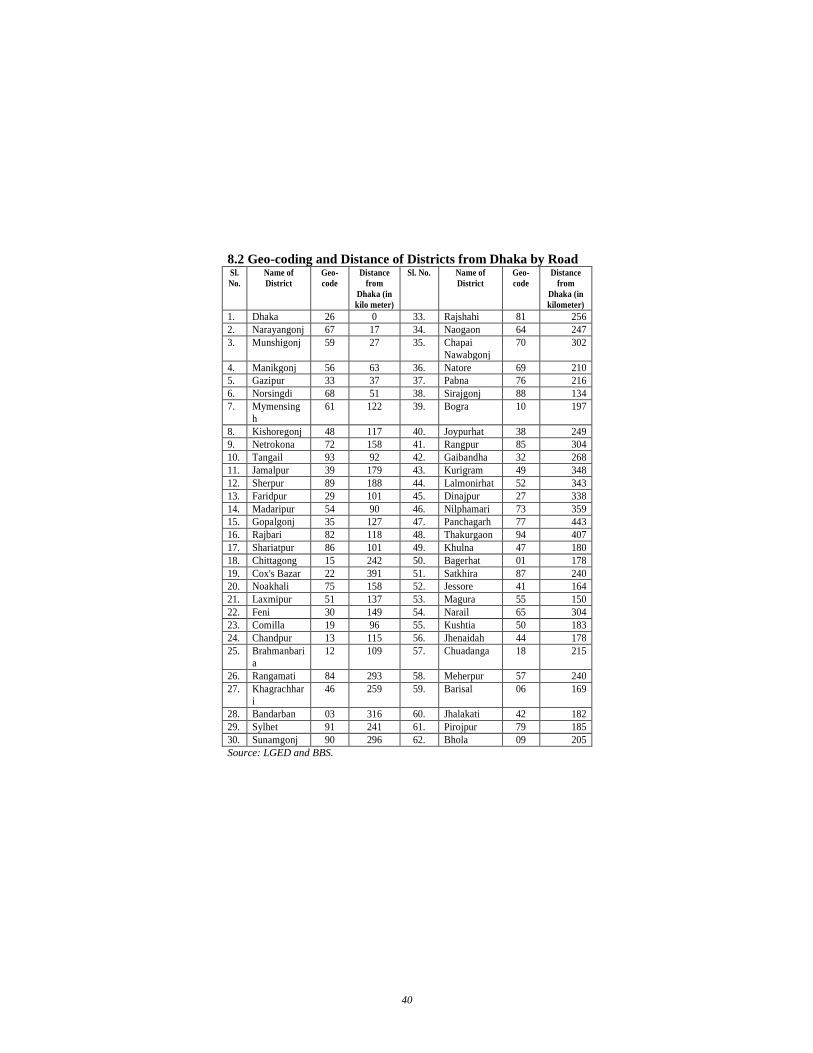
8.2 Geo-coding and Distance of Districts from Dhaka by Road Sl.
No.
Name of
District
Geo-
code
Distance
from
Dhaka (in
kilo meter)
Sl. No. Sl. No. Name of
District
Geo-
code
Distance
from
Dhaka (in
kilometer)
1. Dhaka 26 0 33. Rajshahi 81 256
2. Narayangonj 67 17 34. Naogaon 64 247
3. Munshigonj 59 27 35. Chapai
Nawabgonj
70 302
4. Manikgonj 56 63 36. Natore 69 210
5. Gazipur 33 37 37. Pabna 76 216
6. Norsingdi 68 51 38. Sirajgonj 88 134
7. Mymensing
h
61 122 39. Bogra 10 197
8. Kishoregonj 48 117 40. Joypurhat 38 249
9. Netrokona 72 158 41. Rangpur 85 304
10. Tangail 93 92 42. Gaibandha 32 268
11. Jamalpur 39 179 43. Kurigram 49 348
12. Sherpur 89 188 44. Lalmonirhat 52 343
13. Faridpur 29 101 45. Dinajpur 27 338
14. Madaripur 54 90 46. Nilphamari 73 359
15. Gopalgonj 35 127 47. Panchagarh 77 443
16. Rajbari 82 118 48. Thakurgaon 94 407
17. Shariatpur 86 101 49. Khulna 47 180
18. Chittagong 15 242 50. Bagerhat 01 178
19. Cox's Bazar 22 391 51. Satkhira 87 240
20. Noakhali 75 158 52. Jessore 41 164
21. Laxmipur 51 137 53. Magura 55 150
22. Feni 30 149 54. Narail 65 304
23. Comilla 19 96 55. Kushtia 50 183
24. Chandpur 13 115 56. Jhenaidah 44 178
25. Brahmanbaria
12 109 57. Chuadanga 18 215
26. Rangamati 84 293 58. Meherpur 57 240
27. Khagrachhar
i
46 259 59. Barisal 06 169
28. Bandarban 03 316 60. Jhalakati 42 182
29. Sylhet 91 241 61. Pirojpur 79 185
30. Sunamgonj 90 296 62. Bhola 09 205
Source: LGED and BBS.

41
8.3 Key findings in Computer Software Industry Indicators Year
2013-14 2014-15 Total employment size in computer software manufacturing
companies (number)*
21514 23478
Male 18801 20656
Female 2713 2822
Total employment cost (million tk) 16486.65 22506.16
Total sales value of packaged software produced in the country by
types of clients (million tk)
10162.25 11629.80
Sales to individuals and households 709.06 836.24
Sales for embedding in computer hardware 124.25 196.58
Sales to government and semi government organization 547.42 2036.42
Sales to other business organization in Bangladesh 4867.61 3940.19
Total sales value of customized software produced in the country
(million tk)
15594.61 23482.76
Sales to government and semi government organization 205.17 268.65
Sales to other business organization in Bangladesh 4188.64 6565.82
Sales to clients outsideBangladesh (export) 11200.80 16648.29
Total gross output of computer software (million tk) 26334.12 35630.96
Gross value added 20658.84 28210.08
a. Compensation of employees 16486.65 22506.16
b. Operating Surplus 4172.19 5703.91
Intermediate Consumption 5675.28 7420.88
Gross Fixed Capital Formation (GFCF) in Computer software
(million tk)
11379.94 16086.14
Export earnings (million tk)** 15115.05 21268.65
GFCF in Computer software as percent of total GFCF 0.30 0.37
Gross value added (GVA) associated with computer software as
percent of total GVA
0.15 0.19
* Employment size is only for computer software manufacturing companies (establishment
based only)
* Export includes only for packaged and customized software produced by computer software
manufacturing companies (establishment based only)
Source: Report on private sector gross fixed capital formation in software survey 2016, BBS

42

43
Chapter IX
Foreign Trade
9.1 Indicators of the Foreign Trade Sector
) 2013-14 2014-15 2015-16 2016-17
Total imports (CIF) 2822310 3670702 3869349 4712495
Per capita Import
(Tk.)
16078 23247 24200 29134
% of GDP 18.64 24.22 22.33 -
Total export (FOB) 2122602 2408850 2634668 -3003837
Per capita exports (Tk.)
11154 15256 16478 18571
% of GDP 12.93 15.89 15.20 -
Balance of trade (-)2610050 (-)1261852 (-)1234681 (-) 1708658
Source: National Accounting Wing, BBS
9.2 Foreign Trade (Tk in crore)
Year 2014-15 2015-16 2016-17
Exports 148888 236802 471250
Imports 210066 313879 300384
Balance (-)61178 (-)77077 (-) 170866
Source: Economic Trends, Bangladesh Bank, Completed by National Accounting
Wing, BBS
9.3 Export to Top Ten Countries (million tk)
Countries where
we exports
2014-2015 2015-16 2016-17
Value % of
total
Value % of
total
Value % of
total
1. U.S.A 448323 18.61 483322 18.34 505413 16.83
2. Germany 365328 15.17 388967 14.76 475848 15.84
3. UK 248930 10.33 296450 11.25 308430 10.27
4. France 135275 5.62 144033 5.47 164781 5.49
5. Netherlands 65101 2.70 65344 2.48 92899 3.09
6. Canada 79744 3.31 86490 3.28 601141 20.01
7. Italy 107279 4.45 107875 4.09 130299 4.34
8. Spain 136029 5.65 156040 5.92 176136 5.86
9. Belgium 75685 3.14 78414 2.98 80107 2.67
10. Turkey 55979 2.32 5058 0.19 52966 1.76
11.Other
countries
691177 28.69 822725 31.23 415817 13.84
Total exports 2408850 100 2634668 100 3003837 100
Source: National Accounting Wing, BBS
44
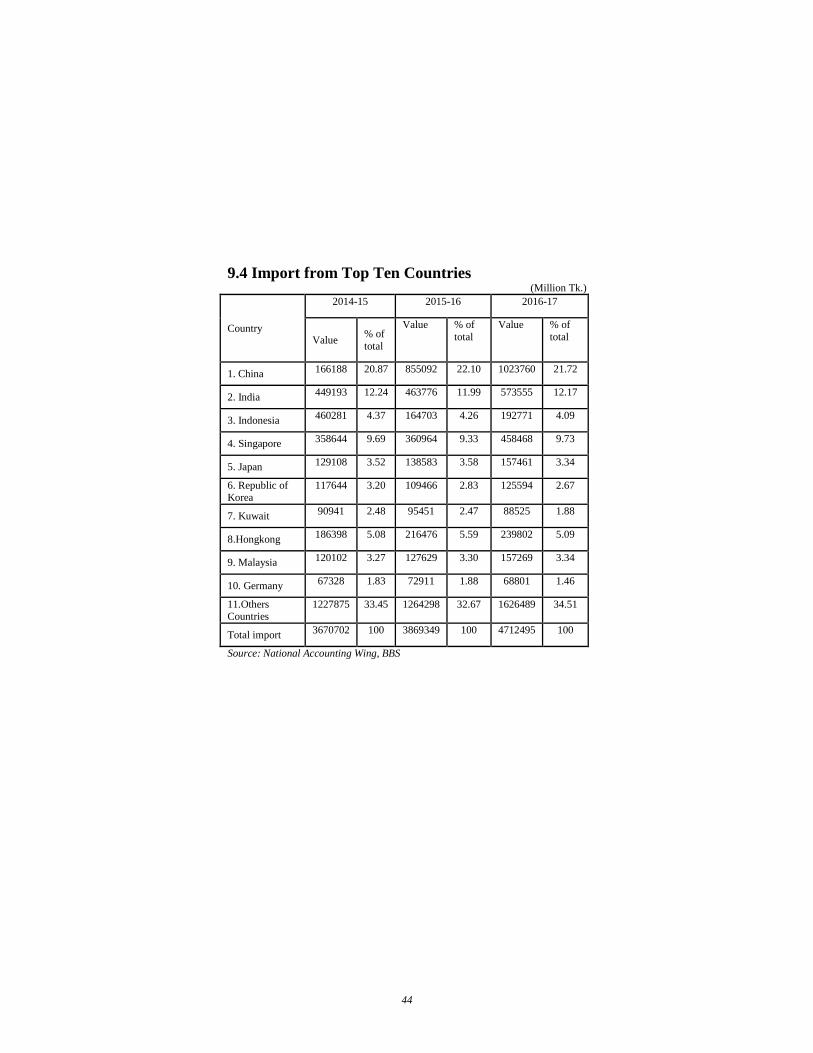
9.4 Import from Top Ten Countries (Million Tk.)
Country
2014-15 2015-16 2016-17
Value % of
total
Value % of
total
Value % of
total
1. China 166188 20.87 855092 22.10 1023760 21.72
2. India 449193 12.24 463776 11.99 573555 12.17
3. Indonesia 460281 4.37 164703 4.26 192771 4.09
4. Singapore 358644 9.69 360964 9.33 458468 9.73
5. Japan 129108 3.52 138583 3.58 157461 3.34
6. Republic of Korea
117644 3.20 109466 2.83 125594 2.67
7. Kuwait 90941 2.48 95451 2.47 88525 1.88
8.Hongkong 186398 5.08 216476 5.59 239802 5.09
9. Malaysia 120102 3.27 127629 3.30 157269 3.34
10. Germany 67328 1.83 72911 1.88 68801 1.46
11.Others Countries
1227875 33.45 1264298 32.67 1626489 34.51
Total import 3670702 100 3869349 100 4712495 100
Source: National Accounting Wing, BBS
45
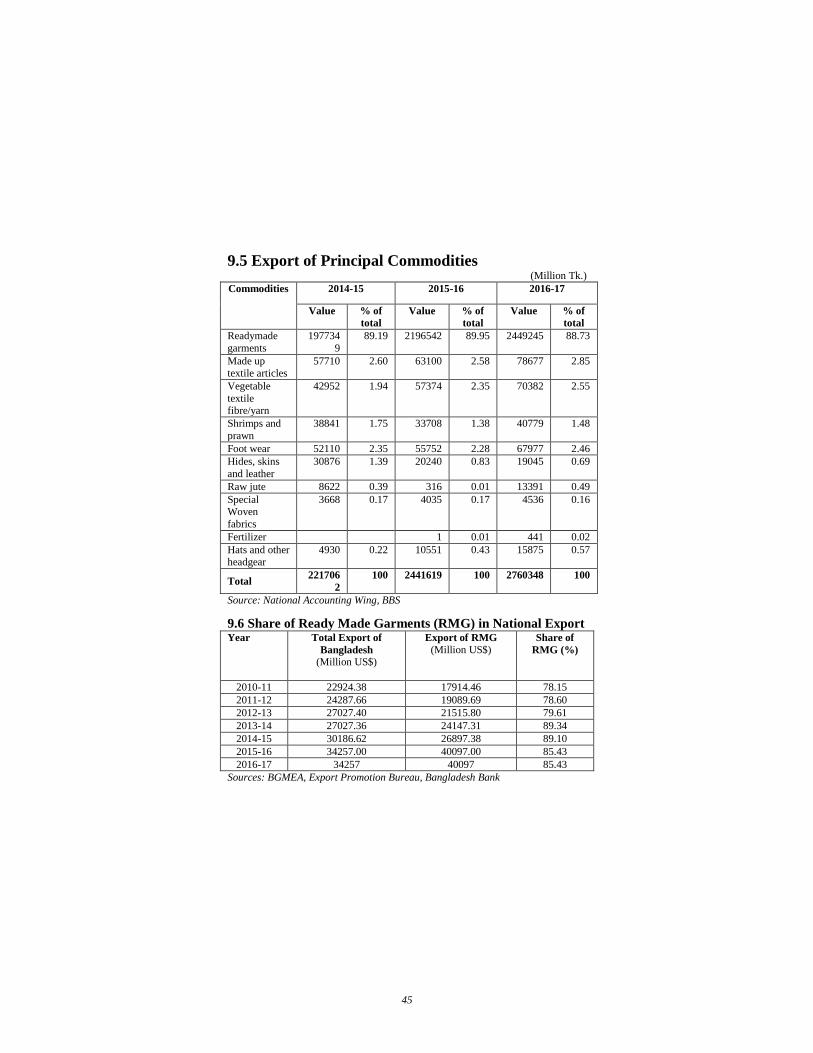
9.5 Export of Principal Commodities (Million Tk.)
Commodities 2014-15 2015-16 2016-17
Value % of
total
Value % of
total
Value % of
total
Readymade
garments
197734
9
89.19 2196542 89.95 2449245 88.73
Made up textile articles
57710 2.60 63100 2.58 78677 2.85
Vegetable
textile fibre/yarn
42952 1.94 57374 2.35 70382 2.55
Shrimps and
prawn
38841 1.75 33708 1.38 40779 1.48
Foot wear 52110 2.35 55752 2.28 67977 2.46
Hides, skins
and leather
30876 1.39 20240 0.83 19045 0.69
Raw jute 8622 0.39 316 0.01 13391 0.49
Special Woven
fabrics
3668 0.17 4035 0.17 4536 0.16
Fertilizer 1 0.01 441 0.02
Hats and other headgear
4930 0.22 10551 0.43 15875 0.57
Total 221706
2
100 2441619 100 2760348 100
Source: National Accounting Wing, BBS
9.6 Share of Ready Made Garments (RMG) in National Export Year Total Export of
Bangladesh
(Million US$)
Export of RMG
(Million US$) Share of
RMG (%)
2010-11 22924.38 17914.46 78.15
2011-12 24287.66 19089.69 78.60
2012-13 27027.40 21515.80 79.61
2013-14 27027.36 24147.31 89.34
2014-15 30186.62 26897.38 89.10
2015-16 34257.00 40097.00 85.43
2016-17 34257 40097 85.43
Sources: BGMEA, Export Promotion Bureau, Bangladesh Bank
46
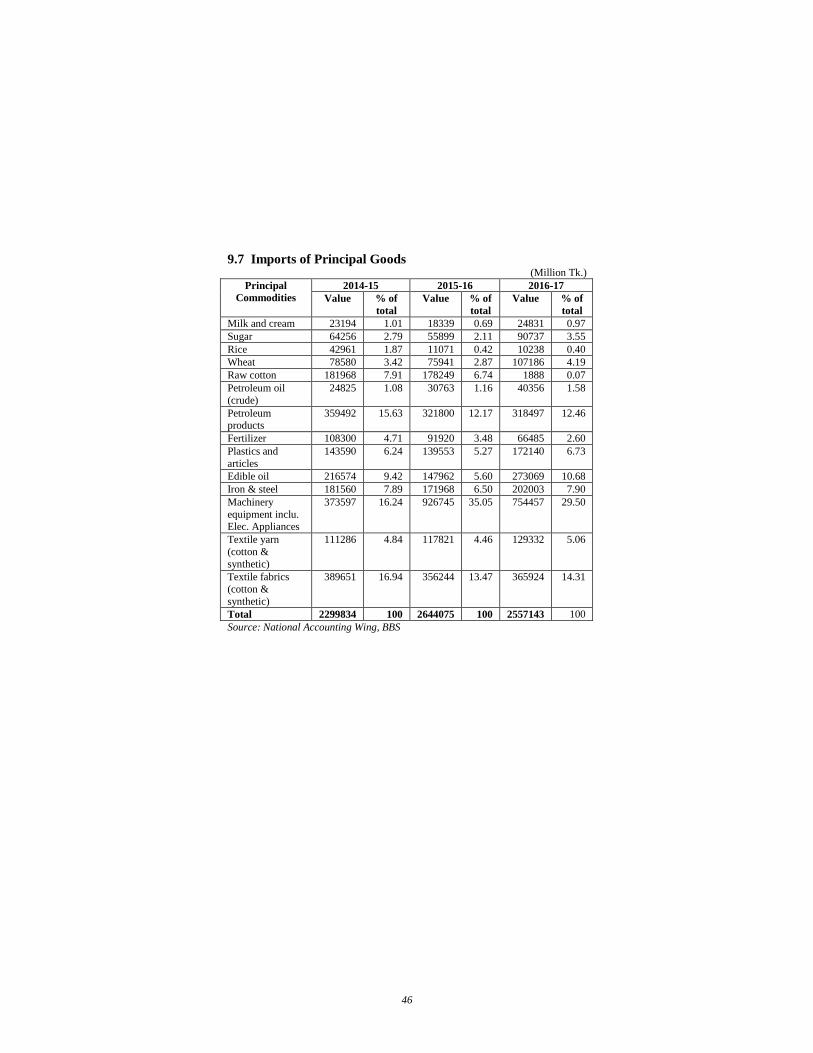
9.7 Imports of Principal Goods (Million Tk.)
Principal
Commodities
2014-15 2015-16 2016-17
Value % of
total
Value % of
total
Value % of
total
Milk and cream 23194 1.01 18339 0.69 24831 0.97
Sugar 64256 2.79 55899 2.11 90737 3.55
Rice 42961 1.87 11071 0.42 10238 0.40
Wheat 78580 3.42 75941 2.87 107186 4.19
Raw cotton 181968 7.91 178249 6.74 1888 0.07
Petroleum oil
(crude)
24825 1.08 30763 1.16 40356 1.58
Petroleum products
359492 15.63 321800 12.17 318497 12.46
Fertilizer 108300 4.71 91920 3.48 66485 2.60
Plastics and
articles
143590 6.24 139553 5.27 172140 6.73
Edible oil 216574 9.42 147962 5.60 273069 10.68
Iron & steel 181560 7.89 171968 6.50 202003 7.90
Machinery
equipment inclu. Elec. Appliances
373597 16.24 926745 35.05 754457 29.50
Textile yarn
(cotton &
synthetic)
111286 4.84 117821 4.46 129332 5.06
Textile fabrics
(cotton &
synthetic)
389651 16.94 356244 13.47 365924 14.31
Total 2299834 100 2644075 100 2557143 100
Source: National Accounting Wing, BBS
47
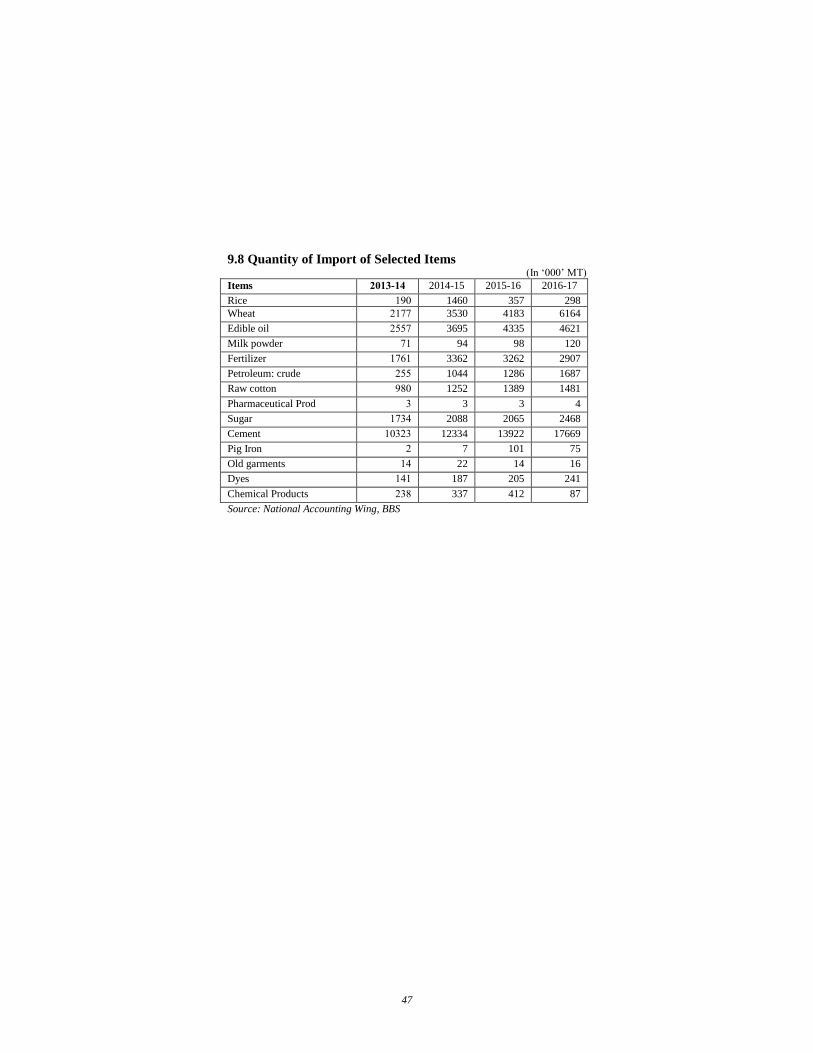
9.8 Quantity of Import of Selected Items (In ‘000’ MT)
Items 2013-14 2014-15 2015-16 2016-17
Rice 190 1460 357 298
Wheat 2177 3530 4183 6164
Edible oil 2557 3695 4335 4621
Milk powder 71 94 98 120
Fertilizer 1761 3362 3262 2907
Petroleum: crude 255 1044 1286 1687
Raw cotton 980 1252 1389 1481
Pharmaceutical Prod 3 3 3 4
Sugar 1734 2088 2065 2468
Cement 10323 12334 13922 17669
Pig Iron 2 7 101 75
Old garments 14 22 14 16
Dyes 141 187 205 241
Chemical Products 238 337 412 87
Source: National Accounting Wing, BBS
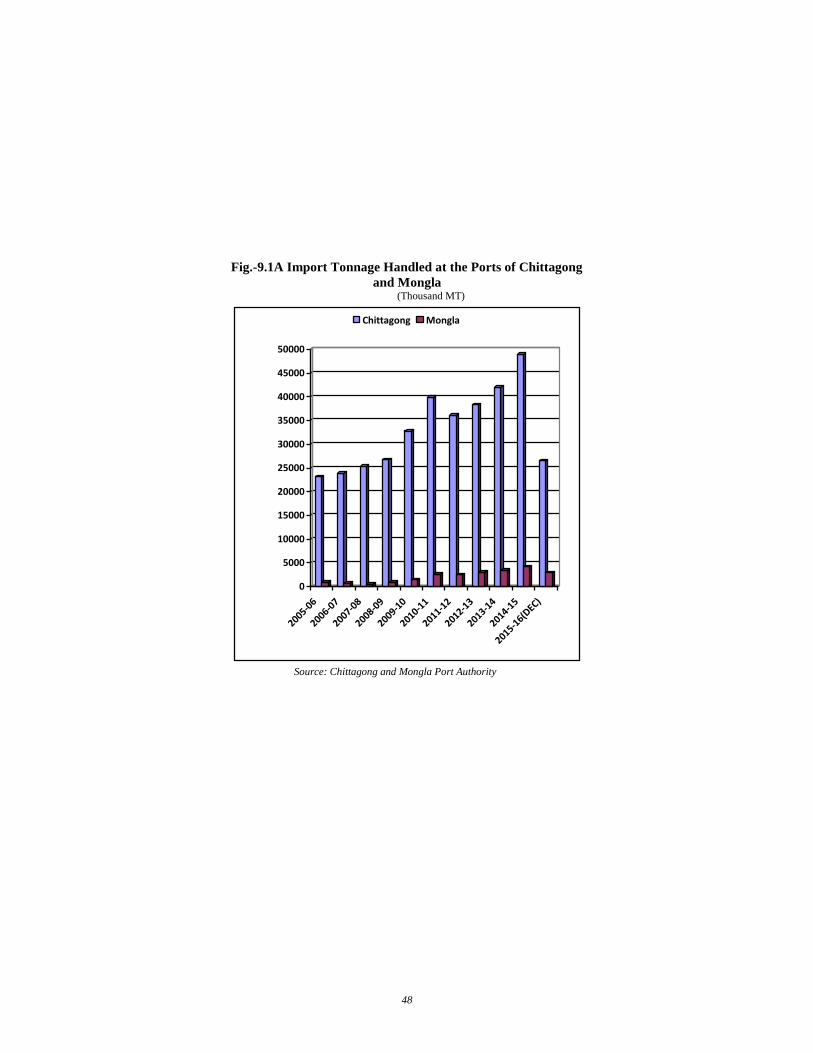
48
Fig.-9.1A Import Tonnage Handled at the Ports of Chittagong
and Mongla (Thousand MT)
0
5000
10000
15000
20000
25000
30000
35000
40000
45000
50000
2005-06
2006-07
2007-08
2008-09
2009-10
2010-11
2011-12
2012-13
2013-14
2014-15
2015-16(D
EC)
Chittagong Mongla
Source: Chittagong and Mongla Port Authority
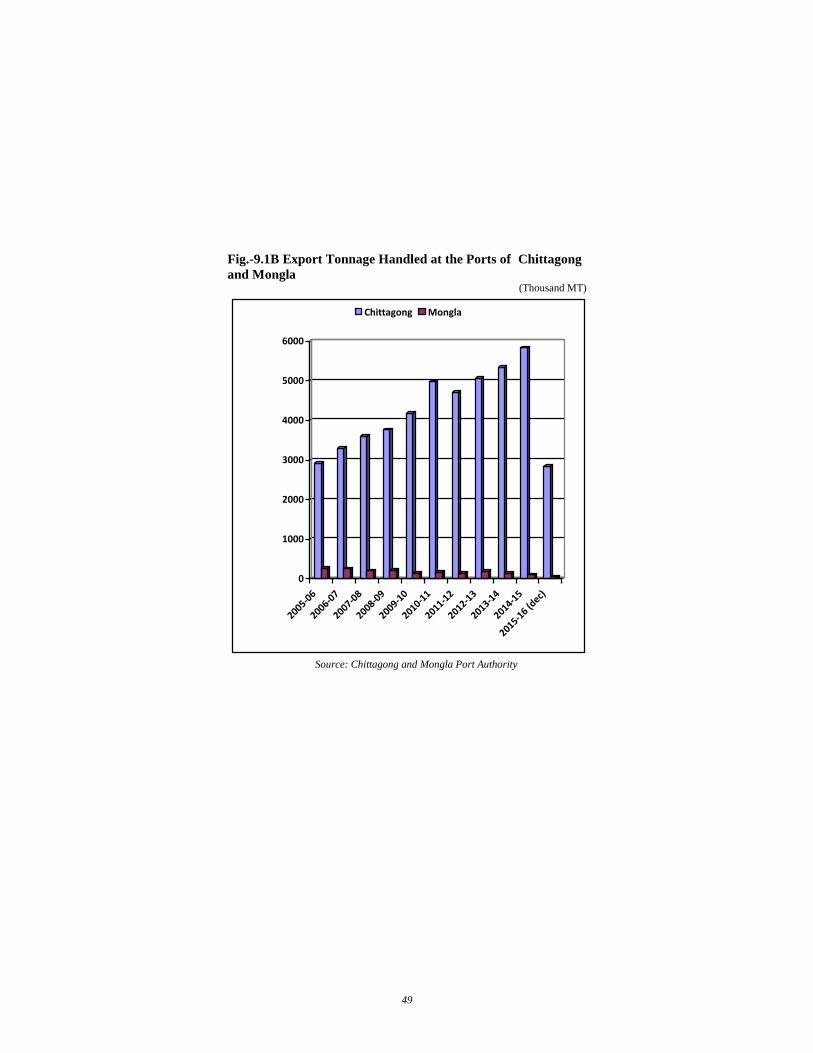
49
Fig.-9.1B Export Tonnage Handled at the Ports of Chittagong
and Mongla (Thousand MT)
0
1000
2000
3000
4000
5000
6000
2005-06
2006-07
2007-08
2008-09
2009-10
2010-11
2011-12
2012-13
2013-14
2014-15
2015-16 (d
ec)
Chittagong Mongla
Source: Chittagong and Mongla Port Authority
50
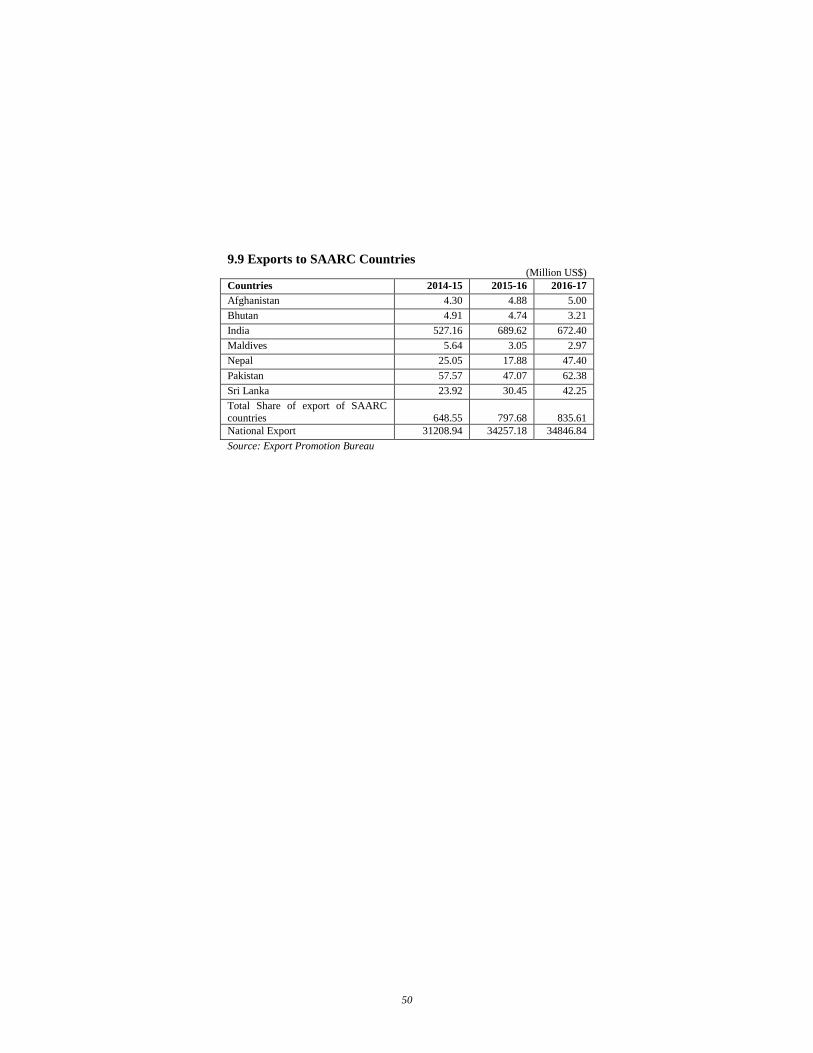
9.9 Exports to SAARC Countries (Million US$)
Countries 2014-15 2015-16 2016-17
Afghanistan 4.30 4.88 5.00
Bhutan 4.91 4.74 3.21
India 527.16 689.62 672.40
Maldives 5.64 3.05 2.97
Nepal 25.05 17.88 47.40
Pakistan 57.57 47.07 62.38
Sri Lanka 23.92 30.45 42.25
Total Share of export of SAARC
countries 648.55 797.68 835.61
National Export 31208.94 34257.18 34846.84
Source: Export Promotion Bureau
51
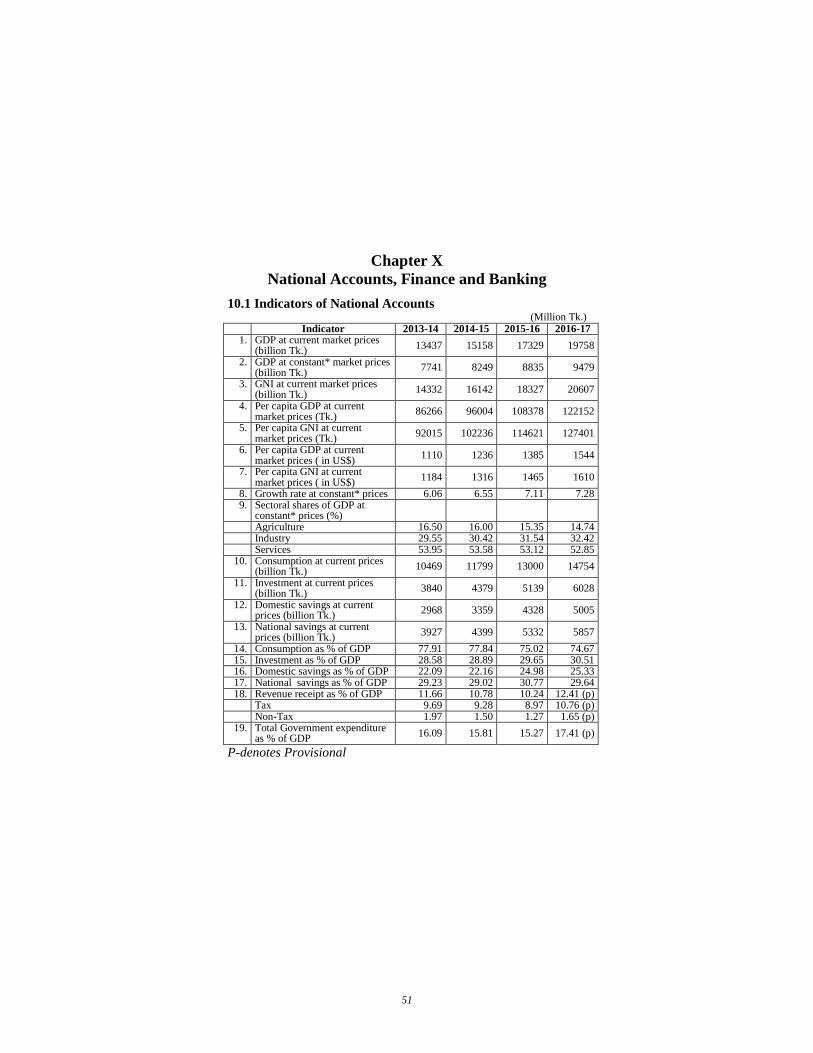
Chapter X
National Accounts, Finance and Banking
10.1 Indicators of National Accounts (Million Tk.)
Indicator 2013-14 2014-15 2015-16 2016-17 1. GDP at current market prices
(billion Tk.) 13437 15158 17329 19758
2. GDP at constant* market prices (billion Tk.)
7741 8249 8835 9479
3. GNI at current market prices (billion Tk.)
14332 16142 18327 20607
4. Per capita GDP at current market prices (Tk.)
86266 96004 108378 122152
5. Per capita GNI at current market prices (Tk.)
92015 102236 114621 127401
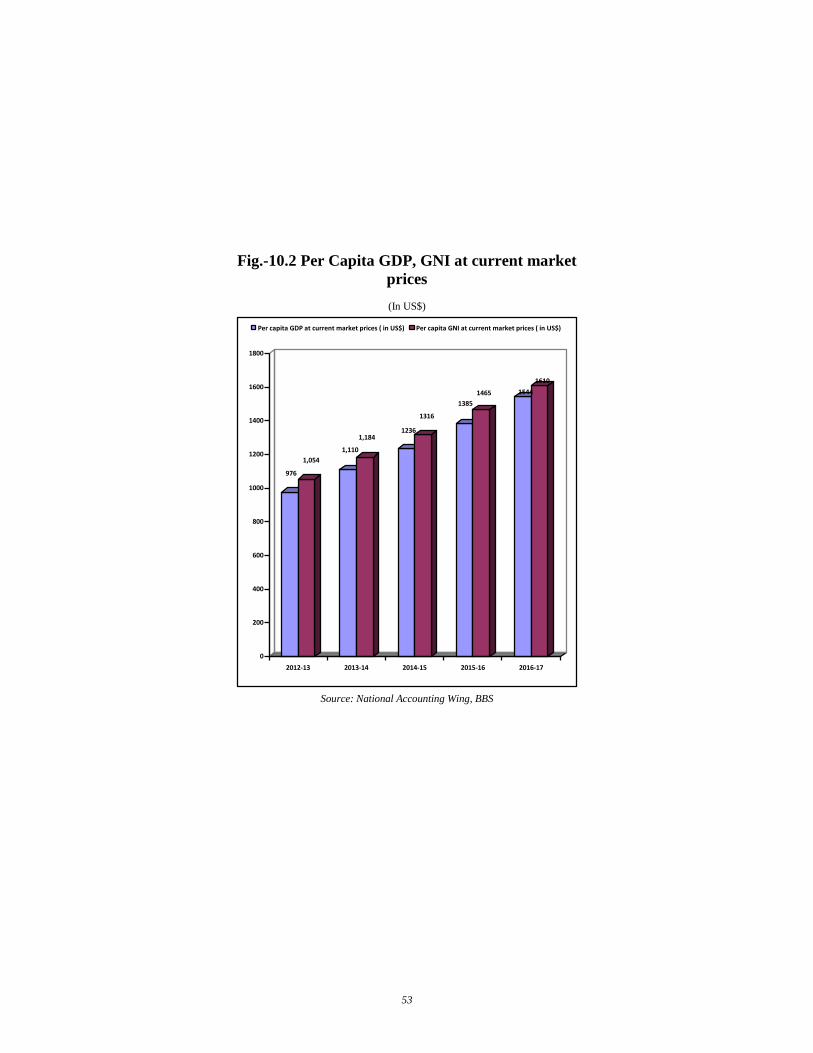
6. Per capita GDP at current market prices ( in US$)
1110 1236 1385 1544
7. Per capita GNI at current market prices ( in US$)
1184 1316 1465 1610
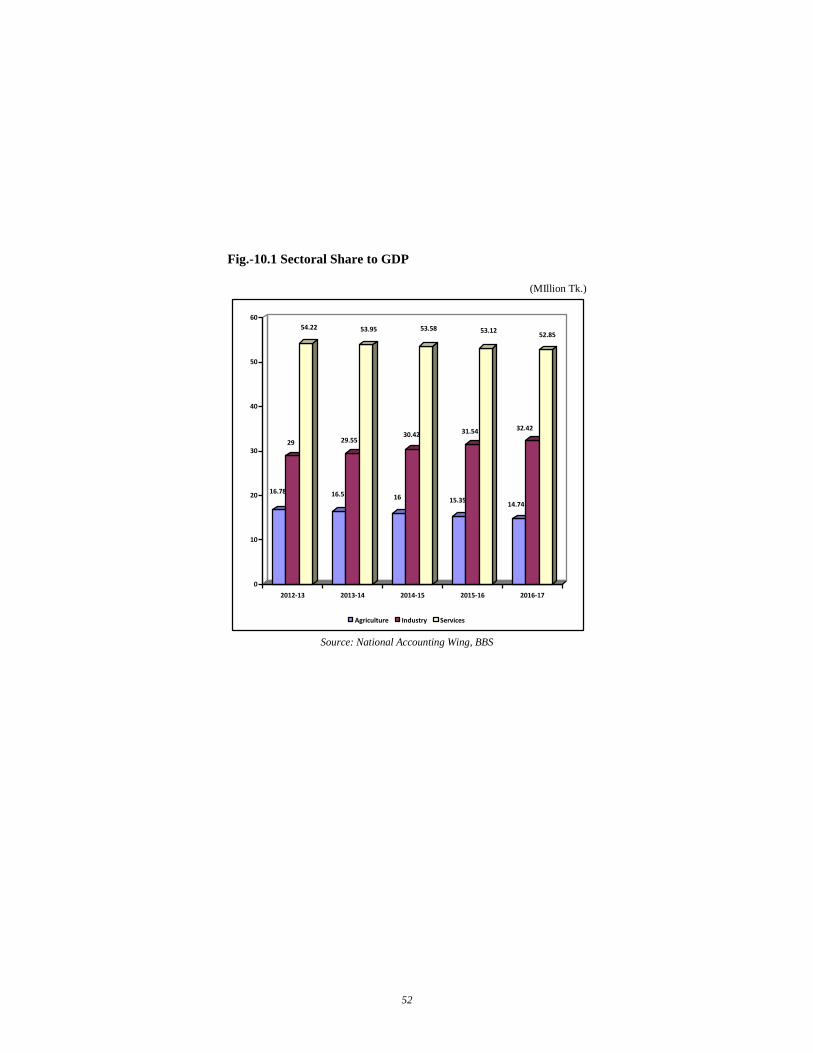
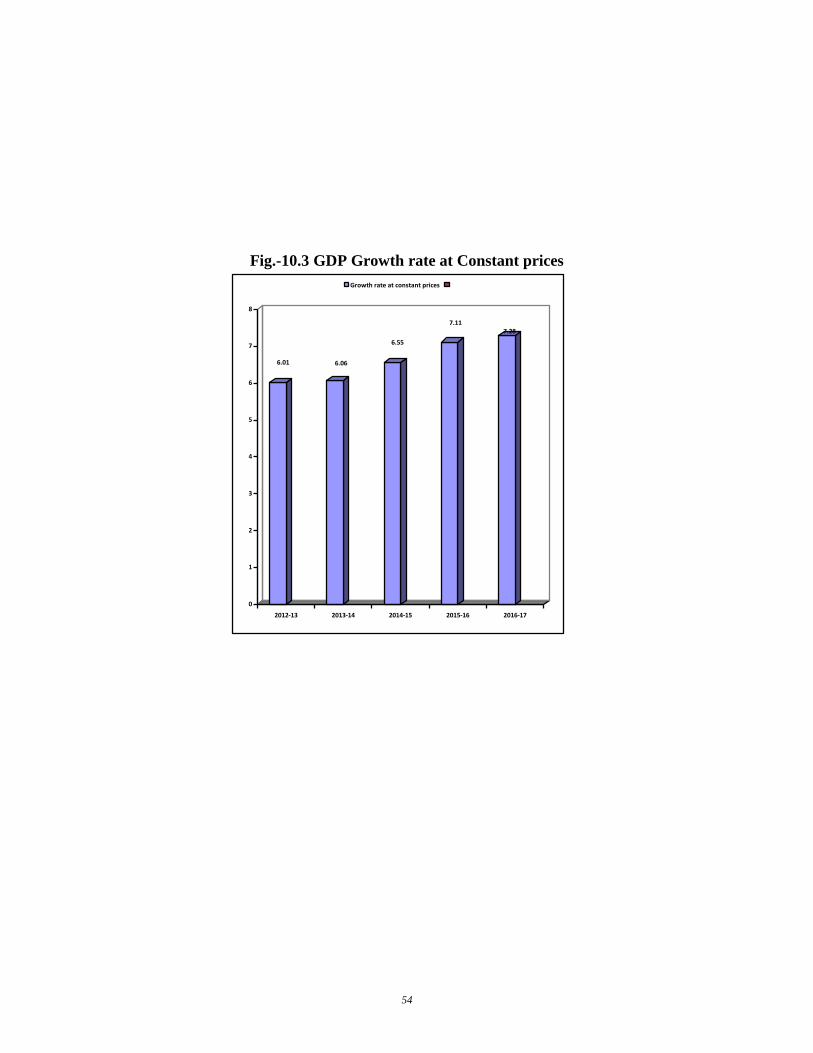
8. Growth rate at constant* prices 6.06 6.55 7.11 7.28 9. Sectoral shares of GDP at
constant* prices (%)
Agriculture 16.50 16.00 15.35 14.74 Industry 29.55 30.42 31.54 32.42 Services 53.95 53.58 53.12 52.85
10. Consumption at current prices (billion Tk.)
10469 11799 13000 14754
11. Investment at current prices (billion Tk.)
3840 4379 5139 6028
12. Domestic savings at current prices (billion Tk.)
2968 3359 4328 5005
13. National savings at current prices (billion Tk.)
3927 4399 5332 5857
14. Consumption as % of GDP 77.91 77.84 75.02 74.67 15. Investment as % of GDP 28.58 28.89 29.65 30.51 16. Domestic savings as % of GDP 22.09 22.16 24.98 25.33 17. National savings as % of GDP 29.23 29.02 30.77 29.64 18. Revenue receipt as % of GDP 11.66 10.78 10.24 12.41 (p)
Tax 9.69 9.28 8.97 10.76 (p) Non-Tax 1.97 1.50 1.27 1.65 (p)
19. Total Government expenditure as % of GDP
16.09 15.81 15.27 17.41 (p)
P-denotes Provisional
52
Fig.-10.1 Sectoral Share to GDP
(MIllion Tk.)
16.78
29
54.22
16.5
29.55
53.95
16
30.42
53.58
15.35
31.54
53.12
14.74
32.42
52.85
0
10
20
30
40
50
60
2012-13 2013-14 2014-15 2015-16 2016-17
Agriculture Industry Services
Source: National Accounting Wing, BBS
53
Fig.-10.2 Per Capita GDP, GNI at current market
prices
(In US$)
976
1,054
1,110
1,1841236
1316
1385
1465 1544
1610
0
200
400
600
800
1000
1200
1400
1600
1800
2012-13 2013-14 2014-15 2015-16 2016-17
Per capita GDP at current market prices ( in US$) Per capita GNI at current market prices ( in US$)
Source: National Accounting Wing, BBS
54
Fig.-10.3 GDP Growth rate at Constant prices
6.01 6.06
6.55
7.117.28
0
1
2
3
4
5
6
7
8
2012-13 2013-14 2014-15 2015-16 2016-17
Growth rate at constant prices
55
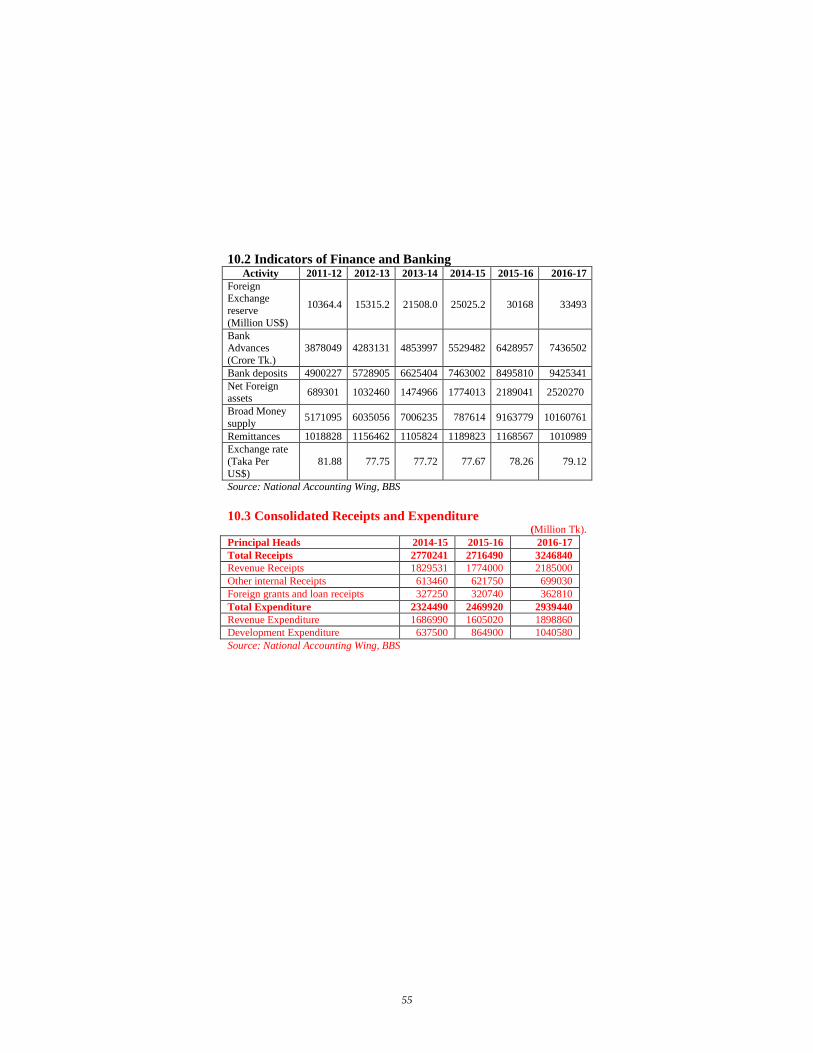
10.2 Indicators of Finance and Banking Activity 2011-12 2012-13 2013-14 2014-15 2015-16 2016-17
Foreign Exchange
reserve
(Million US$)
10364.4 15315.2 21508.0 25025.2 30168 33493
Bank
Advances
(Crore Tk.)
3878049 4283131 4853997 5529482 6428957 7436502
Bank deposits 4900227 5728905 6625404 7463002 8495810 9425341
Net Foreign assets
689301 1032460 1474966 1774013 2189041 2520270
Broad Money
supply 5171095 6035056 7006235 787614 9163779 10160761
Remittances 1018828 1156462 1105824 1189823 1168567 1010989
Exchange rate
(Taka Per
US$)
81.88 77.75 77.72 77.67 78.26 79.12
Source: National Accounting Wing, BBS
10.3 Consolidated Receipts and Expenditure (Million Tk).
Principal Heads 2014-15 2015-16 2016-17
Total Receipts 2770241 2716490 3246840
Revenue Receipts 1829531 1774000 2185000
Other internal Receipts 613460 621750 699030
Foreign grants and loan receipts 327250 320740 362810
Total Expenditure 2324490 2469920 2939440
Revenue Expenditure 1686990 1605020 1898860
Development Expenditure 637500 864900 1040580
Source: National Accounting Wing, BBS
56
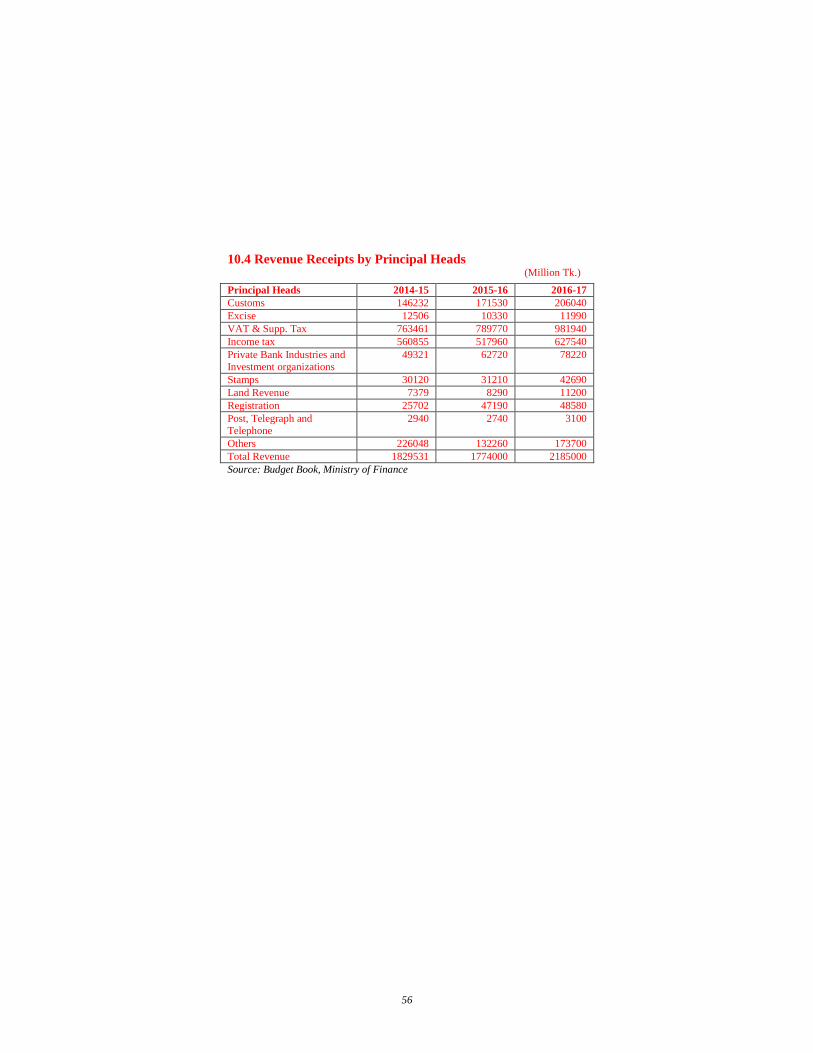
10.4 Revenue Receipts by Principal Heads (Million Tk.)
Principal Heads 2014-15 2015-16 2016-17
Customs 146232 171530 206040
Excise 12506 10330 11990
VAT & Supp. Tax 763461 789770 981940
Income tax 560855 517960 627540
Private Bank Industries and Investment organizations
49321 62720 78220
Stamps 30120 31210 42690
Land Revenue 7379 8290 11200
Registration 25702 47190 48580
Post, Telegraph and Telephone
2940 2740 3100
Others 226048 132260 173700
Total Revenue 1829531 1774000 2185000
Source: Budget Book, Ministry of Finance
57
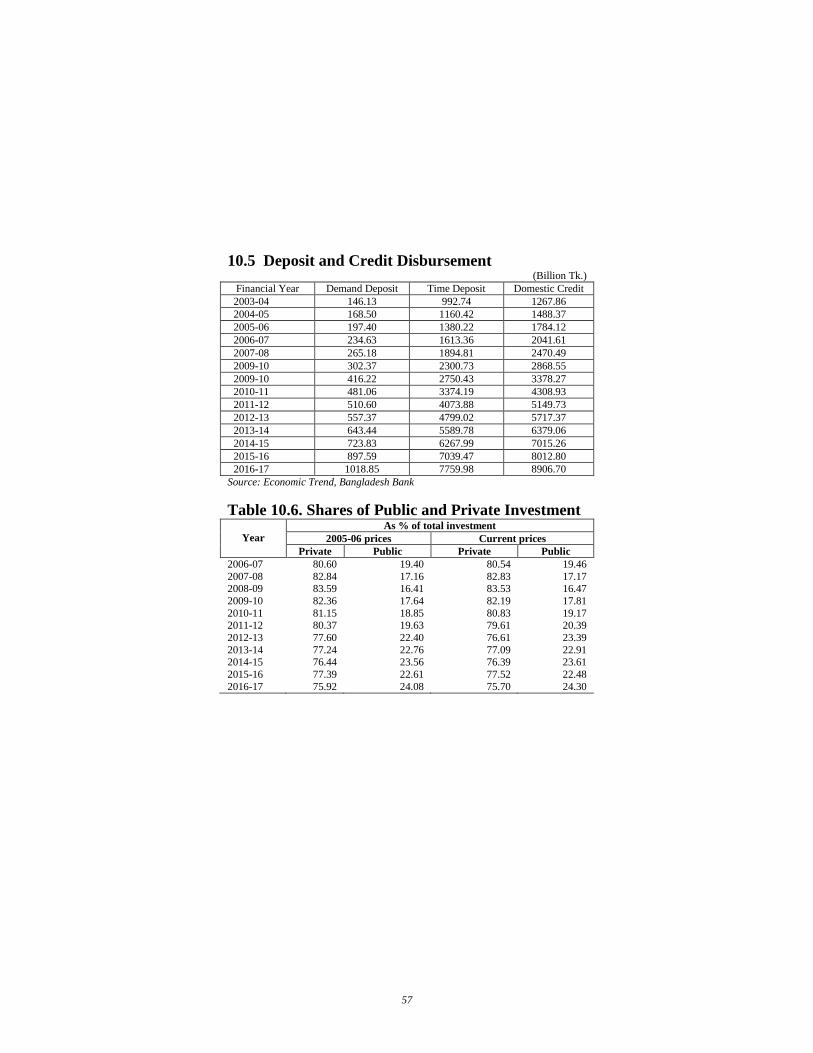
10.5 Deposit and Credit Disbursement (Billion Tk.)
Financial Year Demand Deposit Time Deposit Domestic Credit
2003-04 146.13 992.74 1267.86
2004-05 168.50 1160.42 1488.37
2005-06 197.40 1380.22 1784.12
2006-07 234.63 1613.36 2041.61
2007-08 265.18 1894.81 2470.49
2009-10 302.37 2300.73 2868.55
2009-10 416.22 2750.43 3378.27
2010-11 481.06 3374.19 4308.93
2011-12 510.60 4073.88 5149.73
2012-13 557.37 4799.02 5717.37
2013-14 643.44 5589.78 6379.06
2014-15 723.83 6267.99 7015.26
2015-16 897.59 7039.47 8012.80
2016-17 1018.85 7759.98 8906.70
Source: Economic Trend, Bangladesh Bank
Table 10.6. Shares of Public and Private Investment
Year
As % of total investment
2005-06 prices Current prices
Private Public Private Public
2006-07 80.60 19.40 80.54 19.46
2007-08 82.84 17.16 82.83 17.17 2008-09 83.59 16.41 83.53 16.47
2009-10 82.36 17.64 82.19 17.81
2010-11 81.15 18.85 80.83 19.17 2011-12 80.37 19.63 79.61 20.39
2012-13 77.60 22.40 76.61 23.39
2013-14 77.24 22.76 77.09 22.91 2014-15 76.44 23.56 76.39 23.61
2015-16 77.39 22.61 77.52 22.48
2016-17 75.92 24.08 75.70 24.30
58
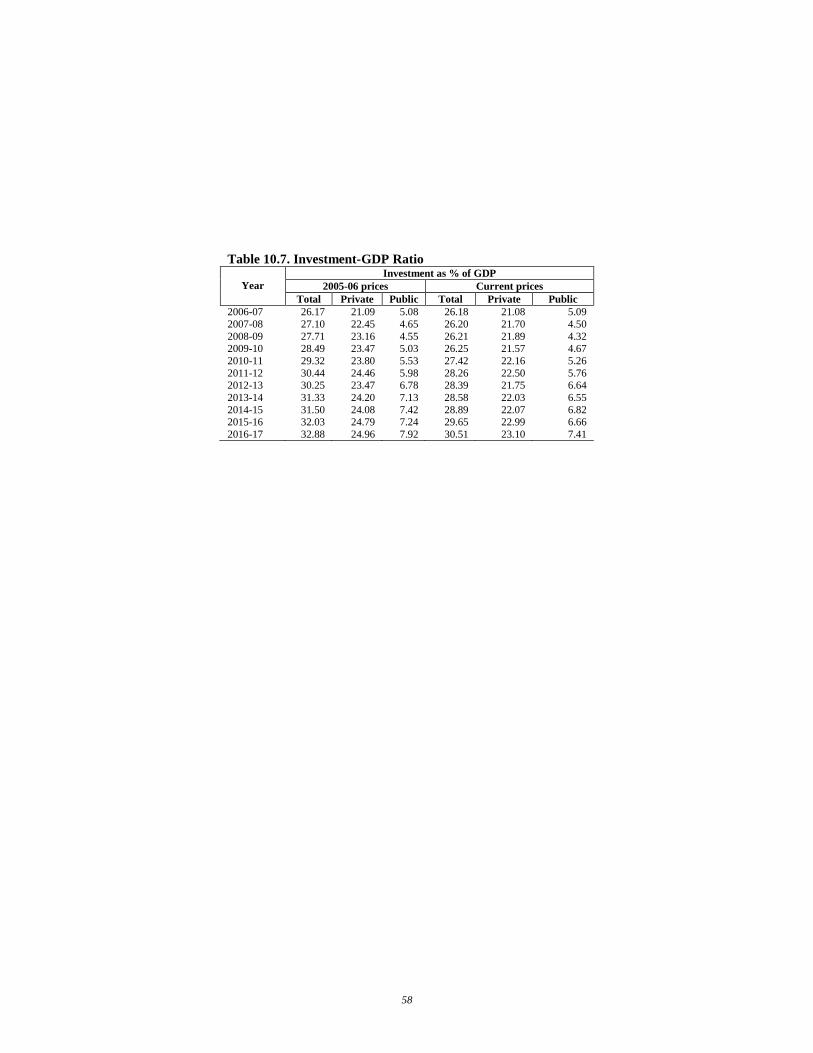
Table 10.7. Investment-GDP Ratio
Year
Investment as % of GDP
2005-06 prices Current prices
Total Private Public Total Private Public
2006-07 26.17 21.09 5.08 26.18 21.08 5.09
2007-08 27.10 22.45 4.65 26.20 21.70 4.50
2008-09 27.71 23.16 4.55 26.21 21.89 4.32
2009-10 28.49 23.47 5.03 26.25 21.57 4.67
2010-11 29.32 23.80 5.53 27.42 22.16 5.26
2011-12 30.44 24.46 5.98 28.26 22.50 5.76 2012-13 30.25 23.47 6.78 28.39 21.75 6.64
2013-14 31.33 24.20 7.13 28.58 22.03 6.55
2014-15 31.50 24.08 7.42 28.89 22.07 6.82 2015-16 32.03 24.79 7.24 29.65 22.99 6.66
2016-17 32.88 24.96 7.92 30.51 23.10 7.41
59
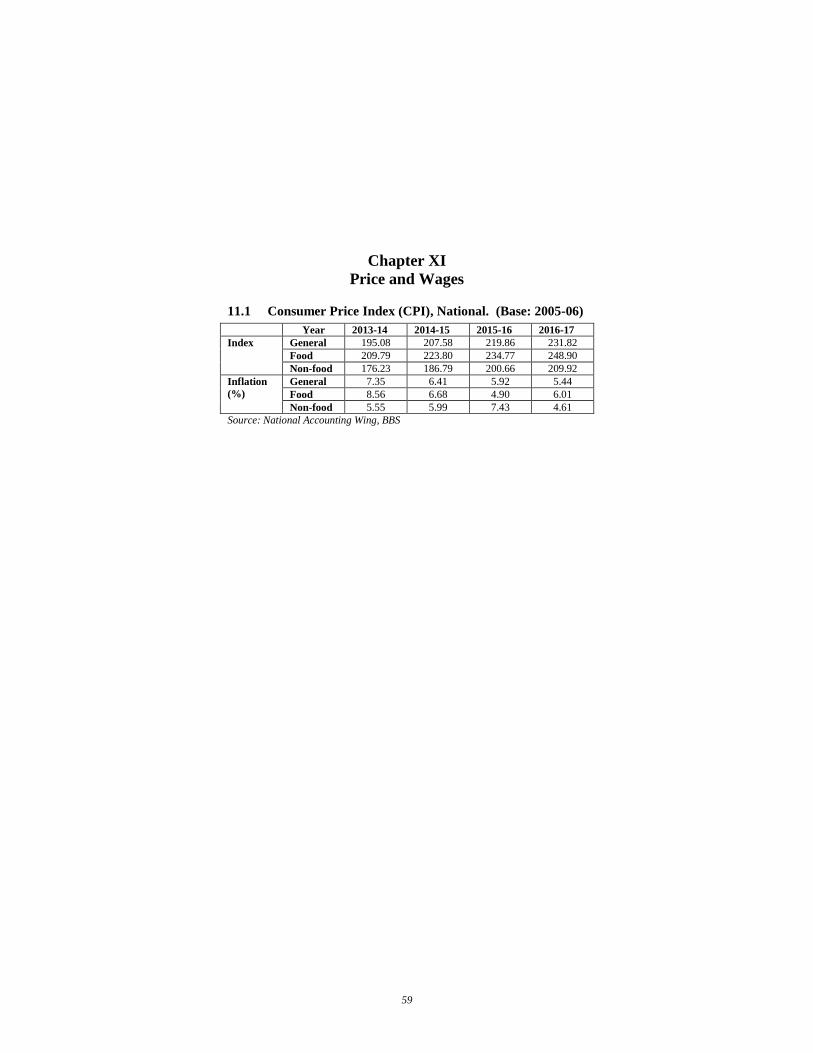
Chapter XI
Price and Wages
11.1 Consumer Price Index (CPI), National. (Base: 2005-06)
Year 2013-14 2014-15 2015-16 2016-17
Index
General 195.08 207.58 219.86 231.82
Food 209.79 223.80 234.77 248.90
Non-food 176.23 186.79 200.66 209.92
Inflation
(%)
General 7.35 6.41 5.92 5.44
Food 8.56 6.68 4.90 6.01
Non-food 5.55 5.99 7.43 4.61
Source: National Accounting Wing, BBS
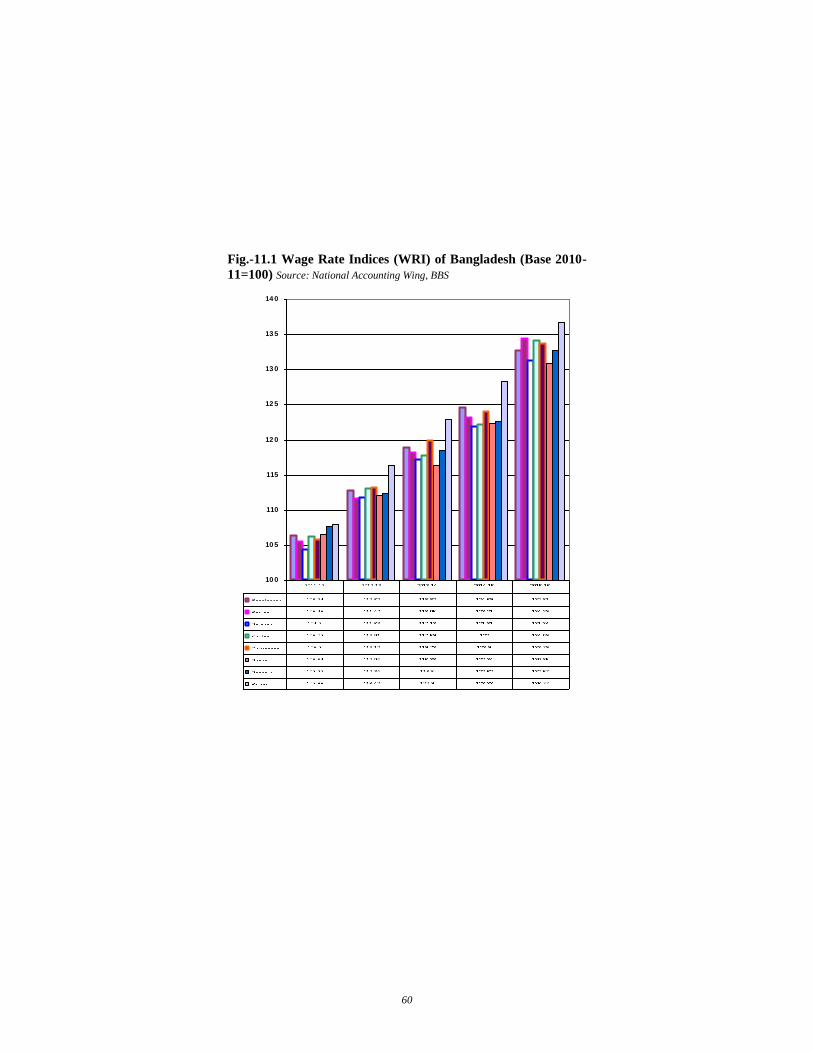
60
Fig.-11.1 Wage Rate Indices (WRI) of Bangladesh (Base 2010-
11=100) Source: National Accounting Wing, BBS
10 0
10 5
110
115
12 0
12 5
13 0
13 5
14 0
61
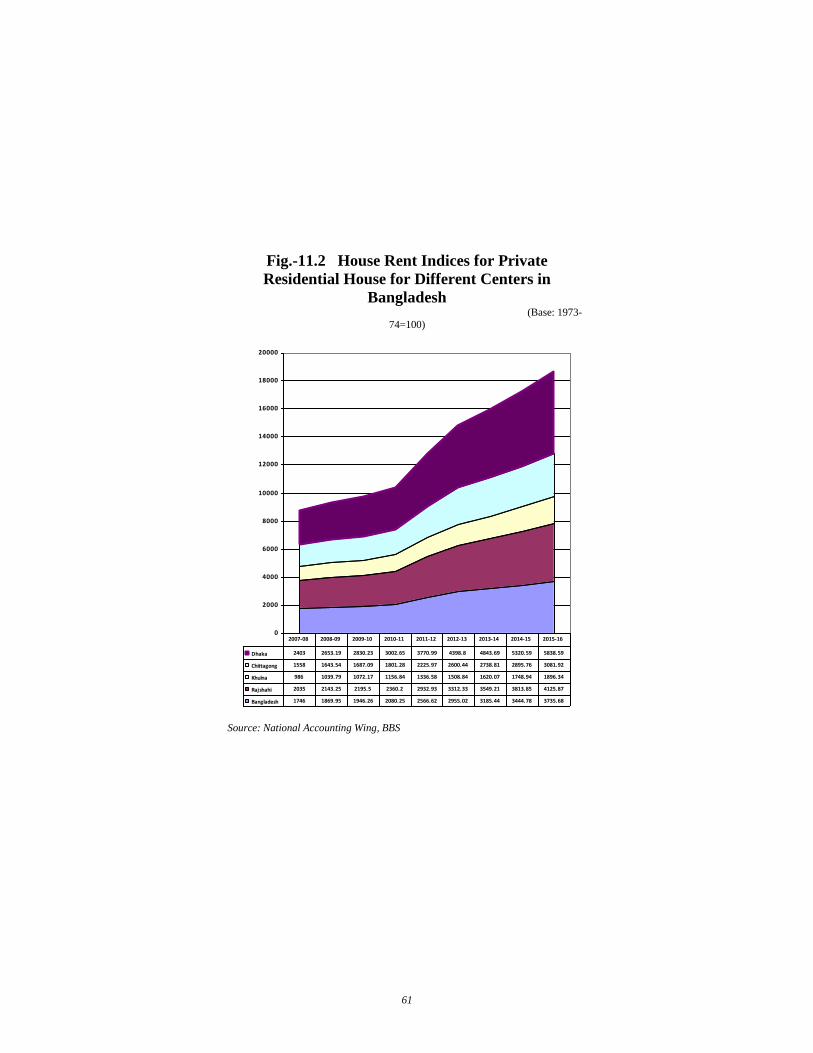
Fig.-11.2 House Rent Indices for Private
Residential House for Different Centers in
Bangladesh (Base: 1973-
74=100)
0
2000
4000
6000
8000
10000
12000
14000
16000
18000
20000
Dhaka 2403 2653.19 2830.23 3002.65 3770.99 4398.8 4843.69 5320.59 5838.59
Chittagong 1558 1643.54 1687.09 1801.28 2225.97 2600.44 2738.81 2895.76 3081.92
Khulna 986 1039.79 1072.17 1156.84 1336.58 1508.84 1620.07 1748.94 1896.34
Rajshahi 2035 2143.25 2195.5 2360.2 2932.93 3312.33 3549.21 3813.85 4125.87
Bangladesh 1746 1869.95 1946.26 2080.25 2566.62 2955.02 3185.44 3444.78 3735.68
2007-08 2008-09 2009-10 2010-11 2011-12 2012-13 2013-14 2014-15 2015-16
Source: National Accounting Wing, BBS
62
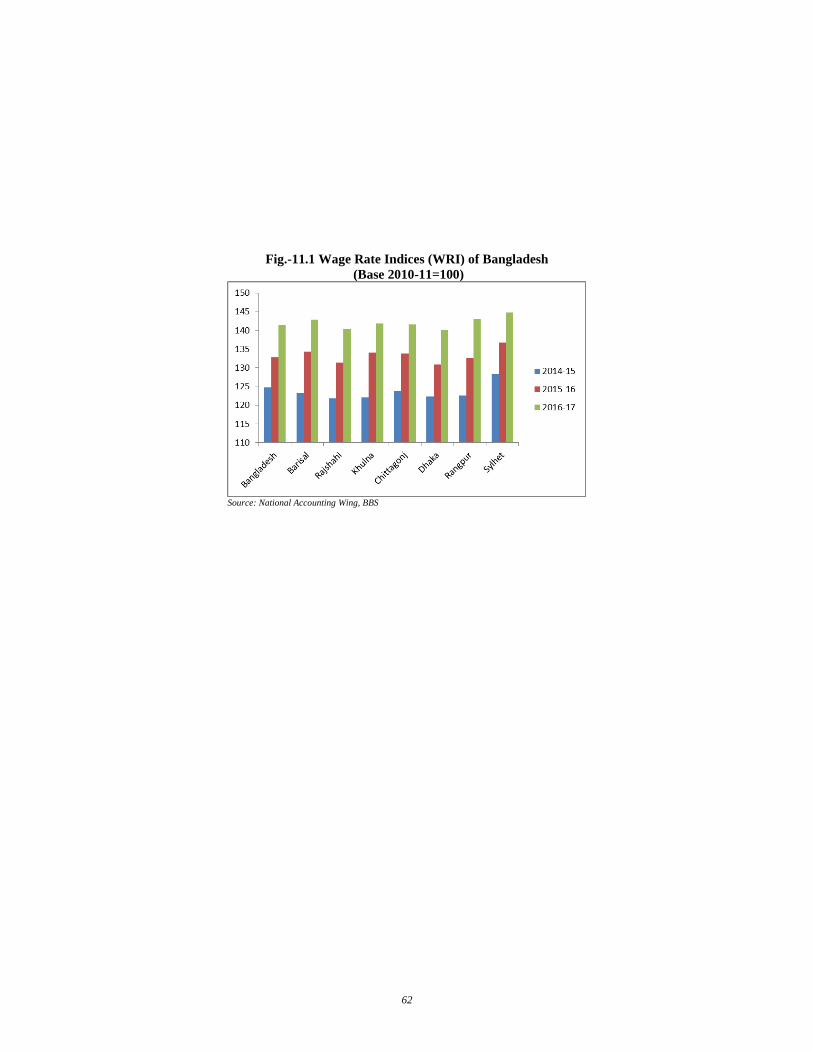
Fig.-11.1 Wage Rate Indices (WRI) of Bangladesh
(Base 2010-11=100)
Source: National Accounting Wing, BBS

63
Fig.-11.2 House Rent Indices for Private
Residential House for Different Centers in
Bangladesh (Base: 1973-74=100)
Source: National Accounting Wing, BBS

64
65
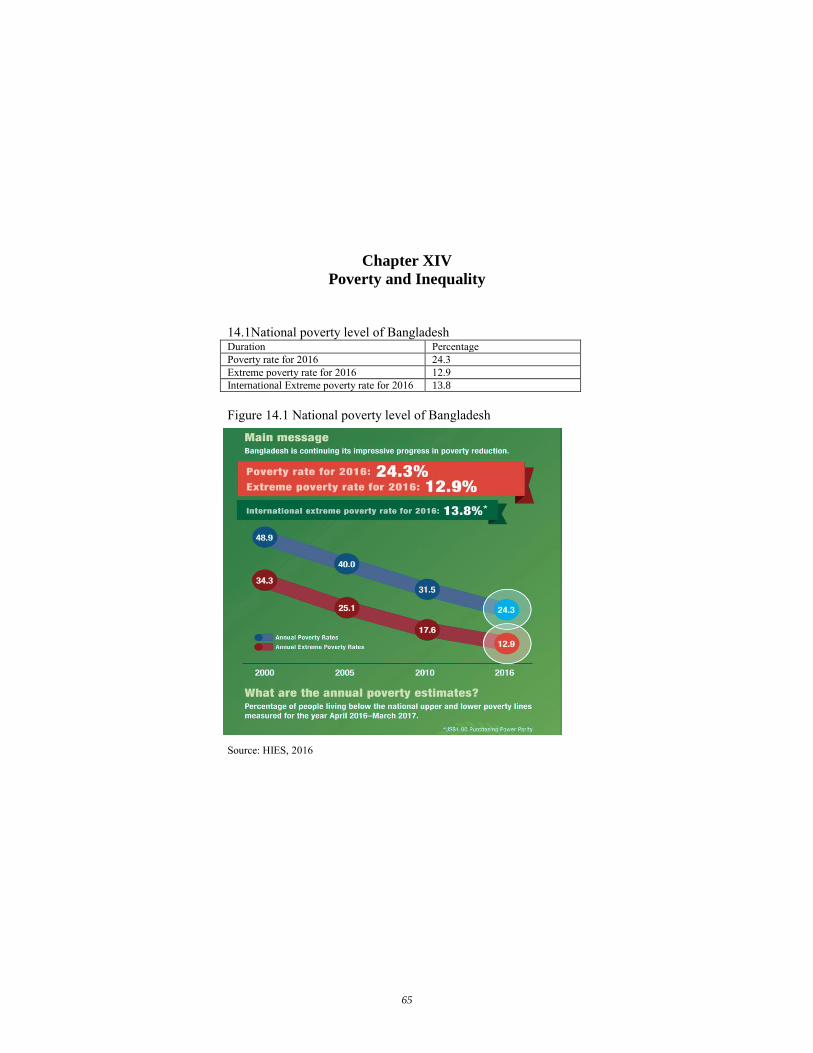
Chapter XIV
Poverty and Inequality
14.1National poverty level of Bangladesh Duration Percentage
Poverty rate for 2016 24.3
Extreme poverty rate for 2016 12.9
International Extreme poverty rate for 2016 13.8
Figure 14.1 National poverty level of Bangladesh
Source: HIES, 2016
66
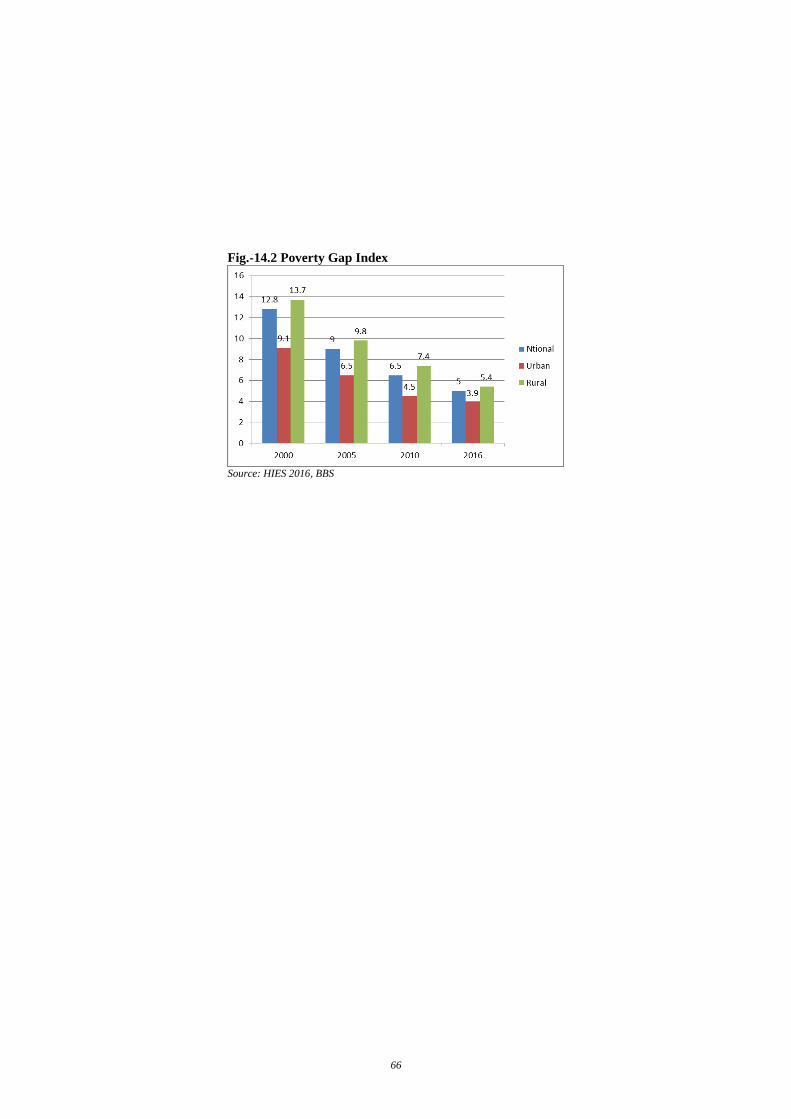
Fig.-14.2 Poverty Gap Index
Source: HIES 2016, BBS