Embed Size (px)
Citation preview
Bank bias in Europe: Effects on systemic risk and growth
Sam Langfield and Marco Pagano
European Central Bank (ESRB Secretariat) and Bank of England; Università di Napoli Federico II, CSEF, EIEF and CEPR
ABSTRACT
Europe’s financial structure has become strongly bank-based – far more so than in other economies. We document that an increase in the size of the banking system relative to equity and private bond markets is associated with more systemic risk and lower economic growth, particularly during housing market crises. We argue that these two phenomena arise owing to an amplification mechanism, by which banks overextend and misallocate credit when asset prices rise, and ration it when they drop. The paper concludes by discussing policy solutions to Europe’s “bank bias”, which include reducing regulatory favouritism towards banks, while simultaneously supporting the development of securities markets.
JEL Codes: G1, G2
Keywords: banks, financial structure, systemic risk, bank regulation
The authors are grateful for insightful comments from the Economic Policy Managing Editor in charge of this paper (Thorsten Beck); conference discussants (Franklin Allen, Florian Hett, Victoria Ivashina, Jan Pieter Krahnen and Wolf Wagner). In addition, helpful remarks and suggestions were provided by three anonymous referees; by Viral Acharya, Anat Admati, Giovanni Bassani, Niccolò Battistini, Jeroen Brinkhoff, Markus Brunnermeier, Gino Cenedese, Alex Cukierman, George de Menil, Giovanni Dell’Ariccia, Daniele Frison, Alfredo Gigliobianco, Sergei Guriev, Philipp Hartmann, Martin Hellwig, Ross Levine, Stan Maes, Francesco Mazzaferro, Eric Monnet, Alex Popov, Ariell Reshef, Tano Santos, André Sapir, Mark Schaffer, Oreste Tristani; and by participants at the 2015 AEA Meeting in Boston, the 11th FRBNY-NYU Stern Conference on Financial Intermediation, the ECB Conference on the “Optimal Size of the Financial Sector”, and seminars at the Bank of England, Bank of Portugal, CEPS, ECB, European Commission and the University of Mainz. Excellent research assistance was provided by Giuseppe Cascarino, Ondřej Klečka, Robert Maderitsch, Bahar Maghssudnia, Marco Scotto di Carlo and Alexia Ventula Veghazy. This paper draws its inspiration from a report entitled “Is Europe Overbanked?” published in June 2014 by the Advisory Scientific Committee of the European Systemic Risk Board and to which both authors contributed. Opinions and errors in this paper are the responsibility of the authors and not the institutions to which they are affiliated. Marco Pagano acknowledges financial support from the ERC (FINLAB project no. 295709).
BANK BIAS IN EUROPE
2
“Looking at our past experience, the absence of an alternative funding channel increased
overall economic risk – because the bank lending channel got clogged. Better to have a
plurality of channels financing the real economy than to rely on just one.”
ECB President Mario Draghi at the European Parliament on 17 November 2014
1. EUROPE’S BANKING SYSTEM IN PERSPECTIVE
Europe is home to the world’s largest banking system. The total assets of banks in the EU
amounted to €42tn (334% of EU GDP) in 2013. By contrast, Japanese banks’ assets added up
to €8tn (196% of Japan’s GDP), while US banks’ assets were worth €11tn (88% of US GDP).
Converting the US figure to international accounting standards would add €3.5tn,1 bringing
the US banking system to 115% of US GDP – still just over a third of the size of Europe’s
banking system.2
Europe’s banking system has not always been extraordinarily large, as Figures 1 and
2 reveal. From 1880 until the 1960s, bank assets to GDP fluctuated around 70% in both the
US and major western European countries. In the late 1980s, bank assets amounted to about
180% of GDP in Japan and major western European countries. Only since 1990 has Europe’s
banking system grown so much larger than its international peers.3
Insert Figure 1 here
Insert Figure 2 here
Why have Europe’s banks grown so much? One possible explanation could be the
contemporaneous rise in the wealth of European households, documented by Piketty and
Zucman (2014).4 Banks, and financial firms more generally, provide wealth preservation
services to households. Gennaioli, Shleifer and Vishny (2014) build a Solow-style growth
model which captures this wealth preservation activity, and predicts that the size of financial
intermediaries should grow in proportion to household wealth, rather than GDP.
However, the rise in European banks’ assets has far outpaced the rise in private
wealth, as shown in Figure 3. Between 1880 and 1950, the ratio of total bank assets to private
wealth fluctuated around 17% in Germany, the UK and the US. After 1950, the ratio in
Germany and the UK trended upwards, accelerating in the early 1990s, and reaching
1 This €3.5tn adjusts for the underestimation of on-balance-sheet derivative positions by US local GAAP accounting standards compared to IFRS. To estimate this uplift, we extend Hoenig’s (2013) calculations on G-SIB US banks to all major US banks with substantial derivatives books. This entails adding a GAAP-bank’s off-balance-sheet derivative exposures to its reported total assets. Hereafter, all data and regression estimations shown in this paper use IFRS-equivalent estimations of US banks’ total assets. 2 Furthermore, including the assets of Fannie Mae and Freddie Mac would add €4tn (31% of US GDP). 3 A similar pattern is obtained if the size of the banking system is measured by the ratio of bank loans (instead of bank assets) to GDP: according to data collected by Schularick and Taylor (2012), the ratio of European bank loans to GDP has become about 2.5 times its 1980 level, while in Figure 1 the ratio of European bank assets to GDP is 2.9 times its 1980 level. Additional evidence on the size of Europe’s banking system is presented in Pagano et al (2014). 4 Between 1980 and 2010, private wealth to GDP rose from 230% to 354% in Germany, 261% to 461% in the UK, and 302% and 351% in the US.
BANK BIAS IN EUROPE
3
approximately 100% by 2011. Meanwhile, the US series remained flat at around 17%. The
growth in household wealth therefore provides a reasonable explanation for the size of the US
banking system, but it cannot account for the growth in bank assets in Germany and the UK.
Insert Figure 3 here
This enormous expansion of banking has rendered European countries’ financial
structures strongly bank-based. We characterise financial structure by the ratio of bank assets
to the capitalisation of stock and private bond markets, and for brevity we refer to this measure
as a country’s bank-market ratio. This ratio was in decline in Germany and the UK in the late
1980s and early 1990s, but began to grow sharply from the mid-1990s, as Figure 4 shows.
These trends are true also of the rest of Europe, as Figure 5 reveals. The reason for these trends
is the burgeoning size of the banking system – coupled with a stock market that has fluctuated
but not increased in value, and a private bond market which has barely grown. In contrast with
these European trends, the US bank-market ratio has remained flat since 1995. Figure 6 shows
that Europe’s financial structure in 2011 was much more bank-based in comparison not only
with the US, but also with other developed economies such as Japan, Canada and Australia.
Even developing economies such as Brazil and India are less bank-based than any European
country except Sweden.
Insert Figure 4 here
Insert Figure 5 here
Insert Figure 6 here
Given the tight connection between financial systems and macroeconomic
performance, it is natural to question whether Europe’s increasing dependence on banks has
affected the stability and growth of its economy. We explore this issue by asking two related
questions. First, is a more bank-based financial structure associated with greater systemic
risk? Second, is it associated with worse economic growth performance, in the sense of a
growth rate that is both lower on average and more sensitive to large drops in asset prices? In
Section 2, we explain the rationale for these potential effects, based on theories of bank
behaviour over the financial cycle. Section 3 then formulates two hypotheses based on these
theories. Sections 4 and 5 present and discuss empirical evidence regarding these two
hypotheses, and quantify the extent to which Europe’s bank-based structure has contributed
to systemic risk and affected economic growth.
As we shall see, Europe’s bank-based financial structure has sizeable adverse
economic implications: in this sense, it is warranted to label Europe’s financial structure as
exhibiting a “bank bias”. In Section 6, we argue that this bias largely reflects political factors
and policy choices. Different political attitudes and more enlightened policymaking could
therefore reduce Europe’s bank bias. Section 7 discusses policies which would encourage, in
BANK BIAS IN EUROPE
4
the words of ECB President Mario Draghi, “a plurality of channels financing the real
economy”.
2. BANK-BASED VS MARKET-BASED FINANCE: AN UNSETTLED DEBATE
The finance literature has long debated the relative merits of bank-based and market-based
financing, seeking to establish whether and why either one of the two financial structures may
be regarded as superior in terms of its effects on economic growth and on the allocation of
risk (Allen and Gale, 2000). Reviewing this debate is useful, because it provides a conceptual
backdrop and motivation for our subsequent empirical analysis.
A bank-based structure can contribute to economic growth by improving access to
finance. Banks are specialists at mitigating asymmetric information problems between lenders
and borrowers (Boot, 2000). As a result, banks diminish adverse selection through the ex-ante
screening of borrowers, and reduce moral hazard by monitoring firms’ ex post investment
decisions. Small firms, which typically have no access to securities markets owing to their
modest size, are among the biggest beneficiaries of banks’ information-processing role.
Security market participants do not have the same incentive to engage in these costly
information-based activities, since free-riding by other market participants would largely
prevent them from appropriating the benefits of screening and monitoring. Banks’ mitigation
of asymmetric information problems is particularly important for firms that do not have an
established track record as creditworthy borrowers. In contrast, firms that have such a record
can more easily access securities markets and obtain direct funding from investors (Diamond,
1991).
However, the superiority of banks in acquiring information about their borrowers is
a mixed blessing: banks’ informational advantage may induce them to appropriate a sizeable
share of their borrowers’ profits, thus thwarting borrowers’ incentives to perform. This hold-
up problem is analysed by Rajan (1992), who shows that it can be mitigated if a borrower also
has some access to market-based funding, which provides external competition and thus
reduces banks’ bargaining power vis-à-vis their borrowers. Unfortunately, many firms,
especially small and medium enterprises (SMEs), have no access to market-based funding,
and therefore remain vulnerable to the hold-up problem.
Moreover, it is not clear that banks are superior to securities markets in their ability
to mitigate borrowers’ moral hazard. Stiglitz and Weiss (1983), among others, have argued
that banks can discipline borrowers by punishing defaults with the refusal of further credit.
However, even though the threat of such punishment may be optimal ex ante, the threat is not
credible. Once default occurs, the lender’s costs are sunk; if the borrower has another project
with positive net present value, the bank will want to provide finance. Hence, the bank will
renege on its ex ante threat to punish defaulters by continuing to extend credit – a practice
known as “ever-greening” or forbearance. By contrast, securities markets tend to be more
credible: defaulting borrowers typically find it difficult to restructure their bonds and obtain
further funding. The transaction costs of renegotiating with many bondholders, rather than a
BANK BIAS IN EUROPE
5
single bank, tend to be large. Moreover, each bondholder has the incentive to “hold out” while
allowing other bondholders to renegotiate – hence all bondholders hold out, and no
renegotiation occurs (Dewatripont and Maskin, 1995).
Banks and markets also have comparative advantages in funding different types of
projects. Owing to the bilateral nature of their relationships with borrowers, banks are better
than markets at protecting confidential information regarding their clients’ business plans –
such as new products or technical breakthroughs – which can be very valuable in protecting
their clients’ competitive advantages (Yosha, 1995). On the other hand, securities markets
tend to be better financiers of innovation when there is a wide diversity of prior beliefs about
the expected value of new projects: optimistic investors can finance these projects, while
pessimistic investors can remain uninvested (Allen and Gale, 1999). Historically,
transformational technological innovations have tended to occur in countries with market-
based financial structures (Allen, 1993), also because these structures tend to foster venture
capital firms (Black and Gilson, 1998).
Hence, the theoretical literature has not established a clear-cut prediction regarding
the superiority of bank-based or market-based finance in promoting the efficient allocation of
funding, and thus on economic performance. In light of this, it may not be surprising that
Levine (2002) finds no relationship between financial structure and economic growth in
World Bank data covering the period between 1980 and 1995.5 After carrying out many
robustness checks, Levine concludes that:
“the results are overwhelming. There is no cross-country empirical support for either the
market-based or the bank-based views. Neither bank-based nor market-based financial
systems are particularly effective at promoting growth” (p. 403).
However, recent evidence suggests that these conclusions might not hold when the data are
extended to include the past two decades (Gambacorta, Yang and Tsatsaronis, 2014; Pagano
et al, 2014; Levine, Lin and Xie, 2015). One of the contributions of this paper is to extend this
emerging literature by estimating the within-country effect of financial structure on economic
growth, and by controlling for the endogeneity of financial structure, by instrumenting it with
past reforms of financial regulation.
The effect of financial structure on economic growth is not the only dimension along
which one can assess the relative merits of bank-based and market-based finance. Another
key dimension is the extent to which banks and markets enable efficient risk-sharing and
enhance the resilience of the economy to macroeconomic shocks. In this respect, banks’
comparative advantage lies in their ability to collect private information about their borrowers
through repeated interaction. Insofar as this information enables banks to identify solvent
borrowers facing a temporary liquidity shortfall, banks can help these borrowers to overcome
idiosyncratic liquidity shocks. Insuring firms against liquidity shocks is regarded as the
quintessential feature of “relationship banking”, whereby a firm borrows mainly or
5 Levine (2002) measures financial structure by the ratio of either domestic stock trading or stock market capitalization to the credit extended by banks to the private sector.
BANK BIAS IN EUROPE
6
exclusively from a single bank over a long period of time. Evidence suggests that firms with
close relationships with banks pay lower interest rates and are less likely to pledge collateral
(Berger and Udell, 1995). The informational superiority of relationship banking may also
increase the resilience of the economy during crises, according to the model in Bolton,
Freixas, Gambacorta and Mistrulli (2013), who also present evidence that Italian relationship
banks continued lending to solvent firms following the bankruptcy of Lehman Brothers.
Similar evidence is presented in Sette and Gobbi (2015). In the same vein, Beck, Degryse, De
Haas and van Horen (2014) show – using data from 21 countries in central and eastern Europe
– that relationship lending alleviated firms’ credit constraints during the cyclical downturn of
2008-09, but not during the boom period of 2005.
However, in most countries relationship banks account for a modest portion of total
bank lending. In a sample of 1,079 firms in 22 European countries, only 14.5% of firms had
borrowed from a single bank and another 18.8% had borrowed from two banks (Ongena and
Smith, 2000). Hence, the stabilizing role of relationship banking does not dominate the
aggregate behaviour of bank lending. On the contrary, at the macroeconomic level, bank
lending is more volatile and pro-cyclical than bond financing, especially during financial
crises. As Figure 7 shows, bank loans to euro area firms dropped substantially between 2009
and 2011, but expanded much more in the early 2000s. Moreover, Figure 7 shows that the two
types of financing are partial substitutes: in both the subprime crisis and the euro area debt
crisis, bank loans to euro area firms dropped, while their debt security financing expanded,
relative to GDP. Firms with access to debt security markets were able to respond to the
contraction in bank loan supply by issuing more debt securities. A similar picture emerges
from US flow of funds data: the bank loan series is strongly pro-cyclical, while bond financing
is more stable and less affected by recessions, and even rose over the recent financial crisis.6
Insert Figure 7 here
This greater cyclicality of bank lending compared to bond financing may stem from
banks’ high leverage. When asset prices rise, the increase in the value of collateral and of firm
equity allows banks to expand credit, which in turn feeds back into asset prices, prompting
further credit expansion – as shown by Bernanke and Gertler (1989), Kiyotaki and Moore
(1997) and Bernanke, Gertler and Gilchrist (1999). The highly leveraged nature of banks
amplifies the operation of this mechanism: when asset prices increase, banks’ own equity
value increases, so that loans can be expanded by a multiple of the gains on banks’ equity,
even while keeping their leverage ratio unchanged. By the same token, an asset price drop
forces banks to deleverage, driven both by market and regulatory pressures.7 This aggregate
6 There is consistent evidence of the substitution between loans and bond financing in recessions. Adrian, Colla and Shin (2012) document that, although US bank lending to firms declined during the 2007-09 crisis, bond financing increased to make up much of its drop. Becker and Ivashina (2014) document substitution from bank loans to debt securities during times of tight monetary policy, tight lending standards, high levels of non-performing loans, and low bank equity prices. Finally, Grjebine, Szczerbowicz and Tripier (2014), using a quarterly panel of 25 countries over the period 1989-2013, find that “the substitution of loans for bonds is a regular property of business cycles”. 7 The pro-cyclical behaviour of bank lending may at least partly be attributed to regulatory requirements. For instance, Adrian, Colla and Shin (2012) argue that banks’ credit supply decreases during a recession because they are forced to reduce their exposure to rising default risk in order to satisfy a Value-at-Risk constraint.
BANK BIAS IN EUROPE
7
deleveraging process induces a recessionary impulse, which exacerbates the initial asset price
decline, prompting further deleveraging. Hence, banks’ high leverage creates a mechanism
that amplifies the impact of asset price shocks on lending and economic activity. Owing to
the non-linearity of this amplification mechanism, relatively small negative shocks can lead
to banking crises and persistent recessions (Brunnermeier and Sannikov, 2012; He and
Krishnamurti, 2012; Boissay, Colliard and Smets, 2014). As a result, one would expect
economic activity to be more sensitive to asset price fluctuations in bank-based structures than
in market-based structures, owing to a greater build-up of risks during asset price booms and
more pronounced deleveraging once asset prices drop substantially.
3. HYPOTHESES TO BE TESTED
The build-up of risk before financial crises and the sensitivity of economic activity to financial
shocks is therefore expected to be larger in bank-based than in market-based structures. This
central idea underlies two hypotheses.
The first hypothesis concerns the relationship between financial structure and banks’
risk taking. When asset prices rise, banks’ rapid credit expansion occurs at the expense of
credit quality. As aggregate credit creation increases, banks are increasingly likely to finance
risky and unprofitable borrowers, as the pool of creditworthy borrowers thins. Banks’
systematic financing of loss-making projects is revealed only once asset prices revert and the
mispricing of credit risk by banks is corrected.
Why do banks willingly expand credit volume at the expense of credit quality when
asset prices rise? Asset price booms generally occur against the backdrop of abundant funding
liquidity, which encourages banks to lower their credit standards. A rationale for this is offered
by Acharya and Naqvi (2012): in their model, banks face random deposit withdrawals and, in
the event of a liquidity shortfall, incur a penalty, as they are forced to “fire sell” assets. Absent
moral hazard, this penalty induces banks to choose a lending rate that properly reflects the
risk of the projects. But if loan officers’ effort is unobservable, then it is optimal to tie officers’
compensation to the quantity of loans that they originate, and randomly carry out a costly
audit to determine whether officers have over-lent or under-priced loans. The time-consistent
policy is to audit loan officers only when the liquidity shortfall is sufficiently large. So when
the bank enjoys abundant liquidity, loan officers will rationally anticipate a lenient policy of
infrequent audits, and will accordingly engage in excessive lending, charging an interest rate
that under-prices credit risk.8
When many banks simultaneously engage in such behaviour, their excessive risk-
taking can have systemic consequences, as the values of their exposures are highly correlated.
When asset prices drop, banks will simultaneously deleverage, engage in collateral sales and
prompt their customers to do the same: this process can lead to fire sales of assets and
widespread defaults, resulting in economy-wide contagion. The magnitude of these
8 Indeed, Maddaloni and Peydró (2011), Dell’Ariccia, Igan and Laeven (2012), Jiménez, Ongena, Peydró and Saurina (2014) and Altnubas, Gambacorta and Marques-Ibanez (2014) all find that, prior to the subprime mortgage crisis, the rapid expansion of credit and low policy interest rates softened bank lending standards.
BANK BIAS IN EUROPE
8
phenomena should be greater in economies that are more dependent on bank credit, as
bondholders and stockholders are typically less leveraged than banks and therefore tend to
absorb losses stemming from asset price drops without generating simultaneous deleveraging
and spill-over effects in the economy. These arguments lead to our first hypothesis, to be
tested in Section 4.
Hypothesis 1: Financial Structure and Systemic Risk
Bank-based financial structures feature higher systemic risk than market-based structures,
particularly during times of large drops in asset prices.
If bank-based financial structures indeed feature higher systemic risk, as just
hypothesised, then the structure of the financial system is also likely to have implications for
economic growth. When systemic risk is high, financial crises are more frequent and more
severe. Crises tend to have a scarring effect, imposing long-lasting damage on economies
(Reinhart and Rogoff, 2009). If the evidence is consistent with Hypothesis 1, then we should
expect bank-based structures to reduce economic growth via its impact on the frequency and
severity of financial crises.
Financial structure can also affect economic growth in non-crisis times. The
amplification mechanism described above implies that banks, being highly leveraged, create
excessive credit in good times (when asset prices are rising) and insufficient credit in bad
times (when asset prices are falling). This pro-cyclicality of credit supply is likely to lead to
an inefficient allocation of external funding. During asset price booms, banks tend to finance
a large quantity of bad projects, harming economy-wide productivity growth.9 When instead
asset prices fall substantially, the resulting deleveraging forces banks to deny credit to
profitable projects. In many cases, these profitable investment opportunities cannot survive
until banks return to their target leverage ratios and asset prices begin rising again. If
entrepreneurs cannot obtain external funding from non-bank sources, as is likely in bank-
biased financial structures, then these investment opportunities will be permanently lost.
Hence, both excessive lending during asset price booms and credit rationing associated with
crashes hurt growth, though in an asymmetric fashion: the first, by promoting investments
that contribute relatively little to productivity growth; the second, by curtailing investments
that could contribute strongly to it, and thereby triggering a direct recessionary impulse.
These inefficiencies in credit allocation are exacerbated when banks engage in
excessive forbearance of non-performing loans, tending to refinance low-productivity
projects while refusing funds to new, more productive projects (Peek and Rosengren, 2005;
Caballero, Hoshi and Kashyap, 2008; ESRB ASC, 2012). Excessive forbearance distorts the
process of market entry and exit, and in doing so harms aggregate productivity growth
(Disney, Haskel and Heden, 2003). By contrast, markets avoid throwing “good money after
9 This was apparent in the housing and construction boom in Spain, where investment in housing as a proportion of total investment increased from just above 60% in the late 1990s to more than 70% in 2006, driven by an expansion in bank lending. This phenomenon is not new: Rajan and Ramcharan (2015) document that bank credit availability amplified the boom and bust in farm land prices in the US in the 1920s.
BANK BIAS IN EUROPE
9
bad”: owing to higher coordination costs, they can credibly commit to refuse to refinance
unprofitable projects (Dewatripont and Maskin, 1995).
In summary, banks’ credit creation features inefficiencies that could be detrimental
to economic growth, both in the upswing and the downswing of the financial cycle. These
inefficiencies are magnified during times of crisis. These arguments lead to the second
hypothesis, which is tested in Section 4.
Hypothesis 2: Financial Structure and Economic Growth
Bank-based financial structures feature lower economic growth, particularly during times of
large drops in asset prices.
4. FINANCIAL STRUCTURE AND SYSTEMIC RISK
This section tests Hypothesis 1: that bank-based financial structures feature higher levels of
systemic risk than market-based structures, particularly during times of large drops in asset
prices. Banks expand their balance sheet and increase their risk-taking when asset prices rise,
owing to higher values of collateral and bank equity. As bank-based structures tend to be more
leveraged than market-based financial structures, one should observe greater systemic risk-
taking in the former than in the latter. The risk is systemic in the sense that the risk-taking
behaviour of banks during credit expansions threatens not only their individual stability, but
that of the entire financial system, owing to contagion effects arising from contractual
relationships, information externalities, fire-sale externalities, and common asset exposures.
The losses arising from such systemic risk-taking only materialise in the downswing of the
financial cycle when asset prices drop.
To test Hypothesis 1, we construct a dataset comprising systemic risk at the bank-
level, alongside bank balance sheet characteristics, plus information on total bank assets and
stock and private bond market capitalisation at the country-level. To capture banks’
contribution and exposure to systemic risk, we use the variable SRISK, as calculated by New
York University’s Volatility Laboratory, based on work by Brownlees and Engle (2012) and
Acharya, Engle and Richardson (2012). SRISK measures the euro-amount of equity capital
that a bank would need to raise in the event that the broad stock market index falls by 40%
over six months. A bank’s SRISK is a function of its initial leverage and an estimate of its
“downside beta” – that is, the sensitivity of the bank’s equity value to large declines in the
broad stock market index.
We divide SRISK by a bank’s total assets to compute the quantity of systemic risk
per unit of asset, which we label “systemic risk intensity”. This normalisation is important, as
it ensures that the results are not driven by the size of individual banks or a country’s banking
system. Furthermore, following Acharya, Engle and Richardson (2012), we replace negative
observations on “systemic risk intensity” by truncating the variable at zero, since negative
equity shortfalls do not contribute to systemic risk. More than half of the observations on this
BANK BIAS IN EUROPE
10
variable are negative, which implies that systemic risk creation is concentrated in a minority
of banks.
The resulting dataset covers 517 listed banks resident in 20 different countries. The
panel extends from 2000 to 2012, encompassing approximately 5,000 bank-year observations
on the “systemic risk intensity” variable. After truncation, the mean is 1.4% and the
observation at the 90th percentile is 5.1%. In our dataset, the highest observation on SRISK is
Royal Bank of Scotland’s €186bn in 2008; scaled by RBS’s €2.5tn balance sheet, this
corresponds to a “systemic risk intensity” of 7.4%.
These bank-level data are matched with country-year observations on the bank-
market ratio, which is computed as total bank assets divided by the sum of stock and private
bond market capitalisation. These two measures of market capitalisation are obtained from
the World Bank’s financial development and structure dataset, described in Beck, Demirgüç-
Kunt and Levine (2000). To obtain a comparably large country panel of total bank assets, we
turn to country-level sources, requiring careful attention to cross-country comparability. Data
on bank assets were collected on a host-country basis, meaning that we count the assets of all
banks resident in that country, including branches and subsidiaries of foreign banks. Our
definition of banks includes all credit institutions with a banking license to receive retail
deposits, including savings institutions. Other monetary financial institutions, such as money
market funds, are not included.
Hypothesis 1 postulates that systemic risk intensity is likely to be particularly high
in bank-based financial structures during times of large drops in asset prices. To test this
hypothesis, we compute two dummy variables to capture different types of financial crisis.
The first dummy variable – “housing market crisis” – is equal to 1 when a country’s real house
prices drop by at least 10% in one year, and 0 otherwise. The second – “stock market crisis”
– is equal to 1 when a country’s real stock prices drop by at least 20% in one year, and 0
otherwise.10 It is important to capture different types of financial crisis, since banks’ balance
sheets can respond differently to the price changes of different asset classes. Moreover,
different financial crises often occur at different times. This is underscored by Figure 8, which
plots the frequency of the two types of crisis between 1990 and 2011.
Insert Figure 8 here
These data are used to test the hypothesis that bank-based financial structures tend
to feature greater systemic risk, particularly during times of large drops in asset prices. We
estimate panel regressions with fixed effects, to control for time-invariant unobserved
heterogeneity across countries, and with year dummies to control for effects which vary over
time but not across countries. The dependent variable in these regressions is banks’ systemic
risk intensity. Since this variable is observed at bank-level, it is unlikely to have a reverse
10 The “stock market crisis” dummy is therefore distinct from the SRISK variable. SRISK is computed as a bank’s equity shortfall conditional on a hypothetical stock market crash of 40%, while the “stock market crisis” dummy takes the value of 1 following an actual stock market drop of more than 20%. Naturally, we expect the coefficient of the “stock market crisis” dummy to be positive, since the capital shortfall arising associated with a hypothetical stock market crash of 40% should be larger if it occurs in the wake of an actual stock market drop of more than 20%.
BANK BIAS IN EUROPE
11
causal effect on financial structure, which is measured at the country-level. As such, we
interpret the estimated coefficient of the bank-market ratio as the conditional effect of that
variable on banks’ systemic risk intensity.
Table 1 shows the results of the bank-level panel regression estimations. Results of
the initial specification, shown in columns I and III of Table 1, reveal that bank-based
countries feature greater systemic risk intensity at the bank-level. In column I, in which a
crisis is defined as a real house price drop of at least 10% over one year, the effect of the bank-
market ratio on systemic risk intensity operates entirely through the positive coefficient of the
interaction between the bank-market ratio and the crisis dummy. A change in the bank-market
ratio outside of housing crises exerts no significant effect on systemic risk intensity. By
contrast, in column III of Table 1, in which a crisis is defined as an annual real stock price
drop of at least 20%, the coefficients of both the bank-market ratio and its interaction with the
stock market crisis dummy are positive and significant.
Columns II and IV of Table 1 control for three time-varying bank characteristics –
bank size (measured as total liabilities), bank size relative to GDP, and leverage – all lagged
by one year to mitigate endogeneity concerns. The conceptual rationale for the inclusion of
these three variables is as follows. First, large banks tend to be more interconnected with other
banks, which increases their importance within financial networks, particularly in derivatives
markets, which feature high scale economies (Langfield, Liu and Ota, 2014). Large banks also
tend to have less stable funding structures, more market-based activities, and more complex
organisational structures. These features lead large banks to create more systemic risk
(Laeven, Ratnovski and Tong, 2014). Second, a measure of size as a proportion to GDP
captures the relative importance of that bank to the real economy, both in terms of a large
share of deposits and in the ongoing provision of loans to the real economy. Size is one of the
key indicators used by the Basel Committee to identify systemically important banks (BCBS,
2013). Such banks are more likely to receive public-sector support, in the form of
extraordinary liquidity assistance and creditor bail-out in the event of distress, owing to their
importance to the financial system and real economy. The moral hazard arising from this
implicit subsidy leads large banks to take additional risk (Afonso, Santos and Traina, 2014).
Third, highly leveraged banks are likely to have a higher systemic risk intensity, owing not
only to the role of leverage in the construction of the SRISK variable, but also to the effect of
low franchise value on shareholders’ incentives to “gamble for resurrection” by requiring
bank managers to take excessive risks (Admati and Hellwig, 2013). The coefficients of all
three control variables in columns II and IV of Table 1 are statistically significant and have
the expected positive sign.
Upon the inclusion of these additional controls, the estimated coefficients of the key
variables of interest prove robust. Comparing columns I and II of Table 1, in which the crisis
dummy is defined as a stock market crisis, the magnitude of the coefficient of the interaction
term decreases only slightly, from 0.011 to 0.009, and remains significant at the 1% level of
confidence. Comparing columns III and IV, in which the crisis dummy is defined as a stock
market crisis, the significance of the interaction term disappears, although the coefficients of
BANK BIAS IN EUROPE
12
the bank-market ratio and of the crisis dummy both strengthen in terms of estimated
magnitude and significance.
Insert Table 1 here
An increase in the bank-market ratio at country-level therefore tends to increase
banks’ systemic risk intensity – conditional on time-varying bank characteristics and year and
fixed effects. The economic magnitude of this finding is visualised in Figure 9, which plots
the predicted effect of a within-country change in financial structure on banks’ systemic risk
intensity over the distribution of the bank-market ratio. The right-hand-side of each graph
corresponds to the most bank-based financial structure in our country-year panel. Crucially,
the slope of the predicted effect conditional on a crisis is higher during housing market crises,
reflecting the positive and significant coefficient of the interaction term estimated in column
II of Table 1. By contrast, the coefficient of the interaction term is insignificant in column IV
of Table I, in which the crisis dummy is defined as a stock market crash. As a result, the two
lines in the right hand side graph of Figure 9 have equal gradients. Both lines are upward-
sloping, and the line referring to stock market crises has a higher intercept, reflecting the
positive and significant coefficient of the crisis dummy in column IV of Table I.
Insert Figure 9 here
To garner further insight on the economic magnitude of the predicted effect, consider
a hypothetical large bank with total liabilities of €1tn. Fixing the size of the bank affects the
predicted systemic risk intensity, as the specifications shown in columns II and IV of Table 1
include bank size and bank size relative to GDP among the explanatory variables, and both of
these variables are positively associated with systemic risk intensity. Fixing bank size permits
a conversion of the “systemic risk intensity” variable into a euro-amount of systemic risk. By
way of illustration, Figure 10 shows the predicted systemic risk contribution of a €1tn bank
according to the bank-market ratio of five major countries in 2011: the United States, France,
the United Kingdom, Germany and Italy. The differential effect across these five countries is
sizable. During a housing market crisis, the model predicts that a €1tn bank resident in a
country with a financial structure similar to Germany’s, where the bank-market ratio was 5.7
in 2011, will contribute €78bn to systemic risk. By contrast, a €1tn bank resident in a country
with a financial structure similar to that of the US, which had a bank-market ratio of 0.7 in
2011, will contribute €48bn to systemic risk during a housing market crisis – a differential of
€30bn. In the absence of a housing market crisis, the differential in predicted systemic risk for
a €1tn bank between the financial structures of Germany and the US drops to €10bn.
Insert Figure 10 here
Recall that negative observations on the dependent variable, “systemic risk
intensity”, are truncated at zero. Following Acharya, Engle and Richardson (2012), negative
BANK BIAS IN EUROPE
13
SRISK observations do not imply a contribution to systemic risk, but also do not reduce
aggregate systemic risk, as surplus equity capital at individual banks cannot be redistributed
throughout the banking system. Although this truncation makes sense economically, it could
be problematic econometrically, resulting in biased panel regression estimations in Table 1.
As a robustness check, we re-estimate the specification used in Table 1 with trimmed least
squares estimators, as developed by Honoré (1992). This model results in consistent
estimators in the context of a truncated dependent variable, while preserving our fixed-effects
panel set-up.
Results of this trimmed least squared panel estimation, shown in Table 2, are largely
consistent with those of the standard fixed effects panel regression estimations shown in Table
1. In all specifications, an increase in the bank-market ratio at the country-level is associated
with more systemic risk intensity at the bank-level. In columns I and II of Table 2, in which
the crisis dummy is defined as an annual real house price drop of at least 10%, we estimate
positive and significant coefficients of the crisis dummy on its own and in interaction with the
bank-market ratio. These are qualitatively the same as the results shown in Table 1, although
the predicted effect is smaller: comparing Tables 1 and 2, the estimated coefficient of the
interaction between the bank-market ratio and the crisis dummy declines from 0.011 to 0.005
in column I, and from 0.009 to 0.006 in column II. In columns III and IV, in which the crisis
dummy is defined as an annual real stock price drop of at least 20%, results are less clear-cut.
The standard fixed-effects panel regression model in Table 1 delivered a positive and
significant coefficient of the interaction term in column III, and an insignificant coefficient in
column IV. By contrast, the trimmed least squares fixed-effects panel regression model
estimated in Table 2 delivers negative and significant coefficients of the interaction terms in
columns III and IV, although the magnitude of this effect is dominated by the estimated
coefficients of the bank-market ratio and of the crisis dummy taken on their own.
Insert Table 2 here
Summing up, the estimates shown in Tables 1 and 2 suggest that an increase in a
country’s bank-market ratio tends to increase systemic risk intensity at the bank-level. Results
suggest that much of this effect operates through the performance of the banking sector during
housing market crises, when real house prices drop by more than 10% over one year. This
finding can be viewed in light of the importance of mortgage lending in banks’ balance sheets,
as documented by Jordà, Schularick and Taylor (2014). As a result, changes in bank leverage
are in large part guided by swings in the price of housing. By contrast, we obtain ambiguous
results for the effect of a stock market crisis on the sensitivity of banks’ systemic risk intensity
to the bank-market ratio, suggesting that changes in stock market value are less important for
systemic risk in bank-based financial structures.
BANK BIAS IN EUROPE
14
5. FINANCIAL STRUCTURE AND ECONOMIC GROWTH
We now turn to Hypothesis 2, which postulates that more bank-based financial structures
feature lower economic growth, particularly during times of large drops in asset prices. In
Section 3, we found evidence that more bank-based financial structures feature higher
systemic risk. Owing to the permanent damage that financial crises typically wreak on the real
economy, we expect that the higher level of systemic risk observed in bank-biased structures
would also lead to lower economic growth. In addition, the amplification mechanism
determined by bank leverage implies excessive credit in good times and insufficient credit in
bad times, leading to an economy-wide misallocation of real resources, and thus to lower
long-run growth.
To test Hypothesis 2, we complement the dataset described in Section 3 with
macroeconomic data, while dropping bank-level observations on systemic risk intensity. The
new dependent variable is growth in real GDP per capita; the independent variable of interest
remains the bank-market ratio, defined as the natural logarithm of the ratio of total bank assets
to stock and private bond market capitalisation. As in Section 4, we estimate panel regressions
with country-level fixed effects and time dummies, to control for unobserved time-invariant
heterogeneity across countries and for common time-varying effects.
Since endogeneity is a greater concern with economic growth as a dependent
variable, we divide our 1988-2011 panel into five non-overlapping periods of five years’
duration, and use the average of each variable within each five-year period as the observation
unit. This transformation helps to abstract from any relationship between growth and financial
structure which might be present only at business-cycle frequency, for example owing to the
lagged response of the book value of banks’ assets to GDP surprises.
The dataset contains 180 observations for 45 countries between 1988 and 2011. The
binding constraint on the size of the dataset is the private bond market capitalisation variable,
which is available for fewer countries than the stock market capitalisation variable, and for
which observations begin only in the late 1980s in the World Bank’s financial development
and structure dataset.
The resulting estimates are shown in Table 3. In all specifications, the bank-market
ratio is negatively correlated with GDP growth: an increase in the size of a country’s banking
sector relative to stock and private bond market capitalisation is associated with lower GDP
growth in the subsequent five-year period, conditional on time fixed effects. This core result
contrasts with Levine (2002), who finds no relationship between financial structure and
economic growth between 1980 and 1995. This difference between Levine’s finding and our
own cannot be attributed to methodology: Pagano et al (2014) re-estimate the exact
specifications estimated by Levine (2002) using data up until 2011, and find that more bank-
based financial structures are conditionally associated with lower economic growth –
consistent with our findings reported in Table 3. Instead, the relationship between financial
structure and economic growth appears to have changed since the 1980s. This time-varying
relationship can be interpreted in lights of the basic facts presented in Section 1: banking
BANK BIAS IN EUROPE
15
systems only started to become extraordinarily large from the mid-1990s, especially in
European countries.
Insert Table 3 here
Each of the regressions reported in Table 3 includes a “crisis dummy”, both on its
own and in interaction with the bank-market ratio; and the specifications in columns II and
IV also include a “boom dummy”. The crisis dummies permit us to test the hypothesis that
large drops in asset prices have a more severe effect on economic growth in countries with a
bank-based financial structure. The inclusion of boom dummies is intended to investigate
whether bank-based financial structures also amplify the positive impact of asset price booms
on economic growth.
For consistency with other variables in the growth regression, which are defined over
five-year intervals, we set the housing market crisis dummy equal to 1 if real house prices
drop at an average annual rate of at least 5% over five years, and 0 otherwise. Similarly, the
stock market crisis dummy equals 1 if the domestic stock market index drops at an average
annual rate of at least 10% over five years, and 0 otherwise. In terms of severity – that is,
frequency with which such crises occur in the data – these five-year thresholds are
approximately equivalent to the 10% and 20% yearly thresholds that define the two crisis
dummies in Tables 1 and 2. Symmetrically, we define a “housing market boom” as a five-
year period in which real house prices grow at an average annual rate of at least 5%, and a
“stock market boom” as a five-year period in which the domestic stock market index grows
at an average annual rate of at least 10%.
The estimates shown in column I of Table 3 indicate that an increase in the bank-
market ratio during housing market crises is associated with lower economic growth five years
later. By contrast, the coefficient of the interaction between the stock market crisis dummy
and the bank-market ratio in column III is not significantly different from zero. This finding
can be interpreted in view of the key role played by house prices in determining the value of
the collateral attached to bank loans. Consequently, when house prices drop, banks are
constrained in their ability to provide new funding to profitable projects. The evidence
presented in column I of Table 3 is consistent with the idea that the contraction in bank credit
destroys the potential value in transient profitable investment opportunities that fail to receive
external funding, and that this amplification mechanism is more prominent in bank-based
economies than in market-based ones. Likewise, based on 150 years of US data, Giesecke,
Longstaff, Schafer and Strebulaev (2014) find that banking crises have strong and persistent
effects on macroeconomic growth, while corporate default crises do not.
Interestingly, the more general specifications in columns II and IV, which allow for
the effect of asset price booms on subsequent growth, show that bank-based financial
structures do not amplify the positive effect of asset price booms on economic growth,
irrespective of whether such booms occur in the housing (column II) or in the stock market
(column IV). However, the negative amplification effect is still present for housing market
BANK BIAS IN EUROPE
16
crises: in other words, financial structure plays asymmetrically in housing market crises and
booms.
Why do bank-based financial structures amplify the negative real effects of housing
crises, but not the positive effects of housing booms? As argued in Section 3, an explanation
is that real economic activity responds asymmetrically to the tightening and relaxation of the
collateral constraints arising from changes in the price of real estate. Imagine that the economy
generates a steady stream of new ideas, which (if financed) boost productivity and therefore
output growth. When the typical firm is not credit-constrained, its marginal project has
relatively low productivity in expectation. Instead, when banks and firms are up against a
leverage constraint, many good ideas are not financed – implying that the marginal project
has high productivity in expectation. This implies asymmetry: one euro less of lending has a
greater impact on average productivity in bad times than good times. Hence, a drop in the
value of collateral has a larger impact on real output than an increase of the same magnitude.
Collateral fire sales are an additional reason for the asymmetry: when housing prices drop,
banks simultaneously deleverage by selling collateral, and prompt borrowers to do the same.
These fire sales in turn feed the house price collapse, and induce banks to deleverage even
further – a vicious cycle that is likely to have strong recessionary effects. No mechanism
comparable to fire sales exists when house prices increase: in a housing market boom, banks
make more lending available to their clients, which may induce them to indulge in further
home purchases in a rising market, but banks cannot force borrowers to do so.
Figure 11 plots the predicted economic magnitude, based on the estimations shown
in columns I and III of Table 3. The two graphs plot the modelled relationship between
countries’ bank-market ratio and GDP growth over the distribution of the bank-market ratio.
Three insights stand out. First, the lines are downward sloping in both graphs, indicating a
negative association between an increase in the bank-market ratio at country-level and
predicted GDP growth five years later. Second, the dark grey line, which shows predicted
GDP growth conditional on a financial crisis, always lies below the light grey line, which
shows predicted GDP growth in non-crisis periods. This reveals the additional negative
impact that crises have on GDP growth. Third, the slope of the dark grey line is particularly
large conditional on a housing market crisis, which reflects the strongly negative coefficient
of the respective interaction term estimated in column I of Table 3.
Insert Figure 11 here
To estimate the economic magnitude for major European countries, Figure 12
provides specific predictions based on the bank-market ratio in France, the UK, Italy and
Germany in 2011, compared with that of the US. The predicted effects shown in Figure 12
are based on the estimated coefficients in column I of Table 3, in which the crisis dummy is
defined as an average annual drop in real house prices of at least 5% over five years. We
choose this specification because, during housing market crises, the bank-market ratio has a
particularly strong and significant effect on economic growth, according to the estimations
shown in Table 3. Figure 12 provides specific point estimates of predicted real GDP growth
BANK BIAS IN EUROPE
17
over the distribution of the bank-market ratio and conditional on a housing market crisis. For
example, if a country’s bank-market ratio were to increase from 133%, which corresponds to
the US’s ratio in 2011, to 324%, which corresponds to Germany’s ratio in 2011, the predicted
impact on annual growth in real GDP per capita of a five-year housing market crisis would
increase by 3.6% points.
Insert Figure 12 here
We subject the core results shown in Table 3 to three robustness checks. First, we
check whether the results are robust to alternative definitions of financial crises, which are
not based on housing and stock market prices. The regressions reported in Table 3 modelled
the effect of price changes on only two asset classes (housing and stock); a compelling
rejection of the alternative hypothesis requires us to look at a wider spectrum of asset prices.
In unreported results, we confirm that the introduction of a new crisis dummy defined as a
generalised financial crisis – based on the datasets of Reinhart and Rogoff (2009) and Laeven
and Valencia (2013) – does not absorb the independent explanatory power of the bank-market
ratio.
Second, we investigate whether our findings are driven by observations from the
2008-11 financial crisis. In Sections 2 and 3, we hypothesised that large drops in assets prices
are particularly disruptive to economic growth in bank-based financial structures. One
possibility could be that the generally negative association between the bank-market ratio and
economic growth is driven entirely by this amplification effect of large asset price drops such
as those that occurred in 2008-11, while there is no negative association in normal times.
Hence, in Table 4 we test whether the results in Table 3 are driven by the generalised asset
price drops observed over 2008-11 by dropping that time period from the regression. The
results are broadly robust in the subsample which excludes the 2008-11 period. In columns I
and II, the coefficients on the bank-market ratio are very similar to those estimated in columns
I and II of Table 3; moreover, the coefficients of the bank-market ratio interacted with the
housing market crisis dummy somewhat increase in magnitude, and remain significant at the
1% level of confidence. The results in columns III and IV are less clear-cut, however: the
statistical significance of the estimated coefficient of the bank-market ratio is lower than in
Table 3, while the positive coefficient of the interaction term becomes significant. On the
other hand, the estimated coefficient of the stock market crisis dummy increases in magnitude.
Insert Table 4 here
As a third robustness check, we test whether the core results presented in Table 3
hold for different definitions of financial structure. Our benchmark measure of financial
structure – deployed in all regression estimations except those of columns II, III and IV of
Table 5 – is the ratio of total bank assets to stock and private bond market capitalisation. This
benchmark measure of financial structure is modified in column II of Table 5 by excluding
BANK BIAS IN EUROPE
18
private bond market capitalisation from the denominator; the results are very similar to the
benchmark results in column I.
Total bank assets is defined as the book value of all assets on a bank’s balance sheet
– including not only credit to the non-financial private sector, but also other items such as
loans to other financial firms, holdings of marketable securities, derivatives positions and
tangible assets. Since the increase in the size of European banks since the 1990s has been
driven in part by growth of these other items, it is reasonable to check whether the negative
effect of the bank-market ratio on economic growth is channelled through banks’ non-lending
activities. Indeed, Pagano et al (2014) find that large universal banks, which conduct a wide
array of non-lending activities, reinforce the link between asset price shocks and the supply
of credit, and ultimately real economic activity. A drop in securities prices will hit universal
banks both on the asset and on the liability (or funding) side: insofar as they hold marketable
securities, the price drop reduces universal banks’ market value and therefore the value of
their equity; insofar as they depend on the issuance of these securities to fund their activities,
asset price drops raise universal banks’ cost of capital.
For this robustness check, we define a new variable based on deposit money banks’
lending to the non-financial private sector. This variable therefore excludes other non-lending
activities. In our global panel dataset, deposit money banks’ lending to the non-financial
private sector as a proportion of banks’ total assets averages about 50%, with a standard
deviation of about 20%. We estimate two regressions based on this new private credit
variable: in column III, the bank-market ratio is defined as private credit to stock and private
bond market capitalisation; in column IV, the ratio is defined as private credit to stock market
capitalisation. Column II defines the bank-market ratio as total bank assets to stock market
capitalisation.
Our core result – that is, a negative association between the bank-market ratio and
economic growth – holds in columns III and IV of Table 5, in which the numerator of the
bank-market ratio is defined as deposit money banks’ lending to the non-financial private
sector. The estimated coefficient of the bank-market ratio is negative and significant at the
1% level of confidence in both columns; moreover, the magnitude of the coefficient is similar
to that of our benchmark regression in column I, albeit with a slight (and expected) diminution.
However, the significance of the coefficient of the interaction between the bank-market ratio
and the housing market crisis dummy diminishes to a 10% level of confidence in column IV;
the estimated coefficient loses significance entirely in column III. These results can be
interpreted in light of the potency of the financial accelerator mechanism within universal
banks, as discussed in Pagano et al (2014). Owing to universal banks’ outsized exposure to
securities prices, a housing market crisis is likely to have an especially large effect on
universal banks’ market value, creating a deleveraging impulse that further reduces the value
of securities and impairs the supply of credit to the real economy.
Insert Table 5 here
BANK BIAS IN EUROPE
19
The regressions estimated in Tables 3, 4 and 5 are potentially subject to endogeneity
concerns. Unlike the regressions estimated in Tables 1 and 2, in which the dependent variable
is observed at bank-level and the key independent variable (the bank-market ratio) is observed
at country-level, Tables 3, 4 and 5 model the conditional relationship between two country-
level variables: GDP growth and the bank-market ratio. GDP growth could plausibly exert a
reverse causal effect on the bank-market ratio, compromising a causal interpretation of the
regression results. In particular, a surprise increase in GDP growth would tend to increase
stock and private bond market capitalisation immediately, given that capitalisation is
measured at market prices. Bank total assets, however, would respond more gradually, as
book values are slow to adjust. Therefore, the negative conditional relationship between GDP
growth and the bank-market ratio that we estimate in Tables 3, 4 and 5 could in part reflect
the negative causal impact of GDP growth on the bank-market ratio – although this concern
is to some extent assuaged by the fact that our observations are five-year averages. Short-term
fluctuations of the bank-market ratio induced by surprises in GDP growth at the business cycle
frequency should largely disappear upon averaging both the growth rate and the bank-market
ratio over five years.
To further control for the potential endogeneity of the bank-market ratio to GDP
growth, we estimate instrumental variable (IV) regressions. The IV regressions use six
measures of financial reforms as instruments, provided by Abiad, Detragiache and Tressel
(2008): a measure of the strength and intrusiveness of banking sector supervision; a measure
of security market liberalisation; a measure of ceilings on bank credit; a measure of interest
rate liberalisation; a measure of privatisation of banks; and an indicator of the contestability
of the banking market (that is, an inverse measure of barriers to entry). The choice of these
instruments is motivated by the idea that a change in the legal and regulatory environment
will affect financial structure in equilibrium. For example, an increase in our first instrument
– the strength of banking sector supervision – should increase the relative attractiveness of
non-bank intermediation.
In terms of validity, these instruments are themselves potentially affected by
endogeneity insofar as financial sector liberalisation is more likely to occur in fast-growing
economies. To address this concern, we lag the observations on the financial sector reform
instruments by six years (and take the five-year average of this lagged variable). After this
time, the effect of financial sector liberalisation on GDP growth is likely to have petered out,
leaving in the data only the effect on the level, rather than the growth rate, of GDP.
In the first-stage regressions reported in Table 6, the coefficients of the six measures
of financial reform are jointly statistically significant: F-tests reject the null hypothesis that
their coefficients are all zero at the 5% confidence level, implying that the instruments are
conditionally correlated with the bank-market ratio. In particular, the estimated coefficients
of measures of the strength of banking sector supervision and security market liberalisation,
and in certain specifications also those of credit ceilings and the contestability of the banking
market, are individually significant. The coefficients of the strength of banking sector
supervision and security market liberalisation have the expected negative signs, since they
both reduce the relative attractiveness of bank-based finance.
BANK BIAS IN EUROPE
20
Insert Table 6 here
Table 7 reports the results of the second-stage IV regression. Overall, the results are
consistent with those in Tables 3, 4 and 5, in the sense that an increase in the bank-market
ratio is conditionally associated with lower economic growth. This is true of both
specifications reported in Table 7. However, the source of the effect varies. In column I, the
effect is driven by the coefficients of the bank-market ratio on its own and of its interaction
with the housing market crisis dummy. This suggests that the contraction in lending and
growth owing to banks’ deleveraging is strongest during housing market crises, underscoring
the importance of housing and related assets on banks’ balance sheets. By contrast, the
coefficient of the interaction term in column II, in which the crisis dummy is defined as a
stock market crisis, is positive, although it is significant only at the 10% level of confidence,
and the magnitude of its effect on the bank-market ratio is dominated by that of the estimated
coefficients of the bank-market ratio and stock market crisis dummy. Since the instrumental
variable panel regression model is over-identified in both specifications of Table 7, we
perform tests of over-identifying restrictions. As shown by the p-values reported at the bottom
of Table 7, neither the Sargan test nor Hansen’s J rejects the over-identifying restrictions
assumption even at the 10% level for either of the regressions.
Insert Table 7 here
The results in Tables 3, 4, 5 and 7 yield two key common insights. First, bank-based
structures have a negative effect on economic growth in all specifications. Second, housing
market crises exert a strongly negative effect on economic growth in countries with bank-
based financial structures, which we attribute to the importance of assets related to housing
on banks’ balance sheets. Both of these insights are consistent with our second hypothesis.
6. WHY DID EUROPE DEVELOP A BANK BIAS?
Financial structures dominated by banks tend to have adverse effects on financial stability and
macroeconomic performance, according to the evidence presented in Sections 4 and 5, so it
seems appropriate to refer to Europe’s prevailing financial structure as featuring a “bank bias”.
In light of the negative effects of such “bank bias”, it is important to consider why banks
became so dominant in Europe, as Section 1 documents. To understand the factors underlying
Europe’s increasing bank bias, it is worth noticing that its financial system has been
increasingly dominated by the largest banks, not just by banks in general. To show this, we
perform the following thought experiment. Suppose that the assets of the largest 20 European
banks had grown in line with nominal GDP since 1996: then, what would have been the total
size of Europe’s banking system in 2012? The grey dashed line in Figure 13 plots this resulting
“counterfactual ratio” between bank assets and GDP, while the black solid line plots the
BANK BIAS IN EUROPE
21
corresponding actual values. Strikingly, the near-doubling in the size of the EU banking
system (relative to GDP) since 1996 is entirely attributable to the growth of the largest 20
banks.
Insert Figure 13 here
Explaining why Europe has developed an increasing bank bias amounts largely to
asking which factors account for the growth of Europe’s largest banks. As shown by the first-
stage regressions shown in Table 6, changes in financial regulation and supervision have been
significant drivers of the relative importance of banks and markets. Accordingly, in this
section, we consider two public-policy factors: first, state support and prudential supervision
of banks; and second, political support for banks. We argue that these two factors have been
particularly supportive of the expansion of large banks in Europe.
6.1. Public Support and Prudential Supervision
In most countries, banking is one of the most regulated and closely supervised industries. The
intensity of bank regulation and supervision arises from the peculiar severity of moral hazard
problems in banking: banks borrow from a large pool of unsophisticated and dispersed
depositors, creating risk-shifting incentives for banks’ shareholders and managers. These
moral hazard problems, coupled with banks’ intrinsic fragility stemming from their maturity
transformation function, explain why public policy typically protects depositors via insurance
schemes and subjects banks to prudential regulation and supervision to curb their risk-shifting
incentives and create equity buffers to absorb losses in case of distress.
However, intensive bank regulation and supervision might be inadequate, and
engender unintended consequences. Deposit insurance schemes generate moral hazard, as
they shift insolvency risk onto taxpayers. Capital requirements are often softened by banks,
especially the largest ones, by exploiting loopholes in prudential regulation. Banks that are so
large and interconnected with others that their collapse would threaten systemic stability can
expect to be bailed out by the government in case of distress: they are “too big to fail” (TBTF).
This implicit creditor bailout guarantee is a further source of moral hazard, beyond that
implied by public deposit guarantees.
In turn, the public support granted to TBTF institutions may prompt bank managers
to pursue size as an objective per se, in order to become systemically important and obtain
the public subsidies afforded to systemically important banks. They can do so in a variety of
ways: by expanding lending in areas where it is quickly and easily scalable, such as loans
secured against housing (Manove, Padilla and Pagano, 2001); by acquiring other banks or
merging with them; or by proprietary investment in securities. In all of these activities, bank
managers will place relatively little weight on risk management, since the main objective is
to expand the size of their balance sheet.
BANK BIAS IN EUROPE
22
These factors, however, are not specific to Europe: while they may have driven
growth in banks worldwide, they cannot explain why Europe’s banking system expanded
more, or why Europe’s largest banks have grown so large. What is special about Europe that
triggered these phenomena?
One possible explanation is that European governments have been particularly
supportive of banks, especially large ones, both in the form of bailout guarantees and
regulatory forbearance. Lambert and Ueda et al (2014) find that the magnitude of this implicit
government subsidy of banks has declined somewhat from crisis peaks, but that it remains
substantial, especially in the euro area. Importantly, euro area banks continue to benefit from
a greater reduction in funding costs owing to government support than US or even UK banks.
This reflects not only the generally weaker state of euro area banks’ balance sheets, but also
differences in policy frameworks, such as that of bank resolution.
National supervisors in the EU have been far less inclined to shut down and liquidate
distressed banks than the FDIC in the US, which has acquired a reputation for swift and
efficient bank resolution. This transatlantic discrepancy is highlighted by Figure 14, which
shows that far fewer EU banks have failed since 2008 compared with the number of banks
that have been resolved by the FDIC in the US. Although the FDIC mostly resolves small
banks with assets under $100m, it occasionally resolves medium and large banks. The largest
bank ever resolved by the FDIC is Washington Mutual Bank, which held $307bn of assets at
the time of its closure in September 2008. Only about 20 banks in the EU are larger than
Washington Mutual; 7,238 EU banks are smaller, and could therefore feasibly be resolved by
a European version of the FDIC.
Insert Figure 14 here
A rate of low bank failures during a systemic banking crisis suggests a greater degree
of regulatory forbearance by supervisors towards undercapitalised banks. Rather than
resolving distressed banks, European authorities have often preferred to rescue them by
favouring acquisitions by (or mergers with) other banks. Over the financial crisis, there are
many examples of national governments and supervisors facilitating distressed mergers or
acquisitions, despite concerns regarding excessive concentration and lack of competition.11
Between August 2008 and February 2014, the EU Commission received 440 requests from
EU member states to provide state aid to financial institutions. The EU Commission did not
object to the vast majority (413) of these requests, although state aid approvals often entail
bank restructuring requirements, which in some cases are substantial (EU Commission, 2011).
11 For example, Banco di Napoli, a distressed publicly-owned bank, was sold by the Italian government in 1997 for a nominal sum to Banca Nazionale del Lavoro and the Istituto Nazionale delle Assicurazioni, and resold in 2002 by these banks to the Sanpaolo IMI (which later merged with Banca Intesa). Similarly, the UK Treasury facilitated the merger of Lloyds with the ailing HBOS in September 2008, overruling the competition concerns raised by the Office of Fair Trading by not referring the case to the Competition Commission. In 2008-09, the Irish government brushed aside the Irish Competition Authority to promote mergers among distressed Irish banks. Other examples have arisen following the crisis: once Spain’s property bubble burst in 2008, many of the cajas that had funded the housing boom were distressed or insolvent. The Banco de España’s rescue strategy was to merge them with other banks. Seven cajas merged into a single entity – Bankia – in December 2010.
BANK BIAS IN EUROPE
23
This “lack of exit” induced by public support for distressed and unprofitable banks
helps to explain simultaneously both the increase in Europe’s bank bias, and its coincidence
with the growth of the largest banks. This policy has contributed to the increase in bank
concentration, and at least partly explains the low frequency of bank failures in Europe.
Moreover, by worsening banks’ moral hazard, strong government support is likely to induce
greater risk-taking.12 Thus, public support also helps to explain why greater bank bias is
associated with greater systemic risk, as documented in Section 4.
What explains the greater public support given to distressed banks in the EU, as
compared with the US? Aside from politics, which will be discussed in Section 6.2, we
identify three key reasons.
First, banking supervision in parts of Europe has historically been less effective than
in the US. Until 2014, when a single supervisor was created in the euro area, bank supervision
in Europe was a national preoccupation – but the span of European mega-banks’ operations
was international. This mismatch impaired the effectiveness of national banking supervisors
in the EU. Moreover, supervisors’ power was impaired by a weak, even non-existent, bank
resolution framework throughout the EU. The first-stage instrumental variable regression
results shown in Table 6 are consistent with the hypothesis that weak bank supervision
contributed to Europe’s bank bias.
Second, in Europe the universal banking business model is pervasive, as shown by
Pagano et al (2014). Universal banks’ securities trading arm can obtain funding at interest
rates that reflect the public subsidies associated with their deposit-taking arm, increasing
universal banks’ incentive to take excessive risk in securities markets. The econometric
analysis in Annex A4.2 of the Commission’s report on implicit state guarantees to EU banks
(EU Commission, 2014a) finds that the European banks that receive a larger implicit public
subsidy are larger, riskier, more interconnected, less capitalised, and rely more on the
wholesale market for funding: in short, they are large universal banks, with a strong presence
in securities markets.
A third specificity of Europe is that, in the euro area, the expansion of banking rode
on the back of the process of financial integration that accompanied and followed monetary
unification. Lane (2013) and Lane and McQuade (2014) document that, before the crisis,
international capital flows in the euro area were associated with abnormal expansions of credit
and housing market bubbles in the euro area periphery: core country credit flowed into Spain,
Ireland and Greece, funding housing and consumption booms in these countries; it also flowed
from Germany, Austria and Italy to fund a similar boom in central and eastern Europe.
Therefore, in the presence of financial frictions, the benefits of financial integration were
counterbalanced by a systematic misallocation of funding.
12 Marques, Correa and Sapriza (2013) find that the intensity of government support is positively related to measures of bank risk taking, especially over 2009-10.
BANK BIAS IN EUROPE
24
6.2. Political Factors
Throughout history, banking and politics have been closely connected (Calomiris and Haber,
2014). Political factors have played a particularly important role in the recent growth of
European banks, especially the largest ones, in a variety of ways. One factor, discussed in
Section 6.1, is the public support given to distressed institutions, and its interaction with
regulatory forbearance by prudential authorities. But public support to banks by politicians
may extend far beyond the case of distressed banks.
First and foremost, European governments have nurtured the birth and growth of
mega-banks that act as “national champions” in competition with foreign banks – an attitude
that Véron (2013) labels “banking nationalism”. This policy ranges from preferential
treatment by governments to protection against foreign competition and against takeover bids
by foreign banks. The connection between banks and politics may also be self-reinforcing.
Banks have been able to strengthen their dominance within Europe’s financial structure over
time by lobbying for favourable legislation; as they became ever more vital to the functioning
of financial markets and to the economy, banks increased their lobbying power vis-à-vis
politicians.
Second, politicians in some EU countries have a direct interest in supporting some
banks and ensuring their survival, either because banks are either publicly owned or banks’
management is politically appointed. In Germany, public sector banks account for nearly half
of all bank assets (Hau and Thum, 2009), and are mainly of two types: the savings banks
(Sparkassen), which have local or regional scope, and are owned by their respective
municipalities or counties; and the regional banks (Landesbanken), many of which are major
universal banks with nationwide and even international operations. In Italy, political influence
on banks is also pervasive, albeit more indirect: politicians, especially local ones, affect the
governance of “banking foundations” (fondazioni bancarie), which in turn have important
stakes in the share ownership structure of many banks, including the largest. The banks in
which foundations have major equity stakes comprise 23% of total Italian banking assets, and
foundations’ stakes typically amount to 20% or more of bank capital, although in several large
banks they control boards with a smaller share of ownership, often via agreements with other
shareholders (Jassaud, 2014). In Spain, the management of savings banks (cajas) is closely
connected with local politicians – a connection that according to Garicano (2012) was a factor
in the slow and ineffective response of Spanish prudential supervisors to the crisis, and in the
protracted forbearance of bad loans to real estate developers.
7. POLICY SOLUTIONS TO EUROPE’S BANK BIAS
Before turning to policy, let us recap the main findings of the paper. Section 1 documented
that banking in Europe has expanded at an extraordinary pace – far more than in the US and
Japan, and especially since the mid-1990s. As a result, Europe’s financial structure has
become bank-biased, in the sense that the size of banks dwarfs that of the stock and private
bond markets. Section 2 discussed theories that suggest that bank bias can raise systemic risk,
BANK BIAS IN EUROPE
25
particularly during times of large drops in asset prices; and that bank bias can lower economic
growth, particularly during times of large drops in asset prices. These theories underpin our
two hypotheses, presented in Section 3. Sections 4 and 5 discussed evidence that is largely
consistent with these two predictions: based on our estimations, Europe’s bank-biased
financial structure is associated with greater systemic risk and worse growth performance than
if its structure were more balanced. In Section 6, we argued that Europe’s peculiarly bank-
biased financial structure can be traced to particularly generous public support for banks, both
through implicit bailout guarantees and supervisory forbearance, coupled with a political
attitude which favours “national champions” and publicly owned banks.
Reducing Europe’s bank bias should therefore be an important intermediate
objective of financial policy. Between 2011 and the publication of this paper in 2015,
Europe’s financial structure began the process of rebalancing away from banks and towards
market-based intermediation. In those five years, European banks downsized by around 10%,
creating slack in the supply of external funding which security markets have partly taken up
(ECB, 2014). Primary corporate bond issuance increased, alongside the size of non-bank
financial institutions which are associated with the development of securities markets, such
as institutional investors. This re-balancing is somewhat cyclical: as Figure 7 shows using
aggregate data, and as Becker and Ivashina (2014) document using firm-level data, bank loans
and debt securities are partial substitutes. But the shift towards market-based finance is also
likely to prove structural – an expectation which European policymakers share (Constâncio,
2014; Liikanen, 2014).
In Section 6, we argued that Europe’s bank-biased financial structure arose largely
due to past policies and political attitudes. As such, a substantial and long-lasting re-balancing
of Europe’s financial structure can only be achieved with appropriate reforms and changes in
political attitudes, in particular on two fronts. First, policymakers should reduce regulatory
favouritism towards banks. Many recent policy innovations go in this direction, as Section 7.1
documents – but more progress is needed, in particular in terms of structural reform targeted
at large universal banks and a more stringent anti-trust policy. Second, policymakers should
support the development of securities markets as an alternative source of external funding.
Here, policy reform is in its early stages: the EU Commission has announced its intention to
deliver a “capital markets union” in Europe, but its contents are still being debated (Hill, 2014;
Juncker, 2014; EU Commission, 2015). Section 7.2 outlines some proposals regarding how a
capital markets union could be designed in a way that lowers Europe’s bank bias, thereby
reducing systemic risk and supporting economic growth.
7.1. Reducing Regulatory Favouritism Towards Banks
Recent reforms adopted by the EU establish a stricter regulatory regime for banks, by
requiring banks to fund themselves with more and higher quality capital, tightening prudential
supervision and improving the process of resolution of insolvent banks. Four policy
innovations are particularly noteworthy:
BANK BIAS IN EUROPE
26
In July 2013, the fourth “capital requirements” legislative package – comprising both
a regulation (CRR) and a directive (CRD) – entered into force. This legislation brings
to the EU the expected benefits of the Basel III agreement. Importantly, the
legislation creates new legal powers for authorities to impose additional capital
requirements. For example, authorities can impose an additional systemic risk buffer
on all (or a subset of) banks, with the intention to “prevent and mitigate long term
non-cyclical systemic or macroprudential risks” (Article 133 of the CRD) – such as
the elevated systemic risk associated with bank-biased financial structures
documented in this paper. More generally, imposing stricter capital requirements is
important to reduce the inefficiencies associated with high leverage (Admati,
DeMarzo, Hellwig and Pfleiderer, 2014).
In November 2013, the “SSM regulation” – conferring bank-supervisory powers on
the ECB – entered into force. The Single Supervisory Mechanism creates a new
system of financial supervision comprising the ECB and the national competent
authorities of participating EU countries. From the perspective of this paper, the SSM
should help to combat the “banking nationalism” which hitherto fostered national
champions and contributed to the EU’s bank bias.
In July 2014, the bank recovery and resolution directive (BRRD) entered into force.
From 2016, the BRRD grants authorities the power to “bail-in” the eligible liabilities
(including unsecured creditors) of banks subject to resolution. Moreover, resolution
authorities will have substantial powers to intervene ex ante in banks which they
deem irresolvable. This should help reduce the TBTF subsidy given to EU banks.
In August 2014, a regulation establishing a Single Resolution Mechanism (SRM)
entered into force. The SRM establishes a resolution authority in the euro area, and
therefore will complement the SSM. As part of the SRM regulation, a Single
Resolution Fund, financed ex ante by banks, will help to provide “bridge financing”
for resolved banks. However, the resolution mechanism is extremely complex, and
the resolution fund will not reach its target level of 1% of insured bank deposits until
2023.
These four policy innovations – CRD, SSM, BRRD and SRM – are necessary steps towards
a healthy financial structure in the EU. Higher bank capital requirements under the CRD will
reduce the probability of bank failure, while resolution powers stemming from the BRRD
ensure that resolution authorities will be able to respond in the event of bank failure. In the
euro area, the establishment of the SRM is essential for the SSM to be effective: historically,
one of the key impediments to effective prudential supervision in Europe has been the absence
of resolution powers.
Though necessary, these reforms are unlikely to be sufficient to adequately reduce
Europe’s bank bias. In particular, the effectiveness of the Single Resolution Mechanism faces
three challenges. First, the SRM entrusts the decision to resolve a bank to many authorities –
BANK BIAS IN EUROPE
27
the ECB (as prudential supervisor), the Board of the SRM (which comprises five full-time
members and representatives from national resolution authorities), the EU Commission and
the EU Council – but leaves implementation to national authorities. Second, the Single
Resolution Fund might have limited capacity to support the resolution of a systemically
important financial institution (Gordon and Ringe, 2014), particularly before 2023. Third, the
EU resolution mechanism is not complemented by a centralised deposit insurance mechanism,
unlike the FDIC in the US: hence, bank runs could occur in countries where banks are
perceived as distressed, as depositors try to move their deposits to banks in countries with
more reliable legal arrangements. Such behaviour could interfere with the orderly resolution
of a distressed bank. These three challenges – the complexity of the resolution mechanism;
the potentially insufficient scale of its funding; and the absence of a centralised deposit
insurance mechanism – could therefore hinder the prompt and orderly resolution of large,
systemically important banks in the EU.
A more direct and potentially effective correction of Europe’s bank bias may come
from “structural reform” of the EU banking system. The EU Commission has put forward a
proposal (published in January 2014) for legislation that aims to separate the lending activity
of banks from their security trading activity, with the aim of limiting their risk exposure and
controlling systemic risk. The separation would apply only to banks of global systemic
importance or beyond a certain size. The proposal would also ban banks’ proprietary trading,
in the narrow sense of trading specifically dedicated to taking positions for making a profit
for the bank’s own account. This proposal would help to reduce both the size of the largest
banks and their risk-taking in securities markets. Separation would effectively eliminate the
ability of large universal banks to fund their trading activities at interest rates that benefit from
the public subsidies associated with their deposit-taking activities. This cross-subsidy raises
large universal banks’ incentives to take excessive risk in securities markets. Structural reform
targeted at the largest banks would reduce Europe’s bank bias by shrinking large banks’
security trading activities, while at the same time mitigating the systemic risk that these banks
tend to generate, as shown by the estimations in Section 4.
To complement structural reform targeted at the largest and most systemically
relevant banks, the EU could also implement a more aggressive anti-trust policy. This would
help to address Europe’s bank-bias problem, which arose owing to the growth of its largest
banks. Aggressive anti-trust policy would also curtail national governments’ tendencies to
protect and nurture “national champions” to the detriment of foreign competitors. Such
policies would operate in synergy with the Single Supervisory Mechanism (SSM), which
already creates greater distance between the supervisor and the largest banks, as compared
with the status quo ante. Historically, EU competition policy has been only weakly applied to
banks, except in some cases of conditional state aid approvals and cross-border acquisitions.
This reflects the fact that the EU Commission has limited powers: unlike, for example, UK
competition authorities, the Commission cannot address market structure issues, intervening
whenever it detects excessive market power. Moreover, unlike the US, the EU has no hard
BANK BIAS IN EUROPE
28
ceiling on the maximum size of a single bank.13 Hence, a more aggressive anti-trust policy is
only possible if the powers of the EU Commission in this area are considerably strengthened.
7.2. Supporting the Development of Securities Markets
Reducing Europe’s bank bias need not reduce European firms and households’ access to
external funding if policymakers simultaneously encourage the development of security
markets (including the stock market, the corporate bond market, and markets for asset-backed
securities) and other non-bank funding sources. Indeed, the results presented in Section 4
suggest that a more balanced financial structure would support economic growth by
improving access to external funding, particularly during large asset price declines when
banks tend to retrench.
Supporting the development of securities markets is a key objective of the Juncker
Commission, which began its five-year term in November 2014. To this end, the Commission
has pledged to deliver a “capital markets union” (Hill, 2014), complementing the newly
established “banking union”, which comprises the Single Supervisory Mechanism and Single
Resolution Mechanism described in Section 6.1. The capital markets union is explicitly
intended to “reduce the very high dependence on bank funding” which prevails in Europe
(Juncker, 2014). The evidence presented in Sections 3 and 4 provides strong support for this
goal of reducing Europe’s bank bias.
How should policymakers design the capital markets union to achieve maximum
effect? Unlike the banking union, which is comprised of two key pillars (the SSM and SRM),
the capital markets union requires a multiplicity of policy reforms in order to provide
sufficient impetus to the development of securities markets. In what follows, we highlight
some key reforms that can be expected to support the development of the stock market, the
corporate bond market, and markets for asset-backed securities. Some of these reforms are
outlined in a Green Paper on “Building a Capital Markets Union”, presented by the EU
Commission in February 2015.
To develop the issuance of equity, policymakers could address the current
fragmentation of stock exchanges in Europe. Unlike the US, which is served by the NYSE
and NASDAQ, there is no stock exchange which serves the whole of Europe. Euronext –
covering the Netherlands, France, Belgium and Portugal – is the only large multinational
exchange. Fragmentation inhibits market liquidity – and thereby discourages issuance of new
equity – for three reasons (Foucault, Pagano and Roell, 2013): first, fragmentation confers an
advantage to informed investors, who have access to multiple exchanges, and therefore
increases these investors’ informational rents; second, fragmentation implies that several
prices are quoted simultaneously, increasing search costs; and third, fragmentation prevents
investors from taking full advantage of the “thick market externalities” arising from the fact
that each additional market participant increases liquidity for all other traders (Pagano, 1989).
13 US law prevents a bank from acquiring other banks after it has exceeded 10% of US deposits (see the Riegle-Neal Interstate Banking and Branching Efficiency Act of 1994). However, the law does not prohibit banks from exceeding the 10% ceiling through organic deposit growth. Indeed, three (nearly four) US banks currently exceed the 10% threshold.
BANK BIAS IN EUROPE
29
However, favouring the consolidation of Europe’s stock trading platforms is unlikely to be
the best policy response to such fragmentation, as it would result in a lack of competition
(Foucault and Menkveld, 2008): in the extreme, monopoly rents could erode all efficiency
gains from consolidation. A more efficient policy would be to link markets together so that
trades for a given security always occur at the best possible price. This is the approach adopted
in the US with Regulation NMS, where the so-called “trade-through rule” obliges any trading
platform to reroute marketable limit orders to the platform posting the best price for the
execution of this order when it is submitted. Of course, this approach also has its drawbacks,
as it emphasises the quality rather than the speed of order execution, whereas some investors
(such as high-frequency traders) value the latter more than the former. But the approach would
allow competing platforms to be integrated in a single network, and hence to effectively
behave as a single stock market.
However, an integrated, hence highly liquid, pan-European stock market might still
fall short of its potential if the number of listed companies remains limited. Policymakers’
attention should therefore also address the obstacles that prevent small and medium sized
enterprises’ (SMEs’) access to initial public offerings (IPOs). Currently, stock exchanges are
generally not well geared towards SMEs, since fixed costs associated with IPOs and
subsequent listing requirements are relatively high. Some specialised exchanges attempt to
limit fixed costs by limiting pre-IPO filing requirements, but equity issuance via such
exchanges is still relatively limited.14 To further reduce the fixed costs of IPOs for smaller
firms, policymakers could explore how to simplify the prospectuses that firms must file before
an IPO, streamline its approval process, and even relax disclosure and audit requirements on
certain listed firms.15 Moreover, the deep-seated cultural reluctance of many small European
firms to go public could justify initial subsidies or preferential treatment in order to provide
impetus for the development of specialised stock exchanges. This would also encourage the
development of the financial “ecosystem” that complements stock exchanges, which has
deteriorated in Europe in the past decade – namely venture capital firms for potential future
issuers; advisory services for issuers; auditors for listed firms; and third-party
assessors/analysts, brokers and market-makers for investors (Giovannini and Moran, 2013).
The issuance of corporate bonds, including covered bonds, could be increased by
encouraging the standardisation of issuance, including of characteristics such as coupons and
maturities. This would permit existing issues to be reopened, rather than creating new bespoke
securities – thus reducing the number of distinct bonds. If such reopening were to occur via
auctions, issuers would also save underwriting fees, thereby reducing the “barrier to entry”
which prevents many medium-sized firms in Europe from raising external funding via bond
issuance. Moreover, the standardisation of maturity dates and their alignment with bond
futures and credit derivatives would facilitate hedging (CGFS, 2014). The liquidity of
corporate bond markets may be further enhanced by transforming them from over-the-counter
14 In Germany, the Neuer Markt – an attempt by Deutsche Börse to facilitate IPOs for SMEs with high growth potential –closed in 2003. Its more successful British cousin – LSE’s AIM – has 1,099 listed firms with a total market cap of £72bn (as of November 2014), but just 12 of these firms (with total market cap of less than £1bn) are incorporated in continental Europe (i.e. outside of Britain and Ireland) – so this is a negligible source of external finance for continental European SMEs. 15 For example, disclosure and audit requirements could be relaxed on firms classified in “SME growth markets”, as defined in Article 33 of the European Union’s Markets in Financial Instruments Directive (MIFID) II.
BANK BIAS IN EUROPE
30
(OTC) markets, which are typically decentralised, opaque and illiquid, to electronic limit-
order-book (LOB) markets, which are centralised, more transparent, and offer cheaper trade
execution. Standardisation would also be helpful to promote the marketing of bond issuances
to final investors. To improve transparency and comparability of credit risk across firms, a
common template for prospectuses could be used, as in the US (Dixon, 2014).
The non-bank financing of firms could also be encouraged by developing pan-
European private placement markets to provide private debt financing to unlisted companies
and to listed but unrated companies. Steps in this direction may include overcoming
discrepancies between national insolvency laws, and standardizing the processes,
documentation and information about issuers at EU level. The provision of non-bank
financing could also be greatly expanded by the development of bank loan mutual funds and
business development companies (BDCs), which in the US provide a sizeable portion of
medium-sized firms’ debt financing.16
Markets for asset-backed securities (ABS) represent another potential source of non-
bank funding. The credit underlying ABS is typically originated by banks, but the structured
and somewhat standardised nature of these securities permits tranches to be sold, typically
over-the-counter, to non-bank investors. ABS therefore expand the potential funding available
to firms and households, while retaining banks’ comparative advantage in originating loans.
Securitisation has gained a bad reputation from securities based on US sub-prime mortgages,
which collapsed in value over 2007 and 2008 as risks had been systematically underestimated
(Keys, Mukherjee, Seru and Vig, 2010). European ABS markets have not recovered since
2008 (Altomonte and Bussoli, 2014; Nassr and Wehinger, 2014) – even though structured
credit in Europe had much lower default rates than in the US over the crisis, according to the
ECB and Bank of England (2014).
Securitisation activity may have been subdued in part by the calibration of current
regulations – particularly the CRD IV package and Solvency II – which penalise holdings of
structured credit relative to other assets with similar risk characteristics. In addition, European
ABS markets may be held back by the bad track record developed by ABS in the US sub-
prime crisis. This reputational problem could be addressed by enhanced transparency and
comparability of risk characteristics across products and geographies (Segoviano et al, 2015).
Authorities could develop a data warehouse containing standardised and granular information
on firms’ credit risk – in the short-run by granting non-bank investors access to existing
national credit registers, and in the medium-run by developing a European credit register
accessible to both bank and non-bank investors (Almeida and Damia, 2014).
16 BDCs are permanent-life vehicles subject to a 1:1 debt-equity ratio limit and to diversification requirements. BDCs raise capital from both institutional and retail sources, and perform rigorous screening and monitoring of their borrowers. Beltratti, Bock and Nelson (2015) show that in terms of total return performance BDCs have outperformed most other asset classes, also on a risk-adjusted basis, and that during the crisis they performed much better than bond and loan indices.

BANK BIAS IN EUROPE
31
REFERENCES Acharya, Viral, Robert Engle and Matthew Richardson (2012). “Capital shortfall: A new approach to ranking and regulating systemic risks.” American Economic Review, 102.3: 59-64.
Acharya, Viral and Hassan Naqvi (2012). “The seeds of a crisis: A theory of bank liquidity and risk taking over the business cycle.” Journal of Financial Economics, 106(2): 349-366.
Admati, Anat and Martin Hellwig (2013). The Bankers’ New Clothes: What’s wrong with banking and what to do about it. Princeton University Press.
Admati, Anat, Peter DeMarzo, Martin Hellwig and Paul Pfleiderer (2014). “The leverage ratchet effect.” Working paper.
Adrian, Tobias, Paolo Colla and Hyun Song Shin (2012). “Which financial frictions? Parsing the evidence from the financial crisis of 2007-9.” NBER Working Paper No. 18335.
Afonso, Gara, João Santos and James Traina (2014). “Do ‘too-big-to-fail’ banks take on more risk?” Federal Reserve Bank of New York Economic Policy Review.
Allen, Franklin (1993). “Stock markets and resource allocation.” In: Capital Markets and Financial Intermediation, Colin Mayer and Xavier Vives (eds.). Cambridge University Press.
Allen, Franklin and Douglas Gale (1999). “Diversity of opinion and the financing of new technologies.” Journal of Financial Intermediation, 8: 68-89.
Allen, Franklin and Douglas Gale (2000). Comparing Financial Systems. MIT Press.
Almeida, Ana M de and Violetta Damia (2014). “Challenges and prospects for setting-up a European Union shared system on credit.” Irving Fisher Committee bulletin no.37: proceedings of the BIS Porto workshop on “Integrated management of micro-databases”.
Altnubas, Yener, Leonardo Gambacorta and David Marques Ibanez (2014). “Does monetary policy affect bank risk?” International Journal of Central Banking, 10(1): 95-135.
Altomonte, Carlo and Patrizia Bussoli (2014). “Asset-backed securities: The key to unlocking Europe’s credit markets?” Bruegel.
Basel Committee on Banking Supervision (BCBS) (2013). “Global systemically important banks: updated assessment methodology and the higher loss absorbency requirement.”
Beck, Thorsten, Berrak Buyukkarabacak, Felix Rioja and Neven Valev (2012). “Who gets the credit? And does it matter? Household vs. firm lending across countries.” The B.E. Journal of Macroeconomics, 12(1).
Beck, Thorsten, Aslı Demirgüç-Kunt and Ross Levine (2000). “A new database on financial development and structure.” World Bank Economic Review, 14: 597-605.
Beck, Thorsten, Hans Degryse, Ralph de Haas, and Neeltje van Horen (2014). “When arm’s length is too far: Relationship banking over the business cycle.” CentER Discussion Paper no. 2014-042.
Becker, Bo and Victoria Ivashina (2014). “Cyclicality of credit supply: firm level evidence.” Journal of Monetary Economics, 62: 76-93.
Beltratti, Andrea, Jonathan Bock, and Gregory Nelson (2015). “BDCs – The most important commercial lenders you’ve never heard about.” Working paper.
Berger, Allen N. and Gregory F. Udell (1995). “Relationship lending and lines of credit in small business finance.” Journal of Business, 68(3): 351-381.
Bernanke, Ben S. and Mark Gertler (1989). “Agency costs, net worth, and business fluctuations.” American Economic Review, 79(1): 14-31.
BANK BIAS IN EUROPE
32
Bernanke, Ben, Mark Gertler and Simon Gilchrist (1999). “The financial accelerator in a quantitative business cycle framework.” Handbook of Macroeconomics, volume 1, chapter 11, John B. Taylor and Michael Woodford (eds.), Elsevier.
Black, Bernard S. and Ronald J. Gilson (1998). “Venture capital and the structure of capital markets: Banks versus stock markets.” Journal of Financial Economics, 47(3): 243-277.
Boissay, Fréderic, Fabrice Colliard and Frank Smets (2014). “Booms and banking crises.” ECB Working Paper no. 1514.
Bolton, Patrick, Xavier Freixas, Leonardo Gambacorta, and Paolo E. Mistrulli (2013). “Relationship and transaction lending in a crisis.” Temi di Discussione no. 917, Bank of Italy.
Boot, Arnoud (2000). “Relationship banking: what do we know?” Journal of Financial Intermediation, 9(1): 7-25.
Brownlees, Christian and Robert F. Engle (2012). “Volatility, correlation and tails for systemic risk measurement.” Working paper.
Brunnermeier, Markus K. and Yuliy Sannikov (2012). “A macroeconomic model with a financial sector.” American Economic Review, 104(2): 379-421.
Caballero, Ricardo J., Takeo Hoshi and Anil K. Kashyap (2008). “Zombie lending and depressed restructuring in Japan.” American Economic Review, 98(5): 1943-1977.
Calomiris, Charles W. and Stephen H. Haber (2014). Fragile by Design: The Political Origins of Banking Crises and Scarce Credit. Princeton University Press.
Chakraborty, Indraneel, Itay Goldstein and Andrew MacKinlay (2014). “Do asset price booms have negative real effects?” Working paper.
Committee on the Global Financial System (CGFS) (2014). “Market-making and proprietary trading: industry trends, drivers and policy implications.” CGFS Paper No.52.
Constâncio, Vítor (2014). “Beyond traditional banking: a new credit system coming out of the shadows.” Speech at the 2nd Frankfurt Conference on Financial Market Policy: Banking Beyond Banks, organised by the SAFE Policy Center of Goethe University.
Cuñat, Vicente and Luis Garicano (2009). “Did good cajas extend bad loans? The role of governance and human capital in cajas’ portfolio decisions.” FEDEA monograph.
Dewatripont, Mathias and Eric Maskin (1995). “Credit and efficiency in centralized and decentralized economies.” Review of Economic Studies, 62: 541-555.
Diamond, Douglas (1991). “Monitoring and reputation: the choice between bank loans and directly placed debt.” Journal of Political Economy, 99(4): 689-721.
Disney, Richard, Jonathan Haskel and Ylva Heden (2003). “Restructuring and productivity growth in UK manufacturing.” Economic Journal, 113(489): 666-694.
Dixon, Hugo (2014). “Unlocking Europe’s capital markets union.” Centre for European Reform.
ECB (2014). “Banking structures report.” October.
EU Commission (2011). “The effects of temporary state aid rules adopted in the context of the financial and economic crisis.” Commission Staff Working Paper.
EU Commission (2015). “Building a capital markets union.” Green Paper.
European Systemic Risk Board Advisory Scientific Committee (2012). “Forbearance, resolution and deposit insurance.”
Foucault, Thierry and Albert J. Menkveld (2008). “Competition for order flow and smart order routing systems.” Journal of Finance, 63: 119-158.
Foucault, Thierry, Marco Pagano and Ailsa Roell (2013). Market Liquidity: Theory, Evidence and Policy. Oxford University Press.
BANK BIAS IN EUROPE
33
Gambacorta, Leonardo, Jing Yang and Kostas Tsatsaronis (2014). “Financial structure and growth.” BIS Quarterly Review, March.
Garicano, Luis (2012). “Five lessons from the Spanish cajas debacle for a new euro-wide supervisor.” Banking Union for Europe: 79.
Gennaioli, Nicola, Andrei Shleifer and Robert Vishny (2014). “Finance and the preservation of wealth.” Quarterly Journal of Economics, 129(3): 1221-1254.
Giesecke, Kay, Francis A. Longstaff, Stephen Schafer and Ilya A. Strebulaev (2014). “Macroeconomic effects of corporate default crisis: A long-term perspective.” Journal of Financial Economics, 111(2): 297-310.
Giovannini, Alberto and John Moran (2013). “Finance for growth.” Report of the High Level Expert Group on SME and Infrastructure Financing.
Gordon, Jeffrey N. and Wolf-Georg Ringe (2014). “Resolution in the European banking union: a transatlantic perspective on what it would take.” Oxford Legal Studies Research Paper No. 18/2014.
Grjebine, Thomas, Urszula Szczerbowics and Fabien Tripier (2014). “Corporate debt structure and economic recoveries.” Working paper.
Hau, Harald and Marcel P. Thum (2009). “Subprime crisis and board (in-)competence: Private vs. public banks in Germany.” Economic Policy, 24(60): 701-751.
He, Zhiguo and Arvind Krishnamurthy (2012). “A model of capital and crises.” Review of Economic Studies, 79(2): 735–777.
Hill, Jonathan (2014). “Capital markets union – finance serving the economy.” Speech.
Hoenig, Thomas M. (2013). “Basel III capital: A well-intended illusion.” Speech at the International Association of Deposit Insurers.
Honoré, Bo E. (1992). “Trimmed LAD and least squares estimation of truncated and censored regression models with fixed effects.” Econometrica, 60(3): 533-565.
Jassaud, Nadège (2014). “Reforming the corporate governance of Italian banks.” IMF Working Paper 14/181.
Jiménez, Gabriel, Steven Ongena, José-Luis Peydró, and Jesús Saurina (2014). “Hazardous times for monetary policy: what do 23 million loans say about the impact of monetary policy on credit risk-taking?” Econometrica, 82(2): 463-505.
Jordà, Òscar, Moritz Schularick and Alan M. Taylor (2014). “The great mortgaging: Housing finance, crises, and business cycles.” NBER Working Paper no. 20501.
Juncker, Jean-Claude (2014). “A new start for Europe: My agenda for jobs, growth, fairness and democratic change.” Opening statement in the European Parliament plenary session.
Keys, Benjamin J., Tanmoy Mukherjee, Amit Seru and Vikrant Vig (2010). “Did securitization lead to lax screening? Evidence from subprime loans.” Quarterly Journal of Economics, 125(1): 307-362.
Kiyotaki, Nobu and John Moore (1997). “Credit chains.” Journal of Political Economy, 105(21): 211-248.
Laeven, Luc, Lev Ratnovski and Hui Tong (2014). “Bank size and systemic risk.” IMF Staff Discussion Note, 14/04.
Lambert, Frederic J., Kenichi Ueda, Pragyan Deb, Dale F. Gray and Pierpaolo Grippa (2014). “How big is the implicit subsidy for banks considered too important to fail?” Chapter 3 in Global Financial Stability Report, International Monetary Fund, April.
Lane, Philip R. (2013). “Capital flows in the euro area.” EU Commission Economic Papers no.497.
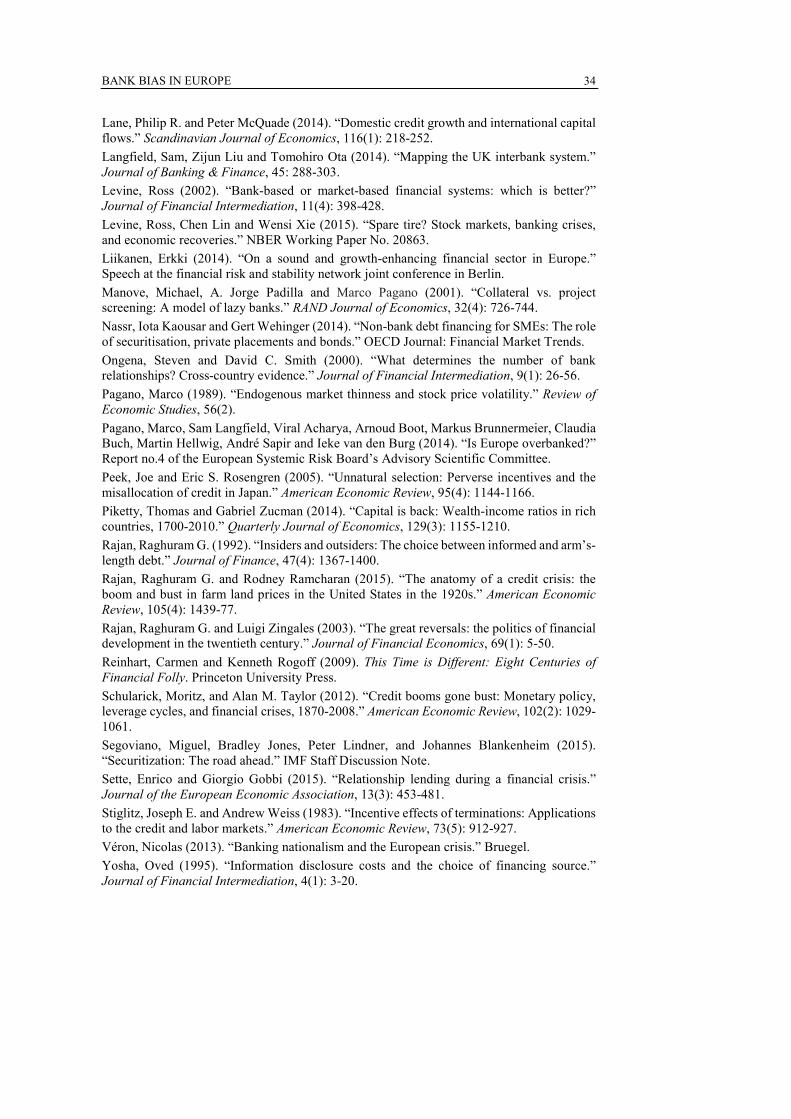
BANK BIAS IN EUROPE
34
Lane, Philip R. and Peter McQuade (2014). “Domestic credit growth and international capital flows.” Scandinavian Journal of Economics, 116(1): 218-252.
Langfield, Sam, Zijun Liu and Tomohiro Ota (2014). “Mapping the UK interbank system.” Journal of Banking & Finance, 45: 288-303.
Levine, Ross (2002). “Bank-based or market-based financial systems: which is better?” Journal of Financial Intermediation, 11(4): 398-428.
Levine, Ross, Chen Lin and Wensi Xie (2015). “Spare tire? Stock markets, banking crises, and economic recoveries.” NBER Working Paper No. 20863.
Liikanen, Erkki (2014). “On a sound and growth-enhancing financial sector in Europe.” Speech at the financial risk and stability network joint conference in Berlin.
Manove, Michael, A. Jorge Padilla and Marco Pagano (2001). “Collateral vs. project screening: A model of lazy banks.” RAND Journal of Economics, 32(4): 726-744.
Nassr, Iota Kaousar and Gert Wehinger (2014). “Non-bank debt financing for SMEs: The role of securitisation, private placements and bonds.” OECD Journal: Financial Market Trends.
Ongena, Steven and David C. Smith (2000). “What determines the number of bank relationships? Cross-country evidence.” Journal of Financial Intermediation, 9(1): 26-56.
Pagano, Marco (1989). “Endogenous market thinness and stock price volatility.” Review of Economic Studies, 56(2).
Pagano, Marco, Sam Langfield, Viral Acharya, Arnoud Boot, Markus Brunnermeier, Claudia Buch, Martin Hellwig, André Sapir and Ieke van den Burg (2014). “Is Europe overbanked?” Report no.4 of the European Systemic Risk Board’s Advisory Scientific Committee.
Peek, Joe and Eric S. Rosengren (2005). “Unnatural selection: Perverse incentives and the misallocation of credit in Japan.” American Economic Review, 95(4): 1144-1166.
Piketty, Thomas and Gabriel Zucman (2014). “Capital is back: Wealth-income ratios in rich countries, 1700-2010.” Quarterly Journal of Economics, 129(3): 1155-1210.
Rajan, Raghuram G. (1992). “Insiders and outsiders: The choice between informed and arm’s-length debt.” Journal of Finance, 47(4): 1367-1400.
Rajan, Raghuram G. and Rodney Ramcharan (2015). “The anatomy of a credit crisis: the boom and bust in farm land prices in the United States in the 1920s.” American Economic Review, 105(4): 1439-77.
Rajan, Raghuram G. and Luigi Zingales (2003). “The great reversals: the politics of financial development in the twentieth century.” Journal of Financial Economics, 69(1): 5-50.
Reinhart, Carmen and Kenneth Rogoff (2009). This Time is Different: Eight Centuries of Financial Folly. Princeton University Press.
Schularick, Moritz, and Alan M. Taylor (2012). “Credit booms gone bust: Monetary policy, leverage cycles, and financial crises, 1870-2008.” American Economic Review, 102(2): 1029-1061.
Segoviano, Miguel, Bradley Jones, Peter Lindner, and Johannes Blankenheim (2015). “Securitization: The road ahead.” IMF Staff Discussion Note.
Sette, Enrico and Giorgio Gobbi (2015). “Relationship lending during a financial crisis.” Journal of the European Economic Association, 13(3): 453-481.
Stiglitz, Joseph E. and Andrew Weiss (1983). “Incentive effects of terminations: Applications to the credit and labor markets.” American Economic Review, 73(5): 912-927.
Véron, Nicolas (2013). “Banking nationalism and the European crisis.” Bruegel.
Yosha, Oved (1995). “Information disclosure costs and the choice of financing source.” Journal of Financial Intermediation, 4(1): 3-20.
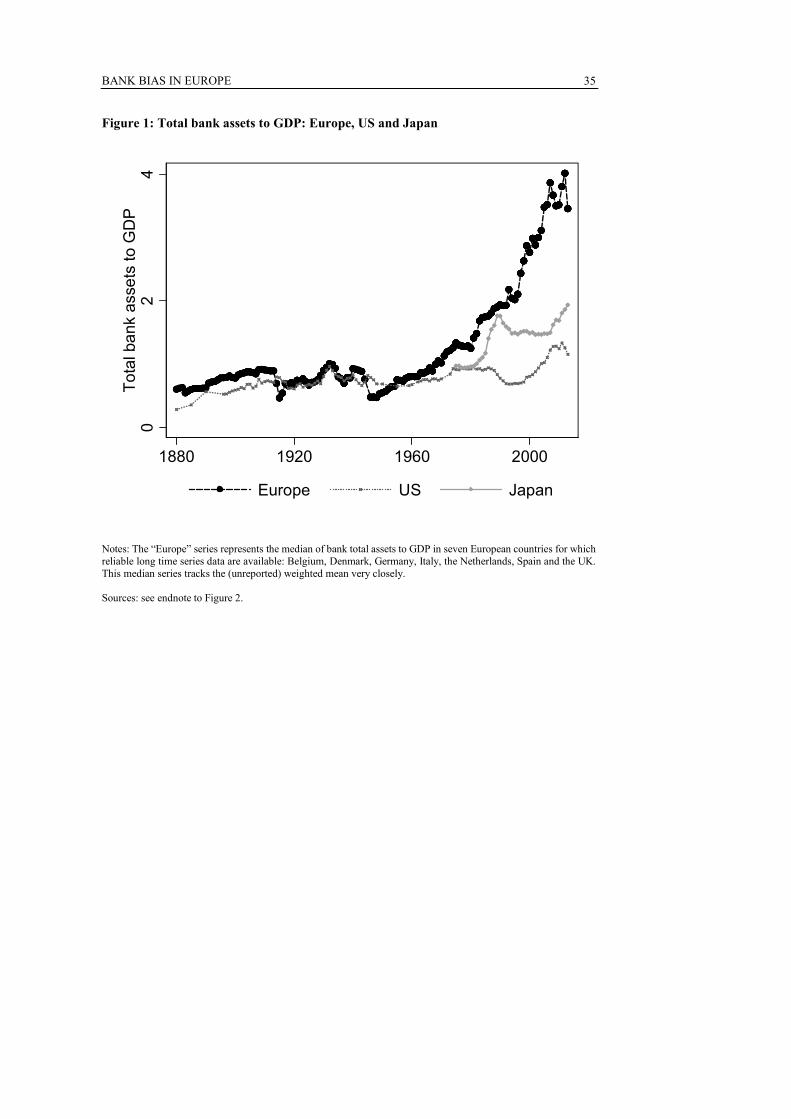
BANK BIAS IN EUROPE
35
Figure 1: Total bank assets to GDP: Europe, US and Japan
Notes: The “Europe” series represents the median of bank total assets to GDP in seven European countries for which reliable long time series data are available: Belgium, Denmark, Germany, Italy, the Netherlands, Spain and the UK. This median series tracks the (unreported) weighted mean very closely. Sources: see endnote to Figure 2.
02
4T
ota
l ba
nk
ass
ets
to G
DP
1880 1920 1960 2000
Europe US Japan
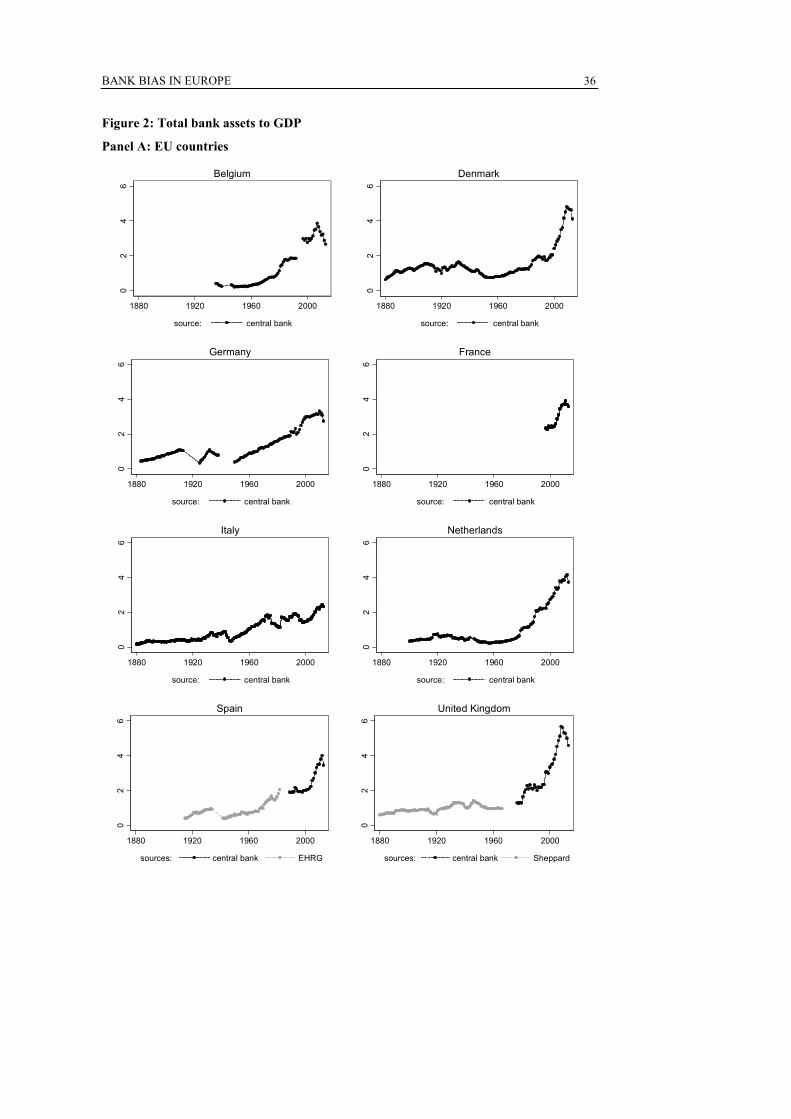
BANK BIAS IN EUROPE
36
Figure 2: Total bank assets to GDP
Panel A: EU countries
02
46
1880 1920 1960 2000
source: central bank
Belgium
02
46
1880 1920 1960 2000
source: central bank
Denmark
02
46
1880 1920 1960 2000
source: central bank
Germany0
24
6
1880 1920 1960 2000
source: central bank
France
02
46
1880 1920 1960 2000
source: central bank
Italy
02
46
1880 1920 1960 2000
source: central bank
Netherlands
02
46
1880 1920 1960 2000
sources: central bank EHRG
Spain
02
46
1880 1920 1960 2000
sources: central bank Sheppard
United Kingdom
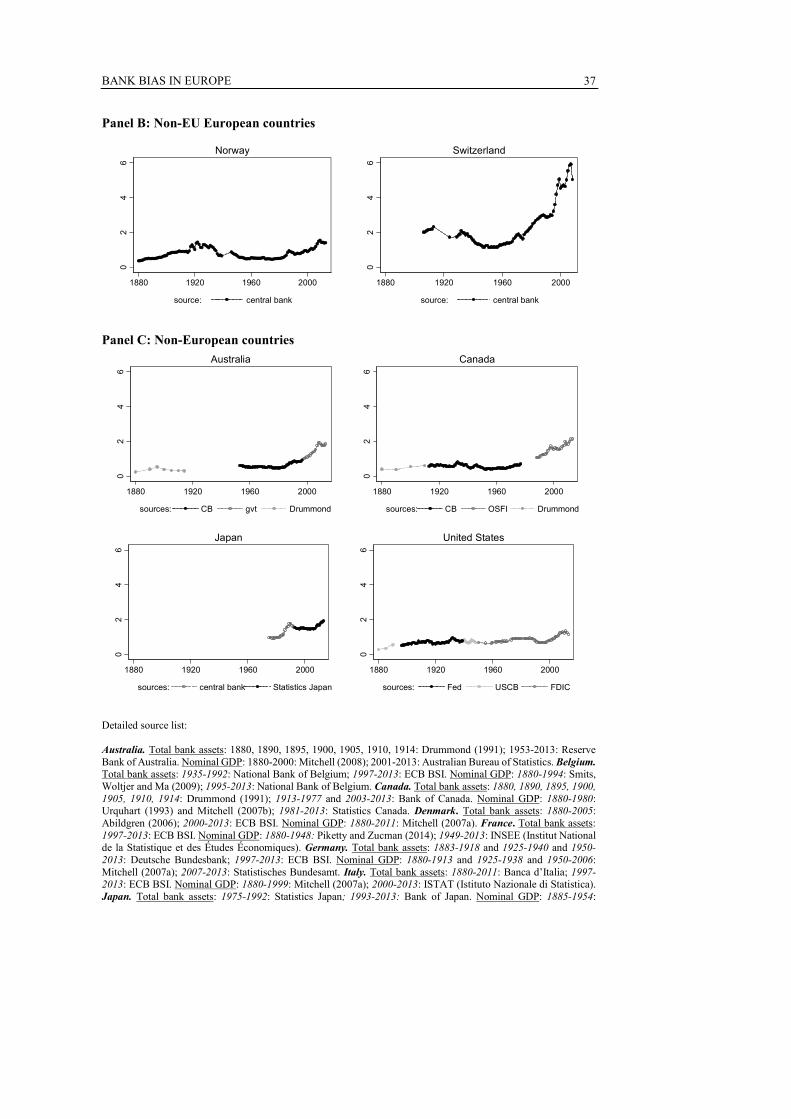
BANK BIAS IN EUROPE
37
Panel B: Non-EU European countries
Panel C: Non-European countries
Detailed source list: Australia. Total bank assets: 1880, 1890, 1895, 1900, 1905, 1910, 1914: Drummond (1991); 1953-2013: Reserve Bank of Australia. Nominal GDP: 1880-2000: Mitchell (2008); 2001-2013: Australian Bureau of Statistics. Belgium. Total bank assets: 1935-1992: National Bank of Belgium; 1997-2013: ECB BSI. Nominal GDP: 1880-1994: Smits, Woltjer and Ma (2009); 1995-2013: National Bank of Belgium. Canada. Total bank assets: 1880, 1890, 1895, 1900, 1905, 1910, 1914: Drummond (1991); 1913-1977 and 2003-2013: Bank of Canada. Nominal GDP: 1880-1980: Urquhart (1993) and Mitchell (2007b); 1981-2013: Statistics Canada. Denmark. Total bank assets: 1880-2005: Abildgren (2006); 2000-2013: ECB BSI. Nominal GDP: 1880-2011: Mitchell (2007a). France. Total bank assets: 1997-2013: ECB BSI. Nominal GDP: 1880-1948: Piketty and Zucman (2014); 1949-2013: INSEE (Institut National de la Statistique et des Études Économiques). Germany. Total bank assets: 1883-1918 and 1925-1940 and 1950-2013: Deutsche Bundesbank; 1997-2013: ECB BSI. Nominal GDP: 1880-1913 and 1925-1938 and 1950-2006: Mitchell (2007a); 2007-2013: Statistisches Bundesamt. Italy. Total bank assets: 1880-2011: Banca d’Italia; 1997-2013: ECB BSI. Nominal GDP: 1880-1999: Mitchell (2007a); 2000-2013: ISTAT (Istituto Nazionale di Statistica). Japan. Total bank assets: 1975-1992: Statistics Japan; 1993-2013: Bank of Japan. Nominal GDP: 1885-1954:
02
46
1880 1920 1960 2000
source: central bank
Norway
02
46
1880 1920 1960 2000
source: central bank
Switzerland
02
46
1880 1920 1960 2000
sources: CB gvt Drummond
Australia0
24
6
1880 1920 1960 2000
sources: CB OSFI Drummond
Canada
02
46
1880 1920 1960 2000
sources: central bank Statistics Japan
Japan
02
46
1880 1920 1960 2000
sources: Fed USCB FDIC
United States

BANK BIAS IN EUROPE
38
Mitchell (2008); 1955-1993: Japanese Statistics Bureau; 1994-2013: Japanese Cabinet Office. Netherlands. Total bank assets: 1900-2013: De Nederlandsche Bank; 1997-2013: ECB BSI. Nominal GDP: 1900-2013: De Nederlandsche Bank. Norway. Total bank assets: 1880-2013: Norges Bank. Nominal GDP: 1880-2013: Grytten (2004). Spain. Total bank assets: 1915-1934 and 1942-2000: Economic History Research Group (EHRG). 1997-2013: ECB BSI. Nominal GDP: 1880-1958: Prados de la Escosura (2003); 1959-1994: Mitchell (2007a); 1995-2013: Instituto Nacional de Estadística. Switzerland. Total bank assets: 1906-2008: Swiss National Bank. Nominal GDP: 1880-1913 and 1924 and 1929-2011: Halbeisen, Müller and Veyrassat (2012). United Kingdom. Total bank assets: 1880-1966: Sheppard (1971); 1977-2013: Bank of England. Nominal GDP: 1880-1976: Bank of England; 1977-2013: Office for National Statistics. United States. Total bank assets: 1880, 1885, 1890: ‘Statistical Abstract of the United States’; 1896-1939: ‘All-bank Statistics, United States, 1896-1955’, Board of Governors of the Federal Reserve System; 1940-1949: ‘Statistical Abstract of the United States’; 1950-1983: ‘Statistical Abstract of the United States’ and FDIC; 1984-2013: FDIC. Nominal GDP: 1880-1928: Carter et al (2006); 1929-2013: Bureau of Economic Analysis. References for historical total assets and GDP data
Abildgren, Kim (2006), “Monetary trends and business cycles in Denmark 1875-2005.” Danmarks Nationalbank Working Papers, No. 43.
Carter, Susan B., Scott Sigmund Gartner, Michael R. Haines, Alan L. Olmstead, Richard Sutch and Gavin Wright (eds.) (2006). Historical Statistics of the United States: Millennial Edition, vol.3.
Drummond, Ian M. (1991). “Banks and banking in Canada and Australia.” In Rondo Cameron and V.I. Bovykin (eds.), International Banking 1870-1914.
Grytten, O.H. (2004). “The gross domestic product for Norway 1830-2003.” Chapter 6 in Ø. Eitrheim, J.T. Klovland and J.F. Qvigstad (eds.), Historical Monetary Statistics for Norway 1819-2003, Norges Bank Occasional Paper no. 35.
Grossman, Richard S. (2010). “US Banking History, Civil War to World War II.” Economic History Association.
Grytten, O.H. (2004). “The gross domestic product for Norway 1830-2003.” Chapter 6 in Ø. Eitrheim, J.T. Klovland and J.F. Qvigstad (eds.). Historical Monetary Statistics for Norway 1819-2003, Norges Bank Occasional Papers no. 35.
Halbeisen, Patrick, Margrit Müller and Béatrice Veyrassat (2012). “Wirtschaftsgeschichte der Schweiz im 20. Jahrhundert.” Schwabe Verlag Basel.
Mitchell, Brian R. (2007a). International Historical Statistics 1750-2005: Europe. Palgrave Macmillan.
Mitchell, Brian R. (2007b). International Historical Statistics 1750-2005: Americas. Palgrave Macmillan.
Mitchell, Brian R. (2008). International Historical Statistics: Africa, Asia and Oceania, 1750-2005. Palgrave Macmillan.
Prados de la Escosura, L. (2003). “El Progreso Económico de España, 1850-2000.” Bilbao: Fundación BBVA.
Sheppard, David K. (1971). The Growth and Role of UK Financial Institutions 1880-1962. Methuen.
Smits, Jan-Pieter, Pieter Woltjer and Debin Ma (2009). “A dataset on comparative historical national accounts, ca. 1870-1950.” University of Groningen research memorandum.
Urquhart, M. C. (1993). Gross National Product, Canada, 1870-1926: The Derivation of the Estimates. McGill-Queen’s University Press.
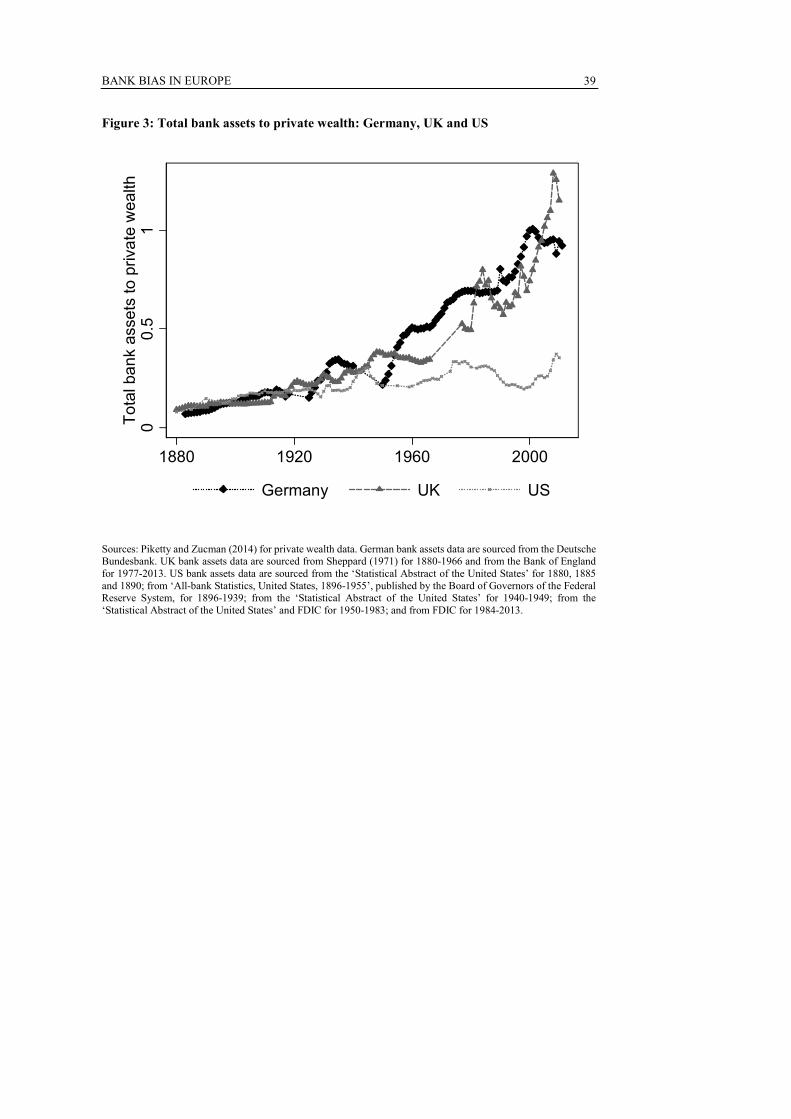
BANK BIAS IN EUROPE
39
Figure 3: Total bank assets to private wealth: Germany, UK and US
Sources: Piketty and Zucman (2014) for private wealth data. German bank assets data are sourced from the Deutsche Bundesbank. UK bank assets data are sourced from Sheppard (1971) for 1880-1966 and from the Bank of England for 1977-2013. US bank assets data are sourced from the ‘Statistical Abstract of the United States’ for 1880, 1885 and 1890; from ‘All-bank Statistics, United States, 1896-1955’, published by the Board of Governors of the Federal Reserve System, for 1896-1939; from the ‘Statistical Abstract of the United States’ for 1940-1949; from the ‘Statistical Abstract of the United States’ and FDIC for 1950-1983; and from FDIC for 1984-2013.
00.5
1T
ota
l ba
nk
ass
ets
to p
riva
te w
ealth
1880 1920 1960 2000
Germany UK US
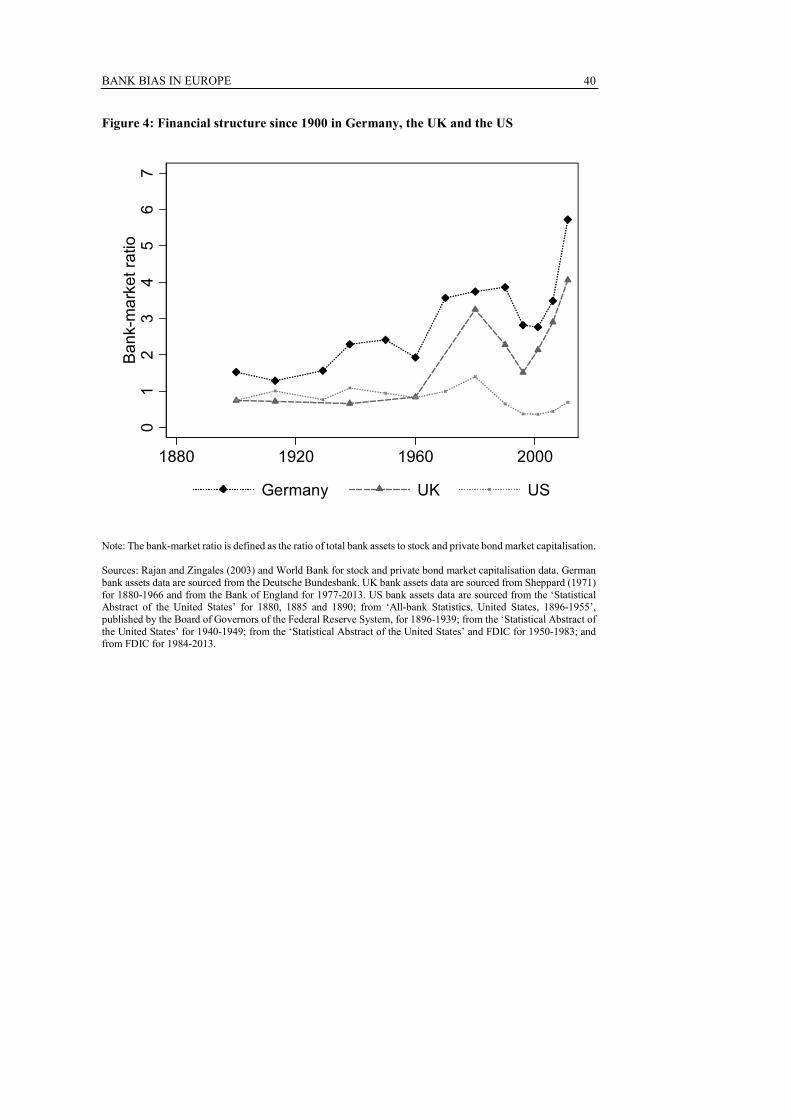
BANK BIAS IN EUROPE
40
Figure 4: Financial structure since 1900 in Germany, the UK and the US
Note: The bank-market ratio is defined as the ratio of total bank assets to stock and private bond market capitalisation. Sources: Rajan and Zingales (2003) and World Bank for stock and private bond market capitalisation data. German bank assets data are sourced from the Deutsche Bundesbank. UK bank assets data are sourced from Sheppard (1971) for 1880-1966 and from the Bank of England for 1977-2013. US bank assets data are sourced from the ‘Statistical Abstract of the United States’ for 1880, 1885 and 1890; from ‘All-bank Statistics, United States, 1896-1955’, published by the Board of Governors of the Federal Reserve System, for 1896-1939; from the ‘Statistical Abstract of the United States’ for 1940-1949; from the ‘Statistical Abstract of the United States’ and FDIC for 1950-1983; and from FDIC for 1984-2013.
01
23
45
67
Ba
nk-
ma
rket ra
tio
1880 1920 1960 2000
Germany UK US
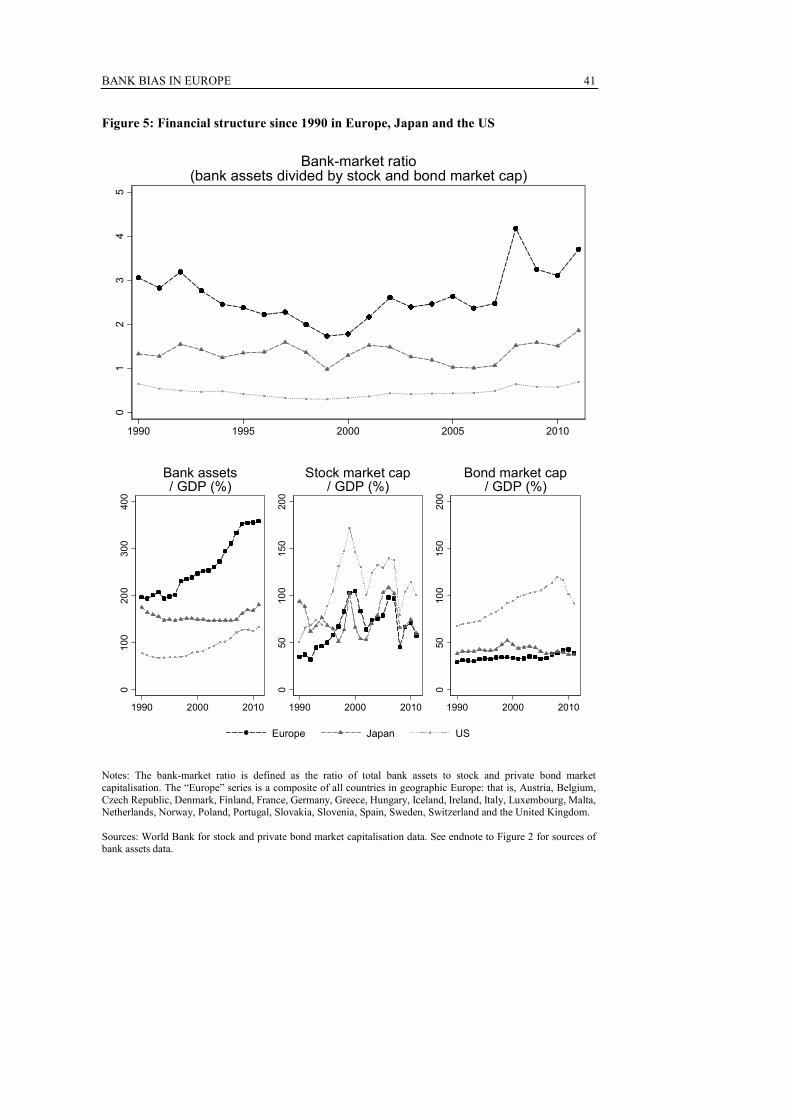
BANK BIAS IN EUROPE
41
Figure 5: Financial structure since 1990 in Europe, Japan and the US
Notes: The bank-market ratio is defined as the ratio of total bank assets to stock and private bond market capitalisation. The “Europe” series is a composite of all countries in geographic Europe: that is, Austria, Belgium, Czech Republic, Denmark, Finland, France, Germany, Greece, Hungary, Iceland, Ireland, Italy, Luxembourg, Malta, Netherlands, Norway, Poland, Portugal, Slovakia, Slovenia, Spain, Sweden, Switzerland and the United Kingdom. Sources: World Bank for stock and private bond market capitalisation data. See endnote to Figure 2 for sources of bank assets data.
01
23
45
1990 1995 2000 2005 2010
Bank-market ratio(bank assets divided by stock and bond market cap)
01
00
20
03
00
40
0
1990 2000 2010
Bank assets/ GDP (%)
050
10
01
50
20
0
1990 2000 2010
Stock market cap/ GDP (%)
050
10
01
50
20
0
1990 2000 2010
Bond market cap/ GDP (%)
Europe Japan US
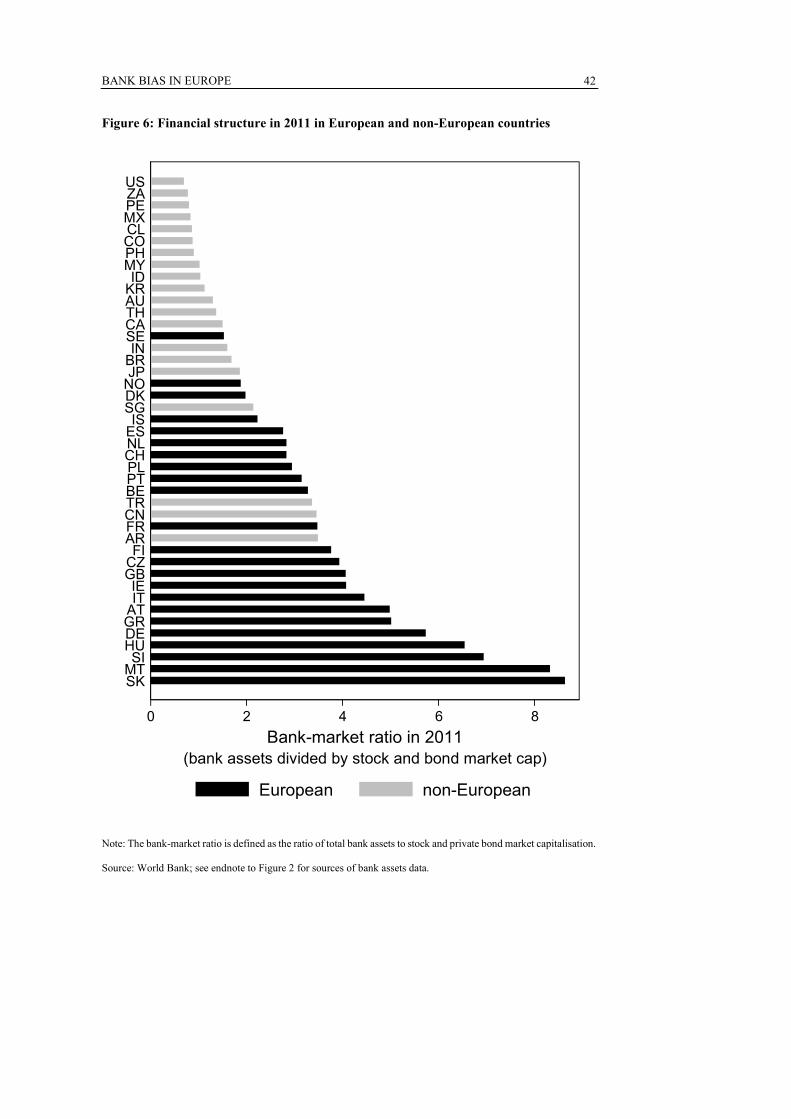
BANK BIAS IN EUROPE
42
Figure 6: Financial structure in 2011 in European and non-European countries
Note: The bank-market ratio is defined as the ratio of total bank assets to stock and private bond market capitalisation. Source: World Bank; see endnote to Figure 2 for sources of bank assets data.
0 2 4 6 8
SKMTSI
HUDEGRATITIE
GBCZFI
ARFRCNTRBEPTPLCHNLESIS
SGDKNOJPBRIN
SECATHAUKRID
MYPHCOCLMXPEZAUS
Bank-market ratio in 2011(bank assets divided by stock and bond market cap)
European non-European
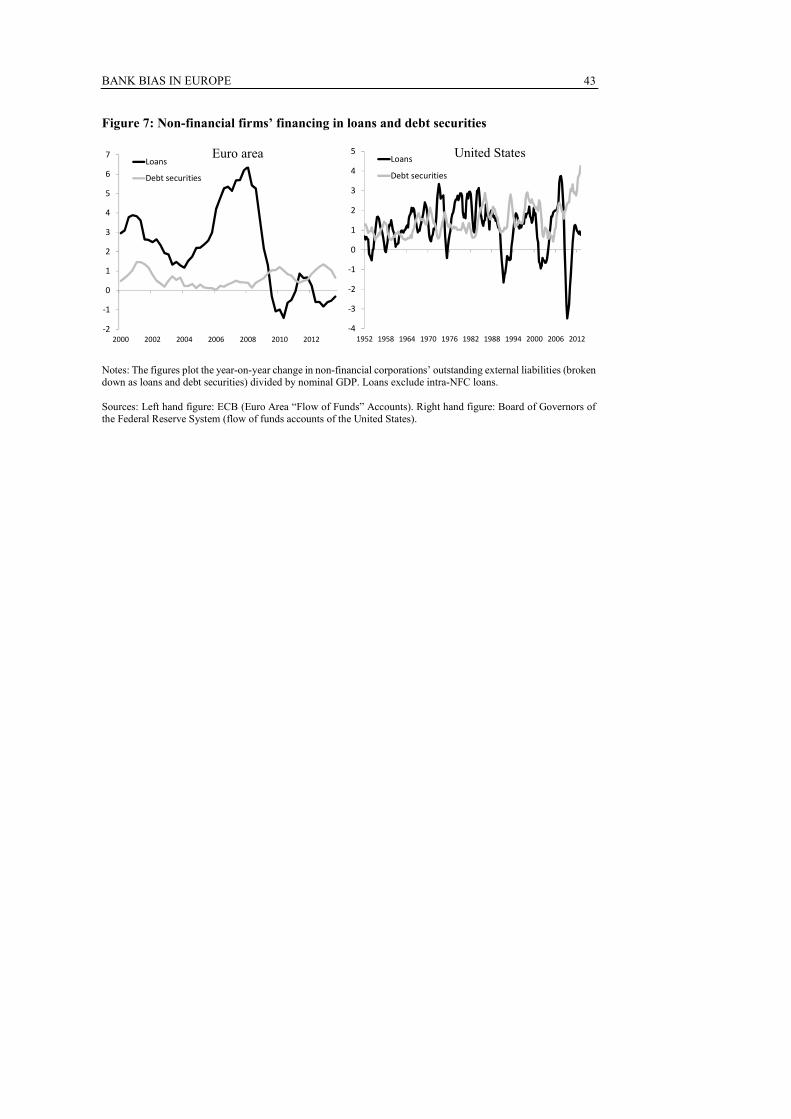
BANK BIAS IN EUROPE
43
Figure 7: Non-financial firms’ financing in loans and debt securities
Notes: The figures plot the year-on-year change in non-financial corporations’ outstanding external liabilities (broken down as loans and debt securities) divided by nominal GDP. Loans exclude intra-NFC loans. Sources: Left hand figure: ECB (Euro Area “Flow of Funds” Accounts). Right hand figure: Board of Governors of the Federal Reserve System (flow of funds accounts of the United States).
-2
-1
0
1
2
3
4
5
6
7
2000 2002 2004 2006 2008 2010 2012
Loans
Debt securities
-4
-3
-2
-1
0
1
2
3
4
5
1952 1958 1964 1970 1976 1982 1988 1994 2000 2006 2012
Loans
Debt securities
United States Euro area
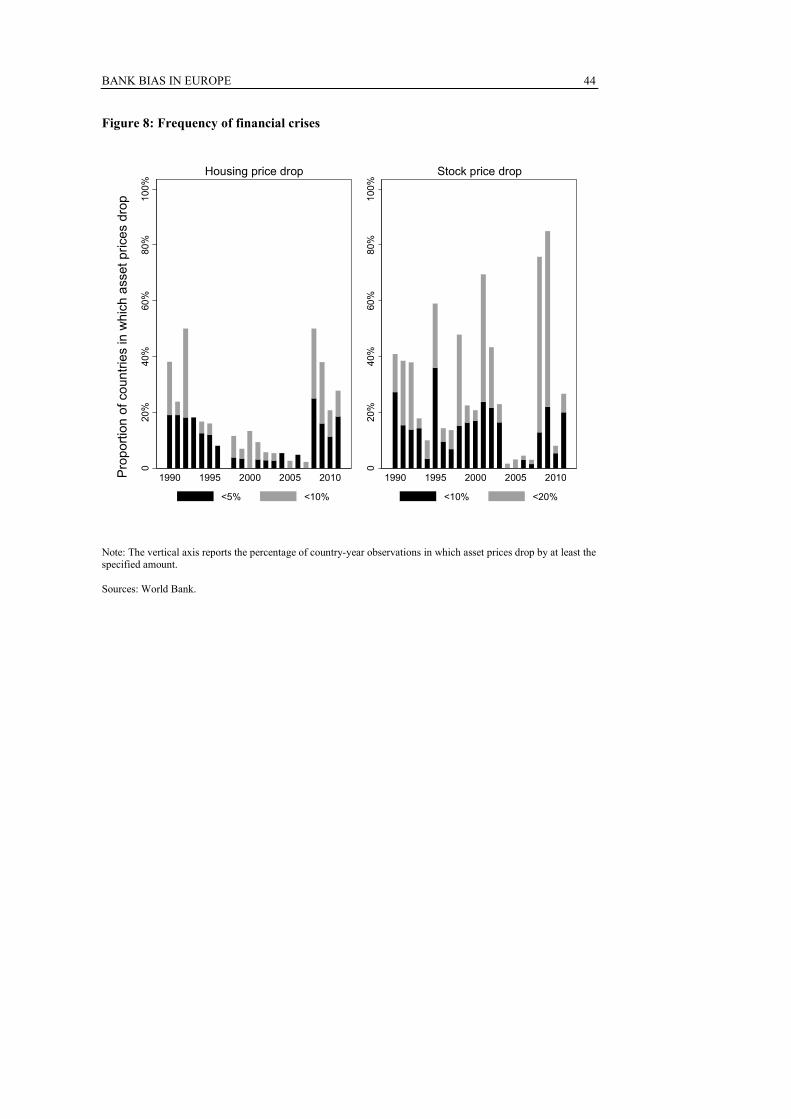
BANK BIAS IN EUROPE
44
Figure 8: Frequency of financial crises
Note: The vertical axis reports the percentage of country-year observations in which asset prices drop by at least the specified amount. Sources: World Bank.
020
%4
0%
60
%8
0%
10
0%
1990 1995 2000 2005 2010
Housing price drop
<5% <10%
020
%4
0%
60
%8
0%
10
0%
1990 1995 2000 2005 2010
Stock price drop
<10% <20%
Pro
po
rtio
n o
f co
un
trie
s in
wh
ich
ass
et
pri
ces
dro
p
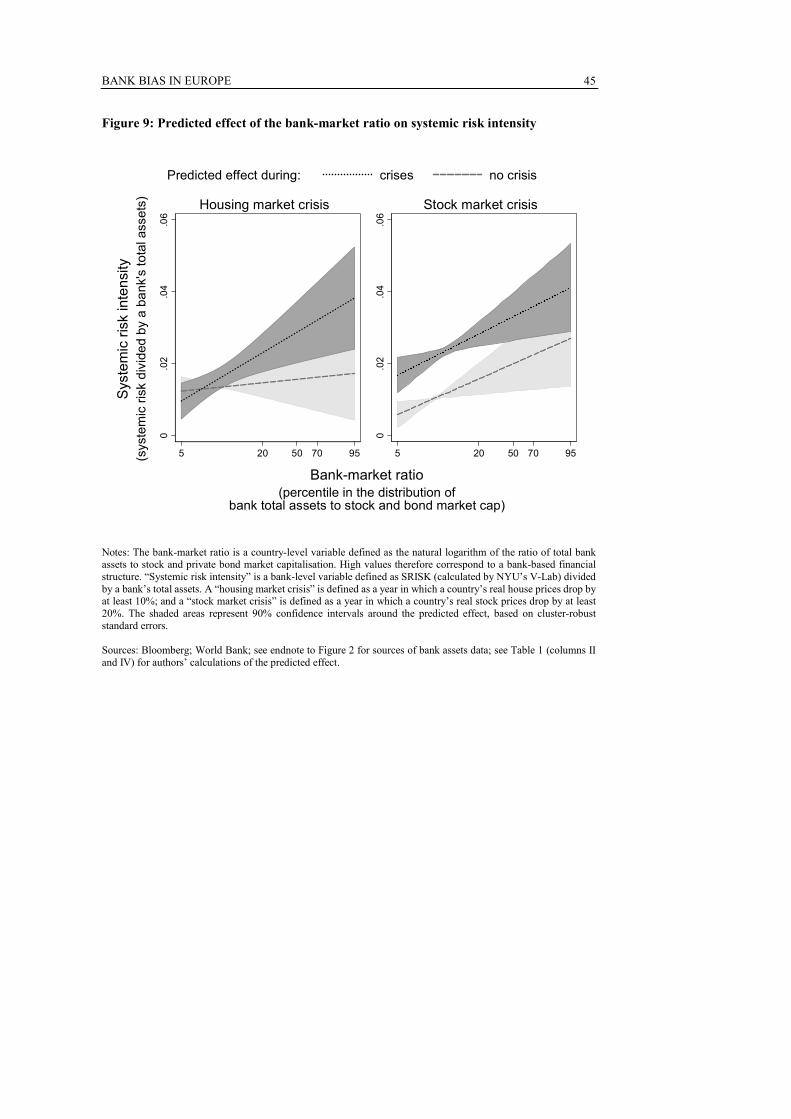
BANK BIAS IN EUROPE
45
Figure 9: Predicted effect of the bank-market ratio on systemic risk intensity
Notes: The bank-market ratio is a country-level variable defined as the natural logarithm of the ratio of total bank assets to stock and private bond market capitalisation. High values therefore correspond to a bank-based financial structure. “Systemic risk intensity” is a bank-level variable defined as SRISK (calculated by NYU’s V-Lab) divided by a bank’s total assets. A “housing market crisis” is defined as a year in which a country’s real house prices drop by at least 10%; and a “stock market crisis” is defined as a year in which a country’s real stock prices drop by at least 20%. The shaded areas represent 90% confidence intervals around the predicted effect, based on cluster-robust standard errors. Sources: Bloomberg; World Bank; see endnote to Figure 2 for sources of bank assets data; see Table 1 (columns II and IV) for authors’ calculations of the predicted effect.
0.0
2.0
4.0
6
5 20 50 70 95
Housing market crisis
0.0
2.0
4.0
6
5 20 50 70 95
Stock market crisis
(sys
tem
ic r
isk
div
ide
d b
y a
ba
nk'
s to
tal a
sse
ts)
Sys
tem
ic r
isk
inte
nsi
ty
Bank-market ratio(percentile in the distribution of
bank total assets to stock and bond market cap)
Predicted effect during: crises no crisis
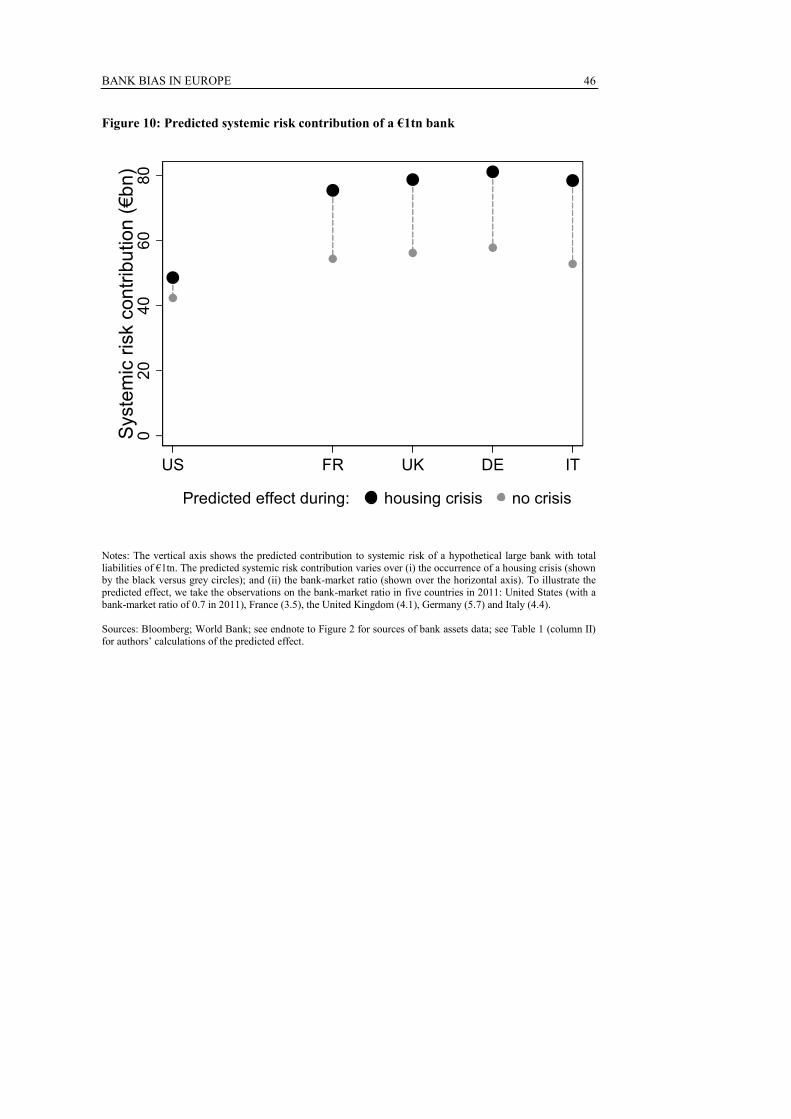
BANK BIAS IN EUROPE
46
Figure 10: Predicted systemic risk contribution of a €1tn bank
Notes: The vertical axis shows the predicted contribution to systemic risk of a hypothetical large bank with total liabilities of €1tn. The predicted systemic risk contribution varies over (i) the occurrence of a housing crisis (shown by the black versus grey circles); and (ii) the bank-market ratio (shown over the horizontal axis). To illustrate the predicted effect, we take the observations on the bank-market ratio in five countries in 2011: United States (with a bank-market ratio of 0.7 in 2011), France (3.5), the United Kingdom (4.1), Germany (5.7) and Italy (4.4). Sources: Bloomberg; World Bank; see endnote to Figure 2 for sources of bank assets data; see Table 1 (column II) for authors’ calculations of the predicted effect.
020
40
60
80
Sys
tem
ic r
isk
contr
ibu
tion
(€b
n)
US FR UK DE IT
Predicted effect during: housing crisis no crisis
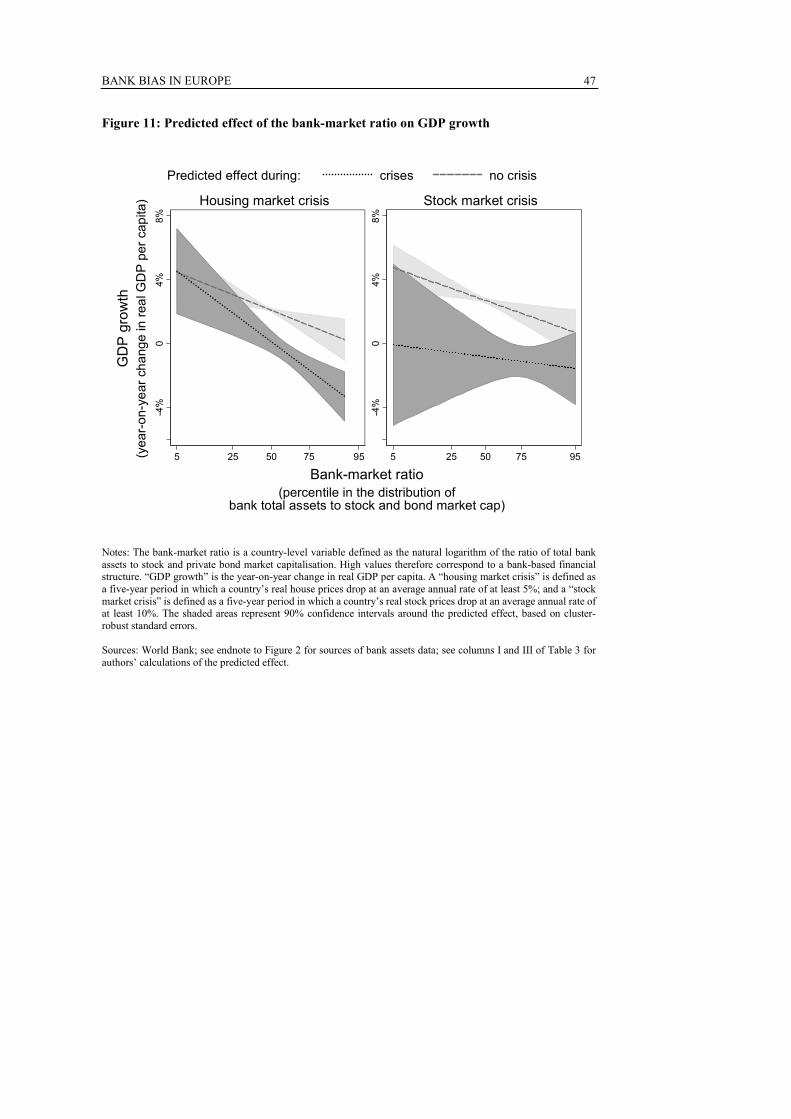
BANK BIAS IN EUROPE
47
Figure 11: Predicted effect of the bank-market ratio on GDP growth
Notes: The bank-market ratio is a country-level variable defined as the natural logarithm of the ratio of total bank assets to stock and private bond market capitalisation. High values therefore correspond to a bank-based financial structure. “GDP growth” is the year-on-year change in real GDP per capita. A “housing market crisis” is defined as a five-year period in which a country’s real house prices drop at an average annual rate of at least 5%; and a “stock market crisis” is defined as a five-year period in which a country’s real stock prices drop at an average annual rate of at least 10%. The shaded areas represent 90% confidence intervals around the predicted effect, based on cluster-robust standard errors. Sources: World Bank; see endnote to Figure 2 for sources of bank assets data; see columns I and III of Table 3 for authors’ calculations of the predicted effect.
-4
%0
4%
8%
5 25 50 75 95
Housing market crisis
-4
%0
4%
8%
5 25 50 75 95
Stock market crisis
(ye
ar-
on
-ye
ar
cha
ng
e in
re
al G
DP
pe
r ca
pita
)
GD
P g
row
th
Bank-market ratio(percentile in the distribution of
bank total assets to stock and bond market cap)
Predicted effect during: crises no crisis
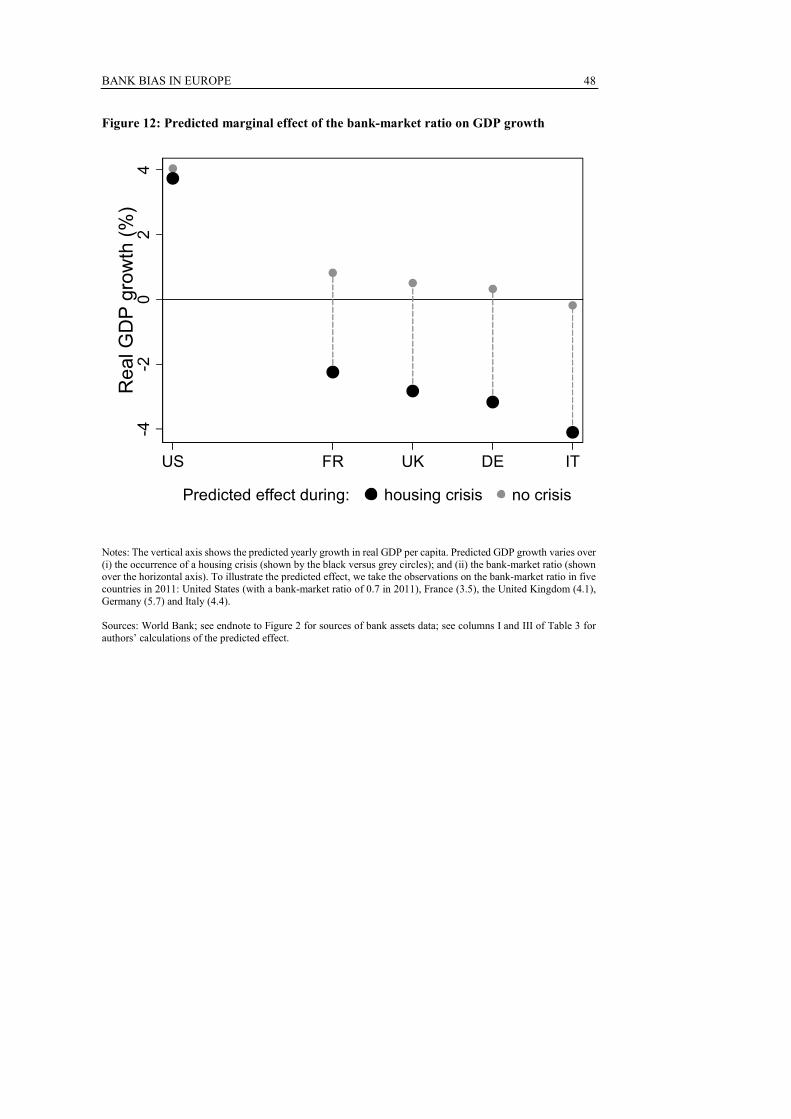
BANK BIAS IN EUROPE
48
Figure 12: Predicted marginal effect of the bank-market ratio on GDP growth
Notes: The vertical axis shows the predicted yearly growth in real GDP per capita. Predicted GDP growth varies over (i) the occurrence of a housing crisis (shown by the black versus grey circles); and (ii) the bank-market ratio (shown over the horizontal axis). To illustrate the predicted effect, we take the observations on the bank-market ratio in five countries in 2011: United States (with a bank-market ratio of 0.7 in 2011), France (3.5), the United Kingdom (4.1), Germany (5.7) and Italy (4.4). Sources: World Bank; see endnote to Figure 2 for sources of bank assets data; see columns I and III of Table 3 for authors’ calculations of the predicted effect.
-4-2
02
4R
eal G
DP
gro
wth
(%
)
US FR UK DE IT
Predicted effect during: housing crisis no crisis
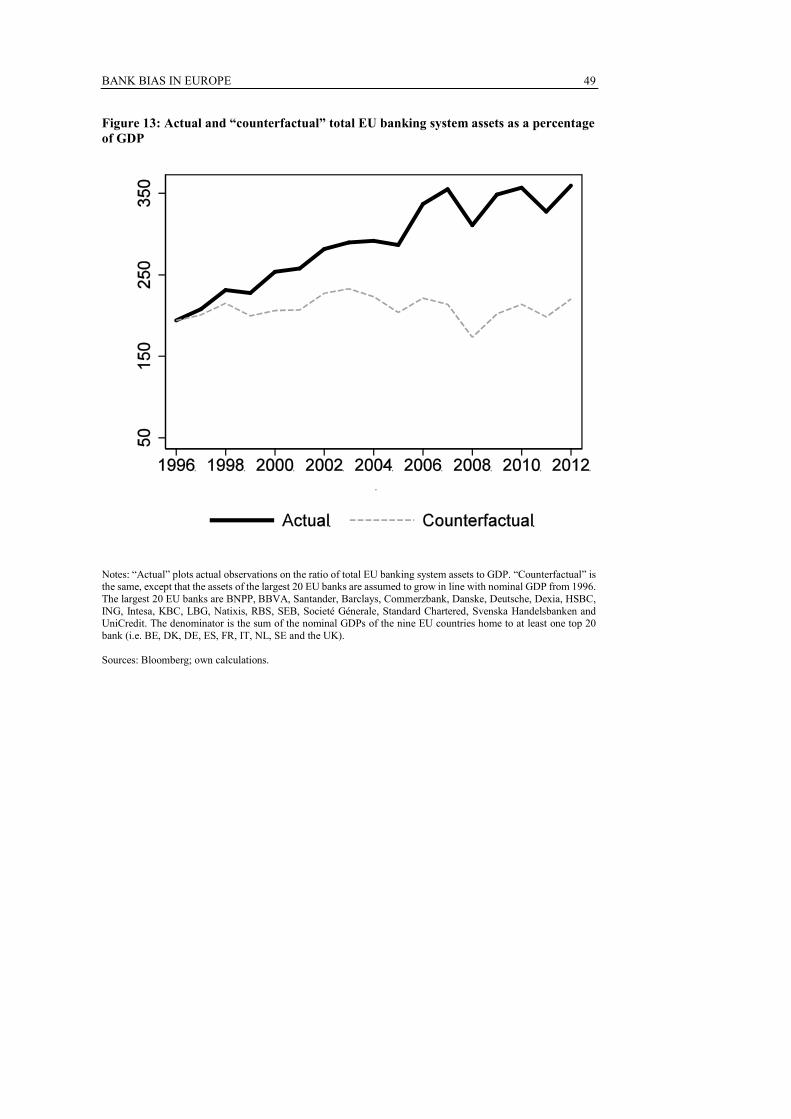
BANK BIAS IN EUROPE
49
Figure 13: Actual and “counterfactual” total EU banking system assets as a percentage of GDP
Notes: “Actual” plots actual observations on the ratio of total EU banking system assets to GDP. “Counterfactual” is the same, except that the assets of the largest 20 EU banks are assumed to grow in line with nominal GDP from 1996. The largest 20 EU banks are BNPP, BBVA, Santander, Barclays, Commerzbank, Danske, Deutsche, Dexia, HSBC, ING, Intesa, KBC, LBG, Natixis, RBS, SEB, Societé Génerale, Standard Chartered, Svenska Handelsbanken and UniCredit. The denominator is the sum of the nominal GDPs of the nine EU countries home to at least one top 20 bank (i.e. BE, DK, DE, ES, FR, IT, NL, SE and the UK). Sources: Bloomberg; own calculations.
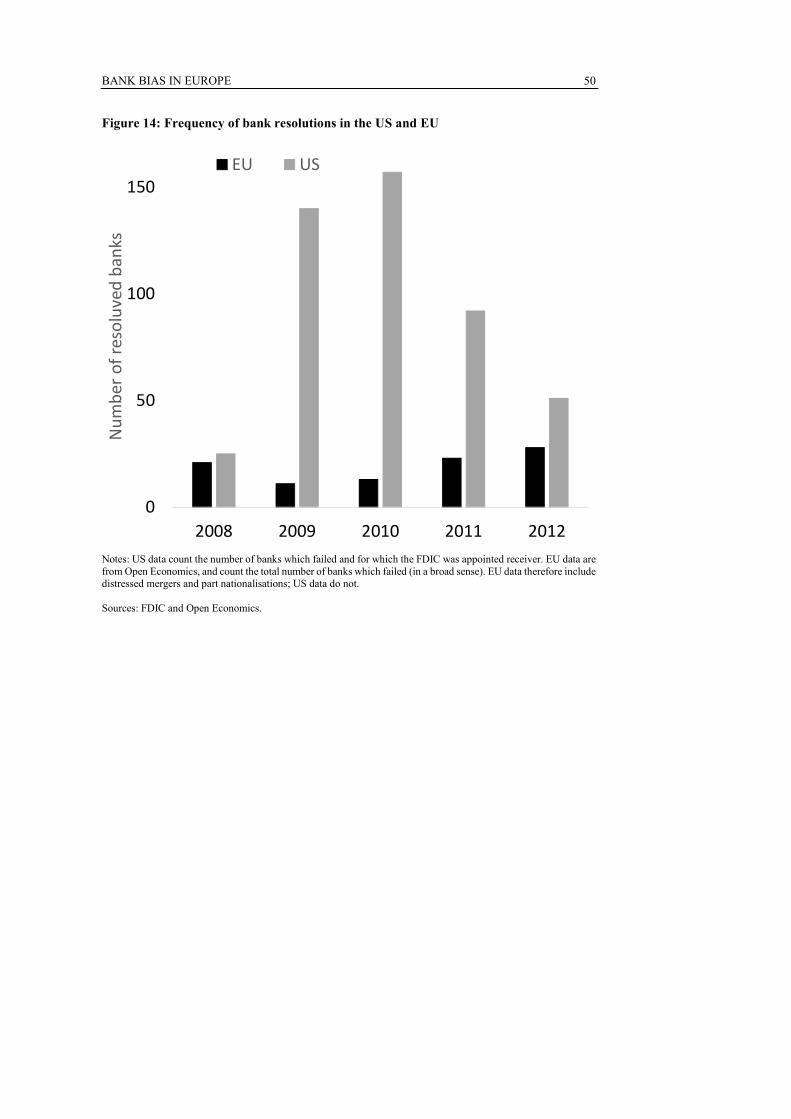
BANK BIAS IN EUROPE
50
Figure 14: Frequency of bank resolutions in the US and EU
Notes: US data count the number of banks which failed and for which the FDIC was appointed receiver. EU data are from Open Economics, and count the total number of banks which failed (in a broad sense). EU data therefore include distressed mergers and part nationalisations; US data do not. Sources: FDIC and Open Economics.
0
50
100
150
2008 2009 2010 2011 2012
Nu
mb
er o
f re
solu
ved
ban
ks
EU US
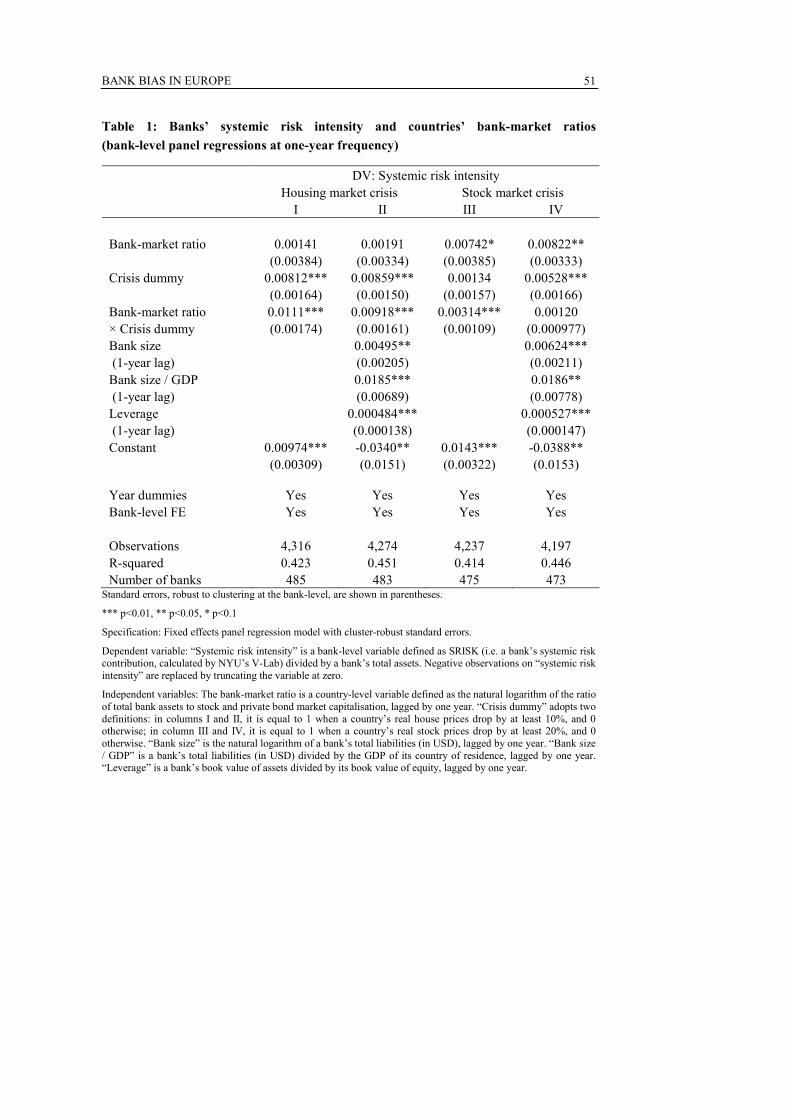
BANK BIAS IN EUROPE
51
Table 1: Banks’ systemic risk intensity and countries’ bank-market ratios
(bank-level panel regressions at one-year frequency)
DV: Systemic risk intensity
Housing market crisis Stock market crisis
I II III IV
Bank-market ratio 0.00141 0.00191 0.00742* 0.00822**
(0.00384) (0.00334) (0.00385) (0.00333)
Crisis dummy 0.00812*** 0.00859*** 0.00134 0.00528***
(0.00164) (0.00150) (0.00157) (0.00166)
Bank-market ratio 0.0111*** 0.00918*** 0.00314*** 0.00120
× Crisis dummy (0.00174) (0.00161) (0.00109) (0.000977)
Bank size 0.00495** 0.00624***
(1-year lag) (0.00205) (0.00211)
Bank size / GDP 0.0185*** 0.0186**
(1-year lag) (0.00689) (0.00778)
Leverage 0.000484*** 0.000527***
(1-year lag) (0.000138) (0.000147)
Constant 0.00974*** -0.0340** 0.0143*** -0.0388**
(0.00309) (0.0151) (0.00322) (0.0153) Year dummies Yes Yes Yes Yes
Bank-level FE Yes Yes Yes Yes
Observations 4,316 4,274 4,237 4,197
R-squared 0.423 0.451 0.414 0.446
Number of banks 485 483 475 473 Standard errors, robust to clustering at the bank-level, are shown in parentheses.
*** p<0.01, ** p<0.05, * p<0.1
Specification: Fixed effects panel regression model with cluster-robust standard errors.
Dependent variable: “Systemic risk intensity” is a bank-level variable defined as SRISK (i.e. a bank’s systemic risk contribution, calculated by NYU’s V-Lab) divided by a bank’s total assets. Negative observations on “systemic risk intensity” are replaced by truncating the variable at zero.
Independent variables: The bank-market ratio is a country-level variable defined as the natural logarithm of the ratio of total bank assets to stock and private bond market capitalisation, lagged by one year. “Crisis dummy” adopts two definitions: in columns I and II, it is equal to 1 when a country’s real house prices drop by at least 10%, and 0 otherwise; in column III and IV, it is equal to 1 when a country’s real stock prices drop by at least 20%, and 0 otherwise. “Bank size” is the natural logarithm of a bank’s total liabilities (in USD), lagged by one year. “Bank size / GDP” is a bank’s total liabilities (in USD) divided by the GDP of its country of residence, lagged by one year. “Leverage” is a bank’s book value of assets divided by its book value of equity, lagged by one year.
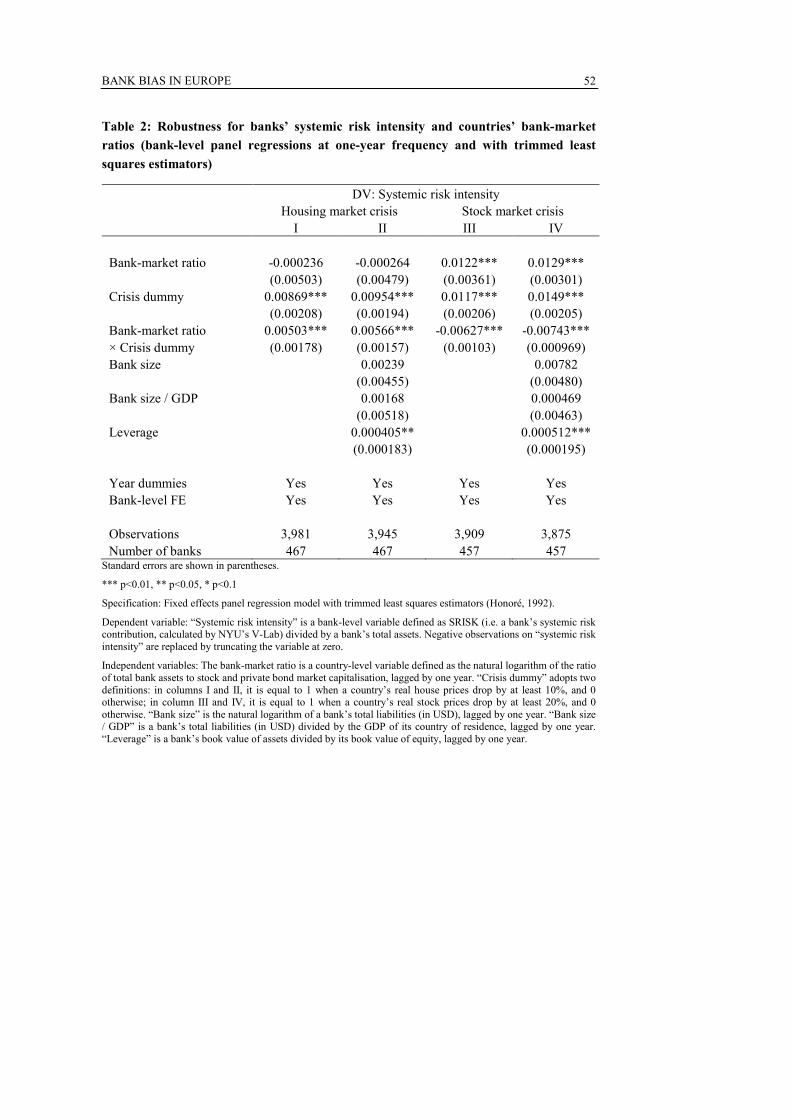
BANK BIAS IN EUROPE
52
Table 2: Robustness for banks’ systemic risk intensity and countries’ bank-market
ratios (bank-level panel regressions at one-year frequency and with trimmed least
squares estimators)
DV: Systemic risk intensity
Housing market crisis Stock market crisis
I II III IV
Bank-market ratio -0.000236 -0.000264 0.0122*** 0.0129***
(0.00503) (0.00479) (0.00361) (0.00301)
Crisis dummy 0.00869*** 0.00954*** 0.0117*** 0.0149***
(0.00208) (0.00194) (0.00206) (0.00205)
Bank-market ratio 0.00503*** 0.00566*** -0.00627*** -0.00743***
× Crisis dummy (0.00178) (0.00157) (0.00103) (0.000969)
Bank size 0.00239 0.00782
(0.00455) (0.00480)
Bank size / GDP 0.00168 0.000469
(0.00518) (0.00463)
Leverage 0.000405** 0.000512***
(0.000183) (0.000195)
Year dummies Yes Yes Yes Yes
Bank-level FE Yes Yes Yes Yes
Observations 3,981 3,945 3,909 3,875
Number of banks 467 467 457 457 Standard errors are shown in parentheses.
*** p<0.01, ** p<0.05, * p<0.1
Specification: Fixed effects panel regression model with trimmed least squares estimators (Honoré, 1992).
Dependent variable: “Systemic risk intensity” is a bank-level variable defined as SRISK (i.e. a bank’s systemic risk contribution, calculated by NYU’s V-Lab) divided by a bank’s total assets. Negative observations on “systemic risk intensity” are replaced by truncating the variable at zero.
Independent variables: The bank-market ratio is a country-level variable defined as the natural logarithm of the ratio of total bank assets to stock and private bond market capitalisation, lagged by one year. “Crisis dummy” adopts two definitions: in columns I and II, it is equal to 1 when a country’s real house prices drop by at least 10%, and 0 otherwise; in column III and IV, it is equal to 1 when a country’s real stock prices drop by at least 20%, and 0 otherwise. “Bank size” is the natural logarithm of a bank’s total liabilities (in USD), lagged by one year. “Bank size / GDP” is a bank’s total liabilities (in USD) divided by the GDP of its country of residence, lagged by one year. “Leverage” is a bank’s book value of assets divided by its book value of equity, lagged by one year.
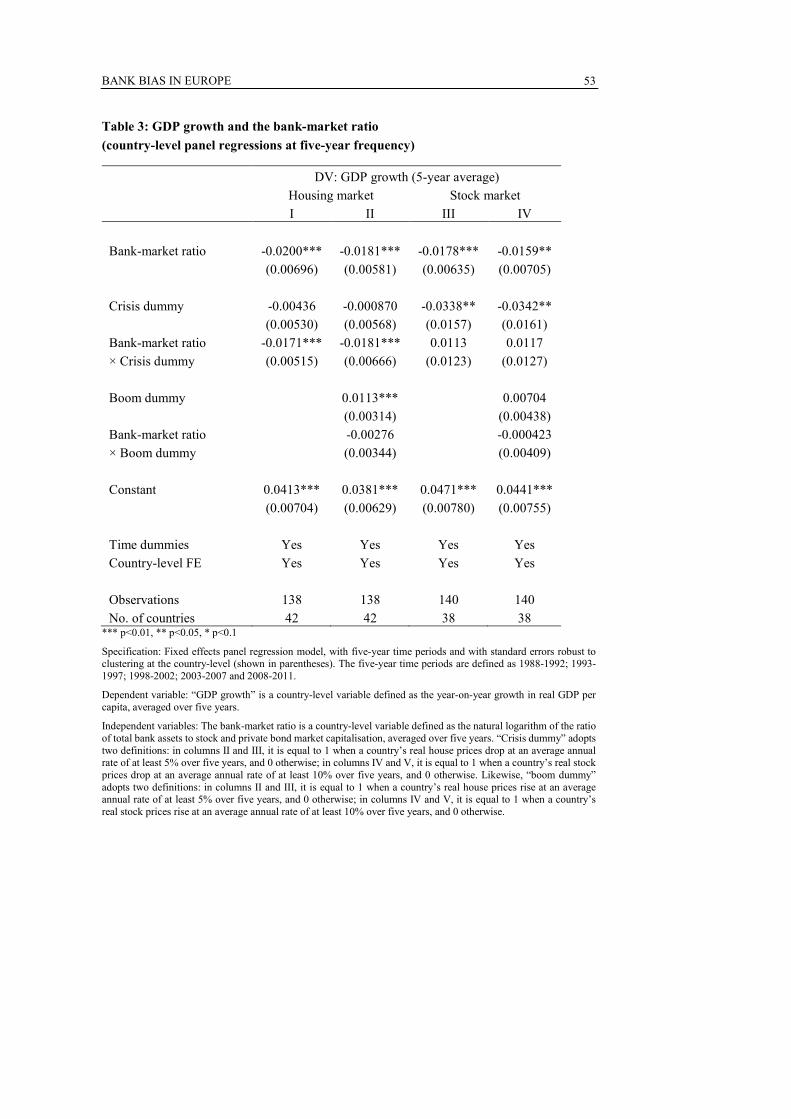
BANK BIAS IN EUROPE
53
Table 3: GDP growth and the bank-market ratio
(country-level panel regressions at five-year frequency)
DV: GDP growth (5-year average)
Housing market Stock market
I II III IV
Bank-market ratio -0.0200*** -0.0181*** -0.0178*** -0.0159**
(0.00696) (0.00581) (0.00635) (0.00705)
Crisis dummy -0.00436 -0.000870 -0.0338** -0.0342**
(0.00530) (0.00568) (0.0157) (0.0161)
Bank-market ratio -0.0171*** -0.0181*** 0.0113 0.0117
× Crisis dummy (0.00515) (0.00666) (0.0123) (0.0127)
Boom dummy 0.0113*** 0.00704
(0.00314) (0.00438)
Bank-market ratio -0.00276 -0.000423
× Boom dummy (0.00344) (0.00409)
Constant 0.0413*** 0.0381*** 0.0471*** 0.0441***
(0.00704) (0.00629) (0.00780) (0.00755)
Time dummies Yes Yes Yes Yes
Country-level FE Yes Yes Yes Yes
Observations 138 138 140 140
No. of countries 42 42 38 38 *** p<0.01, ** p<0.05, * p<0.1
Specification: Fixed effects panel regression model, with five-year time periods and with standard errors robust to clustering at the country-level (shown in parentheses). The five-year time periods are defined as 1988-1992; 1993-1997; 1998-2002; 2003-2007 and 2008-2011.
Dependent variable: “GDP growth” is a country-level variable defined as the year-on-year growth in real GDP per capita, averaged over five years.
Independent variables: The bank-market ratio is a country-level variable defined as the natural logarithm of the ratio of total bank assets to stock and private bond market capitalisation, averaged over five years. “Crisis dummy” adopts two definitions: in columns II and III, it is equal to 1 when a country’s real house prices drop at an average annual rate of at least 5% over five years, and 0 otherwise; in columns IV and V, it is equal to 1 when a country’s real stock prices drop at an average annual rate of at least 10% over five years, and 0 otherwise. Likewise, “boom dummy” adopts two definitions: in columns II and III, it is equal to 1 when a country’s real house prices rise at an average annual rate of at least 5% over five years, and 0 otherwise; in columns IV and V, it is equal to 1 when a country’s real stock prices rise at an average annual rate of at least 10% over five years, and 0 otherwise.
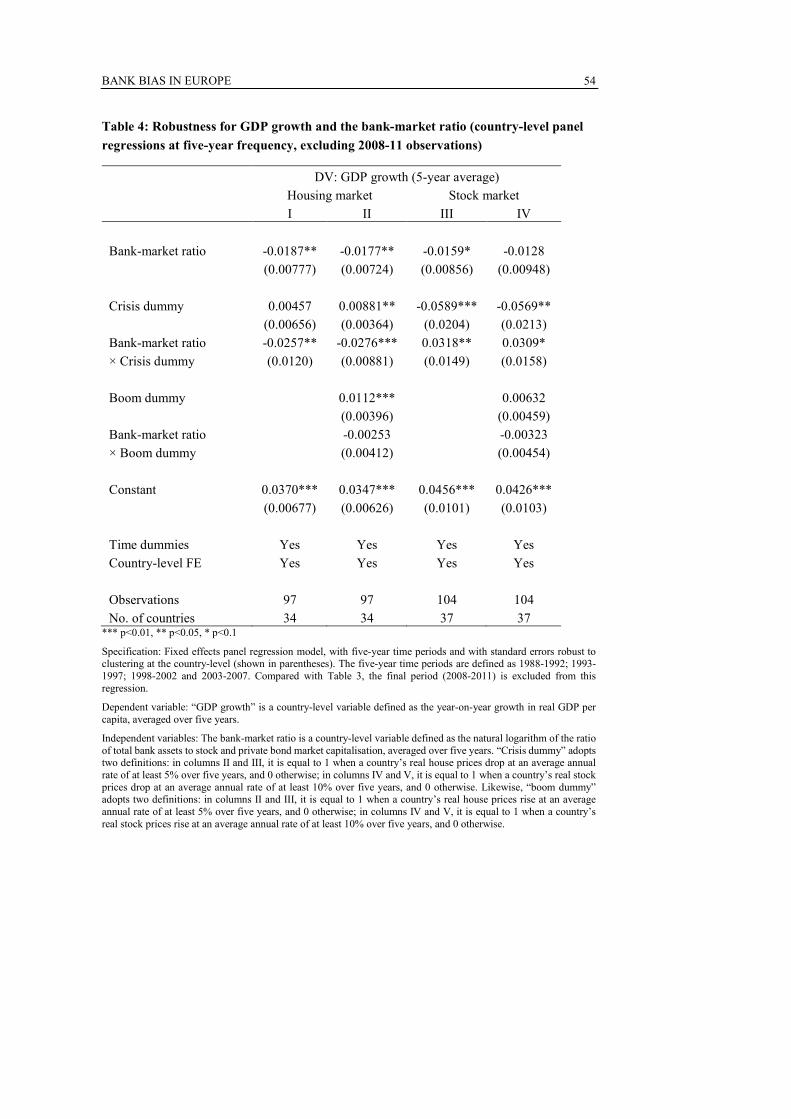
BANK BIAS IN EUROPE
54
Table 4: Robustness for GDP growth and the bank-market ratio (country-level panel
regressions at five-year frequency, excluding 2008-11 observations)
DV: GDP growth (5-year average)
Housing market Stock market
I II III IV
Bank-market ratio -0.0187** -0.0177** -0.0159* -0.0128
(0.00777) (0.00724) (0.00856) (0.00948)
Crisis dummy 0.00457 0.00881** -0.0589*** -0.0569**
(0.00656) (0.00364) (0.0204) (0.0213)
Bank-market ratio -0.0257** -0.0276*** 0.0318** 0.0309*
× Crisis dummy (0.0120) (0.00881) (0.0149) (0.0158)
Boom dummy 0.0112*** 0.00632
(0.00396) (0.00459)
Bank-market ratio -0.00253 -0.00323
× Boom dummy (0.00412) (0.00454)
Constant 0.0370*** 0.0347*** 0.0456*** 0.0426***
(0.00677) (0.00626) (0.0101) (0.0103)
Time dummies Yes Yes Yes Yes
Country-level FE Yes Yes Yes Yes
Observations 97 97 104 104
No. of countries 34 34 37 37 *** p<0.01, ** p<0.05, * p<0.1
Specification: Fixed effects panel regression model, with five-year time periods and with standard errors robust to clustering at the country-level (shown in parentheses). The five-year time periods are defined as 1988-1992; 1993-1997; 1998-2002 and 2003-2007. Compared with Table 3, the final period (2008-2011) is excluded from this regression.
Dependent variable: “GDP growth” is a country-level variable defined as the year-on-year growth in real GDP per capita, averaged over five years.
Independent variables: The bank-market ratio is a country-level variable defined as the natural logarithm of the ratio of total bank assets to stock and private bond market capitalisation, averaged over five years. “Crisis dummy” adopts two definitions: in columns II and III, it is equal to 1 when a country’s real house prices drop at an average annual rate of at least 5% over five years, and 0 otherwise; in columns IV and V, it is equal to 1 when a country’s real stock prices drop at an average annual rate of at least 10% over five years, and 0 otherwise. Likewise, “boom dummy” adopts two definitions: in columns II and III, it is equal to 1 when a country’s real house prices rise at an average annual rate of at least 5% over five years, and 0 otherwise; in columns IV and V, it is equal to 1 when a country’s real stock prices rise at an average annual rate of at least 10% over five years, and 0 otherwise.
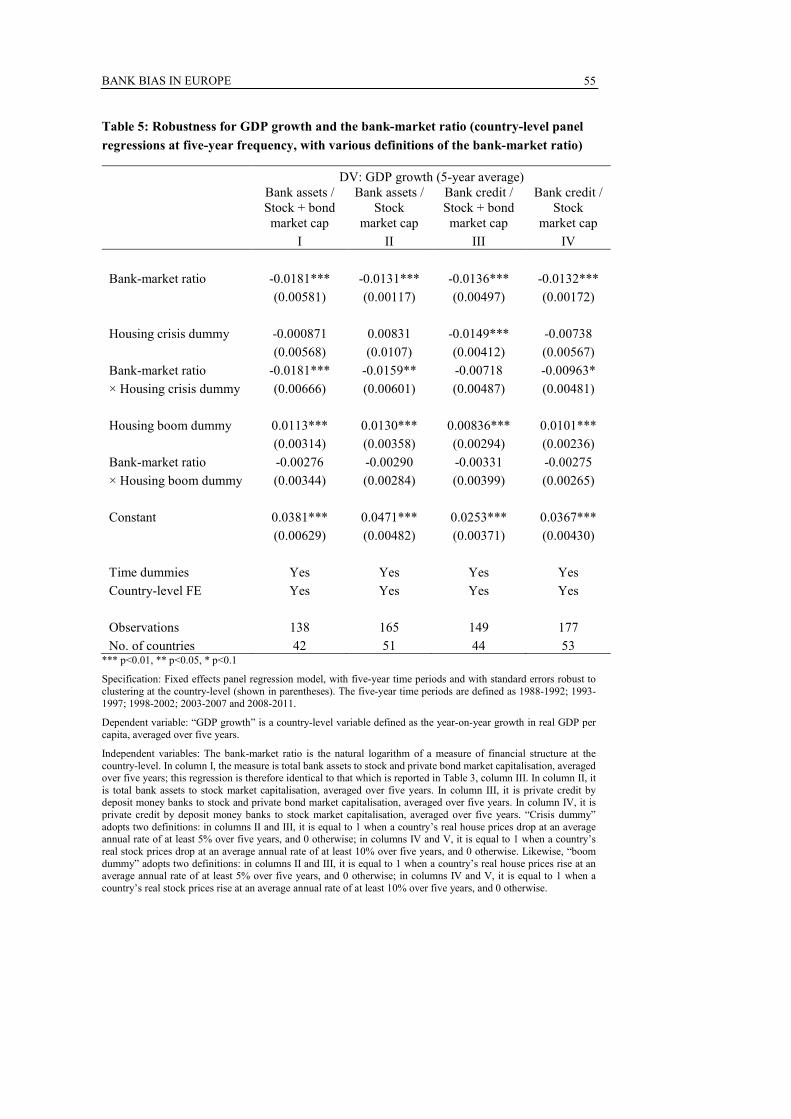
BANK BIAS IN EUROPE
55
Table 5: Robustness for GDP growth and the bank-market ratio (country-level panel
regressions at five-year frequency, with various definitions of the bank-market ratio)
DV: GDP growth (5-year average)
Bank assets / Stock + bond market cap
Bank assets / Stock
market cap
Bank credit / Stock + bond market cap
Bank credit / Stock
market cap
I II III IV
Bank-market ratio -0.0181*** -0.0131*** -0.0136*** -0.0132***
(0.00581) (0.00117) (0.00497) (0.00172)
Housing crisis dummy -0.000871 0.00831 -0.0149*** -0.00738
(0.00568) (0.0107) (0.00412) (0.00567)
Bank-market ratio -0.0181*** -0.0159** -0.00718 -0.00963*
× Housing crisis dummy (0.00666) (0.00601) (0.00487) (0.00481)
Housing boom dummy 0.0113*** 0.0130*** 0.00836*** 0.0101***
(0.00314) (0.00358) (0.00294) (0.00236)
Bank-market ratio -0.00276 -0.00290 -0.00331 -0.00275
× Housing boom dummy (0.00344) (0.00284) (0.00399) (0.00265)
Constant 0.0381*** 0.0471*** 0.0253*** 0.0367***
(0.00629) (0.00482) (0.00371) (0.00430)
Time dummies Yes Yes Yes Yes
Country-level FE Yes Yes Yes Yes
Observations 138 165 149 177
No. of countries 42 51 44 53 *** p<0.01, ** p<0.05, * p<0.1
Specification: Fixed effects panel regression model, with five-year time periods and with standard errors robust to clustering at the country-level (shown in parentheses). The five-year time periods are defined as 1988-1992; 1993-1997; 1998-2002; 2003-2007 and 2008-2011.
Dependent variable: “GDP growth” is a country-level variable defined as the year-on-year growth in real GDP per capita, averaged over five years.
Independent variables: The bank-market ratio is the natural logarithm of a measure of financial structure at the country-level. In column I, the measure is total bank assets to stock and private bond market capitalisation, averaged over five years; this regression is therefore identical to that which is reported in Table 3, column III. In column II, it is total bank assets to stock market capitalisation, averaged over five years. In column III, it is private credit by deposit money banks to stock and private bond market capitalisation, averaged over five years. In column IV, it is private credit by deposit money banks to stock market capitalisation, averaged over five years. “Crisis dummy” adopts two definitions: in columns II and III, it is equal to 1 when a country’s real house prices drop at an average annual rate of at least 5% over five years, and 0 otherwise; in columns IV and V, it is equal to 1 when a country’s real stock prices drop at an average annual rate of at least 10% over five years, and 0 otherwise. Likewise, “boom dummy” adopts two definitions: in columns II and III, it is equal to 1 when a country’s real house prices rise at an average annual rate of at least 5% over five years, and 0 otherwise; in columns IV and V, it is equal to 1 when a country’s real stock prices rise at an average annual rate of at least 10% over five years, and 0 otherwise.
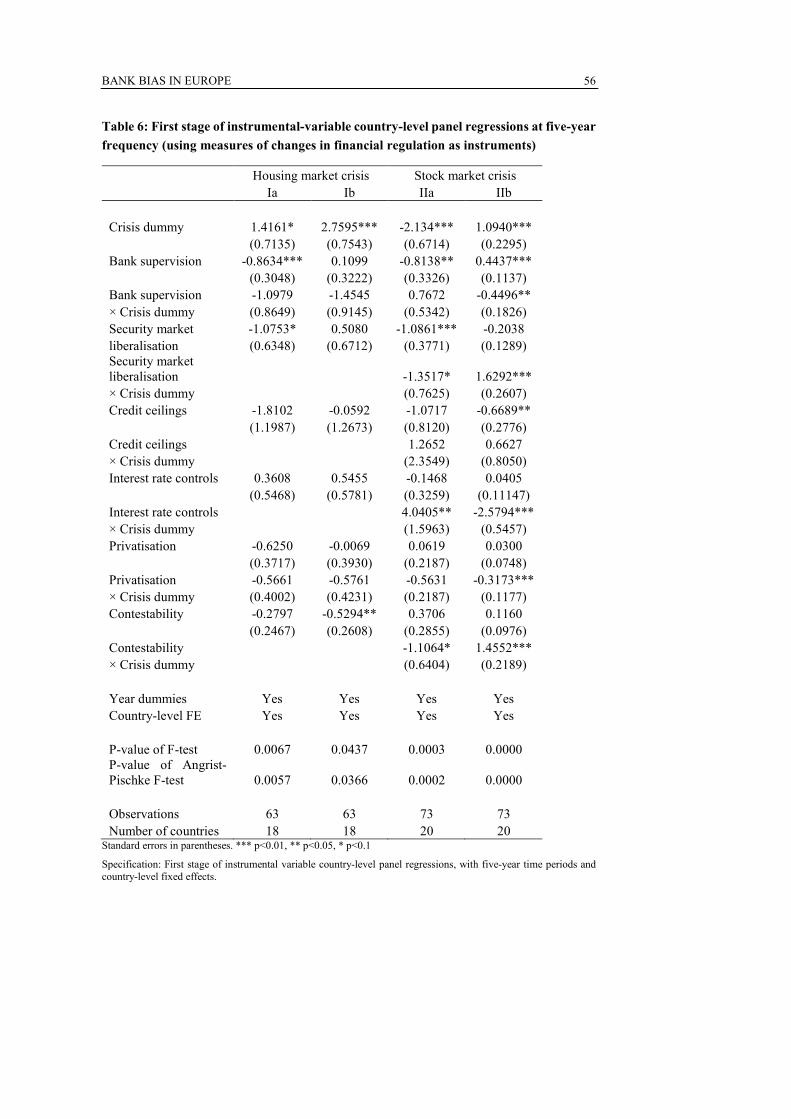
BANK BIAS IN EUROPE
56
Table 6: First stage of instrumental-variable country-level panel regressions at five-year
frequency (using measures of changes in financial regulation as instruments)
Housing market crisis Stock market crisis
Ia Ib IIa IIb
Crisis dummy 1.4161* 2.7595*** -2.134*** 1.0940***
(0.7135) (0.7543) (0.6714) (0.2295)
Bank supervision -0.8634*** 0.1099 -0.8138** 0.4437***
(0.3048) (0.3222) (0.3326) (0.1137)
Bank supervision -1.0979 -1.4545 0.7672 -0.4496**
× Crisis dummy (0.8649) (0.9145) (0.5342) (0.1826)
Security market -1.0753* 0.5080 -1.0861*** -0.2038
liberalisation (0.6348) (0.6712) (0.3771) (0.1289) Security market liberalisation -1.3517* 1.6292***
× Crisis dummy (0.7625) (0.2607)
Credit ceilings -1.8102 -0.0592 -1.0717 -0.6689**
(1.1987) (1.2673) (0.8120) (0.2776)
Credit ceilings 1.2652 0.6627
× Crisis dummy (2.3549) (0.8050)
Interest rate controls 0.3608 0.5455 -0.1468 0.0405
(0.5468) (0.5781) (0.3259) (0.11147)
Interest rate controls 4.0405** -2.5794***
× Crisis dummy (1.5963) (0.5457)
Privatisation -0.6250 -0.0069 0.0619 0.0300
(0.3717) (0.3930) (0.2187) (0.0748)
Privatisation -0.5661 -0.5761 -0.5631 -0.3173***
× Crisis dummy (0.4002) (0.4231) (0.2187) (0.1177)
Contestability -0.2797 -0.5294** 0.3706 0.1160
(0.2467) (0.2608) (0.2855) (0.0976)
Contestability -1.1064* 1.4552***
× Crisis dummy (0.6404) (0.2189)
Year dummies Yes Yes Yes Yes
Country-level FE Yes Yes Yes Yes
P-value of F-test 0.0067 0.0437 0.0003 0.0000 P-value of Angrist-Pischke F-test 0.0057 0.0366 0.0002 0.0000
Observations 63 63 73 73
Number of countries 18 18 20 20 Standard errors in parentheses. *** p<0.01, ** p<0.05, * p<0.1
Specification: First stage of instrumental variable country-level panel regressions, with five-year time periods and country-level fixed effects.

BANK BIAS IN EUROPE
57
Dependent variable: In columns Ia and IIa, the dependent variable is the bank-market ratio, which is a country-level variable defined as the natural logarithm of the ratio of total bank assets to stock and private bond market capitalisation, averaged over five years. In column Ib, the dependent variable is the bank-market ratio interacted with a housing market crisis dummy, which is equal to 1 when a country’s real house prices drop at an average annual rate of at least 5%, and 0 otherwise. In column IIb, the dependent variable is the bank-market ratio interacted with a stock market crisis dummy, which is equal to 1 when a country’s real stock prices drop at an average annual rate of at least 10% over five years, and 0 otherwise.
Independent variables: “Crisis dummy” adopts two definitions: in columns Ia and Ib, it is equal to 1 when a country’s real house prices drop at an average annual rate of at least 5% over five years, and 0 otherwise; in columns IIa and IIb, it is equal to 1 when a country’s real stock prices drop at an average annual rate of at least 10% over five years, and 0 otherwise. The following country-level variables are used as instruments in this first-stage regression: “bank supervision”, which is a measure of the strength and intrusiveness of banking sector supervision; “security market liberalisation”, which is a measure of security market liberalisation; “credit ceilings”, which is a measure of ceilings on bank credit; “interest rate controls”, which is a measure of interest rate liberalisation; “privatisation”, which is a measure of the degree of privatisation of banks; and “contestability”, which is an inverse measure of barriers to entry to the banking sector. Each variable takes the six-year lag, averaged over five years. In columns I and II, each instrument is included on its own and in interaction with the crisis dummy. All instruments are taken from Abiad, Detragiache and Tressel (2008).
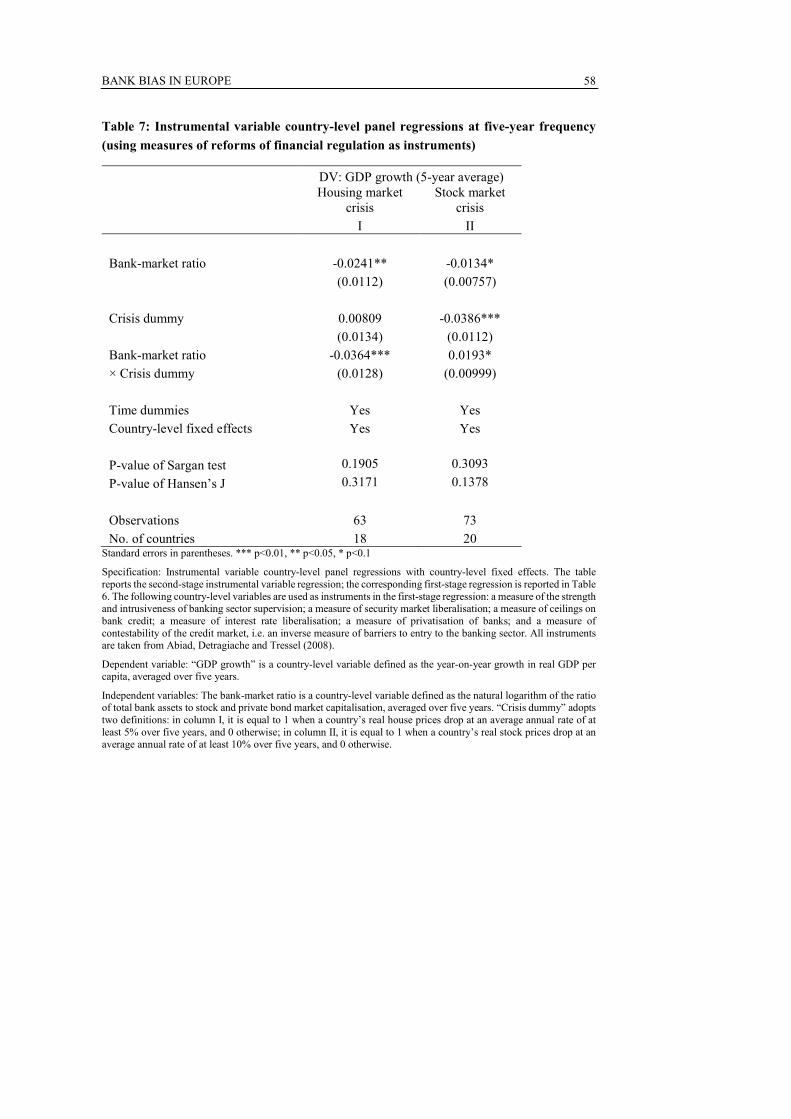
BANK BIAS IN EUROPE
58
Table 7: Instrumental variable country-level panel regressions at five-year frequency
(using measures of reforms of financial regulation as instruments)
DV: GDP growth (5-year average)
Housing market
crisis Stock market
crisis
I II
Bank-market ratio -0.0241** -0.0134*
(0.0112) (0.00757)
Crisis dummy 0.00809 -0.0386***
(0.0134) (0.0112)
Bank-market ratio -0.0364*** 0.0193*
× Crisis dummy (0.0128) (0.00999)
Time dummies Yes Yes
Country-level fixed effects Yes Yes
P-value of Sargan test 0.1905 0.3093
P-value of Hansen’s J 0.3171 0.1378
Observations 63 73
No. of countries 18 20 Standard errors in parentheses. *** p<0.01, ** p<0.05, * p<0.1
Specification: Instrumental variable country-level panel regressions with country-level fixed effects. The table reports the second-stage instrumental variable regression; the corresponding first-stage regression is reported in Table 6. The following country-level variables are used as instruments in the first-stage regression: a measure of the strength and intrusiveness of banking sector supervision; a measure of security market liberalisation; a measure of ceilings on bank credit; a measure of interest rate liberalisation; a measure of privatisation of banks; and a measure of contestability of the credit market, i.e. an inverse measure of barriers to entry to the banking sector. All instruments are taken from Abiad, Detragiache and Tressel (2008).
Dependent variable: “GDP growth” is a country-level variable defined as the year-on-year growth in real GDP per capita, averaged over five years.
Independent variables: The bank-market ratio is a country-level variable defined as the natural logarithm of the ratio of total bank assets to stock and private bond market capitalisation, averaged over five years. “Crisis dummy” adopts two definitions: in column I, it is equal to 1 when a country’s real house prices drop at an average annual rate of at least 5% over five years, and 0 otherwise; in column II, it is equal to 1 when a country’s real stock prices drop at an average annual rate of at least 10% over five years, and 0 otherwise.