Embed Size (px)
Citation preview

- 1 -
BANK HANDLOWY W WARSZAWIE S.A.3Q 2008 consolidated financial results
- 2 -
Sound net income growth as compared to 3Q 2007
216179
0
50
100
150
200
250
3Q07 3Q08
/PLN MM/
21%

- 3 -
P&L lines impact on net income 3Q 2008 vs. 3Q 2007/PLN MM/
69
28 12
216179
741
0
50
100
150
200
250
NETINCOME
3Q07
Treasury Fees Interests Netimpairment losses
Other NETINCOME
3Q 08
22%(3Q08/3Q07)
Fees result
9%(3Q08/3Q07)
Net interest income
3,4%by 0,4 pp
(3Q08/3Q07)Net interest
margin
2%(3Q08/3Q07)
Expenses and depreciation
12 mln
(3Q08/3Q07)Net impairment
losses
73%(3Q08/3Q07)
Treasury result

- 4 -
Major financial ratios
3Q 20083Q 2007 2Q 2008
14.9%
1.9%
61 %
12.9%**
16.3%
13.8%
1.8%
63 %
11.6%
14.9%
17.4%
2.3%
56 %
12.3%
15.6%
ROE*
ROE
ROA*
Cost / Income
CAR
* based on annualized net income
**CAR calculated as at December 31, 2007

- 5 -
Banking sector liquidityFunding gap of non-financial sector
(deposits - loans)66
.4
-12.
5
7.6
7.6
7.3 8.1
6.4
5.7
0.2
6.4
-30.
3
-50
-25
0
25
50
75
3Q 2006 3Q 2007 4Q 2007 1Q 2008 2Q 2008 3Q 2008
PLN B
Banking Sector Citi Handlowy
Source: NBP (Polish central bank), financial statements of Citi Handlowy

- 6 -
CAR
CAR
12,1%
12,4%
12,9%
11,6%
10,8%
11,0%11,8%
10,8%
12,3%
8%
9%
10%
11%
12%
13%
14%
3Q07 4Q07 1Q08 2Q08 3Q08
Banking sector Citi Handlowy
- 7 -
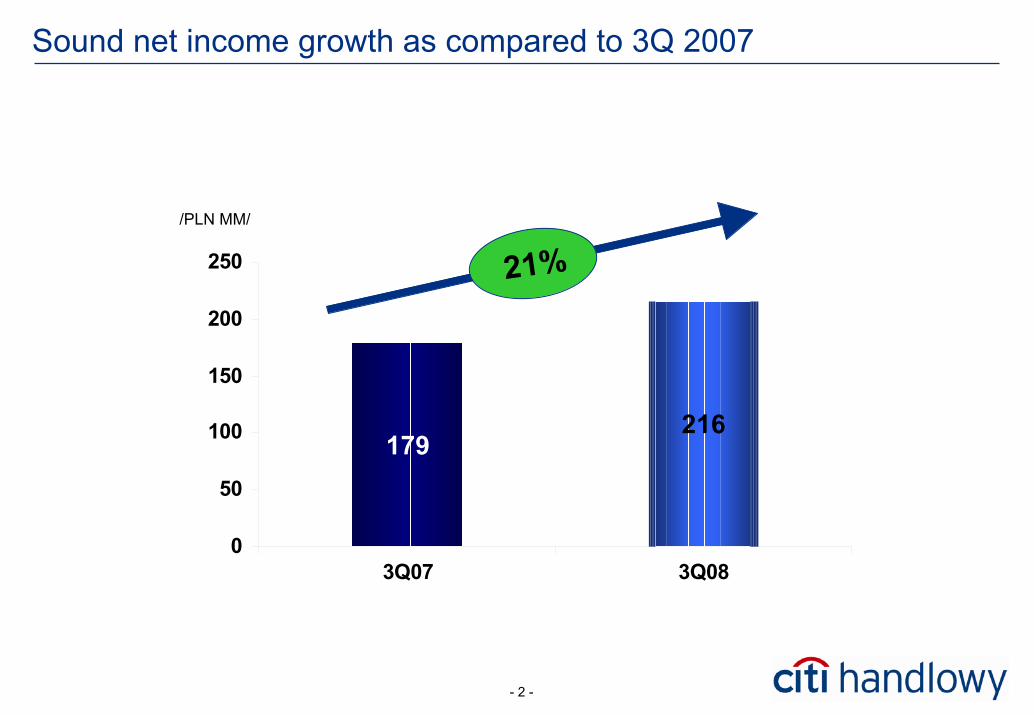
Major factors impacting 3Q 2008 net result vs. 3Q 2007
164.3
3Q 2007 3Q 2008 I/D (mln zł)
69.395.0
Treasury result/PLN MM/
Treasury
• Successful management of the Bank’s own position
• Active sale of products to customers: Significant increase in FX transactions volume of non-bank customers and in FXoptions transactions
• Investment debt securities sale20406080
100120140160180
2Q 06 3Q 06 4Q 06 1Q 07 2Q 07 3Q 07 4Q 07 1Q 08 2Q 08 3Q 08

- 8 -
Treasury
Proprietary management result
High volatility of the proprietary management result
*/
Proprietary management
2Q 06 3Q 06 4Q 06 1Q 07 2Q 07 3Q 07 4Q 07 1Q 08 2Q 08 3Q 08
49%(3Q08/3Q07)
FX result (FX spot)
51%(3Q08/3Q07)
Customer activity result
Customer activity
Customer activity result*/
2Q 06 3Q 06 4Q 06 1Q 07 2Q 07 3Q 07 4Q 07 1Q 08 2Q 08 3Q 08
*Scale on charts is incomparable

- 9 -
Major factors impacting 3Q 2008 net result vs. 3Q 2007
/mld zł/ Mutual funds net inflow (market) WSE turnover (market)
Fees & commissions result
/mld zł/
25%(3Q08/3Q07)
Custody services
34%(3Q08/3Q07)
Investment and insurance products
44%(3Q08/3Q07)
Brokerage fees
0
20
40
60
80
100
120
140
1Q 07 2Q 07 3Q 07 4Q 07 1Q 08 2Q 08 3Q 08
-15
-10
-5
0
5
10
15
1Q 07 2Q 07 3Q 07 4Q 07 1Q 08 2Q 08 3Q 08

- 10 -
Major factors impacting 3Q 2008 net result vs. 3Q 2007
Net interest income and net interest margin
(11%)(3Q08/3Q07)
AFS portfolio income
28%(3Q08/3Q07)
Interests from loans – non-
financial sector
37%(3Q08/3Q07)
Interests from credit cards
/PLN MM/
150170190210230250270290310330350
1Q 06 2Q 06 3Q 06 4Q 06 1Q 07 2Q 07 3Q 07 4Q 07 1Q 08 2Q 08 3Q 082,6%
2,7%
2,8%
2,9%
3,0%
3,1%
3,2%
3,3%
3,4%
3,5%Net interest result Net interest margin

- 11 -
Major factors impacting 3Q 2008 net result vs. 3Q 2007
(22.6)
3Q 2007 3Q 2008 I/D (mln zł)
(12.0)(10.6)
/PLN MM/ Net impairment losses
Net impairment losses
(30)(20)(10)
010203040
2Q 06 3Q 06 4Q 06 1Q 07 2Q 07 3Q 07 4Q 07 1Q 08 2Q 08 3Q 08

- 12 -
Expenses under control – strategy delivery
177
198 196
171
0
50
100
150
200
250
300
350
400
3Q2007 3Q2008
/PLN MM/ 376 367(2%)
(4%)
(1%)
3Q07 2Q08 3Q08GCG 69% 68% 65%CMB 54% 57% 48%Total 61% 63% 56%
Cost / Income
Retail Bank (GCG)Corporate Bank (CMB)
● Corporate: lower staff expenses and staff expenditures, decrease of technological expenses
● Retail: Expenses of the segment went down slightely, higher expenses related to increased acquisition and portfolio growth were compensated by growing effectiveness of the segment and lower marketing spending

- 13 -
Balance sheet structure improvement
6.1 4.0
6.57.1
8.77.1
5.14.8
14.112.5
31.12.07 30.09.082.0 2.74.4 3.0
5.6
7.1 6.0
19.819.8
5.6
31.12.07 30.09.08
Financial sector
Trading portfolio
Other assets
Loans – non-financial sector
Assets
13%
9%(6%)
(5%) 38.9
(18%)
37.138.9
0%
(15%)
(34%)
37.1 (5%) /PLN MM/
0%(32%)
Liabilities
/PLN MM/
Deposits – non-financial sector
Deposits – financial sector
EquityAFS
Trading portfolio
Other liabilities
13%(3Q08/4Q07)
Loans to non-financial sector
71%up by 8 pp
(3Q08/4Q07)
Loans / deposits ratio
38%up by 6 pp
(3Q08/4Q07)
Loans’ share in total assets
12,3%up by 0,7 pp
(3Q08/2Q08)
Capital Adequacy Ratio

- 14 -
Loans
Non-financial sector loans
0123456789
30.06.08 30.09.08
Market
Corporate loans
(3%)
7%
7%
0123456
30.06.08 30.09.08
Retail loans
4%
Market (excl. mortgage)
8%
Corporate loans: including public sector and local government institutionsSource: Bank’s estimates, data pro-forma, in PLN billion

- 15 -
Deposits
02468
101214
30.06.08 30.09.08
Corporate deposits
(4%)
(5%)
(2%)
Market
4%
TermCurrent
024
68
30.06.08 30.09.08
5%
(6%)
Retail deposits
(2%)Market
5%
Non-financial sector deposits
Corporate deposits including public sector and local government institutions
Source: Bank’s estimates, data pro-forma, in PLN billion

- 16 -
Results of the third quarter – corporate banking
Achievements of the Bank for corporates
130 %Growth of
transactions volumes concluded by On Line Trading
Platformcompared to
analogous period of 2007
3-year loan agreement was signed with FMCG segment player for the
amount of
40 million USD
Almost 80% growth of volumes level on
hedging by customerstheir FX exposure by
options(IIIQ2008/ IIIQ2007)
50 % Growth of the
number of customers on On Line Trading
Platform(IIIQ2008/ IIIQ2007)

- 17 -
Results of the third quarter – corporate banking
Prepaid payment cards Citi Handlowy – market leader
Innovative solution with a wide spectrum of use:
� social benefit card
� instrument in contests and promotions
� tool used in incentive programmes
70%Market share
90% Growth of issued cards at
the end of the III quarter 2008 as compared to analogous
period of 2007
420,000 cards
prepaid were issued as at the end of September 2008
- 18 -
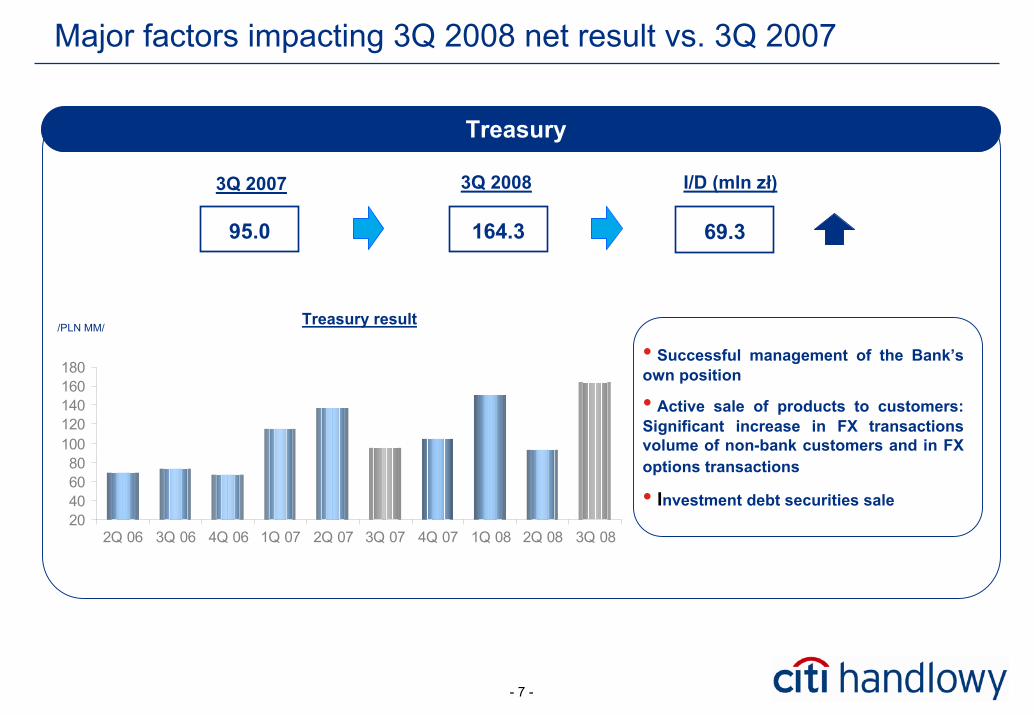
Results of the third quarter – retail banking
Once again record results in the credit cards segment
�Aquisition of more than 74,000 credit cards – almost 20% more than in 3Q 2007
� Total number of cards as at the end of 3Q 2008 reached 972,000 – 26% more than as at the end of
3Q 2007
The largest Credit Cards Discount Program in PolandStable growth of popularity co-branded cards
� Co-branded cards (65,000) amount more than 90% of acquired credit cards;
�The users of Motokarta Kredytowa Citibank-BPrepresent almost half of it (31,000)
� Thus the Citibank-BP card, with total of nearly 240,000 issued cards, strengthened its position of the largest co-branding partnership programme on the market
� More than 3,200 vendors – 30% more than in 3Q 2007

- 19 -
Innovations for customer – retail banking
Safety and comfort for individual customers
� Innovative SMS service which helps holders of Citibank Credit Cards to locate the Discount Program partners
� Shopping in the Internet for instalments with Citibank Credit Cards – customer is enabled to independently set up instalment plans on his/her Citibank Credit Card payments, this via the eCard served internet shops
SMS with adresses of the nearest vendors, whereattractive discounts can
be obtained
CitibankOnline↑20%
(IIQ2008 vs. IIIQ2008)The growth of the number of customers, which
decided on Online Statements (255,000)
One motion for new customers for gaining retail products of the Bank
(current account in PLN and other currencies, deposit accounts, credit line in the account, credit card and
insurance products)

- 20 -
Prospect for the Polish Economy
• Euro zone recession will likely contribute to economic slowdown in Poland
• Risk of heightened market volatility due to global financial crisis
• Economic growth weakness opens doors for interest rate cuts in Poland
Unfavourable External Environment Increased Financial Market Volatility
Likely Substantial Rate Cuts
4.0
4.5
5.0
5.5
6.0
6.5
7.0
Jul-0
7
Oct
-07
Jan-
08
Apr
-08
Jul-0
8
Oct
-08
Jan-
09
Apr
-09
Jul-0
9
Oct
-09
NBP reference rate (%) Forecast
-1.0
0.0
1.0
2.0
3.0
4.0
5.0
6.0
7.0
1q08 2q08 3q08 4q08 1q09 2q09 3q09 4q09
Poland - GDP (% YoY) Euro Area (% YoY)
3.1
3.2
3.3
3.4
3.5
3.6
3.7
3.8
3.9
4.0
Jul-0
8
Aug
-08
Sep
-08
Oct
-08
Nov
-08
EUR/PLN exchange rate
Sources: NBP, Eurostat, GUS, Citi Handlowy forecasts.

- 21 -

- 22 -
3Q 2008 results
PLN MM 3Q 2007 3Q 2008I/ (D) I/ (D) %
Net interest income 306,8 335,0 28,2 9%Net fee and commission income 191,3 150,1 (41,2) (22%)Dividend income 3,5 0,4 (3,1) (89%)Treasury 95,0 164,3 69,3 73%Equity instruments result 0,3 0,0 (0,3) (100%)Other operating revenue 18,0 11,2 (6,8) (38%)Revenue 614,9 661,1 46,2 8%Expenses and depreciation (375,7) (367,2) (8,5) (2%)Total operating expenses (349,0) (343,1) (5,8) (2%)Depreciation (26,7) (24,1) (2,6) (10%)Income on fixed assets sale 0,5 1,3 0,8 155%Movements in provisions (10,6) (22,6) (12,0) 113%Share in subs' profits 0,0 0,0 (0,0) -EBIT 229,2 272,5 43,4 19%Corporate tax (50,3) (56,8) 6,5 13%
Net profit 178,8 215,7 36,9 21%
3Q08/3Q07

- 23 -
Corporate banking 3Q 2008 results
PLN MM 3Q 2007 3Q 2008I/ (D) I/ (D) %
Net interest income 138,6 128,5 (10,1) (7%)Net fee and commission income 78,8 62,0 (16,9) (21%)Dividend income 3,5 0,4 (3,1) (89%)Treasury 86,9 154,2 67,3 77%Equity instruments result 0,3 0,0 (0,3) (100%)Other operating revenue 18,1 13,9 (4,2) (23%)Revenue 326,2 358,9 32,7 10%Expenses and depreciation (177,3) (170,7) (6,6) (4%)Total operating expenses (158,5) (154,9) (3,6) (2%)Depreciation (18,8) (15,8) (2,9) (16%)Income on fixed assets sale 0,5 1,0 0,6 117%Movements in provisions 6,7 (4,0) (10,7) nmShare in subs' profits 0,0 0,0 (0,0) -EBIT 156,2 185,2 29,1 19%
3Q08/3Q07

- 24 -
Retail banking 3Q 2008 results
PLN MM 3Q 2007 3Q 2008I/ (D) I/ (D) %
Net interest income 168,3 206,6 38,3 23%Net fee and commission income 112,5 88,2 (24,3) (22%)Dividend income 0,0 0,0 0,0 - Treasury 8,1 10,1 2,0 25%Equity instruments result 0,0 0,0 0,0 - Other operating revenue (0,1) (2,7) (2,5) nmRevenue 288,7 302,2 13,4 5%Expenses and depreciation (198,4) (196,5) (1,9) (1%)Total operating expenses (190,4) (188,2) (2,2) (1%)Depreciation (8,0) (8,2) 0,3 4%Income on fixed assets sale 0,0 0,2 0,2 1167%Movements in provisions (17,4) (18,6) (1,3) 7%Share in subs' profits 0,0 0,0 0,0 - EBIT 73,0 87,3 14,3 20%
3Q08/3Q07