Embed Size (px)
Citation preview
Bank of America Merrill Lynch Global Technology Conference
Sumit SadanaExecutive Vice President & Chief Strategy OfficerJune 5, 2013
June 5, 2013 2
Forward-Looking StatementDuring our meeting today we will be making forward-looking statements.
Any statement that refers to expectations, projections or other characterizations of future events or circumstances is a forward-looking statement, including those relating to revenue, unit sales, pricing, market positions, market growth, product sales, industry trends, expenses, gross margin or other financial measures, capital investments, cash flow, use of cash, customer relationships and partnerships, strategic investments and other strategic transactions, competition and competitive advantages, future memory and other technologies, production capacity, technology transitions and future products.
Actual results may differ materially from those expressed in these forward-looking statements including due to the factors detailed under the caption “Risk Factors” and elsewhere in the documents we file from time-to-time with the SEC, including our annual and quarterly reports.
Reconciliations between Non-GAAP and GAAP results presented are included in the appendix of the financial presentation.
We undertake no obligation to update these forward-looking statements, which speak only as of June 5, 2013.
Bank of America Merrill Lynch Global Technology Conference, San Francisco, CA
June 5, 2013 3
Agenda
SanDisk Overview
Current and Future NAND Growth Drivers
Technology & Capacity Planning
Financial Review
Bank of America Merrill Lynch Global Technology Conference, San Francisco, CA
June 5, 2013 4
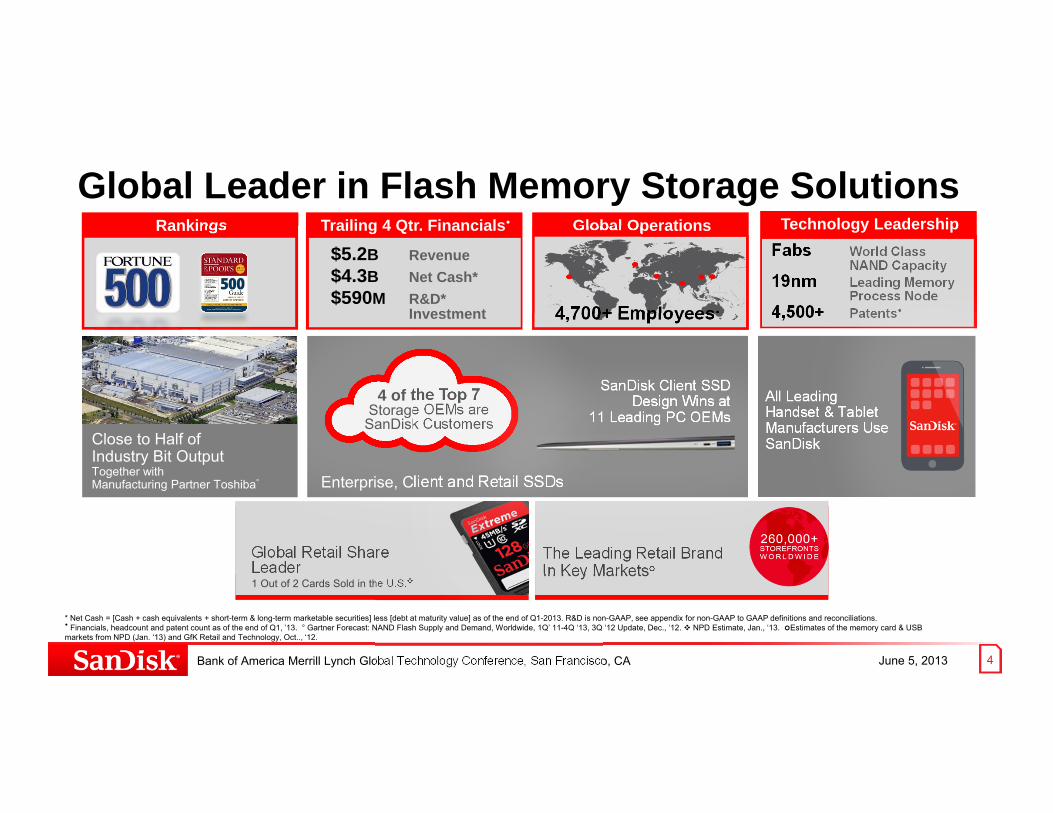
Global Leader in Flash Memory Storage Solutions
Bank of America Merrill Lynch Global Technology Conference, San Francisco, CA
Global Retail Share Leader1 Out of 2 Cards Sold in the U.S.
The Leading Retail Brand In Key Markets
Technology LeadershipGlobal Operations
4,700+ Employees
RankingsFabs World Class
NAND Capacity19nm Leading Memory
Process Node4,500+ Patents
4 of the Top 7 Storage OEMs are
SanDisk Customers
Enterprise, Client and Retail SSDs
SanDisk Client SSD Design Wins at
11 Leading PC OEMsClose to Half of Industry Bit OutputTogether with Manufacturing Partner Toshiba°
All Leading Handset & Tablet Manufacturers Use SanDisk
Trailing 4 Qtr. Financials
$5.2B Revenue$4.3B Net Cash*$590M R&D*
Investment
* Net Cash = [Cash + cash equivalents + short-term & long-term marketable securities] less [debt at maturity value] as of the end of Q1-2013. R&D is non-GAAP, see appendix for non-GAAP to GAAP definitions and reconciliations. Financials, headcount and patent count as of the end of Q1, ’13. ° Gartner Forecast: NAND Flash Supply and Demand, Worldwide, 1Q’ 11-4Q ‘13, 3Q ‘12 Update, Dec., ‘12. NPD Estimate, Jan., ‘13. Estimates of the memory card & USB markets from NPD (Jan. ‘13) and GfK Retail and Technology, Oct.., ‘12.
June 5, 2013 5
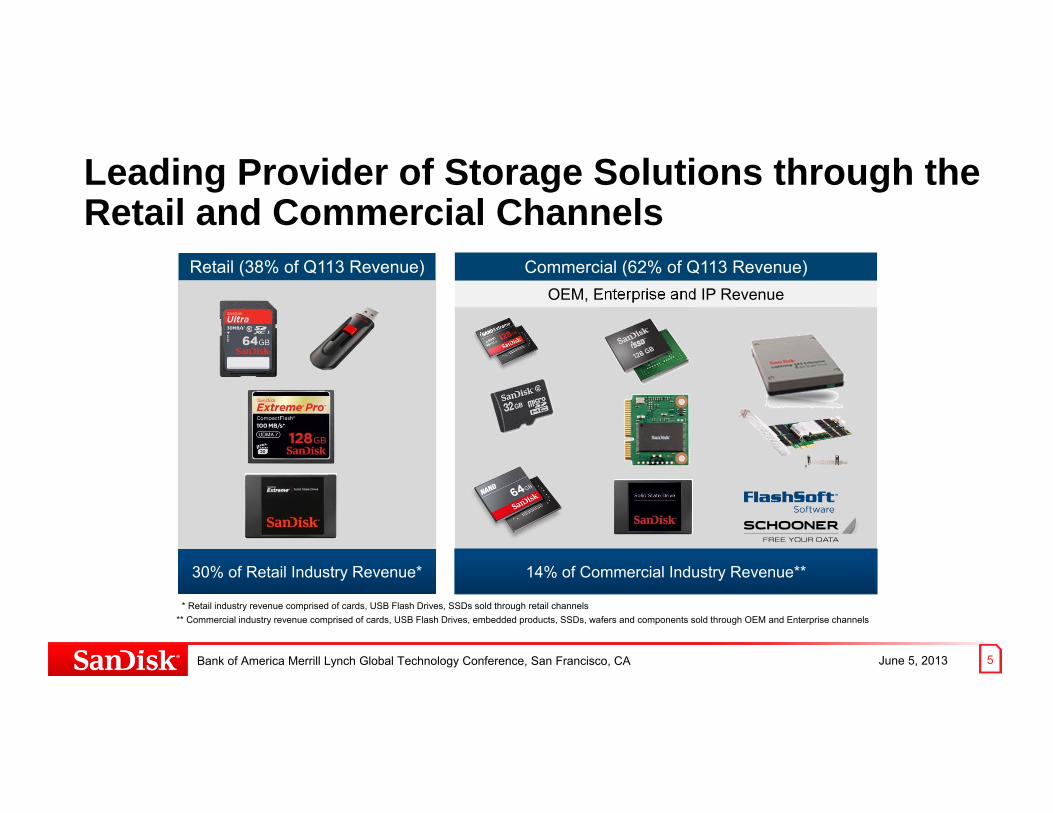
Leading Provider of Storage Solutions through the Retail and Commercial Channels
Bank of America Merrill Lynch Global Technology Conference, San Francisco, CA
Retail (38% of Q113 Revenue) Commercial (62% of Q113 Revenue)OEM, Enterprise and IP Revenue
30% of Retail Industry Revenue* 14% of Commercial Industry Revenue**
* Retail industry revenue comprised of cards, USB Flash Drives, SSDs sold through retail channels** Commercial industry revenue comprised of cards, USB Flash Drives, embedded products, SSDs, wafers and components sold through OEM and Enterprise channels
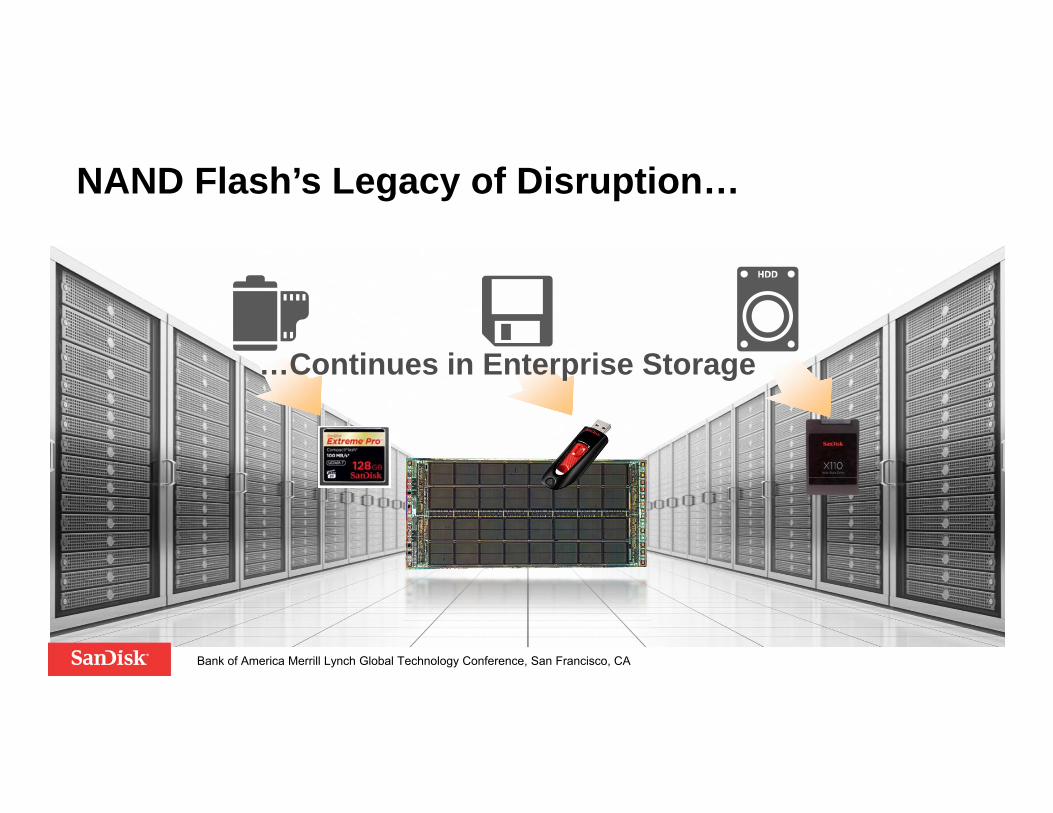
NAND Flash’s Legacy of Disruption…
…Continues in Enterprise Storage
Bank of America Merrill Lynch Global Technology Conference, San Francisco, CA
June 5, 2013 7
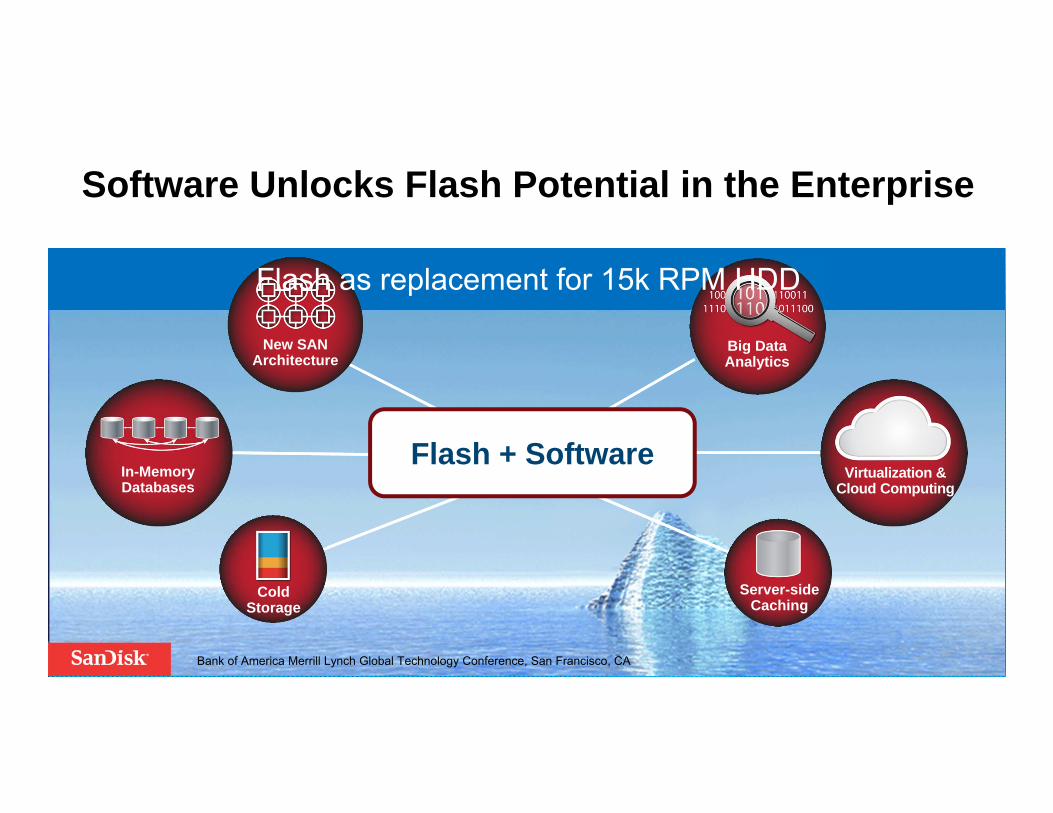
Software Unlocks Flash Potential in the Enterprise
7
Flash + Software
New SAN Architecture
In-MemoryDatabases
ColdStorage
Big DataAnalytics
Virtualization &Cloud Computing
Server-sideCaching
Flash as replacement for 15k RPM HDD
Bank of America Merrill Lynch Global Technology Conference, San Francisco, CA
June 5, 2013 8
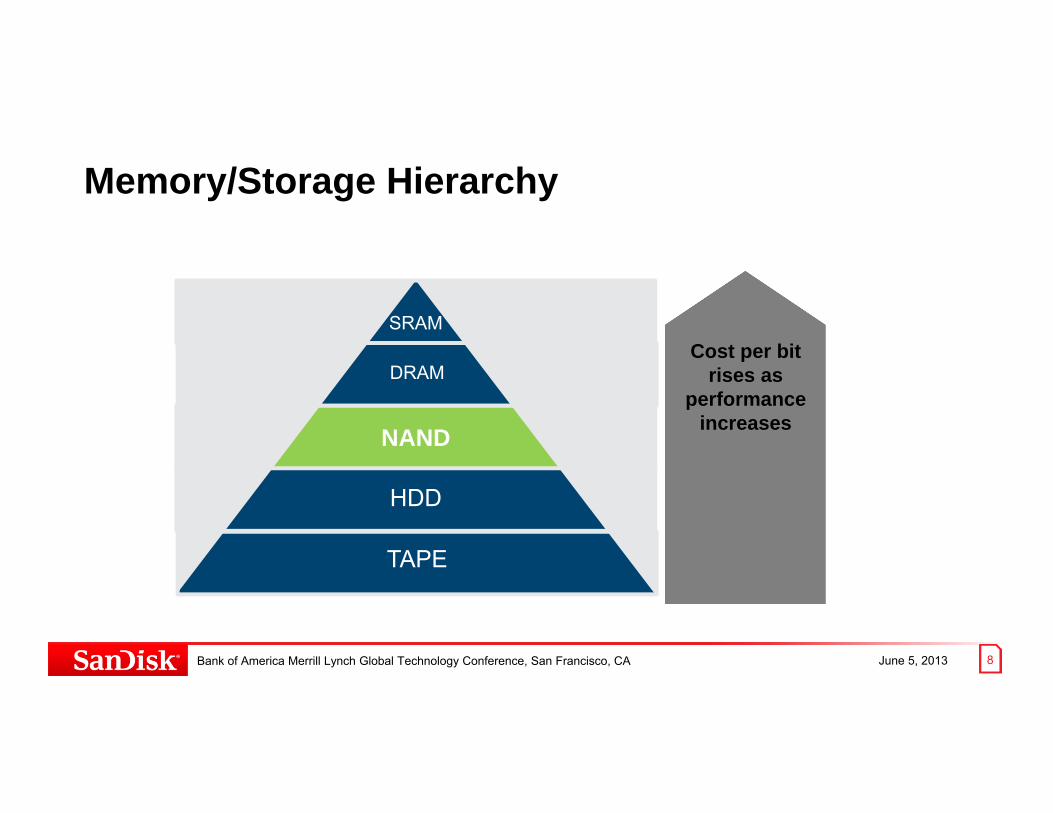
SRAM
DRAM
HDD
TAPE
Memory/Storage Hierarchy
Cost per bitrises as
performanceincreasesNAND
Bank of America Merrill Lynch Global Technology Conference, San Francisco, CA
June 5, 2013 9
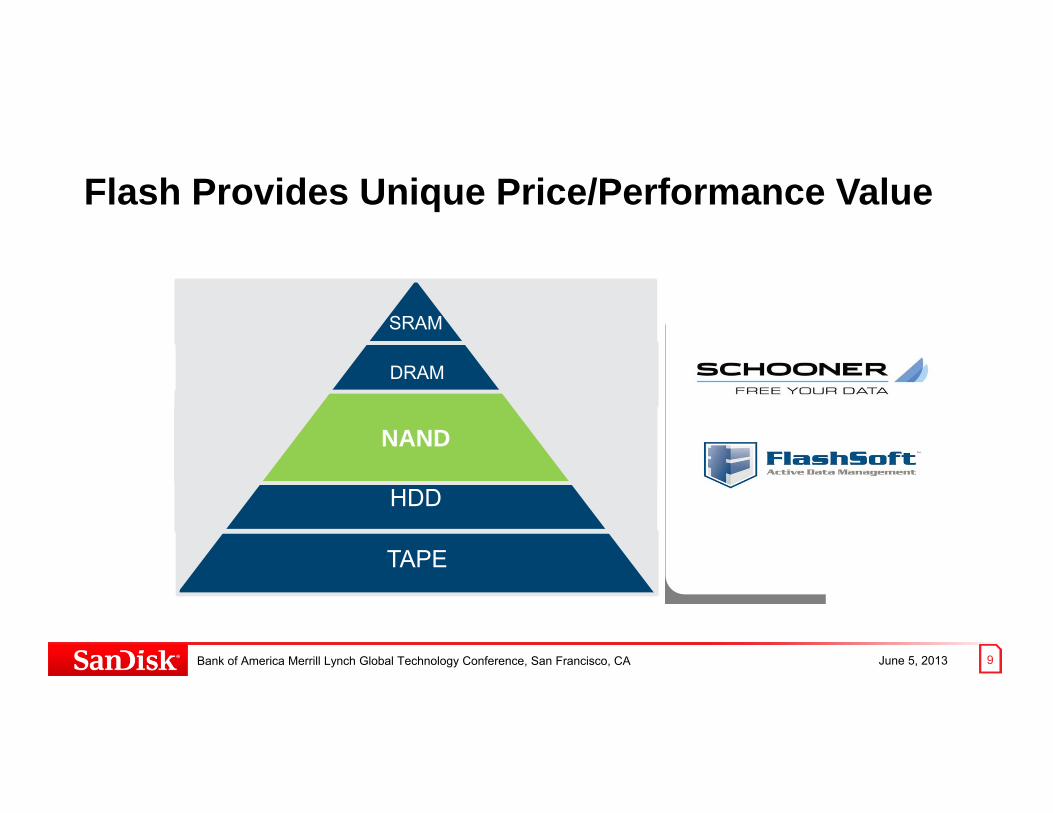
NAND
SRAM
DRAM
HDD
TAPE
Flash Provides Unique Price/Performance Value
Cost per bitrises as
performanceincreasesNAND
Bank of America Merrill Lynch Global Technology Conference, San Francisco, CA
June 5, 2013 10
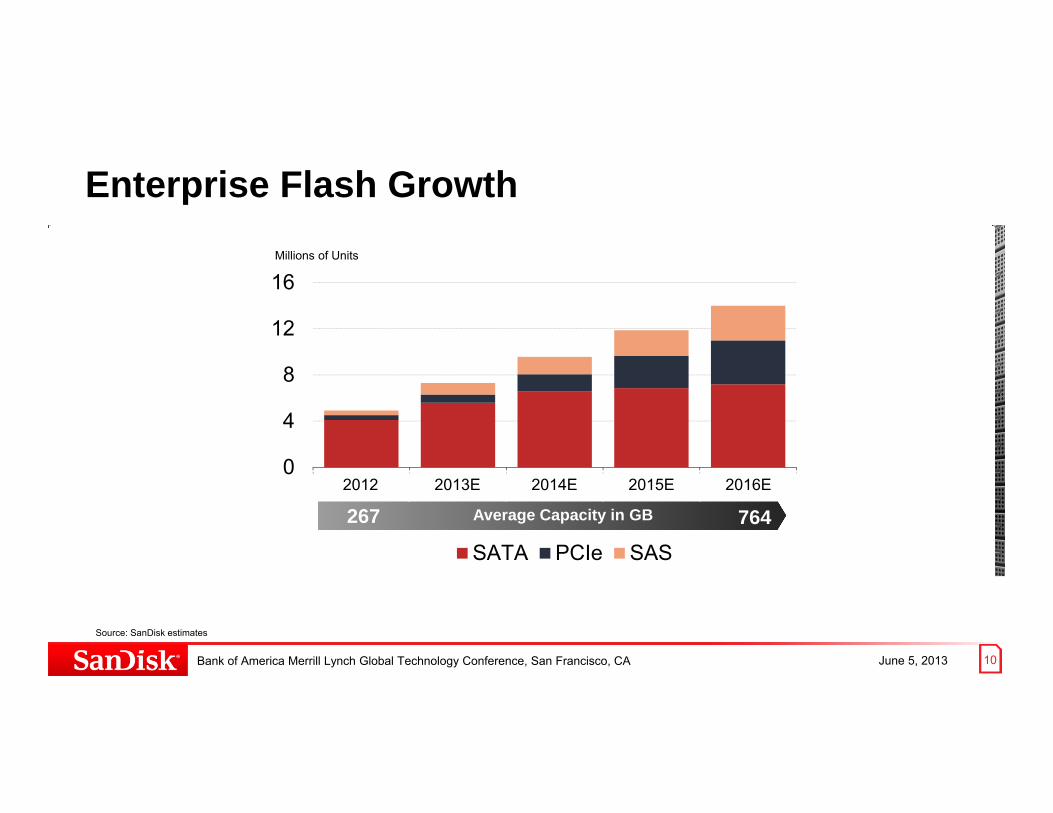
Enterprise Flash Growth
Bank of America Merrill Lynch Global Technology Conference, San Francisco, CA
Millions of Units
Source: SanDisk estimates
0
4
8
12
16
SATA PCIe SAS
Average Capacity in GB 7642672012 2013E 2014E 2015E 2016E
June 5, 2013 11
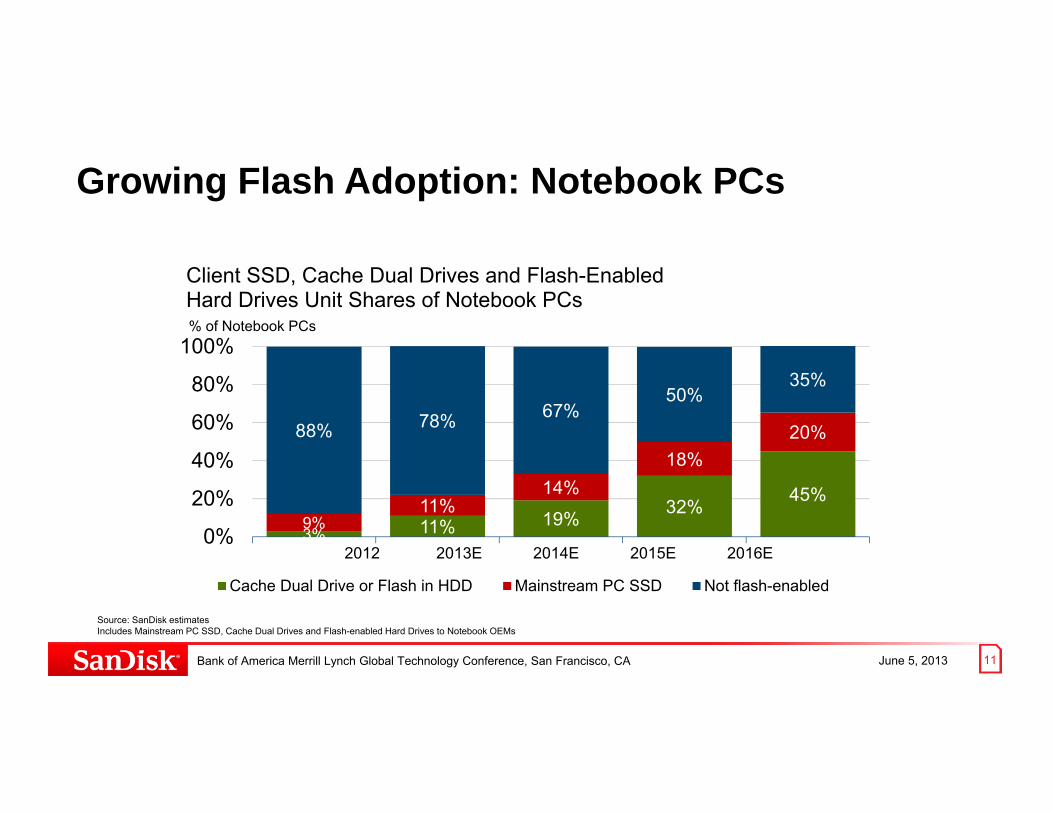
Growing Flash Adoption: Notebook PCs
Source: SanDisk estimatesIncludes Mainstream PC SSD, Cache Dual Drives and Flash-enabled Hard Drives to Notebook OEMs
3% 11% 19% 32% 45%9%
11%14%
18%20%88% 78% 67%
50%35%
0%
20%
40%
60%
80%
100%
Client SSD, Cache Dual Drives and Flash-Enabled Hard Drives Unit Shares of Notebook PCs
Cache Dual Drive or Flash in HDD Mainstream PC SSD Not flash-enabled
% of Notebook PCs
2012 2013E 2014E 2015E 2016E
Bank of America Merrill Lynch Global Technology Conference, San Francisco, CA
June 5, 2013 12
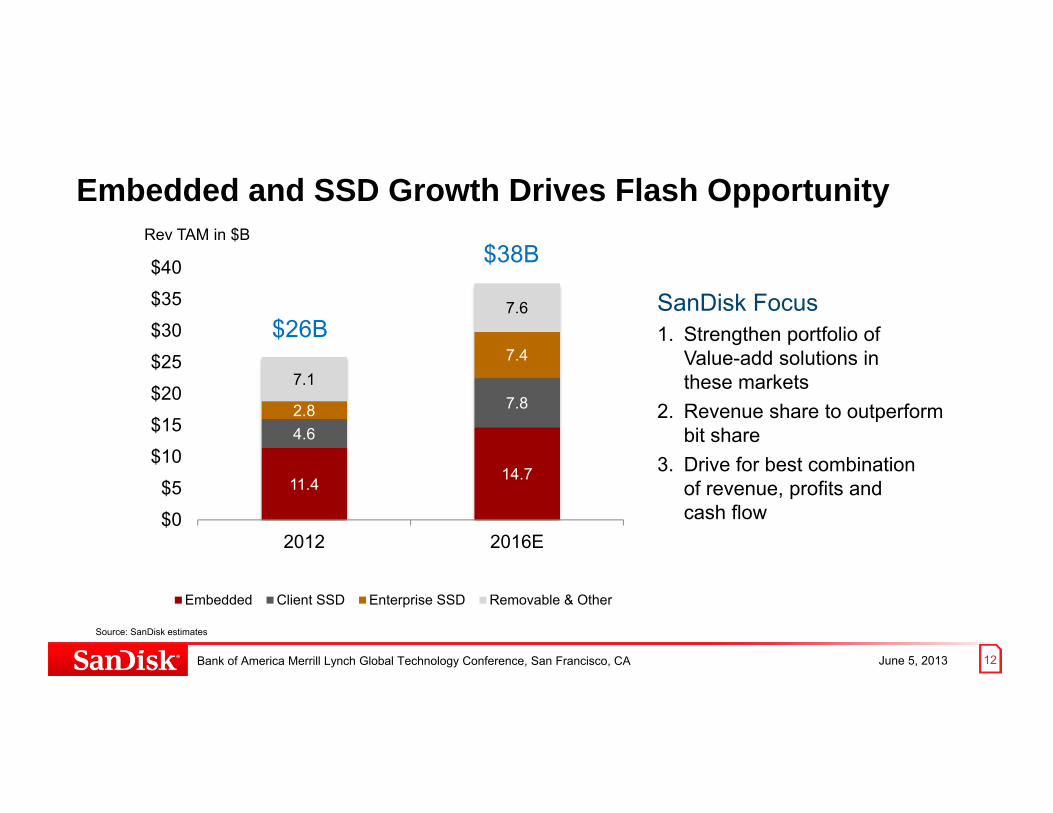
Embedded and SSD Growth Drives Flash Opportunity
Bank of America Merrill Lynch Global Technology Conference, San Francisco, CA
Source: SanDisk estimates
11.4 14.7
4.6
7.82.8
7.47.1
7.6
$0
$5
$10
$15
$20
$25
$30
$35
$40
2012 2016E
Embedded Client SSD Enterprise SSD Removable & Other
Rev TAM in $B
SanDisk Focus1. Strengthen portfolio of
Value-add solutions in these markets
2. Revenue share to outperform bit share
3. Drive for best combination of revenue, profits and cash flow
$26B
$38B
June 5, 2013 13
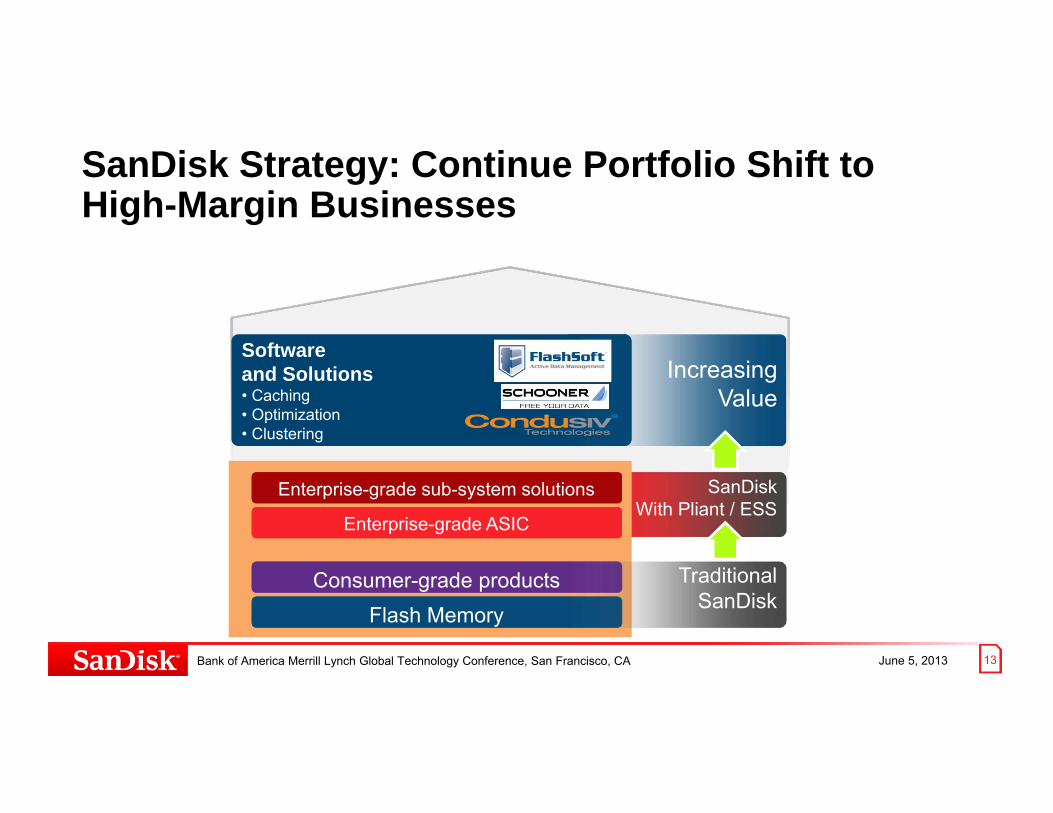
SanDisk With Pliant / ESS
Flash Memory
Software and Solutions• Caching • Optimization• Clustering
Consumer-grade products
Enterprise-grade ASIC
Enterprise-grade sub-system solutions
TraditionalSanDisk
Increasing Value
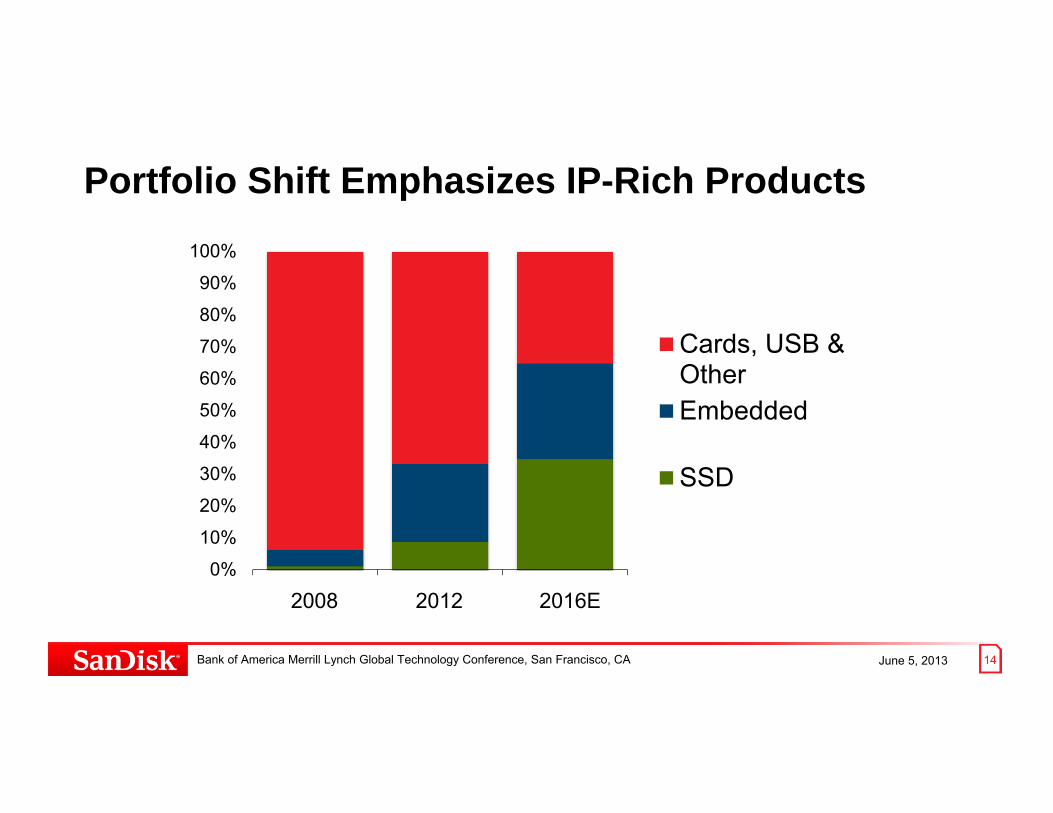
SanDisk Strategy: Continue Portfolio Shift to High-Margin Businesses
Bank of America Merrill Lynch Global Technology Conference, San Francisco, CA
June 5, 2013 14
Portfolio Shift Emphasizes IP-Rich Products
Bank of America Merrill Lynch Global Technology Conference, San Francisco, CA
0%
10%
20%
30%
40%
50%
60%
70%
80%
90%
100%
Cards, USB &OtherEmbedded
SSD
2008 2012 2016E
June 5, 2013 15
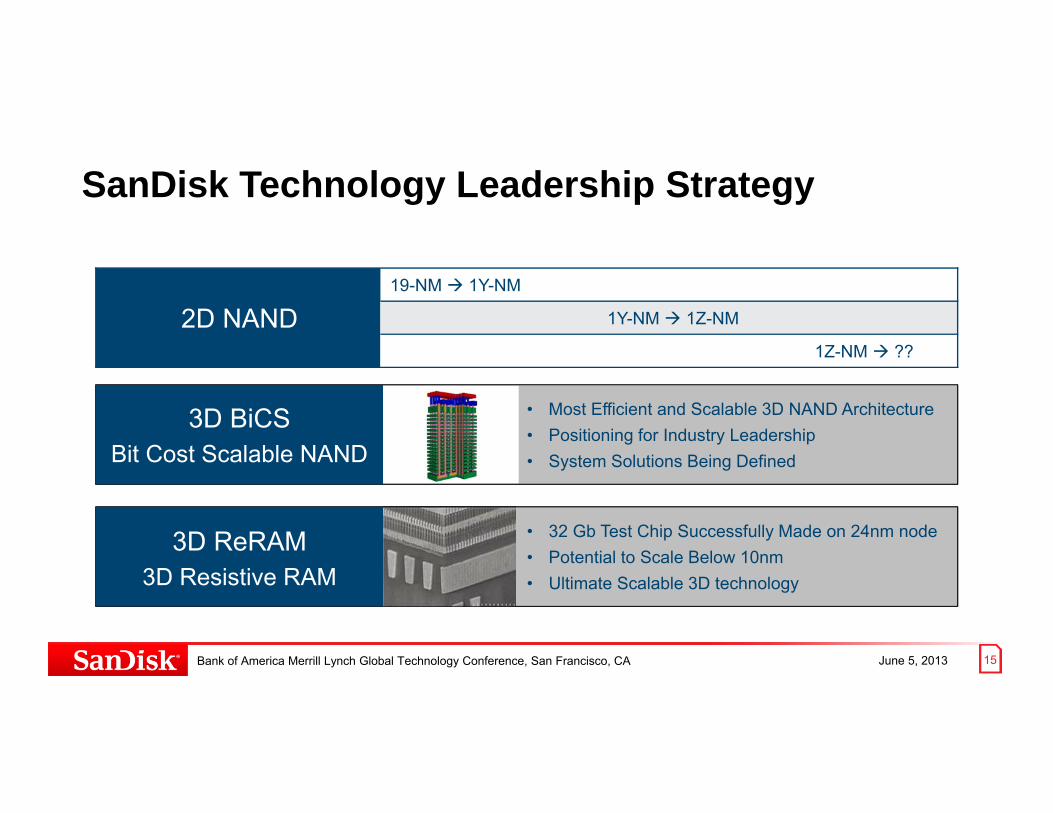
• Most Efficient and Scalable 3D NAND Architecture• Positioning for Industry Leadership• System Solutions Being Defined
SanDisk Technology Leadership Strategy
19-NM 1Y-NM
1Y-NM 1Z-NM
1Z-NM ??
2D NAND
• 32 Gb Test Chip Successfully Made on 24nm node• Potential to Scale Below 10nm • Ultimate Scalable 3D technology
3D BiCSBit Cost Scalable NAND
3D ReRAM3D Resistive RAM
Bank of America Merrill Lynch Global Technology Conference, San Francisco, CA
June 5, 2013 16
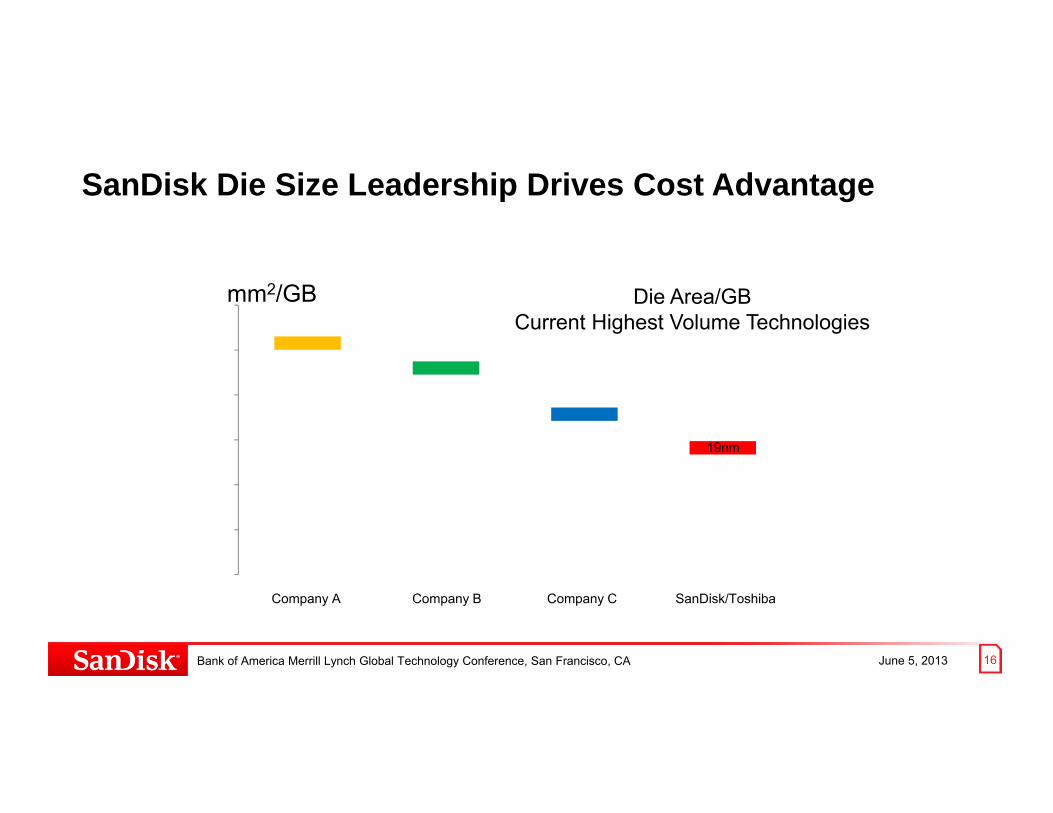
SanDisk Die Size Leadership Drives Cost Advantage
mm2/GB Die Area/GB Current Highest Volume Technologies
Company A Company B Company C SanDisk/Toshiba
19nm
Bank of America Merrill Lynch Global Technology Conference, San Francisco, CA
June 5, 2013 17
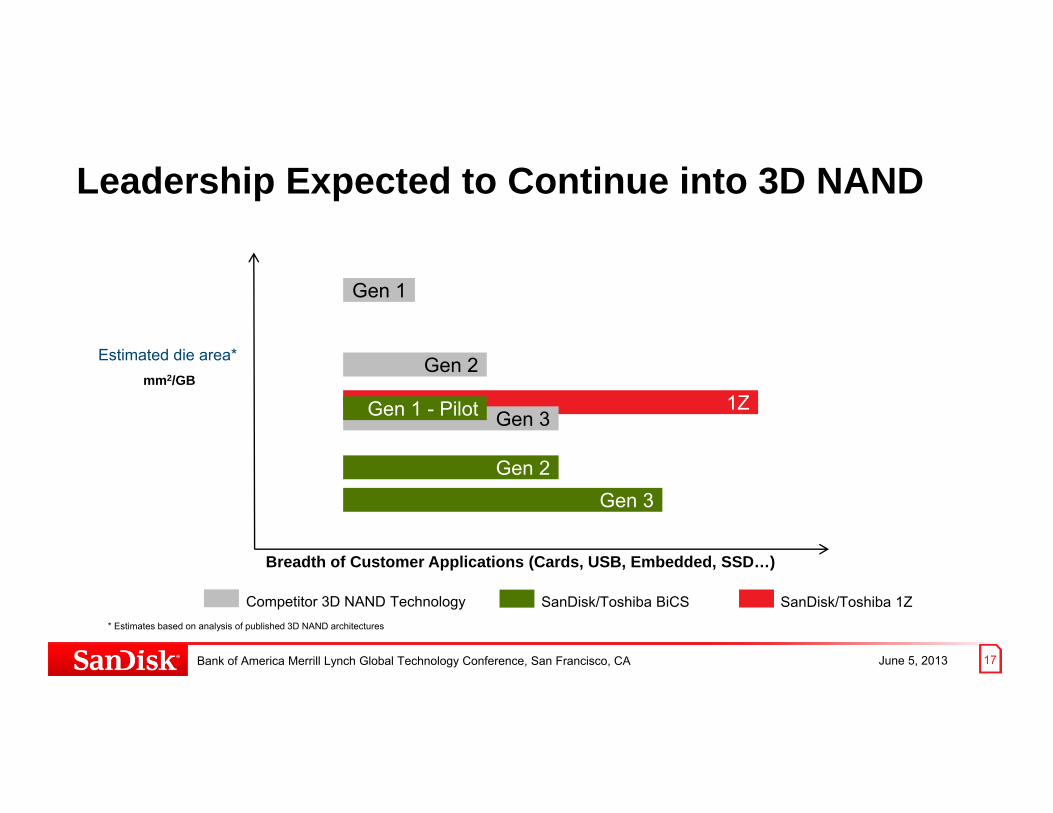
1Z
Leadership Expected to Continue into 3D NAND
Bank of America Merrill Lynch Global Technology Conference, San Francisco, CA
Competitor 3D NAND Technology SanDisk/Toshiba BiCS SanDisk/Toshiba 1Z
Gen 1
Gen 2
Gen 3Gen 1 - Pilot
Gen 2Gen 3
Breadth of Customer Applications (Cards, USB, Embedded, SSD…)
mm2/GB
* Estimates based on analysis of published 3D NAND architectures
Estimated die area*
June 5, 2013 18
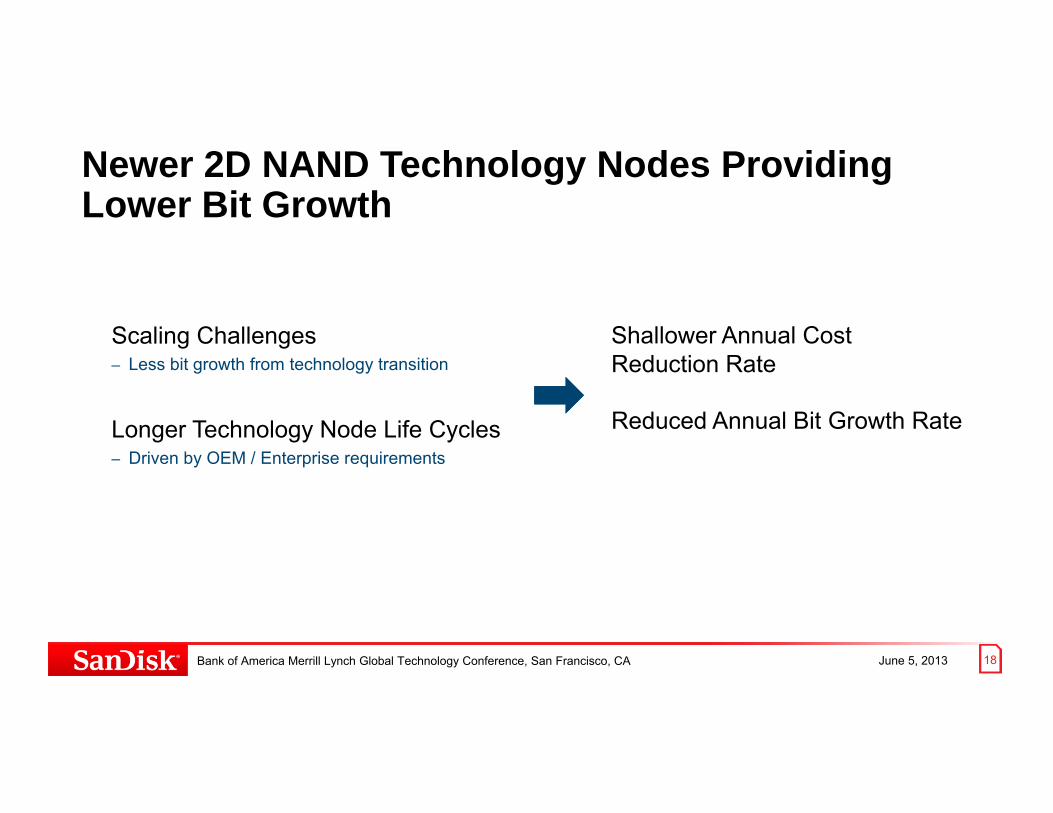
Newer 2D NAND Technology Nodes Providing Lower Bit Growth
Bank of America Merrill Lynch Global Technology Conference, San Francisco, CA
Scaling Challenges– Less bit growth from technology transition
Longer Technology Node Life Cycles– Driven by OEM / Enterprise requirements
Shallower Annual Cost Reduction Rate
Reduced Annual Bit Growth Rate
June 5, 2013 19
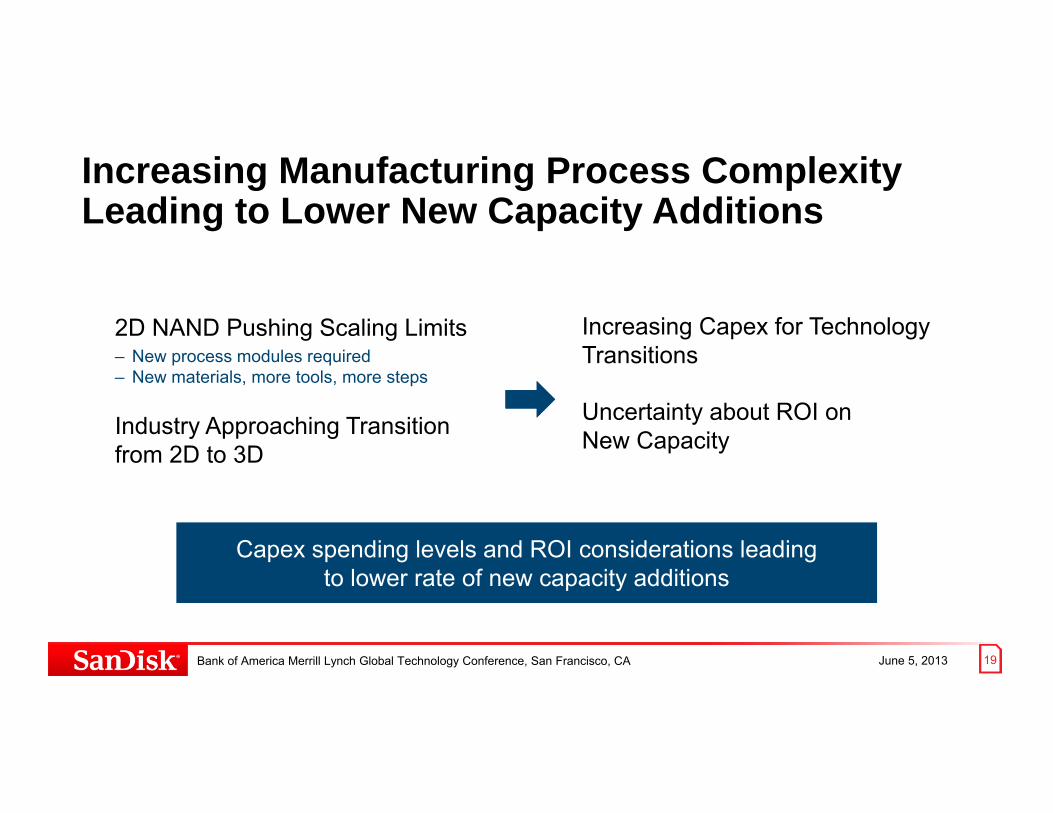
Increasing Manufacturing Process Complexity Leading to Lower New Capacity Additions
Bank of America Merrill Lynch Global Technology Conference, San Francisco, CA
Capex spending levels and ROI considerations leading to lower rate of new capacity additions
2D NAND Pushing Scaling Limits– New process modules required– New materials, more tools, more steps
Industry Approaching Transition from 2D to 3D
Increasing Capex for Technology Transitions
Uncertainty about ROI on New Capacity
June 5, 2013 20
1
10
100
1,000
10,000
100,000
2005 2006 2007 2008 2009 2010 2011 2012 2013F 2014F
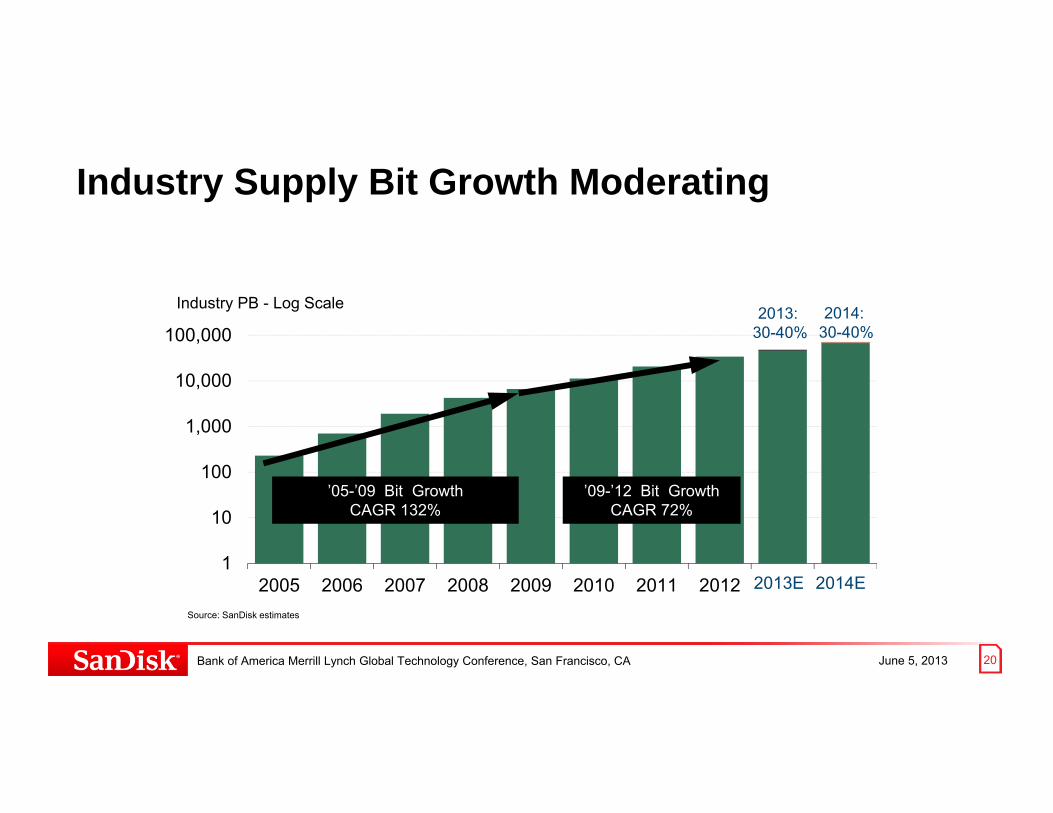
Industry PB - Log Scale
Industry Supply Bit Growth Moderating
2013: 30-40%
2014: 30-40%
’05-’09 Bit Growth CAGR 132%
’09-’12 Bit Growth CAGR 72%
2013E 2014E
Source: SanDisk estimates
Bank of America Merrill Lynch Global Technology Conference, San Francisco, CA
June 5, 2013 21
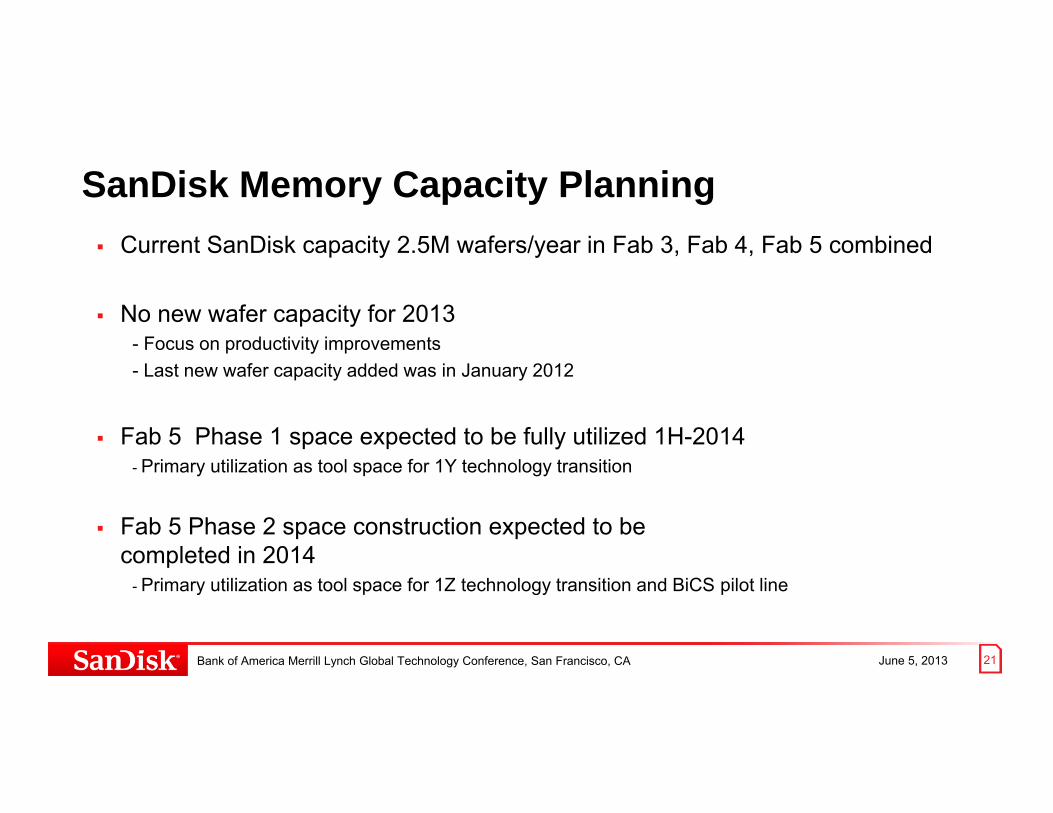
SanDisk Memory Capacity Planning Current SanDisk capacity 2.5M wafers/year in Fab 3, Fab 4, Fab 5 combined
No new wafer capacity for 2013- Focus on productivity improvements- Last new wafer capacity added was in January 2012
Fab 5 Phase 1 space expected to be fully utilized 1H-2014- Primary utilization as tool space for 1Y technology transition
Fab 5 Phase 2 space construction expected to be completed in 2014
- Primary utilization as tool space for 1Z technology transition and BiCS pilot line
Bank of America Merrill Lynch Global Technology Conference, San Francisco, CA
June 5, 2013 22Bank of America Merrill Lynch Global Technology Conference, San Francisco, CA
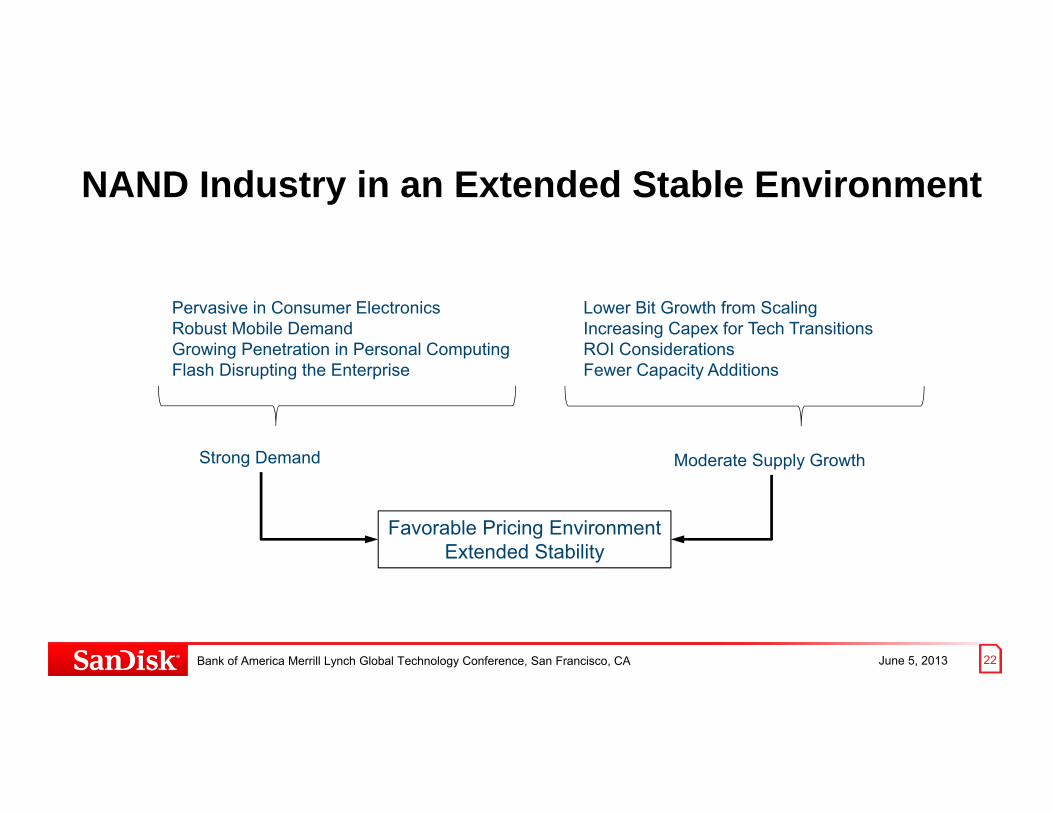
NAND Industry in an Extended Stable Environment
Lower Bit Growth from ScalingIncreasing Capex for Tech TransitionsROI ConsiderationsFewer Capacity Additions
Moderate Supply Growth
Favorable Pricing EnvironmentExtended Stability
Pervasive in Consumer ElectronicsRobust Mobile DemandGrowing Penetration in Personal ComputingFlash Disrupting the Enterprise
Strong Demand
June 5, 2013 23
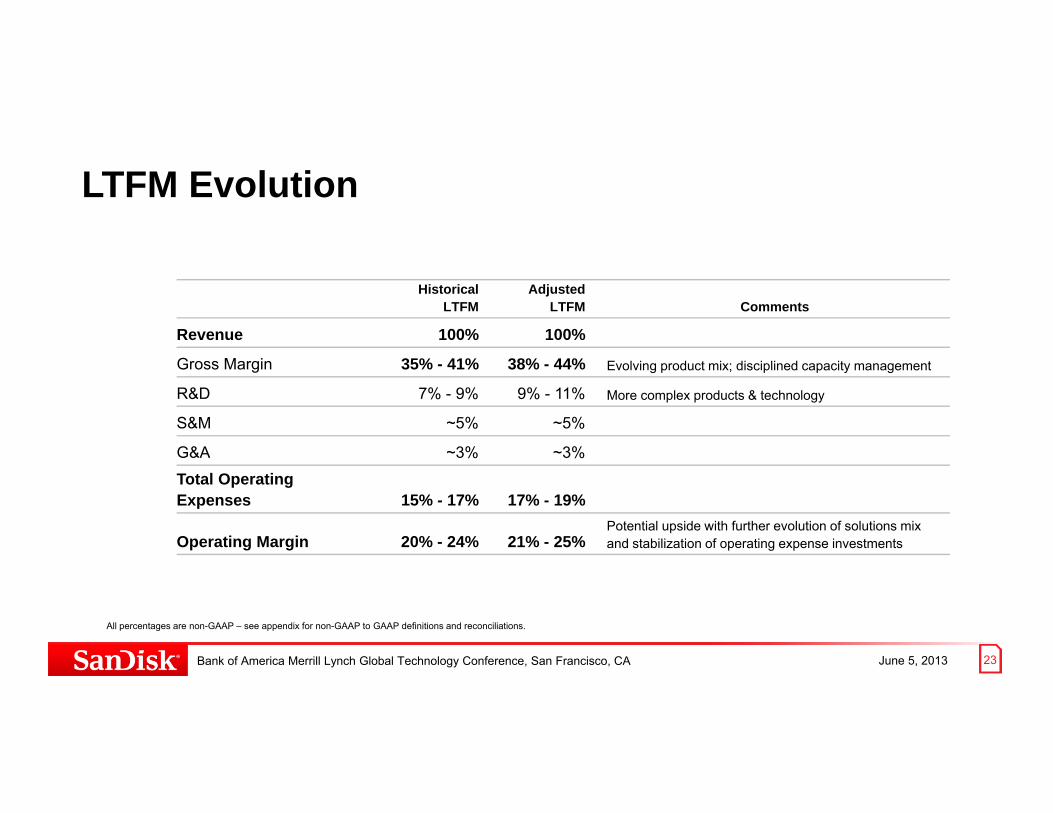
LTFM Evolution
All percentages are non-GAAP – see appendix for non-GAAP to GAAP definitions and reconciliations.
HistoricalLTFM
AdjustedLTFM Comments
Revenue 100% 100%
Gross Margin 35% - 41% 38% - 44% Evolving product mix; disciplined capacity management
R&D 7% - 9% 9% - 11% More complex products & technology
S&M ~5% ~5%
G&A ~3% ~3%
Total Operating Expenses 15% - 17% 17% - 19%
Operating Margin 20% - 24% 21% - 25%Potential upside with further evolution of solutions mix and stabilization of operating expense investments
Bank of America Merrill Lynch Global Technology Conference, San Francisco, CA
June 5, 2013 24
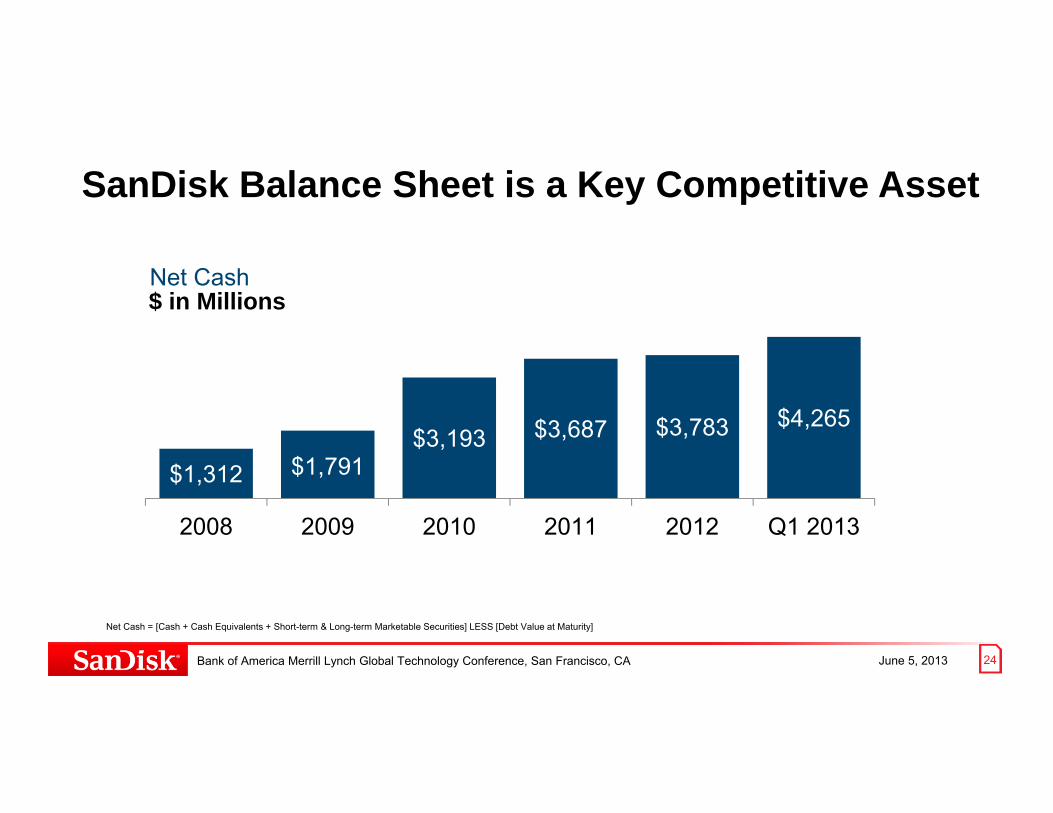
$1,312 $1,791$3,193 $3,687 $3,783 $4,265
2008 2009 2010 2011 2012 Q1 2013
$ in Millions
SanDisk Balance Sheet is a Key Competitive Asset
Net Cash = [Cash + Cash Equivalents + Short-term & Long-term Marketable Securities] LESS [Debt Value at Maturity]
Net Cash
Bank of America Merrill Lynch Global Technology Conference, San Francisco, CA
June 5, 2013 25
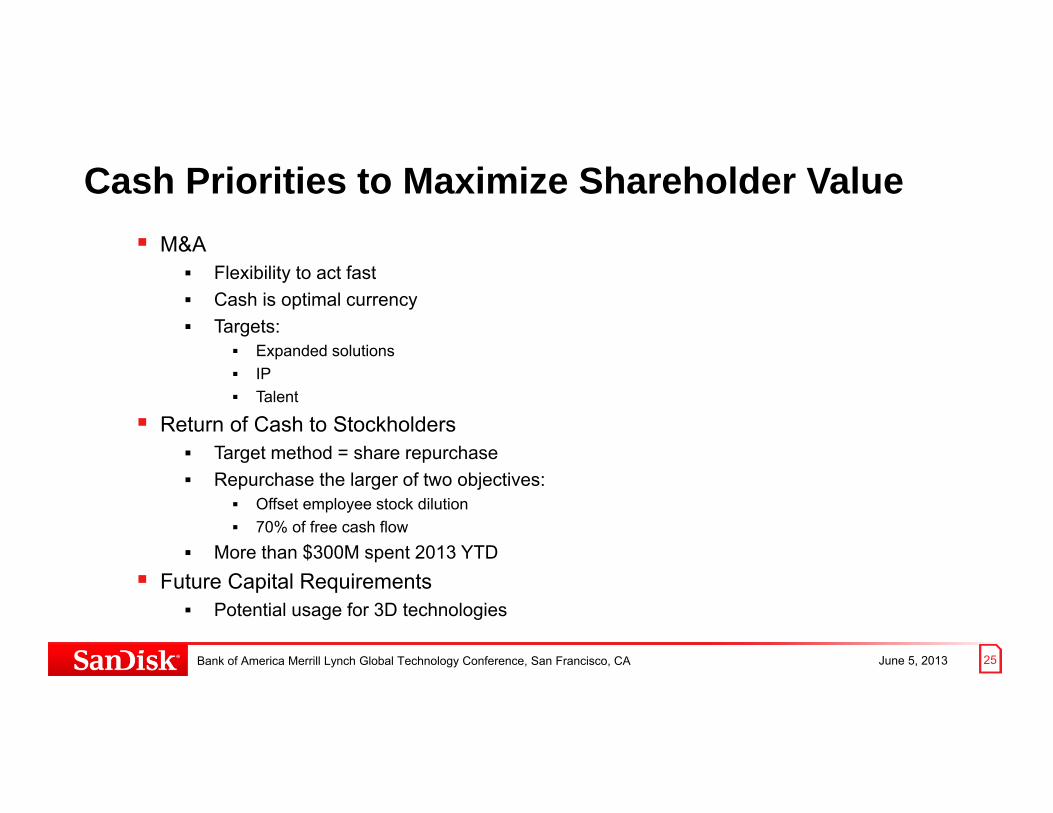
Cash Priorities to Maximize Shareholder Value M&A
Flexibility to act fast Cash is optimal currency Targets:
Expanded solutions IP Talent
Return of Cash to Stockholders Target method = share repurchase Repurchase the larger of two objectives:
Offset employee stock dilution 70% of free cash flow
More than $300M spent 2013 YTD Future Capital Requirements
Potential usage for 3D technologies
Bank of America Merrill Lynch Global Technology Conference, San Francisco, CA
June 5, 2013 26
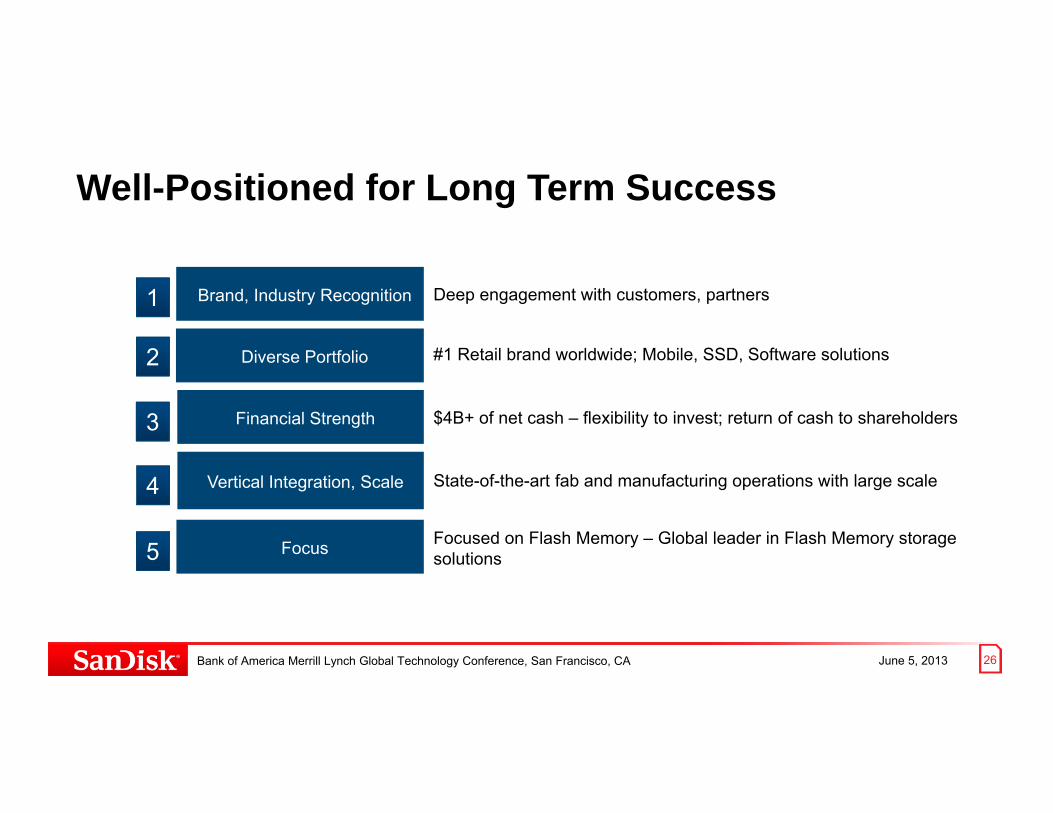
Well-Positioned for Long Term Success
Brand, Industry Recognition Deep engagement with customers, partners1
Diverse Portfolio #1 Retail brand worldwide; Mobile, SSD, Software solutions2
Financial Strength $4B+ of net cash – flexibility to invest; return of cash to shareholders3
Vertical Integration, Scale State-of-the-art fab and manufacturing operations with large scale4
Focus5Focused on Flash Memory – Global leader in Flash Memory storage solutions
Bank of America Merrill Lynch Global Technology Conference, San Francisco, CA
June 5, 2013 27Bank of America Merrill Lynch Global Technology Conference, San Francisco, CA
Thank You!
June 5, 2013 28
AppendicesBasis of Presentation for Non-GAAP to GAAP Reconciliations
Reconciliation of Non-GAAP to GAAP for Adjusted Long-term Financial ModelNon-GAAP to GAAP Reconciliations for Historical Results
Copyright & Trademarks
Bank of America Merrill Lynch Global Technology Conference, San Francisco, CA
June 5, 2013 29
To supplement our condensed consolidated financial statements presented in accordance with generally accepted accounting principles(GAAP), we use non-GAAP measures of operating results, net income and net income per share, which are adjusted from results basedon GAAP to exclude certain expenses, gains and losses. These non-GAAP financial measures are provided to enhance the user'soverall understanding of our current financial performance and our prospects for the future. Specifically, we believe the non-GAAPresults provide useful information to both management and investors as these non-GAAP results exclude certain expenses, gains andlosses that we believe are not indicative of our core operating results and because it is consistent with the financial models andestimates published by many analysts who follow the Company. For example, because the non-GAAP results exclude the expenses werecorded for share-based compensation, amortization and write-off of acquisition-related intangible assets related to acquisitions ofMatrix Semiconductor, Inc. in January 2006, msystems Ltd. in November 2006, Pliant Technology, Inc. in May 2011, FlashSoftCorporation in February 2012 and Schooner Information Technology, Inc. in June 2012, non-cash economic interest expenseassociated with the convertible debt, non-cash change in fair value of the liability component of the repurchased portion of theconvertible debt and related tax adjustments, we believe the inclusion of non-GAAP financial measures provides consistency in ourfinancial reporting. These non-GAAP results are some of the primary indicators management uses for assessing our performance,allocating resources and planning and forecasting future periods. Further, management uses non-GAAP information that excludescertain non-cash charges, such as amortization and write-off of acquisition-related intangible assets, share-based compensation, non-cash economic interest expense associated with the convertible debt, non-cash change in fair value of the liability component of therepurchased portion of the convertible debt and related tax adjustments, as these non-GAAP charges do not reflect the cash operatingresults of the business or the ongoing results. These measures should be considered in addition to results prepared in accordance withGAAP, but should not be considered a substitute for, or superior to, GAAP results. These non-GAAP measures may be different thanthe non-GAAP measures used by other companies.
Basis of Presentation for non-GAAP to GAAP Operating Results
Bank of America Merrill Lynch Global Technology Conference, San Francisco, CA
June 5, 2013 30
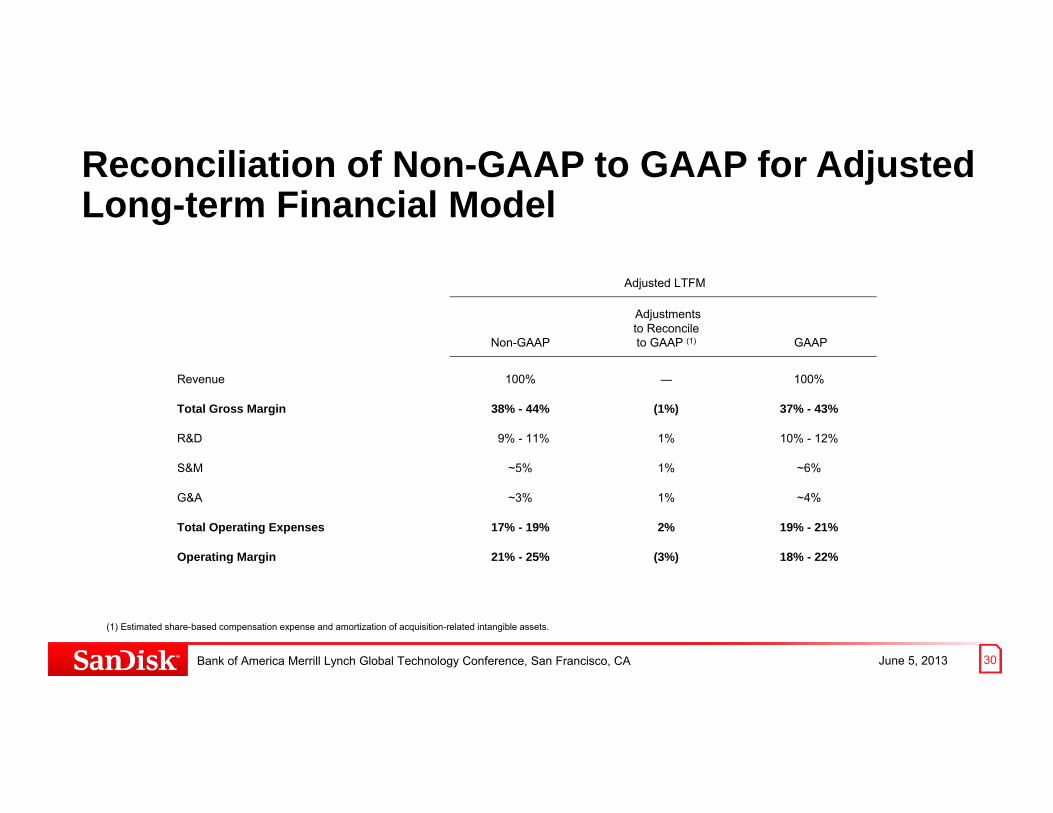
Reconciliation of Non-GAAP to GAAP for Adjusted Long-term Financial Model
(1) Estimated share-based compensation expense and amortization of acquisition-related intangible assets.
Adjusted LTFM
Non-GAAP
Adjustments to Reconcile to GAAP (1) GAAP
Revenue 100% ― 100%
Total Gross Margin 38% - 44% (1%) 37% - 43%
R&D 9% - 11% 1% 10% - 12%
S&M ~5% 1% ~6%
G&A ~3% 1% ~4%
Total Operating Expenses 17% - 19% 2% 19% - 21%
Operating Margin 21% - 25% (3%) 18% - 22%
Bank of America Merrill Lynch Global Technology Conference, San Francisco, CA
June 5, 2013 31
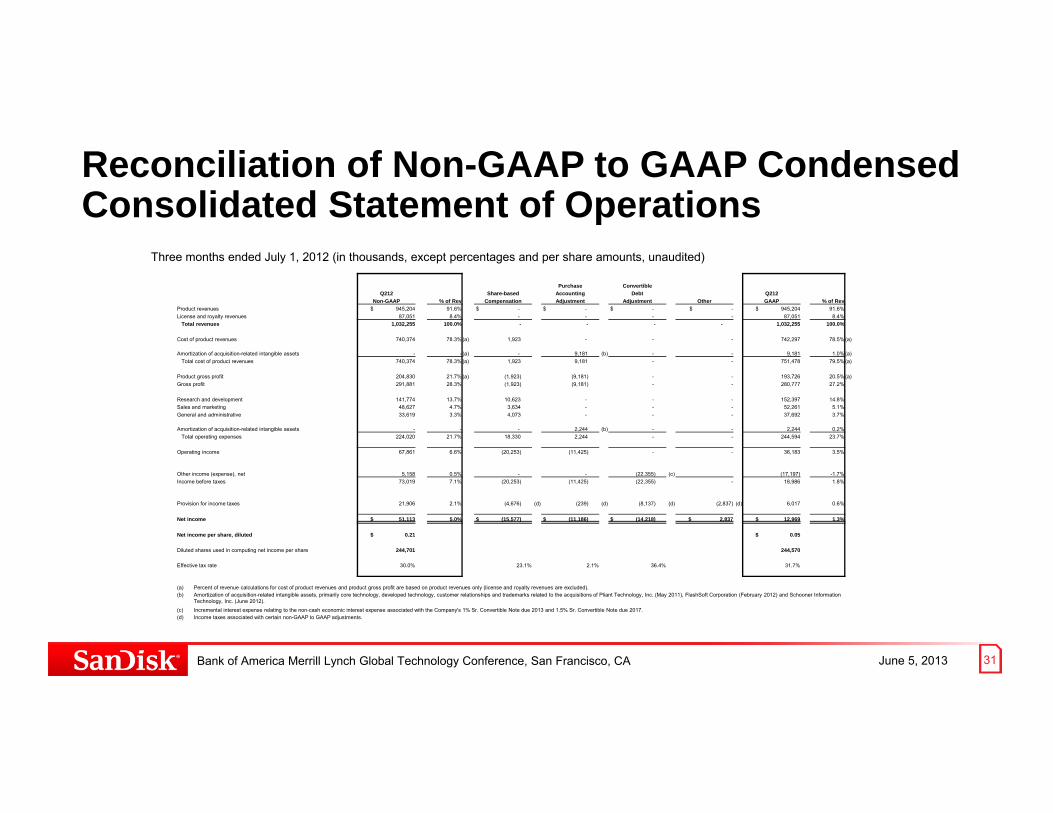
Reconciliation of Non-GAAP to GAAP Condensed Consolidated Statement of Operations
Three months ended July 1, 2012 (in thousands, except percentages and per share amounts, unaudited)
Purchase ConvertibleQ212 Share-based Accounting Debt Q212
Non-GAAP % of Rev Compensation Adjustment Adjustment Other GAAP % of RevProduct revenues $ 945,204 91.6% $ - $ - $ - $ - $ 945,204 91.6%License and royalty revenues 87,051 8.4% - - - - 87,051 8.4%
Total revenues 1,032,255 100.0% - - - - 1,032,255 100.0%
Cost of product revenues 740,374 78.3% (a) 1,923 - - - 742,297 78.5% (a)
Amortization of acquisition-related intangible assets - - (a) - 9,181 (b) - - 9,181 1.0% (a)Total cost of product revenues 740,374 78.3% (a) 1,923 9,181 - - 751,478 79.5% (a)
Product gross profit 204,830 21.7% (a) (1,923) (9,181) - - 193,726 20.5% (a)Gross profit 291,881 28.3% (1,923) (9,181) - - 280,777 27.2%
Research and development 141,774 13.7% 10,623 - - - 152,397 14.8%Sales and marketing 48,627 4.7% 3,634 - - - 52,261 5.1%General and administrative 33,619 3.3% 4,073 - - - 37,692 3.7%
Amortization of acquisition-related intangible assets - - - 2,244 (b) - - 2,244 0.2%Total operating expenses 224,020 21.7% 18,330 2,244 - - 244,594 23.7%
Operating income 67,861 6.6% (20,253) (11,425) - - 36,183 3.5%
Other income (expense), net 5,158 0.5% - - (22,355) (c) (17,197) -1.7%Income before taxes 73,019 7.1% (20,253) (11,425) (22,355) - 18,986 1.8%
Provision for income taxes 21,906 2.1% (4,676) (d) (239) (d) (8,137) (d) (2,837) (d) 6,017 0.6%
Net income $ 51,113 5.0% $ (15,577) $ (11,186) $ (14,218) $ 2,837 $ 12,969 1.3%
Net income per share, diluted $ 0.21 $ 0.05
Diluted shares used in computing net income per share 244,701 244,570
Effective tax rate 30.0% 23.1% 2.1% 36.4% 31.7%
(a) Percent of revenue calculations for cost of product revenues and product gross profit are based on product revenues only (license and royalty revenues are excluded).(b) Amortization of acquisition-related intangible assets, primarily core technology, developed technology, customer relationships and trademarks related to the acquisitions of Pliant Technology, Inc. (May 2011), FlashSoft Corporation (February 2012) and Schooner Information
Technology, Inc. (June 2012).(c) Incremental interest expense relating to the non-cash economic interest expense associated with the Company's 1% Sr. Convertible Note due 2013 and 1.5% Sr. Convertible Note due 2017.(d) Income taxes associated with certain non-GAAP to GAAP adjustments.
Bank of America Merrill Lynch Global Technology Conference, San Francisco, CA
June 5, 2013 32
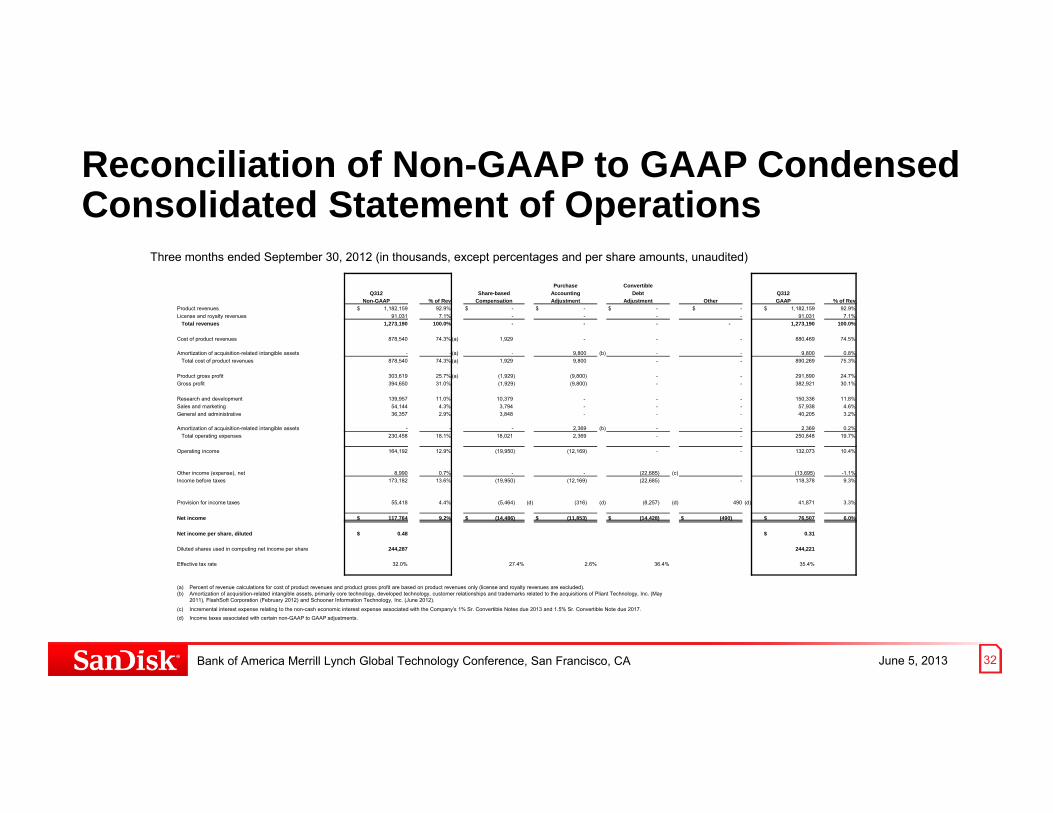
Reconciliation of Non-GAAP to GAAP Condensed Consolidated Statement of Operations
Three months ended September 30, 2012 (in thousands, except percentages and per share amounts, unaudited)
Purchase ConvertibleQ312 Share-based Accounting Debt Q312
Non-GAAP % of Rev Compensation Adjustment Adjustment Other GAAP % of RevProduct revenues $ 1,182,159 92.9% $ - $ - $ - $ - $ 1,182,159 92.9%License and royalty revenues 91,031 7.1% - - - - 91,031 7.1%
Total revenues 1,273,190 100.0% - - - - 1,273,190 100.0%
Cost of product revenues 878,540 74.3% (a) 1,929 - - - 880,469 74.5%
Amortization of acquisition-related intangible assets - - (a) - 9,800 (b) - - 9,800 0.8%Total cost of product revenues 878,540 74.3% (a) 1,929 9,800 - - 890,269 75.3%
Product gross profit 303,619 25.7% (a) (1,929) (9,800) - - 291,890 24.7%Gross profit 394,650 31.0% (1,929) (9,800) - - 382,921 30.1%
Research and development 139,957 11.0% 10,379 - - - 150,336 11.8%Sales and marketing 54,144 4.3% 3,794 - - - 57,938 4.6%General and administrative 36,357 2.9% 3,848 - - - 40,205 3.2%
Amortization of acquisition-related intangible assets - - - 2,369 (b) - - 2,369 0.2%Total operating expenses 230,458 18.1% 18,021 2,369 - - 250,848 19.7%
Operating income 164,192 12.9% (19,950) (12,169) - - 132,073 10.4%
Other income (expense), net 8,990 0.7% - - (22,685) (c) (13,695) -1.1%Income before taxes 173,182 13.6% (19,950) (12,169) (22,685) - 118,378 9.3%
Provision for income taxes 55,418 4.4% (5,464) (d) (316) (d) (8,257) (d) 490 (d) 41,871 3.3%
Net income $ 117,764 9.2% $ (14,486) $ (11,853) $ (14,428) $ (490) $ 76,507 6.0%
Net income per share, diluted $ 0.48 $ 0.31
Diluted shares used in computing net income per share 244,287 244,221
Effective tax rate 32.0% 27.4% 2.6% 36.4% 35.4%
(a) Percent of revenue calculations for cost of product revenues and product gross profit are based on product revenues only (license and royalty revenues are excluded).(b) Amortization of acquisition-related intangible assets, primarily core technology, developed technology, customer relationships and trademarks related to the acquisitions of Pliant Technology, Inc. (May
2011), FlashSoft Corporation (February 2012) and Schooner Information Technology, Inc. (June 2012).
(c) Incremental interest expense relating to the non-cash economic interest expense associated with the Company's 1% Sr. Convertible Notes due 2013 and 1.5% Sr. Convertible Note due 2017.(d) Income taxes associated with certain non-GAAP to GAAP adjustments.
Bank of America Merrill Lynch Global Technology Conference, San Francisco, CA
June 5, 2013 33
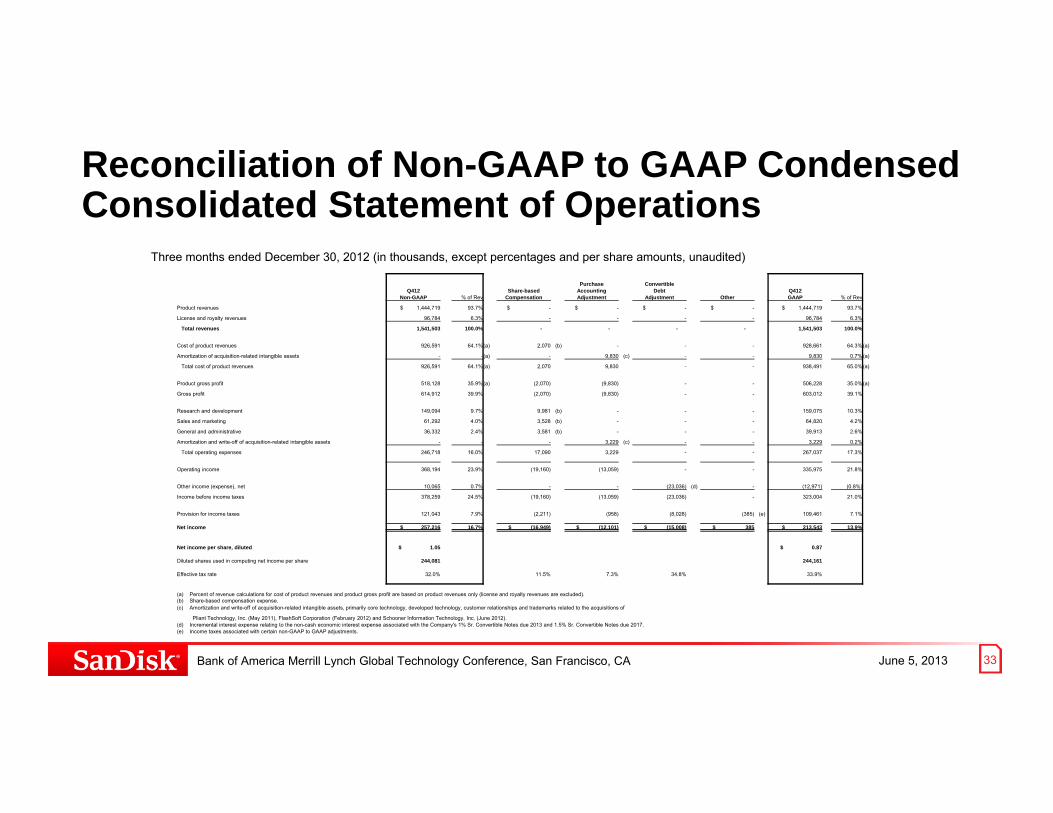
Reconciliation of Non-GAAP to GAAP Condensed Consolidated Statement of Operations
Three months ended December 30, 2012 (in thousands, except percentages and per share amounts, unaudited)
Purchase ConvertibleQ412 Share-based Accounting Debt Q412
Non-GAAP % of Rev Compensation Adjustment Adjustment Other GAAP % of Rev
Product revenues $ 1,444,719 93.7% $ - $ - $ - $ - $ 1,444,719 93.7%
License and royalty revenues 96,784 6.3% - - - - 96,784 6.3%
Total revenues 1,541,503 100.0% - - - - 1,541,503 100.0%
Cost of product revenues 926,591 64.1%(a) 2,070 (b) - - - 928,661 64.3%(a)
Amortization of acquisition-related intangible assets - -(a) - 9,830 (c) - - 9,830 0.7%(a)
Total cost of product revenues 926,591 64.1%(a) 2,070 9,830 - - 938,491 65.0%(a)
Product gross profit 518,128 35.9%(a) (2,070) (9,830) - - 506,228 35.0%(a)
Gross profit 614,912 39.9% (2,070) (9,830) - - 603,012 39.1%
Research and development 149,094 9.7% 9,981 (b) - - - 159,075 10.3%
Sales and marketing 61,292 4.0% 3,528 (b) - - - 64,820 4.2%
General and administrative 36,332 2.4% 3,581 (b) - - - 39,913 2.6%
Amortization and write-off of acquisition-related intangible assets - - - 3,229 (c) - - 3,229 0.2%
Total operating expenses 246,718 16.0% 17,090 3,229 - - 267,037 17.3%
Operating income 368,194 23.9% (19,160) (13,059) - - 335,975 21.8%
Other income (expense), net 10,065 0.7% - - (23,036) (d) - (12,971) (0.8%)
Income before income taxes 378,259 24.5% (19,160) (13,059) (23,036) - 323,004 21.0%
Provision for income taxes 121,043 7.9% (2,211) (958) (8,028) (385) (e) 109,461 7.1%
Net income $ 257,216 16.7% $ (16,949) $ (12,101) $ (15,008) $ 385 $ 213,543 13.9%
Net income per share, diluted $ 1.05 $ 0.87
Diluted shares used in computing net income per share 244,081 244,161
Effective tax rate 32.0% 11.5% 7.3% 34.8% 33.9%
(a) Percent of revenue calculations for cost of product revenues and product gross profit are based on product revenues only (license and royalty revenues are excluded).(b) Share-based compensation expense.(c) Amortization and write-off of acquisition-related intangible assets, primarily core technology, developed technology, customer relationships and trademarks related to the acquisitions of
Pliant Technology, Inc. (May 2011), FlashSoft Corporation (February 2012) and Schooner Information Technology, Inc. (June 2012).(d) Incremental interest expense relating to the non-cash economic interest expense associated with the Company's 1% Sr. Convertible Notes due 2013 and 1.5% Sr. Convertible Notes due 2017.(e) Income taxes associated with certain non-GAAP to GAAP adjustments.
Bank of America Merrill Lynch Global Technology Conference, San Francisco, CA
June 5, 2013 34
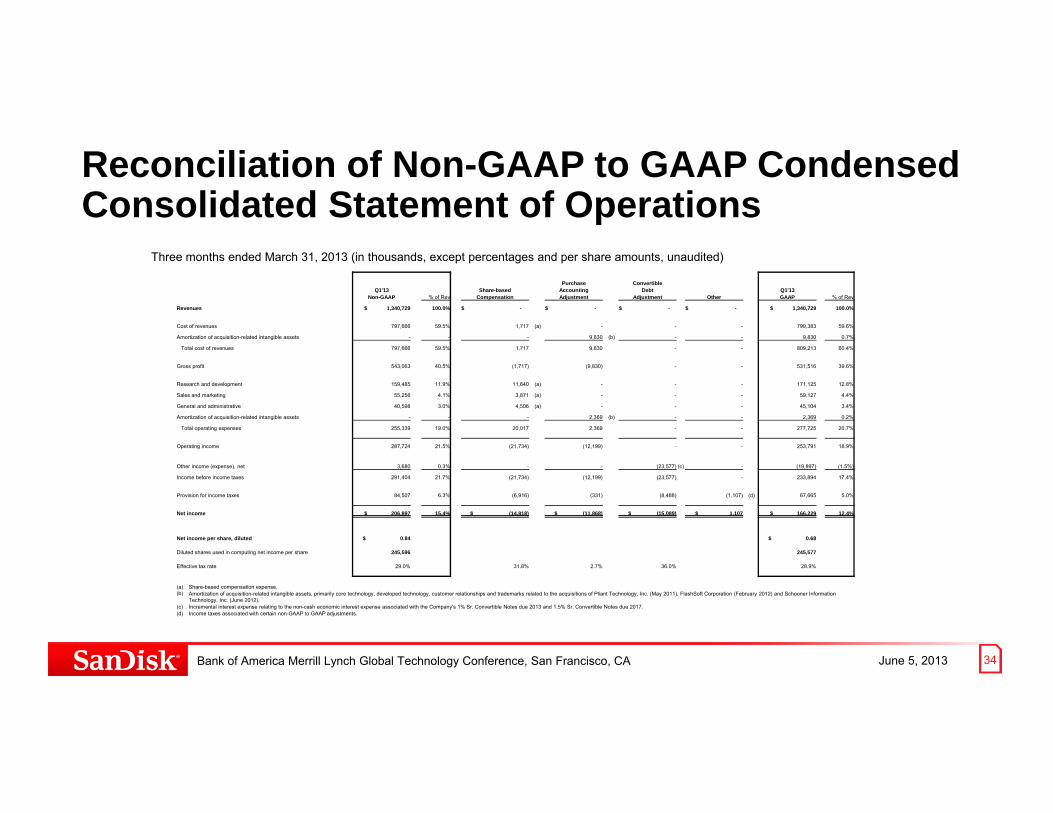
Reconciliation of Non-GAAP to GAAP Condensed Consolidated Statement of Operations
Three months ended March 31, 2013 (in thousands, except percentages and per share amounts, unaudited)
Purchase ConvertibleQ1'13 Share-based Accounting Debt Q1'13
Non-GAAP % of Rev Compensation Adjustment Adjustment Other GAAP % of Rev
Revenues $ 1,340,729 100.0% $ - $ - $ - $ - $ 1,340,729 100.0%
Cost of revenues 797,666 59.5% 1,717 (a) - - - 799,383 59.6%
Amortization of acquisition-related intangible assets - - - 9,830 (b) - - 9,830 0.7%
Total cost of revenues 797,666 59.5% 1,717 9,830 - - 809,213 60.4%
Gross profit 543,063 40.5% (1,717) (9,830) - - 531,516 39.6%
Research and development 159,485 11.9% 11,640 (a) - - - 171,125 12.8%
Sales and marketing 55,256 4.1% 3,871 (a) - - - 59,127 4.4%
General and administrative 40,598 3.0% 4,506 (a) - - - 45,104 3.4%
Amortization of acquisition-related intangible assets - - - 2,369 (b) - - 2,369 0.2%
Total operating expenses 255,339 19.0% 20,017 2,369 - - 277,725 20.7%
Operating income 287,724 21.5% (21,734) (12,199) - - 253,791 18.9%
Other income (expense), net 3,680 0.3% - - (23,577) (c) - (19,897) (1.5%)
Income before income taxes 291,404 21.7% (21,734) (12,199) (23,577) - 233,894 17.4%
Provision for income taxes 84,507 6.3% (6,916) (331) (8,488) (1,107) (d) 67,665 5.0%
Net income $ 206,897 15.4% $ (14,818) $ (11,868) $ (15,089) $ 1,107 $ 166,229 12.4%
Net income per share, diluted $ 0.84 $ 0.68
Diluted shares used in computing net income per share 245,596 245,577
Effective tax rate 29.0% 31.8% 2.7% 36.0% 28.9%
(a) Share-based compensation expense.(b) Amortization of acquisition-related intangible assets, primarily core technology, developed technology, customer relationships and trademarks related to the acquisitions of Pliant Technology, Inc. (May 2011), FlashSoft Corporation (February 2012) and Schooner Information
Technology, Inc. (June 2012).(c) Incremental interest expense relating to the non-cash economic interest expense associated with the Company's 1% Sr. Convertible Notes due 2013 and 1.5% Sr. Convertible Notes due 2017.(d) Income taxes associated with certain non-GAAP to GAAP adjustments.
Bank of America Merrill Lynch Global Technology Conference, San Francisco, CA
June 5, 2013 35
Copyrights & Trademarks
1GB = 1,000,000,000 bytes. Actual user storage less.
SanDisk, CompactFlash, SanDisk Ultra, SanDisk Extreme and SanDisk Extreme Pro are trademarks of SanDisk Corporation, registered in the United States and other countries. iNAND and iNAND Extreme are trademarks of SanDisk Corporation. Lightning is a U.S. registered trademark of SanDisk Enterprise IP LLC. FlashSoft is a trademark of SanDisk Enterprise IP LLC. microSD, microSDHC, microSDXC, SD, SDHC and SDXC marks and logos are trademarks of SD-3C, LLC. Other brand names mentioned herein are for identification purposes only and may be the trademarks of their respective holder(s).
© 2013 SanDisk Corporation. All rights reserved.
Bank of America Merrill Lynch Global Technology Conference, San Francisco, CA