Embed Size (px)
Citation preview
Bank of America, National Association
Hong Kong Branch
Interim Disclosure Statement
June 30, 2018
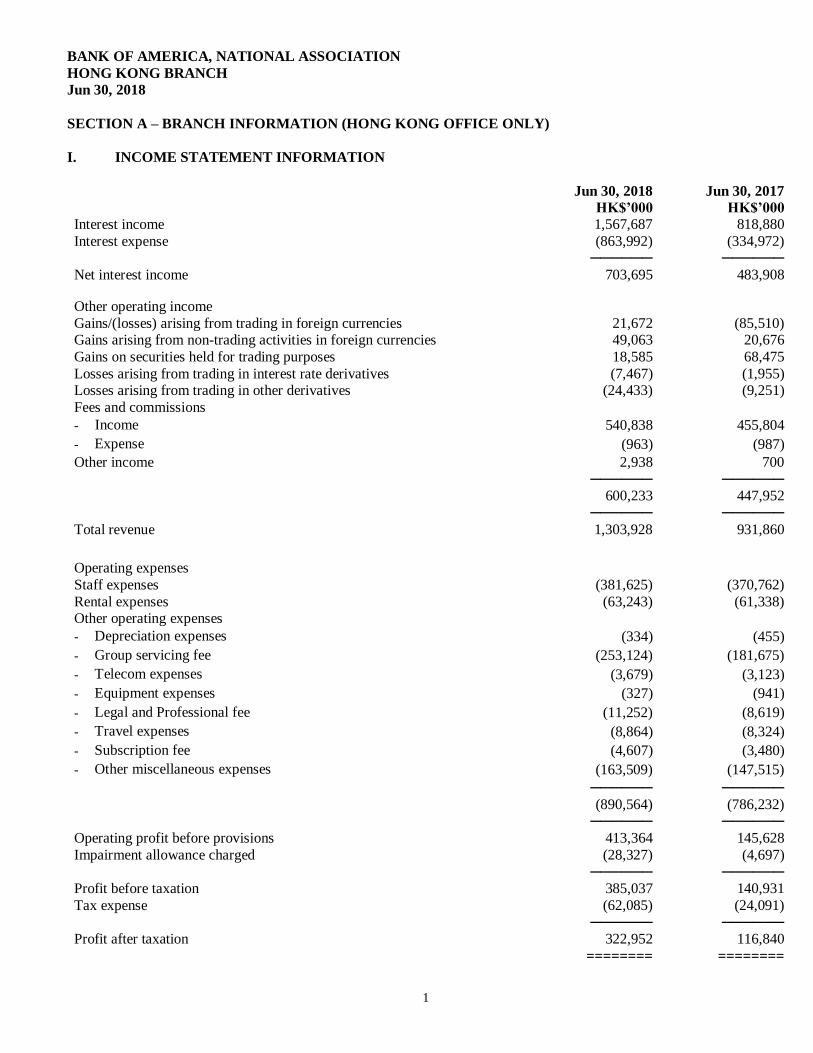
BANK OF AMERICA, NATIONAL ASSOCIATION
HONG KONG BRANCH
Jun 30, 2018
1
SECTION A – BRANCH INFORMATION (HONG KONG OFFICE ONLY)
I. INCOME STATEMENT INFORMATION
Jun 30, 2018 Jun 30, 2017 HK$’000 HK$’000
Interest income 1,567,687 818,880
Interest expense (863,992) (334,972) ────── ──────
Net interest income 703,695 483,908
Other operating income
Gains/(losses) arising from trading in foreign currencies 21,672 (85,510) Gains arising from non-trading activities in foreign currencies 49,063 20,676
Gains on securities held for trading purposes 18,585 68,475
Losses arising from trading in interest rate derivatives (7,467) (1,955) Losses arising from trading in other derivatives (24,433) (9,251)
Fees and commissions
- Income 540,838 455,804
- Expense (963) (987)
Other income 2,938 700 ────── ────── 600,233 447,952 ────── ──────
Total revenue 1,303,928 931,860
Operating expenses
Staff expenses (381,625) (370,762)
Rental expenses (63,243) (61,338) Other operating expenses
- Depreciation expenses (334) (455)
- Group servicing fee (253,124) (181,675)
- Telecom expenses (3,679) (3,123)
- Equipment expenses (327) (941)
- Legal and Professional fee (11,252) (8,619)
- Travel expenses (8,864) (8,324)
- Subscription fee (4,607) (3,480)
- Other miscellaneous expenses (163,509) (147,515) ────── ────── (890,564) (786,232) ────── ──────
Operating profit before provisions 413,364 145,628
Impairment allowance charged (28,327) (4,697) ────── ──────
Profit before taxation 385,037 140,931
Tax expense (62,085) (24,091) ────── ──────
Profit after taxation 322,952 116,840 ======== ========
BANK OF AMERICA, NATIONAL ASSOCIATION
HONG KONG BRANCH
Jun 30, 2018
2
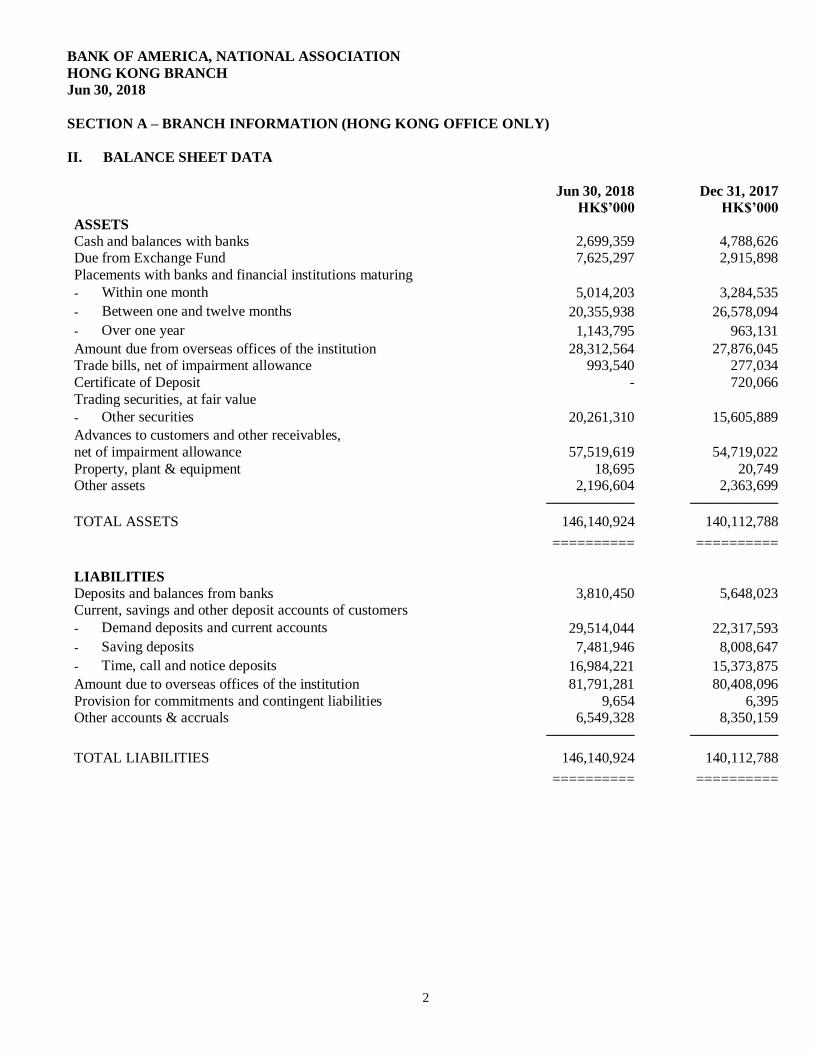
SECTION A – BRANCH INFORMATION (HONG KONG OFFICE ONLY)
II. BALANCE SHEET DATA
Jun 30, 2018 Dec 31, 2017 HK$’000 HK$’000
ASSETS
Cash and balances with banks 2,699,359 4,788,626 Due from Exchange Fund 7,625,297 2,915,898
Placements with banks and financial institutions maturing
- Within one month 5,014,203 3,284,535
- Between one and twelve months 20,355,938 26,578,094
- Over one year 1,143,795 963,131
Amount due from overseas offices of the institution 28,312,564 27,876,045 Trade bills, net of impairment allowance 993,540 277,034
Certificate of Deposit - 720,066
Trading securities, at fair value
- Other securities 20,261,310 15,605,889
Advances to customers and other receivables,
net of impairment allowance 57,519,619 54,719,022
Property, plant & equipment 18,695 20,749 Other assets 2,196,604 2,363,699
────── ──────
TOTAL ASSETS 146,140,924 140,112,788 ========== ==========
LIABILITIES
Deposits and balances from banks 3,810,450 5,648,023 Current, savings and other deposit accounts of customers
- Demand deposits and current accounts 29,514,044 22,317,593
- Saving deposits 7,481,946 8,008,647
- Time, call and notice deposits 16,984,221 15,373,875
Amount due to overseas offices of the institution 81,791,281 80,408,096
Provision for commitments and contingent liabilities 9,654 6,395 Other accounts & accruals 6,549,328 8,350,159
────── ──────
TOTAL LIABILITIES 146,140,924 140,112,788 ========== ==========
BANK OF AMERICA, NATIONAL ASSOCIATION
HONG KONG BRANCH
Jun 30, 2018
3
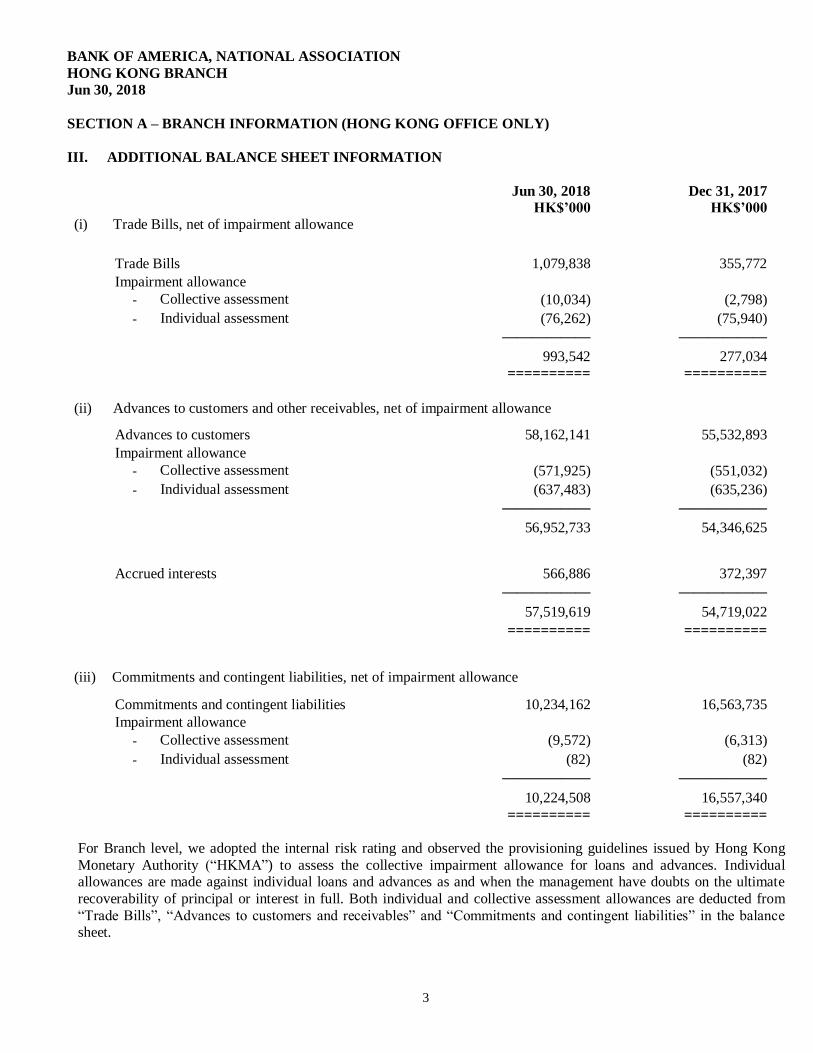
SECTION A – BRANCH INFORMATION (HONG KONG OFFICE ONLY)
III. ADDITIONAL BALANCE SHEET INFORMATION
Jun 30, 2018 Dec 31, 2017
HK$’000 HK$’000
(i) Trade Bills, net of impairment allowance
Trade Bills 1,079,838 355,772
Impairment allowance
- Collective assessment (10,034) (2,798)
- Individual assessment (76,262) (75,940) ────── ────── 993,542 277,034 ========== ==========
(ii) Advances to customers and other receivables, net of impairment allowance
Advances to customers 58,162,141 55,532,893
Impairment allowance
- Collective assessment (571,925) (551,032)
- Individual assessment (637,483) (635,236) ────── ────── 56,952,733 54,346,625
Accrued interests 566,886 372,397 ────── ────── 57,519,619 54,719,022 ========== ==========
(iii) Commitments and contingent liabilities, net of impairment allowance
Commitments and contingent liabilities 10,234,162 16,563,735
Impairment allowance
- Collective assessment (9,572) (6,313)
- Individual assessment (82) (82) ────── ────── 10,224,508 16,557,340 ========== ==========
For Branch level, we adopted the internal risk rating and observed the provisioning guidelines issued by Hong Kong
Monetary Authority (“HKMA”) to assess the collective impairment allowance for loans and advances. Individual allowances are made against individual loans and advances as and when the management have doubts on the ultimate
recoverability of principal or interest in full. Both individual and collective assessment allowances are deducted from
“Trade Bills”, “Advances to customers and receivables” and “Commitments and contingent liabilities” in the balance sheet.
BANK OF AMERICA, NATIONAL ASSOCIATION
HONG KONG BRANCH
Jun 30, 2018
4
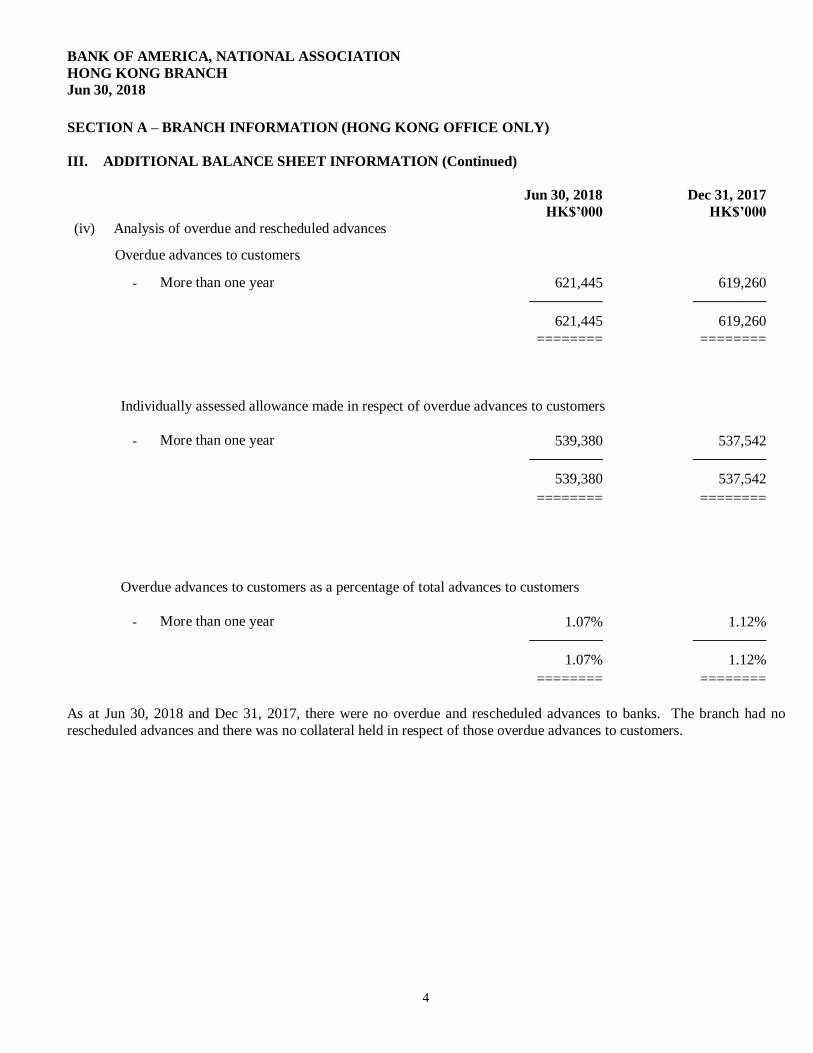
SECTION A – BRANCH INFORMATION (HONG KONG OFFICE ONLY)
III. ADDITIONAL BALANCE SHEET INFORMATION (Continued)
Jun 30, 2018 Dec 31, 2017 HK$’000 HK$’000
(iv) Analysis of overdue and rescheduled advances
Overdue advances to customers
- More than one year 621,445 619,260
───── ─────
621,445 619,260 ======== ========
Individually assessed allowance made in respect of overdue advances to customers
- More than one year 539,380 537,542 ───── ─────
539,380 537,542
======== ========
Overdue advances to customers as a percentage of total advances to customers
- More than one year 1.07% 1.12% ───── ─────
1.07% 1.12%
======== ======== As at Jun 30, 2018 and Dec 31, 2017, there were no overdue and rescheduled advances to banks. The branch had no
rescheduled advances and there was no collateral held in respect of those overdue advances to customers.
BANK OF AMERICA, NATIONAL ASSOCIATION
HONG KONG BRANCH
Jun 30, 2018
5
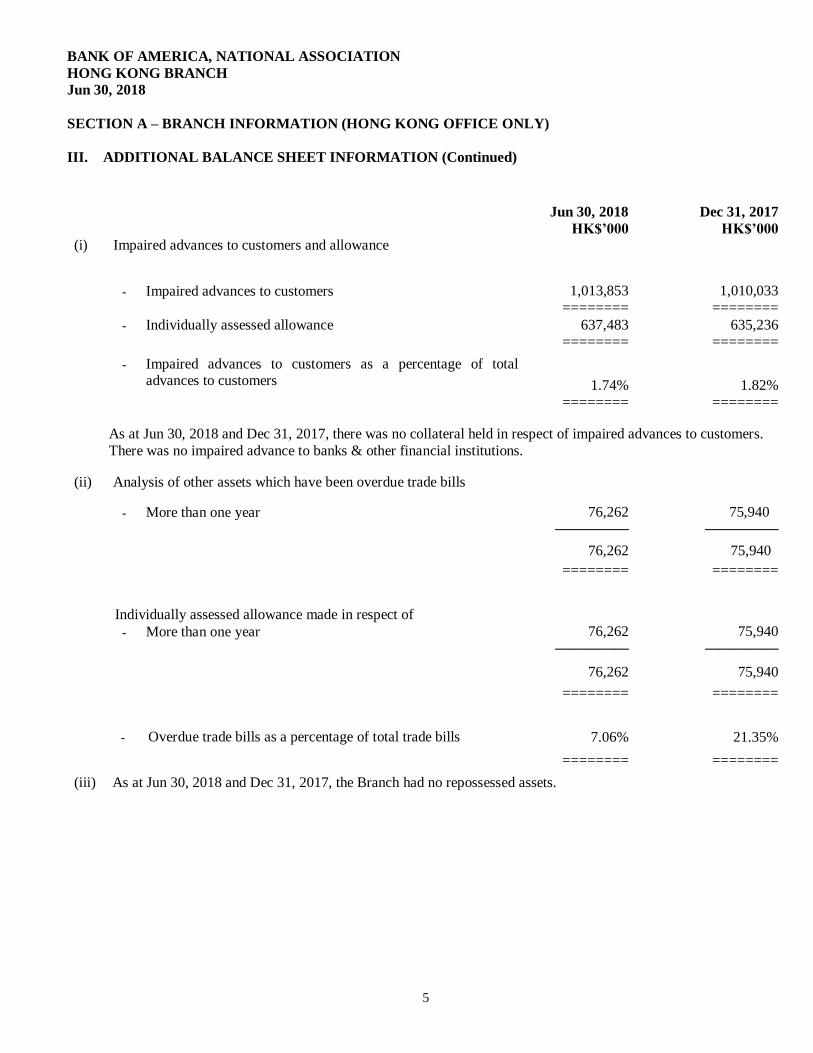
SECTION A – BRANCH INFORMATION (HONG KONG OFFICE ONLY)
III. ADDITIONAL BALANCE SHEET INFORMATION (Continued)
Jun 30, 2018 Dec 31, 2017
HK$’000 HK$’000 (i) Impaired advances to customers and allowance
- Impaired advances to customers 1,013,853 1,010,033 ======== ========
- Individually assessed allowance 637,483 635,236 ======== ========
- Impaired advances to customers as a percentage of total advances to customers
1.74% 1.82% ======== ========
As at Jun 30, 2018 and Dec 31, 2017, there was no collateral held in respect of impaired advances to customers.
There was no impaired advance to banks & other financial institutions.
(ii) Analysis of other assets which have been overdue trade bills
- More than one year 76,262 75,940 ───── ───── 76,262 75,940 ======== ========
Individually assessed allowance made in respect of
- More than one year 76,262 75,940 ───── ─────
76,262 75,940 ======== ========
- Overdue trade bills as a percentage of total trade bills 7.06% 21.35%
======== ========
(iii) As at Jun 30, 2018 and Dec 31, 2017, the Branch had no repossessed assets.
BANK OF AMERICA, NATIONAL ASSOCIATION
HONG KONG BRANCH
Jun 30, 2018
6
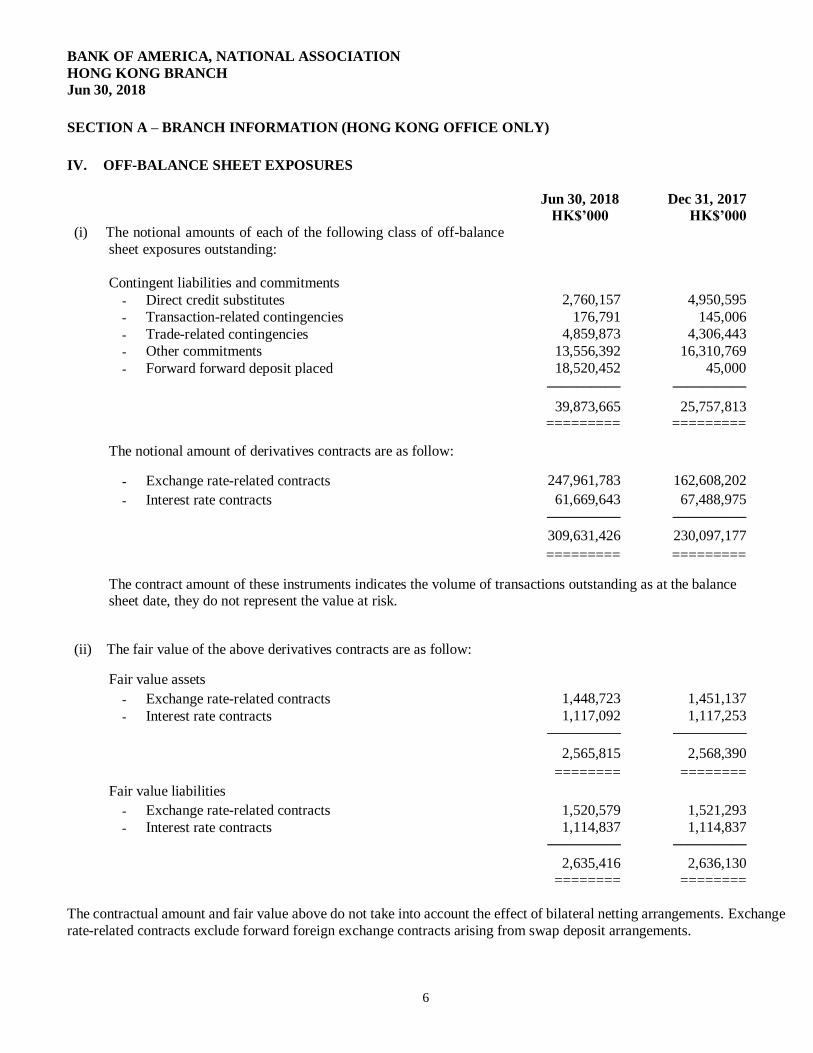
SECTION A – BRANCH INFORMATION (HONG KONG OFFICE ONLY)
IV. OFF-BALANCE SHEET EXPOSURES
Jun 30, 2018 Dec 31, 2017
HK$’000 HK$’000
(i) The notional amounts of each of the following class of off-balance
sheet exposures outstanding:
Contingent liabilities and commitments
- Direct credit substitutes 2,760,157 4,950,595
- Transaction-related contingencies 176,791 145,006
- Trade-related contingencies 4,859,873 4,306,443
- Other commitments 13,556,392 16,310,769
- Forward forward deposit placed 18,520,452 45,000 ───── ───── 39,873,665 25,757,813 ========= =========
The notional amount of derivatives contracts are as follow:
- Exchange rate-related contracts 247,961,783 162,608,202
- Interest rate contracts 61,669,643 67,488,975 ───── ───── 309,631,426 230,097,177 ========= =========
The contract amount of these instruments indicates the volume of transactions outstanding as at the balance sheet date, they do not represent the value at risk.
(ii) The fair value of the above derivatives contracts are as follow:
Fair value assets
- Exchange rate-related contracts 1,448,723 1,451,137
- Interest rate contracts 1,117,092 1,117,253 ───── ───── 2,565,815 2,568,390 ======== ========
Fair value liabilities
- Exchange rate-related contracts 1,520,579 1,521,293
- Interest rate contracts 1,114,837 1,114,837 ───── ───── 2,635,416 2,636,130 ======== ========
The contractual amount and fair value above do not take into account the effect of bilateral netting arrangements. Exchange
rate-related contracts exclude forward foreign exchange contracts arising from swap deposit arrangements.
BANK OF AMERICA, NATIONAL ASSOCIATION
HONG KONG BRANCH
Jun 30, 2018
7
SECTION A – BRANCH INFORMATION (HONG KONG OFFICE ONLY)
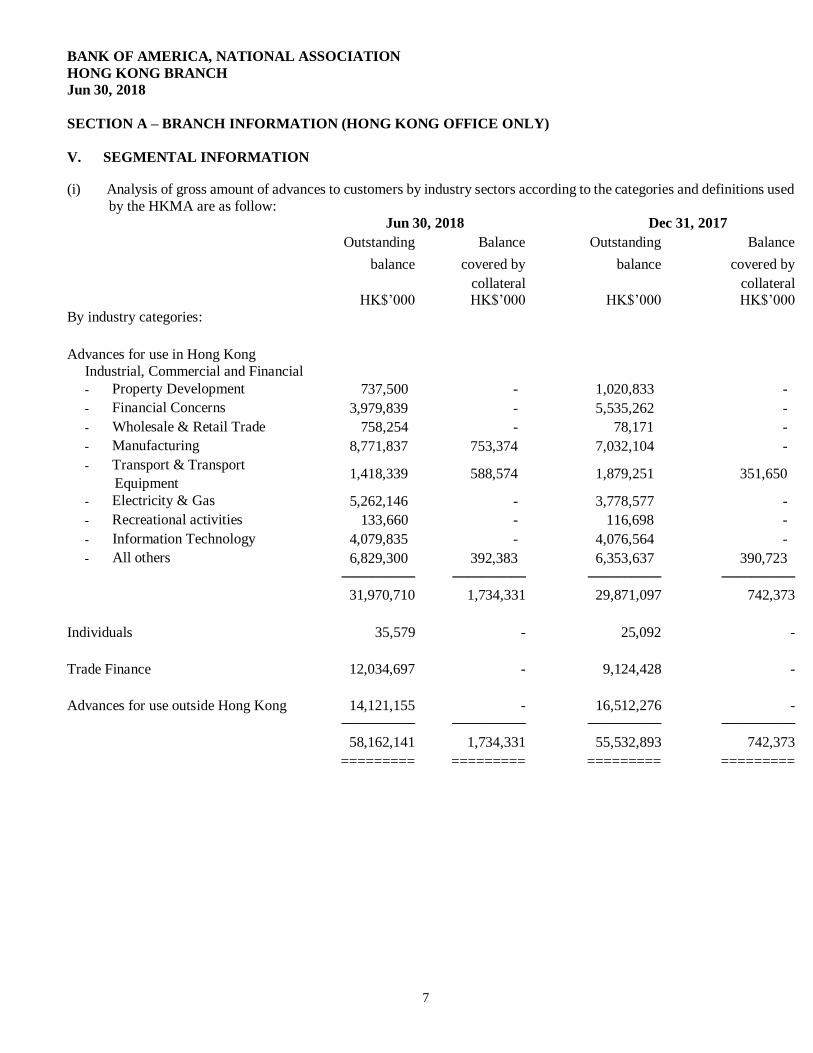
V. SEGMENTAL INFORMATION
(i) Analysis of gross amount of advances to customers by industry sectors according to the categories and definitions used
by the HKMA are as follow: Jun 30, 2018 Dec 31, 2017
Outstanding
Balance
Outstanding
Balance
balance covered by balance covered by
collateral collateral HK$’000 HK$’000 HK$’000 HK$’000
By industry categories:
Advances for use in Hong Kong
Industrial, Commercial and Financial
- Property Development 737,500 - 1,020,833 -
- Financial Concerns 3,979,839 - 5,535,262 -
- Wholesale & Retail Trade 758,254 - 78,171 -
- Manufacturing 8,771,837 753,374 7,032,104 -
- Transport & Transport
Equipment 1,418,339 588,574 1,879,251 351,650
- Electricity & Gas 5,262,146 - 3,778,577 -
- Recreational activities 133,660 - 116,698 -
- Information Technology 4,079,835 - 4,076,564 -
- All others 6,829,300 392,383 6,353,637 390,723 ───── ───── ───── ───── 31,970,710 1,734,331 29,871,097 742,373
Individuals 35,579 - 25,092 -
Trade Finance 12,034,697 - 9,124,428 -
Advances for use outside Hong Kong 14,121,155 - 16,512,276 - ───── ───── ───── ───── 58,162,141 1,734,331 55,532,893 742,373 ========= ========= ========= =========
BANK OF AMERICA, NATIONAL ASSOCIATION
HONG KONG BRANCH
Jun 30, 2018
8
SECTION A – BRANCH INFORMATION (HONG KONG OFFICE ONLY)
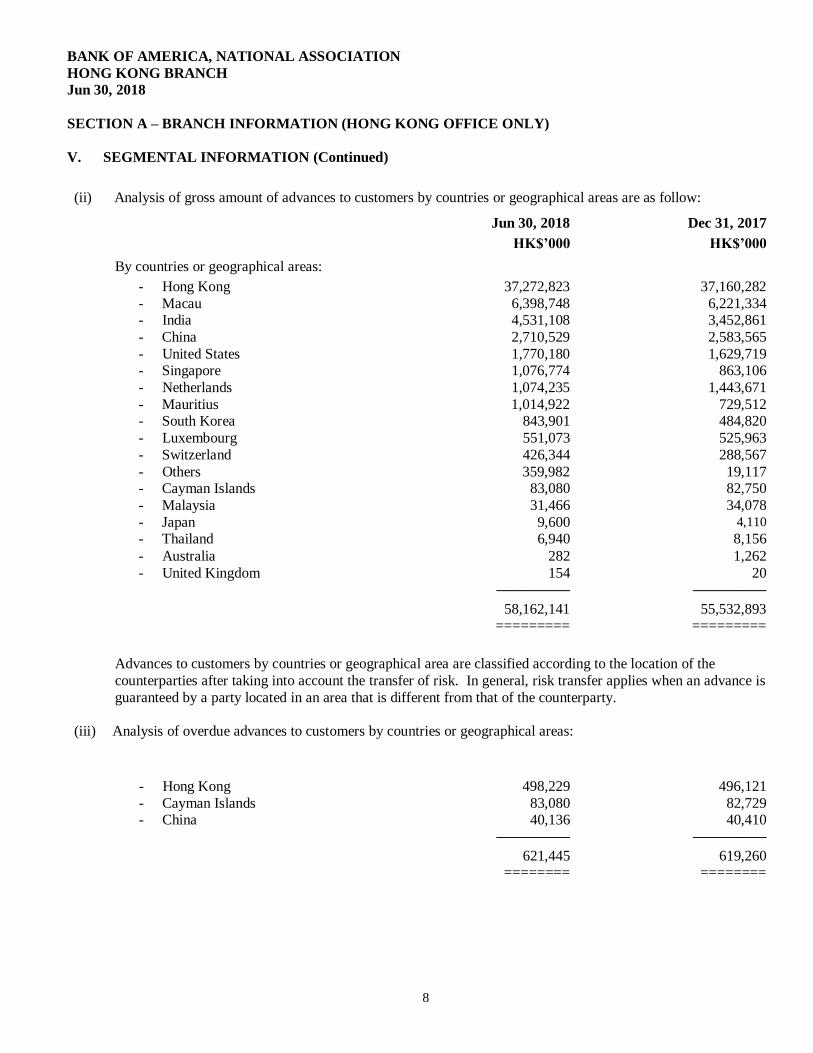
V. SEGMENTAL INFORMATION (Continued)
(ii) Analysis of gross amount of advances to customers by countries or geographical areas are as follow:
Jun 30, 2018 Dec 31, 2017 HK$’000 HK$’000
By countries or geographical areas:
- Hong Kong 37,272,823 37,160,282
- Macau 6,398,748 6,221,334 - India 4,531,108 3,452,861
- China 2,710,529 2,583,565
- United States 1,770,180 1,629,719 - Singapore 1,076,774 863,106
- Netherlands 1,074,235 1,443,671
- Mauritius 1,014,922 729,512 - South Korea 843,901 484,820
- Luxembourg 551,073 525,963
- Switzerland 426,344 288,567
- Others 359,982 19,117 - Cayman Islands 83,080 82,750
- Malaysia 31,466 34,078
- Japan 9,600 4,110
- Thailand 6,940 8,156
- Australia 282 1,262
- United Kingdom 154 20 ───── ─────
58,162,141 55,532,893 ========= =========
Advances to customers by countries or geographical area are classified according to the location of the
counterparties after taking into account the transfer of risk. In general, risk transfer applies when an advance is
guaranteed by a party located in an area that is different from that of the counterparty.
(iii) Analysis of overdue advances to customers by countries or geographical areas:
498,229 496,121
- Hong Kong 498,229 496,121
- Cayman Islands 83,080 82,729 - China 40,136 40,410
───── ───── 621,445 619,260 ======== ========
BANK OF AMERICA, NATIONAL ASSOCIATION
HONG KONG BRANCH
Jun 30, 2018
9
SECTION A – BRANCH INFORMATION (HONG KONG OFFICE ONLY)
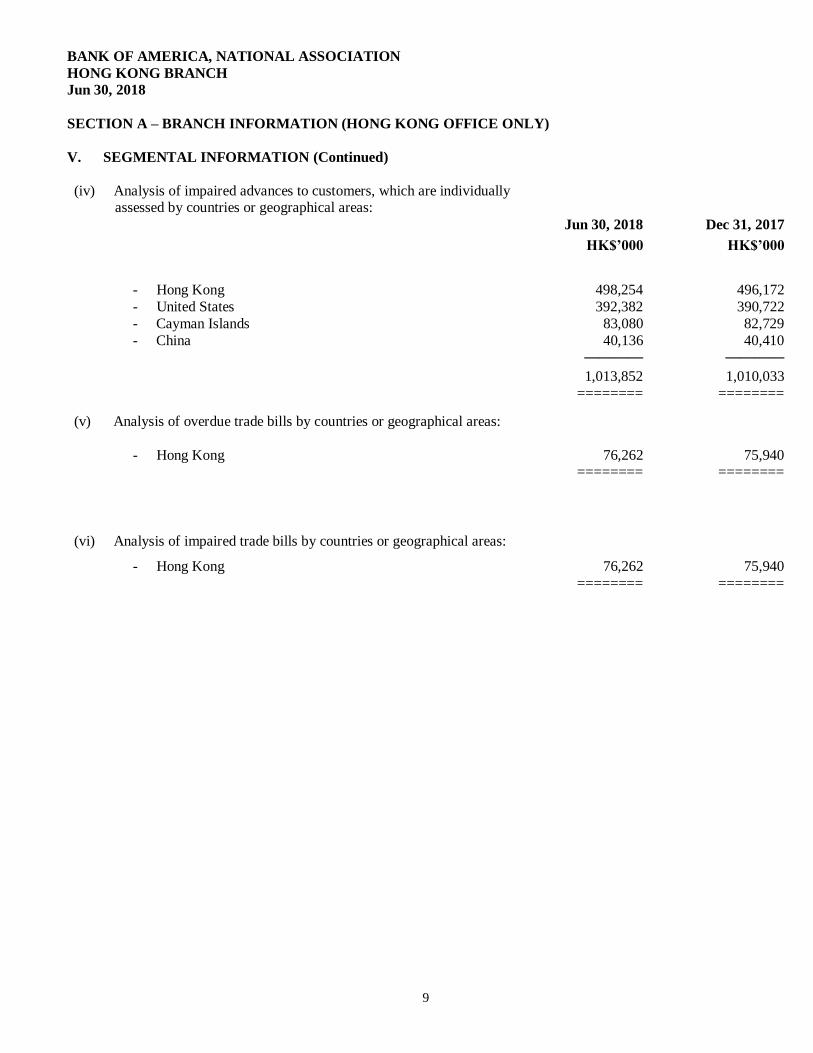
V. SEGMENTAL INFORMATION (Continued)
(iv) Analysis of impaired advances to customers, which are individually assessed by countries or geographical areas:
Jun 30, 2018 Dec 31, 2017
HK$’000 HK$’000
- Hong Kong 498,254 496,172
- United States 392,382 390,722
- Cayman Islands 83,080 82,729
- China 40,136 40,410 ──── ──── 1,013,852 1,010,033 ======== ========
(v) Analysis of overdue trade bills by countries or geographical areas:
- Hong Kong 76,262 75,940
======== ========
(vi) Analysis of impaired trade bills by countries or geographical areas:
- Hong Kong 76,262 75,940
======== ========
BANK OF AMERICA, NATIONAL ASSOCIATION
HONG KONG BRANCH
Jun 30, 2018
10
SECTION A – BRANCH INFORMATION (HONG KONG OFFICE ONLY)
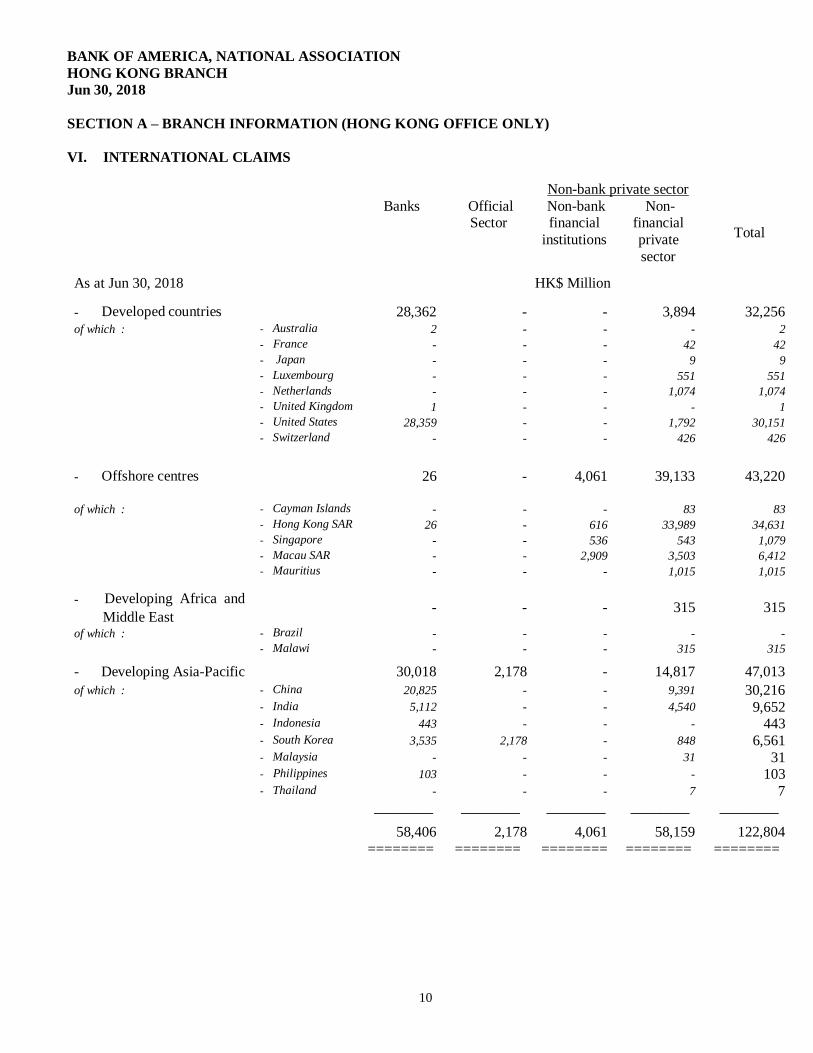
VI. INTERNATIONAL CLAIMS
Non-bank private sector
Banks Official Sector
Non-bank financial
institutions
Non-financial
private
sector
Total
As at Jun 30, 2018 HK$ Million
- Developed countries 28,362 - - 3,894 32,256 of which : - Australia 2 - - - 2
- France - - - 42 42 - Japan - - - 9 9 - Luxembourg - - - 551 551 - Netherlands - - - 1,074 1,074 - United Kingdom 1 - - - 1 - United States 28,359 - - 1,792 30,151 - Switzerland - - - 426 426
- Offshore centres 26 - 4,061 39,133 43,220
of which : - Cayman Islands - - - 83 83 - Hong Kong SAR 26 - 616 33,989 34,631 - Singapore - - 536 543 1,079 - Macau SAR - - 2,909 3,503 6,412 - Mauritius - - - 1,015 1,015
- Developing Africa and
Middle East - - - 315 315
of which : - Brazil - - - - - - Malawi - - - 315 315
- Developing Asia-Pacific 30,018 2,178 - 14,817 47,013
of which : - China 20,825 - - 9,391 30,216 - India 5,112 - - 4,540 9,652 - Indonesia 443 - - - 443 - South Korea 3,535 2,178 - 848 6,561 - Malaysia - - - 31 31 - Philippines 103 - - - 103 - Thailand - - - 7 7 ──── ──── ──── ──── ────
58,406 2,178 4,061 58,159 122,804 ======== ======== ======== ======== ========
BANK OF AMERICA, NATIONAL ASSOCIATION
HONG KONG BRANCH
Jun 30, 2018
11
SECTION A – BRANCH INFORMATION (HONG KONG OFFICE ONLY)
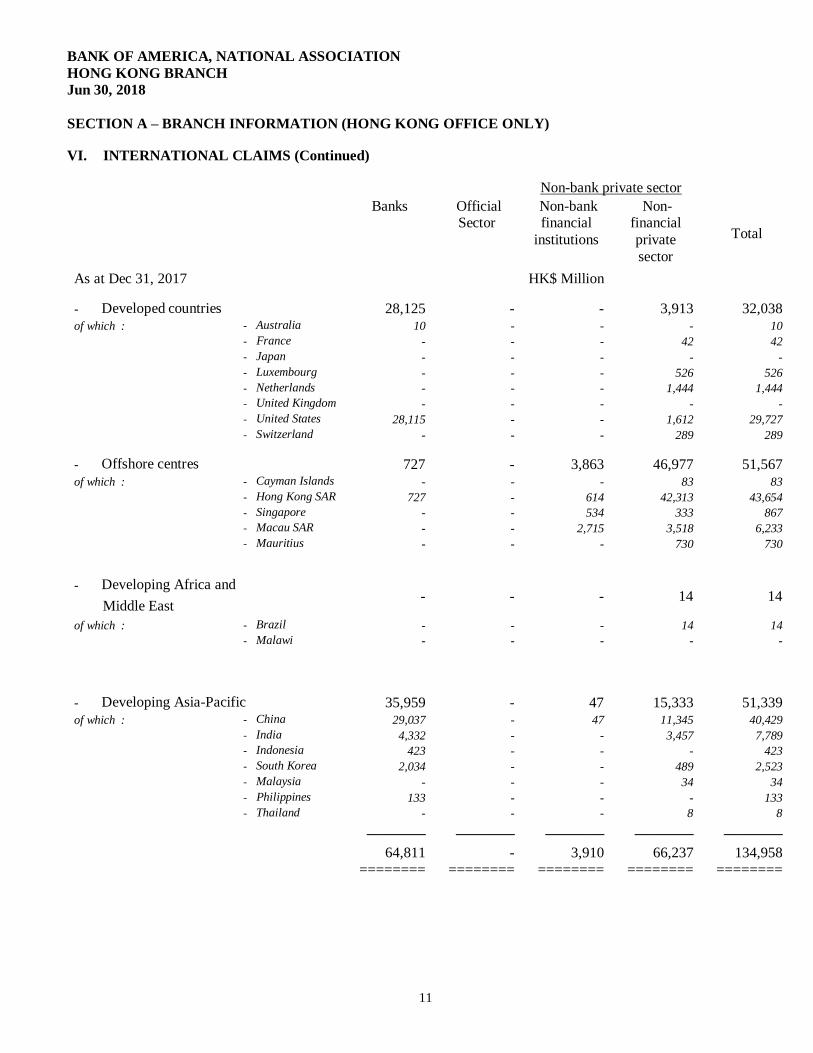
VI. INTERNATIONAL CLAIMS (Continued)
Non-bank private sector Banks Official
Sector Non-bank financial
institutions
Non-financial
private
sector
Total
As at Dec 31, 2017 HK$ Million
- Developed countries 28,125 - - 3,913 32,038 of which : - Australia 10 - - - 10
- France - - - 42 42
- Japan - - - - - - Luxembourg - - - 526 526 - Netherlands - - - 1,444 1,444 - United Kingdom - - - - - - United States 28,115 - - 1,612 29,727 - Switzerland - - - 289 289
- Offshore centres 727 - 3,863 46,977 51,567 of which : - Cayman Islands - - - 83 83
- Hong Kong SAR 727 - 614 42,313 43,654 - Singapore - - 534 333 867
- Macau SAR - - 2,715 3,518 6,233
- Mauritius - - - 730 730
- Developing Africa and - - - 14 14
Middle East
of which : - Brazil - - - 14 14
- Malawi - - - - -
- Developing Asia-Pacific 35,959 - 47 15,333 51,339 of which : - China 29,037 - 47 11,345 40,429
- India 4,332 - - 3,457 7,789 - Indonesia 423 - - - 423 - South Korea 2,034 - - 489 2,523
- Malaysia - - - 34 34
- Philippines 133 - - - 133
- Thailand - - - 8 8 ──── ──── ──── ──── ──── 64,811 - 3,910 66,237 134,958 ======== ======== ======== ======== ========
BANK OF AMERICA, NATIONAL ASSOCIATION
HONG KONG BRANCH
Jun 30, 2018
12
SECTION A – BRANCH INFORMATION (HONG KONG OFFICE ONLY)
VI. INTERNATIONAL CLAIMS (Continued)
The information of international claims discloses exposures to foreign counterparties on which the ultimate risk lies,
and is derived according to the location of the counterparties after taking into account any transfer of risk. In general, transfer of risk from one country to another is recognized if the claim against counterparties is guaranteed by another
party in a different country or if the claim is on an overseas branch of a bank whose head office is located in a
different country. A country or geographical segment (including Hong Kong) should generally be reported individually if it constitutes 10% or more of the aggregated international claims.
Claims arising between head office, branches and subsidiaries are excluded.
BANK OF AMERICA, NATIONAL ASSOCIATION
HONG KONG BRANCH
Jun 30, 2018
13
SECTION A – BRANCH INFORMATION (HONG KONG OFFICE ONLY)
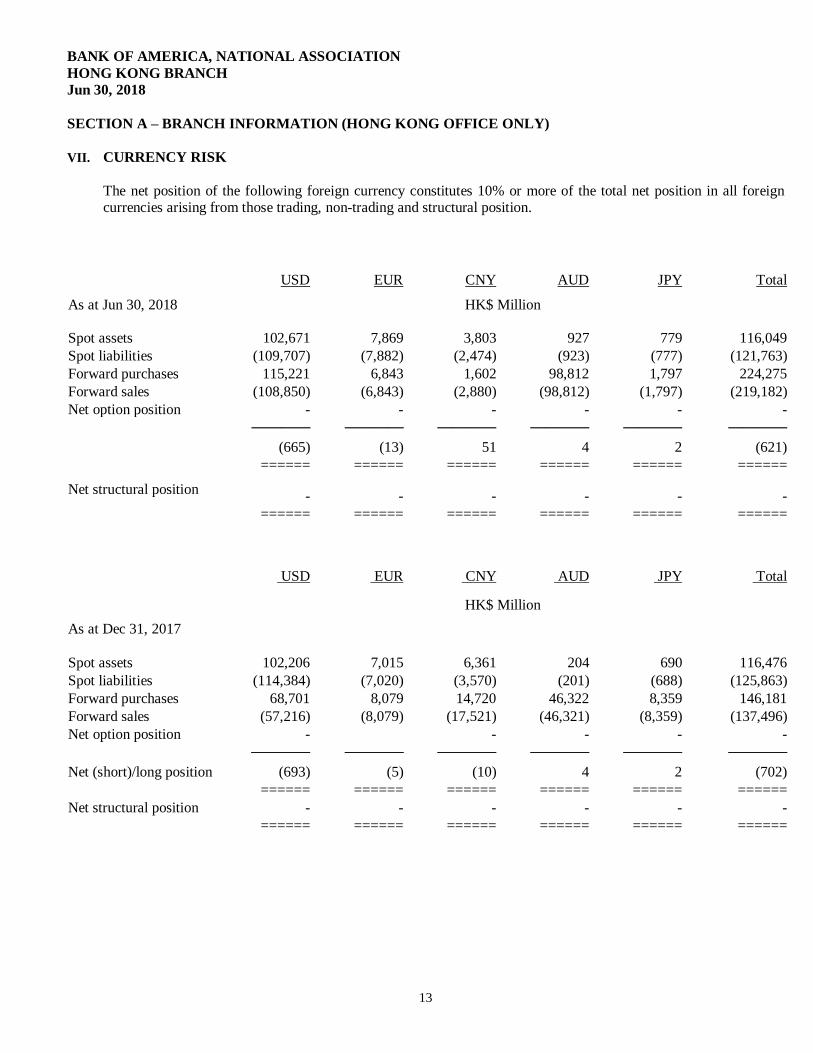
VII. CURRENCY RISK
The net position of the following foreign currency constitutes 10% or more of the total net position in all foreign currencies arising from those trading, non-trading and structural position.
USD EUR CNY AUD JPY Total
As at Jun 30, 2018 HK$ Million
Spot assets 102,671 7,869 3,803 927 779 116,049
Spot liabilities (109,707) (7,882) (2,474) (923) (777) (121,763)
Forward purchases 115,221 6,843 1,602 98,812 1,797 224,275
Forward sales (108,850) (6,843) (2,880) (98,812) (1,797) (219,182)
Net option position - - - - - - ──── ──── ──── ──── ──── ────
(665) (13) 51 4 2 (621) ====== ====== ====== ====== ====== ======
Net structural position
- - - - - - ====== ====== ====== ====== ====== ======
USD EUR CNY AUD JPY Total
HK$ Million
As at Dec 31, 2017
Spot assets 102,206 7,015 6,361 204 690 116,476
Spot liabilities (114,384) (7,020) (3,570) (201) (688) (125,863)
Forward purchases 68,701 8,079 14,720 46,322 8,359 146,181
Forward sales (57,216) (8,079) (17,521) (46,321) (8,359) (137,496)
Net option position - - - - - ──── ──── ──── ──── ──── ────
Net (short)/long position (693) (5) (10) 4 2 (702) ====== ====== ====== ====== ====== ======
Net structural position - - - - - - ====== ====== ====== ====== ====== ======
BANK OF AMERICA, NATIONAL ASSOCIATION
HONG KONG BRANCH
Jun 30, 2018
14
SECTION A – BRANCH INFORMATION (HONG KONG OFFICE ONLY)
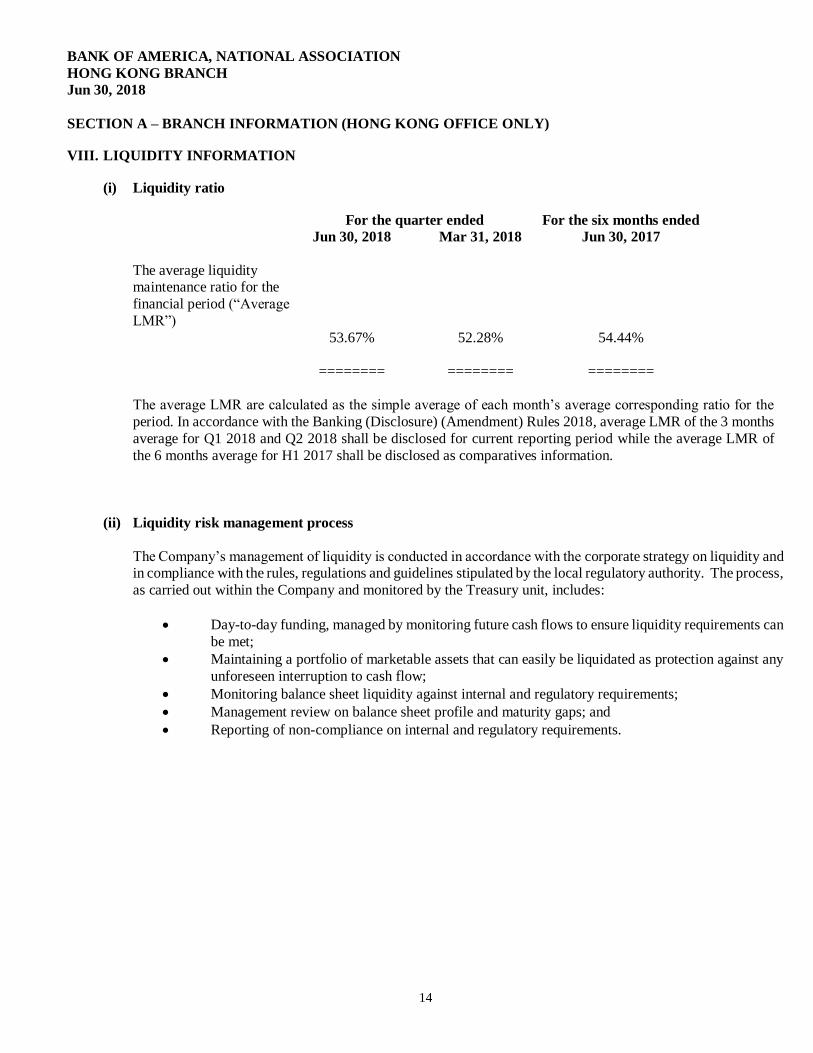
VIII. LIQUIDITY INFORMATION
(i) Liquidity ratio
For the quarter ended For the six months ended
Jun 30, 2018 Mar 31, 2018 Jun 30, 2017
The average liquidity maintenance ratio for the
financial period (“Average
LMR”)
53.67%
52.28%
54.44%
======== ======== ========
The average LMR are calculated as the simple average of each month’s average corresponding ratio for the
period. In accordance with the Banking (Disclosure) (Amendment) Rules 2018, average LMR of the 3 months
average for Q1 2018 and Q2 2018 shall be disclosed for current reporting period while the average LMR of
the 6 months average for H1 2017 shall be disclosed as comparatives information.
(ii) Liquidity risk management process
The Company’s management of liquidity is conducted in accordance with the corporate strategy on liquidity and in compliance with the rules, regulations and guidelines stipulated by the local regulatory authority. The process,
as carried out within the Company and monitored by the Treasury unit, includes:
Day-to-day funding, managed by monitoring future cash flows to ensure liquidity requirements can
be met;
Maintaining a portfolio of marketable assets that can easily be liquidated as protection against any
unforeseen interruption to cash flow;
Monitoring balance sheet liquidity against internal and regulatory requirements;
Management review on balance sheet profile and maturity gaps; and
Reporting of non-compliance on internal and regulatory requirements.
BANK OF AMERICA, NATIONAL ASSOCIATION
HONG KONG BRANCH
Jun 30, 2018
15
SECTION A – BRANCH INFORMATION (HONG KONG OFFICE ONLY)
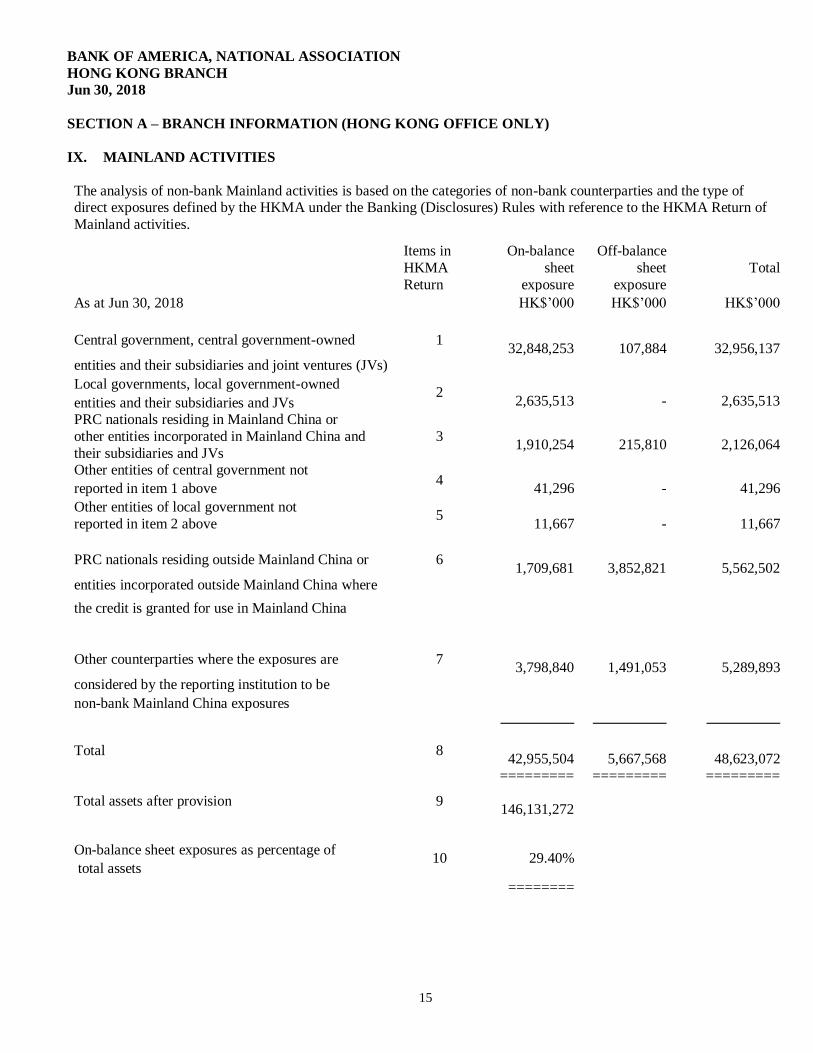
IX. MAINLAND ACTIVITIES
The analysis of non-bank Mainland activities is based on the categories of non-bank counterparties and the type of direct exposures defined by the HKMA under the Banking (Disclosures) Rules with reference to the HKMA Return of
Mainland activities.
Items in
HKMA
Return
On-balance
sheet
exposure
Off-balance
sheet
exposure
Total
As at Jun 30, 2018 HK$’000 HK$’000 HK$’000
Central government, central government-owned 1
32,848,253
107,884
32,956,137 entities and their subsidiaries and joint ventures (JVs)
Local governments, local government-owned 2
2,635,513
-
2,635,513 entities and their subsidiaries and JVs PRC nationals residing in Mainland China or
3
1,910,254
215,810
2,126,064 other entities incorporated in Mainland China and
their subsidiaries and JVs Other entities of central government not
4
41,296
-
41,296 reported in item 1 above
Other entities of local government not 5
11,667
-
11,667 reported in item 2 above
PRC nationals residing outside Mainland China or 6
1,709,681
3,852,821
5,562,502 entities incorporated outside Mainland China where
the credit is granted for use in Mainland China
Other counterparties where the exposures are 7
3,798,840
1,491,053
5,289,893
considered by the reporting institution to be
non-bank Mainland China exposures
───── ───── ─────
Total 8
42,955,504
5,667,568
48,623,072 ========= ========= =========
Total assets after provision 9
146,131,272
On-balance sheet exposures as percentage of 10 29.40%
total assets ========
BANK OF AMERICA, NATIONAL ASSOCIATION
HONG KONG BRANCH
Jun 30, 2018
16
SECTION A – BRANCH INFORMATION (HONG KONG OFFICE ONLY)
IX. MAINLAND ACTIVITIES (CONTINUED)
Items in
HKMA
Return
On-balance
sheet exposure
Off-balance sheet
exposure
Total
As at Dec 31, 2017 HK$’000 HK$’000 HK$’000
Central government, central government-owned 1
29,062,423
2,208,334
31,270,756
entities and their subsidiaries and joint ventures (JVs)
Local governments, local government-owned 2
2,536,952 -
2,536,952 entities and their subsidiaries and JVs
PRC nationals residing in Mainland China or
3
1,416,561 -
1,416,561
other entities incorporated in Mainland China and
their subsidiaries and JVs
Other entities of central government not 4
41,907 -
41,907 reported in item 1 above
Other entities of local government not 5
11,842
-
11,842 reported in item 2 above
PRC nationals residing outside Mainland China or 6
1,817,546
2,934,135
4,751,681
entities incorporated outside Mainland China where
the credit is granted for use in Mainland China
Other counterparties where the exposures are 7
3,846,904
703,301
4,550,205
considered by the reporting institution to be
non-bank Mainland China exposures
───── ───── ─────
Total 8
38,734,135
5,845,770
44,579,904
========= ========= =========
Total assets after provision 9
140,106,393
On-balance sheet exposures as percentage of 10 27.65%
total assets
========
BANK OF AMERICA, NATIONAL ASSOCIATION
HONG KONG BRANCH
Jun 30, 2018
17
X. OTHER INFORMATION
(i) Principal Activities
The principal activities of Bank of America, National Association, Hong Kong Branch (“BANA HK”) are Corporate Banking and Global Markets. Corporate Banking includes Cash Management, Loans, Deposits; Trade Finance and
Treasury solutions to Financial Institution (“FIs”) and Corporate clients. Global Market includes Foreign Exchange
and Bonds trading and funding for BANA HK
BANK OF AMERICA, NATIONAL ASSOCIATION
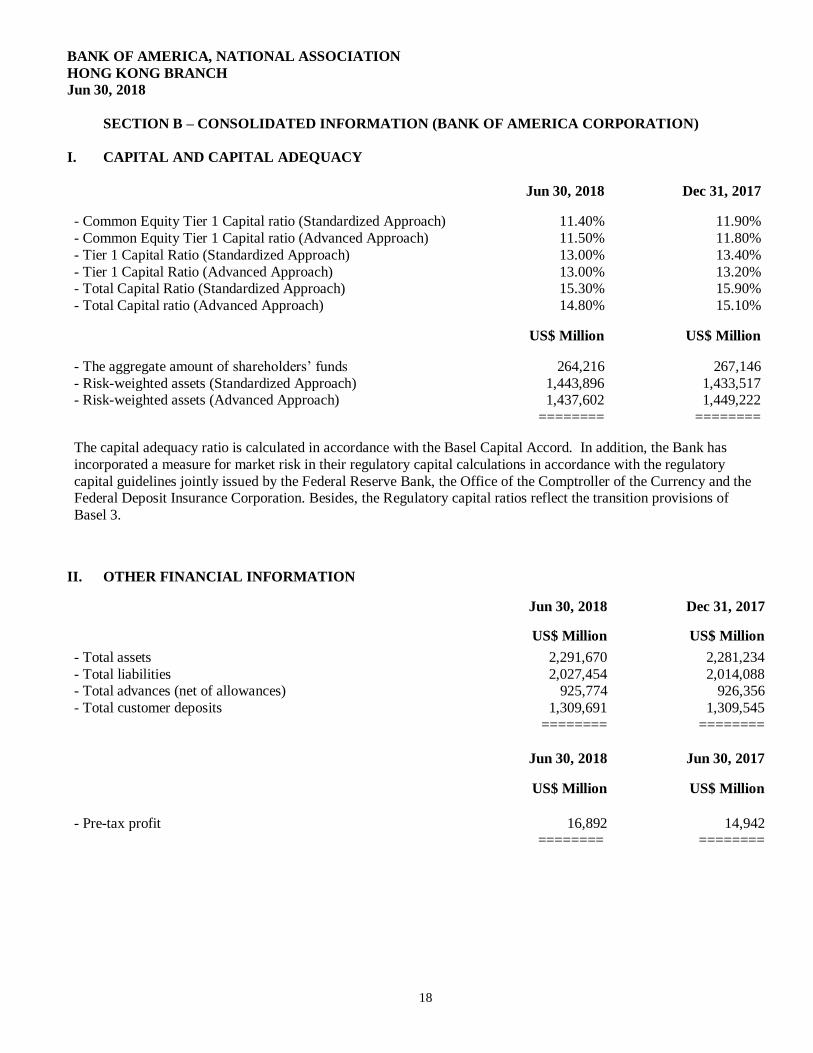
HONG KONG BRANCH
Jun 30, 2018
18
SECTION B – CONSOLIDATED INFORMATION (BANK OF AMERICA CORPORATION)
I. CAPITAL AND CAPITAL ADEQUACY
Jun 30, 2018 Dec 31, 2017
- Common Equity Tier 1 Capital ratio (Standardized Approach) 11.40% 11.90%
- Common Equity Tier 1 Capital ratio (Advanced Approach) 11.50% 11.80%
- Tier 1 Capital Ratio (Standardized Approach) 13.00% 13.40%
- Tier 1 Capital Ratio (Advanced Approach) 13.00% 13.20% - Total Capital Ratio (Standardized Approach) 15.30% 15.90%
- Total Capital ratio (Advanced Approach) 14.80% 15.10%
US$ Million US$ Million
- The aggregate amount of shareholders’ funds 264,216 267,146
- Risk-weighted assets (Standardized Approach) 1,443,896 1,433,517 - Risk-weighted assets (Advanced Approach) 1,437,602 1,449,222
======== ========
The capital adequacy ratio is calculated in accordance with the Basel Capital Accord. In addition, the Bank has
incorporated a measure for market risk in their regulatory capital calculations in accordance with the regulatory
capital guidelines jointly issued by the Federal Reserve Bank, the Office of the Comptroller of the Currency and the Federal Deposit Insurance Corporation. Besides, the Regulatory capital ratios reflect the transition provisions of
Basel 3.
II. OTHER FINANCIAL INFORMATION
Jun 30, 2018 Dec 31, 2017
US$ Million US$ Million
- Total assets 2,291,670 2,281,234
- Total liabilities 2,027,454 2,014,088 - Total advances (net of allowances) 925,774 926,356
- Total customer deposits 1,309,691 1,309,545 ======== ========
Jun 30, 2018 Jun 30, 2017
US$ Million US$ Million
- Pre-tax profit 16,892 14,942 ======== ========