Embed Size (px)
Citation preview
B A N K O F C A N A D A
FinancialSystem Review
December 2003

Members of the Editorial Committee
David Longworth, Chair
Agathe CôtéClyde GoodletJohn HelliwellPaul C. JenkinsTiff Macklem
Dinah MacleanJohn Murray
Graydon PaulinGeorge Pickering
James PowellDenis Schuthe
Jack SelodyRobert Turnbull
Jill MoxleyLea-Anne Solomonian
(Editors)
The Bank of Canada’s Financial System Review is published semi-annually. Copies maybe obtained free of charge by contacting
Publications Distribution, Communications Department, Bank of Canada, Ottawa,Ontario, Canada K1A 0G9Telephone: (613) 782-8248; e-mail: [email protected]
Please forward any comments on the Financial System Review to
Public Information, Communications Department, Bank of Canada, Ottawa,Ontario, Canada K1A 0G9Telephone: (613) 782-8111, 1-800-303-1282; e-mail: [email protected]
Web site: <http://www.bankofcanada.ca>
Bank of CanadaDecember 2003
Contents
Developments and Trends ............................................................ 1
Introduction ............................................................................................ 3
Highlighted Issues .................................................................................... 4
The Macrofinancial Environment ............................................................... 11
The Financial System................................................................................ 22
Reports ...................................................................................... 31
Introduction ............................................................................................ 33
Development of the Canadian Corporate Debt Market:Some Stylized Facts and Issues ................................................................... 35
Measuring Financial Stress........................................................................ 43
Policy and Infrastructure Developments ........................................ 49
Introduction ............................................................................................ 51
Restoring Investor Confidence: Background on RecentDevelopments in Canada .......................................................................... 53
Transparency in the Canadian Fixed-Income Market:Opportunities and Constraints ................................................................... 59
Policy Issues in Retail Payments ................................................................. 65
Research Summaries ................................................................... 69
Introduction ............................................................................................ 71
Governance and Financial Fragility............................................................ 73
Income Trusts: Understanding the Issues..................................................... 77
Valuation of Canadian- versus U.S.-Listed Equities:Is There a Discount? ................................................................................. 81
Excess Collateral in the LVTS: How Much Is Too Much? ............................... 85

Developments
and
Trends

Notes
The material in this document is based on information available to 3 Decemberunless otherwise indicated.
The phrase “major banks” in Canada refers to the six largest Canadian commercialbanks by asset size: the Bank of Montreal, CIBC, National Bank, RBC Financial Group,Scotiabank, and TD Bank Financial Group.
Financial System Review
Introduction
This section of the Financial SystemReview examines the recent performanceof the Canadian financial system and thefactors, both domestic and international,that are influencing it. In each issue, oneor more subjects of particular interest arediscussed as highlighted topics.
A key development during the second half of2003 is the substantial improvement in the glo-bal macrofinancial environment. The economicoutlook for the industrialized economies, afterdeteriorating during the first half of the year,has been revised upwards since the summer. Fi-nancial institutions in the United States and Eu-rope are reporting improved financial results.Nevertheless, risks associated with global im-balances remain, and in Canada the strongerdollar will affect the financial positions of thosesectors with a strong net export orientation.
Key Points
• An improving economic environmentand a stabilization in corporate creditquality have contributed to better resultsfor financial institutions.
• The risks associated with the ability ofCanadian households to meet theirfinancial obligations under changingfinancial conditions appear to be withinmanageable levels.
• The financial system has experiencedsome significant changes in the prices offinancial assets, but has responded in aresilient fashion.
Stronger economic conditions have helped tostabilize the earlier decline in corporate creditquality, both globally and in Canada. Defaultrates and credit-rating downgrades on corporatedebt have diminished. A declining need to addto loan-loss provisions contributed to thestrong increase in profitability reported byCanadian banks in the second half of the year.Canadian banks have fared well over the currentbusiness cycle, compared with earlier cycles,attesting to their strong underlying position.Other financial institutions have also reportedimproved results.
In the face of past heightened losses on corpo-rate lending exposures, the relative strength ofthe Canadian household sector has been a wel-come source of support for the financial sector.An assessment of the potential impact of chang-es to the financial environment, such as higherinterest rates or a fall in housing prices, on theability of households to service their debt sug-gests that the risks in this area are within man-ageable levels.
In the context of an improving economic envi-ronment and an increase in investors’ appetitefor risk, there were some large movements in fi-nancial prices during recent quarters. Yields onlong-term bonds fell to very low levels in June,before subsequently rising. Equity prices haverisen steadily since the second quarter, as inves-tors anticipate improved corporate earnings.Against the background of rapidly growing U.S.international indebtedness, global exchangerates have been dominated by a decline in thevalue of the U.S. dollar, such that the Canadiandollar has appreciated significantly. The Cana-dian financial system has adapted to thesechanging conditions in a resilient fashion.
International efforts to buttress investor confi-dence in capital markets, including revised stan-dards for financial reporting and auditing, havecontinued. The importance of better oversight
3
Developments and Trends
Chart 2 Distribution of Lending by FinancialInstitutions, 2003
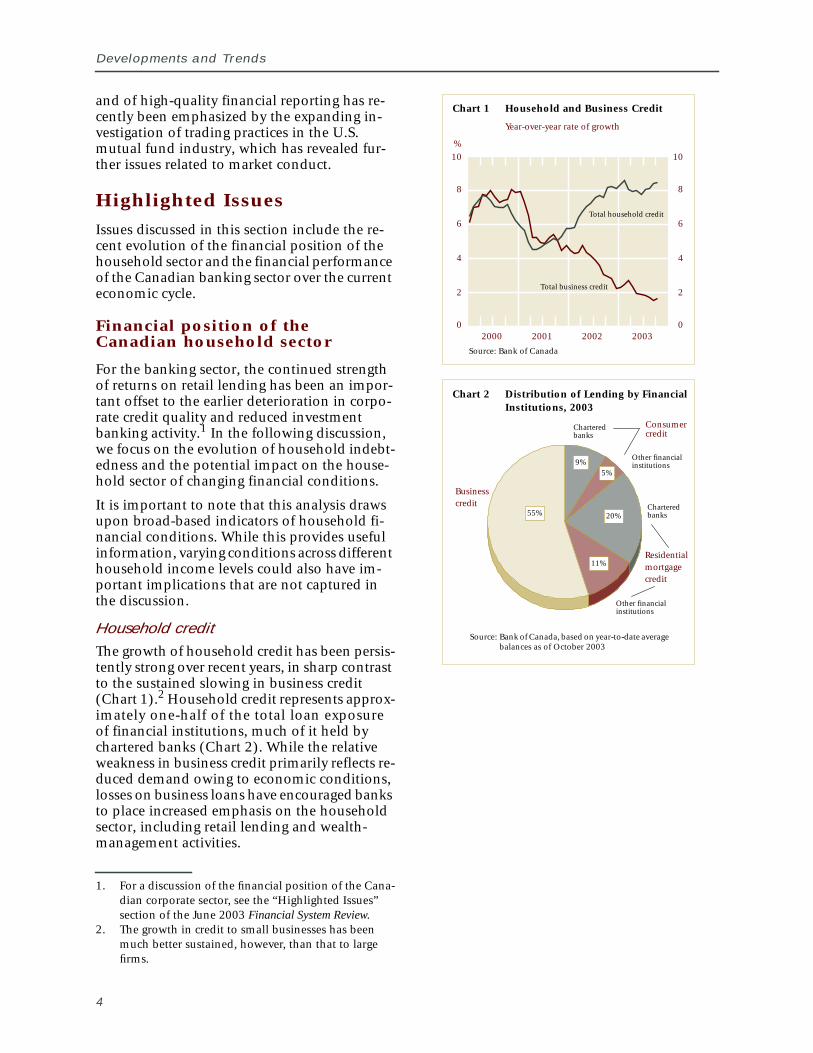
Chart 1 Household and Business Credit
Year-over-year rate of growth
Source: Bank of Canada
Source: Bank of Canada, based on year-to-date averagebalances as of October 2003
Other financialinstitutions
Charteredbanks
Residentialmortgagecredit
11%
20%
9%
Charteredbanks
Consumercredit
Other financialinstitutions
5%
Businesscredit
55%
0
2
4
6
8
10
0
2
4
6
8
10
2000 2001 2002 2003
%
Total household credit
Total business credit
and of high-quality financial reporting has re-cently been emphasized by the expanding in-vestigation of trading practices in the U.S.mutual fund industry, which has revealed fur-ther issues related to market conduct.
Highlighted Issues
Issues discussed in this section include the re-cent evolution of the financial position of thehousehold sector and the financial performanceof the Canadian banking sector over the currenteconomic cycle.
Financial position of theCanadian household sector
For the banking sector, the continued strengthof returns on retail lending has been an impor-tant offset to the earlier deterioration in corpo-rate credit quality and reduced investmentbanking activity.1 In the following discussion,we focus on the evolution of household indebt-edness and the potential impact on the house-hold sector of changing financial conditions.
It is important to note that this analysis drawsupon broad-based indicators of household fi-nancial conditions. While this provides usefulinformation, varying conditions across differenthousehold income levels could also have im-portant implications that are not captured inthe discussion.
Household creditThe growth of household credit has been persis-tently strong over recent years, in sharp contrastto the sustained slowing in business credit(Chart 1).2 Household credit represents approx-imately one-half of the total loan exposureof financial institutions, much of it held bychartered banks (Chart 2). While the relativeweakness in business credit primarily reflects re-duced demand owing to economic conditions,losses on business loans have encouraged banksto place increased emphasis on the householdsector, including retail lending and wealth-management activities.
1. For a discussion of the financial position of the Cana-dian corporate sector, see the “Highlighted Issues”section of the June 2003 Financial System Review.
2. The growth in credit to small businesses has beenmuch better sustained, however, than that to largefirms.
4

Financial System Review
Chart 4 Household Debt Ratios
Source: Statistics Canada and Bank of Canadacalculations
14
15
16
17
18
19
20
60
70
80
90
100
110
120
1980 1985 1990 1995 2000
Debt todisposable income
(right scale)
Debt to total assets(left scale)
% %
Chart 5 Household Sector Debt
* Does not include principal repayments.Source: Statistics Canada and Bank of Canada
calculations
%
4
6
8
10
12
14
16
18
7
8
9
10
11
12
13
14
1980 1985 1990 1995 2000
Effective interest rateon household debt
(left scale)
Household debt-service ratio*(right scale)
%
Chart 3 Housing and Vehicle Sales
3-month moving average, annualized
Source: Statistics Canada
Thousands of units
1998 1999 2000 2001 2002 2003
Thousands of units
1,300
1,400
1,500
1,600
1,700
1,800
250
300
350
400
450
500
Vehicle sales(left scale)
Sales ofexisting homes
(right scale)
The strength of household credit reflects thegrowth in both mortgage and consumer credit(the latter including vehicle loans, credit cardloans, renovation loans, and lines of credit).This growth has, in turn, been stimulated by thestrength of the domestic housing market and ofauto sales, respectively (Chart 3). Although thegrowth of consumer debt has tended to outpacethe accumulation of mortgage debt, mortgagesstill account for almost 70 per cent of totalhousehold debt.
The expanded use of lines of credit, now held byjust over one-half of Canadian households, hascontributed to the overall growth in consumercredit. Amounts outstanding under credit cardshave shown particularly strong growth. In addi-tion, stimulated by strong house prices and lowmortgage rates, a growing proportion of home-owners are refinancing their mortgages with aview to increasing the amount borrowed againsttheir home equity. Based on recent survey evi-dence, the average size of the increase is about$33,000.3
The securitization of household debt has beenanother significant trend in consumer debtsince the mid-1990s. Securitization allowsbanks to restructure their exposure to theseloans, effectively selling it in the form of bondsto a range of investors.
Servicing household debtConsumer indebtedness, in Canada and else-where (e.g., the United States and the UnitedKingdom), has risen to high levels. A commonmeasure of household indebtedness, the ratioof debt to personal disposable income, has risensteadily to about 115 per cent (Chart 4). In ad-dition, households have a range of other finan-cial obligations (e.g., payments on rentalaccommodation) that can affect their financialoutlook. This has raised questions regarding theability of households to service their debt andmeet their financial obligations if circumstanceschange.
Several factors have likely contributed to this in-creased indebtedness. One is the higher level ofhousehold assets, which includes financial as-sets, real estate, and other real assets. The house-hold debt-to-asset ratio has been relativelystable since 1990, exhibiting only a modest
3. Clayton Research, drawing upon survey results fromSeptember 2002 to June 2003.
5
Developments and Trends
upward trend in recent years. Financial innova-tion and more efficient financial intermediation(between borrowers and lenders) have also fa-cilitated credit growth.
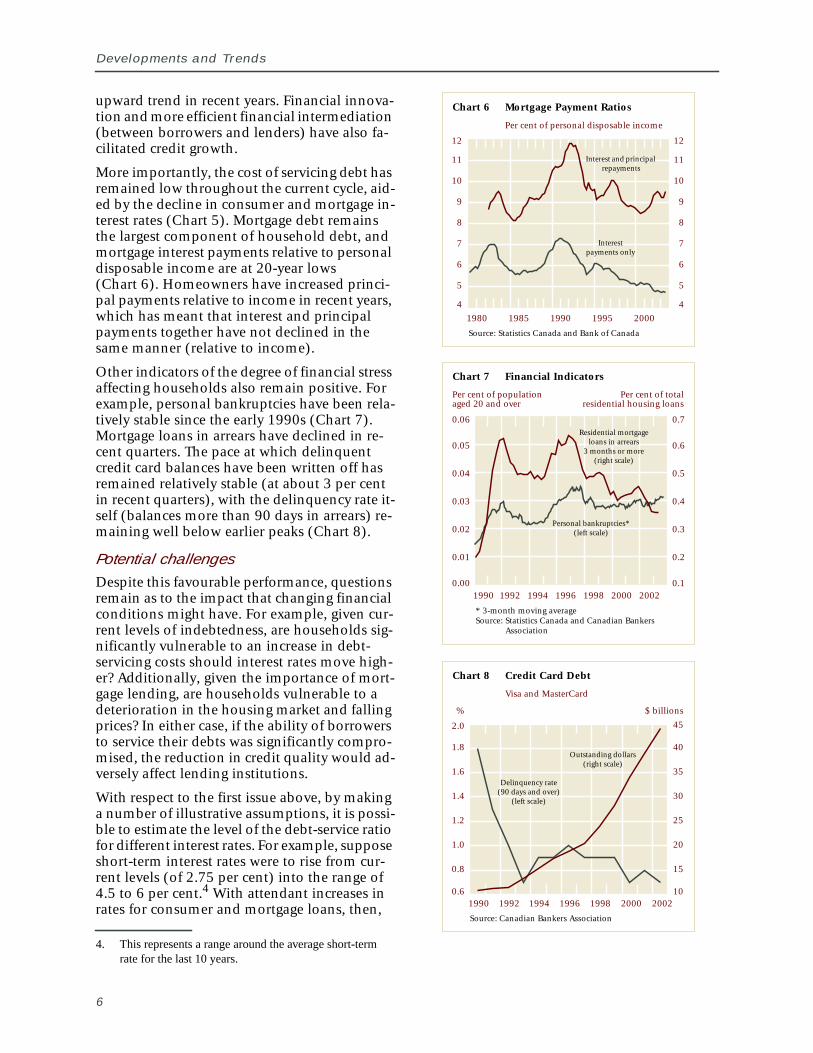
More importantly, the cost of servicing debt hasremained low throughout the current cycle, aid-ed by the decline in consumer and mortgage in-terest rates (Chart 5). Mortgage debt remainsthe largest component of household debt, andmortgage interest payments relative to personaldisposable income are at 20-year lows(Chart 6). Homeowners have increased princi-pal payments relative to income in recent years,which has meant that interest and principalpayments together have not declined in thesame manner (relative to income).
Other indicators of the degree of financial stressaffecting households also remain positive. Forexample, personal bankruptcies have been rela-tively stable since the early 1990s (Chart 7).Mortgage loans in arrears have declined in re-cent quarters. The pace at which delinquentcredit card balances have been written off hasremained relatively stable (at about 3 per centin recent quarters), with the delinquency rate it-self (balances more than 90 days in arrears) re-maining well below earlier peaks (Chart 8).
Potential challengesDespite this favourable performance, questionsremain as to the impact that changing financialconditions might have. For example, given cur-rent levels of indebtedness, are households sig-nificantly vulnerable to an increase in debt-servicing costs should interest rates move high-er? Additionally, given the importance of mort-gage lending, are households vulnerable to adeterioration in the housing market and fallingprices? In either case, if the ability of borrowersto service their debts was significantly compro-mised, the reduction in credit quality would ad-versely affect lending institutions.
With respect to the first issue above, by makinga number of illustrative assumptions, it is possi-ble to estimate the level of the debt-service ratiofor different interest rates. For example, supposeshort-term interest rates were to rise from cur-rent levels (of 2.75 per cent) into the range of4.5 to 6 per cent.4 With attendant increases inrates for consumer and mortgage loans, then,
4. This represents a range around the average short-termrate for the last 10 years.
6
Chart 6 Mortgage Payment Ratios
Per cent of personal disposable income
Source: Statistics Canada and Bank of Canada
4
5
6
7
8
9
10
11
12
4
5
6
7
8
9
10
11
12
1980 1985 1990 1995 2000
Interestpayments only
Interest and principalrepayments
Chart 8 Credit Card Debt
Visa and MasterCard
Source: Canadian Bankers Association
% $ billions
0.6
0.8
1.0
1.2
1.4
1.6
1.8
1990 1992 1994 1996 1998 2000 2002
2.0
Outstanding dollars(right scale)
Delinquency rate(90 days and over)
(left scale)
10
15
20
25
30
35
40
45
Chart 7 Financial Indicators
* 3-month moving averageSource: Statistics Canada and Canadian Bankers
Association
Per cent of populationaged 20 and over
Per cent of total residential housing loans
0.00
0.01
0.02
0.03
0.04
0.05
0.06
0.1
0.2
0.3
0.4
0.5
0.6
0.7
1990 1992 1994 1996 1998 2000 2002
Personal bankruptcies*(left scale)
Residential mortgageloans in arrears
3 months or more(right scale)
Financial System Review
under some simplifying assumptions, the debt-service ratio would climb into the correspondingrange of 8.5 to 10.5 per cent.5 Even at these lev-els, however, the debt-service ratio would re-main well below earlier peaks (recall Chart 5).
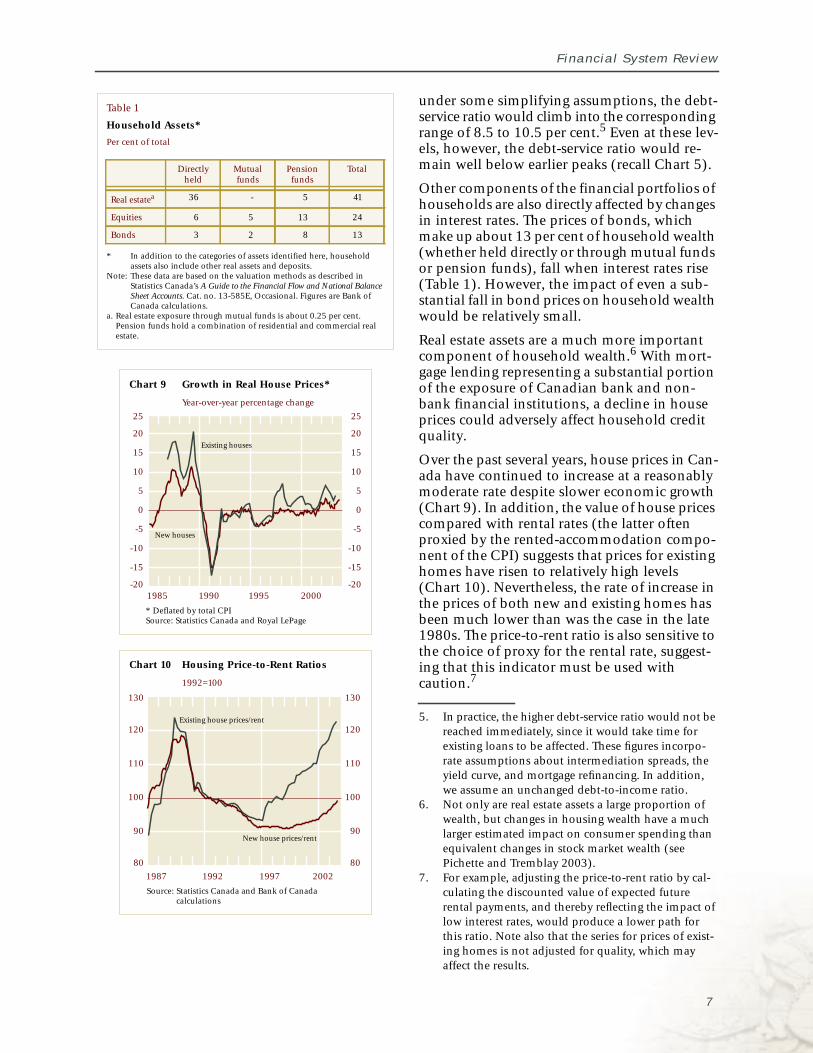
Other components of the financial portfolios ofhouseholds are also directly affected by changesin interest rates. The prices of bonds, whichmake up about 13 per cent of household wealth(whether held directly or through mutual fundsor pension funds), fall when interest rates rise(Table 1). However, the impact of even a sub-stantial fall in bond prices on household wealthwould be relatively small.
Real estate assets are a much more importantcomponent of household wealth.6 With mort-gage lending representing a substantial portionof the exposure of Canadian bank and non-bank financial institutions, a decline in houseprices could adversely affect household creditquality.
Over the past several years, house prices in Can-ada have continued to increase at a reasonablymoderate rate despite slower economic growth(Chart 9). In addition, the value of house pricescompared with rental rates (the latter oftenproxied by the rented-accommodation compo-nent of the CPI) suggests that prices for existinghomes have risen to relatively high levels(Chart 10). Nevertheless, the rate of increase inthe prices of both new and existing homes hasbeen much lower than was the case in the late1980s. The price-to-rent ratio is also sensitive tothe choice of proxy for the rental rate, suggest-ing that this indicator must be used withcaution.7
5. In practice, the higher debt-service ratio would not bereached immediately, since it would take time forexisting loans to be affected. These figures incorpo-rate assumptions about intermediation spreads, theyield curve, and mortgage refinancing. In addition,we assume an unchanged debt-to-income ratio.
6. Not only are real estate assets a large proportion ofwealth, but changes in housing wealth have a muchlarger estimated impact on consumer spending thanequivalent changes in stock market wealth (seePichette and Tremblay 2003).
7. For example, adjusting the price-to-rent ratio by cal-culating the discounted value of expected futurerental payments, and thereby reflecting the impact oflow interest rates, would produce a lower path forthis ratio. Note also that the series for prices of exist-ing homes is not adjusted for quality, which mayaffect the results.
Chart 10 Housing Price-to-Rent Ratios
1992=100
Source: Statistics Canada and Bank of Canadacalculations
80
90
100
110
120
130
80
90
100
110
120
130
1987 1992 1997 2002
Existing house prices/rent
New house prices/rent
Chart 9 Growth in Real House Prices*
Year-over-year percentage change
* Deflated by total CPISource: Statistics Canada and Royal LePage
-20
-15
-10
-5
0
5
10
15
20
25
-20
-15
-10
-5
0
5
10
15
20
25
1985 1990 1995 2000
New houses
Existing houses
Table 1
Household Assets*
Per cent of total
* In addition to the categories of assets identified here, householdassets also include other real assets and deposits.
Note: These data are based on the valuation methods as described inStatistics Canada’s A Guide to the Financial Flow and National BalanceSheet Accounts. Cat. no. 13-585E, Occasional. Figures are Bank ofCanada calculations.
a. Real estate exposure through mutual funds is about 0.25 per cent.Pension funds hold a combination of residential and commercial realestate.
Directlyheld
Mutualfunds
Pensionfunds
Total
Real estatea 36 - 5 41
Equities 6 5 13 24
Bonds 3 2 8 13
7
Developments and Trends
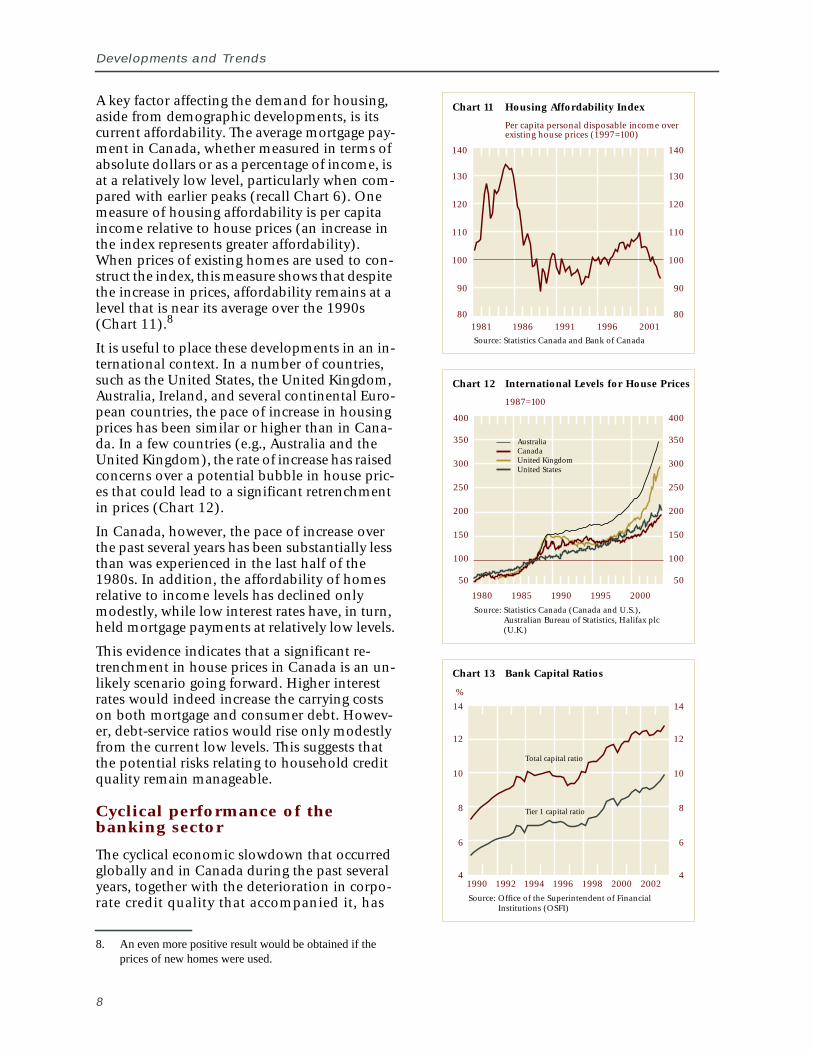
A key factor affecting the demand for housing,aside from demographic developments, is itscurrent affordability. The average mortgage pay-ment in Canada, whether measured in terms ofabsolute dollars or as a percentage of income, isat a relatively low level, particularly when com-pared with earlier peaks (recall Chart 6). Onemeasure of housing affordability is per capitaincome relative to house prices (an increase inthe index represents greater affordability).When prices of existing homes are used to con-struct the index, this measure shows that despitethe increase in prices, affordability remains at alevel that is near its average over the 1990s(Chart 11).8
It is useful to place these developments in an in-ternational context. In a number of countries,such as the United States, the United Kingdom,Australia, Ireland, and several continental Euro-pean countries, the pace of increase in housingprices has been similar or higher than in Cana-da. In a few countries (e.g., Australia and theUnited Kingdom), the rate of increase has raisedconcerns over a potential bubble in house pric-es that could lead to a significant retrenchmentin prices (Chart 12).
In Canada, however, the pace of increase overthe past several years has been substantially lessthan was experienced in the last half of the1980s. In addition, the affordability of homesrelative to income levels has declined onlymodestly, while low interest rates have, in turn,held mortgage payments at relatively low levels.
This evidence indicates that a significant re-trenchment in house prices in Canada is an un-likely scenario going forward. Higher interestrates would indeed increase the carrying costson both mortgage and consumer debt. Howev-er, debt-service ratios would rise only modestlyfrom the current low levels. This suggests thatthe potential risks relating to household creditquality remain manageable.
Cyclical performance of thebanking sector
The cyclical economic slowdown that occurredglobally and in Canada during the past severalyears, together with the deterioration in corpo-rate credit quality that accompanied it, has
8. An even more positive result would be obtained if theprices of new homes were used.
8
Chart 11 Housing Affordability Index
Per capita personal disposable income overexisting house prices (1997=100)
Source: Statistics Canada and Bank of Canada
80
90
100
110
120
130
140
80
90
100
110
120
130
140
1981 1986 1991 1996 2001
Chart 13 Bank Capital Ratios
Source: Office of the Superintendent of FinancialInstitutions (OSFI)
4
6
8
10
12
14
4
6
8
10
12
14
1990 1992 1994 1996 1998 2000 2002
%
Total capital ratio
Tier 1 capital ratio
Chart 12 International Levels for House Prices
1987=100
Source: Statistics Canada (Canada and U.S.),Australian Bureau of Statistics, Halifax plc(U.K.)
50
100
150
200
250
300
350
400
50
100
150
200
250
300
350
400
1980 1985 1990 1995 2000
AustraliaCanadaUnited KingdomUnited States
Financial System Review
affected Canadian financial institutions. Howbanks have performed in this environment,especially in relation to earlier cyclical episodes,provides insight into their underlying sound-ness.
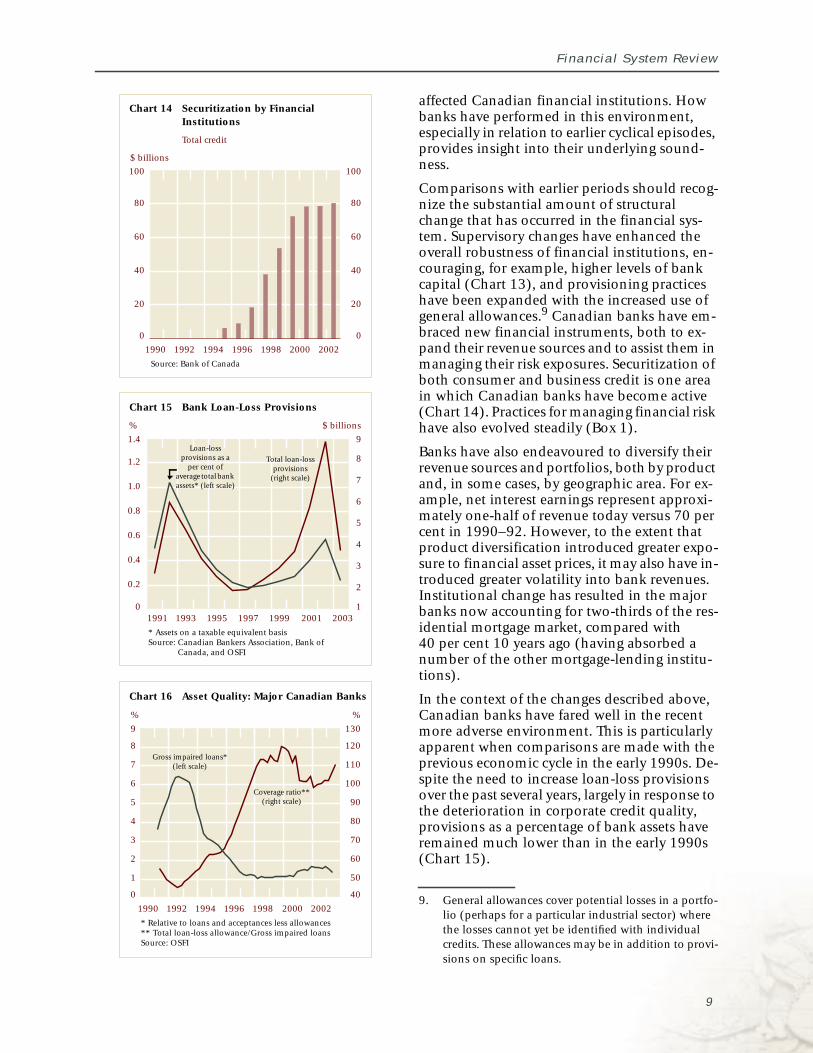
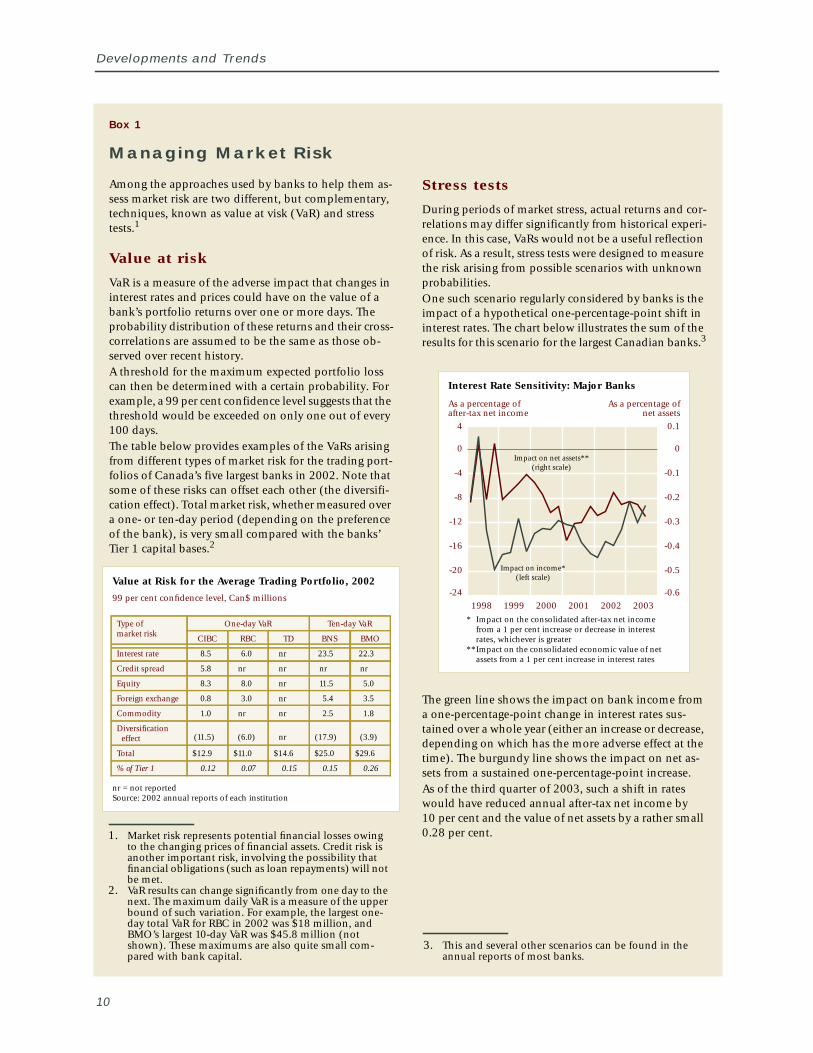
Comparisons with earlier periods should recog-nize the substantial amount of structuralchange that has occurred in the financial sys-tem. Supervisory changes have enhanced theoverall robustness of financial institutions, en-couraging, for example, higher levels of bankcapital (Chart 13), and provisioning practiceshave been expanded with the increased use ofgeneral allowances.9 Canadian banks have em-braced new financial instruments, both to ex-pand their revenue sources and to assist them inmanaging their risk exposures. Securitization ofboth consumer and business credit is one areain which Canadian banks have become active(Chart 14). Practices for managing financial riskhave also evolved steadily (Box 1).
Banks have also endeavoured to diversify theirrevenue sources and portfolios, both by productand, in some cases, by geographic area. For ex-ample, net interest earnings represent approxi-mately one-half of revenue today versus 70 percent in 1990–92. However, to the extent thatproduct diversification introduced greater expo-sure to financial asset prices, it may also have in-troduced greater volatility into bank revenues.Institutional change has resulted in the majorbanks now accounting for two-thirds of the res-idential mortgage market, compared with40 per cent 10 years ago (having absorbed anumber of the other mortgage-lending institu-tions).
In the context of the changes described above,Canadian banks have fared well in the recentmore adverse environment. This is particularlyapparent when comparisons are made with theprevious economic cycle in the early 1990s. De-spite the need to increase loan-loss provisionsover the past several years, largely in response tothe deterioration in corporate credit quality,provisions as a percentage of bank assets haveremained much lower than in the early 1990s(Chart 15).
9. General allowances cover potential losses in a portfo-lio (perhaps for a particular industrial sector) wherethe losses cannot yet be identified with individualcredits. These allowances may be in addition to provi-sions on specific loans.
Chart 14 Securitization by FinancialInstitutions
Total credit
Source: Bank of Canada
$ billions
0
20
40
60
80
100
0
20
40
60
80
100
1990 1992 1994 1996 1998 2000 2002
Chart 15 Bank Loan-Loss Provisions
* Assets on a taxable equivalent basisSource: Canadian Bankers Association, Bank of
Canada, and OSFI
% $ billions
1991 1993 1995 1997 1999 2001 20030
0.2
0.4
0.6
0.8
1.0
1.2
1.4
1
2
3
4
5
6
7
8
9Loan-loss
provisions as aper cent of
average totalbankassets* (left scale)
Total loan-lossprovisions
(right scale)
Chart 16 Asset Quality: Major Canadian Banks
* Relative to loans and acceptances less allowances** Total loan-loss allowance/Gross impaired loansSource: OSFI
%
0
1
2
3
4
5
6
7
8
9
40
50
60
70
80
90
100
110
120
130
1990 1992 1994 1996 1998 2000 2002
Gross impaired loans*(left scale)
Coverage ratio**(right scale)
%
9
Developments and Trends
10
Among the approaches used by banks to help them as-sess market risk are two different, but complementary,techniques, known as value at visk (VaR) and stresstests.1
Value at risk
VaR is a measure of the adverse impact that changes ininterest rates and prices could have on the value of abank’s portfolio returns over one or more days. Theprobability distribution of these returns and their cross-correlations are assumed to be the same as those ob-served over recent history.A threshold for the maximum expected portfolio losscan then be determined with a certain probability. Forexample, a 99 per cent confidence level suggests that thethreshold would be exceeded on only one out of every100 days.The table below provides examples of the VaRs arisingfrom different types of market risk for the trading port-folios of Canada’s five largest banks in 2002. Note thatsome of these risks can offset each other (the diversifi-cation effect). Total market risk, whether measured overa one- or ten-day period (depending on the preferenceof the bank), is very small compared with the banks’Tier 1 capital bases.2
Stress tests
During periods of market stress, actual returns and cor-relations may differ significantly from historical experi-ence. In this case, VaRs would not be a useful reflectionof risk. As a result, stress tests were designed to measurethe risk arising from possible scenarios with unknownprobabilities.One such scenario regularly considered by banks is theimpact of a hypothetical one-percentage-point shift ininterest rates. The chart below illustrates the sum of theresults for this scenario for the largest Canadian banks.3
The green line shows the impact on bank income froma one-percentage-point change in interest rates sus-tained over a whole year (either an increase or decrease,depending on which has the more adverse effect at thetime). The burgundy line shows the impact on net as-sets from a sustained one-percentage-point increase.As of the third quarter of 2003, such a shift in rateswould have reduced annual after-tax net income by10 per cent and the value of net assets by a rather small0.28 per cent.
Value at Risk for the Average Trading Portfolio, 2002
99 per cent confidence level, Can$ millions
nr = not reportedSource: 2002 annual reports of each institution
Type ofmarket risk
One-day VaR Ten-day VaR
CIBC RBC TD BNS BMO
Interest rate 8.5 6.0 nr 23.5 22.3
Credit spread 5.8 nr nr nr nr
Equity 8.3 8.0 nr 11.5 5.0
Foreign exchange 0.8 3.0 nr 5.4 3.5
Commodity 1.0 nr nr 2.5 1.8
Diversificationeffect (11.5) (6.0) nr (17.9) (3.9)
Total $12.9 $11.0 $14.6 $25.0 $29.6
% of Tier 1 0.12 0.07 0.15 0.15 0.26
Interest Rate Sensitivity: Major Banks
As a percentage of As a percentage ofafter-tax net income net assets
* Impact on the consolidated after-tax net incomefrom a 1 per cent increase or decrease in interestrates, whichever is greater
**Impact on the consolidated economic value of netassets from a 1 per cent increase in interest rates
Impact on income*(left scale)
Impact on net assets**(right scale)
-24
-20
-16
-12
-8
-4
0
4
-0.6
-0.5
-0.4
-0.3
-0.2
-0.1
0
0.1
1998 1999 2000 2001 2002 2003
Box 1
Managing Market Risk
3. This and several other scenarios can be found in theannual reports of most banks.
1. Market risk represents potential financial losses owingto the changing prices of financial assets. Credit risk isanother important risk, involving the possibility thatfinancial obligations (such as loan repayments) will notbe met.
2. VaR results can change significantly from one day to thenext. The maximum daily VaR is a measure of the upperbound of such variation. For example, the largest one-day total VaR for RBC in 2002 was $18 million, andBMO’s largest 10-day VaR was $45.8 million (notshown). These maximums are also quite small com-pared with bank capital.
Financial System Review
The level of impaired loans has also stayed rela-tively low and, in turn, the coverage ratio (totalloan-loss provisions relative to impaired loans)has remained over 100 per cent (Chart 16). Thislast outcome has been facilitated by the devel-opment of deeper secondary markets for loans,which banks have used to sell off portions oftheir loan books. In particular, several majorCanadian banks have indicated their desire toreduce their exposures in certain areas, such asexposures to high-risk corporate and foreignloans, and to increase their focus on retail lend-ing and wealth management.
The possibility has also been raised that the ex-posure of banks to certain sub-prime credits,such as credit cards, would contribute to largerlosses. But the evidence suggests that the riskshere have been well managed, with recent deli-quency rates on credit cards below those of ear-lier periods (recall Chart 8).
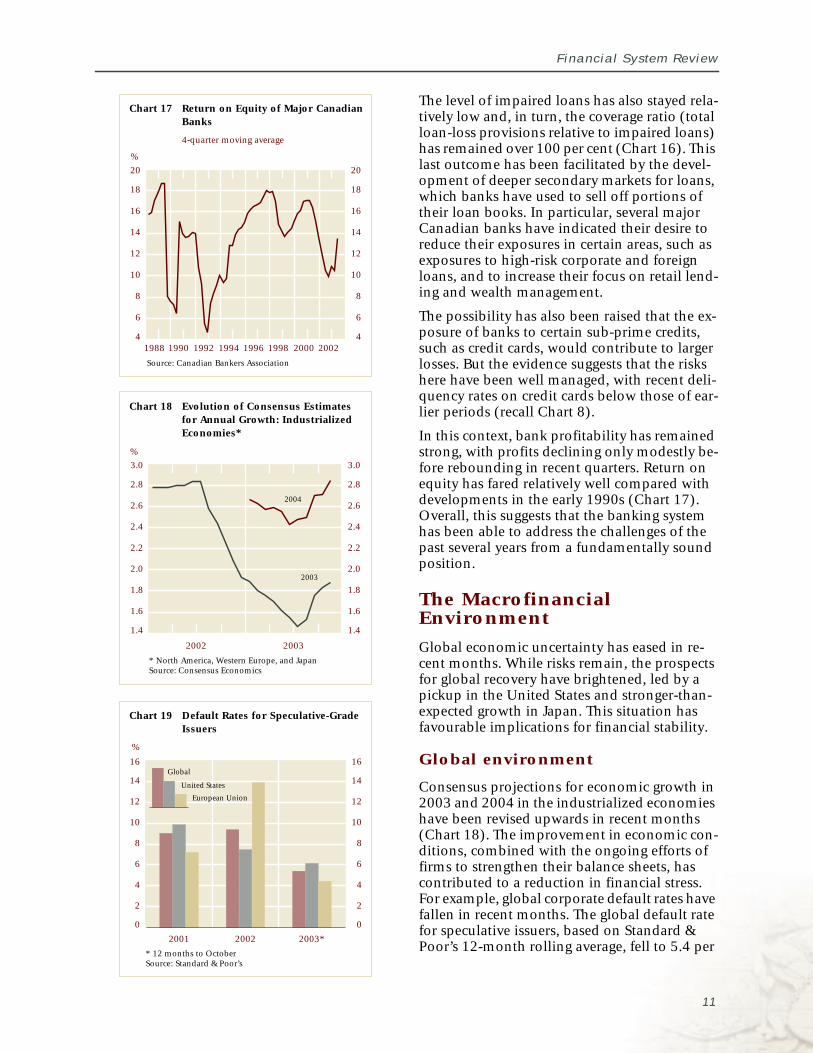
In this context, bank profitability has remainedstrong, with profits declining only modestly be-fore rebounding in recent quarters. Return onequity has fared relatively well compared withdevelopments in the early 1990s (Chart 17).Overall, this suggests that the banking systemhas been able to address the challenges of thepast several years from a fundamentally soundposition.
The MacrofinancialEnvironment
Global economic uncertainty has eased in re-cent months. While risks remain, the prospectsfor global recovery have brightened, led by apickup in the United States and stronger-than-expected growth in Japan. This situation hasfavourable implications for financial stability.
Global environment
Consensus projections for economic growth in2003 and 2004 in the industrialized economieshave been revised upwards in recent months(Chart 18). The improvement in economic con-ditions, combined with the ongoing efforts offirms to strengthen their balance sheets, hascontributed to a reduction in financial stress.For example, global corporate default rates havefallen in recent months. The global default ratefor speculative issuers, based on Standard &Poor’s 12-month rolling average, fell to 5.4 per
Chart 18 Evolution of Consensus Estimatesfor Annual Growth: IndustrializedEconomies*
Chart 17 Return on Equity of Major CanadianBanks
4-quarter moving average
Source: Canadian Bankers Association
* North America, Western Europe, and JapanSource: Consensus Economics
%
%
4
6
8
10
12
14
16
18
20
4
6
8
10
12
14
16
18
20
1988 1990 1992 1994 1996 1998 2000 2002
1.4
1.6
1.8
2.0
2.2
2.4
2.6
2.8
3.0
1.4
1.6
1.8
2.0
2.2
2.4
2.6
2.8
3.0
2002 2003
2003
2004
Chart 19 Default Rates for Speculative-GradeIssuers
* 12 months to OctoberSource: Standard & Poor’s
0
2
4
6
8
10
12
14
16
0
2
4
6
8
10
12
14
16
%
European Union
United States
Global
2001 2002 2003*
11
Developments and Trends
cent at the end of October from 9.4 per cent atthe end of last year (Chart 19). The global creditratio for downgrades per upgrade fell to 2.0 inthe third quarter, from 3.1 in the second, and4.6 in the first, and the proportion of issues un-der review for possible downgrading declined.
Globally, financial markets have improved sig-nificantly. Credit spreads have continued tonarrow, and equity market prices have risen,supported by improved earnings prospects andan increase in the risk appetite of investors.Bond issuance by corporations has been robust.
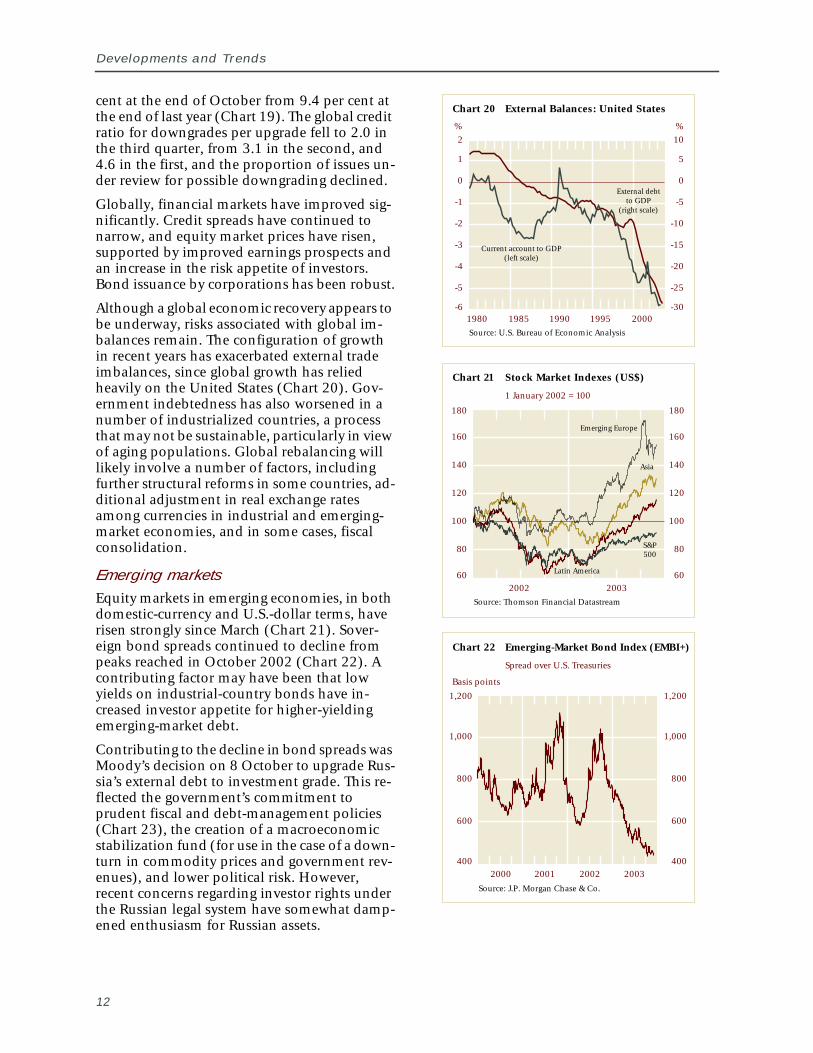
Although a global economic recovery appears tobe underway, risks associated with global im-balances remain. The configuration of growthin recent years has exacerbated external tradeimbalances, since global growth has reliedheavily on the United States (Chart 20). Gov-ernment indebtedness has also worsened in anumber of industrialized countries, a processthat may not be sustainable, particularly in viewof aging populations. Global rebalancing willlikely involve a number of factors, includingfurther structural reforms in some countries, ad-ditional adjustment in real exchange ratesamong currencies in industrial and emerging-market economies, and in some cases, fiscalconsolidation.
Emerging marketsEquity markets in emerging economies, in bothdomestic-currency and U.S.-dollar terms, haverisen strongly since March (Chart 21). Sover-eign bond spreads continued to decline frompeaks reached in October 2002 (Chart 22). Acontributing factor may have been that lowyields on industrial-country bonds have in-creased investor appetite for higher-yieldingemerging-market debt.
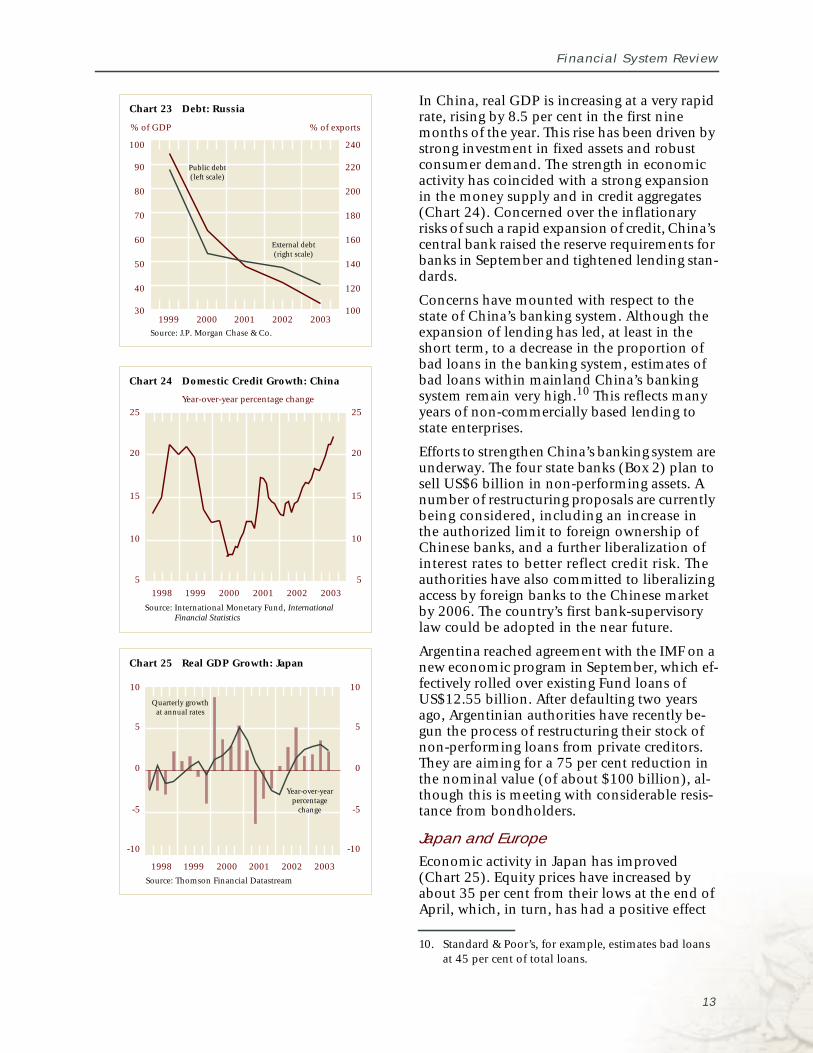
Contributing to the decline in bond spreads wasMoody’s decision on 8 October to upgrade Rus-sia’s external debt to investment grade. This re-flected the government’s commitment toprudent fiscal and debt-management policies(Chart 23), the creation of a macroeconomicstabilization fund (for use in the case of a down-turn in commodity prices and government rev-enues), and lower political risk. However,recent concerns regarding investor rights underthe Russian legal system have somewhat damp-ened enthusiasm for Russian assets.
12
Chart 20 External Balances: United States
Source: U.S. Bureau of Economic Analysis
%
-6
-5
-4
-3
-2
-1
0
1
2
-30
-25
-20
-15
-10
-5
0
5
10
1980 1985 1990 1995 2000
Current account to GDP(left scale)
External debtto GDP
(right scale)
%
Chart 21 Stock Market Indexes (US$)
1 January 2002 = 100
Source: Thomson Financial Datastream
60
80
100
120
140
160
180
60
80
100
120
140
160
180
2002 2003
Asia
Latin America
S&P500
Emerging Europe
Chart 22 Emerging-Market Bond Index (EMBI+)
Spread over U.S. Treasuries
Source: J.P. Morgan Chase & Co.
Basis points
400
600
800
1,000
1,200
400
600
800
1,000
1,200
2000 2001 2002 2003
Financial System Review
In China, real GDP is increasing at a very rapidrate, rising by 8.5 per cent in the first ninemonths of the year. This rise has been driven bystrong investment in fixed assets and robustconsumer demand. The strength in economicactivity has coincided with a strong expansionin the money supply and in credit aggregates(Chart 24). Concerned over the inflationaryrisks of such a rapid expansion of credit, China’scentral bank raised the reserve requirements forbanks in September and tightened lending stan-dards.
Concerns have mounted with respect to thestate of China’s banking system. Although theexpansion of lending has led, at least in theshort term, to a decrease in the proportion ofbad loans in the banking system, estimates ofbad loans within mainland China’s bankingsystem remain very high.10 This reflects manyyears of non-commercially based lending tostate enterprises.
Efforts to strengthen China’s banking system areunderway. The four state banks (Box 2) plan tosell US$6 billion in non-performing assets. Anumber of restructuring proposals are currentlybeing considered, including an increase inthe authorized limit to foreign ownership ofChinese banks, and a further liberalization ofinterest rates to better reflect credit risk. Theauthorities have also committed to liberalizingaccess by foreign banks to the Chinese marketby 2006. The country’s first bank-supervisorylaw could be adopted in the near future.
Argentina reached agreement with the IMF on anew economic program in September, which ef-fectively rolled over existing Fund loans ofUS$12.55 billion. After defaulting two yearsago, Argentinian authorities have recently be-gun the process of restructuring their stock ofnon-performing loans from private creditors.They are aiming for a 75 per cent reduction inthe nominal value (of about $100 billion), al-though this is meeting with considerable resis-tance from bondholders.
Japan and EuropeEconomic activity in Japan has improved(Chart 25). Equity prices have increased byabout 35 per cent from their lows at the end ofApril, which, in turn, has had a positive effect
10. Standard & Poor’s, for example, estimates bad loansat 45 per cent of total loans.
Chart 23 Debt: Russia
Source: J.P. Morgan Chase & Co.
% of GDP % of exports
1999 2000 2001 2002 2003
External debt(right scale)
Public debt(left scale)
30
40
50
60
70
80
90
100
100
120
140
160
180
200
220
240
Chart 24 Domestic Credit Growth: China
Year-over-year percentage change
Source: International Monetary Fund, InternationalFinancial Statistics
5
10
15
20
25
5
10
15
20
25
1998 1999 2000 2001 2002 2003
Chart 25 Real GDP Growth: Japan
Source: Thomson Financial Datastream
-10
-5
0
5
10
-10
-5
0
5
10
1998 1999 2000 2001 2002 2003
Quarterly growthat annual rates
Year-over-yearpercentage
change
13
14
Developments and Trends
The Chinese banking system is dominated by the “big-four” state commercial banks (SCBs): the Industrial andCommercial Bank of China, the Agricultural Bank ofChina, the Bank of China, and the China ConstructionBank. These banks have sectoral lending responsibili-ties, with the Bank of China being responsible for for-eign exchange and trade finance. The bulk of theirlending has been directed to state-owned enterprises.Together, the SCBs account for about two-thirds of thetotal assets of the country’s banking system. Four gov-ernment-owned asset-management companies were es-tablished in 1999 to facilitate the resolution of baddebts at the large state banks.
China also has three policy banks: the State Develop-ment Bank, the Export-Import Bank of China, and theAgriculture Development Bank. Their principal role isto finance infrastructure and other long-term projectssupported by the state. Their assets represent about10 per cent of total banking assets.
Ten joint-stock medium-sized commercial banks arealso in operation. In most cases, these are owned bystate enterprises or public sector entities. Four of thesebanks are listed on the domestic stock markets. In re-cent years, these institutions have expanded at a briskpace through mergers with other banks and strategic al-liances with foreign banks. The banking system also in-cludes more than 100 city commercial banks, about
30,000 rural credit co-operatives, and a host of tradeand investment corporations.
Participation by foreign banks is negligible because ofthe various restrictions they face in the conduct of theirbusiness. Foreign banks can engage in local-currencybusiness only in specific geographic areas. They are notable to take retail deposits, and lending is subject toquantity restrictions. Foreign banks are, however, ex-pected to play an increasing role in the Chinese finan-cial system in the future, following China’s accession tothe WTO. In 2004, foreign banks will be able to conductunfettered domestic-currency business with Chineseenterprises, and geographic restrictions will be lifted. In2007, they will be able to conduct local-currency busi-ness with Chinese individuals and will have full nation-al treatment.
In recent years, foreign banks have tried to increase theirpenetration of the Chinese banking market. In Decem-ber 2001, the HSBC and the International Finance Cor-poration (IFC), the private investment arm of the WorldBank, bought, respectively, 8 and 5 per cent of the Bankof Shanghai, one of the largest city commercial banks.The IFC recently bought a 1.6 per cent stake in the Min-sheng Bank, the only privately owned bank in China.China’s banking regulator will allow foreign banks tohold up to 25 per cent of a Chinese bank in the future,compared with the current limit of 15 per cent.
Box 2
The Structure of the Chinese Banking System
Chart 26 Gross Financial Liabilities: GeneralGovernment
Per cent of GDP
Source: Organisation for Economic Co-operation andDevelopment
40
60
80
100
120
140
160
40
60
80
100
120
140
160
1990 1995 2000
United States
Japan
Euro area
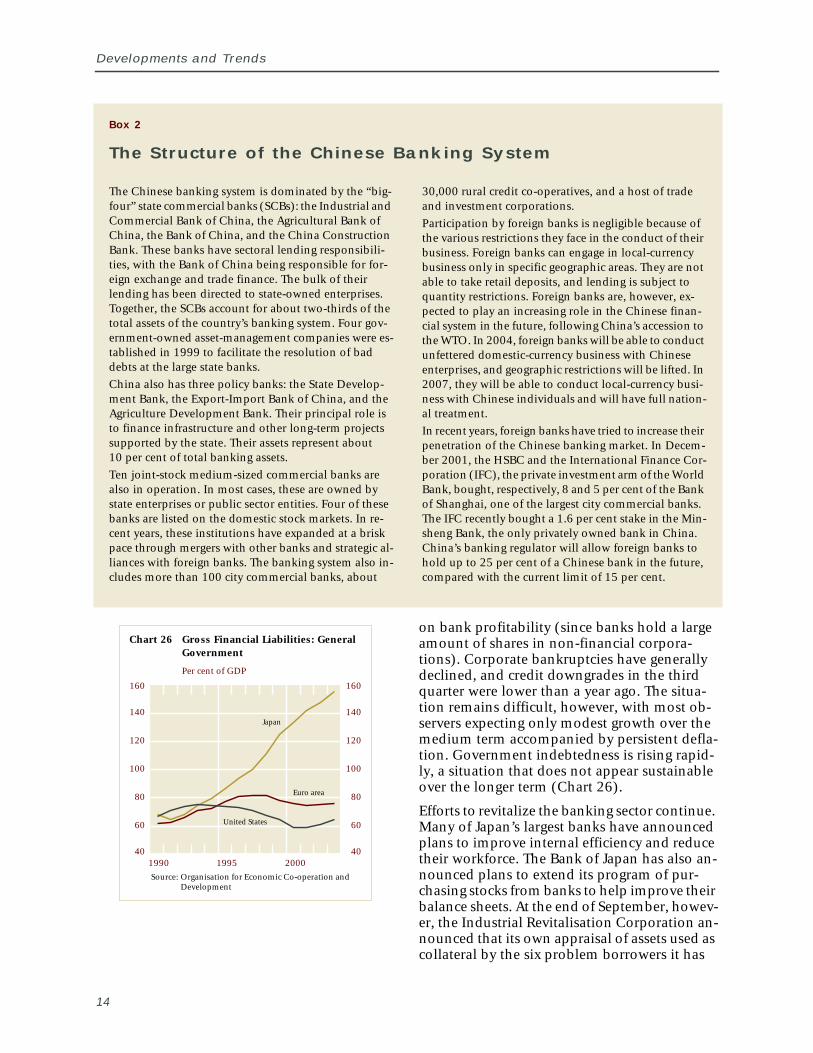
on bank profitability (since banks hold a largeamount of shares in non-financial corpora-tions). Corporate bankruptcies have generallydeclined, and credit downgrades in the thirdquarter were lower than a year ago. The situa-tion remains difficult, however, with most ob-servers expecting only modest growth over themedium term accompanied by persistent defla-tion. Government indebtedness is rising rapid-ly, a situation that does not appear sustainableover the longer term (Chart 26).
Efforts to revitalize the banking sector continue.Many of Japan’s largest banks have announcedplans to improve internal efficiency and reducetheir workforce. The Bank of Japan has also an-nounced plans to extend its program of pur-chasing stocks from banks to help improve theirbalance sheets. At the end of September, howev-er, the Industrial Revitalisation Corporation an-nounced that its own appraisal of assets used ascollateral by the six problem borrowers it has
Financial System Review
Chart 28 Real GDP Growth: United States
Chart 29 Corporate Profit: United States
Profit as a share of GDP
Chart 27 House Price Index: United Kingdom
Year-over-year percentage change
Source: Halifax plc
Source: U.S. Bureau of Economic Analysis
Source: Thomson Financial Datastream
-10
0
10
20
30
40
-10
0
10
20
30
40
1987 1992 1997 2002
-2
0
2
4
6
8
10
-2
0
2
4
6
8
10
1998 1999 2000 2001 2002 2003
3
4
5
6
7
3
4
5
6
7
1990 1992 1994 1996 1998 2000 2002
Quarterly growth atannual rates
Year-over-yearpercentage change
agreed to support was lower than the assess-ment of the original lending banks. This mayimply the need for further increases to loan-lossreserves. At the end of November, the govern-ment nationalized Ashikaga Bank.
Economic activity in Europe remains weak, withonly limited growth in the euro zone in the lastthree quarters. This has contributed to ongoingpressure on the European corporate sector.Credit downgrades continued to outpace up-grades by a wide margin in the third quarter.Twenty-five per cent of the companies rated atthe parent level in Europe were listed with anegative bias, a proportion similar to the situa-tion last year. Owing to Germany’s weak econo-my and the pressures on its banking sector,some corporations there are experiencing in-creased difficulty in obtaining bank loans.
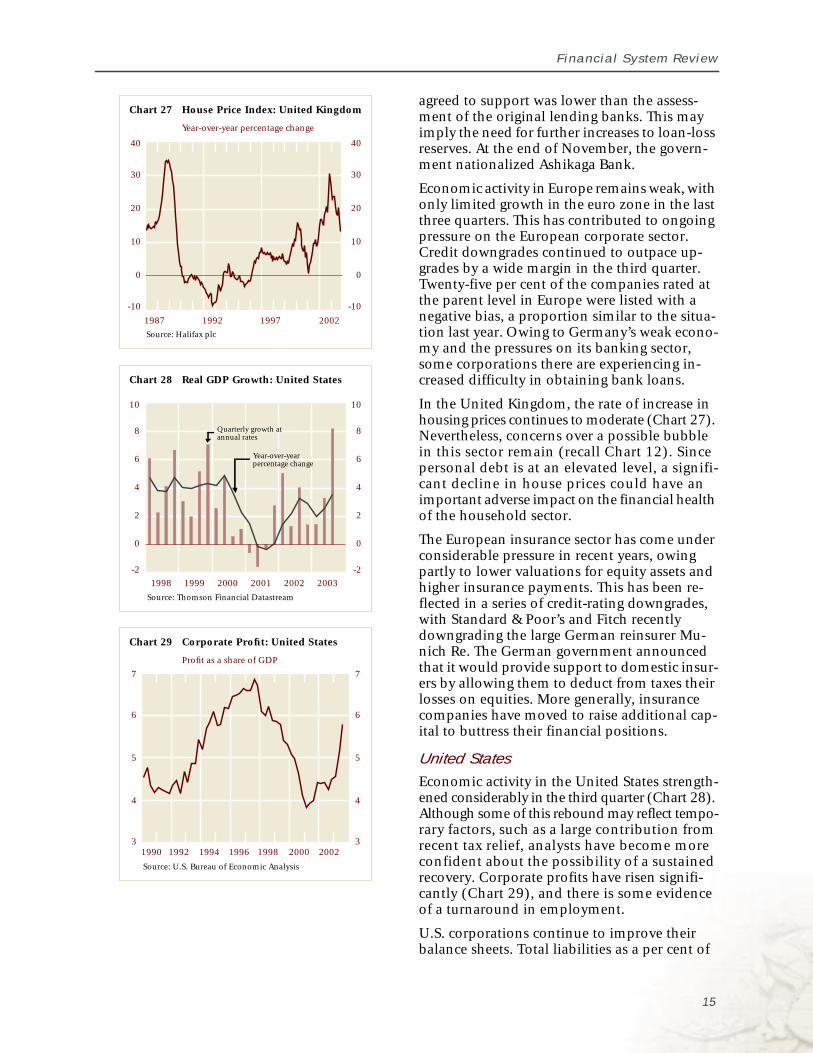
In the United Kingdom, the rate of increase inhousing prices continues to moderate (Chart 27).Nevertheless, concerns over a possible bubblein this sector remain (recall Chart 12). Sincepersonal debt is at an elevated level, a signifi-cant decline in house prices could have animportant adverse impact on the financial healthof the household sector.
The European insurance sector has come underconsiderable pressure in recent years, owingpartly to lower valuations for equity assets andhigher insurance payments. This has been re-flected in a series of credit-rating downgrades,with Standard & Poor’s and Fitch recentlydowngrading the large German reinsurer Mu-nich Re. The German government announcedthat it would provide support to domestic insur-ers by allowing them to deduct from taxes theirlosses on equities. More generally, insurancecompanies have moved to raise additional cap-ital to buttress their financial positions.
United StatesEconomic activity in the United States strength-ened considerably in the third quarter (Chart 28).Although some of this rebound may reflect tempo-rary factors, such as a large contribution fromrecent tax relief, analysts have become moreconfident about the possibility of a sustainedrecovery. Corporate profits have risen signifi-cantly (Chart 29), and there is some evidenceof a turnaround in employment.
U.S. corporations continue to improve theirbalance sheets. Total liabilities as a per cent of
15
Developments and Trends
Chart 30 Household Debt: United States
Per cent of personal disposable income
Source: U.S. Federal Reserve Board
10
12
14
16
18
20
10
12
14
16
18
20
1980 1985 1990 1995 2000
Debt-service payments
Financial obligations
Chart 31 Return on Assets: All InstitutionsInsured by the FDIC
Source: U.S. Federal Deposit Insurance Corporation
0.8
1.0
1.2
1.4
0.8
1.0
1.2
1.4
1992 1997 2002
%
Table 2
Largest U.S. Banks (by assets)
As of 31 December 2002
Source: U.S. Federal Deposit Insurance Corporation
$billion
Citigroup 1,097
Bank of America/FleetBoston 851
J.P. Morgan Chase & Co. 759
Wells Fargo 349
Wachovia 341
Per cent of total bank assets 48
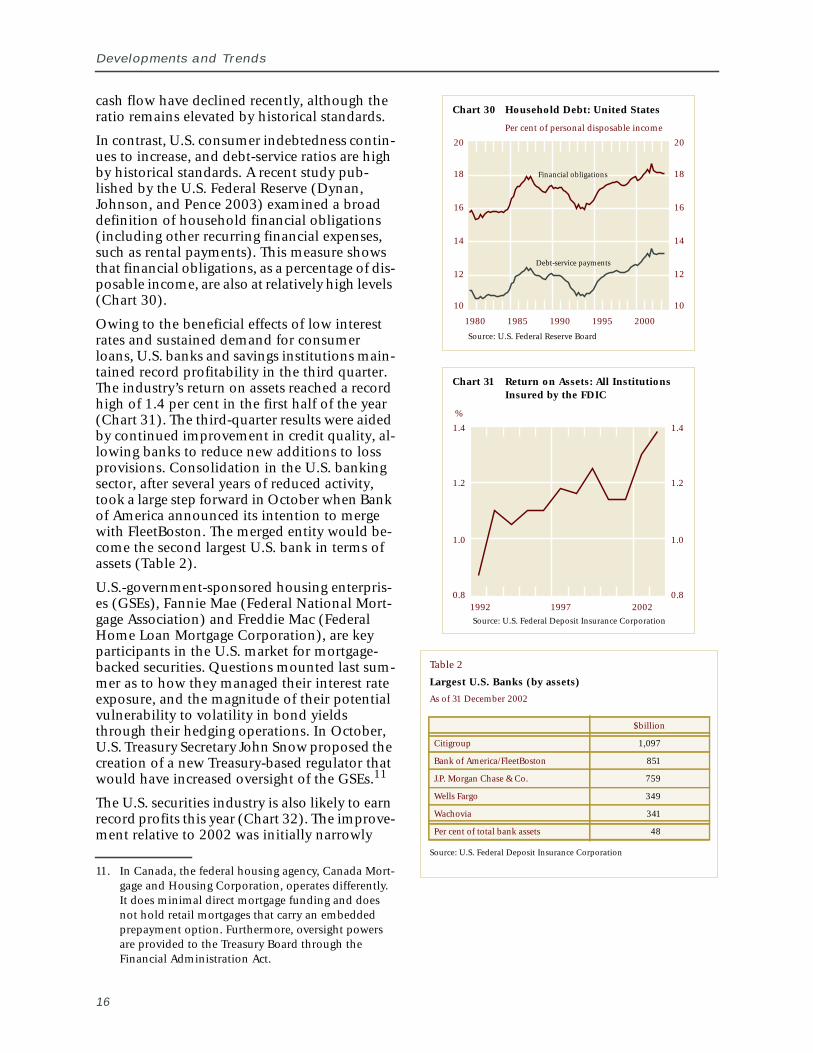
cash flow have declined recently, although theratio remains elevated by historical standards.
In contrast, U.S. consumer indebtedness contin-ues to increase, and debt-service ratios are highby historical standards. A recent study pub-lished by the U.S. Federal Reserve (Dynan,Johnson, and Pence 2003) examined a broaddefinition of household financial obligations(including other recurring financial expenses,such as rental payments). This measure showsthat financial obligations, as a percentage of dis-posable income, are also at relatively high levels(Chart 30).
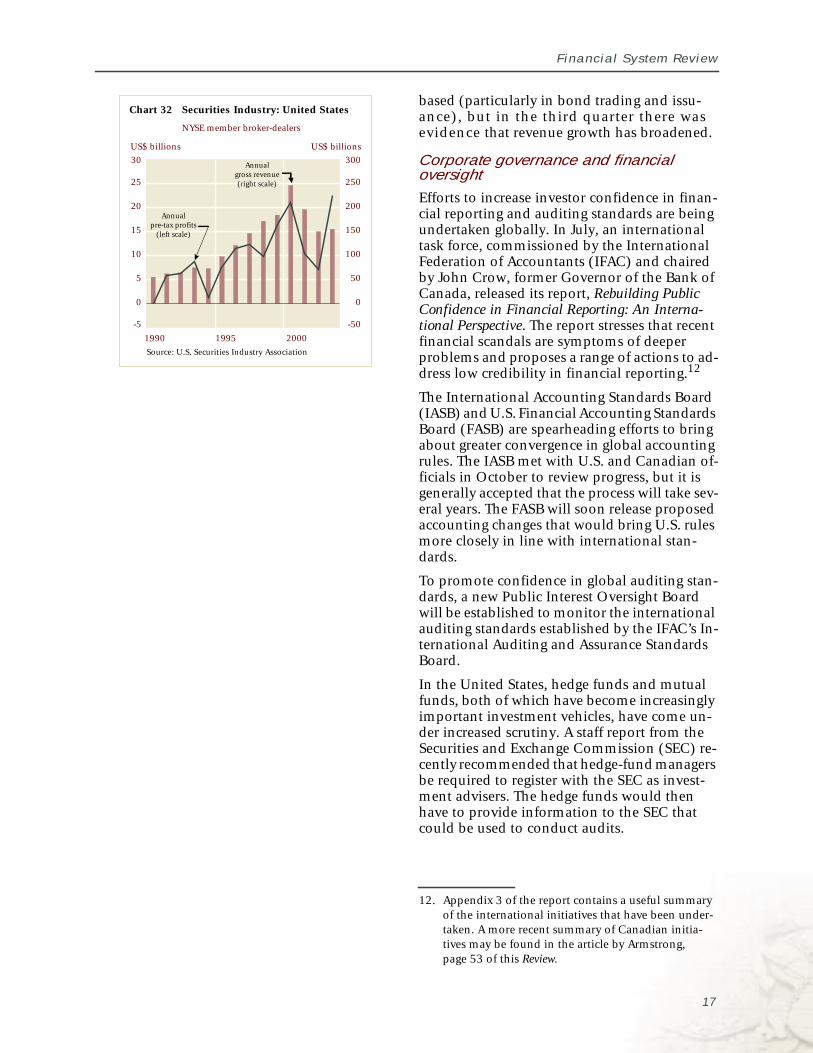
Owing to the beneficial effects of low interestrates and sustained demand for consumerloans, U.S. banks and savings institutions main-tained record profitability in the third quarter.The industry’s return on assets reached a recordhigh of 1.4 per cent in the first half of the year(Chart 31). The third-quarter results were aidedby continued improvement in credit quality, al-lowing banks to reduce new additions to lossprovisions. Consolidation in the U.S. bankingsector, after several years of reduced activity,took a large step forward in October when Bankof America announced its intention to mergewith FleetBoston. The merged entity would be-come the second largest U.S. bank in terms ofassets (Table 2).
U.S.-government-sponsored housing enterpris-es (GSEs), Fannie Mae (Federal National Mort-gage Association) and Freddie Mac (FederalHome Loan Mortgage Corporation), are keyparticipants in the U.S. market for mortgage-backed securities. Questions mounted last sum-mer as to how they managed their interest rateexposure, and the magnitude of their potentialvulnerability to volatility in bond yieldsthrough their hedging operations. In October,U.S. Treasury Secretary John Snow proposed thecreation of a new Treasury-based regulator thatwould have increased oversight of the GSEs.11
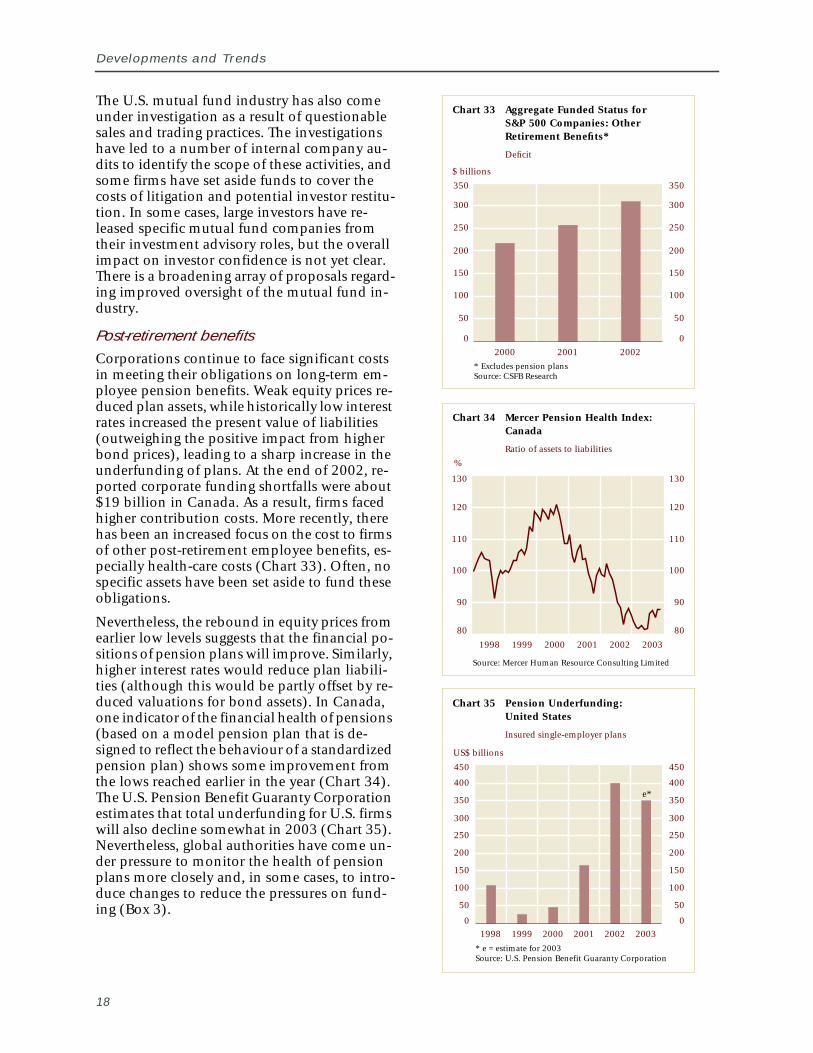
The U.S. securities industry is also likely to earnrecord profits this year (Chart 32). The improve-ment relative to 2002 was initially narrowly
11. In Canada, the federal housing agency, Canada Mort-gage and Housing Corporation, operates differently.It does minimal direct mortgage funding and doesnot hold retail mortgages that carry an embeddedprepayment option. Furthermore, oversight powersare provided to the Treasury Board through theFinancial Administration Act.
16
Financial System Review
Chart 32 Securities Industry: United States
NYSE member broker-dealers
Source: U.S. Securities Industry Association
US$ billions US$ billions
-5
0
5
10
15
20
25
30
-50
0
50
100
150
200
250
300
1990 1995 2000
Annualpre-tax profits
(left scale)
Annualgross revenue(right scale)
based (particularly in bond trading and issu-ance), but in the third quarter there wasevidence that revenue growth has broadened.
Corporate governance and financialoversightEfforts to increase investor confidence in finan-cial reporting and auditing standards are beingundertaken globally. In July, an internationaltask force, commissioned by the InternationalFederation of Accountants (IFAC) and chairedby John Crow, former Governor of the Bank ofCanada, released its report, Rebuilding PublicConfidence in Financial Reporting: An Interna-tional Perspective. The report stresses that recentfinancial scandals are symptoms of deeperproblems and proposes a range of actions to ad-dress low credibility in financial reporting.12
The International Accounting Standards Board(IASB) and U.S. Financial Accounting StandardsBoard (FASB) are spearheading efforts to bringabout greater convergence in global accountingrules. The IASB met with U.S. and Canadian of-ficials in October to review progress, but it isgenerally accepted that the process will take sev-eral years. The FASB will soon release proposedaccounting changes that would bring U.S. rulesmore closely in line with international stan-dards.
To promote confidence in global auditing stan-dards, a new Public Interest Oversight Boardwill be established to monitor the internationalauditing standards established by the IFAC’s In-ternational Auditing and Assurance StandardsBoard.
In the United States, hedge funds and mutualfunds, both of which have become increasinglyimportant investment vehicles, have come un-der increased scrutiny. A staff report from theSecurities and Exchange Commission (SEC) re-cently recommended that hedge-fund managersbe required to register with the SEC as invest-ment advisers. The hedge funds would thenhave to provide information to the SEC thatcould be used to conduct audits.
12. Appendix 3 of the report contains a useful summaryof the international initiatives that have been under-taken. A more recent summary of Canadian initia-tives may be found in the article by Armstrong,page 53 of this Review.
17
Developments and Trends
Chart 33 Aggregate Funded Status forS&P 500 Companies: OtherRetirement Benefits*
Deficit
* Excludes pension plansSource: CSFB Research
$ billions
0
50
100
150
200
250
300
350
0
50
100
150
200
250
300
350
2000 2001 2002
Chart 35 Pension Underfunding:United States
Insured single-employer plans
* e = estimate for 2003Source: U.S. Pension Benefit Guaranty Corporation
US$ billions
0
50
100
150
200
250
300
350
400
450
0
50
100
150
200
250
300
350
400
450
1998 1999 2000 2001 2002 2003
e*
Chart 34 Mercer Pension Health Index:Canada
Ratio of assets to liabilities
Source: Mercer Human Resource Consulting Limited
80
90
100
110
120
130
80
90
100
110
120
130
1998 1999 2000 2001 2002 2003
%
The U.S. mutual fund industry has also comeunder investigation as a result of questionablesales and trading practices. The investigationshave led to a number of internal company au-dits to identify the scope of these activities, andsome firms have set aside funds to cover thecosts of litigation and potential investor restitu-tion. In some cases, large investors have re-leased specific mutual fund companies fromtheir investment advisory roles, but the overallimpact on investor confidence is not yet clear.There is a broadening array of proposals regard-ing improved oversight of the mutual fund in-dustry.
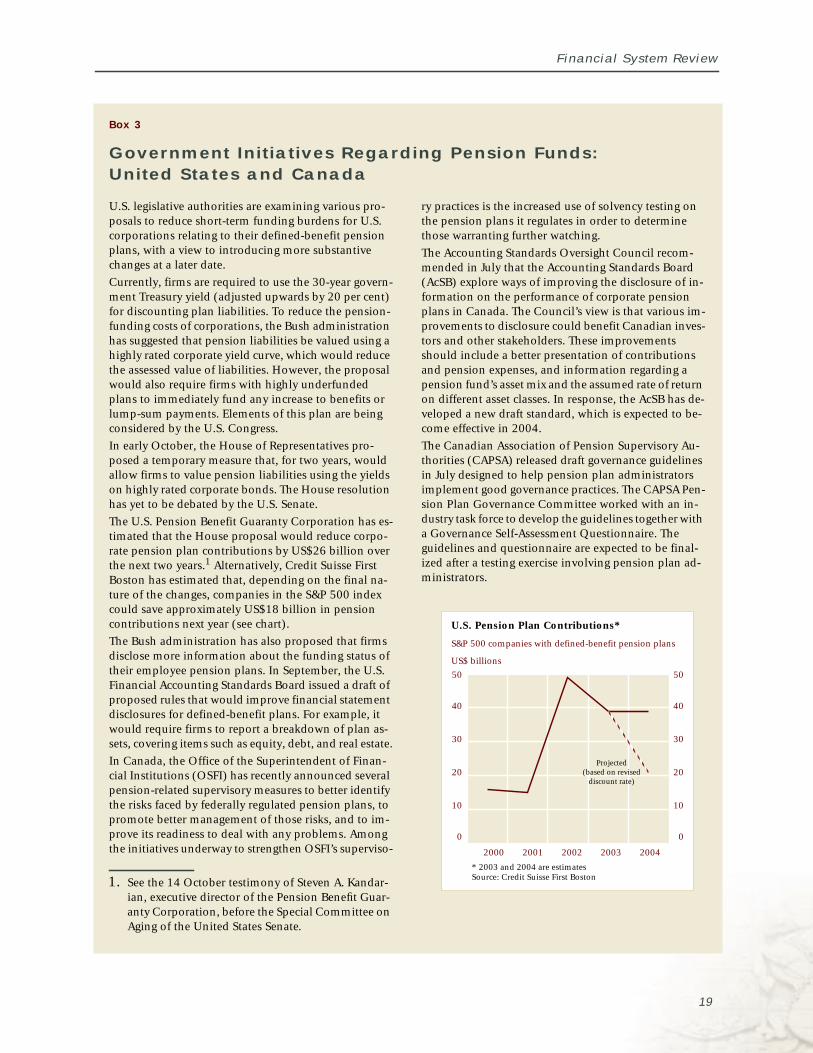
Post-retirement benefitsCorporations continue to face significant costsin meeting their obligations on long-term em-ployee pension benefits. Weak equity prices re-duced plan assets, while historically low interestrates increased the present value of liabilities(outweighing the positive impact from higherbond prices), leading to a sharp increase in theunderfunding of plans. At the end of 2002, re-ported corporate funding shortfalls were about$19 billion in Canada. As a result, firms facedhigher contribution costs. More recently, therehas been an increased focus on the cost to firmsof other post-retirement employee benefits, es-pecially health-care costs (Chart 33). Often, nospecific assets have been set aside to fund theseobligations.
Nevertheless, the rebound in equity prices fromearlier low levels suggests that the financial po-sitions of pension plans will improve. Similarly,higher interest rates would reduce plan liabili-ties (although this would be partly offset by re-duced valuations for bond assets). In Canada,one indicator of the financial health of pensions(based on a model pension plan that is de-signed to reflect the behaviour of a standardizedpension plan) shows some improvement fromthe lows reached earlier in the year (Chart 34).The U.S. Pension Benefit Guaranty Corporationestimates that total underfunding for U.S. firmswill also decline somewhat in 2003 (Chart 35).Nevertheless, global authorities have come un-der pressure to monitor the health of pensionplans more closely and, in some cases, to intro-duce changes to reduce the pressures on fund-ing (Box 3).
18
19
Financial System Review
U.S. legislative authorities are examining various pro-posals to reduce short-term funding burdens for U.S.corporations relating to their defined-benefit pensionplans, with a view to introducing more substantivechanges at a later date.
Currently, firms are required to use the 30-year govern-ment Treasury yield (adjusted upwards by 20 per cent)for discounting plan liabilities. To reduce the pension-funding costs of corporations, the Bush administrationhas suggested that pension liabilities be valued using ahighly rated corporate yield curve, which would reducethe assessed value of liabilities. However, the proposalwould also require firms with highly underfundedplans to immediately fund any increase to benefits orlump-sum payments. Elements of this plan are beingconsidered by the U.S. Congress.
In early October, the House of Representatives pro-posed a temporary measure that, for two years, wouldallow firms to value pension liabilities using the yieldson highly rated corporate bonds. The House resolutionhas yet to be debated by the U.S. Senate.
The U.S. Pension Benefit Guaranty Corporation has es-timated that the House proposal would reduce corpo-rate pension plan contributions by US$26 billion overthe next two years.1 Alternatively, Credit Suisse FirstBoston has estimated that, depending on the final na-ture of the changes, companies in the S&P 500 indexcould save approximately US$18 billion in pensioncontributions next year (see chart).
The Bush administration has also proposed that firmsdisclose more information about the funding status oftheir employee pension plans. In September, the U.S.Financial Accounting Standards Board issued a draft ofproposed rules that would improve financial statementdisclosures for defined-benefit plans. For example, itwould require firms to report a breakdown of plan as-sets, covering items such as equity, debt, and real estate.
In Canada, the Office of the Superintendent of Finan-cial Institutions (OSFI) has recently announced severalpension-related supervisory measures to better identifythe risks faced by federally regulated pension plans, topromote better management of those risks, and to im-prove its readiness to deal with any problems. Amongthe initiatives underway to strengthen OSFI’s superviso-
ry practices is the increased use of solvency testing onthe pension plans it regulates in order to determinethose warranting further watching.
The Accounting Standards Oversight Council recom-mended in July that the Accounting Standards Board(AcSB) explore ways of improving the disclosure of in-formation on the performance of corporate pensionplans in Canada. The Council’s view is that various im-provements to disclosure could benefit Canadian inves-tors and other stakeholders. These improvementsshould include a better presentation of contributionsand pension expenses, and information regarding apension fund’s asset mix and the assumed rate of returnon different asset classes. In response, the AcSB has de-veloped a new draft standard, which is expected to be-come effective in 2004.
The Canadian Association of Pension Supervisory Au-thorities (CAPSA) released draft governance guidelinesin July designed to help pension plan administratorsimplement good governance practices. The CAPSA Pen-sion Plan Governance Committee worked with an in-dustry task force to develop the guidelines together witha Governance Self-Assessment Questionnaire. Theguidelines and questionnaire are expected to be final-ized after a testing exercise involving pension plan ad-ministrators.
U.S. Pension Plan Contributions*
S&P 500 companies with defined-benefit pension plans
* 2003 and 2004 are estimatesSource: Credit Suisse First Boston
US$ billions
0
10
20
30
40
50
0
10
20
30
40
50
2000 2001 2002 2003 2004
Projected(based on revised
discount rate)
Box 3
Government Initiatives Regarding Pension Funds:United States and Canada
1. See the 14 October testimony of Steven A. Kandar-ian, executive director of the Pension Benefit Guar-anty Corporation, before the Special Committee onAging of the United States Senate.
Developments and Trends
Canadian developments
Domestic factors that influence developmentsin the Canadian financial system include thestate of the Canadian economy, the financialposition of the household and corporate sec-tors, and developments within specific industri-al sectors.
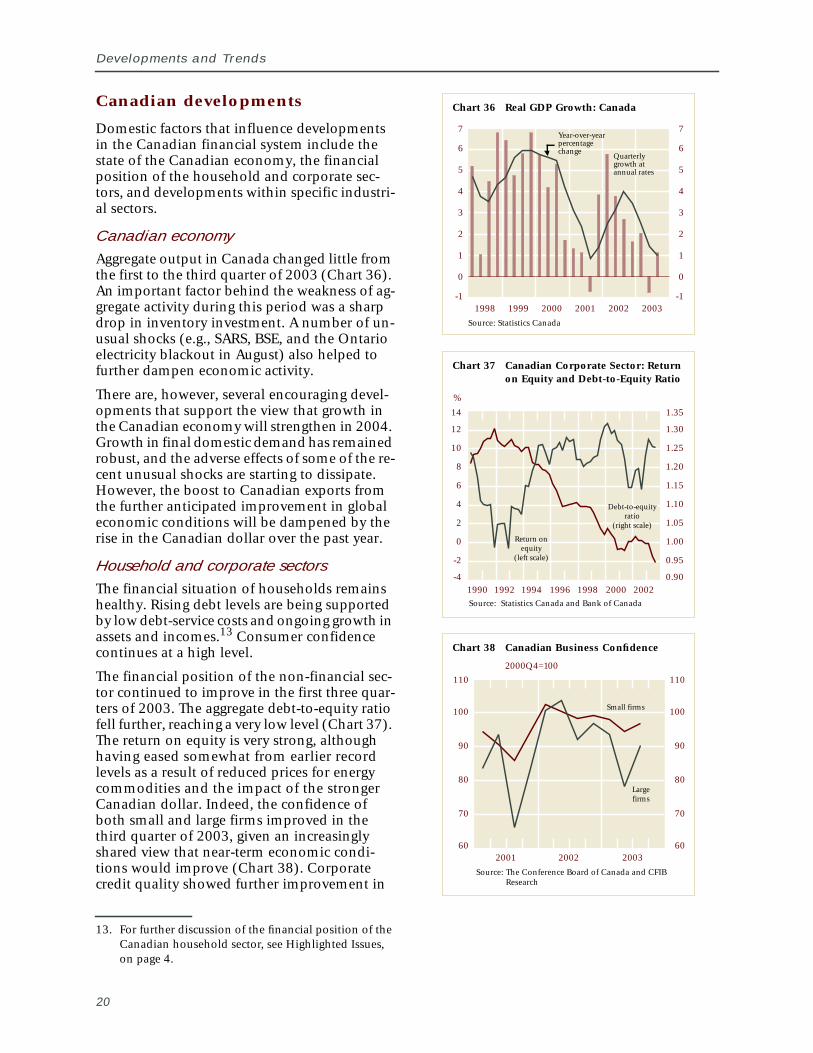
Canadian economyAggregate output in Canada changed little fromthe first to the third quarter of 2003 (Chart 36).An important factor behind the weakness of ag-gregate activity during this period was a sharpdrop in inventory investment. A number of un-usual shocks (e.g., SARS, BSE, and the Ontarioelectricity blackout in August) also helped tofurther dampen economic activity.
There are, however, several encouraging devel-opments that support the view that growth inthe Canadian economy will strengthen in 2004.Growth in final domestic demand has remainedrobust, and the adverse effects of some of the re-cent unusual shocks are starting to dissipate.However, the boost to Canadian exports fromthe further anticipated improvement in globaleconomic conditions will be dampened by therise in the Canadian dollar over the past year.
Household and corporate sectorsThe financial situation of households remainshealthy. Rising debt levels are being supportedby low debt-service costs and ongoing growth inassets and incomes.13 Consumer confidencecontinues at a high level.
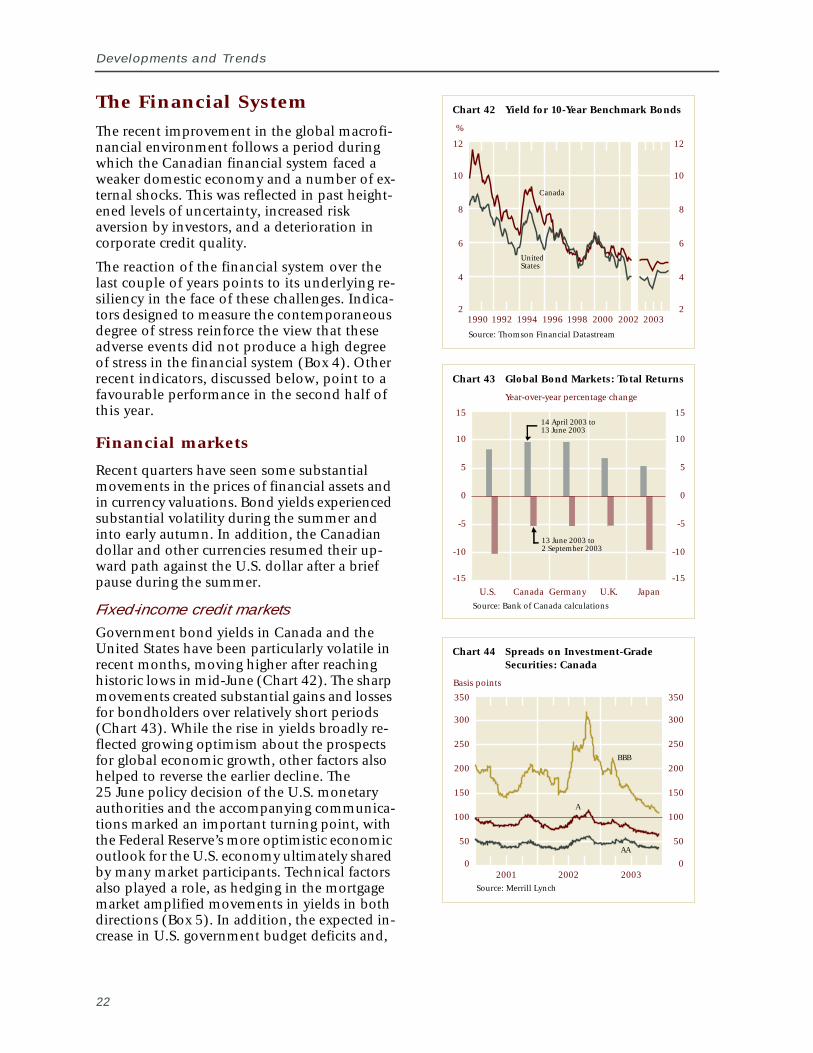
The financial position of the non-financial sec-tor continued to improve in the first three quar-ters of 2003. The aggregate debt-to-equity ratiofell further, reaching a very low level (Chart 37).The return on equity is very strong, althoughhaving eased somewhat from earlier recordlevels as a result of reduced prices for energycommodities and the impact of the strongerCanadian dollar. Indeed, the confidence ofboth small and large firms improved in thethird quarter of 2003, given an increasinglyshared view that near-term economic condi-tions would improve (Chart 38). Corporatecredit quality showed further improvement in
13. For further discussion of the financial position of theCanadian household sector, see Highlighted Issues,on page 4.
20
Chart 36 Real GDP Growth: Canada
Source: Statistics Canada
-1
0
1
2
3
4
5
6
7
-1
0
1
2
3
4
5
6
7
1998 1999 2000 2001 2002 2003
Year-over-yearpercentagechange
Quarterlygrowth atannual rates
Chart 37 Canadian Corporate Sector: Returnon Equity and Debt-to-Equity Ratio
Source: Statistics Canada and Bank of Canada
1990 1992 1994 1996 1998 2000 2002
%
-4
-2
0
2
4
6
8
10
12
14
0.90
0.95
1.00
1.05
1.10
1.15
1.20
1.25
1.30
1.35
Debt-to-equityratio
(right scale)
Return onequity
(left scale)
Chart 38 Canadian Business Confidence
2000Q4=100
Source: The Conference Board of Canada and CFIBResearch
60
70
80
90
100
110
60
70
80
90
100
110
2001 2002 2003
Largefirms
Small firms

Financial System Review
Chart 39 Credit-Rating Downgrades: Canada
Source: Moody’s and Standard & Poor’s
0
5
10
15
20
0
5
10
15
20
2001 2002 2003
Moody’s
Standard & Poor’s
Chart 40 Farm Cash Receipts
Cattle and calves
Chart 41 Real Output Growth: Steel
Source: Statistics Canada
Source: Statistics Canada
$ billions
0.4
0.6
0.8
1.0
1.2
1.4
1.6
1.8
2.0
2.2
0.4
0.6
0.8
1.0
1.2
1.4
1.6
1.8
2.0
2.2
1998 1999 2000 2001 2002 2003
-20
30
-20
-10
0
10
20
30
1998 1999 2000 2001 2002 2003
Year-over-yearpercentage
change
Quarterly growth atannual rates
-10
0
10
20
the third quarter, as the number of companiesdowngraded continued to decline, with few de-faults recorded to date in 2003 (Chart 39).
IndustryAlthough the financial condition of the overallnon-financial corporate sector is relativelyhealthy, some industries continue to be underfinancial stress. Activity levels and profitabilityin the airline and aerospace manufacturing in-dustries fell sharply in the second quarter fromalready-low levels, mainly owing to the adverseeconomic effects of the SARS outbreak. As a re-sult, some firms in these industries are restruc-turing their operations and balance sheets.More recently, there has been a partial recoveryof activity in the airline industry.
The financial situation in Canada’s livestocksector has also deteriorated, following the ap-pearance of one case of BSE in Alberta(Chart 40). However, a number of countrieshave partially lifted the ban on Canadian beefproducts since early August.
The financial positions of many of those sectorswith a strong net export orientation continue to beadversely affected by the appreciation of the Cana-dian dollar. In particular, the rise in the value ofthe Canadian dollar is likely to have an especiallysignificant negative impact on the profitability ofhigh-tech manufacturing industries. Indeed, prof-itability in the electronic and computer manufac-turing industry deteriorated in the third quarter of2003, with manufacturers of telecommunicationsequipment still facing weak demand.
As well, steel manufacturers have seen their fi-nancial positions worsen considerably(Chart 41), given weak demand and prices, thestrong dollar, and high costs for raw materialsand energy. While producers of non-ferrousmetals and forest products would typically ben-efit from the marked increase in global pricesfor both non-ferrous metals and lumber, a ma-jor offsetting factor has been the appreciation ofthe Canadian dollar.
The near-term financial prospects of NorthAmerican automakers remain weak owing toglobal excess capacity, the high cost of sales in-centives, and the need to shore up their pensionplans. Credit ratings have come under down-ward pressure.14
14. In recent months, the credit ratings of Ford andDaimlerChrysler have been downgraded.
21
Developments and Trends
Chart 42 Yield for 10-Year Benchmark Bonds
Source: Thomson Financial Datastream
%
2
4
6
8
10
12
2
4
6
8
10
12
1990 1996 2000 2003
UnitedStates
1992 1994 1998 2002
Canada
Chart 43 Global Bond Markets: Total Returns
Year-over-year percentage change
Source: Bank of Canada calculations
-15
-10
-5
0
5
10
15
-15
-10
-5
0
5
10
15
U.S. Canada Germany U.K. Japan
14 April 2003 to13 June 2003
13 June 2003 to2 September 2003
Chart 44 Spreads on Investment-GradeSecurities: Canada
Source: Merrill Lynch
A
AA
BBB
Basis points
0
50
100
150
200
250
300
350
0
50
100
150
200
250
300
350
2001 2002 2003
The Financial System
The recent improvement in the global macrofi-nancial environment follows a period duringwhich the Canadian financial system faced aweaker domestic economy and a number of ex-ternal shocks. This was reflected in past height-ened levels of uncertainty, increased riskaversion by investors, and a deterioration incorporate credit quality.
The reaction of the financial system over thelast couple of years points to its underlying re-siliency in the face of these challenges. Indica-tors designed to measure the contemporaneousdegree of stress reinforce the view that theseadverse events did not produce a high degreeof stress in the financial system (Box 4). Otherrecent indicators, discussed below, point to afavourable performance in the second half ofthis year.
Financial markets
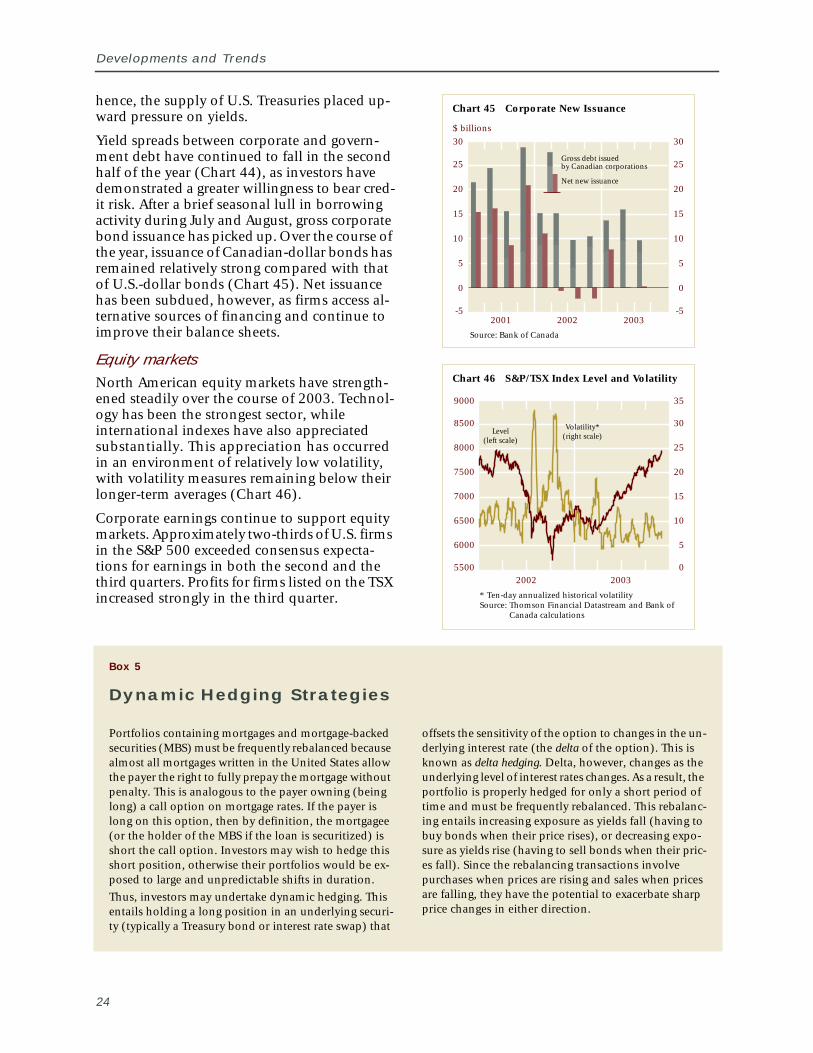
Recent quarters have seen some substantialmovements in the prices of financial assets andin currency valuations. Bond yields experiencedsubstantial volatility during the summer andinto early autumn. In addition, the Canadiandollar and other currencies resumed their up-ward path against the U.S. dollar after a briefpause during the summer.
Fixed-income credit marketsGovernment bond yields in Canada and theUnited States have been particularly volatile inrecent months, moving higher after reachinghistoric lows in mid-June (Chart 42). The sharpmovements created substantial gains and lossesfor bondholders over relatively short periods(Chart 43). While the rise in yields broadly re-flected growing optimism about the prospectsfor global economic growth, other factors alsohelped to reverse the earlier decline. The25 June policy decision of the U.S. monetaryauthorities and the accompanying communica-tions marked an important turning point, withthe Federal Reserve’s more optimistic economicoutlook for the U.S. economy ultimately sharedby many market participants. Technical factorsalso played a role, as hedging in the mortgagemarket amplified movements in yields in bothdirections (Box 5). In addition, the expected in-crease in U.S. government budget deficits and,
22
23
Financial System Review
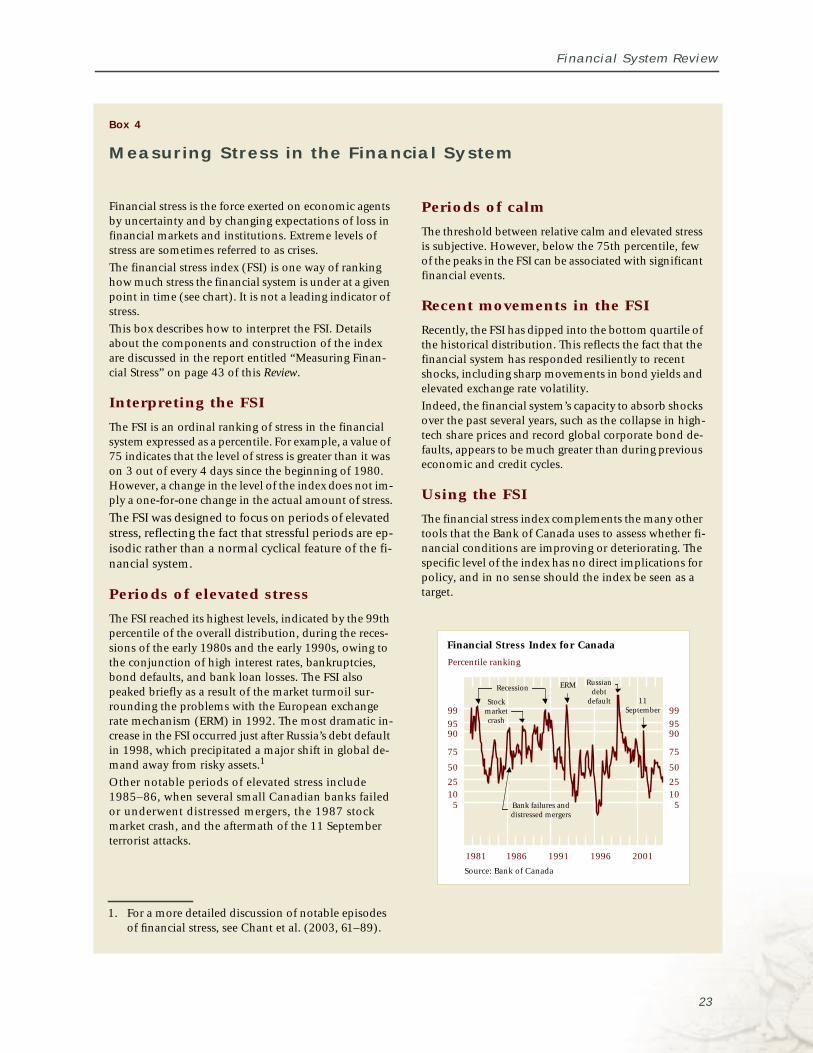
Financial stress is the force exerted on economic agentsby uncertainty and by changing expectations of loss infinancial markets and institutions. Extreme levels ofstress are sometimes referred to as crises.
The financial stress index (FSI) is one way of rankinghow much stress the financial system is under at a givenpoint in time (see chart). It is not a leading indicator ofstress.
This box describes how to interpret the FSI. Detailsabout the components and construction of the indexare discussed in the report entitled “Measuring Finan-cial Stress” on page 43 of this Review.
Interpreting the FSI
The FSI is an ordinal ranking of stress in the financialsystem expressed as a percentile. For example, a value of75 indicates that the level of stress is greater than it wason 3 out of every 4 days since the beginning of 1980.However, a change in the level of the index does not im-ply a one-for-one change in the actual amount of stress.
The FSI was designed to focus on periods of elevatedstress, reflecting the fact that stressful periods are ep-isodic rather than a normal cyclical feature of the fi-nancial system.
Periods of elevated stress
The FSI reached its highest levels, indicated by the 99thpercentile of the overall distribution, during the reces-sions of the early 1980s and the early 1990s, owing tothe conjunction of high interest rates, bankruptcies,bond defaults, and bank loan losses. The FSI alsopeaked briefly as a result of the market turmoil sur-rounding the problems with the European exchangerate mechanism (ERM) in 1992. The most dramatic in-crease in the FSI occurred just after Russia’s debt defaultin 1998, which precipitated a major shift in global de-mand away from risky assets.1
Other notable periods of elevated stress include1985–86, when several small Canadian banks failedor underwent distressed mergers, the 1987 stockmarket crash, and the aftermath of the 11 Septemberterrorist attacks.
Periods of calm
The threshold between relative calm and elevated stressis subjective. However, below the 75th percentile, fewof the peaks in the FSI can be associated with significantfinancial events.
Recent movements in the FSI
Recently, the FSI has dipped into the bottom quartile ofthe historical distribution. This reflects the fact that thefinancial system has responded resiliently to recentshocks, including sharp movements in bond yields andelevated exchange rate volatility.
Indeed, the financial system’s capacity to absorb shocksover the past several years, such as the collapse in high-tech share prices and record global corporate bond de-faults, appears to be much greater than during previouseconomic and credit cycles.
Using the FSI
The financial stress index complements the many othertools that the Bank of Canada uses to assess whether fi-nancial conditions are improving or deteriorating. Thespecific level of the index has no direct implications forpolicy, and in no sense should the index be seen as atarget.
Financial Stress Index for Canada
Source: Bank of Canada
Percentile ranking
25
50
75
909599
510
1986 1991 1996 20011981
25
50
75
909599
510
Stockmarketcrash
Recession ERM
Bank failures anddistressed mergers
Russiandebt
default 11September
Box 4
Measuring Stress in the Financial System
1. For a more detailed discussion of notable episodesof financial stress, see Chant et al. (2003, 61–89).
Developments and Trends
hence, the supply of U.S. Treasuries placed up-ward pressure on yields.
Yield spreads between corporate and govern-ment debt have continued to fall in the secondhalf of the year (Chart 44), as investors havedemonstrated a greater willingness to bear cred-it risk. After a brief seasonal lull in borrowingactivity during July and August, gross corporatebond issuance has picked up. Over the course ofthe year, issuance of Canadian-dollar bonds hasremained relatively strong compared with thatof U.S.-dollar bonds (Chart 45). Net issuancehas been subdued, however, as firms access al-ternative sources of financing and continue toimprove their balance sheets.
Equity marketsNorth American equity markets have strength-ened steadily over the course of 2003. Technol-ogy has been the strongest sector, whileinternational indexes have also appreciatedsubstantially. This appreciation has occurredin an environment of relatively low volatility,with volatility measures remaining below theirlonger-term averages (Chart 46).
Corporate earnings continue to support equitymarkets. Approximately two-thirds of U.S. firmsin the S&P 500 exceeded consensus expecta-tions for earnings in both the second and thethird quarters. Profits for firms listed on the TSXincreased strongly in the third quarter.
24
Portfolios containing mortgages and mortgage-backedsecurities (MBS) must be frequently rebalanced becausealmost all mortgages written in the United States allowthe payer the right to fully prepay the mortgage withoutpenalty. This is analogous to the payer owning (beinglong) a call option on mortgage rates. If the payer islong on this option, then by definition, the mortgagee(or the holder of the MBS if the loan is securitized) isshort the call option. Investors may wish to hedge thisshort position, otherwise their portfolios would be ex-posed to large and unpredictable shifts in duration.
Thus, investors may undertake dynamic hedging. Thisentails holding a long position in an underlying securi-ty (typically a Treasury bond or interest rate swap) that
Box 5
Dynamic Hedging Strategies
Chart 46 S&P/TSX Index Level and Volatility
* Ten-day annualized historical volatilitySource: Thomson Financial Datastream and Bank of
Canada calculations
5500
6000
6500
7000
7500
8000
8500
9000
0
5
10
15
20
25
30
35
2002 2003
Level(left scale)
Volatility*(right scale)
Chart 45 Corporate New Issuance
Source: Bank of Canada
$ billions
-5
0
5
10
15
20
25
30
-5
0
5
10
15
20
25
30
2001 2002 2003
Net new issuance
Gross debt issuedby Canadian corporations
offsets the sensitivity of the option to changes in the un-derlying interest rate (the delta of the option). This isknown as delta hedging. Delta, however, changes as theunderlying level of interest rates changes. As a result, theportfolio is properly hedged for only a short period oftime and must be frequently rebalanced. This rebalanc-ing entails increasing exposure as yields fall (having tobuy bonds when their price rises), or decreasing expo-sure as yields rise (having to sell bonds when their pric-es fall). Since the rebalancing transactions involvepurchases when prices are rising and sales when pricesare falling, they have the potential to exacerbate sharpprice changes in either direction.
Financial System Review
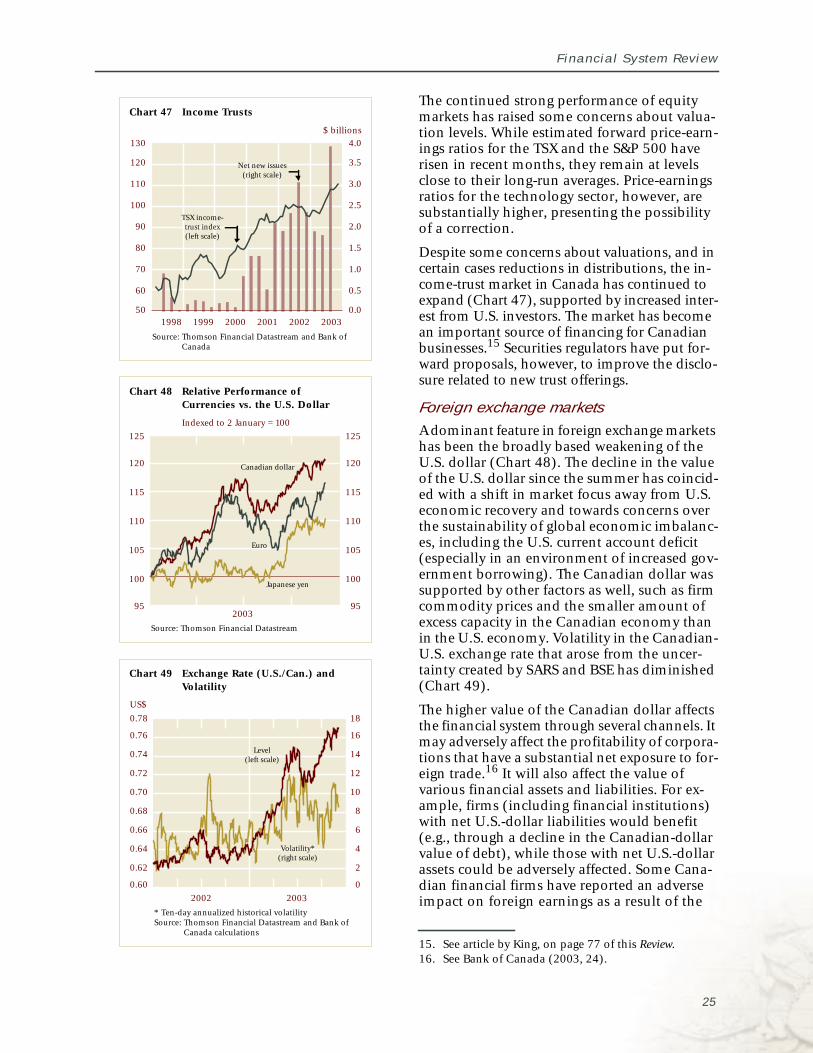
The continued strong performance of equitymarkets has raised some concerns about valua-tion levels. While estimated forward price-earn-ings ratios for the TSX and the S&P 500 haverisen in recent months, they remain at levelsclose to their long-run averages. Price-earningsratios for the technology sector, however, aresubstantially higher, presenting the possibilityof a correction.
Despite some concerns about valuations, and incertain cases reductions in distributions, the in-come-trust market in Canada has continued toexpand (Chart 47), supported by increased inter-est from U.S. investors. The market has becomean important source of financing for Canadianbusinesses.15 Securities regulators have put for-ward proposals, however, to improve the disclo-sure related to new trust offerings.
Foreign exchange marketsA dominant feature in foreign exchange marketshas been the broadly based weakening of theU.S. dollar (Chart 48). The decline in the valueof the U.S. dollar since the summer has coincid-ed with a shift in market focus away from U.S.economic recovery and towards concerns overthe sustainability of global economic imbalanc-es, including the U.S. current account deficit(especially in an environment of increased gov-ernment borrowing). The Canadian dollar wassupported by other factors as well, such as firmcommodity prices and the smaller amount ofexcess capacity in the Canadian economy thanin the U.S. economy. Volatility in the Canadian-U.S. exchange rate that arose from the uncer-tainty created by SARS and BSE has diminished(Chart 49).
The higher value of the Canadian dollar affectsthe financial system through several channels. Itmay adversely affect the profitability of corpora-tions that have a substantial net exposure to for-eign trade.16 It will also affect the value ofvarious financial assets and liabilities. For ex-ample, firms (including financial institutions)with net U.S.-dollar liabilities would benefit(e.g., through a decline in the Canadian-dollarvalue of debt), while those with net U.S.-dollarassets could be adversely affected. Some Cana-dian financial firms have reported an adverseimpact on foreign earnings as a result of the
15. See article by King, on page 77 of this Review.16. See Bank of Canada (2003, 24).
Chart 48 Relative Performance ofCurrencies vs. the U.S. Dollar
Indexed to 2 January = 100
Source: Thomson Financial Datastream
95
100
105
110
115
120
125
95
100
105
110
115
120
125
2003
Euro
Canadian dollar
Japanese yen
Chart 49 Exchange Rate (U.S./Can.) andVolatility
* Ten-day annualized historical volatilitySource: Thomson Financial Datastream and Bank of
Canada calculations
0.60
0.62
0.64
0.66
0.68
0.70
0.72
0.74
0.76
0.78
0
2
4
6
8
10
12
14
16
18
2002 2003
Level(left scale)
Volatility*(right scale)
US$
Chart 47 Income Trusts
Source: Thomson Financial Datastream and Bank ofCanada
$ billions
50
60
70
80
90
100
110
120
130
0.0
0.5
1.0
1.5
2.0
2.5
3.0
3.5
4.0
1998 1999 2000 2001 2002 2003
TSX income-trust index(left scale)
Net new issues(right scale)
25
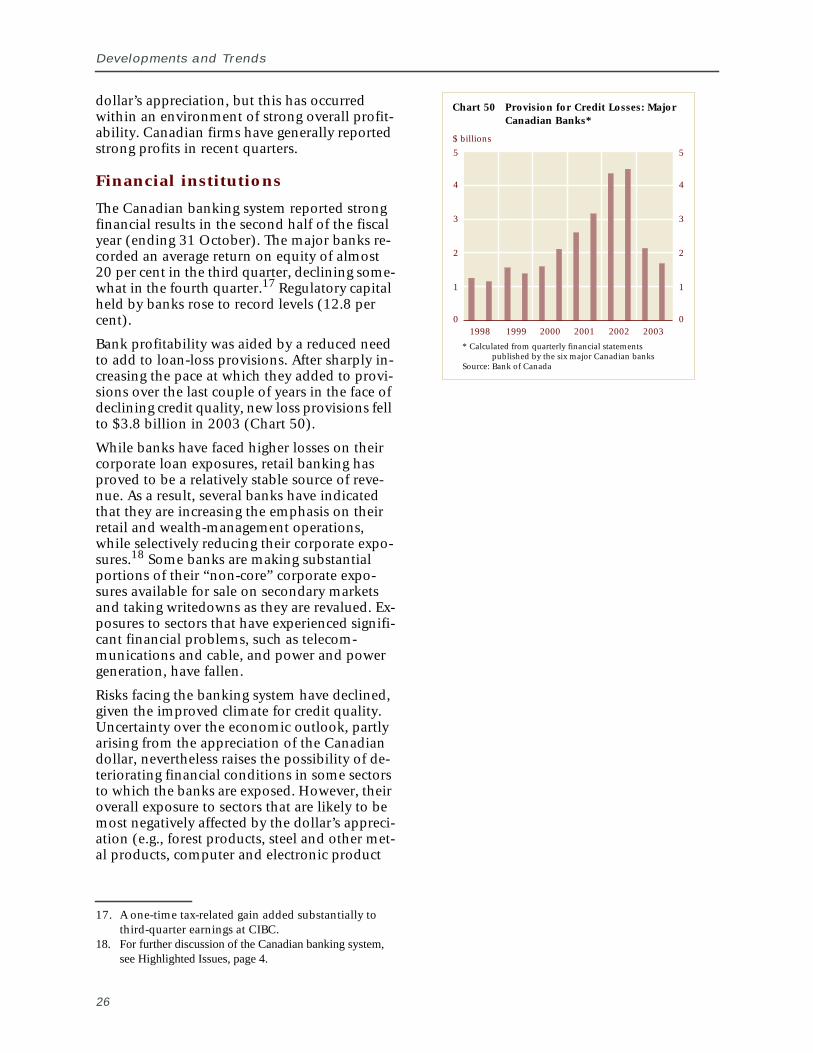
Developments and Trends
dollar’s appreciation, but this has occurredwithin an environment of strong overall profit-ability. Canadian firms have generally reportedstrong profits in recent quarters.
Financial institutions
The Canadian banking system reported strongfinancial results in the second half of the fiscalyear (ending 31 October). The major banks re-corded an average return on equity of almost20 per cent in the third quarter, declining some-what in the fourth quarter.17 Regulatory capitalheld by banks rose to record levels (12.8 percent).
Bank profitability was aided by a reduced needto add to loan-loss provisions. After sharply in-creasing the pace at which they added to provi-sions over the last couple of years in the face ofdeclining credit quality, new loss provisions fellto $3.8 billion in 2003 (Chart 50).
While banks have faced higher losses on theircorporate loan exposures, retail banking hasproved to be a relatively stable source of reve-nue. As a result, several banks have indicatedthat they are increasing the emphasis on theirretail and wealth-management operations,while selectively reducing their corporate expo-sures.18 Some banks are making substantialportions of their “non-core” corporate expo-sures available for sale on secondary marketsand taking writedowns as they are revalued. Ex-posures to sectors that have experienced signifi-cant financial problems, such as telecom-munications and cable, and power and powergeneration, have fallen.
Risks facing the banking system have declined,given the improved climate for credit quality.Uncertainty over the economic outlook, partlyarising from the appreciation of the Canadiandollar, nevertheless raises the possibility of de-teriorating financial conditions in some sectorsto which the banks are exposed. However, theiroverall exposure to sectors that are likely to bemost negatively affected by the dollar’s appreci-ation (e.g., forest products, steel and other met-al products, computer and electronic product
17. A one-time tax-related gain added substantially tothird-quarter earnings at CIBC.
18. For further discussion of the Canadian banking systemsee Highlighted Issues, page 4.
26
,
Chart 50 Provision for Credit Losses: MajorCanadian Banks*
* Calculated from quarterly financial statementspublished by the six major Canadian banks
Source: Bank of Canada
$ billions
0
1
2
3
4
5
0
1
2
3
4
5
1998 1999 2000 2001 2002 2003
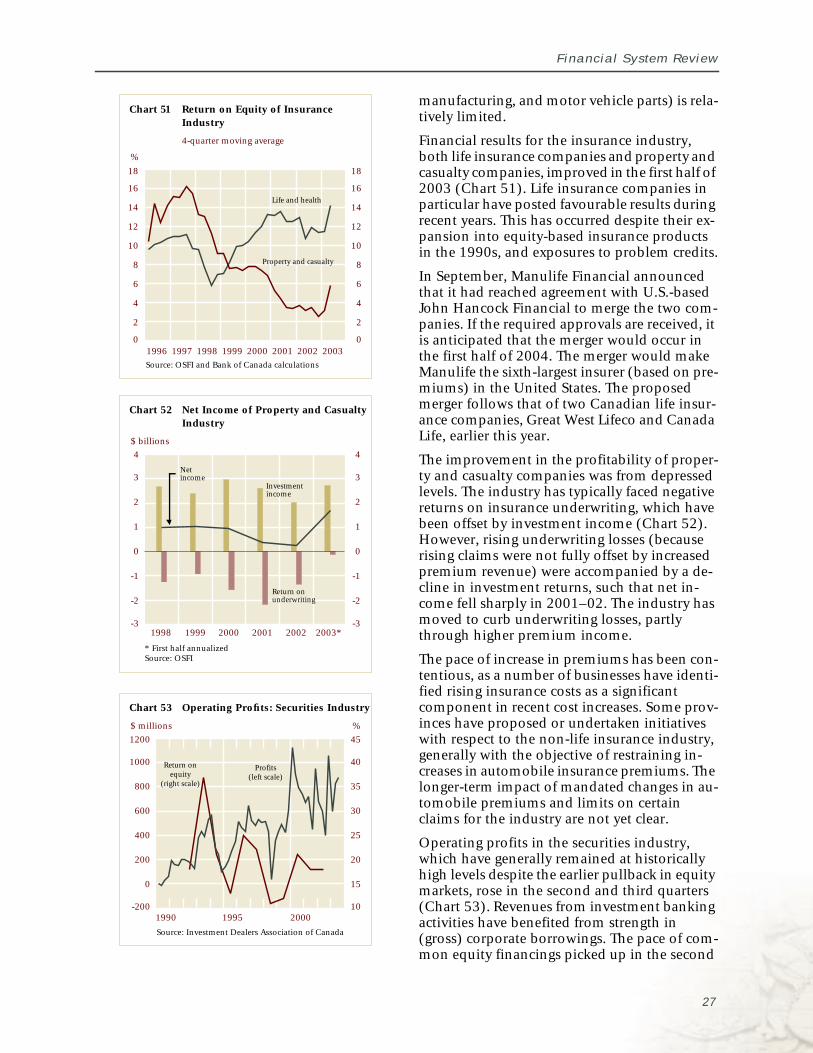
Financial System Review
Chart 52 Net Income of Property and CasualtyIndustry
Chart 51 Return on Equity of InsuranceIndustry
4-quarter moving average
Source: OSFI and Bank of Canada calculations
%
* First half annualizedSource: OSFI
$ billions
0
2
4
6
8
10
12
14
16
18
0
2
4
6
8
10
12
14
16
18
1996 1997 1998 1999 2000 2001 2002 2003
-3
-2
-1
0
1
2
3
4
-3
-2
-1
0
1
2
3
4
1998 1999 2000 2001 2002 2003*
Life and health
Property and casualty
Investmentincome
Netincome
Return onunderwriting
Chart 53 Operating Profits: Securities Industry
Source: Investment Dealers Association of Canada
$ millions %
-200
0
200
400
600
800
1000
1200
1990 1995 2000
Profits(left scale)
Return onequity
(right scale)
10
15
20
25
30
35
40
45
manufacturing, and motor vehicle parts) is rela-tively limited.
Financial results for the insurance industry,both life insurance companies and property andcasualty companies, improved in the first half of2003 (Chart 51). Life insurance companies inparticular have posted favourable results duringrecent years. This has occurred despite their ex-pansion into equity-based insurance productsin the 1990s, and exposures to problem credits.
In September, Manulife Financial announcedthat it had reached agreement with U.S.-basedJohn Hancock Financial to merge the two com-panies. If the required approvals are received, itis anticipated that the merger would occur inthe first half of 2004. The merger would makeManulife the sixth-largest insurer (based on pre-miums) in the United States. The proposedmerger follows that of two Canadian life insur-ance companies, Great West Lifeco and CanadaLife, earlier this year.
The improvement in the profitability of proper-ty and casualty companies was from depressedlevels. The industry has typically faced negativereturns on insurance underwriting, which havebeen offset by investment income (Chart 52).However, rising underwriting losses (becauserising claims were not fully offset by increasedpremium revenue) were accompanied by a de-cline in investment returns, such that net in-come fell sharply in 2001–02. The industry hasmoved to curb underwriting losses, partlythrough higher premium income.
The pace of increase in premiums has been con-tentious, as a number of businesses have identi-fied rising insurance costs as a significantcomponent in recent cost increases. Some prov-inces have proposed or undertaken initiativeswith respect to the non-life insurance industry,generally with the objective of restraining in-creases in automobile insurance premiums. Thelonger-term impact of mandated changes in au-tomobile premiums and limits on certainclaims for the industry are not yet clear.
Operating profits in the securities industry,which have generally remained at historicallyhigh levels despite the earlier pullback in equitymarkets, rose in the second and third quarters(Chart 53). Revenues from investment bankingactivities have benefited from strength in(gross) corporate borrowings. The pace of com-mon equity financings picked up in the second
27
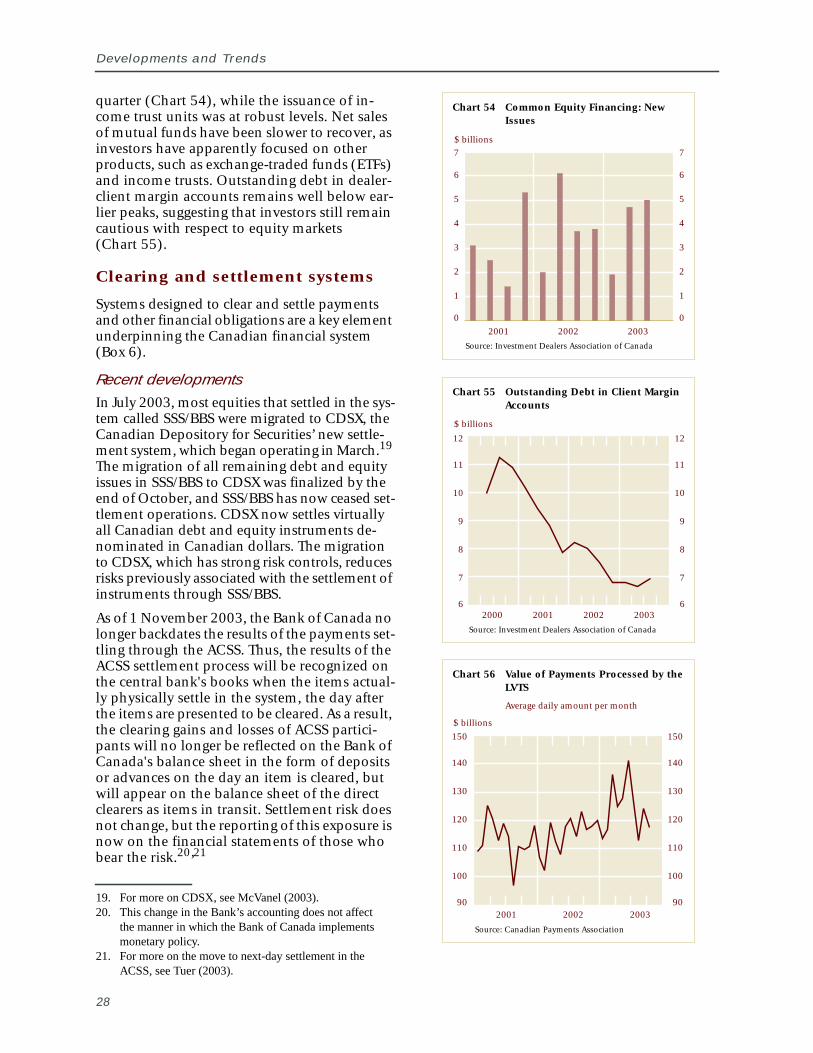
Developments and Trends
Chart 54 Common Equity Financing: NewIssues
Source: Investment Dealers Association of Canada
$ billions
0
1
2
3
4
5
6
7
0
1
2
3
4
5
6
7
2001 2002 2003
Chart 55 Outstanding Debt in Client MarginAccounts
Source: Investment Dealers Association of Canada
$ billions
6
7
8
9
10
11
12
6
7
8
9
10
11
12
2000 2001 2002 2003
Chart 56 Value of Payments Processed by theLVTS
Average daily amount per month
Source: Canadian Payments Association
$ billions
2001 2002 200390
100
110
120
130
140
150
90
100
110
120
130
140
150
quarter (Chart 54), while the issuance of in-come trust units was at robust levels. Net salesof mutual funds have been slower to recover, asinvestors have apparently focused on otherproducts, such as exchange-traded funds (ETFs)and income trusts. Outstanding debt in dealer-client margin accounts remains well below ear-lier peaks, suggesting that investors still remaincautious with respect to equity markets(Chart 55).
Clearing and settlement systems
Systems designed to clear and settle paymentsand other financial obligations are a key elementunderpinning the Canadian financial system(Box 6).
Recent developmentsIn July 2003, most equities that settled in the sys-tem called SSS/BBS were migrated to CDSX, theCanadian Depository for Securities’ new settle-ment system, which began operating in March.19
The migration of all remaining debt and equityissues in SSS/BBS to CDSX was finalized by theend of October, and SSS/BBS has now ceased set-tlement operations. CDSX now settles virtuallyall Canadian debt and equity instruments de-nominated in Canadian dollars. The migrationto CDSX, which has strong risk controls, reducesrisks previously associated with the settlement ofinstruments through SSS/BBS.
As of 1 November 2003, the Bank of Canada nolonger backdates the results of the payments set-tling through the ACSS. Thus, the results of theACSS settlement process will be recognized onthe central bank's books when the items actual-ly physically settle in the system, the day afterthe items are presented to be cleared. As a result,the clearing gains and losses of ACSS partici-pants will no longer be reflected on the Bank ofCanada's balance sheet in the form of depositsor advances on the day an item is cleared, butwill appear on the balance sheet of the directclearers as items in transit. Settlement risk doesnot change, but the reporting of this exposure isnow on the financial statements of those whobear the risk.20
’21
19. For more on CDSX, see McVanel (2003).20. This change in the Bank’s accounting does not affect
the manner in which the Bank of Canada implementsmonetary policy.
21. For more on the move to next-day settlement in theACSS, see Tuer (2003).
28
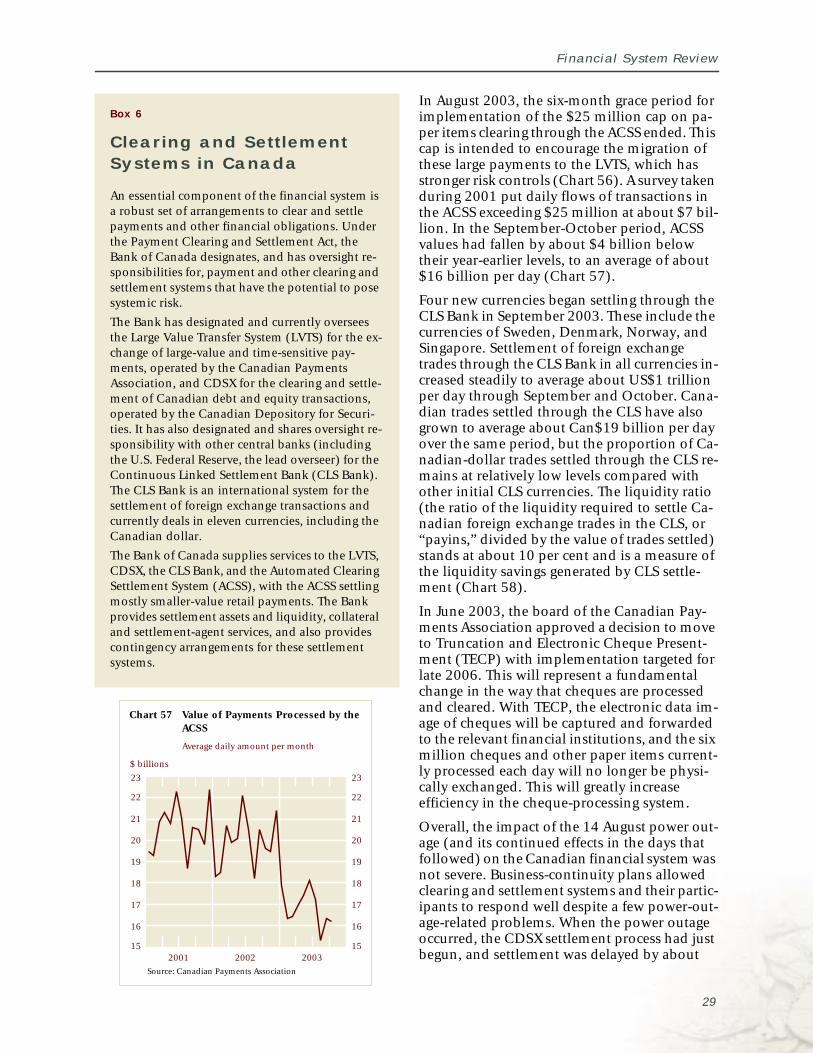
Financial System Review
An essential component of the financial system isa robust set of arrangements to clear and settlepayments and other financial obligations. Underthe Payment Clearing and Settlement Act, theBank of Canada designates, and has oversight re-sponsibilities for, payment and other clearing andsettlement systems that have the potential to posesystemic risk.
The Bank has designated and currently overseesthe Large Value Transfer System (LVTS) for the ex-change of large-value and time-sensitive pay-ments, operated by the Canadian PaymentsAssociation, and CDSX for the clearing and settle-ment of Canadian debt and equity transactions,operated by the Canadian Depository for Securi-ties. It has also designated and shares oversight re-sponsibility with other central banks (includingthe U.S. Federal Reserve, the lead overseer) for theContinuous Linked Settlement Bank (CLS Bank).The CLS Bank is an international system for thesettlement of foreign exchange transactions andcurrently deals in eleven currencies, including theCanadian dollar.
The Bank of Canada supplies services to the LVTS,CDSX, the CLS Bank, and the Automated ClearingSettlement System (ACSS), with the ACSS settlingmostly smaller-value retail payments. The Bankprovides settlement assets and liquidity, collateraland settlement-agent services, and also providescontingency arrangements for these settlementsystems.
Box 6
Clearing and SettlementSystems in Canada
Chart 57 Value of Payments Processed by theACSS
Average daily amount per month
Source: Canadian Payments Association
$ billions
15
16
17
18
19
20
21
22
23
15
16
17
18
19
20
21
22
23
2001 2002 2003
In August 2003, the six-month grace period forimplementation of the $25 million cap on pa-per items clearing through the ACSS ended. Thiscap is intended to encourage the migration ofthese large payments to the LVTS, which hasstronger risk controls (Chart 56). A survey takenduring 2001 put daily flows of transactions inthe ACSS exceeding $25 million at about $7 bil-lion. In the September-October period, ACSSvalues had fallen by about $4 billion belowtheir year-earlier levels, to an average of about$16 billion per day (Chart 57).
Four new currencies began settling through theCLS Bank in September 2003. These include thecurrencies of Sweden, Denmark, Norway, andSingapore. Settlement of foreign exchangetrades through the CLS Bank in all currencies in-creased steadily to average about US$1 trillionper day through September and October. Cana-dian trades settled through the CLS have alsogrown to average about Can$19 billion per dayover the same period, but the proportion of Ca-nadian-dollar trades settled through the CLS re-mains at relatively low levels compared withother initial CLS currencies. The liquidity ratio(the ratio of the liquidity required to settle Ca-nadian foreign exchange trades in the CLS, or“payins,” divided by the value of trades settled)stands at about 10 per cent and is a measure ofthe liquidity savings generated by CLS settle-ment (Chart 58).
In June 2003, the board of the Canadian Pay-ments Association approved a decision to moveto Truncation and Electronic Cheque Present-ment (TECP) with implementation targeted forlate 2006. This will represent a fundamentalchange in the way that cheques are processedand cleared. With TECP, the electronic data im-age of cheques will be captured and forwardedto the relevant financial institutions, and the sixmillion cheques and other paper items current-ly processed each day will no longer be physi-cally exchanged. This will greatly increaseefficiency in the cheque-processing system.
Overall, the impact of the 14 August power out-age (and its continued effects in the days thatfollowed) on the Canadian financial system wasnot severe. Business-continuity plans allowedclearing and settlement systems and their partic-ipants to respond well despite a few power-out-age-related problems. When the power outageoccurred, the CDSX settlement process had justbegun, and settlement was delayed by about
29
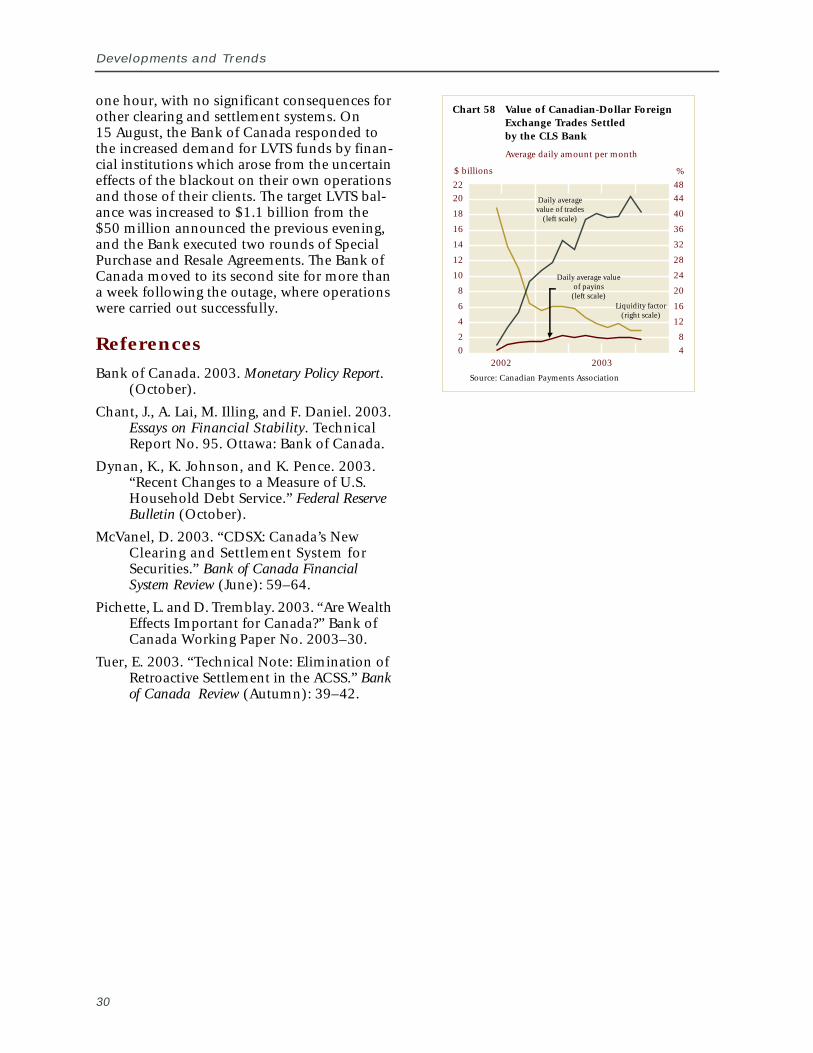
Developments and Trends
Chart 58 Value of Canadian-Dollar ForeignExchange Trades Settledby the CLS Bank
Average daily amount per month
Source: Canadian Payments Association
$ billions %
0
2
4
6
8
10
12
14
16
18
20
22
4
8
12
16
20
24
28
32
36
40
44
48
2002 2003
Liquidity factor(right scale)
Daily average valueof payins
(left scale)
Daily averagevalue of trades
(left scale)
one hour, with no significant consequences forother clearing and settlement systems. On15 August, the Bank of Canada responded tothe increased demand for LVTS funds by finan-cial institutions which arose from the uncertaineffects of the blackout on their own operationsand those of their clients. The target LVTS bal-ance was increased to $1.1 billion from the$50 million announced the previous evening,and the Bank executed two rounds of SpecialPurchase and Resale Agreements. The Bank ofCanada moved to its second site for more thana week following the outage, where operationswere carried out successfully.
References
Bank of Canada. 2003. Monetary Policy Report.(October).
Chant, J., A. Lai, M. Illing, and F. Daniel. 2003.Essays on Financial Stability. TechnicalReport No. 95. Ottawa: Bank of Canada.
Dynan, K., K. Johnson, and K. Pence. 2003.“Recent Changes to a Measure of U.S.Household Debt Service.” Federal ReserveBulletin (October).
McVanel, D. 2003. “CDSX: Canada’s NewClearing and Settlement System forSecurities.” Bank of Canada FinancialSystem Review (June): 59–64.
Pichette, L. and D. Tremblay. 2003. “Are WealthEffects Important for Canada?” Bank ofCanada Working Paper No. 2003–30.
Tuer, E. 2003. “Technical Note: Elimination ofRetroactive Settlement in the ACSS.” Bankof Canada Review (Autumn): 39–42.
30

Reports


Financial System Review
Introduction
eports address specific issues of relevance tothe financial system (whether institutions,markets, or clearing and settlement systems)in greater depth.
Both of the reports in this issue examine the ro-bustness of the Canadian financial system. Onefocuses on Canadian fixed-income markets, andthe other looks at the Canadian financial systemmore generally.
The Canadian corporate debt market has grownrapidly over the past decade and, by any stan-dard, can be considered well developed. Never-theless, a significant proportion of the debtissuance by Canadian non-financial corpora-tions takes place in foreign capital markets, es-pecially in the United States. This proportionhas remained relatively constant over the pastdecade. The report, Development of the CanadianCorporate Debt Market: Some Stylized Facts and Is-sues, explores the characteristics of U.S.-dollarborrowing by Canadian corporations and thesalient features of Canadian and U.S. capitalmarkets.
In addition to financial markets, the financialsystem consists of institutions and clearing andsettlement systems. Given the growing size andcomplexity of the financial system, sources ofstress can emerge from several avenues. The sec-ond report, Measuring Financial Stress, discussesone particular new approach for examining thedegree of stress under which the Canadian fi-nancial system is operating. This new measurecomplements the many tools used at the Bankof Canada to understand financial conditions.
R
33

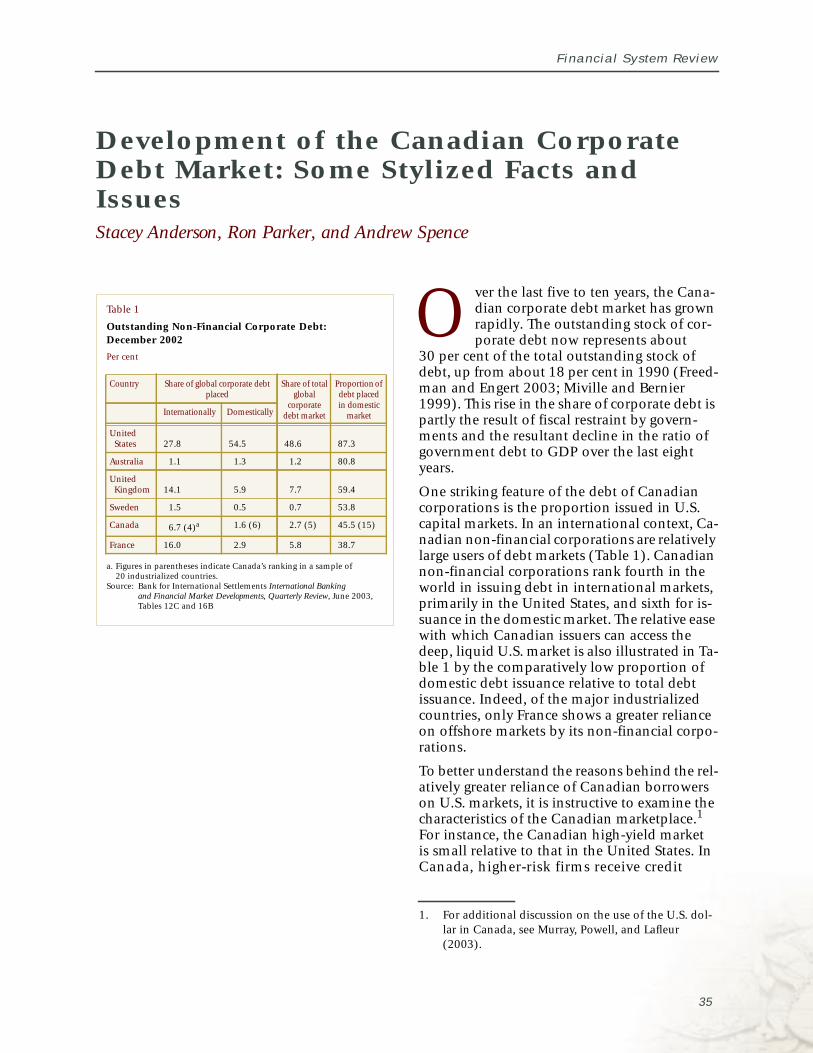
Financial System Review
Development of the Canadian CorporateDebt Market: Some Stylized Facts andIssuesStacey Anderson, Ron Parker, and Andrew Spence
Table 1
Outstanding Non-Financial Corporate Debt:December 2002
Per cent
a. Figures in parentheses indicate Canada’s ranking in a sample of20 industrialized countries.
Source: Bank for International Settlements International Bankingand Financial Market Developments, Quarterly Review, June 2003,Tables 12C and 16B
Country Share of global corporate debtplaced
Share of totalglobal
corporatedebt market
Proportionofdebt placedin domestic
marketInternationally Domestically
UnitedStates 27.8 54.5 48.6 87.3
Australia 1.1 1.3 1.2 80.8
UnitedKingdom 14.1 5.9 7.7 59.4
Sweden 1.5 0.5 0.7 53.8
Canada 6.7 (4)a 1.6 (6) 2.7 (5) 45.5 (15)
France 16.0 2.9 5.8 38.7
ver the last five to ten years, the Cana-dian corporate debt market has grownrapidly. The outstanding stock of cor-porate debt now represents about
30 per cent of the total outstanding stock ofdebt, up from about 18 per cent in 1990 (Freed-man and Engert 2003; Miville and Bernier1999). This rise in the share of corporate debt ispartly the result of fiscal restraint by govern-ments and the resultant decline in the ratio ofgovernment debt to GDP over the last eightyears.
One striking feature of the debt of Canadiancorporations is the proportion issued in U.S.capital markets. In an international context, Ca-nadian non-financial corporations are relativelylarge users of debt markets (Table 1). Canadiannon-financial corporations rank fourth in theworld in issuing debt in international markets,primarily in the United States, and sixth for is-suance in the domestic market. The relative easewith which Canadian issuers can access thedeep, liquid U.S. market is also illustrated in Ta-ble 1 by the comparatively low proportion ofdomestic debt issuance relative to total debtissuance. Indeed, of the major industrializedcountries, only France shows a greater relianceon offshore markets by its non-financial corpo-rations.
To better understand the reasons behind the rel-atively greater reliance of Canadian borrowerson U.S. markets, it is instructive to examine thecharacteristics of the Canadian marketplace.1
For instance, the Canadian high-yield marketis small relative to that in the United States. InCanada, higher-risk firms receive credit
1. For additional discussion on the use of the U.S. dol-lar in Canada, see Murray, Powell, and Lafleur(2003).
O
35
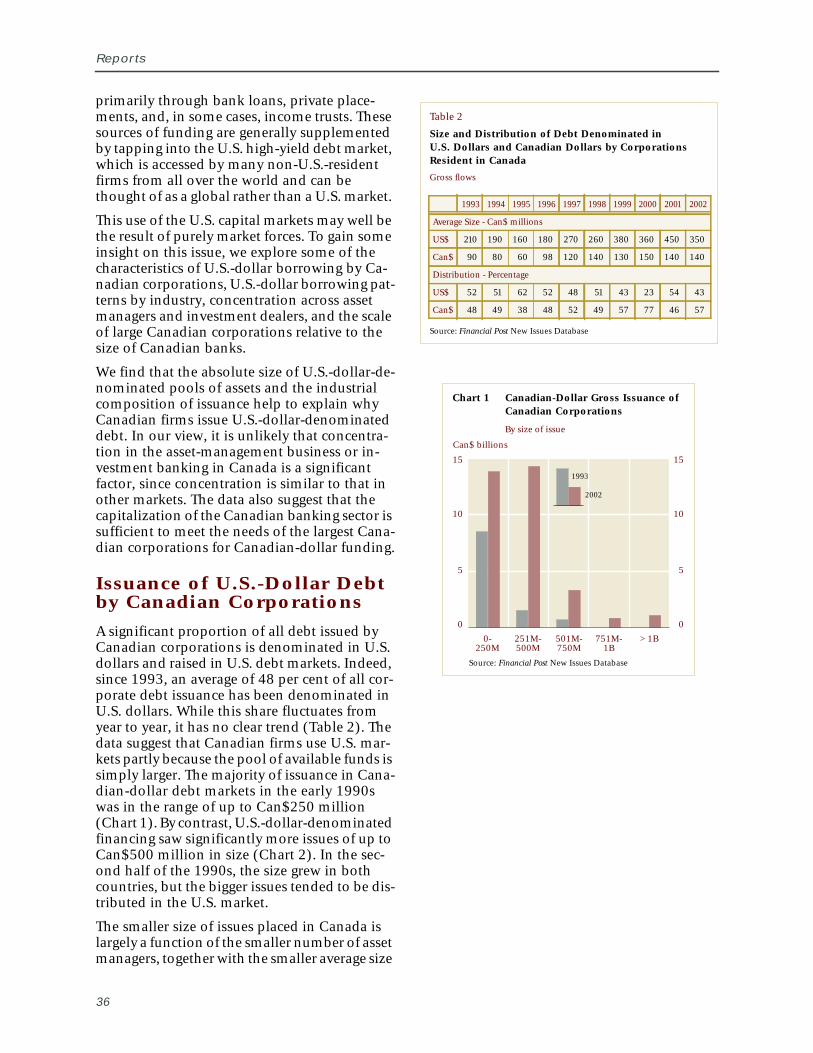
Reports
Table 2
Size and Distribution of Debt Denominated inU.S. Dollars and Canadian Dollars by CorporationsResident in Canada
Gross flows
Source: Financial Post New Issues Database
1993 1994 1995 1996 1997 1998 1999 2000 2001 2002
Average Size - Can$ millions
US$ 210 190 160 180 270 260 380 360 450 350
Can$ 90 80 60 98 120 140 130 150 140 140
Distribution - Percentage
US$ 52 51 62 52 48 51 43 23 54 43
Can$ 48 49 38 48 52 49 57 77 46 57
Chart 1 Canadian-Dollar Gross Issuance ofCanadian Corporations
By size of issue
Source: Financial Post New Issues Database
Can$ billions
1993
0
5
10
15
0
5
10
15
0- 251M- 501M- 751M- > 1B250M 500M 750M 1B
2002
primarily through bank loans, private place-ments, and, in some cases, income trusts. Thesesources of funding are generally supplementedby tapping into the U.S. high-yield debt market,which is accessed by many non-U.S.-residentfirms from all over the world and can bethought of as a global rather than a U.S. market.
This use of the U.S. capital markets may well bethe result of purely market forces. To gain someinsight on this issue, we explore some of thecharacteristics of U.S.-dollar borrowing by Ca-nadian corporations, U.S.-dollar borrowing pat-terns by industry, concentration across assetmanagers and investment dealers, and the scaleof large Canadian corporations relative to thesize of Canadian banks.
We find that the absolute size of U.S.-dollar-de-nominated pools of assets and the industrialcomposition of issuance help to explain whyCanadian firms issue U.S.-dollar-denominateddebt. In our view, it is unlikely that concentra-tion in the asset-management business or in-vestment banking in Canada is a significantfactor, since concentration is similar to that inother markets. The data also suggest that thecapitalization of the Canadian banking sector issufficient to meet the needs of the largest Cana-dian corporations for Canadian-dollar funding.
Issuance of U.S.-Dollar Debtby Canadian Corporations
A significant proportion of all debt issued byCanadian corporations is denominated in U.S.dollars and raised in U.S. debt markets. Indeed,since 1993, an average of 48 per cent of all cor-porate debt issuance has been denominated inU.S. dollars. While this share fluctuates fromyear to year, it has no clear trend (Table 2). Thedata suggest that Canadian firms use U.S. mar-kets partly because the pool of available funds issimply larger. The majority of issuance in Cana-dian-dollar debt markets in the early 1990swas in the range of up to Can$250 million(Chart 1). By contrast, U.S.-dollar-denominatedfinancing saw significantly more issues of up toCan$500 million in size (Chart 2). In the sec-ond half of the 1990s, the size grew in bothcountries, but the bigger issues tended to be dis-tributed in the U.S. market.
The smaller size of issues placed in Canada islargely a function of the smaller number of assetmanagers, together with the smaller average size
36
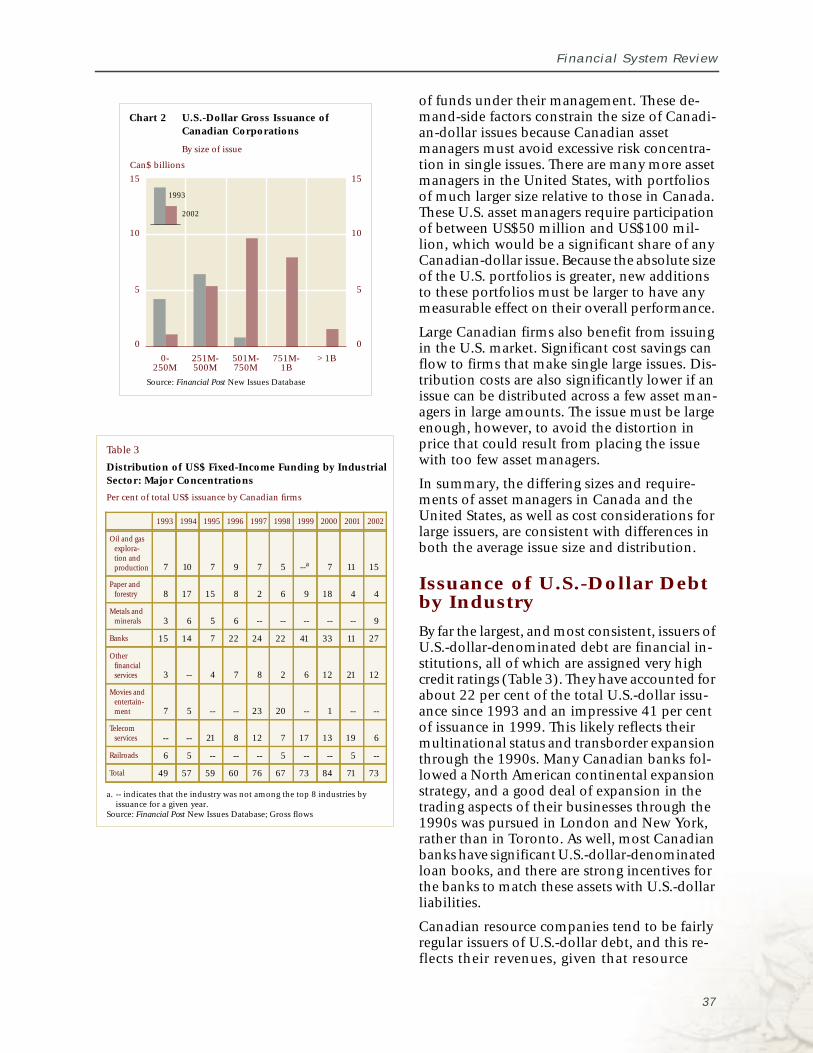
Financial System Review
Chart 2 U.S.-Dollar Gross Issuance ofCanadian Corporations
By size of issue
Source: Financial Post New Issues Database
Can$ billions
0
5
10
15
0
5
10
15
0- 251M- 501M- 751M- > 1B250M 500M 750M 1B
1993
2002
Table 3
Distribution of US$ Fixed-Income Funding by IndustrialSector: Major Concentrations
Per cent of total US$ issuance by Canadian firms
a. -- indicates that the industry was not among the top 8 industries byissuance for a given year.
Source: Financial Post New Issues Database; Gross flows
1993 1994 1995 1996 1997 1998 1999 2000 2001 2002
Oil and gasexplora-tion andproduction 7 10 7 9 7 5 --a 7 11 15
Paper andforestry 8 17 15 8 2 6 9 18 4 4
Metals andminerals 3 6 5 6 -- -- -- -- -- 9
Banks 15 14 7 22 24 22 41 33 11 27
Otherfinancialservices 3 -- 4 7 8 2 6 12 21 12
Movies andentertain-ment 7 5 -- -- 23 20 -- 1 -- --
Telecomservices -- -- 21 8 12 7 17 13 19 6
Railroads 6 5 -- -- -- 5 -- -- 5 --
Total 49 57 59 60 76 67 73 84 71 73
of funds under their management. These de-mand-side factors constrain the size of Canadi-an-dollar issues because Canadian assetmanagers must avoid excessive risk concentra-tion in single issues. There are many more assetmanagers in the United States, with portfoliosof much larger size relative to those in Canada.These U.S. asset managers require participationof between US$50 million and US$100 mil-lion, which would be a significant share of anyCanadian-dollar issue. Because the absolute sizeof the U.S. portfolios is greater, new additionsto these portfolios must be larger to have anymeasurable effect on their overall performance.
Large Canadian firms also benefit from issuingin the U.S. market. Significant cost savings canflow to firms that make single large issues. Dis-tribution costs are also significantly lower if anissue can be distributed across a few asset man-agers in large amounts. The issue must be largeenough, however, to avoid the distortion inprice that could result from placing the issuewith too few asset managers.
In summary, the differing sizes and require-ments of asset managers in Canada and theUnited States, as well as cost considerations forlarge issuers, are consistent with differences inboth the average issue size and distribution.
Issuance of U.S.-Dollar Debtby Industry
By far the largest, and most consistent, issuers ofU.S.-dollar-denominated debt are financial in-stitutions, all of which are assigned very highcredit ratings (Table 3). They have accounted forabout 22 per cent of the total U.S.-dollar issu-ance since 1993 and an impressive 41 per centof issuance in 1999. This likely reflects theirmultinational status and transborder expansionthrough the 1990s. Many Canadian banks fol-lowed a North American continental expansionstrategy, and a good deal of expansion in thetrading aspects of their businesses through the1990s was pursued in London and New York,rather than in Toronto. As well, most Canadianbanks have significant U.S.-dollar-denominatedloan books, and there are strong incentives forthe banks to match these assets with U.S.-dollarliabilities.
Canadian resource companies tend to be fairlyregular issuers of U.S.-dollar debt, and this re-flects their revenues, given that resource
37
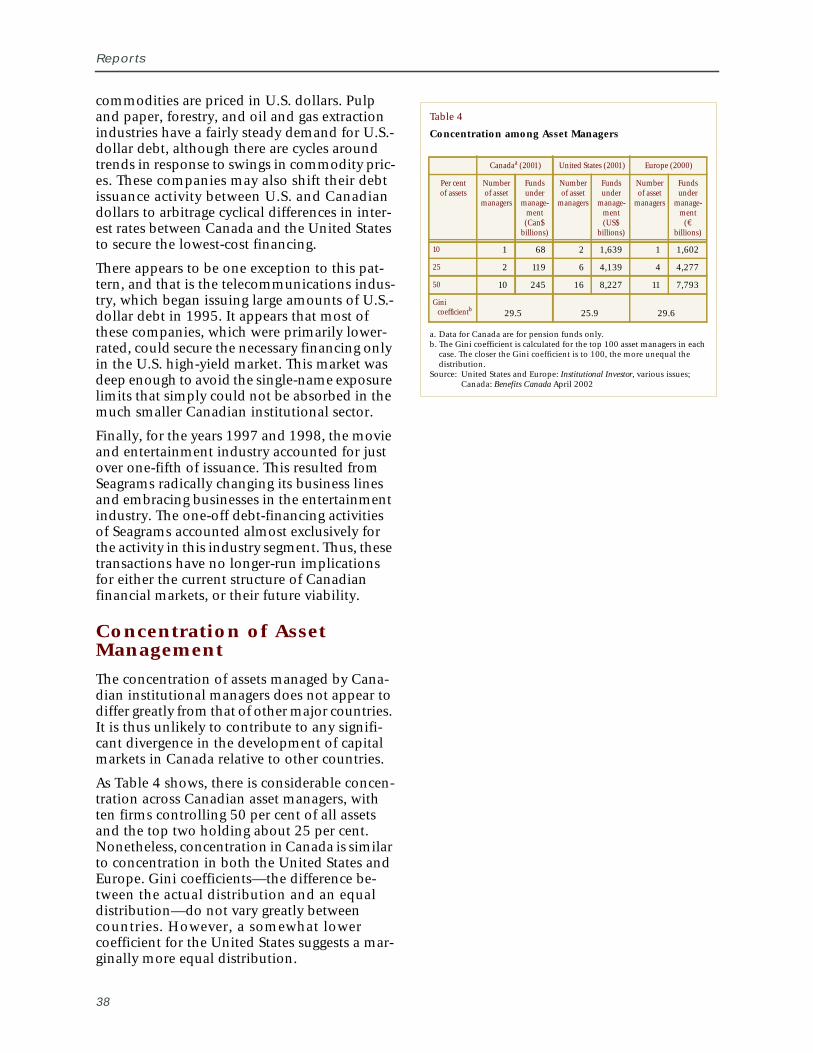
Reports
Table 4
Concentration among Asset Managers
a. Data for Canada are for pension funds only.b. The Gini coefficient is calculated for the top 100 asset managers in each
case. The closer the Gini coefficient is to 100, the more unequal thedistribution.
Source: United States and Europe: Institutional Investor, various issues;Canada: Benefits Canada April 2002
Canadaa (2001) United States (2001) Europe (2000)
Per centof assets
Numberof asset
managers
Fundsunder
manage-ment(Can$
billions)
Numberof asset
managers
Fundsunder
manage-ment(US$
billions)
Numberof asset
managers
Fundsunder
manage-ment
(€billions)
10 1 68 2 1,639 1 1,602
25 2 119 6 4,139 4 4,277
50 10 245 16 8,227 11 7,793
Ginicoefficientb 29.5 25.9 29.6
commodities are priced in U.S. dollars. Pulpand paper, forestry, and oil and gas extractionindustries have a fairly steady demand for U.S.-dollar debt, although there are cycles aroundtrends in response to swings in commodity pric-es. These companies may also shift their debtissuance activity between U.S. and Canadiandollars to arbitrage cyclical differences in inter-est rates between Canada and the United Statesto secure the lowest-cost financing.
There appears to be one exception to this pat-tern, and that is the telecommunications indus-try, which began issuing large amounts of U.S.-dollar debt in 1995. It appears that most ofthese companies, which were primarily lower-rated, could secure the necessary financing onlyin the U.S. high-yield market. This market wasdeep enough to avoid the single-name exposurelimits that simply could not be absorbed in themuch smaller Canadian institutional sector.
Finally, for the years 1997 and 1998, the movieand entertainment industry accounted for justover one-fifth of issuance. This resulted fromSeagrams radically changing its business linesand embracing businesses in the entertainmentindustry. The one-off debt-financing activitiesof Seagrams accounted almost exclusively forthe activity in this industry segment. Thus, thesetransactions have no longer-run implicationsfor either the current structure of Canadianfinancial markets, or their future viability.
Concentration of AssetManagement
The concentration of assets managed by Cana-dian institutional managers does not appear todiffer greatly from that of other major countries.It is thus unlikely to contribute to any signifi-cant divergence in the development of capitalmarkets in Canada relative to other countries.
As Table 4 shows, there is considerable concen-tration across Canadian asset managers, withten firms controlling 50 per cent of all assetsand the top two holding about 25 per cent.Nonetheless, concentration in Canada is similarto concentration in both the United States andEurope. Gini coefficients—the difference be-tween the actual distribution and an equaldistribution—do not vary greatly betweencountries. However, a somewhat lowercoefficient for the United States suggests a mar-ginally more equal distribution.
38

Financial System Review
Chart 3 Market Shares of the Top 10 Dealers
(First lead; Canadian-dollar deals) - 1993
Source: Financial Post New Issues Database
%
0
5
10
15
20
25
30
0
5
10
15
20
25
30
Scotia
CIBCRBC
BMO
GordonCapital
MerrillLynch
Hambros
Bank
TD SwissBank
LBG
Chart 4 Market Shares of the Top 10 Dealers
(First lead; Canadian-dollar deals) - 2002
%
Source: Financial Post New Issues Database
0
5
10
15
20
25
30
0
5
10
15
20
25
30
RBCTD Scotia
BMO
MerrillLynch
CIBCNationalBank
CSFBHSBC
Laurentian
Bank
It is hard to argue that concentration of assetmanagement has impeded the level of develop-ment of Canadian fixed-income markets, sinceconcentration is similar across countries. How-ever, the assets managed by the top manager inCanada are small, at Can$68 billion, comparedwith those in the United States, at US$854 bil-lion, and Europe, at €1,602 billion. This mayhave, through limits on single-name exposures,a strong effect on the size of corporate issuesthat can successfully come to the Canadian-dol-lar market at any one time.
Concentration amongDealers
Canadian-resident securities dealers are over-whelmingly dominant in the provision of Cana-dian-dollar fixed-income services in Canada.Through the 1990s and into the early years ofthe current decade, Canadian dealers had an av-erage market share of 90 per cent of lead deals,ranging from a low of 82 per cent in 1994 to ahigh of 97 per cent in 2001. Charts 3 and 4show market shares for the beginning and endof the period under review. The top dealer tendsto win about 25 per cent of all leads, and thesame major dealer usually dominates the topspot. Foreign penetration has remained mini-mal, but Merrill Lynch has emerged as the dom-inant foreign-based dealer.2
The market share of domestic dealers in localcurrency deals in the United Kingdom and Aus-tralia is considerably smaller, with the UnitedKingdom at roughly 40 per cent and Australia at54 per cent. However, domestic concentrationsin the United States and Sweden are both rela-tively high in the range of 80 to 90 per cent.3
For countries with a limited presence of foreigndealers in their domestic fixed-income markets,fixed-income market share is likely a function ofcredit granted by the banks/dealers and thedepth of product lines offered to local-currency-
2. Merrill Lynch first came to Canada in the early 1950s.3. U.S. data include the fixed-income activities of
Deutsche Bank and CSFB. Even though both areEuropean-based banks, both acquired significantformer U.S. investment banks that had well-estab-lished domestic businesses. Excluding these two insti-tutions reduces the domestic market share to 60 to70 per cent. U.K. data are based on an informal sur-vey of U.K. authorities and investment dealers. Theyare subject to a wide margin of error.
39
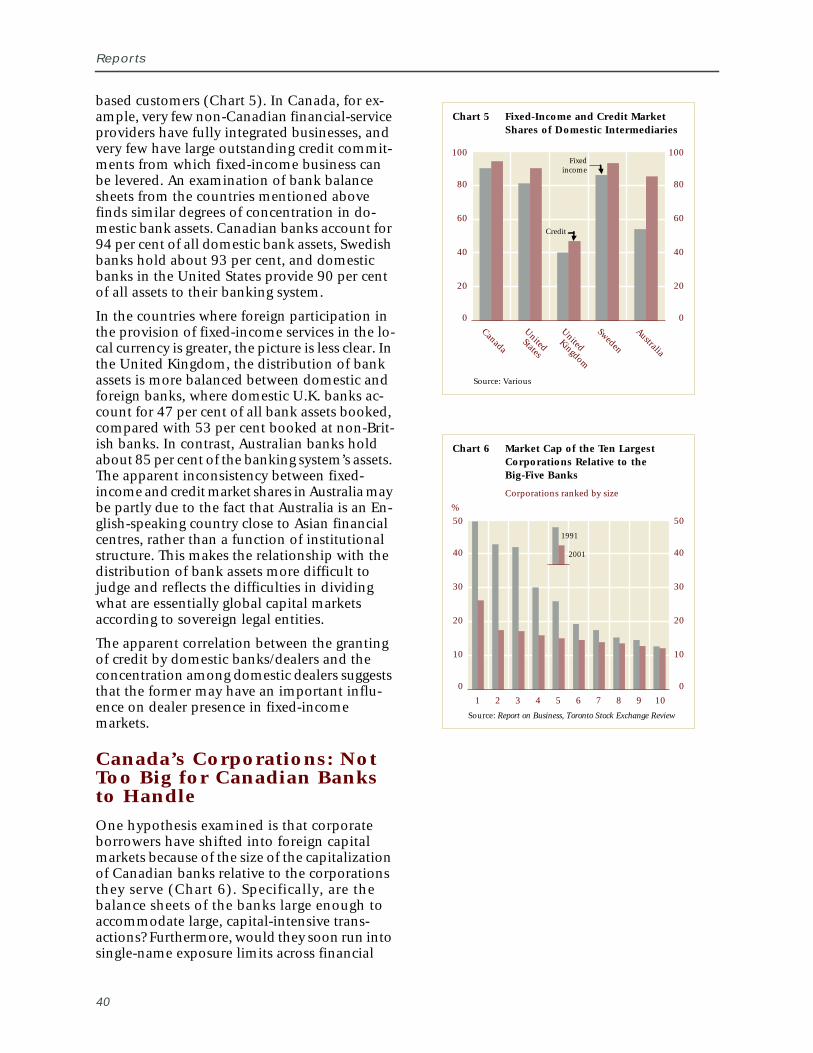
Reports
Chart 5 Fixed-Income and Credit MarketShares of Domestic Intermediaries
Source: Various
0
20
40
60
80
100
0
20
40
60
80
100
Canada
United
United
Sweden
Australia
Fixedincome
Credit
StatesKingdom
Chart 6 Market Cap of the Ten LargestCorporations Relative to theBig-Five Banks
Corporations ranked by size
Source: Report on Business, Toronto Stock Exchange Review
%
0
10
20
30
40
50
1 2 3 4 5 6 7 8 9 10
0
10
20
30
40
50
1991
2001
based customers (Chart 5). In Canada, for ex-ample, very few non-Canadian financial-serviceproviders have fully integrated businesses, andvery few have large outstanding credit commit-ments from which fixed-income business canbe levered. An examination of bank balancesheets from the countries mentioned abovefinds similar degrees of concentration in do-mestic bank assets. Canadian banks account for94 per cent of all domestic bank assets, Swedishbanks hold about 93 per cent, and domesticbanks in the United States provide 90 per centof all assets to their banking system.
In the countries where foreign participation inthe provision of fixed-income services in the lo-cal currency is greater, the picture is less clear. Inthe United Kingdom, the distribution of bankassets is more balanced between domestic andforeign banks, where domestic U.K. banks ac-count for 47 per cent of all bank assets booked,compared with 53 per cent booked at non-Brit-ish banks. In contrast, Australian banks holdabout 85 per cent of the banking system’s assets.The apparent inconsistency between fixed-income and credit market shares in Australia maybe partly due to the fact that Australia is an En-glish-speaking country close to Asian financialcentres, rather than a function of institutionalstructure. This makes the relationship with thedistribution of bank assets more difficult tojudge and reflects the difficulties in dividingwhat are essentially global capital marketsaccording to sovereign legal entities.
The apparent correlation between the grantingof credit by domestic banks/dealers and theconcentration among domestic dealers suggeststhat the former may have an important influ-ence on dealer presence in fixed-incomemarkets.
Canada’s Corporations: NotToo Big for Canadian Banksto Handle
One hypothesis examined is that corporateborrowers have shifted into foreign capitalmarkets because of the size of the capitalizationof Canadian banks relative to the corporationsthey serve (Chart 6). Specifically, are thebalance sheets of the banks large enough toaccommodate large, capital-intensive trans-actions? Furthermore, would they soon run intosingle-name exposure limits across financial
40
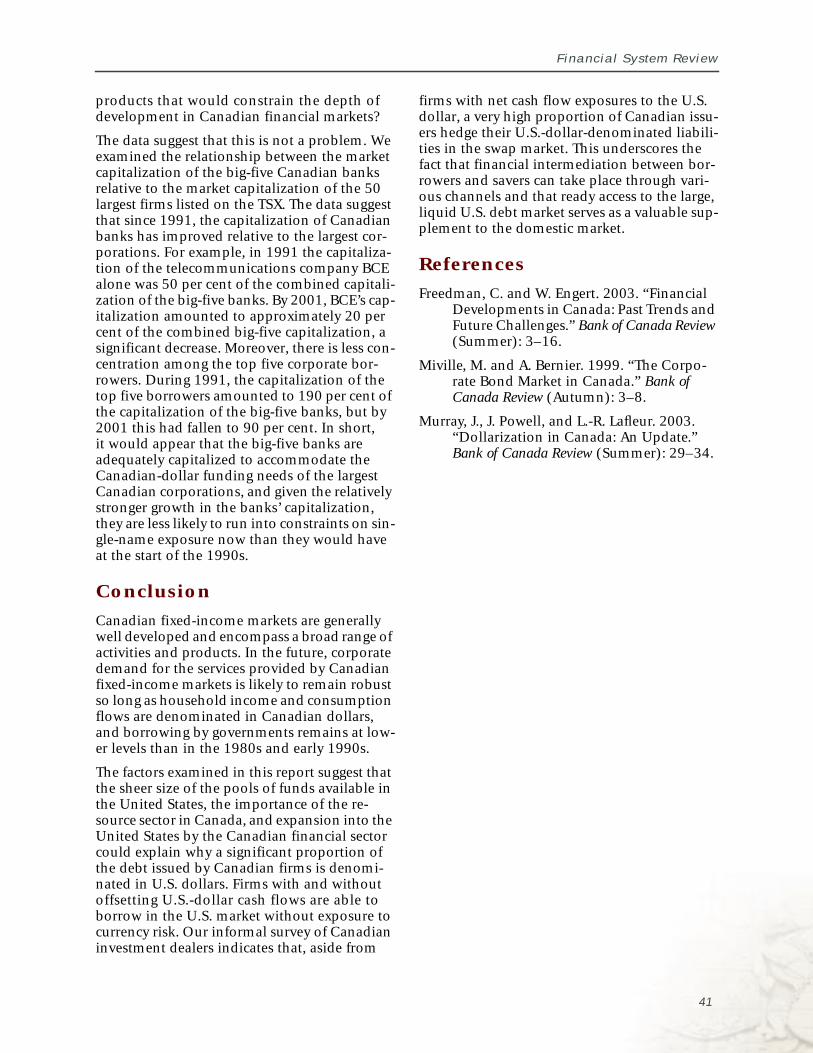
Financial System Review
products that would constrain the depth ofdevelopment in Canadian financial markets?
The data suggest that this is not a problem. Weexamined the relationship between the marketcapitalization of the big-five Canadian banksrelative to the market capitalization of the 50largest firms listed on the TSX. The data suggestthat since 1991, the capitalization of Canadianbanks has improved relative to the largest cor-porations. For example, in 1991 the capitaliza-tion of the telecommunications company BCEalone was 50 per cent of the combined capitali-zation of the big-five banks. By 2001, BCE’s cap-italization amounted to approximately 20 percent of the combined big-five capitalization, asignificant decrease. Moreover, there is less con-centration among the top five corporate bor-rowers. During 1991, the capitalization of thetop five borrowers amounted to 190 per cent ofthe capitalization of the big-five banks, but by2001 this had fallen to 90 per cent. In short,it would appear that the big-five banks areadequately capitalized to accommodate theCanadian-dollar funding needs of the largestCanadian corporations, and given the relativelystronger growth in the banks’ capitalization,they are less likely to run into constraints on sin-gle-name exposure now than they would haveat the start of the 1990s.
Conclusion
Canadian fixed-income markets are generallywell developed and encompass a broad range ofactivities and products. In the future, corporatedemand for the services provided by Canadianfixed-income markets is likely to remain robustso long as household income and consumptionflows are denominated in Canadian dollars,and borrowing by governments remains at low-er levels than in the 1980s and early 1990s.
The factors examined in this report suggest thatthe sheer size of the pools of funds available inthe United States, the importance of the re-source sector in Canada, and expansion into theUnited States by the Canadian financial sectorcould explain why a significant proportion ofthe debt issued by Canadian firms is denomi-nated in U.S. dollars. Firms with and withoutoffsetting U.S.-dollar cash flows are able toborrow in the U.S. market without exposure tocurrency risk. Our informal survey of Canadianinvestment dealers indicates that, aside from
firms with net cash flow exposures to the U.S.dollar, a very high proportion of Canadian issu-ers hedge their U.S.-dollar-denominated liabili-ties in the swap market. This underscores thefact that financial intermediation between bor-rowers and savers can take place through vari-ous channels and that ready access to the large,liquid U.S. debt market serves as a valuable sup-plement to the domestic market.
References
Freedman, C. and W. Engert. 2003. “FinancialDevelopments in Canada: Past Trends andFuture Challenges.” Bank of Canada Review(Summer): 3–16.
Miville, M. and A. Bernier. 1999. “The Corpo-rate Bond Market in Canada.” Bank ofCanada Review (Autumn): 3–8.
Murray, J., J. Powell, and L.-R. Lafleur. 2003.“Dollarization in Canada: An Update.”Bank of Canada Review (Summer): 29–34.
41


Financial System Review
Measuring Financial StressMark Illing and Ying Liu*
umerous events over the past decadehave been described as “financial cri-ses”—the Mexican crisis of 1994–95,the 1997–98 Southeast Asian crisis,
and the Russian debt default and Long-TermCapital Management crisis of 1998 are a few ofthe better known. How did these events affectthe Canadian financial system?
One way of considering this question is to applythe concept of “stress” to the financial system,drawing on analogies from the physical scienc-es. Stress is often caused by an outside (exoge-nous) force acting on a system. It leads tochanges in the functioning and integrity of thesystem that, if great enough, can damage thesystem itself. Such a change can be thought of asa “crisis.”
The size and diverse makeup of the financialsystem, which consists of financial institutions,financial markets, and clearing and settlementsystems, suggests there are many potentialsources of stress. According to this perspective,stress is always present to a degree somewherein the financial system and may pass largely un-noticed until it reaches high levels or becomeswidespread. Thus, a measure of financial stressshould be a continuum, where extreme valuesrepresent crises.
Stress rises when one or more of the followingincreases:
• expected financial loss
• risk (a higher probability of loss)
• uncertainty (reduced confidence about theprobability of loss)
N
* This report draws on a recent Bank of Canada workingpaper (Illing and Liu 2003).
Stress results from the impact of a shock on thefinancial system. The amount of stress presentin a system therefore depends on the magnitudeof these shocks, the initial conditions present inthe system, and the structure of the financialsystem. For example, a negative shock is morelikely to cause a large increase in stress when fi-nancial conditions are weak, when cash flowsare low, balance sheets are highly leveraged, orlenders are more risk-averse. Shocks may also bepropagated through weaknesses in the structureof the financial system, such as market-coordi-nation failures, overloaded computer systems,or highly asymmetric flows of information. Thesize of the shock and its interaction with weak-nesses in the financial system determine the lev-el of stress (Chart 1).
Stress can manifest itself in various ways acrossthe financial system, and disruptions in onemarket can spill over to others (this is known ascontagion). For example, adverse movements inmarket prices and interest rates can impair thevalue of financial assets, as is the case during astock market crash. This can be followed by un-usually large deposit withdrawals or interrup-tions in payment flows that strain bankingsystem liquidity.
How Is Stress Measured?
Although the literature on predicting financialcrises in emerging markets is abundant, little at-tention has been devoted to defining crises ormeasuring their severity. The standard approachin the empirical literature is to treat stress as abinary variable with either crisis or non-crisisvalues. Kaminsky and Reinhart (1996, 1999)and Frankel and Rose (1996) are commonlyfollowed examples. Crises are usually definedbased on an event study or on the extremevalues of one or two variables, such as a sharp
43
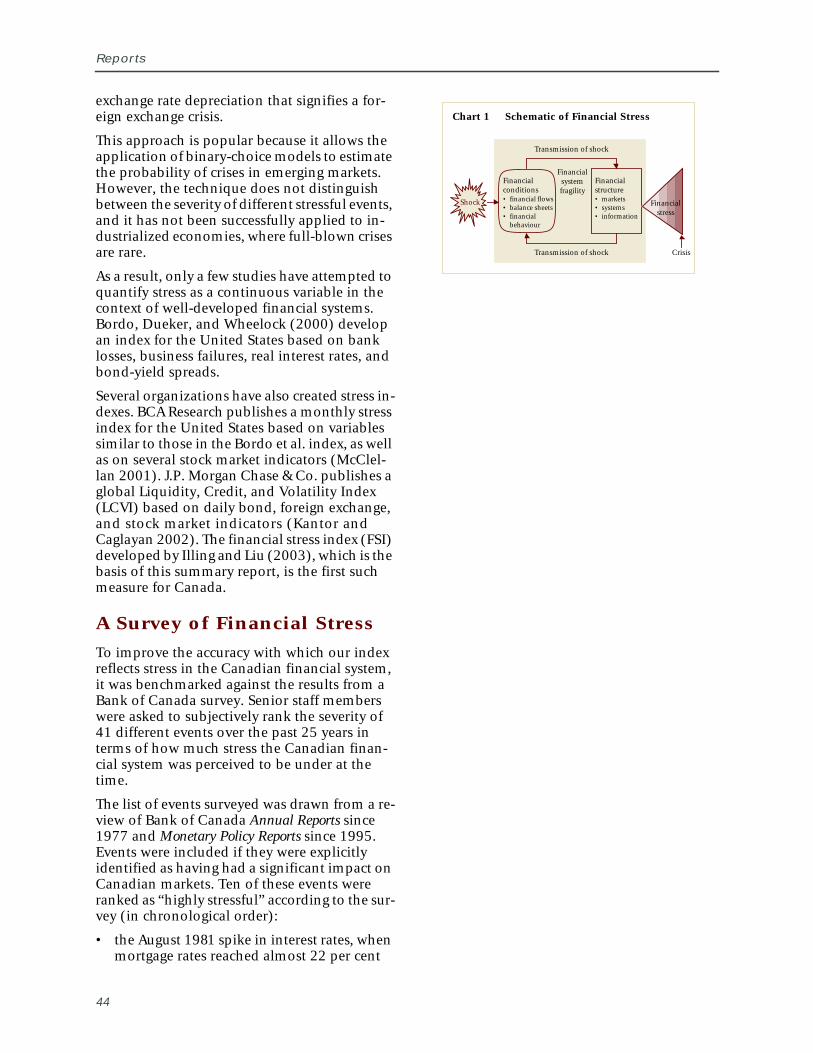
Reports
Chart 1 Schematic of Financial Stress
Transmission of shock
Financialconditions• financial flows• balance sheets• financial
behaviour
Financialsystemfragility
Financialstructure• markets• systems• information
Transmission of shock
Shock Financialstress
Crisis
exchange rate depreciation that signifies a for-eign exchange crisis.
This approach is popular because it allows theapplication of binary-choice models to estimatethe probability of crises in emerging markets.However, the technique does not distinguishbetween the severity of different stressful events,and it has not been successfully applied to in-dustrialized economies, where full-blown crisesare rare.
As a result, only a few studies have attempted toquantify stress as a continuous variable in thecontext of well-developed financial systems.Bordo, Dueker, and Wheelock (2000) developan index for the United States based on banklosses, business failures, real interest rates, andbond-yield spreads.
Several organizations have also created stress in-dexes. BCA Research publishes a monthly stressindex for the United States based on variablessimilar to those in the Bordo et al. index, as wellas on several stock market indicators (McClel-lan 2001). J.P. Morgan Chase & Co. publishes aglobal Liquidity, Credit, and Volatility Index(LCVI) based on daily bond, foreign exchange,and stock market indicators (Kantor andCaglayan 2002). The financial stress index (FSI)developed by Illing and Liu (2003), which is thebasis of this summary report, is the first suchmeasure for Canada.
A Survey of Financial Stress
To improve the accuracy with which our indexreflects stress in the Canadian financial system,it was benchmarked against the results from aBank of Canada survey. Senior staff memberswere asked to subjectively rank the severity of41 different events over the past 25 years interms of how much stress the Canadian finan-cial system was perceived to be under at thetime.
The list of events surveyed was drawn from a re-view of Bank of Canada Annual Reports since1977 and Monetary Policy Reports since 1995.Events were included if they were explicitlyidentified as having had a significant impact onCanadian markets. Ten of these events wereranked as “highly stressful” according to the sur-vey (in chronological order):
• the August 1981 spike in interest rates, whenmortgage rates reached almost 22 per cent
44

Financial System Review
• the less-developed countries (LDC) debt cri-ses of the early 1980s, to which Canadianbanks were heavily exposed
• the regional Canadian bank failures of 1985
• the October 1987 stock market crash
• the real estate price collapse, loan losses,and debt defaults of the early 1990s
• the Mexican peso crisis (1995)
• the Southeast Asian crisis (1997–98)
• the Russian/LTCM crisis (1998)
• the high-tech stock market collapse (2000)
• the events of 11 September 2001
Variable Selection
The next step involved determining which vari-ables best reflected the qualitative rankingsfrom the survey and weighting them appropri-ately.
Over 150 different measures of expected loss,risk, and uncertainty were considered. Thesewere drawn from the financial institutions sec-tor and from the foreign exchange, fixed-in-come, and equity markets. The rankings fromthe survey helped to determine which variableswere best suited for the index. Several alterna-tive weighting schemes were also tested.
The final results are quite robust to the choice ofvariables and weighting schemes. The specifica-tion of the financial stress index that most close-ly matches the survey rankings includes thefollowing measures of expected loss, risk, anduncertainty.
Variables that primarily reflect expected loss:
• the spread between the yields on bondsissued by Canadian financial institutionsand on government bonds of comparableduration
• similarly, the spread between the yields onCanadian non-financial corporate bondsand on government bonds
• because the capacity to repay debt can beaffected by short-term fluctuations in inter-est rates, the inverted term spread is alsoincluded in the index (i.e., the 90-daytreasury bill rate minus the yield on 10-yeargovernment bonds)
Variables that primarily reflect risk:
• the beta (β) variable derived from the total-return index for Canadian financial institu-tions (β is a measure of how risky a stock, orgroup of stocks, is relative to the overallmarket)
• volatility of the Canadian dollar1
• Canadian stock market volatility2
Variables that primarily reflect uncertainty:
• the difference between Canadian and U.S.government short-term borrowing rates (thedifference is adjusted for exchange rate riskusing the covered-interest-parity condition)
• the average bid/ask spread on Canadiantreasury bills3
• the spread between the rates on 90-day Cana-dian commercial paper and treasury bills
Weighting Methodology
The daily value of each variable is first weightedby its sample cumulative distribution function.For example, if the value of a variable on a givenday exceeds 75 per cent of all previously ob-served values, then it is given a ranking of 75.Next, each variable is weighted by the relativesize of the market to which it pertains. The larg-er the market’s share of total credit in the econ-omy is, the higher the weight.
More formally, the index described above canbe expressed as
where xjt is the value of the jth variable (fromthe nine variables listed above) on day t, and wjtis the credit weight. The integrated term is theestimated cumulative distribution function forxj based on the historical sample.
1. We use a trade-weighted average of the dollar versusthe currencies of Canada’s six largest trading partnersand apply a general autoregressive conditional het-eroscedastic (GARCH) model to measure the volatility.
2. We use the S&P TSX index and apply a GARCHmodel to measure the volatility.
3. The “bid” and “ask” rates are those at which securitiesdealers, acting as market middlemen, will sell andbuy treasury bills.
FSIt wjt f xjt( ) xjtd∞–
x j∫⋅j
∑ 100,⋅=
45
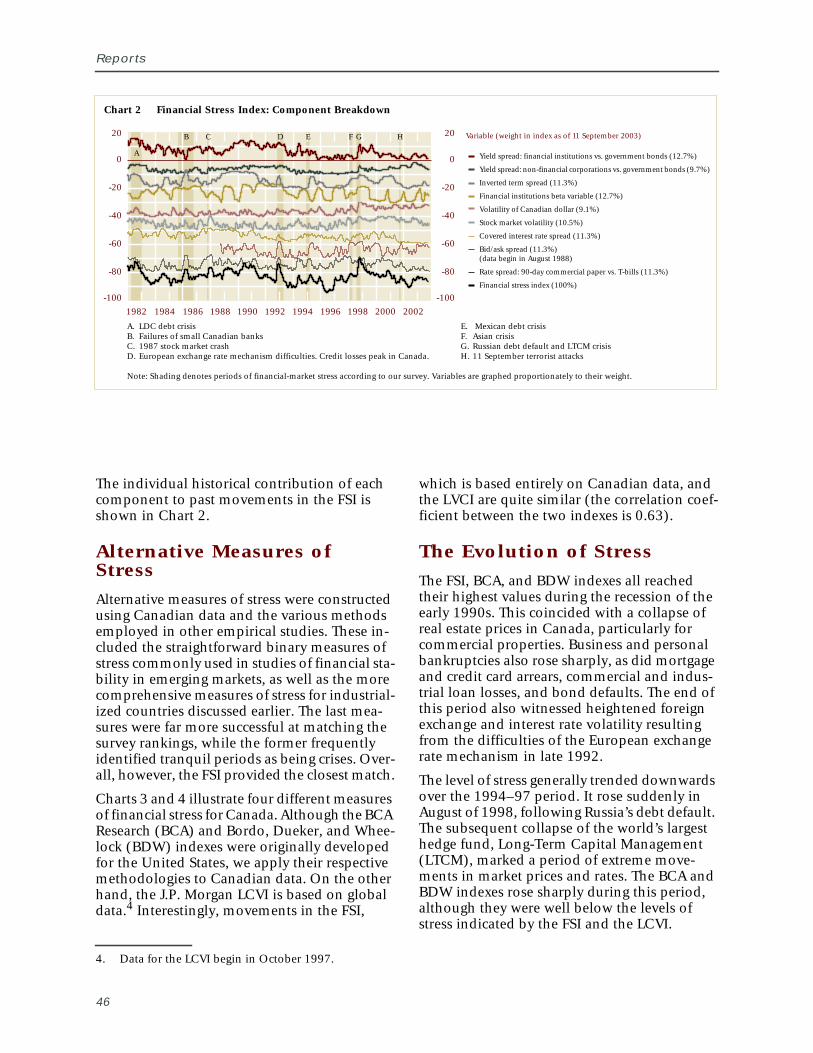
Reports
Chart 2 Financial Stress Index: Component Breakdown
A. LDC debt crisis E. Mexican debt crisisB. Failures of small Canadian banks F. Asian crisisC. 1987 stock market crash G. Russian debt default and LTCM crisisD. European exchange rate mechanism difficulties. Credit losses peak in Canada. H. 11 September terrorist attacks
Note: Shading denotes periods of financial-market stress according to our survey. Variables are graphed proportionately to their weight.
Variable (weight in index as of 11 September 2003)
Yield spread: financial institutions vs. government bonds (12.7%)
Yield spread: non-financial corporations vs. government bonds (9.7%)
Inverted term spread (11.3%)
Financial institutions beta variable (12.7%)
Volatility of Canadian dollar (9.1%)
Stock market volatility (10.5%)
Covered interest rate spread (11.3%)
Bid/ask spread (11.3%)(data begin in August 1988)
Rate spread: 90-day commercial paper vs. T-bills (11.3%)
Financial stress index (100%)
-100
-80
-60
-40
-20
0
20
-100
-80
-60
-40
-20
0
20
1982 1984 1986 1988 1990 1992 1994 1996 1998 2000 2002
A
B C D E F G H
The individual historical contribution of eachcomponent to past movements in the FSI isshown in Chart 2.
Alternative Measures ofStress
Alternative measures of stress were constructedusing Canadian data and the various methodsemployed in other empirical studies. These in-cluded the straightforward binary measures ofstress commonly used in studies of financial sta-bility in emerging markets, as well as the morecomprehensive measures of stress for industrial-ized countries discussed earlier. The last mea-sures were far more successful at matching thesurvey rankings, while the former frequentlyidentified tranquil periods as being crises. Over-all, however, the FSI provided the closest match.
Charts 3 and 4 illustrate four different measuresof financial stress for Canada. Although the BCAResearch (BCA) and Bordo, Dueker, and Whee-lock (BDW) indexes were originally developedfor the United States, we apply their respectivemethodologies to Canadian data. On the otherhand, the J.P. Morgan LCVI is based on globaldata.4 Interestingly, movements in the FSI,
4. Data for the LCVI begin in October 1997.
46
which is based entirely on Canadian data, andthe LVCI are quite similar (the correlation coef-ficient between the two indexes is 0.63).
The Evolution of Stress
The FSI, BCA, and BDW indexes all reachedtheir highest values during the recession of theearly 1990s. This coincided with a collapse ofreal estate prices in Canada, particularly forcommercial properties. Business and personalbankruptcies also rose sharply, as did mortgageand credit card arrears, commercial and indus-trial loan losses, and bond defaults. The end ofthis period also witnessed heightened foreignexchange and interest rate volatility resultingfrom the difficulties of the European exchangerate mechanism in late 1992.
The level of stress generally trended downwardsover the 1994–97 period. It rose suddenly inAugust of 1998, following Russia’s debt default.The subsequent collapse of the world’s largesthedge fund, Long-Term Capital Management(LTCM), marked a period of extreme move-ments in market prices and rates. The BCA andBDW indexes rose sharply during this period,although they were well below the levels ofstress indicated by the FSI and the LCVI.
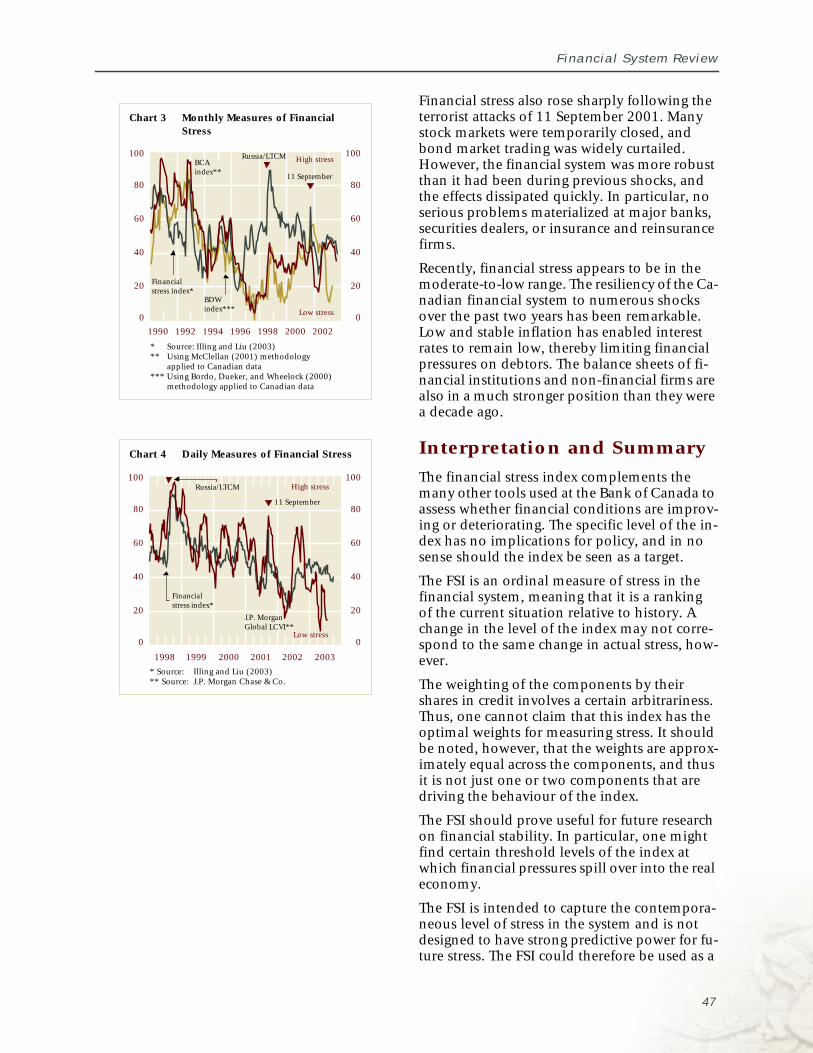
Financial System Review
Chart 3 Monthly Measures of FinancialStress
High stress
Low stress
Financialstress index*
BDWindex***
Russia/LTCM
11 September
BCAindex**
0
20
40
60
80
100
0
20
40
60
80
100
1990 1992 1994 1996 1998 2000 2002
* Source: Illing and Liu (2003)** Using McClellan (2001) methodology
applied to Canadian data*** Using Bordo, Dueker, and Wheelock (2000)
methodology applied to Canadian data
Chart 4 Daily Measures of Financial Stress
0
20
40
60
80
100
0
20
40
60
80
100
* Source: Illing and Liu (2003)** Source: J.P. Morgan Chase & Co.
1998 1999 2000 2001 2002 2003
Financialstress index*
Low stress
11 September
J.P. MorganGlobal LCVI**
High stressRussia/LTCM
Financial stress also rose sharply following theterrorist attacks of 11 September 2001. Manystock markets were temporarily closed, andbond market trading was widely curtailed.However, the financial system was more robustthan it had been during previous shocks, andthe effects dissipated quickly. In particular, noserious problems materialized at major banks,securities dealers, or insurance and reinsurancefirms.
Recently, financial stress appears to be in themoderate-to-low range. The resiliency of the Ca-nadian financial system to numerous shocksover the past two years has been remarkable.Low and stable inflation has enabled interestrates to remain low, thereby limiting financialpressures on debtors. The balance sheets of fi-nancial institutions and non-financial firms arealso in a much stronger position than they werea decade ago.
Interpretation and Summary
The financial stress index complements themany other tools used at the Bank of Canada toassess whether financial conditions are improv-ing or deteriorating. The specific level of the in-dex has no implications for policy, and in nosense should the index be seen as a target.
The FSI is an ordinal measure of stress in thefinancial system, meaning that it is a rankingof the current situation relative to history. Achange in the level of the index may not corre-spond to the same change in actual stress, how-ever.
The weighting of the components by theirshares in credit involves a certain arbitrariness.Thus, one cannot claim that this index has theoptimal weights for measuring stress. It shouldbe noted, however, that the weights are approx-imately equal across the components, and thusit is not just one or two components that aredriving the behaviour of the index.
The FSI should prove useful for future researchon financial stability. In particular, one mightfind certain threshold levels of the index atwhich financial pressures spill over into the realeconomy.
The FSI is intended to capture the contempora-neous level of stress in the system and is notdesigned to have strong predictive power for fu-ture stress. The FSI could therefore be used as a
47
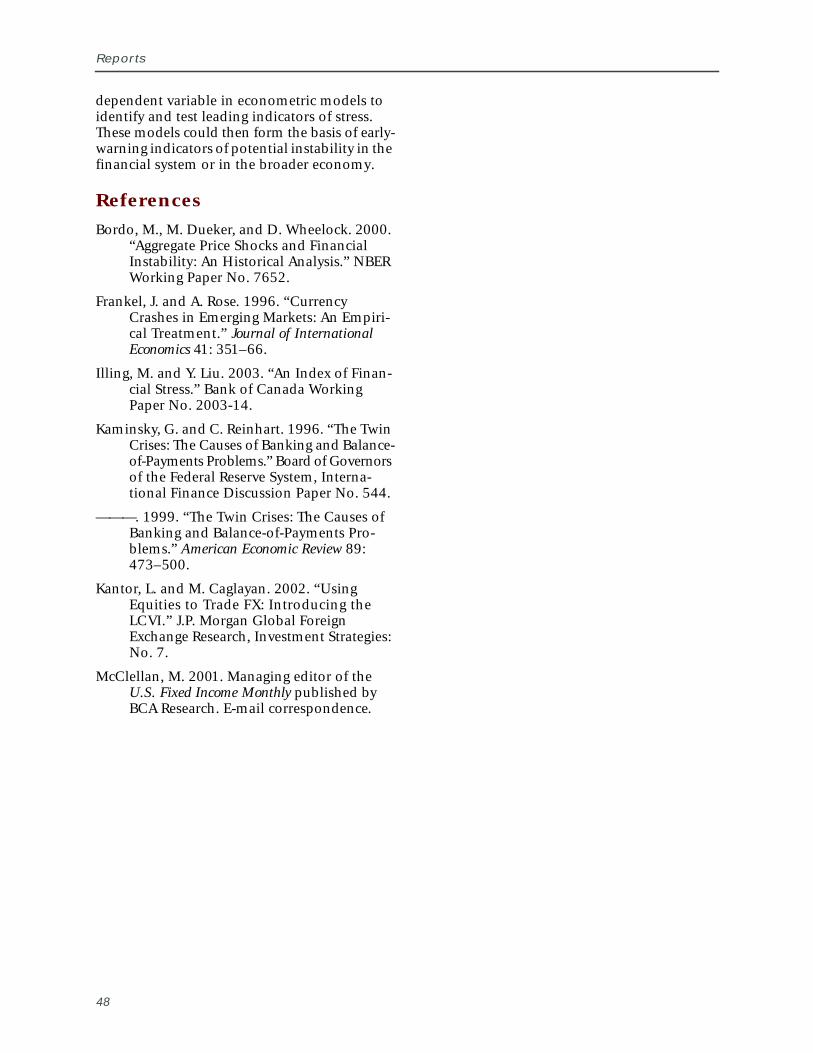
Reports
dependent variable in econometric models toidentify and test leading indicators of stress.These models could then form the basis of early-warning indicators of potential instability in thefinancial system or in the broader economy.
References
Bordo, M., M. Dueker, and D. Wheelock. 2000.“Aggregate Price Shocks and FinancialInstability: An Historical Analysis.” NBERWorking Paper No. 7652.
Frankel, J. and A. Rose. 1996. “CurrencyCrashes in Emerging Markets: An Empiri-cal Treatment.” Journal of InternationalEconomics 41: 351–66.
Illing, M. and Y. Liu. 2003. “An Index of Finan-cial Stress.” Bank of Canada WorkingPaper No. 2003-14.
Kaminsky, G. and C. Reinhart. 1996. “The TwinCrises: The Causes of Banking and Balance-of-Payments Problems.” Board of Governorsof the Federal Reserve System, Interna-tional Finance Discussion Paper No. 544.
———. 1999. “The Twin Crises: The Causes ofBanking and Balance-of-Payments Pro-blems.” American Economic Review 89:473–500.
Kantor, L. and M. Caglayan. 2002. “UsingEquities to Trade FX: Introducing theLCVI.” J.P. Morgan Global ForeignExchange Research, Investment Strategies:No. 7.
McClellan, M. 2001. Managing editor of theU.S. Fixed Income Monthly published byBCA Research. E-mail correspondence.
48

Policy and
Infrastructure
Developments

Financial System Review
Introduction
he financial system and all of its variouscomponents (institutions, markets, andclearing and settlement systems) are sup-ported by a set of arrangements, including
government policies, that influence its structure andfacilitate its operation. Taken together, these ar-rangements form the financial system’s infrastruc-ture. Experience has demonstrated that a keydeterminant of a robust financial system is the ex-tent to which it is underpinned by a solid, well-de-veloped infrastructure. This section of the Reviewhighlights work in this area, including that relatedto relevant policy developments.
A key element in a well-functioning financialsystem is easy access by market participants tothe information they need for making soundfinancial decisions.
During the past couple of years, a series of reve-lations regarding questionable corporate ac-counting and governance practices, primarily inthe United States, damaged investor confidencein financial statements and corporate gover-nance. Restoring Investor Confidence: Backgroundon Recent Developments in Canada summarizesthe initiatives currently underway to enhancedomestic governance practices. While improvedregulatory and financial reporting structuresshould be helpful, their effectiveness will haveto be assessed over time.
The recent development of alternative (i.e., elec-tronic) trading systems promises to improvetransparency within securities markets. Trans-parency in the Canadian Fixed-Income Market: Op-portunities and Constraints describes the growingpresence of these systems in Canada. Theirarrival has necessitated the development of anappropriate set of guidelines, and the Bank ofCanada is involved in this process.
T
Also underpinning financial markets, and in-deed all commercial activity in Canada, is theretail payments system. While many types ofpayment instrument are easily recognized (e.g.,cash, cheques, and debit and credit cards), thesystem that transfers the associated funds be-tween individuals, businesses, and governmententities is less well known. Policy Issues in RetailPayments examines the pressures for change inthis area, arising partly from new informationtechnologies.51

Financial System Review
Restoring Investor Confidence:Background on Recent Developmentsin CanadaJim Armstrong
53
usiness failures caused by inadequatecorporate governance and deficiencies incorporate financial reporting are by nomeans new. However, recent high-pro-
file cases in the United States such as Enron,Worldcom, and others, as well as many lessercases worldwide, have focused attention on thisarea. Particularly troubling are indications thatthe interests of corporate management were, ina number of cases, profoundly misaligned withthose of shareholders. This arguably contribut-ed to sharp losses in equity markets and to amore generalized loss of confidence in capitalmarkets globally.
Financial statements have historically been anessential means of providing information to in-vestors. Doubts about the validity of these state-ments can undermine investor confidence andlead to a higher cost of capital, which reducesthe economy's productivity.
As a recent task force committee sponsored bythe International Federation of Accountants(IFAC), and chaired by former Bank of CanadaGovernor John Crow, reported, “Almost all thehigh-profile failures are the result of failures inbusiness, failures in governance, and failures inreporting. The business issue that should becommunicated to users of the financial state-ments is not properly disclosed, governancestructures fail to prevent or detect this, and a re-porting failure results. As an entity moves closerto business failure, the incentive to distort re-porting increases and, therefore, the chance ofreporting failure increases” (IFAC 2003, 5).
It has been noted that during the period of over-heated equity markets in the late 1990s, pres-sures to push share prices ever higher often tookprecedence over proper governance and disclo-sure practices. Executive compensation increas-ingly based on the granting of stock optionsadded to these pressures. This environmentcreated the conditions for the high-profile cor-porate frauds.
B
These extreme cases generated tremendous pres-sures for reform in the United States, which cul-minated in the passage of the landmarkSarbanes-Oxley Act (July 2002). Among themost far-reaching legislative reforms to affectthe U.S. corporate sector, it sets extensive newstandards—from governance and accountingpractices to reporting deadlines, ethics codes,and penalties for altering corporate documents.Given Canada's relatively small markets andhigh degree of integration with U.S. capital mar-kets, Canadian authorities have endeavoured toreact in a way that acknowledges U.S. develop-ments while accommodating the unique fea-tures of our corporate sector and financialmarkets—in essence, arriving at a “made inCanada” solution. Complicating this processhas been the fact that U.S. regulation has tradi-tionally emphasized the application of detailedrules, whereas in Canada the emphasis has beenon the development of overarching principlesto which practices should broadly conform.
Recent reform efforts in Canada have involvedthe co-operation of the federal and provincialgovernments, regulators, and the private sector.The Department of Finance (2003) has broadlycategorized the Canadian reforms to date as
• strengthening corporate governance andensuring management accountability,
• improving financial reporting and disclo-sure,
• enhancing the credibility of the audit pro-cess, and
• strengthening enforcement.
The proposed changes are aimed at buildingconfidence while keeping compliance costsmanageable. In this article, some issues in eachcategory are highlighted.
Policy and Infrastructure Developments
Strengthening CorporateGovernance and EnsuringManagement Accountability
Corporate governance can be broadly thoughtof as the way in which directors and managershandle their responsibilities towards sharehold-ers.
Concerns about governance come to the foreonly when there is a separation of ownershipfrom control, which happens exclusively in thecorporate form of business organization.1 Thisseparation can give rise to what is referred to asthe “agency problem,” that is, the risk that themanagers (the agents) of the firm will make de-cisions in their own interests rather than in theinterests of the shareholders (the principals). Inthe extreme, such behaviour, if unchecked, canthreaten the viability of the firm. To mitigatethis problem, shareholders elect directors to theboard who, in turn, appoint managers and holdthem accountable.
Who sets corporate governancestandards in Canada?
In Canada, rules and guidelines related to gov-ernance originate from a number of sources.Federally incorporated companies are subject toprovisions in the Canada Business Corpora-tions Act (CBCA), and provincial companies aresubject to the various provincial business corpo-ration acts. In addition, public corporations aresubject to provincial securities laws and stockexchange requirements, if applicable.
Regulated financial institutions may be subjectto additional standards. For example, in January2003, the Office of the Superintendent of Finan-cial Institutions (OSFI) released a new guidelinewith respect to corporate governance for federalfinancial institutions. It should also be notedthat in 2001, the Canada Deposit InsuranceCorporation (CDIC) updated and modernizedits Standards of Sound Business and Financial Prac-tices.2
1. The other major business categories are single propri-etorships and partnerships, where there is no distinc-tion between ownership and control.
2. These Standards for CDIC members (which includeall federally regulated institutions that take retaildeposits) are a codification of practices at the best-run deposit-taking institutions.
54
Over the last decade, there have been severalprominent public reviews of the quality of gov-ernance in publicly held corporations in Cana-da. These have generally provided assessmentsand suggestions for improvement.3 Most re-cently, the Senate Standing Committee onBanking, Trade and Commerce released a report(2003) that addresses the various dimensions ofthe recent crisis of confidence in financial mar-kets (of which corporate governance is one as-pect) and makes wide-ranging recommendations.Much useful work was done through this periodalthough, for the most part, proposed reformshave remained voluntary for public corpora-tions.
The thrust of recent board reform
In the aftermath of the recent high-profile cor-porate scandals, the need for reform in corpo-rate governance has taken on much greaterurgency. Not surprisingly, given the number ofapparent board failures, considerable focus hasbeen on reforming boards and making themmore accountable and more independent.
In the United States, proposed measures intro-duced by the major stock exchanges (expectedto receive final approval from the Securities Ex-change Commission for a phased introduction)will lead to a requirement that boards be com-posed of a majority of independent directors. Inaddition, board committees that are generallyconsidered to be the most important—audit,compensation, and nominating—are to consistexclusively of independent directors and tobe subject to additional rules.4 Under theproposals, independence is defined strictly and
3. For example, in 1994, the Toronto Stock Exchangecreated a committee under Peter Dey (a former headof the Ontario Securities Commission), which made14 recommendations for best practices, focusing onthe board of directors and its relationship with share-holders and management. In 1998, the Senate Stand-ing Committee on Banking, Trade and Commerceproduced a report (The Kirby Report) that focused onthe governance practices of institutional investors. In2000, the Joint Committee on Corporate Gover-nance, chaired by Guylaine Saucier, was created. Itsfinal report proposed modifications to the Dey rec-ommendations in light of trends in globalization.
4. For example, for audit committees there would benew rules related to the financial expertise of com-mittee members and how frequently committeesmust meet.
Financial System Review
excludes all those individuals with a material fi-nancial relationship to the company, as well asfamily members and former employees. Interms of prior relationships, an extended “cool-ing-off period” (likely to be five years) has beenestablished as a condition for achieving inde-pendent status.
In Canada, the process of board reform has in-tensified. Of course, many of Canada’s largestcorporations are interlisted in the United Statesand will have to comply with many of the newU.S. standards if they wish to have continuedaccess to U.S. capital markets. Meanwhile, aftermore than a year of debate and review, manyCanadian companies have been carrying out in-ternal reforms in areas such as committee com-position, board practices, and compensationpolicies (McFarland 2003). The Globe and Mailrecently surveyed 207 of the largest public com-panies in Canada, assigning scores for a range offactors related to good governance. It found thatover the year, scores improved for two-thirds ofthe companies in the sample (McFarland andChurch 2003).
Pressure for governance reform is also comingfrom other fronts. For example, in June 2002,major Canadian institutional investors estab-lished the Canadian Coalition for CorporateGovernance, a vehicle for sharing informationand working towards better governance practic-es. In August 2003, the Coalition publishedguidelines. In September 2002, the CanadianCouncil of Chief Executives released a state-ment outlining actions that they felt chief exec-utive officers (CEOs) and boards of directorscould take to strengthen corporate governance.
Doubts have been expressed about the appro-priateness of the new U.S. standards for all Ca-nadian firms. Canada has a different corporatestructure than the United States, with a relative-ly larger proportion of small public firms andfirms controlled more narrowly (by familiesand others) as opposed to being widely held. Ithas also been argued that the proposals for in-dependent directors are too onerous for smallfirms—the argument being that they would notbe able to attract enough qualified independentdirectors—and are not reasonable for narrowlycontrolled (family) firms. This has led some toadvocate the notion of “two tiers” of gover-nance standards in Canada, with less-stringentstandards being applied to small firms.
At this point, the reform of governance stan-dards is still a work in progress. One step oc-curred in June 2003 when 12 of Canada’s 13provincial and territorial securities regulatorspublished new draft rules for public companiesthat
• prescribed the role and composition ofaudit committees, and
• required the CEO and chief financial officer(CFO) to certify annual and interim disclo-sures.
Companies listed on the TSX would be requiredto have audit committees that are fully indepen-dent and financially literate. By contrast, small-er companies listed on the TSX Venture Exchangeand unlisted issuers would be required to dis-close only those audit committee members whoare independent and financially literate.
In addition, a “certification rule,” applicable toall public companies, will require CEOs andCFOs to attest to the accuracy of their compa-ny’s financial statements and to disclose theeffectiveness of their internal controls.
The TSX has also promoted the adoption of newcorporate-governance standards. In September2002, the TSX proposed changes to its voluntaryguidelines and listing requirements to reflectnew views on best practices. As a result of theinvestor-confidence measures proposed bysecurities regulators, amended proposals areexpected.
Similarly, specific proposals are being preparedthat would result in revisions to the governanceprovisions in the federal CBCA and to statutesgoverning financial institutions.
Financial Reporting andAccounting Standards
A key dimension of proper corporate gover-nance is adequate and sufficient financial re-porting. As noted by the recent Report of theSenate Standing Committee on Banking, Tradeand Commerce (2003), “A lack of financialtransparency is an important issue for everystakeholder, including shareholders, investors,lenders, and auditors.”
55
Policy and Infrastructure Developments
The standard-setters
In Canada, supervision of financial reportinginvolves a number of regulatory, self-regulatory,and oversight bodies. In terms of legislation, thefederal CBCA, as well as provincial corporationacts and provincial securities acts, requires thatcompanies prepare financial statements in ac-cordance with Generally Accepted AccountingPrinciples.
The Accounting Standards Board (AcSB) of theaccounting industry association, the CanadianInstitute of Chartered Accountants (CICA), setsaccounting standards. Public oversight of theAcSB is provided by the Accounting StandardsOversight Council, which consists of a mix ofindividuals from both within and outside theaccounting profession.
Accounting standards
Generally Accepted Accounting Principles—orGAAP—are a set of standards intended to bringclarity and uniformity to the financial reportingof corporations.
Traditionally, Canadian GAAP has been moreprinciples based and judgment driven, and U.S.GAAP has been more rules based, althoughboth systems encompass rules and principles.The International Accounting Standards Boardis promoting the development of global uni-form accounting standards that tend to relymore on principles. The U.S. Financial Account-ing Standards Board is participating in this ini-tiative. Canadian standards, while continuingto be strongly influenced by those in the UnitedStates, will likely be affected by internationalefforts aimed at greater harmonization.5
Important changes to Canada’s accountingstandards, designed to improve disclosure, arecoming into effect. These include
• guidance on speculative derivatives that wasbrought into effect for fiscal years starting inJuly 2002;
• a new guideline requiring the disclosure offinancial guarantees, which came into effecton 1 January 2003;
5. Harmonization does not necessarily imply adoptingU.S. or other rules verbatim but rather capturing theessence of their intent using a Canadian format.
56
• a new guideline for variable-interest entities,which will come into effect by January 2004;and
• a draft guideline on the expensing of stockoptions, which is expected to come intoeffect by January 2004.
Enhancing the Credibility ofthe Audit Process
The recent failures in corporate governancewere often associated with breakdowns in theintegrity of the audit process. This, in turn, hastriggered a global re-examination of the externalaudit function. The growing importance of theconsulting services that audit firms provide totheir corporate clients has come under particu-lar scrutiny. In certain cases, this may have com-promised the objectivity of the audit process.
In Canada, the audit firm is appointed, in prin-ciple, by the shareholders—often with the guid-ance of the board’s audit committee. Overall,Canadian audit practices follow a self-regulato-ry framework. Auditing and assurance standardsare set by the Assurance Standards Board underthe aegis of the CICA. The Board sets GenerallyAccepted Assurance Standards. In October2002, the CICA announced the establishmentof the Auditing and Assurance Standards Over-sight Council, an independent body to overseethe setting of auditing standards; this body be-gan to operate earlier this year.
Standards relating to public practice, such asauditor-independence rules and professionalcodes of conduct, have been developed by pro-vincial institutes or associations of professionalaccountants for application to their members.
One important regulatory development hasbeen the creation of The Canadian Public Ac-countability Board (CPAB), which is chaired byformer Bank of Canada Governor, GordonThiessen. The mission of the CPAB, which wasannounced in 2002, is to contribute to publicconfidence in the integrity of financial reportingof Canadian public companies by promotinghigh-quality, independent auditing. The newagency, which aims to ensure both indepen-dence and transparency, means that auditors of

Financial System Review
Canada’s publicly listed companies will be sub-ject to more frequent and rigorous reviews.6
With regard to the important issue of auditor in-dependence, the CICA released a draft indepen-dence standard in 2002 to apply to Canadianauditors and other assurance providers. Accord-ing to the CICA, “the core principle of the newstandard is that every effort must be made toeliminate any real or perceived threat to the au-ditor’s independence” (CICA 2002). Among theissues addressed in the independence standardare which categories of non-audit services pro-vided by an auditing firm to a corporate clientare acceptable, as well as requirements for audi-tor rotation.
Strengthening Enforcement
Considerable action has been taken to strength-en Canada’s enforcement framework. In the2003 federal budget, the government an-nounced a coordinated national approach toenforcement aimed at strengthening the investi-gation and prosecution of serious corporatefraud and illegal market activity. Up to $30 mil-lion a year has been provided for this coordinat-ed approach, which includes
• Legislative amendments to the CriminalCode to create new offences (e.g., improperinsider trading) and evidence-gatheringtools to increase penalties, to provide guid-ance on sentencing, and to establish concur-rent jurisdiction with the provinces in theprosecution of serious cases of capital mar-ket fraud
• New resources dedicated to investigatingserious cases of capital market fraud—spe-cial teams of investigators, forensic accoun-tants, and lawyers will be established in keyCanadian financial centres
6. CPAB’s five-member Council of Governors is madeup of the: Chair of the Canadian Securities Adminis-trators, the Chairs of two provincial securities com-missions (the Ontario Securities Commission andthe Commission des valeurs mobilières du Québec),the Superintendent of Financial Institutions, and thePresident and CEO of the Canadian Institute of Char-tered Accountants.It should be noted that a draft rule by 12 of Canada’s13 provincial and territorial securities regulators,published in June 2003, requires auditors of publicfirms to be members in good standing of the CPAB.
• New resources to support the prosecution ofcapital market fraud offences under theCriminal Code (including cases generatedby the special investigative teams)
At the provincial level, governments have bol-stered the enforcement framework for securitieslaws. For example, Ontario and Quebec havepassed legislation to modernize the definitionof securities offences, increase penalties, andbroaden the investigative powers of their securi-ties commissions.
On 12 November 2003, the Canadian SecuritiesAdministrators (CSA) announced that they hadreceived a report from the Illegal Insider TradingTask Force. The report recommends practices toaddress illegal insider trading in Canadian cap-ital markets.7 The recommendations focus onaddressing the problem from three directions:prevention, detection, and deterrence. The CSAstated that it will consider the recommenda-tions as it develops an action plan to address theproblem of illegal insider trading.
Conclusion
Numerous initiatives have been taken with re-spect to corporate governance, accounting, andauditing standards in Canada. While more re-mains to be done, it should be remembered thatsuch regulatory changes are not costless forbusinesses (which are subject to the increasedreporting and governance standards). It is there-fore important that the authorities try to achievethe desired goals with minimum effect on effi-ciency. To ensure that these measures will serveCanada well in the years to come, it will beessential to rigorously assess the reforms imple-mented.
7. The Illegal Insider Trading Task Force was establishedin September 2002 and included representativesfrom the Ontario, Quebec, British Columbia, andAlberta securities commissions, the Investment Deal-ers Association of Canada, the Bourse de Montréal,and Market Regulation Services Inc.
57
Policy and Infrastructure Developments
References
Canada. Department of Finance. 2003. “Foster-ing Investor Confidence in CanadianCapital Markets.” Available at <http://www.fin.gc.ca/toce/2003/fostering_e.html>.
Canadian Institute of Chartered Accountants(CICA). 2002. “Canada’s CharteredAccountants Issue New Draft AuditorIndependence Standard.” Media release,5 September.
International Federation of Accountants(IFAC). 2003. Rebuilding Public Confidencein Financial Reporting—An InternationalPerspective. IFAC Task Force on RebuildingPublic Confidence in Financial Reporting.
McFarland, J. 2003. “Everybody Is in a State ofSelf-Examination.” The Globe and Mail,1 April, E1.
McFarland, J. and E. Church. 2003. “BoardGames: Canada’s Definitive CorporateGovernance Rankings.” The Globe andMail, 22 September. Report on Business,B1.
Senate Standing Committee on Banking, Tradeand Commerce. 1998. The GovernancePractices of Institutional Investors (The KirbyReport) (November).
———. 2003. Navigating Through “The PerfectStorm”: Safeguards to Restore Investor Confi-dence (June).
58
Financial System Review
Transparency in the Canadian Fixed-Income Market: Opportunities andConstraintsTran-Minh Vu
arket quality is important to policy-makers because it directly affects thelevel of confidence and the willing-ness of participants to use markets
for transactions. Factors such as informationalefficiency, volatility, liquidity, and transparencycan all affect market quality (Boisvert and Gaa2001).
The Bank of Canada has a particular interest inthe quality of fixed-income markets because ofits roles in promoting a safe and efficient finan-cial system, formulating and implementingmonetary policy, and managing the federal gov-ernment’s debt. Liquid, orderly, and resilientmarkets support the financial system’s ability toallocate resources effectively, the Bank’s abilityto rely on the efficient transmission of changesin the overnight interest rate across the termstructure of yields, and the government’s abilityto achieve stable, low-cost financing.
This article focuses on one aspect of marketquality—transparency. The Bank, the Depart-ment of Finance, and others have promotedenhanced transparency in fixed-income marketsfor some time.
Market Structure andTransparency
Market transparency is usually defined as theability of market participants to observe theinformation in the trading process (O’Hara1995).
In general, the level of transparency differsacross different market structures. Its evolutionhas been influenced by the nature of the instru-ments traded, the interactions between marketparticipants, and, in some instances, by rules es-tablished by public authorities. For example,fixed-income markets are distinct from equitymarkets in a number of ways. Most equity
M
markets are centralized, order-driven markets,whereas fixed-income markets, where dealersintermediate customer transactions by provid-ing quoted prices, are typically decentralizedand quote driven. The frequency of transactionsis lower in fixed-income markets than in equitymarkets; however, the average size of each tradeis much larger. Fixed-income markets are gener-ally wholesale markets, dominated by sophisti-cated institutional investors. Retail investors aremore active in equity markets. These character-istics have contributed to the decentralized na-ture of fixed-income markets, where retailparticipants have less access to price informa-tion than they do in centralized markets, such asthe equity market. Participants in fixed-incomemarkets generally demand greater immediacy oftrade execution than those in equity markets.1Dealers undertake the immediate trade andthen proceed to manage their inventory throughsubsequent trades.
In fixed-income markets, transparency refersmainly to information regarding pre-tradequotes and post-trade reporting of prices andvolumes. More specifically, pre-trade quotes re-fer to the availability of information about bidsand offers, and post-trade reporting refers to thepublic and timely transmission of informationon past trades, which may include price, vol-ume, and execution time (BIS 2001).2
Equity markets have evolved in a heavily regu-lated environment, and much of the practicaland theoretical knowledge of market regulationhas developed around these particular
1. Demand for immediacy depends on the volatility ofthe security and the diversifiability of the risk of anadverse price movement. Therefore, the greater therisks that investors face in delaying their trades, thegreater the desire for immediacy of trade execution.
2. Note that price information may also be displayed asa yield or a spread against a benchmark.
59
Policy and Infrastructure Developments
markets. A wide body of literature supportsthe argument that greater transparency in thetrading process enhances market liquidityand efficiency by reducing opportunitiesfor taking advantage of less-informed ornon-professional participants.3 This has ledregulatory authorities to require that equity-trading information be made immediately avail-able to the general public. However, the type oftransparency regulation appropriate for equitymarkets may not be appropriate for fixed-in-come markets. While the issue of asymmetricinformation (where a subset of market partici-pants have private knowledge of an asset’s ex-pected value) may apply to equity markets, itmay be less of an issue in fixed-income marketsfor government securities. Gravelle (2002) findsthat private information about the expected val-ue of government securities plays only a minorrole in the market (if any), since their prices de-pend on the term structure of yields which, inturn, depend on macroeconomic factors thatare public information.
The effects of increasedtransparency
Generally, a market becomes more transparentwhen there is an increase in trade informationavailable to the public. It is assumed that greatertransparency would likely increase market li-quidity by building up the confidence of partic-ipants. Moreover, a higher level of pre-tradetransparency would encourage customers tomanage their portfolios more actively andwould attract new investors to the market. Ahigher level of customer participation wouldnot only increase the level of liquidity, butwould also add to the ability of dealers to pro-vide liquidity to the markets by reducing theirmarket-making cost.4
In Canada, because of the decentralized natureof the fixed-income market, customers typicallycontact several dealers to obtain the best price.5
3. A liquid market is generally defined as a market whereparticipants can rapidly execute large-volume transac-tions with only a small impact on prices (BIS 1999).
4. Increased customer participation could help dealersto manage part of their inventory risk by increasingthe frequency of their trading with their own custom-ers.
5. Because they are primarily institutional investors,customers usually have a fiduciary duty to obtain atleast three quotes from different dealers.
60
Increasing pre-trade transparency would notonly contribute to more efficient price discov-ery, but would also help customers obtain thebest execution of their transactions.
It is increasingly recognized by participants andresearchers that, at some level, a trade-off existsbetween increased transparency and liquidity.For example, participants who responded to theInvestment Dealers Association of Canada(IDA) and the Canadian Securities Administra-tors (CSA) Market Survey on Regulation of FixedIncome Markets (Deloitte & Touche 2002)agreed that steps taken to increase transparencyshould also consider the impact of such stepson liquidity. On balance, however, the litera-ture is still inconclusive about the effect of great-er transparency on overall market quality(Allen, Hawkins, and Sato 2001).
While increased transparency benefits the mar-ket as a whole, full transparency may not alwaysbe optimal. This is particularly true if dealersare required to display information on large-volume trades in real time (i.e., full post-tradetransparency) to the market. For example, sucha dealer will incur greater costs for managing in-ventory risk, since other dealers, who have beeninformed about the direction and size of thetrade in real time, will strategically adjust theirquotes in the interdealer market.6 Full post-trade transparency would hinder the ability ofdealers to manage their inventory risk, therebyreducing their incentive to provide liquidity tothe market. Ultimately, dealers might pass onthese higher risk-management costs to their cus-tomers by widening the bid/ask spread andproviding less depth to the market.
How transparent are Canadianfixed-income markets?
The IDA/CSA Market Survey on Regulation ofFixed Income Markets (Deloitte & Touche2002) states that “price transparency varies de-pending on the type of security and on the typeof market participant.” Respondents to the sur-vey indicated that government securities havegood price transparency, while illiquid securi-ties are less transparent. However, the survey
6. Dealers use the interdealer fixed-income market notonly as a price-discovery mechanism, but also as ameans of sharing with other dealers the position risksthat they have taken on while trading with customers.
Financial System Review
shows that customers in the retail sector havevery little access to price information.
Market participants (i.e., institutional, whole-sale investors) can currently obtain informationon debt securities via CanPX.7 CanPX is asystem for reporting quotations and trades andis designed to provide a consolidation of inter-dealer prices to all interested market partici-pants. By logging on to CanPX, participants canhave access to the best bids and offers in theinterdealer market.
Moreover, participants have access to price in-formation by calling dealers for quotes and alsoto indicative quotes via service providers(e.g., Bloomberg). The recent development ofalternative trading systems (ATSs) in Canadagives participants access to quotes from a num-ber of dealers through these systems. Therefore,ATSs have the potential to increase transparencyin fixed-income markets.
Changing Technology: AnOpportunity for IncreasedTransparency
While the last few years have seen the rapidemergence of electronic trading systems in secu-rities markets, their penetration has been un-even. Distinctive market structures have led toslower development of electronic trading infixed-income markets than in equity or foreignexchange markets.8 On a cross-country compar-ison basis, electronic trading has been slower todevelop in the Canadian fixed-income marketthan in U.S. or European markets. This maybe partly explained by the varied needs andincentives of market participants, as well as bythe regulatory and competitive factors presentin each country. The relatively smaller sizeof Canadian markets and the degree of concen-tration, coupled with the high cost of techno-logical infrastructure, may also be factorsbehind the slower development of electronictrading in Canada.
7. CanPX was developed by IDA member firms andinterdealer brokers. It began operating in Canada in1999 and is similar to the GovPX system in theUnited States.
8. Asset type is also an important element in the devel-opment of electronic trading, since standardized,homogeneous products have proved the easiest tomigrate to electronic trading platforms.
The impact of electronic tradingsystems
Electronic trading systems have already affectedthe functioning of fixed-income markets inmany ways, particularly in the United States andEurope. First, they can facilitate greater pre-trade and post-trade transparency. In fact, themost commonly cited benefit of electronic trad-ing systems is that they can enhance the price-discovery process and help establish best prices.Second, electronic trading can be more cost-ef-ficient, especially with its capability for straight-through processing. Third, these systems alterthe relationship between dealers and custom-ers. For example, customers can obtain quotesfrom several dealers almost instantaneouslywithout having to contact each dealer. The in-troduction of a customer-to-customer system(bypassing the intermediary role of dealers)could affect the structure of the fixed-incomemarket by removing the current separation thatexists between the interdealer sphere and thedealer-customer sphere.
Reporting quotations and trades
The CanPX system provides further price trans-parency for the Canadian fixed-income marketby consolidating price information. At this stagein its development, its coverage is limited tobenchmark government securities and a rela-tively narrow number of corporate securitiestraded in the domestic marketplace. TheDeloitte Report (2002) indicates that responsesto CanPX have been mixed. On one hand, insti-tutional investors and issuers commend CanPXfor increasing the level of price transparency inthe markets. On the other hand, large dealersare skeptical about the quality of the informa-tion displayed on CanPX because it is limited toa minimum trade size, whereas prices usuallyvary with the size of the order.
Improving market quality
Electronic trading systems and systems for re-porting quotations and trades are welcome ad-ditions to the Canadian fixed-income market.Although some of these systems are still in theirearly developmental stages, they have the po-tential to enhance current levels of transparency.By enhancing transparency, electronic tradingsystems will add to market quality, becausetrading transparency contributes to reliable
61
Policy and Infrastructure Developments
price discovery and efficient risk-allocation be-tween market participants.
The Canadian Public PolicyResponse
Canadian provincial securities regulators areactively involved in regulating electronic trad-ing systems. In December 2001, the ATS Rulescame into effect in Canada.9 The primary pur-pose of the ATS Rules is to establish a newframework that allows ATSs to compete withmore traditional exchanges. The regulatoryobjectives are to provide investors with morechoices, decrease trading costs, and improveprice discovery and market integrity. The ATSRules are divided into three parts: (1) a frame-work for the regulation of marketplaces, (2) re-quirements for data transparency and marketintegration, and (3) rules for market regula-tion.10 The requirements for data transparencyare divided into two categories: (a) exchange-traded securities and foreign-exchange-tradedsecurities, and (b) debt securities.
According to the current ATS Rules, transparen-cy requirements for debt securities have beenseparated into two subcategories: governmentdebt securities and corporate debt securities. Forgovernment securities, marketplaces and inter-dealer brokers (IDBs) must provide real-timeorder and trade information on designatedbenchmarks to an information processor (fullpre-trade and post-trade transparency).11 Forcorporate securities, marketplaces are requiredto provide real-time order information to an in-formation processor. The reporting of trade in-formation for corporate securities is, however,subject to volume caps and a time delay.12
9. The CSA’s ATS Rules consist of National Instrument21-101 Marketplace Operation (NI 21-101), NationalInstrument 23-101 Trading Rules (NI 23-101), and therelated companion policies (21-101CP and 23-101CP).
10. Marketplaces are exchanges, as well as systems forreporting quotations and trades, including ATSs. Theydo not include interdealer brokers.
11. The ATS Rules define an information processor as anyperson or company that receives and provides informa-tion under the NI 21-101 and has filed Form 21-101F5.
12. More specifically, marketplaces, IDBs, and dealersexecuting trades outside of a marketplace must pro-vide trade details within one hour after the trade,subject to volume caps of $2 million and $200,000for investment-grade corporate securities and non-investment-grade corporate securities, respectively.
62
The CSA granted fixed-income ATSs an exemp-tion from transparency requirements until31 December 2003. In October 2003, the CSAreleased a notice of amendments to the ATSRules. Under the amendments, all transactionsin government securities would be granted athree-year exemption from the transparency re-quirements, while transparency requirementsfor corporate securities would be implementedas planned. The CSA indicated that the three-year period will allow market participants to de-termine the appropriate level of transparencyfor government fixed-income markets. The CSAhave also recommended CanPX as an informa-tion processor for corporate debt securities.13
Views on the ATS Rules
The Bank, together with the Department of Fi-nance, has been participating in the develop-ment of the ATS Rules since 1999, and hasprovided comments on the potential repercus-sions of the Rules on the maintenance of well-functioning fixed-income markets. While great-er transparency is generally supported, ourperspective has been that transparency require-ments be designed so as to not adversely affectthe price-discovery mechanism or market liquid-ity.
Throughout this period, in interactions with theCSA and the Bond Market Transparency Com-mittee (BMTC), the importance of developingappropriate levels of transparency on a consul-tative basis has been stressed.14 While transpar-ency should increase, especially in the retailsector, measured steps should be taken whenincreasing transparency so as not to disrupt theefficient functioning of the wholesale fixed-income market. This sentiment is shared by themarket participants who responded to theDeloitte & Touche survey.
One consideration is the need for an equitable,but appropriately differentiated, regulatoryframework, recognizing similarities and differ-ences in market structures. More specifically, it
13. CanPX was named information processor for corpo-rate securities by the provincial securities commis-sions in September 2003.
14. The BMTC was established by the CSA to examine thelevels of transparency appropriate for Canadian debtsecurities. The BMTC was designed to include, asmuch as possible, representatives from all segmentsof the fixed-income market.
Financial System Review
has been suggested that fixed-income ATSs andmarketplaces that are similar in nature shouldbe subject to the same transparency require-ments. As such, systems displaying executableprices should have the same level of transparen-cy as IDBs, which are also characterized by thisfeature. Furthermore, the Bank and the Depart-ment of Finance have expressed confidence thatIDBs and systems displaying executable pricesshould be able to support a higher level of trans-parency than systems displaying indicative prices.
When the amendments come into effect in early2004, transactions in corporate debt securities willbe regulated by the ATS Rules. But the CSA haveindicated that it is premature to impose trans-parency requirements in the government debtmarket. One would expect that government se-curities, which are the most liquid of Canadianfixed-income securities, could support a higherlevel of transparency than corporate debt securi-ties and support it sooner rather than later.
What’s Next?
The Bank will continue to work in collaborationwith the Department of Finance, the CSA, andthe BMTC to promote increased transparency ina way that recognizes the unique characteristicsof fixed-income markets.
In February 2004, the Bank will host a work-shop on regulation and transparency in fixed-income markets. The workshop will bring to-gether academics, regulators, and market partic-ipants to examine and analyze issues related totransparency and market quality. This will fur-ther inform our work to enhance the efficiencyof the Canadian fixed-income market.
References
Allen, H., J. Hawkins, and S. Sato. 2001. “Elec-tronic Trading and its Implications forFinancial Systems.” In Electronic Finance:A New Perspective and Challenges. Proceed-ings of a workshop convened by the BIS,July 2001. BIS Papers No. 7.
Bank for International Settlements (BIS). 1999.Market Liquidity: Research Findings andSelected Policy Implications. Report of aStudy Group established by the CGFS.
Bank for International Settlements (BIS). 2001.The Implications of Electronic Trading inFinancial Markets. Report of a Study Groupestablished by the CGFS.
Boisvert, S. and C. Gaa. 2001. “Innovation andCompetition in Canadian Equity Markets.”Bank of Canada Review (Summer): 15–30.
Deloitte & Touche. 2002. IDA/CSA Market Sur-vey on Regulation of Fixed Income Markets.Available at <http://www.ida.ca/IndIssues/PubResearch/IDACSAMarketSurvey_en.asp>.
Gravelle, T. 2002. “The Microstructure of Multiple-Dealer Equity and Government SecuritiesMarkets: How They Differ.” Bank of CanadaWorking Paper No. 2002-9.
O’Hara, M. 1995. Market Microstructure Theory.Cambridge MA: Blackwell Publishers Inc.
63

Financial System Review
Policy Issues in Retail PaymentsSean O’Connor
65
Infrastructure Systems
The infrastructure systems for payments providetransaction, clearing, and settlement services totheir participating members.
Transaction systems use information and commu-nication technology to deliver payment instruc-tions between the parties to a transaction andtheir financial institutions. Their services include
• verifying the identity of the parties and theirability to pay;
• validating the payment instructions; and• communicating information between the par-
ties and their financial institutions.
Clearing systems exchange payment informationbetween the financial institutions that settle theircustomers’ payment obligations. They also calcu-late each institution’s (clearing member’s) settle-ment claim or obligation. Clearing servicesinclude
• sorting and matching transactions betweenmember institutions;
• calculating members’ settlement positions;and,
• transmitting the data to the individual mem-ber institutions and to the settlement bank.
Settlement systems transfer funds between depositaccounts that the clearing members hold at thecentral bank or at another depository. Settlementservices include
• verifying interbank funds-transfer positionsand the funds available in the paying institu-tion’s settlement account;
• settling obligations by posting the fundstransfers to the institutions’ settlementaccounts; and
• confirming the completed settlement with theaccount holders.
he retail payments system is critical tocommercial activity in Canada. Broadlydefined, it has many components, in-cluding payment instruments, informa-
tion technologies, and funds-transfer processesthat involve a range of institutions. Each institu-tion specializes in particular services required toinitiate or settle a retail payment obligation. Re-tail payments are obligations arising from retailcommercial and financial transactions betweenindividuals and businesses and from transfersbetween them and governments.
Everyone is familiar with the various retail pay-ment instruments, such as cash, cheques, andcredit cards. The infrastructure arrangements forprocessing these instruments and for transfer-ring the associated funds are less well known,but their efficient and reliable operation drivesthe retail payments system.
This note highlights some of the policy issuesand initiatives that are emerging in retail pay-ments systems, especially those affecting theinfrastructure arrangements.1 Some of these is-sues are being addressed by private and publicsector organizations, while others are just be-ginning to emerge. To provide some context fordiscussing these issues, a brief overview of theorganization of the retail payments system inCanada and of key developments that havegiven rise to these issues is necessary.
Retail Payment Infrastructure
The principal system for clearing and settlingretail payments in Canada is the AutomatedClearing Settlement System (ACSS) operated bythe Canadian Payments Association (CPA).CPA members are the financial institutions thatprovide payment accounts, instruments, andservices to individuals and businesses. The CPA
1. For a more detailed description, see O’Connor(2003).
T
Policy and Infrastructure Developments
clears a variety of retail payment instrumentsthrough the ACSS daily. It nets the value of allthese payment instruments, multilaterallyacross all direct participants, into a single settle-ment payable or receivable for each participant.These settlement positions are dischargedthrough transfers across the settlement accountsheld at the Bank of Canada by the direct partic-ipants in the ACSS.
There are also other clearing and settlement sys-tems for retail payments in Canada. The majorcredit card organizations and some Internetpayment schemes operate their own clearingsystems and settle their payment obligationsthrough accounts held at commercial banks.Most are associated with a shared or common-use transaction system. Some are operated bynon-bank Internet payment providers.
The most established transaction systems areATM, debit-card, Internet, and tele-banking sys-tems owned and operated by the major Canadi-an financial institutions. The proprietary ATMand debit-card systems are typically linked na-tionwide through Interac into the largest of thecommon network arrangements. Paymentsmade through Interac are cleared and settledthrough the ACSS.
Developments in RetailPayments
Two principal factors underlie the changes in re-tail payments in recent years:
• Innovations in information technology thatinvolve new payment applications, and
• Changes in financial sector policy aimed atimproving competition and efficiency infinancial services, including payment ser-vices.
The most noteworthy effects of these develop-ments on retail payments have been:
• A shift towards electronic payments andaway from cheques. This has been most pro-nounced with respect to card payments andreflects the relatively low costs and risksassociated with these instruments, as well asthe immediacy of payment.
• A trend towards outsourcing of paymentprocessing and transaction services. Thisallows financial institutions to tap into com-mon, shared networks and systems to reduce
66
costs for payment service and improve thequality of service.
• The separation of clearing and settlementsystems for wholesale (large-value) andretail payments. This has permitted the CPAto initiate changes that will make the ACSSmore cost-efficient for its participants.
• A relaxation of regulatory constraints onaccess to infrastructure systems and the pro-vision of service in retail payment markets.
These developments present challenges to exist-ing public and private sector policies regardingthe operations and services of infrastructure sys-tems for retail payments.2
Issues and Initiatives
The key issues that have begun to emerge in re-tail payments systems as a result of these chang-es can be grouped into
• infrastructure arrangements and services,
• payment technologies and applications, and
• market access and competition.3
Infrastructure arrangements
Direct participation in the ACSSTwo issues have emerged with respect to thestructure of the ACSS. The first deals with theconditions for direct participation in the sys-tem. The Canadian Payments Act of 2001extended access to include life insurance com-panies, securities dealers, and money marketmutual funds. Direct participation is, however,subject to conditions regarding the minimumvolume of payments cleared through the sys-tem, the type of institutional class to which amember belongs, and access to ACSS settlementfacilities at the Bank of Canada. CPA membersare concerned that these conditions may nolonger be the most appropriate for direct partic-ipation in the ACSS, although some membersare concerned that eliminating all conditionscould impose significant costs and risks on thesystem.
2. For a more comprehensive description of retail pay-ments systems, see Committee on Payment and Set-tlement Systems (1999 and 2000).
3. Some issues are shared by other countries. See Com-mittee on Payment and Settlement Systems (2003).
Financial System Review
As part of its ACSS settlement facility, the Bankof Canada provides overnight credit to directparticipants. The Bank is concerned that it maybe difficult to cover its credit exposures with avalid, first-priority, security interest for some ofthe classes of institutions newly eligible to par-ticipate in the ACSS. Some institutions are gov-erned by pledging restrictions and bankruptcyregimes that could expose the Bank’s security in-terest to stays on execution. Consequently, theBank has been examining workable options forproviding access to settlement facilities to allclasses of institutions in the CPA. The fact thatthe net obligations of the ACSS are now settledthrough the Large Value Transfer System (LVTS)could help resolve this issue. With this methodof settlement, the Bank will no longer need toextend overnight credit to settle positions in theACSS. A legally valid security interest in collater-al pledged to the Bank for these LVTS paymentswill be protected from stays on execution underthe Payment Clearing and Settlement Act.4
The second issue is related to tiered participa-tion in the ACSS. Only a few direct participantsin the ACSS act as clearing agents for the indirectparticipants in the system. In doing so, they ef-fectively operate their own clearing and settle-ment systems (called quasi-systems) within theACSS. There is some concentration of settle-ment risk within these quasi-systems, but theirrisk-management controls are not transparent.The untimely failure of one of the principalclearing agents, or of a major indirect clearer,could disrupt settlement in the ACSS and causerepercussions for participants and their clients.
The CPA, the Bank of Canada, and the Depart-ment of Finance have established a joint studygroup to examine these issues and report theirfindings by next year.
Retail payments and the LVTSAlthough the LVTS handles the majority oflarge-value payments cleared through the CPA,some large-value retail payments are stillcleared and settled through the ACSS. Eventhough these payments are extremely unlikelyto create systemic risk in the ACSS, the individ-ual payments themselves are still open to settle-ment risks that are not present in the LVTS.Recently, the CPA established a maximum limitof $25 million for individual cheques eligible
4. See Tuer (2003) for details on the settlement process.
for clearing and settlement through the ACSS.This initiative is expected to reduce financialrisk for ACSS participants and their clients.
There has been a proposal to impose the samelimit on electronic payments that clear and set-tle through the ACSS. At issue is whether the riskreduction would be cost-effective for the partic-ipants in the ACSS and their clients.
Cross-border retail payments systemsWith projections that the volume and value ofcross-border retail payments will continue togrow, the development of centralized clearingsystems that specialize in cross-border retailpayments is again under review in some coun-tries. Earlier proposals and programs for multi-lateral cross-border systems failed because of aweak business case related to relatively low val-ues and volumes and the investments alreadymade in well-established, decentralized bilater-al correspondent banking arrangements. Somesmall multilateral systems do still exist, howev-er. There has also been a recent initiative to de-velop a new multilateral system for clearingcross-border retail payments in the euro system.A proposal to link it with non-euro systems forclearing cross-currency payments, might en-courage Canadian financial institutions to re-examine their business case for participation.
New payment technologies
The development of low-cost Internet commu-nications has increased the commercial incen-tives for remote transactions and for makingpayments over multiple-user, open-networksystems, such as the World Wide Web. Two keyissues here are the security of payment informa-tion in these systems and authentication of theidentity of the transacting parties. Private andpublic entities, such as the major credit cardcompanies, the Canadian Payments Associa-tion, and Industry Canada, are spearheading thedevelopment of secure electronic informationand storage technologies to resolve these issues.Legislation to protect privacy and to validateelectronic documents and signatures has alsorecently been enacted.
As these technological and legal initiatives con-tinue to build, related commercial issues stillneed to be resolved. Among these are thequestions of interoperability of equipment,software, and operating standards for the
67
Policy and Infrastructure Developments
infrastructure arrangements of rival Internetpayment schemes. Also at issue is their compat-ibility with complementary services such as pay-ment, clearing, and settlement.
There are also issues regarding the legal founda-tion for new forms of electronic payment appli-cations. Principal among these is chequetruncation. Paper cheques would become digi-tized at the receiving institution so that thephysical cheque would no longer need to betransferred back to the paying institution.Hence, the cost of clearing and settlementwould decline. The technologies are now welldeveloped and available; the CPA is working ondrafting procedures and standards for digitizedcheques; and the Department of Finance hasbegun a review of legislative requirements.
Market access and competition
Many recent legislative changes and regulatoryefforts have been aimed at enhancing competi-tion and efficiency in retail payments. The pres-sure for increasingly open access to infras-tructure organizations raises questions aboutdifferential regulation among similar infrastruc-ture systems and remote access to them.
While the operators and systems of some infra-structure arrangements, such as the CPA andInterac, are regulated in various ways, manyemerging Internet payment schemes and creditcard systems are not regulated in Canada. Con-sequently, there is a question concerning theability of regulated and unregulated entities tocompete evenly in the same service markets.There is also the issue of what objectives and cri-teria are appropriate for regulation of retail pay-ments systems.
Because of legal and regulatory concerns aboutconflicts of law and regulatory authority acrosssovereign jurisdictions, remote participation—access to domestic infrastructure systems for in-stitutions located outside Canada—is prohibited.However, financial institutions in Canada alreadyacquire some transaction and clearing servicesfor card payments from organizations locatedelsewhere. Also, the emergence of Internet bank-ing provides a platform by which institutionslocated elsewhere could provide retail paymentaccounts, instruments, and services to Canadianresidents. With the resolution of the legal andregulatory concerns, remote participation in the
68
infrastructure systems for retail payments couldbecome more likely.
Conclusions
To lower costs and avoid costly disruptions inretail commercial and financial transactions, re-tail payments systems are required to operate ef-ficiently and reliably. Innovations and policychanges aimed at achieving this goal are under-way, but they raise a number of policy issues forboth the public and private sectors. Initiatives toresolve some of the significant issues describedabove are already underway, and some consid-eration of others by both private and publicsector organizations is beginning. All organ-izations involved in retail payments share thesame objective: to find the right balance be-tween the need for efficiency, necessary riskcontrols, and consumer interests that best servesthe evolving retail payments system.
References
Committee on Payment and Settlement Systems.1999. Retail Payments in Selected Countries:A Comparative Study. Basel, Switzerland:Bank for International Settlements(September).
———. 2000. Clearing and Settlement Arrange-ments for Retail Payments in SelectedCountries. Basel, Switzerland: Bank forInternational Settlements (September).
———. 2003. Policy Issues for Central Banks inRetail Payments. Basel, Switzerland: Bankfor International Settlements (March).
O’Connor, S. 2003. “Developments, Issues, andInitiatives in Retail Payments.” Bank ofCanada Review (Autumn): 23–37.
Tuer, E. 2003. “Technical Note: Elimination ofRetroactive Settlement in the ACSS.” Bankof Canada Review (Autumn): 39–42.

Research
Summaries

Financial System Review
Introduction
ank of Canada staff undertake researchdesigned to improve overall knowledge andunderstanding of the Canadian and interna-tional financial systems. This work is often
pursued from a broad, system-wide perspective thatemphasizes linkages across the different parts of thefinancial system (institutions, markets, and clearingand settlement systems). Other important linkagesmay include those between the Canadian financialsystem and the rest of the economy, as well as thosewith the international environment, including theinternational financial system. This section summa-rizes some of the Bank’s recent work.
Governance and Financial Fragility examines,from a general cross-country perspective, thechannels through which governance (broadlydefined as the rules and institutions that governeconomic activity) affects the stability of the fi-nancial system. There is a growing body of evi-dence that weak governance can contribute toperiods of volatile financial activity and, in ex-treme cases, to a financial crisis. Specific aspectsof governance that are most likely to contributeto the robustness of the financial system areidentified.
Income trusts have experienced rapid growth asan investment vehicle for Canadians over thepast several years. In Income Trusts: Understand-ing the Issues, the structure of this market isdescribed, including factors that affect the valu-ation of income trusts.
The third article, Valuation of Canadian- versusU.S.-Listed Equities: Is There a Discount? exam-ines to what extent the equity of firms listed onCanadian markets trades at a discount relativeto that of comparable firms listed on U.S. mar-kets. Although the authors present evidenceindicating that there is indeed a discount, theyconclude that further research will be requiredto fully understand its sources.
B
The Large Value Transfer System is one of Cana-da’s key clearing and settlement systems. Tosupport their payments activity in the LVTS,participants are required to pledge collateral. InExcess Collateral in the LVTS: How Much Is TooMuch? the authors develop an approach to helpdetermine whether the collateral held in theLVTS is consistent with a simple cost-minimiza-tion model. The results suggest that, in aggre-gate, this generally appears to be the case.71

Financial System Review
Governance and Financial FragilityMichael Francis*
fter a period of financial turbulenceduring the last half of the 19th and theearly 20th centuries, the world experi-enced relative stability. This was a peri-
od in which global financial markets wereheavily regulated and controlled. As Allen andGale (forthcoming) point out, reliance on suchsevere intervention came at the cost of econom-ic efficiency. The subsequent period of financialderegulation, while contributing to efficiencygains, has also revealed weaknesses in many fi-nancial markets and has coincided with a peri-od of financial instability around the globe.Authorities are consequently searching for thesources of financial fragility, in the hope ofeliminating the costs associated with financialcrisis without the burden of excessive regula-tion.1
This note examines the relationship betweengovernance (the rules and institutions that gov-ern economic activity) and financial fragility (asituation in which the willingness of creditors tofinance investment opportunities is highly sen-sitive to shocks). Drawing upon evidence fromthe literature and new empirical research, thefocus is on domestic financial markets. It is ar-gued that governance can play an importantrole in improving the stability of financial sys-tems by mitigating unnecessary fluctuations
1. That financial crises can have enormous costs is welldocumented. For example, Honohan (1997) esti-mates that just the public sector costs of resolvingbanking crises in developing countries between 1980and 1995 amounted to US$250 billion. Other privateeconomic costs include foregone investment andsocial costs.
* This note draws on a recently published Bank ofCanada working paper (Francis 2003).
A
in investment financing and reducing the likeli-hood of a systemic banking crisis.2Note that the definition of governance usedhere is much broader than that of corporategovernance alone. It is intended to capture thewider set of arrangements (i.e., rules and insti-tutions) that support economic and financialactivity.
Governing FinancialRelationships
Governance is increasingly cited as playing animportant role in determining economic out-comes.3 The reason is simple. In addition to rel-ative prices, it is the system of governance thatdetermines the set of incentives facing econom-ic agents. While the price mechanism alonecould be expected to guide agents to a good eco-nomic outcome if property rights were well de-fined and respected, these criteria may not besatisfied in many markets. This is especially truefor financial markets where there are extremeasymmetric information problems between theborrower and creditor.
From a creditor’s viewpoint, the lack of credibleinformation about the behaviour of borrowersand their intentions to repay can lead to a situ-ation in which a creditor may have no basis forbelieving that a borrower is committed to repay-ing. In such circumstances, creditors may beunwilling to supply credit to borrowers. Toovercome problems like this, societies tend todevelop rules and institutions that, amongother things, act to align the incentives for
2. This note is concerned with financial fragility.Although financial fragility is a widely used term, it isused here to describe the vulnerability of the bankingsystem to a crisis (as in Mishkin 1997) and the mag-nitude of accelerator effects as described by Bernankeand Gertler (1989).
3. See, for example, IMF (2003).
73

Research Summaries
borrowers so that they are committed to repay-ing creditors. Without a well-developed set ofrules and institutions, financial development inan economy is likely to be poor.
Clearly, governance mechanisms, ranging fromthe absence of corruption through to specificlaws such as those covering bankruptcy, canplay an important role in fostering an environ-ment where borrowers will commit themselvesto repaying creditors (La Porta et al. 1998).However, governance mechanisms such asthese have the complication of linking the pro-vision of credit to the borrowers’ commitmentto repay rather than to the returns on invest-ment.4 Consequently, the value of a firm’s as-sets and the quality of governance are importantfeatures of the financing decisions that firmstake, and, thereby, are important for determin-ing the aggregate level of credit provision andinvestment. Not surprisingly, one might alsoexpect the quality of governance to affect thedegree of financial stability.
Financial Fragility
The view that governance is important for finan-cial stability makes sense when it is acknowl-edged that if the quality of governance is poor,then the collateral value of assets determines theavailability of financing for working capital andinvestment. In such a situation, because the val-ue of a firm’s assets may depend on the expectedlevel of investment, a shock that reduces thewillingness of lenders to extend credit can leadto a vicious circle in which the reduction in in-vestment produces a fall in asset values resultingin a further reduction in the supply of credit andinvestment.5 If the view that governance is animportant factor in determining the magnitudeof these “accelerator effects” is correct, then itfollows that both financial systems and the levelof investment are less stable in countries with
4. It should be noted that the credibility of the bor-rower’s commitment to repay is conceptually differ-ent from the intrinsic risk associated with theinvestment project. The former is at the heart of themoral hazard problem and can be mitigated (at leastpartially) by appropriate governance, while gover-nance can do nothing about the latter.
5. For a theoretical development of accelerator effects infinancial markets, see Bernanke and Gertler (1989)and Kiyotaki and Moore (1997) among others.
74
relatively weak governance than in those withrelatively effective governance.
Evidence
Financial fragility is difficult to quantify. At onelevel, it can be considered as the likelihood of asystemic failure in the financial system, while ata less dramatic level, it can be considered as thesensitivity of the financial system to relativelysmall shocks. With the first measure, the mostobvious indicator of financial fragility is a sys-temic banking crisis. The most recent researchon this topic suggests that pecuniary externali-ties (e.g., the collapse in market asset pricestriggered by the failure of a borrower) are a fun-damental part of the story behind systemicbanking crises (Allen and Gale 2003). These ex-ternalities, and the associated accelerator effect,provide the mechanism through which a smallshock involving one bank can lead to a sharpdrop in asset values and, ultimately, to a system-ic collapse. More generally, however, othermeasures, such as investment volatility, mayalso provide quantifiable measures of the size ofthese accelerator effects and therefore the extentof financial fragility. In either case, by reducingthe magnitude of accelerator effects, good gov-ernance can be expected to mitigate financialfragility.
Chart 1 supports this view. The graph indicatesthat a significantly higher proportion of coun-tries with poor governance experienced a bank-ing crisis during the 1984–2001 period whencompared with those countries having a higherquality of governance—a finding that holdsacross a wide range of governance indicators.6
For example, 86 per cent of countries, whererespect for the rule of law was ranked as low,experienced banking crises during the period,whereas only 24 per cent of countries experi-enced a crisis if respect for the rule of law was re-garded as high. Interestingly, the relationship istrue not only for those measures that are likelyto be closely linked with protection of propertyrights, but also for other measures, ranging fromthe absence of corruption through to the qualityof public service (government effectiveness)and the accountability of the government to thepeople.
6. The dataset consists of 90 developing and industrial-ized countries of which 47 experienced at least onecrisis between 1984 and 2001.
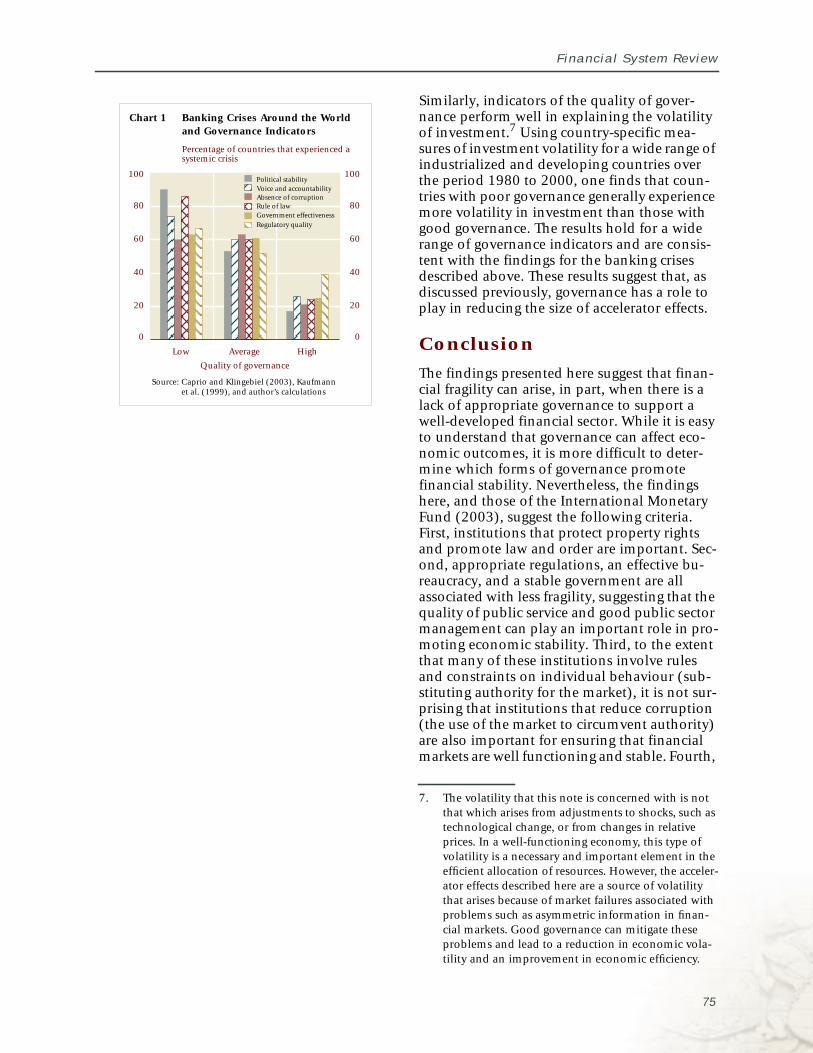
Financial System Review
Chart 1 Banking Crises Around the Worldand Governance Indicators
Percentage of countries that experienced asystemic crisis
Source: Caprio and Klingebiel (2003), Kaufmannet al. (1999), and author’s calculations
Low Average High
Quality of governance
0
20
40
60
80
100
0
20
40
60
80
100Political stabilityVoice and accountabilityAbsence of corruptionRule of lawGovernment effectivenessRegulatory quality
Similarly, indicators of the quality of gover-nance perform well in explaining the volatilityof investment.7 Using country-specific mea-sures of investment volatility for a wide range ofindustrialized and developing countries overthe period 1980 to 2000, one finds that coun-tries with poor governance generally experiencemore volatility in investment than those withgood governance. The results hold for a widerange of governance indicators and are consis-tent with the findings for the banking crisesdescribed above. These results suggest that, asdiscussed previously, governance has a role toplay in reducing the size of accelerator effects.
Conclusion
The findings presented here suggest that finan-cial fragility can arise, in part, when there is alack of appropriate governance to support awell-developed financial sector. While it is easyto understand that governance can affect eco-nomic outcomes, it is more difficult to deter-mine which forms of governance promotefinancial stability. Nevertheless, the findingshere, and those of the International MonetaryFund (2003), suggest the following criteria.First, institutions that protect property rightsand promote law and order are important. Sec-ond, appropriate regulations, an effective bu-reaucracy, and a stable government are allassociated with less fragility, suggesting that thequality of public service and good public sectormanagement can play an important role in pro-moting economic stability. Third, to the extentthat many of these institutions involve rulesand constraints on individual behaviour (sub-stituting authority for the market), it is not sur-prising that institutions that reduce corruption(the use of the market to circumvent authority)are also important for ensuring that financialmarkets are well functioning and stable. Fourth,
7. The volatility that this note is concerned with is notthat which arises from adjustments to shocks, such astechnological change, or from changes in relativeprices. In a well-functioning economy, this type ofvolatility is a necessary and important element in theefficient allocation of resources. However, the acceler-ator effects described here are a source of volatilitythat arises because of market failures associated withproblems such as asymmetric information in finan-cial markets. Good governance can mitigate theseproblems and lead to a reduction in economic vola-tility and an improvement in economic efficiency.
75
Research Summaries
it is perhaps not surprising that, given the im-portant role that governments play in regulatingand participating in financial markets, mecha-nisms that increase government accountabilityplay an important role in creating a stable finan-cial system.
From a policy perspective, the findings present-ed here suggest that financial stability aroundthe world could be improved through contin-ued attention to improving the institutional in-frastructure within which domestic financialsystems operate.
References
Allen, F. and D. Gale. 2003. “Financial Fragility,Liquidity and Asset Prices.” WorkingPaper No. 01-37-B, Wharton FinancialInstitutions Center, University ofPennsylvania.
———. Forthcoming. Understanding FinancialCrises. Chapter One. Oxford UniversityPress.
Bernanke, B. and M. Gertler. 1989. “AgencyCosts, Net Worth, and Business Fluctua-tions.” American Economic Review 79:14–31.
Caprio, G. and D. Klingebiel. 2003. “Episodesof Systemic and Borderline FinancialCrises.” World Bank Research Dataset.
Francis, M. 2003. “Governance and FinancialFragility: Evidence from a Cross-Section ofCountries.” Bank of Canada WorkingPaper No. 2003-34.
Honohan, P. 1997. “Banking System Failures inDeveloping and Transition Countries:Diagnosis and Prediction.” Bank for Inter-national Settlements Working PaperNo. 39.
International Monetary Fund. 2003. “Growthand Institutions.” IMF World EconomicOutlook (April): 95–128.
Kaufmann, D., A. Kraay, and P. Zoido-Lobatón.1999. “Governance Matters.” PolicyResearch Working Paper 2196. The WorldBank Institute.
Kiyotaki, N. and J. Moore. 1997. “CreditCycles.” The Journal of Political Economy105: 211–48.
76
La Porta, R., F. Lopez de Silanes, A. Shleifer, andR.W. Vishny. 1998. “Law and Finance.”The Journal of Political Economy 106: 1113–55.
Mishkin, F. 1997. “The Causes and Propagationof Financial Instability: Lessons for PolicyMakers.” In Maintaining Financial Stabilityin a Global Economy. Proceedings of a Sym-posium sponsored by the Federal ReserveBank of Kansas City, Jackson Hole,Wyoming.
Financial System Review
Income Trusts: Understanding the IssuesMichael R. King*
n income trust is an investment vehiclethat distributes cash generated by a setof operating assets in a tax-efficientmanner. The sharp rise of income-trust
valuations, the large supply of new issues, andthe complexity of their legal structure have ledto increased scrutiny of this asset class. To ex-plore whether the cash returns from incometrusts are in line with the risks, the structure of atypical income trust is compared with that of atypical corporate entity. The legal, regulatory,and governance issues introduced by these dif-ferences are then raised. Finally, business andmarket-related issues are discussed.
Structure and Valuation
An income trust is a special-purpose entity thatsells equity to the public in the form of unitsand uses the proceeds to purchase an operatingcompany that holds a set of income-generatingassets. Legally, income trusts are a subset of thebroader category of “mutual fund trusts” withinthe meaning of the Income Tax Act (Canada).The term “income trust” may be used broadly tocover a variety of businesses and models, or nar-rowly to refer to a segment of this asset class.Here, it refers to royalty trusts, real estate invest-ment trusts, and trusts based on various busi-nesses (also called hybrid trusts or business-income trusts).
As an asset class, income trusts have experiencedphenomenal growth over the past two years. In-come trusts had a total market capitalization of$45 billion at the end of 2002 and representedabout 6 per cent of the stock market capitaliza-tion of the Toronto Stock Exchange. This totalrepresents a dramatic rate of growth when com-pared with the $29.5 billion of total market cap-italization at year-end 2001 and $2 billion at
A
* This note summarizes a recently published Bank ofCanada working paper (King 2003).
year-end 1994. The exceptional growth of thisasset class has been driven by appreciation inthe value of outstanding income trusts, the issu-ance of units through initial public offerings,and the subsequent sale of additional units byexisting income trusts.
An income trust is designed to maximize thecash distributions from a set of revenue-generat-ing assets, with these distributions typicallypaid to unitholders on a monthly basis. Thecash distributions from an income trust aremaximized by minimizing or eliminating thecorporate tax paid by the operating companythat holds these assets. In other words, an in-come trust is a “flow-through” vehicle thatallows income to flow through it and be taxedat the investor level.
The valuation of an income trust is similar tothe valuation of any other equity security. Inves-tors discount the future stream of cash flowsthat are expected to accrue to unitholders usinga discount rate that reflects the uncertainty ofthe business and the capital structure. Threesteps are fundamental to the valuation of an in-come trust: an analysis of the distributable cash,an understanding of the capital structure, and acomparison of one income trust with others inthe same industry sector or business. To get anaccurate picture of risks and returns, existing in-come trusts must be valued relative to others inthe same industry, using multiples of cash flowthat take into account the leverage in the capitalstructure, the uncertainty of the business, andthe tax treatment of different types of distribu-tions.
Firms and investors have benefited from the de-velopment of income trusts. Firms have beenable to realize significant gains on the sale of as-sets through this market. They have thereforebeen able to raise significant amounts of capitalby selling off mature assets and either returningthe proceeds to shareholders or investing them
77
Research Summaries
in potentially more profitable growth opportu-nities. This avenue of raising capital has particu-larly benefited small firms or firms that did nothave access to Canadian equity markets onattractive terms. For their part, investors haveearned high cash returns from income trustsover the past few years—a period when Canadi-an stock markets suffered significant losses, andinterest rates declined to historically low levels.Higher cash payouts reduce the need to monitormanagement, because investors make the deci-sion on how to reinvest the earnings rather thanleaving these funds in the hands of manage-ment.
Issues Raised by IncomeTrusts
Investors should consider several issues whenvaluing an income trust. These issues can beclassified into four broad categories—legal andregulatory issues, corporate governance issues,operational issues, and market issues.
Legal and regulatory issues include the potentialpersonal liability of unitholders, the possibilityof a change in tax treatment, and the treatmentof unitholders in the event of bankruptcy. Theissue of unitholder liability is being addressedin some provinces. For example, the Ontariogovernment has introduced legislation thatwould limit the liability of Ontario-basedunitholders under the Trust Beneficiaries’ Lia-bility Act 2003 (Government of Ontario 2003).1
Hayward (2002) addresses the tax implicationsof this asset class.
While they resemble corporate entities, incometrusts fall under a different code of law with dif-ferent requirements for corporate governance.Unitholders in an income trust are representedby a trustee, whose responsibilities are laid outin a trust indenture. The assets owned by the in-come trust may be managed by full-time inter-nal managers similar to a corporation, but thistask may also be contracted to a managementcompany under a management agreement. In-vestors need to scrutinize these documents inorder to understand the staffing of these posi-tions, the incentives for the trustee and manag-ers, their compensation arrangements, and thelevel of disclosure required for factors such as
1. Passage of this legislation was delayed by the Ontarioelection.
78
potential conflicts of interest. Unitholdersshould also be aware that their legal rights aremore limited than those of shareholders in acorporate entity.
Operational issues relate to the subordinationof the unitholder’s claim on the operating assetsto secured bank loans or other debts, the sus-tainability of expected cash flows from these as-sets, and the degree of leverage in the operatingcompany’s capital structure. Not every businessmodel is viable as an income trust. For example,this structure is suited to businesses that gener-ate a steady stream of cash distributions and re-quire minimal capital expenditure to maintainthe productivity of the assets. Given the prolif-eration of income trusts in various businesssectors, investors need to question the keyassumptions regarding cash distributions toensure that these distributions are sustainablein the long run.
Finally, market issues involve the sensitivity ofincome-trust valuations to changes in the levelof interest rates, the level of risk premiums, andsecondary market liquidity. While market con-ditions have been favourable for income trustsover the past two years, the change in the exter-nal environment in the fourth quarter of 2002led to a decline in their valuation. In 2003, thewide variation in the performance of differentincome trusts reflects a greater differentiation byinvestors concerning their future prospects.
These investment issues led Standard & Poor’sto introduce a new product in 1999 called sta-bility ratings. These ratings are intended to re-flect the “sustainability and variability indistributable cash flow generation in the medi-um to long term” (Standard & Poor’s 2002). Astability rating is voluntary, and income trustsmust pay Standard & Poor’s to receive one. As ofyear-end 2002, only 25 Canadian income trustshad been rated.
Conclusion
A better understanding of the issues raised byincome trusts will allow investors to seek theappropriate return for a given level of risk. Themixed performance of this asset class over 2003suggests that income trusts are evolving andhave reached a new phase of consolidation withslower growth expected in the future.

Financial System Review
References
Government of Ontario. 2003. “The RightChoices Act (Budget Measures), 2003.”March. Photocopy. Available at <http://www.gov.on.ca/FIN/english/media/2003/bke-budbill.htm>.
Hayward, P. 2002. “Income Trusts: A ‘Tax-Efficient’ Product or the Product of TaxInefficiency?” Canadian Tax Journal 50:1529–69.
King, M. 2003. “Income Trusts—Understandingthe Issues.” Bank of Canada WorkingPaper No. 2003-25.
Standard & Poor’s. 2002. “Canadian StabilityRatings: Methodological Framework.”26 September.
79

Financial System Review
Valuation of Canadian- versus U.S.-ListedEquities: Is There a Discount?Michael R. King, Bank of Canada and Dan Segal, University of Toronto*
here is a perception that the equity ofCanadian-listed firms trades at a dis-count relative to the equity of compara-ble firms listed on exchanges in the
United States. If there are systematic differencesin valuation between Canadian and U.S. equitymarkets, Foerster and Karolyi (1999) argue thatfirms will have an incentive to adopt financingstrategies to reduce any negative effects. Suchdecisions by individual firms could affect theoverall depth and liquidity of a country’s finan-cial markets, as well as the future viability ofthose markets.
Our study tests this hypothesis by examiningthe valuation ratios assigned to the equity offirms listed in these two markets. We find thatCanadian-listed firms traded at a discount toU.S.-listed firms over the 1991–2000 period,based on a range of valuation measures. Thisdiscount exists even though the median Canadi-an-listed firm has, on average, a lower cost ofequity and higher profitability over the past de-cade than its U.S.-listed peers. Based on a com-parison of Canadian interlisted firms that reportunder both Canadian and U.S. GAAP, our studyrejects accounting differences between Canadaand the United States as the source of this dis-count.
The study focuses on book-to-market and earn-ings-to-price ratios, and finds that, in line withfinancial theory, part of the discount is ex-plained by company-specific factors, such assize, industry membership, cost of equity, andprofitability. Valuation is also affected by thecharacteristics of the market where the share islisted. A country discount persists after control-ling for company-specific and market-specificfactors. This finding is consistent with previousresearch, which suggests that Canadian and U.S.
T
* This note summarizes a recently published Bank ofCanada working paper (King and Segal 2003).
financial markets remain segmented (Doukasand Switzer 2000; Jorion and Schwartz 1986).
Methodology
The analysis uses annual company accountsdata and monthly pricing data on Canadian-and U.S.-listed firms for the period 1990 to2000. Data were provided by Standard & Poor’sCompustat and the Canadian Financial MarketsResearch Centre. The sample consists of close to10,000 firms, of which about 7 per cent are Ca-nadian-listed firms and the remainder are U.S.-listed firms. Cross-listed Canadian firms weredropped from the sample in order to focus oncountry-specific effects.
Factors Affecting Valuation
Differences in valuation for the equity of anygiven company relative to that of its peers maybe explained by company-specific, market-spe-cific, and country-specific factors. Company-specific factors include company size, industry,cost of equity, profitability, the dividend policyof a firm, and secondary-market liquidity. Mar-ket-specific variables capture differences in thefeatures of the equity markets that affect allfirms listed and traded on a given stock ex-change, such as the relative performance of theoverall stock market. Finally, country-specificfactors capture those institutional features ofthe financial markets that affect all firms listedand traded within a given jurisdiction, such asthe accounting systems used to prepare finan-cial statements.
Evidence of a CountryDiscount
To test for the existence of significant differenc-es in the valuation of Canadian- and U.S.-listedequities, we compare the valuation of firms
81
Research Summaries
listed either exclusively in Canada or in theUnited States and exclude interlisted firms. EachCanadian firm is matched with comparableU.S.-listed firms based on industry sector andthe Canadian firm’s size. The valuation of theCanadian-listed firm is then compared with themedian of its U.S.-listed counterparts based onfour valuation ratios. The valuation ratios are:book-to-market, earnings-to-price, free cashflow-to-enterprise value, and earnings beforeinterest, taxes, depreciation, and amortization(EBITDA)-to-enterprise value.
On average, the median Canadian-listed firmtraded at a discount to comparable U.S.-listedfirms across a range of valuation measures, de-spite the fact that the average Canadian-listedfirm was more profitable. The differences be-tween Canadian-listed firms and their U.S.counterparts are both statistically significantand economically important. For example, theaverage Canadian firm traded at a multiple ofbook value that was 8 per cent lower than itsU.S.-listed peers, despite having a return on eq-uity that was higher by 1.5 per cent. Canadian-listed firms had a cost of equity that was higherfrom 1991 to 1995 by as much as 2 per cent, butthey enjoyed a lower cost of equity from 1996onwards.
The Effect of Accounting
Differences in cross-border valuation may resultfrom differences between Canadian and U.S.generally accepted accounting principles(GAAP). This hypothesis is tested by consider-ing the valuation of roughly 160 Canadianfirms that interlist on a U.S. exchange. Thesefirms provide financial results under CanadianGAAP, as well as a reconciliation of financial ac-counts under U.S. GAAP. The valuation andprofitability ratios are calculated for each cross-listed Canadian company using both sets of re-sults. The comparison shows that Canadian andU.S. GAAP are close substitutes, consistent withprevious research (Bandyopadhyay, Hilton, andRichardson 2002). There is no statistical differ-ence in return on equity, return on assets, orearnings-to-price between Canadian listingsand U.S. listings. The differences in the othervaluation measures based on Canadian versusU.S. GAAP were either not economically impor-tant or showed no consistent pattern. This com-parison suggests that accounting differences do
82
not explain the discount of Canadian-listedfirms against their U.S.-listed peers.
The Effect of Market-SpecificFactors
Differences in the valuation of Canadian- andU.S.-listed firms may be due to the impact ofmarket-specific factors, such as the characteris-tics or performance of the stock exchange wherea share is listed. This hypothesis is examined us-ing a series of multivariate regressions. The de-pendent variable for these regressions is book-to-market in one specification and earnings-to-price in a second specification. Each regressionincludes company-specific variables that havebeen shown to affect valuation; namely, compa-ny size, industry sector, profitability, cost of eq-uity, and earnings retention rate. The inclusionof these variables controls for their impact sothat the contribution of market-specific factorscan be measured.
Two market-specific variables are included ineach regression. The impact of a company’sshares having greater liquidity is controlled byincluding a measure of share turnover. Differ-ences in the risk-adjusted equity returns be-tween Canada and the United States arecontrolled by including a variable that capturesany premium valuation of U.S.-listed firms thatmay be due to “irrational exuberance.” Thisvariable measures the risk-adjusted excess re-turn of each stock market, using a Sharpe ratio.The objective of this specification is to see if acountry dummy included in the regression hasany incremental power for explaining a firm’svaluation. The company-specific and market-specific variables are significant with the correctsign. More importantly, the country dummy isalso significant, despite the presence of theseother variables, and confirms that Canadian-listed firms trade at a discount to their U.S.-list-ed peers.
Conclusion
This study finds that Canadian-listed firms arenot valued as highly as their U.S.-listed peers,based on comparisons across a series of valua-tion measures. Variables such as cost of equity,secondary market liquidity, and the risk-adjust-ed return of the overall stock market did explainpart of the discount, but when these factors
Financial System Review
were controlled for, Canadian-listed firms stillexhibited a systematic discount.
These results confirm earlier studies suggestingthat Canadian and U.S. equity markets are notperfectly integrated as theory would suggest. In-vestors do not view Canadian- and U.S.-listedequities as perfect substitutes but assign a riskpremium to Canadian listings. The existence ofsystematic differences in valuation creates in-centives for Canadian firms to access U.S. equitymarkets. Given the findings of this paper, moreresearch is needed to identify the sources of thismarket segmentation.
References
Bandyopadhyay, S., A. Hilton, and G. Richardson.2002. “A Re-Examination of ReconcilingItems between Canadian and UnitedStates GAAP.” Managerial Finance 28: 37–56.
Doukas, J. and L. Switzer. 2000. “CommonStock Returns and International ListingAnnouncements: Conditional Tests of theMild Segmentation Hypothesis.” Journalof Banking and Finance 24: 471–502.
Foerster, S. and G. Karolyi. 1999. “The Effectsof Market Segmentation and InvestorRecognition on Asset Prices: Evidencefrom Foreign Stocks Listing in the UnitedStates.” Journal of Finance 54: 981–1013.
Jorion, P. and E. Schwartz. 1986. “Integrationvs. Segmentation in the Canadian StockMarket.” Journal of Finance 41: 603–14.
King, M. and D. Segal. 2003. “Valuation ofCanadian- vs. U.S.-Listed Equity: Is Therea Discount?” Bank of Canada WorkingPaper No. 2003–6.
83

Financial System Review
Excess Collateral in the LVTS: How Much IsToo Much?Kim McPhail and Anastasia Vakos*
85
anada’s Large Value Transfer System(LVTS) is the payment system used tomake large-value or time-sensitive pay-ments, on a final and irrevocable basis.
Thirteen financial institutions (and the Bank ofCanada) are direct LVTS participants. The LVTSrequires these participants to pledge to the Bankof Canada enough collateral to cover the defaultof the participant with the single largest net deb-it position. In the extremely remote event ofmultiple defaults and insufficient collateral, theBank of Canada guarantees that the LVTS willsettle. Sufficient collateral thus facilitates thesafe and continuous flow of payments through-out the day and ensures that the LVTS can com-plete settlement at the end of the day.1
Payments sent through the LVTS and receivedby each participant can vary significantly fromday to day, hour to hour, and even minute tominute. Although participants know in advancemany of the payments they will receive andsend, they cannot always synchronize theseflows. They may have to make large paymentsbefore receiving incoming funds. From time totime, they can be faced with making unexpect-edly large payments. By holding a buffer ofcollateral for LVTS purposes, participants canaccommodate all of these factors without im-peding the timely delivery of payments. A par-ticipant with sufficient collateral can also meetits clients’ payment needs on a more timely ba-sis, compared with a participant with signifi-cantly less collateral. The first participant cantherefore provide a higher level of service to itsclients.
1. For further information on the LVTS, see Box 6 onpage 29 of this Review. See also the Bank’s Web site at<http://www.bankofcanada.ca/en/payments/systems.html#value>.
* This note draws on a recent Bank of Canada workingpaper (McPhail and Vakos 2003).
C
If an LVTS participant does not minimize thecosts associated with holding and managingcollateral for LVTS purposes, excessive costscould be passed on to its clients, who could endup paying more for sending LVTS paymentsthan would be optimal. In such a case, clients ofthis financial institution may be deterred fromsending payments via the LVTS. They may in-stead choose payment systems that are not aswell protected against risk. Alternatively, theymay choose another financial service provider.If participants do not hold sufficient collateralfor LVTS purposes, one would expect to see anexcessive number of occasions when large-val-ue, time-sensitive, or systemically importantpayments are delayed because of insufficientcollateral. This would disrupt payment systemsand could inconvenience the clients of LVTSparticipants.
It is therefore interesting to consider theamount of collateral pledged to the LVTS. To ex-amine this issue, we build a theoretical modelthat generates the demand for collateral by LVTSparticipants under the assumption that theyminimize the cost of holding and managingcollateral for LVTS purposes. Our fairly simplemodel predicts that the optimal amount of col-lateral held by each LVTS participant for thispurpose depends on the opportunity cost of col-lateral, the cost of transferring collateral in andout of the LVTS, and the distribution of an LVTSparticipant’s payment flows in the system. Wecompare the predictions of our model with ac-tual levels of collateral held in the LVTS.2 Wealso estimate regressions using panel data todetermine how collateral varies in response tochanges in factors affecting the demand forcollateral.
2. Data on the payment flows and collateral for individ-ual participants are confidential.
Research Summaries
A Brief Description of theLVTS
In the first five months of 2003, an average ofabout 16,000 payments totalling about$125 billion flowed through the LVTS each day.The LVTS has two payment streams: Tranche 1(T1) and Tranche 2 (T2). T2 payments accountfor 98 per cent of payment volumes and about$110 billion per day. T1 payments account for2 per cent of volumes and about $15 billion invalue.
T2 is supported largely by intraday credit. It usescollateral so efficiently that about $110 billionin payments can be supported by only a few bil-lion dollars of collateral. Participants’ collateralrequirements for T2 payments change littlefrom one day to another. Hence, there is littleneed for participants to hold a large buffer ofcollateral for LVTS purposes to accommodatechanges in T2 collateral requirements. We there-fore focus on T1 payment flows.
T1 payments must be financed, dollar for dol-lar, by T1 funds already received or by collateral.It is therefore much more expensive in terms ofcollateral for participants to send T1 paymentsthan T2 payments. T1 payments tend to be re-served for situations in which insufficient creditis available for a payment to pass through T2risk controls.3
T1 payments averaged $15 billion per day in thefirst five months of 2003. Of these, about $7 bil-lion were sent by financial institutions, and theremainder were sent by the Bank of Canada. T1payments sent by the Bank are not collateral-ized, and so are not considered here.
We use data from February 1999 (when theLVTS began operations) up to May 2003. Overthis period, daily T1 payments sent by financialinstitutions averaged $5.7 billion.
3. For example, most payments made to the Bank ofCanada to support participants’ operations in Can-ada’s securities settlement system, CDSX, or in theforeign exchange settlement system, the CLS Bank,rely on T1. For more on these systems, see Box 6 onpage 29 of this Review.
86
A Model of the Demand forCollateral in the LVTS
The daily management of collateral by LVTSparticipants involves making sure that thecollateral required to support T1 payments willbe available promptly. For LVTS participants,having sufficient collateral for LVTS purposes isanalogous to managing an inventory to meetdemand. For collateral to be managed efficient-ly it must be managed at minimum cost. Themodel used is a simple precautionary demandfor collateral.
We assume that participants know the probabil-ity distribution of their T1 payments, but do notknow their value until the beginning of eachday. The distribution of payments is highlyskewed—on many days payments are relativelysmall, and on a few days payments are extreme-ly large.
Participants base the collateral that they pledgeto the LVTS on three factors. Each participantchooses an optimal “normal” level of collateralto hold in the LVTS. One dollar of normal col-lateral has an opportunity cost (defined as i) of5 basis points. Once payments are known, ifnormal collateral is insufficient to meet theday’s payments, the participant will bring addi-tional collateral into the system. Collateral isthen returned to its normal level at the end ofthe day. The fixed cost of increasing collateral(and of subsequently returning it to its normallevel) (defined as a) is $80. The interest fore-gone when collateral must be added to the LVTS(defined as j) is 43 basis points times the valueof the additional collateral. We assume that par-ticipants face a higher cost of collateral if thatcollateral is obtained at short notice. The bench-mark values 5 basis points, 43 basis points, and$80 are based on anecdotal evidence but, inpractice, may differ considerably among LVTSparticipants.
To minimize the expected total cost of collateral,participants balance the additional cost of hold-ing a higher normal level of collateral for LVTSpurposes against the reduction in transactionscost and the reduced need to acquire extra col-lateral at premium prices (when payments arelarge). This determines the optimal level of nor-mal collateral.
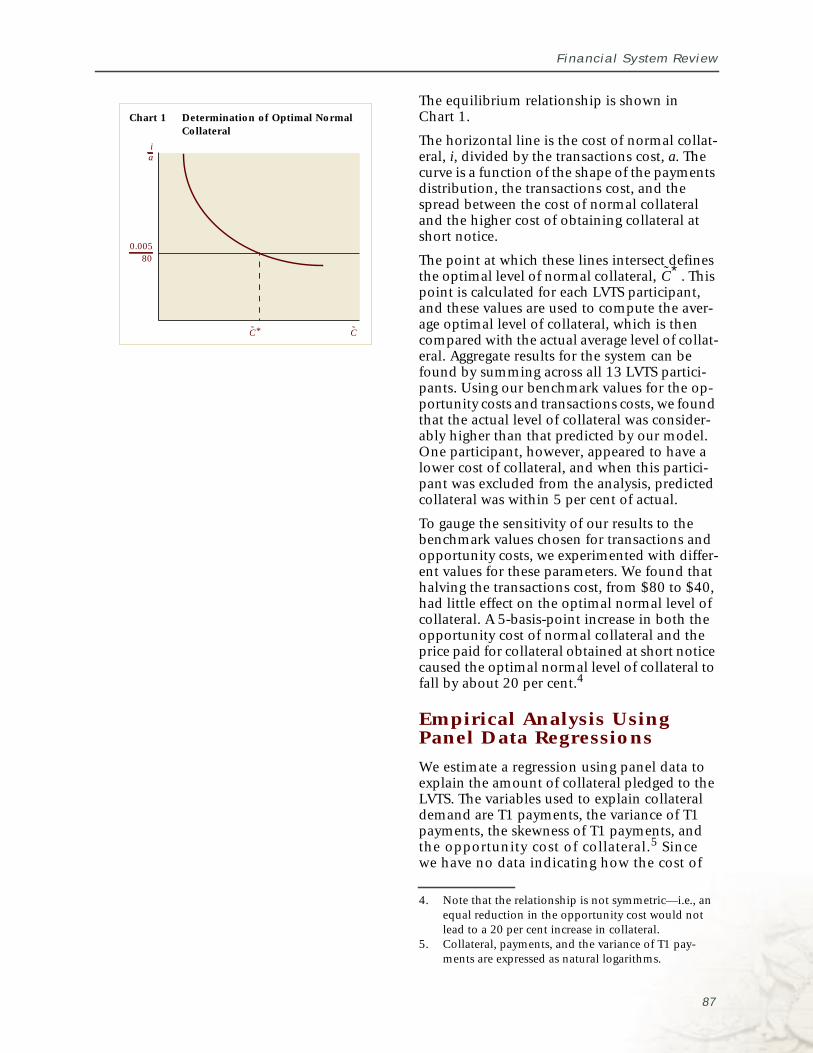
Financial System Review
Chart 1 Determination of Optimal NormalCollateral
0.005
i
80
a
*C̃ C̃
The equilibrium relationship is shown inChart 1.
The horizontal line is the cost of normal collat-eral, i, divided by the transactions cost, a. Thecurve is a function of the shape of the paymentsdistribution, the transactions cost, and thespread between the cost of normal collateraland the higher cost of obtaining collateral atshort notice.
The point at which these lines intersect definesthe optimal level of normal collateral, . Thispoint is calculated for each LVTS participant,and these values are used to compute the aver-age optimal level of collateral, which is thencompared with the actual average level of collat-eral. Aggregate results for the system can befound by summing across all 13 LVTS partici-pants. Using our benchmark values for the op-portunity costs and transactions costs, we foundthat the actual level of collateral was consider-ably higher than that predicted by our model.One participant, however, appeared to have alower cost of collateral, and when this partici-pant was excluded from the analysis, predictedcollateral was within 5 per cent of actual.
To gauge the sensitivity of our results to thebenchmark values chosen for transactions andopportunity costs, we experimented with differ-ent values for these parameters. We found thathalving the transactions cost, from $80 to $40,had little effect on the optimal normal level ofcollateral. A 5-basis-point increase in both theopportunity cost of normal collateral and theprice paid for collateral obtained at short noticecaused the optimal normal level of collateral tofall by about 20 per cent.4
Empirical Analysis UsingPanel Data Regressions
We estimate a regression using panel data toexplain the amount of collateral pledged to theLVTS. The variables used to explain collateraldemand are T1 payments, the variance of T1payments, the skewness of T1 payments, andthe opportunity cost of collateral.5 Sincewe have no data indicating how the cost of
4. Note that the relationship is not symmetric—i.e., anequal reduction in the opportunity cost would notlead to a 20 per cent increase in collateral.
5. Collateral, payments, and the variance of T1 pay-ments are expressed as natural logarithms.
C̃∗
87
Research Summaries
obtaining collateral at short notice and transac-tions costs vary over time, these variables arenot included in our regressions. We use a mov-ing 30-day backward window of the varianceand skewness of T1 payments. Our opportunitycost is based on the spread between bankers’ ac-ceptances and treasury bills. After November2001, when the list of securities eligible for useas collateral in the LVTS was expanded, we as-sume the opportunity cost of collateral to be5 basis points. The fixed effects that capture in-stitution-specific unobservable variables are in-corporated by including dummy variables inthe equations for each LVTS participant.
The regression results are in line with expecta-tions. Collateral levels vary positively with thelevel and variance of T1 payments (the skew-ness measure is not significant). The coeffi-cients, while statistically significant, arenevertheless very small. This is in line with ourtheoretical model, which predicts that normallevels of collateral held for LVTS purposesshould be sufficient to cover all but the largest10 per cent of daily T1 payments. Collateral var-ies negatively and statistically significantly withthe opportunity cost of collateral, as we wouldexpect. This effect is also quite significant eco-nomically, which is consistent with our theoret-ical model.
Conclusion
Our simple model of collateral demand, basedon benchmark values for opportunity costs andtransactions costs, explains the aggregateamount of collateral pledged to the LVTS quitewell, despite the fact that these costs may varyamong participants. We find that when we ex-clude one LVTS participant that appears to havea lower opportunity cost of collateral, aggregateactual collateral is within 5 per cent of the pre-dicted level. Our panel data regressions broadlysupport our theoretical model. Thus, in aggre-gate there does not appear to be an excessiveamount of collateral pledged in the LVTS.
Our model suggests that it is unlikely that theclients of LVTS participants would be deterredfrom using the system because participantspassed on to them the costs associated with ex-cessive levels of collateral. Our model indicatesthat for about 90 per cent of the time the “nor-mal” collateral level in the LVTS is enough tocover daily T1 payments. Occasions may
88
therefore arise when time-sensitive or systemi-cally important payments are delayed as partic-ipants try, at short notice, to obtain collateral tomeet unexpectedly large payments. These occa-sions should be rare.
This study suggests several areas for future work.First, in relation to the application of our theo-retical model, the use of Extreme Value Theory(EVT) might strengthen our results. Althoughwe have more than 1,100 observations for eachfinancial institution in our sample, relativelyfew of these lie in the tail of the payments distri-bution when payments are very large. Second,more information and a greater understandingof the opportunity costs of collateral that is ob-tained at very short notice would be helpful, be-cause this extra cost is important to explainingthe predictions of the model. Finally, our modelassumes that collateral can always be obtainedat short notice (i.e., stockouts do not occur), sothat there is no cost to LVTS participants fromdelays in making payments. In practice, partici-pants may face financial penalties or reputa-tional damage if it takes time to obtaincollateral needed to back time-sensitive pay-ments. This would suggest that participantswould choose to hold more collateral than indi-cated by the model. Including these factorswould make for a richer model.
References
McPhail, K. and A. Vakos. 2003. “Excess Collateralin the LVTS: How Much Is Too Much?” Bankof Canada Working Paper No. 2003-36.