Embed Size (px)
Citation preview
BANK OF FINLAND ARTICLES ON THE ECONOMY

Table of Contents
Public purse carried households and businesses through the COVIDcrisis 3
Public finances carried householdsand businesses through theCOVID-19 crisis24 Jun 2021 – Bank of Finland Bulletin 3/2021 – Finnish economy
Pirkka JalasjokiEconomist
Samu KärkkäinenEconomist
Juuso VanhalaSenior Adviser
A large number of firms fell into distress due to the COVID-19 pandemic and manyA large number of firms fell into distress due to the COVID-19 pandemic and manyhouseholds have been significantly affected by furloughs and lay-offs. However, the non-households have been significantly affected by furloughs and lay-offs. However, the non-financial corporations sector improved its overall profitability in 2020, and thefinancial corporations sector improved its overall profitability in 2020, and thehousehold sector as a whole accrued savings. At the same time, the general governmenthousehold sector as a whole accrued savings. At the same time, the general governmentdeficit widened. Although these developments were influenced by the substantial rise indeficit widened. Although these developments were influenced by the substantial rise ingeneral government subsidies, social benefits and other support in 2020, this alonegeneral government subsidies, social benefits and other support in 2020, this alonewould not account for the other sectors’ strengthening their financial position. Thewould not account for the other sectors’ strengthening their financial position. Thepositive developments in the household and non-financial corporations sectorspositive developments in the household and non-financial corporations sectorsnevertheless hide large differences within the sectors themselves.nevertheless hide large differences within the sectors themselves.
The COVID-19 crisis has been a major shock to the different sectors of the Finnisheconomy. The pandemic and the ensuing containment measures and uncertainty havedriven a large number of firms into distress. This has led to in a rise in furloughs andunemployment, inflicting further distress on households on top of the immediate healthconsequences of the pandemic. Yet a powerful policy response, which has includedsubsidies, a reduction in employers’ social security contributions and expanded socialbenefits, has mitigated the shock on the household and non-financial corporationssectors.
Bofbulletin.fi — Bank of Finland articles on the economy 3
In spite of the distress experienced by many households and firms, the national accountscompiled by Statistics Finland reveal that both sectors have, in aggregate, improved theirfinancial position during the pandemic. By contrast, the financial position of the generalgovernment sector has weakened. In this article, we look at the income and expenditureof these sectors in 2020 and examine whether general government carried the othersectors during the pandemic, or whether there are other reasons for why the non-financial corporations and household sectors improved their financial positions.
General government support to the household sector and non-financial corporationssector rose significantly in 2020, but this by itself does not account for the strengtheningof their financial positions. Households accumulated savings in aggregate, as privatefinal consumption expenditure fell during the COVID-19 crisis. In the non-financialcorporations sector, profits rose despite a considerable contraction in value added, asemployers’ labour costs were reduced (due to outright layoffs, furloughs and reducedsocial security payments) and firms received public subsidies. At the same time, firms cutback on their distribution of profits and investment.
Although the financial positions of the household sector and non-financial corporationssector have strengthened during the pandemic, we should stress that an analysis basedon a sectoral approach hides large discrepancies within the sectors themselves. Thepandemic shock was felt very differently by different firms and their employees indifferent industries, resulting in growing heterogeneity within the non-financial
corporations and household sectors themselves.[1]
The national accounts record the balances andinteractions of different sectors
In the national accounts, the stocks and flows of the economy are recorded on the level ofthe national economy but also on the level of institutional sectors, groups made up of
similar economic agents.[2] The main institutional sectors are the household sector, thenon-financial corporations sector and the general government sector.
In the national accounts, the real (or non-financial) accounts record activity in the realeconomy, e.g. how labour input and other factors of production are combined to producegoods, how income is distributed in the economy, and how capital is formed. Thefinancial accounts, in turn, record the financial assets and liabilities of the differentsectors of the economy and the financial transactions which determine these stocks.Income and expenditure in the real accounts determine whether a sector is a net lenderor net borrower (i.e. its budget balance or financial position), and a correspondingchange is made in the financial accounts to the sector's net assets (financial assets minusliabilities).
1. The authors wish to thank Arto Kokkinen for his feedback.
2. The compilation of the national accounts is guided by the System of National Accounts (latest version
SNA2008), an internationally agreed standard set of recommendations, and the European System of Accounts
(latest version ESA2010), which is based on EU regulation. Both frameworks define an institutional unit as an
economic entity characterised by decision-making autonomy in the exercise of its principal function and, if called
upon, the ability to compile a complete set of accounts. Institutional units are combined into groups called
institutional sectors.
Bofbulletin.fi — Bank of Finland articles on the economy 4
By analysing the real and financial accounts of different institutional sectors, we cantrack the income, expenditure, assets and liabilities of each sector and keep track of theeconomic interactions between sectors. The economy is often measured and forecast onthe basis of supply and demand items, such as through GDP. However, a sectoralapproach allows for a deeper dive into the structures and developments underpinningthe economy and can thus provide useful information for economic policymaking.Monitoring the economy like this makes it easier to identify nascent problems andimbalances, as well as causes, that would otherwise remain unnoticed at the level ofsupply and demand.
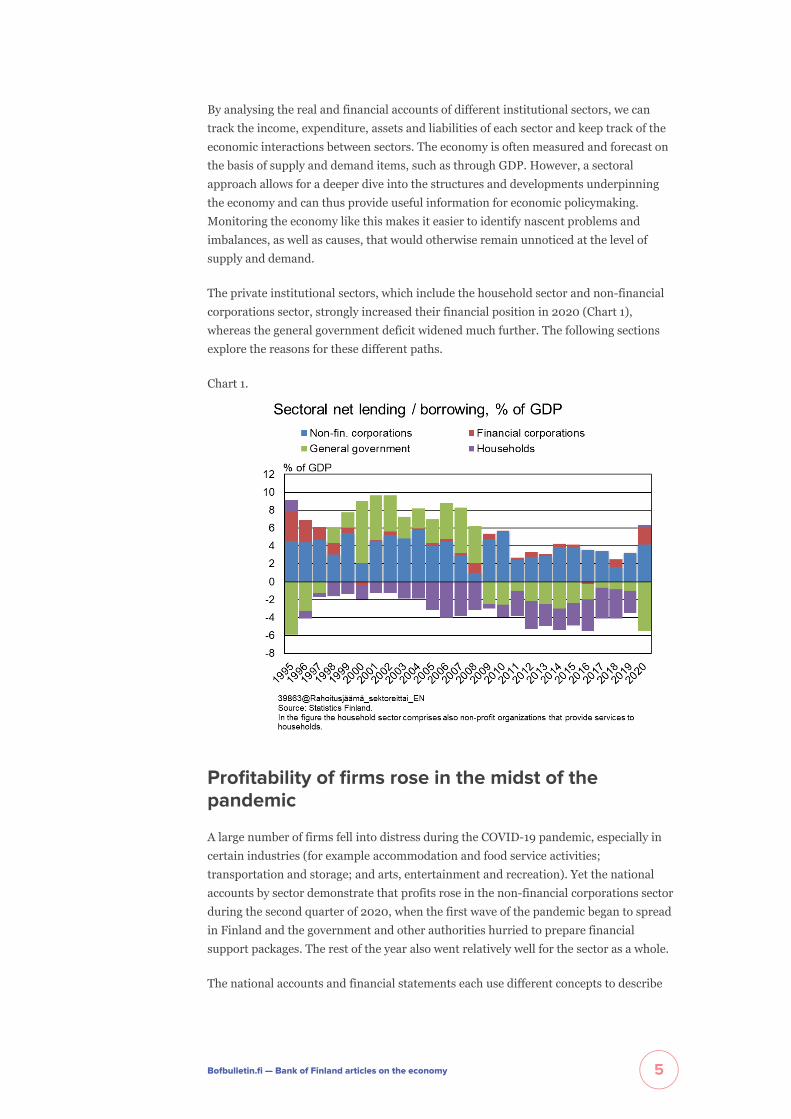
The private institutional sectors, which include the household sector and non-financialcorporations sector, strongly increased their financial position in 2020 (Chart 1),whereas the general government deficit widened much further. The following sectionsexplore the reasons for these different paths.
Chart 1.
Profitability of firms rose in the midst of thepandemic
A large number of firms fell into distress during the COVID-19 pandemic, especially incertain industries (for example accommodation and food service activities;transportation and storage; and arts, entertainment and recreation). Yet the nationalaccounts by sector demonstrate that profits rose in the non-financial corporations sectorduring the second quarter of 2020, when the first wave of the pandemic began to spreadin Finland and the government and other authorities hurried to prepare financialsupport packages. The rest of the year also went relatively well for the sector as a whole.
The national accounts and financial statements each use different concepts to describe
Bofbulletin.fi — Bank of Finland articles on the economy 5
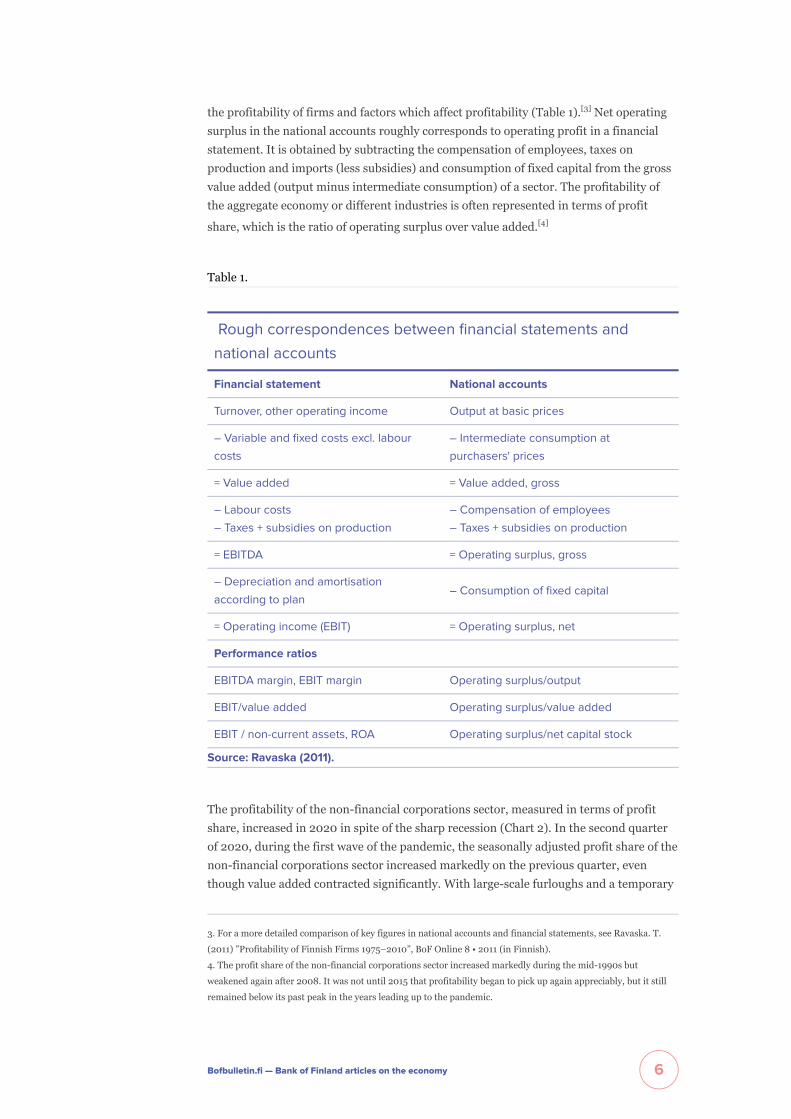
the profitability of firms and factors which affect profitability (Table 1).[3] Net operatingsurplus in the national accounts roughly corresponds to operating profit in a financialstatement. It is obtained by subtracting the compensation of employees, taxes onproduction and imports (less subsidies) and consumption of fixed capital from the grossvalue added (output minus intermediate consumption) of a sector. The profitability ofthe aggregate economy or different industries is often represented in terms of profit
share, which is the ratio of operating surplus over value added.[4]
Table 1.
Rough correspondences between financial statements and
national accounts
Financial statement National accounts
Turnover, other operating income Output at basic prices
– Variable and fixed costs excl. labour
costs
– Intermediate consumption at
purchasers' prices
= Value added = Value added, gross
– Labour costs
– Taxes + subsidies on production
– Compensation of employees
– Taxes + subsidies on production
= EBITDA = Operating surplus, gross
– Depreciation and amortisation
according to plan– Consumption of fixed capital
= Operating income (EBIT) = Operating surplus, net
Performance ratios
EBITDA margin, EBIT margin Operating surplus/output
EBIT/value added Operating surplus/value added
EBIT / non-current assets, ROA Operating surplus/net capital stock
Source: Ravaska (2011).
The profitability of the non-financial corporations sector, measured in terms of profitshare, increased in 2020 in spite of the sharp recession (Chart 2). In the second quarterof 2020, during the first wave of the pandemic, the seasonally adjusted profit share of thenon-financial corporations sector increased markedly on the previous quarter, eventhough value added contracted significantly. With large-scale furloughs and a temporary
3. For a more detailed comparison of key figures in national accounts and financial statements, see Ravaska. T.
(2011) ”Profitability of Finnish Firms 1975–2010”, BoF Online 8 • 2011 (in Finnish).
4. The profit share of the non-financial corporations sector increased markedly during the mid-1990s but
weakened again after 2008. It was not until 2015 that profitability began to pick up again appreciably, but it still
remained below its past peak in the years leading up to the pandemic.
Bofbulletin.fi — Bank of Finland articles on the economy 6
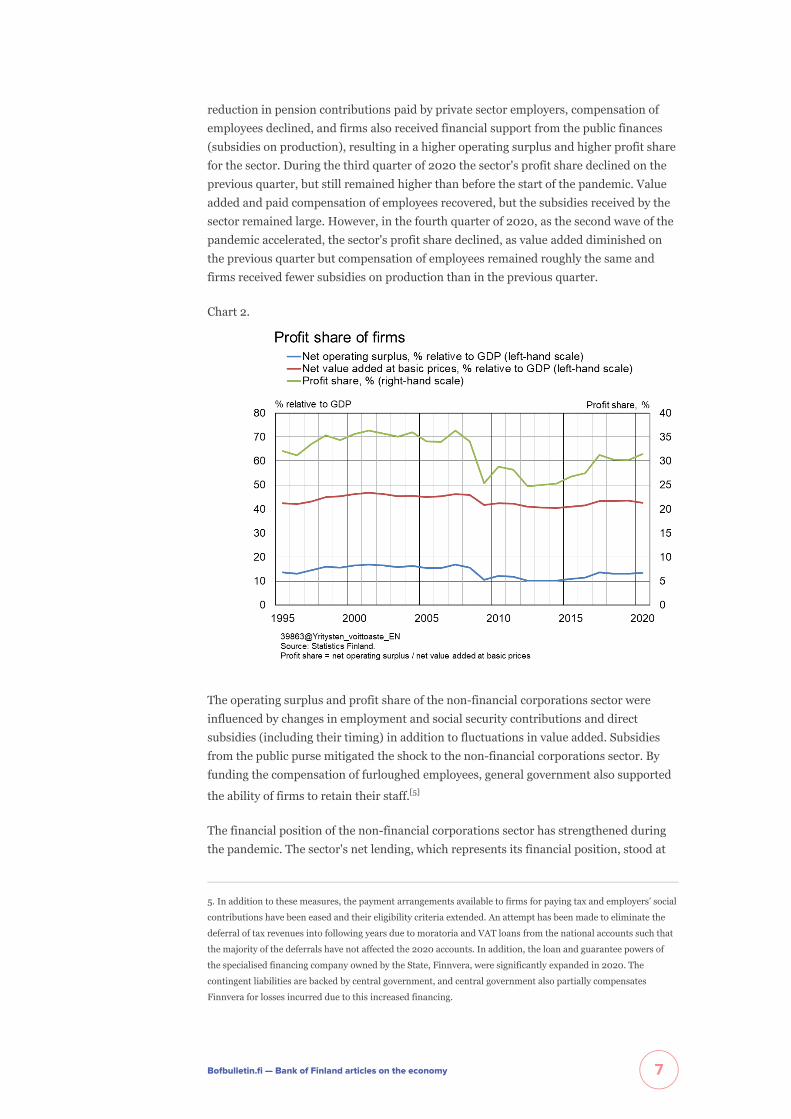
reduction in pension contributions paid by private sector employers, compensation ofemployees declined, and firms also received financial support from the public finances(subsidies on production), resulting in a higher operating surplus and higher profit sharefor the sector. During the third quarter of 2020 the sector's profit share declined on theprevious quarter, but still remained higher than before the start of the pandemic. Valueadded and paid compensation of employees recovered, but the subsidies received by thesector remained large. However, in the fourth quarter of 2020, as the second wave of thepandemic accelerated, the sector's profit share declined, as value added diminished onthe previous quarter but compensation of employees remained roughly the same andfirms received fewer subsidies on production than in the previous quarter.
Chart 2.
The operating surplus and profit share of the non-financial corporations sector wereinfluenced by changes in employment and social security contributions and directsubsidies (including their timing) in addition to fluctuations in value added. Subsidiesfrom the public purse mitigated the shock to the non-financial corporations sector. Byfunding the compensation of furloughed employees, general government also supported
the ability of firms to retain their staff.[5]
The financial position of the non-financial corporations sector has strengthened duringthe pandemic. The sector's net lending, which represents its financial position, stood at
5. In addition to these measures, the payment arrangements available to firms for paying tax and employers’ social
contributions have been eased and their eligibility criteria extended. An attempt has been made to eliminate the
deferral of tax revenues into following years due to moratoria and VAT loans from the national accounts such that
the majority of the deferrals have not affected the 2020 accounts. In addition, the loan and guarantee powers of
the specialised financing company owned by the State, Finnvera, were significantly expanded in 2020. The
contingent liabilities are backed by central government, and central government also partially compensates
Finnvera for losses incurred due to this increased financing.
Bofbulletin.fi — Bank of Finland articles on the economy 7
4.2% relative to GDP in 2020, its highest rate since 2010. As a result, the sector's almost30-year streak as a net lender remained unbroken.
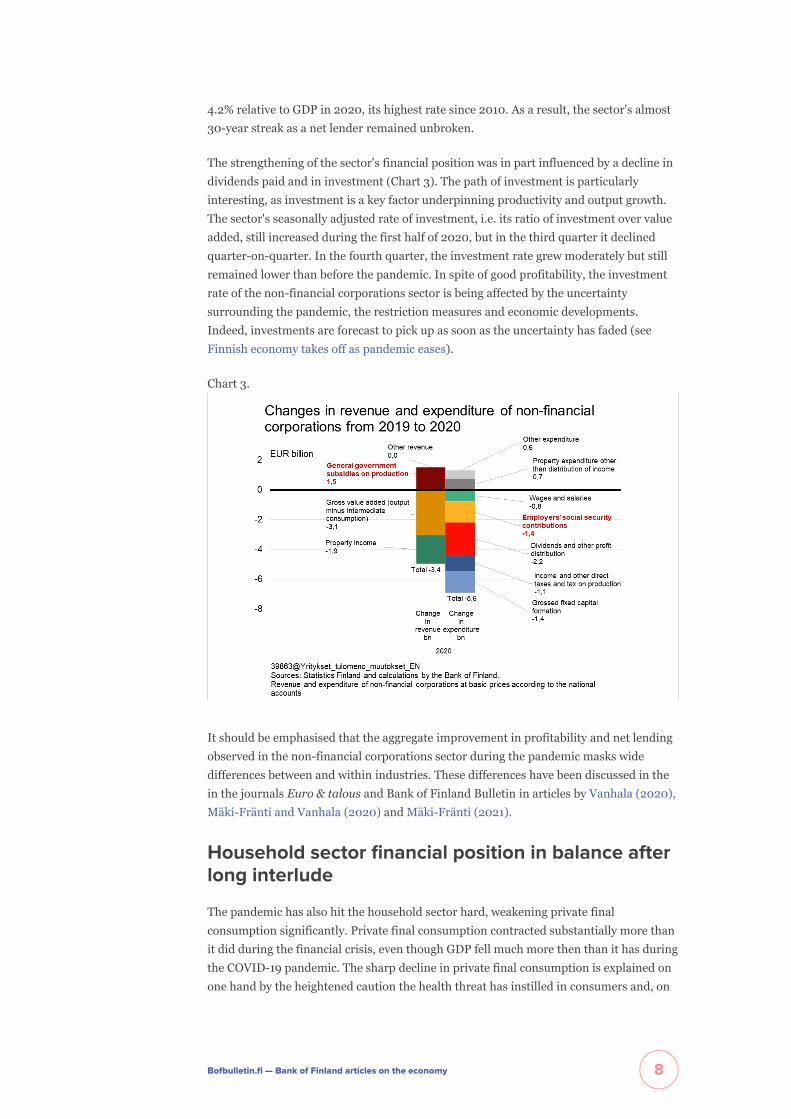
The strengthening of the sector's financial position was in part influenced by a decline individends paid and in investment (Chart 3). The path of investment is particularlyinteresting, as investment is a key factor underpinning productivity and output growth.The sector's seasonally adjusted rate of investment, i.e. its ratio of investment over valueadded, still increased during the first half of 2020, but in the third quarter it declinedquarter-on-quarter. In the fourth quarter, the investment rate grew moderately but stillremained lower than before the pandemic. In spite of good profitability, the investmentrate of the non-financial corporations sector is being affected by the uncertaintysurrounding the pandemic, the restriction measures and economic developments.Indeed, investments are forecast to pick up as soon as the uncertainty has faded (seeFinnish economy takes off as pandemic eases).
Chart 3.
It should be emphasised that the aggregate improvement in profitability and net lendingobserved in the non-financial corporations sector during the pandemic masks widedifferences between and within industries. These differences have been discussed in thein the journals Euro & talous and Bank of Finland Bulletin in articles by Vanhala (2020),Mäki-Fränti and Vanhala (2020) and Mäki-Fränti (2021).
Household sector financial position in balance afterlong interlude
The pandemic has also hit the household sector hard, weakening private finalconsumption significantly. Private final consumption contracted substantially more thanit did during the financial crisis, even though GDP fell much more then than it has duringthe COVID-19 pandemic. The sharp decline in private final consumption is explained onone hand by the heightened caution the health threat has instilled in consumers and, on
Bofbulletin.fi — Bank of Finland articles on the economy 8
the other hand, the restriction measures put in place to prevent the spread of the virusand the constraints these have put on spending opportunities.
Household disposable income increased in 2020 in spite of the pandemic. Becausehousehold final consumption expenditure declined at the same time, the householdsector has accumulated savings. Household savings are defined as the difference betweendisposable income and final consumption expenditure. The savings rate, in turn, is theratio of savings over disposable income. The net savings rate takes into account thedepreciation of capital owned by households.
The savings rate is one of the key indicators for the household sector. The net savings ofthe household sector describes the amount of real and financial assets households canacquire without accumulating debt. Households can use their acquired assets to smoothout their final consumption, for example when disposable income is low because of aspell of unemployment. Final consumption smoothing is important for how suddenshocks, such as the COVID-19 pandemic, are transmitted to the economy. Finally, thesavings of the household sector comprise a large share of the aggregate national savings.If there are not enough national savings to satisfy domestic investment demand,investment will be partly funded from abroad. This, in turn, has an impact on theeconomy's net international investment position.
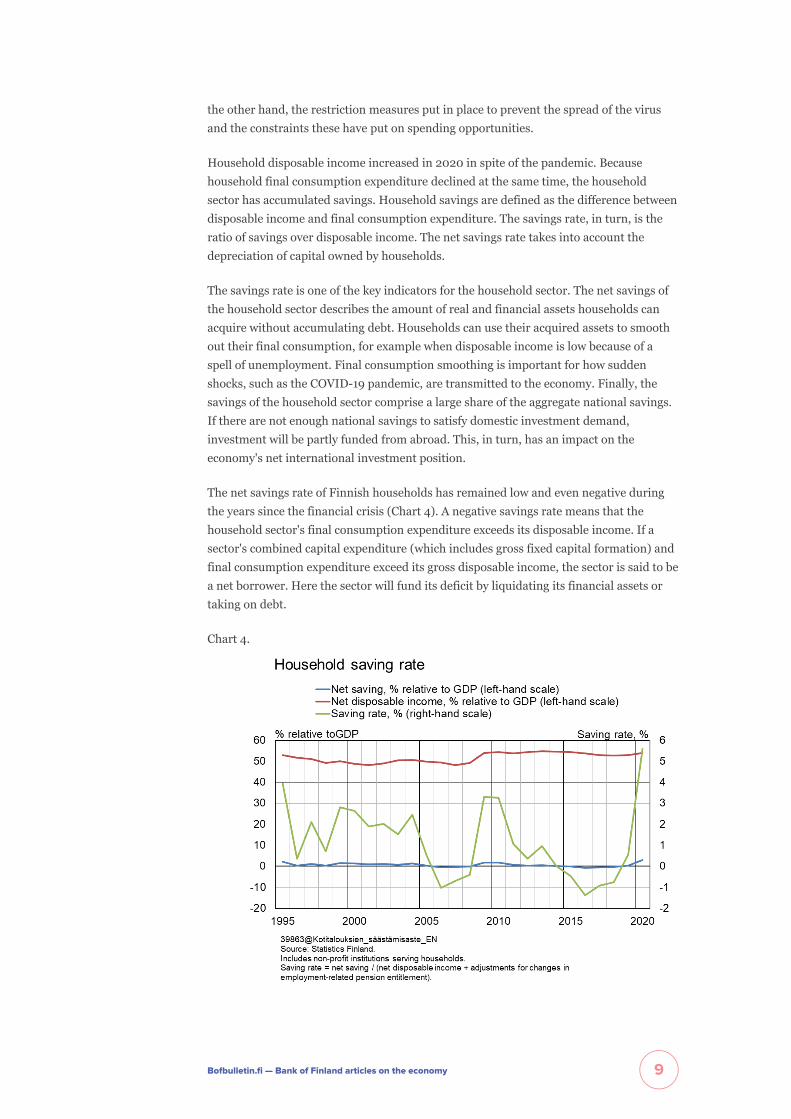
The net savings rate of Finnish households has remained low and even negative duringthe years since the financial crisis (Chart 4). A negative savings rate means that thehousehold sector's final consumption expenditure exceeds its disposable income. If asector's combined capital expenditure (which includes gross fixed capital formation) andfinal consumption expenditure exceed its gross disposable income, the sector is said to bea net borrower. Here the sector will fund its deficit by liquidating its financial assets ortaking on debt.
Chart 4.
Bofbulletin.fi — Bank of Finland articles on the economy 9
The COVID-19 crisis has significantly reshaped the savings behaviour of the householdsector. The sector’s net savings rate rose to almost 6% in 2020, whereas during2010–2019 it remained close to zero (0.3% on average). The main factor underpinningthe strong rise in the savings rate has been the fall in final consumption expenditure. Theother determinant of the net savings rate, i.e. the household sector's net disposableincome, has evolved much more smoothly during the COVID-19 crisis than finalconsumption expenditure. The household sector's net disposable income relative to GDPeven increased in 2020. This is because GDP has contracted, whereas disposablehousehold income has increased slightly.
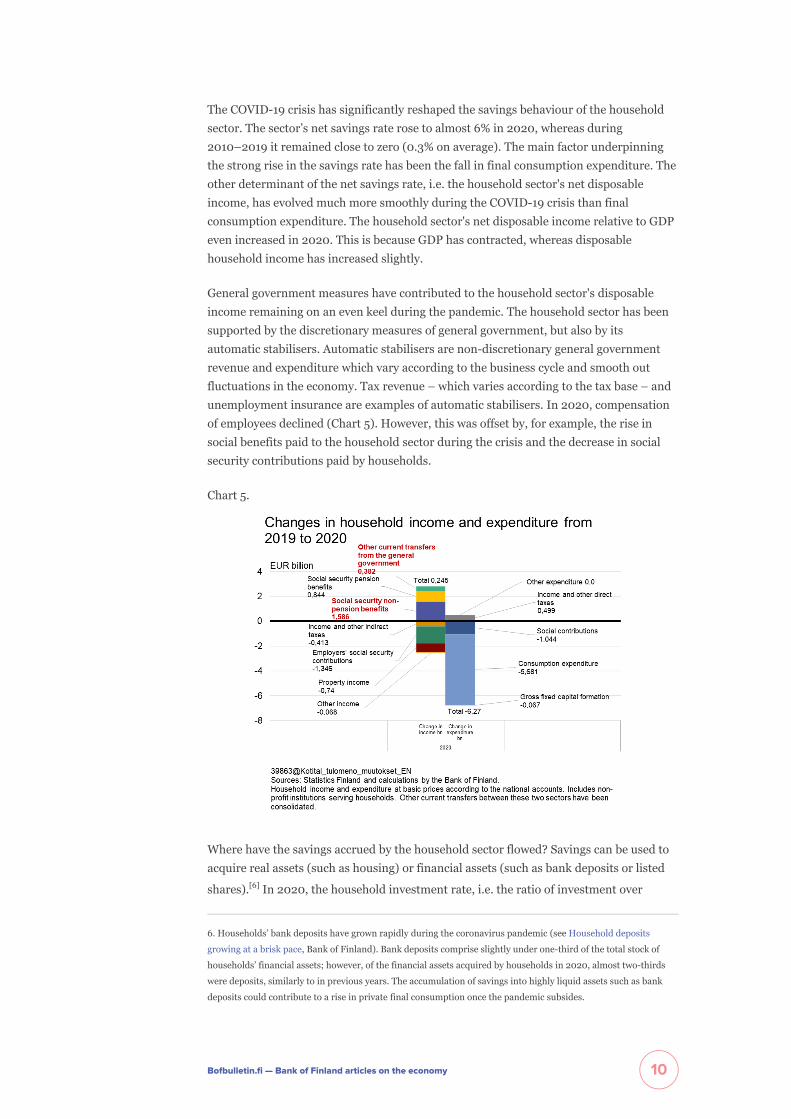
General government measures have contributed to the household sector's disposableincome remaining on an even keel during the pandemic. The household sector has beensupported by the discretionary measures of general government, but also by itsautomatic stabilisers. Automatic stabilisers are non-discretionary general governmentrevenue and expenditure which vary according to the business cycle and smooth outfluctuations in the economy. Tax revenue – which varies according to the tax base – andunemployment insurance are examples of automatic stabilisers. In 2020, compensationof employees declined (Chart 5). However, this was offset by, for example, the rise insocial benefits paid to the household sector during the crisis and the decrease in socialsecurity contributions paid by households.
Chart 5.
Where have the savings accrued by the household sector flowed? Savings can be used toacquire real assets (such as housing) or financial assets (such as bank deposits or listed
shares).[6] In 2020, the household investment rate, i.e. the ratio of investment over
6. Households’ bank deposits have grown rapidly during the coronavirus pandemic (see Household deposits
growing at a brisk pace, Bank of Finland). Bank deposits comprise slightly under one-third of the total stock of
households’ financial assets; however, of the financial assets acquired by households in 2020, almost two-thirds
were deposits, similarly to in previous years. The accumulation of savings into highly liquid assets such as bank
deposits could contribute to a rise in private final consumption once the pandemic subsides.
Bofbulletin.fi — Bank of Finland articles on the economy 10
disposable income, declined only slightly. What is significant is that the household sectorwas a net lender in 2020, albeit only just, for the first time since the end of the 1990s.The sector's financial position being close to balance suggests that, according to the realaccounts, households’ savings have flowed into real assets without a significant increasein debt.
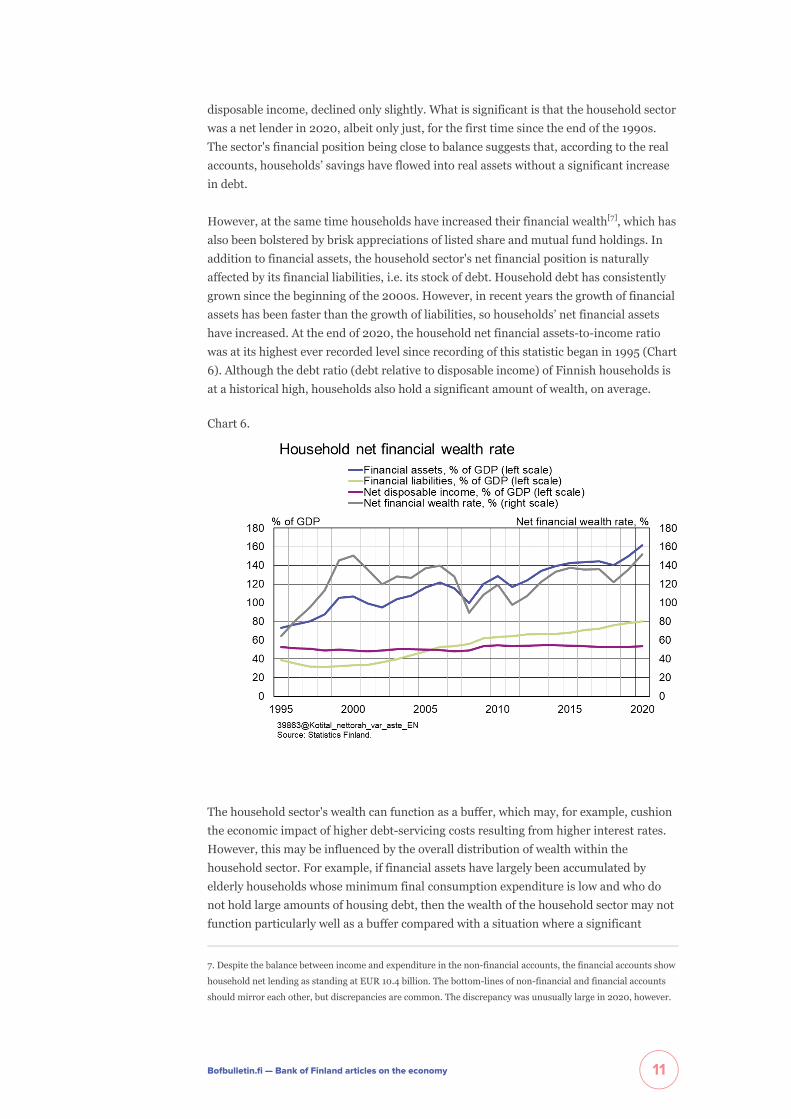
However, at the same time households have increased their financial wealth[7], which hasalso been bolstered by brisk appreciations of listed share and mutual fund holdings. Inaddition to financial assets, the household sector's net financial position is naturallyaffected by its financial liabilities, i.e. its stock of debt. Household debt has consistentlygrown since the beginning of the 2000s. However, in recent years the growth of financialassets has been faster than the growth of liabilities, so households’ net financial assetshave increased. At the end of 2020, the household net financial assets-to-income ratiowas at its highest ever recorded level since recording of this statistic began in 1995 (Chart6). Although the debt ratio (debt relative to disposable income) of Finnish households isat a historical high, households also hold a significant amount of wealth, on average.
Chart 6.
The household sector's wealth can function as a buffer, which may, for example, cushionthe economic impact of higher debt-servicing costs resulting from higher interest rates.However, this may be influenced by the overall distribution of wealth within thehousehold sector. For example, if financial assets have largely been accumulated byelderly households whose minimum final consumption expenditure is low and who donot hold large amounts of housing debt, then the wealth of the household sector may notfunction particularly well as a buffer compared with a situation where a significant
7. Despite the balance between income and expenditure in the non-financial accounts, the financial accounts show
household net lending as standing at EUR 10.4 billion. The bottom-lines of non-financial and financial accounts
should mirror each other, but discrepancies are common. The discrepancy was unusually large in 2020, however.
Bofbulletin.fi — Bank of Finland articles on the economy 11
portion of wealth was also held by households susceptible to, say, fluctuations in theinterest rates on housing loans. This sort of heterogeneity among households, whichpotentially has significant macroeconomic effects, is lost at the institutional sector level.The distribution of wealth among Finnish households in discussed in Bank of FinlandBulletin Mäki-Fränti (2019).
General government expenditure rose sharply
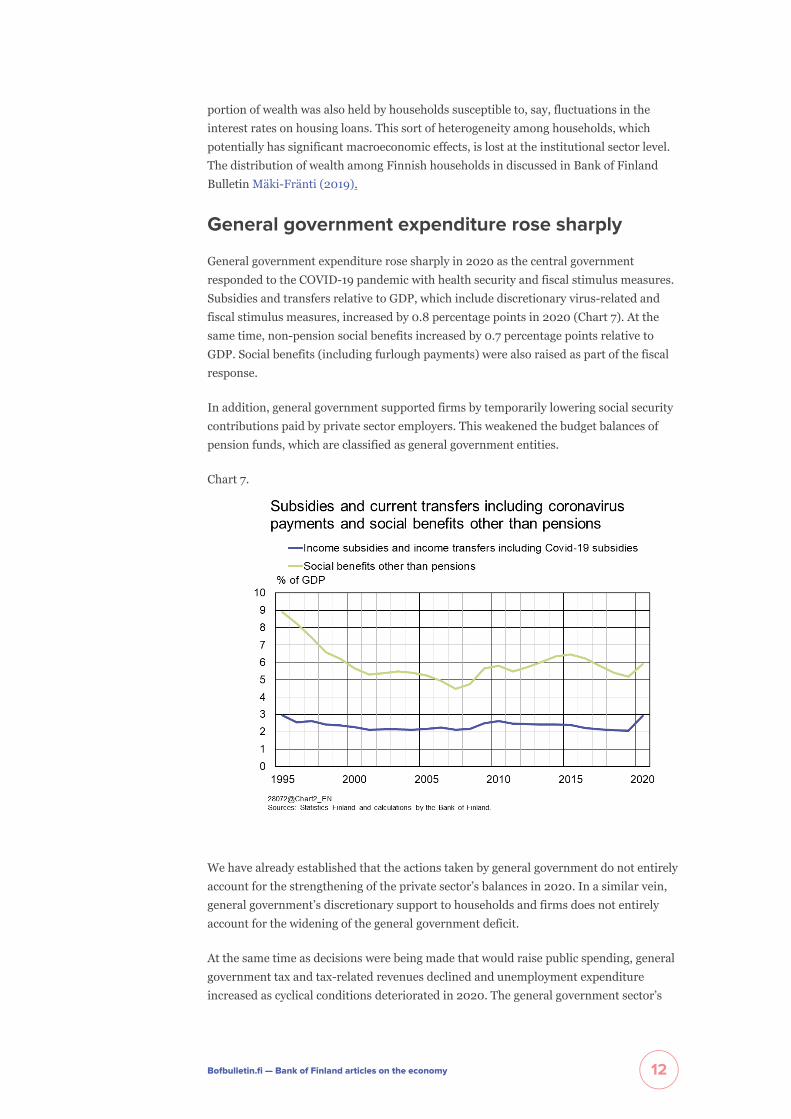
General government expenditure rose sharply in 2020 as the central governmentresponded to the COVID-19 pandemic with health security and fiscal stimulus measures.Subsidies and transfers relative to GDP, which include discretionary virus-related andfiscal stimulus measures, increased by 0.8 percentage points in 2020 (Chart 7). At thesame time, non-pension social benefits increased by 0.7 percentage points relative toGDP. Social benefits (including furlough payments) were also raised as part of the fiscalresponse.
In addition, general government supported firms by temporarily lowering social securitycontributions paid by private sector employers. This weakened the budget balances ofpension funds, which are classified as general government entities.
Chart 7.
We have already established that the actions taken by general government do not entirelyaccount for the strengthening of the private sector’s balances in 2020. In a similar vein,general government’s discretionary support to households and firms does not entirelyaccount for the widening of the general government deficit.
At the same time as decisions were being made that would raise public spending, generalgovernment tax and tax-related revenues declined and unemployment expenditureincreased as cyclical conditions deteriorated in 2020. The general government sector’s
Bofbulletin.fi — Bank of Finland articles on the economy 12
consolidated total revenue contracted on the previous year by one percentage pointrelative to GDP, while total expenditure increased by 3.4 percentage points relative toGDP. Of the widening of the general government deficit in 2020, about 60% can betraced to discretionary measures, while the remainder is the result of automatic
stabilisers.[8] The resulting deficit-to-GDP ratio reached its highest level since thedepression of the 1990s. Central government in particular carried the burden; its budgetwas severely in deficit in 2020.
Prerequisites exist for growth in private finalconsumption and investment
The pandemic and associated restriction measures and uncertainty have disrupted theactivities of a large number of firms and eroded the incomes of many households. Thehealth security and fiscal stimulus measures implemented by general government havemitigated the impact of the pandemic on the non-financial corporations sector and thehousehold sector.
In spite of the COVID-19 pandemic and the disruption caused to many firms, the non-financial corporations sector improved its profitability and financial position in 2020.While the value added created by the sector decreased, compensation of employeesdeclined and firms received public financial support. And, although the sector’s profitshare ultimately increased, its dividend payments shrunk. At the same time, theinvestment rate declined less than had been feared. Better profitability and a strongerfinancial position are creating the conditions for investment growth in the coming years,as soon as the pandemic recedes and the fading of uncertainty improves the outlook for
production. Recent survey data also suggest a recovery in investment.[9] The non-financial corporations sector has remained a net lender for almost three decades, whichmeans that the sector has been able to fund its investment with its operating income. TheBank of Finland’s forecast of strong gross value added growth suggests that reducingfiscal support as the pandemic recedes will not give rise to a surge in bankruptcies.
On the back of the COVID-19 pandemic, the Finnish household sector was a net lender in2020, for the first time since the mid-1990s. The general government sector has in partcontributed to the household sector’s stronger financial position by supporting thedisposable income of households. Yet the main reason for why the sector’s financialposition has become balanced is that households have significantly reduced their finalconsumption expenditure due to the pandemic. With final consumption havingcontracted but disposable income remaining broadly the same, households have accrueda significant amount of savings. It is forecast that the savings rate will return to its pre-pandemic levels, and this will support growth in final consumption. In addition, ifhouseholds spend the savings they have accrued during the COVID-19 crisis on finalconsumption, this might further boost the Finnish economy’s recovery from the
8. This estimate is based on the European System of Central Banks' methodology for calculating the cyclically
adjusted general government balance and the Bank of Finland's June 2021 forecast.
9. Investment survey conducted by the Confederation of Finnish Industry and Employers, January 2021; Report
on the impact of the COVID-19 crisis on Finnish SMEs, Finnish Industry Investment Ltd; April 2021. In Finnish
only.
Bofbulletin.fi — Bank of Finland articles on the economy 13
recession caused by the pandemic.
The figures in the national accounts are designed to reflect sectors in aggregate termsand not provide a full sweep of heterogeneity among households and firms. These figuresstill offer valuable insight into trends in the macroeconomy, the structure of the economyand the interactions between sectors. This information can be used e.g. as backgroundinformation in economic policymaking and as a support for economic forecasting.
Tags
companies/firms, COVID-19, COVID-19 pandemic, households, national accounts,public finances
Bofbulletin.fi — Bank of Finland articles on the economy 14