Embed Size (px)
Citation preview
Bank of Sierra Leone
Annual Reportand
Statement of Accountsfor year ended 31st December 2016

TABLE OF CONTENT
List of Tables............................................................................................................................. ivList of Figures............................................................................................................................ vAbbreviations............................................................................................................................ viForeword by the Governor........................................................................................................ 7Board of Directors, as at 31st December 2016........................................................................... 9Management of the BSL as at 31st December 2016.................................................................... 10Bank of Sierra Leone Organiational Structure 2016....................................................................... 12Vision Statement, Mission Statement and Mandate of the Bank................................................... 13
1.0 GOVERNANCE........................................................................................................ 141.1 The Board of Directors................................................................................................. 141.1.1 Functions of the Board.................................................................................................. 141.2 The Monetary Policy Committee................................................................................... 15
2.0 DEVELOPMENTS IN THE GLOBAL ECONOMY................................................ 162.1 Global Output Growth.................................................................................................. 162.2 Advanced Economies................................................................................................... 162.3 Emerging Market and Developing Economies................................................................ 162.4 Sub-Saharan Africa...................................................................................................... 172.5 Global Inflation............................................................................................................ 172.6 Commodity Prices........................................................................................................ 182.6.1 Crude Oil………………………………………………….……………………….... 182.6.2 Iron Ore…………………………………………………..………………………..... 19
3.0 DEVELOPMENTS IN THE SIERRA LEONE ECONOMY................................... 193.1 Economic Growth.......................................................................................................... 193.1.1 Agriculture……………………………………………………………………............. 203.1.2 Manufacturing…………………………………………………………………............ 203.1.3 Construction…………………………………..…………………………….…........... 203.1.4 Mining………………………………………………………………………............... 213.1.5 Electricity Generation…………………………………………………………............. 213.1.6 Tourism………………………………………..…………….……………….…......... 223.2 Price Development.………............................................................................................ 223.3 Fiscal Policy and Government Budgetary Operations...................................................... 243.3.1 Government Revenue…………………………….........……………………….….…. 243.3.2 Government Expenditure…………………………..…………………….……............ 273.3.3 Budget Deficit and Financing…………………………………………………............. 27
4.0 MONETARY DEVELOPMENTS.............................................................................. 284.1 Monetary Policy Stance and Challenges.......................................................................... 284.2 Developments in Monetary Aggregates........................................................................... 284.3 Interest Rates................................................................................................................. 294.4 Developments in Government securities Market............................................................... 30
ii
5.0 EXTERNAL SECTOR DEVELOPMENTS 335.1 Overview of the External Sector...................................................................................... 335.2 Exports......................................................................................................................... 335.3 Imports......................................................................................................................... 35
6.0 DEVELOPMENTS IN THE FOREIGN EXCHANGE MARKET 356.1 Overview....................................................................................................................... 356.2 Foreign Exchange Flows............................................................................................... 366.3 Purchases and sales of foreign exchange by commercial banks........................................ 366.4 Receipts into and Payments from Customers Foreign Currency (CFC) accounts............. 366.5 Foreign Exchange Auction.............................................................................................. 376.6 Sectorial Distribution of Auction Funds........................................................................... 376.7 Foreign Exchange Rate Movements.............................................................................. 386.8 Reserves Management................................................................................................... 396.8.1 Foreign Exchange Assets……………………………………………………………... 396.8.2 Investment Activities………………………………………………..…….................. 426.8.3 Foreign Currency Management……………………………...……………….............. 436.9 External Debt............................................................................................................... 43
7.0 THE ECOWAS MACROECONOMIC CONVERGENCE 447.1 Sierra Leone's Performance under the Rationalized ECOWAS Convergence Criteria.... 45
8.0 FINANCIAL SECTOR DEVELOPMENTS 468.1 Structure of the Financial Sector..................................................................................... 468.1.1 Commercial Banks…………………………………………………………………… 468.2 Community Banks......................................................................................................... 478.3 Discount Houses.......................................................................................................... 558.4 Foreign Exchange Bureaux............................................................................................ 558.5 Microfinance Institutions (MFIs).................................................................................... 608.5.1 Deposit-Taking Microfinance Institutions…………………………………………....... 608.5.2 Credit-Only Microfinance Institutions (COMFIs)……………...………………….......... 608.5.3 Operating Performance……………………………………………….……………... 618.6 Anti-Money Laundering/Combating the Finance of Terrorism (AML/CFT)……………. 628.7 Customer complaints and investigations………………………………………….......... 628.8 Regulatory Framework…………………………………………................................. 62
9.0 HUMAN RESOURCES DEVELOPMENTS 669.1 Staff Strength…………………………………………................................................ 669.2 Severance………………………………………….................................................... 669.3 Training - 2016………………………………………….............................................. 67
iii
LIST OF TABLES
Table 1: Meetings of the Bank of Sierra Leone Board................................................................ 15
Table 2: Committees and Membership of the Board.................................................................. 15
Table 3: Global Growth............................................................................................................ 17
Table 4: Global Inflation........................................................................................................... 17
Table 5: GDP Growth Rates by Sector...................................................................................... 19
Table 6: Government Fiscal Operation....................................................................................... 26
Table 7: Stock of Marketable Government Securities Outstanding by Holder (in Millions of Leones)..... 32
Table 8: International Trade and Reserves (US Dollars)............................................................. 34
Table 9: Bank of Sierra Leone Foreign Exchange Cash Flow (2015 & 2016 Inflows)................ 40
Table 10: Bank of Sierra Leone Foreign Exchange Cash Flow (2015 & 2016 outflows)............. 41
Table 11: Currencies Holdings by the Bank of Sierra Leone at End Dec 2015 & 2016............... 43
Table 12: Status of Macroeconomic Convergence in Sierra Leone............................................. 45
Table 13: The Number of account holders in the Banking system as at 31st December, 2016..... 46
Table 14: Number of Commercial Bank Branches as at 31st December, 2016........................... 47
Table 15: Selected Financial Soundness Indicators..................................................................... 52
Table 16: Consolidated Balance Sheet of the Community Banks Assets and Liabilities................ 53
Table 17: Community Banks operating in Sierra Leone in 2016.................................................. 55
Table 18: Consolidated Balance Sheet of Discount Houses as at 31st December 2016............... 56
Table 19: Consolidated Foreign Exchange Bureau Transaction................................................... 57
Table 20: Licensed Foreign Exchange Bureaux and their Branches in Sierra Leone (31/12/16).... 57
Table 21: Credit -only microfinance institutions as at 31st December 2016................................. 60
Table 22: The pre-tax profit/loss position of COMFIs at end December 2016............................ 61
Table 23: Portfolio, Financial and Non-Financial Information as at end December 2016............. 61
Table 24 Other Components of Liabilities.................................................................................. 62
Table 25: Dec 2016 Sectorial Distribution of Gross Loans and Advances................................... 63Table 26: Consolidated Profit and Loss Account for the Banking Industry (Unaudited) for the end
period 31st December 2016...................................................................................... 63
Table 27:Consolidated Balance Sheet of Banking System as at 31st December 2016 ( Asset).. 64
Table 28 Consolidated Balance Sheet of Banking System as at 31st December 2016 (Liabilities).64
Table 29: Financial Performance Indicators of the Banking System ............................................ 65
Table 30 Staff Strength as at December 2016........................................................................... 66
Table 31: Severance................................................................................................................. 66iv
LIST OF FIGURES
Figure 1: Crude Oil Prices........................................................................................................ 18Figure 2: Iron Ore Price............................................................................................................ 19Figure 3: Percentage Contributions to GDP by Sector 2016...................................................... 20Figure 4: Monthly Electricity Generation.................................................................................... 21Figure 5: Tourists Arrival by Country of Origin........................................................................... 22Figure 6: Tourists Arrival by Purpose......................................................................................... 22Figure 7: Trends in Headline, Food and Non-Food Inflation....................................................... 23Figure 8: Contribution of main components to Annual Inflation................................................... 23Figure 9: Headline and Core Inflation........................................................................................ 24Figure 10: Trends in Revenue, Expenditure & Budget Deficit...................................................... 25Figure 11a: Expenditure Disaggregation in 2015......................................................................... 27Figure 11b: Expenditure Disaggregation in 2016.......................................................................... 27Figure 12: Trend in the Yields of Government Securities in the Primary and Secondary Markets 30Figure 13: Stock of Government Securities by Tenure.............................................................. 31Figure 14: Holdings of Government Securities by Sector (In Billions of Leones) 31Figure 15: External Trade, 2016................................................................................................ 33Figure 16: Composition of Imports 2016................................................................................... 35Figure 17: Commercial Banks Purchases and Sales of Foreign exchange.................................... 36Figure 18: Receipt into Payment from CFC Account.................................................................. 37Figure 19: Demand and Supply in the Auction (USD 000).......................................................... 37Figure 20: Sectorial Distribution of Auction Funds January- December 2016............................... 38Figure 21: Exchange Rate Depreciation (y-o-y).......................................................................... 38Figure 22: Exchange Rates Spread as per Market Segments...................................................... 39Figure 23: Gross Foreign Reserves............................................................................................ 39Figure 24: Actual Investments Income by Currencies, converted in US Dollars........................... 42Figure 25: Actual Investments Income by Currencies, converted in US Dollars........................... 42Figure 26: Percentage composition of external debt.................................................................... 44Figure 27: Asset Base of Commercial Banks (%) as at 31st Dec 2016....................................... 47Figure 28: Sectorial Distribution of Loans and Advances as at end December 2016.................... 48Figure 29: Growth of Key Financial Indicators........................................................................... 49Figure 30: Total Income for the Banking Sector (December 2016)............................................. 50Figure 31: Total Expenditure for the Banking Sector (December 2016)....................................... 50
v
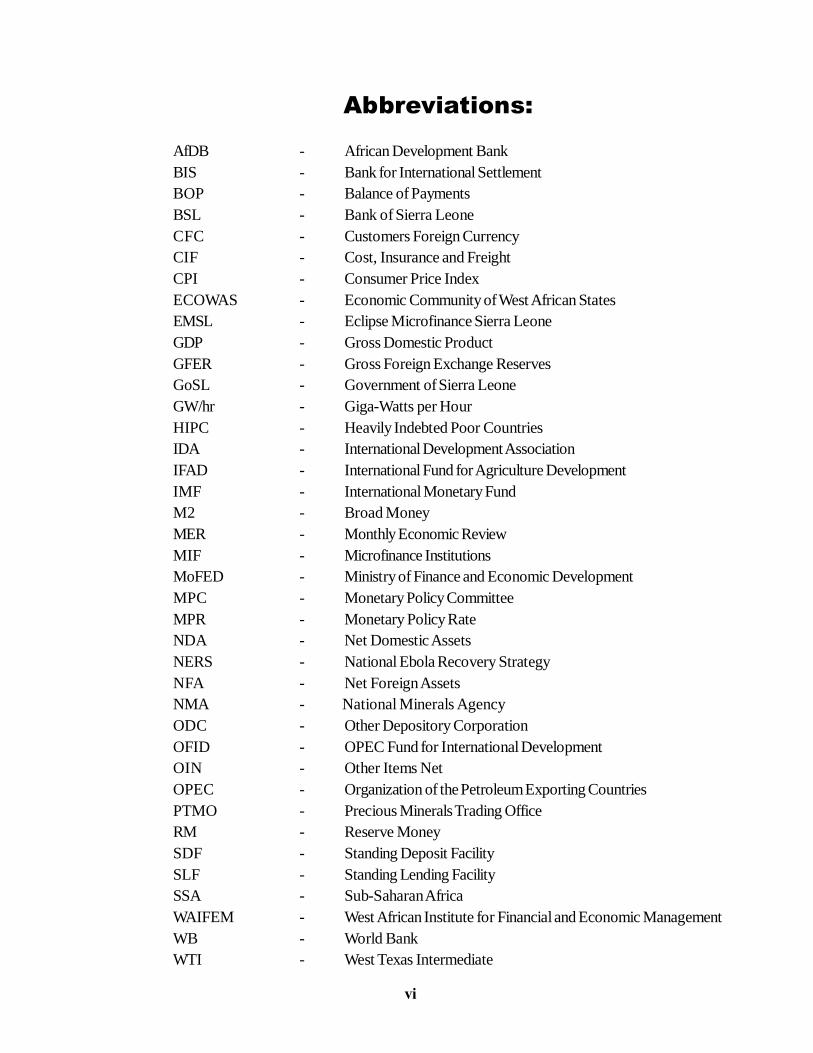
Abbreviations:
AfDB - African Development BankBIS - Bank for International SettlementBOP - Balance of PaymentsBSL - Bank of Sierra LeoneCFC - Customers Foreign CurrencyCIF - Cost, Insurance and FreightCPI - Consumer Price IndexECOWAS - Economic Community of West African StatesEMSL - Eclipse Microfinance Sierra LeoneGDP - Gross Domestic ProductGFER - Gross Foreign Exchange ReservesGoSL - Government of Sierra LeoneGW/hr - Giga-Watts per HourHIPC - Heavily Indebted Poor CountriesIDA - International Development AssociationIFAD - International Fund for Agriculture DevelopmentIMF - International Monetary FundM2 - Broad MoneyMER - Monthly Economic ReviewMIF - Microfinance InstitutionsMoFED - Ministry of Finance and Economic DevelopmentMPC - Monetary Policy CommitteeMPR - Monetary Policy RateNDA - Net Domestic AssetsNERS - National Ebola Recovery StrategyNFA - Net Foreign AssetsNMA - National Minerals AgencyODC - Other Depository CorporationOFID - OPEC Fund for International DevelopmentOIN - Other Items NetOPEC - Organization of the Petroleum Exporting CountriesPTMO - Precious Minerals Trading OfficeRM - Reserve MoneySDF - Standing Deposit FacilitySLF - Standing Lending FacilitySSA - Sub-Saharan AfricaWAIFEM - West African Institute for Financial and Economic ManagementWB - World BankWTI - West Texas Intermediate
vi
7
BANK OF SIERRA LEONE
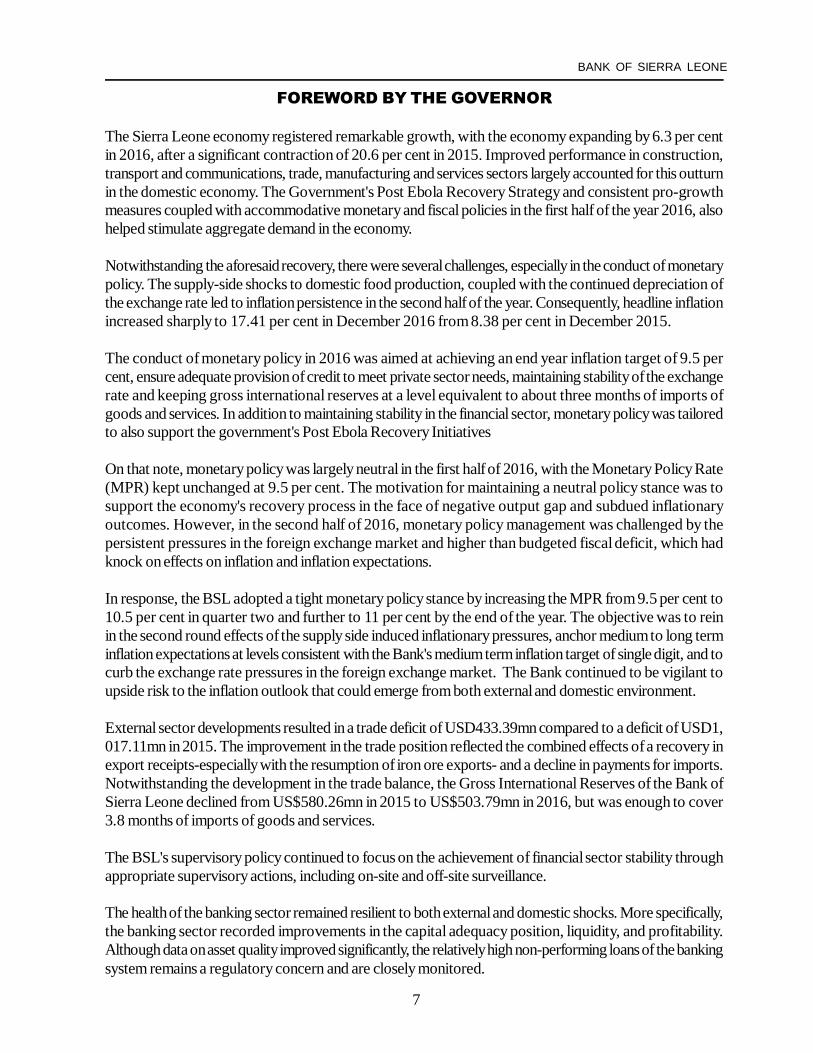
FOREWORD BY THE GOVERNOR
The Sierra Leone economy registered remarkable growth, with the economy expanding by 6.3 per centin 2016, after a significant contraction of 20.6 per cent in 2015. Improved performance in construction,transport and communications, trade, manufacturing and services sectors largely accounted for this outturnin the domestic economy. The Government's Post Ebola Recovery Strategy and consistent pro-growthmeasures coupled with accommodative monetary and fiscal policies in the first half of the year 2016, alsohelped stimulate aggregate demand in the economy.
Notwithstanding the aforesaid recovery, there were several challenges, especially in the conduct of monetarypolicy. The supply-side shocks to domestic food production, coupled with the continued depreciation ofthe exchange rate led to inflation persistence in the second half of the year. Consequently, headline inflationincreased sharply to 17.41 per cent in December 2016 from 8.38 per cent in December 2015.
The conduct of monetary policy in 2016 was aimed at achieving an end year inflation target of 9.5 percent, ensure adequate provision of credit to meet private sector needs, maintaining stability of the exchangerate and keeping gross international reserves at a level equivalent to about three months of imports ofgoods and services. In addition to maintaining stability in the financial sector, monetary policy was tailoredto also support the government's Post Ebola Recovery Initiatives
On that note, monetary policy was largely neutral in the first half of 2016, with the Monetary Policy Rate(MPR) kept unchanged at 9.5 per cent. The motivation for maintaining a neutral policy stance was tosupport the economy's recovery process in the face of negative output gap and subdued inflationaryoutcomes. However, in the second half of 2016, monetary policy management was challenged by thepersistent pressures in the foreign exchange market and higher than budgeted fiscal deficit, which hadknock on effects on inflation and inflation expectations.
In response, the BSL adopted a tight monetary policy stance by increasing the MPR from 9.5 per cent to10.5 per cent in quarter two and further to 11 per cent by the end of the year. The objective was to reinin the second round effects of the supply side induced inflationary pressures, anchor medium to long terminflation expectations at levels consistent with the Bank's medium term inflation target of single digit, and tocurb the exchange rate pressures in the foreign exchange market. The Bank continued to be vigilant toupside risk to the inflation outlook that could emerge from both external and domestic environment.
External sector developments resulted in a trade deficit of USD433.39mn compared to a deficit of USD1,017.11mn in 2015. The improvement in the trade position reflected the combined effects of a recovery inexport receipts-especially with the resumption of iron ore exports- and a decline in payments for imports.Notwithstanding the development in the trade balance, the Gross International Reserves of the Bank ofSierra Leone declined from US$580.26mn in 2015 to US$503.79mn in 2016, but was enough to cover3.8 months of imports of goods and services.
The BSL's supervisory policy continued to focus on the achievement of financial sector stability throughappropriate supervisory actions, including on-site and off-site surveillance.
The health of the banking sector remained resilient to both external and domestic shocks. More specifically,the banking sector recorded improvements in the capital adequacy position, liquidity, and profitability.Although data on asset quality improved significantly, the relatively high non-performing loans of the bankingsystem remains a regulatory concern and are closely monitored.
8
ANNUAL REPORT AND STATEMENT OF ACCOUNTS
During the year, the Bank continued to support the Government's economic reform program. To this end,all targets under the IMF supported ECF program were successfully met. Consequently, in September2016, Sierra Leone successfully completed the sixth and final review under the Extended Credit Facilityof the IMF. Furthermore, the Bank participated in the successful negotiation of the new three year ECFprogram with the Fund.
In 2016, the BSL embarked on a range of reforms aimed at strengthening its capacity to deliver on itsmandate. In a bid to enhance the effectiveness of monetary policy, the BSL in September 2016, introducedinto its monetary policy framework an interest rate corridor system. The corridor consists of overnightdeposit and lending facilities. These facilities offer commercial banks the opportunity to place funds withand obtain funds from the Bank, on an overnight basis. The introduction of the corridor system alsohelped to enhance the transparency and effectiveness of the transmission of monetary policy impulses tothe real economy.
The BSL also strengthened efforts to promote secondary market trading of treasury bills by introducing aPrimary Dealership System which allowed the Bank to migrate from retail to wholesale trading ofGovernment's Securities in the Primary Market.
This system also facilitates secondary trading in treasury securities, as it enhances the transfer of title forgovernment securities. Furthermore, it permits the Bank to have greater flexibility to engage in OpenMarket Operations.
In conclusion, I would like to take this opportunity to thank the Board of Directors of the Bank for theirsupport and guidance throughout the year. I would also like to extend my gratitude to the entire staff of theBank for their continued commitment and support as we work towards setting the right macroeconomicenvironment that supports a sustainable growth path.
Kaifala Marah (Dr.) Governor

9
BANK OF SIERRA LEONE
Dr. Kaifala Marah Dr. Ibrahim L. Stevens Governor and Chairman of the Board Deputy Governor Member
Mr. S. N. Dumbuya PC Mohamed D. Benya V Member Member
Mr. Winstanley Bankole Johnson Mrs. Rosaline Y. Fadika Dr. Richard C. M'Bayo Member Member Member
Board of Directors as at 31st December 2016
10
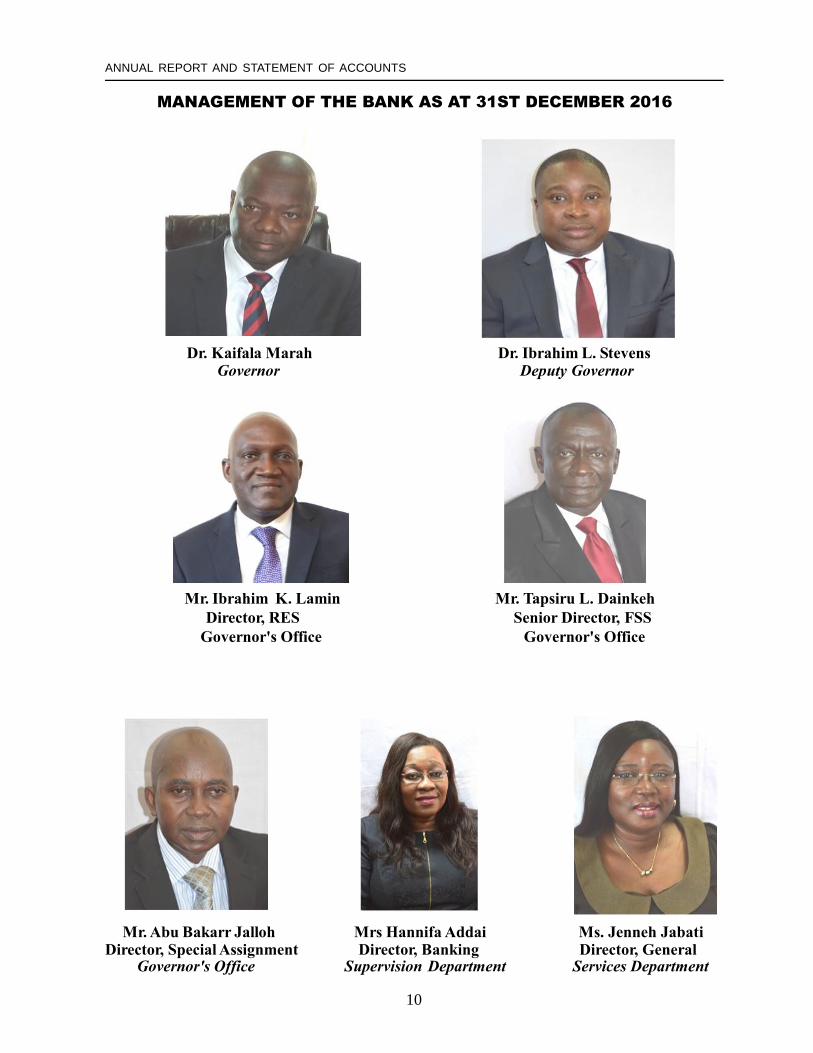
ANNUAL REPORT AND STATEMENT OF ACCOUNTS
MANAGEMENT OF THE BANK AS AT 31ST DECEMBER 2016
Dr. Kaifala Marah Dr. Ibrahim L. Stevens Governor Deputy Governor
Mr. Ibrahim K. Lamin Mr. Tapsiru L. Dainkeh Director, RES Senior Director, FSS Governor's Office Governor's Office
Mr. Abu Bakarr Jalloh Mrs Hannifa Addai Ms. Jenneh JabatiDirector, Special Assignment Director, Banking Director, General Governor's Office Supervision Department Services Department

11
BANK OF SIERRA LEONE
Mr. Ralph Ansumana Mr. Richard J D Sowa Mrs. Mary May Kargbo Director, Banking Director, Secretary's Director, Special Duty Department Department Governor's Office
Mr. Abdul Aziz Sowe Mr. Abdul Bundu Ms. Hawa E. Kallon Director Acting Director Acting DirectorFinance Department Internal Audit Department Human Resources Department
Mr. Gibao Flee Mr. Morlai Bangura Ms. Fatima Mansaray Acting Director Acting Director Acting DirectorFinancial Markets Department Research Management Information Systems
Department

12
ANNUAL REPORT AND STATEMENT OF ACCOUNTS
BANK OF SIERRA LEONE ORGANIZATIONAL STRUCTURE -2016
BOARD OF
DIRECTORS
GOVERNOR
DEPUTY
GOVERNOR
INTERNAL AUDIT
DEPT
MIS
DEPT
HUMAN
RESOURCESs
DEPT
BANKING
SUPERVISION
DEPT
FINANCIAL
MARKETS
DEPT
FINANCE
DEPT
BANKING
DEPT
RESEARCH
DEPTSECRETARY’S
DEPT
OFFICE OF THE GOVERNOR
GENERALSERVICES
DEPT
Security UnitProcurement Unit F S D Unit

13
BANK OF SIERRA LEONE
Vision StatementTo create a modern, effective and dynamic Central Bank that serves the overall financial, growth anddevelopment requirements of Sierra Leone
Mission StatementTo formulate and implement monetary and supervisory policies to foster a sound economic and financialenvironment.
Objectives and Functions of the Bank
(1) The main objective of the Bank as specified in Section 4 of the Bank of Sierra Leone Act 2011, isto achieve and maintain price stability.
(2) Without prejudice to subsection (1), the Bank shall:
(a) Formulate and implement monetary policy, financial regulation and prudential standards;
(b) Act as banker, adviser and fiscal agent of the Government;
(c) Formulate and implement the foreign exchange policy of Sierra Leone;
(d) Conduct foreign-exchange operations;
(e) Own, hold and maintain the official international reserves including the reserves of gold;
(f) Issue and manage the currency of Sierra Leone;
(g) Establish, promote, license and oversee sound and efficient payment and securities settlement systems;
(h) License, register, regulate and supervise financial institutions as specified in this Act or any otherenactment;
(i) Act as a depository for funds from international organizations.
14
ANNUAL REPORT AND STATEMENT OF ACCOUNTS
1.0 GOVERNANCE
1.1 The Board of Directors
The Bank of Sierra Leone Act 2011 provides for a Board which shall consist of the Governor as theChairman, the Deputy Governor and five Non-Executive Directors, all of whom shall be appointedby the President subject to approval by Parliament.
The Governor and the Deputy Governor shall each be appointed for a term of five years and shallbe eligible for reappointment for another term only.
The Directors of the Board, who shall be persons with experience in economics, finance, banking,accounting and law, shall hold office for a term of three years and shall be eligible for reappointmentfor another term only
1.1.1 Functions of the Board
According to Section 17 of the Bank of Sierra Leone Act 2011, the functions of the Board are:
a) determine the organization of the Bank, including the establishment and location of branches,representative offices and operations facilities;
b) determine the general policies and adopt internal rules applicable to the administration and operationsof the Bank;
c) approve the annual budget of the Bank;
d) approve the audited accounts, annual reports and other formal reports and financial statements ofthe Bank;
e) determine denomination and design of banknotes, coins and their issuance and handling;f) appoint committees consisting of members of the Board or members of the Bank's staff and determine
their responsibilities;
g) assess risks and formulate contingency plans for the on-going operations and security of the Bank;
h) adopt the rules of procedure for meetings of the Board;
i) exercise all powers that are not specifically reserved for the Governor; and
j) perform other functions prescribed by the Act.
15
BANK OF SIERRA LEONE
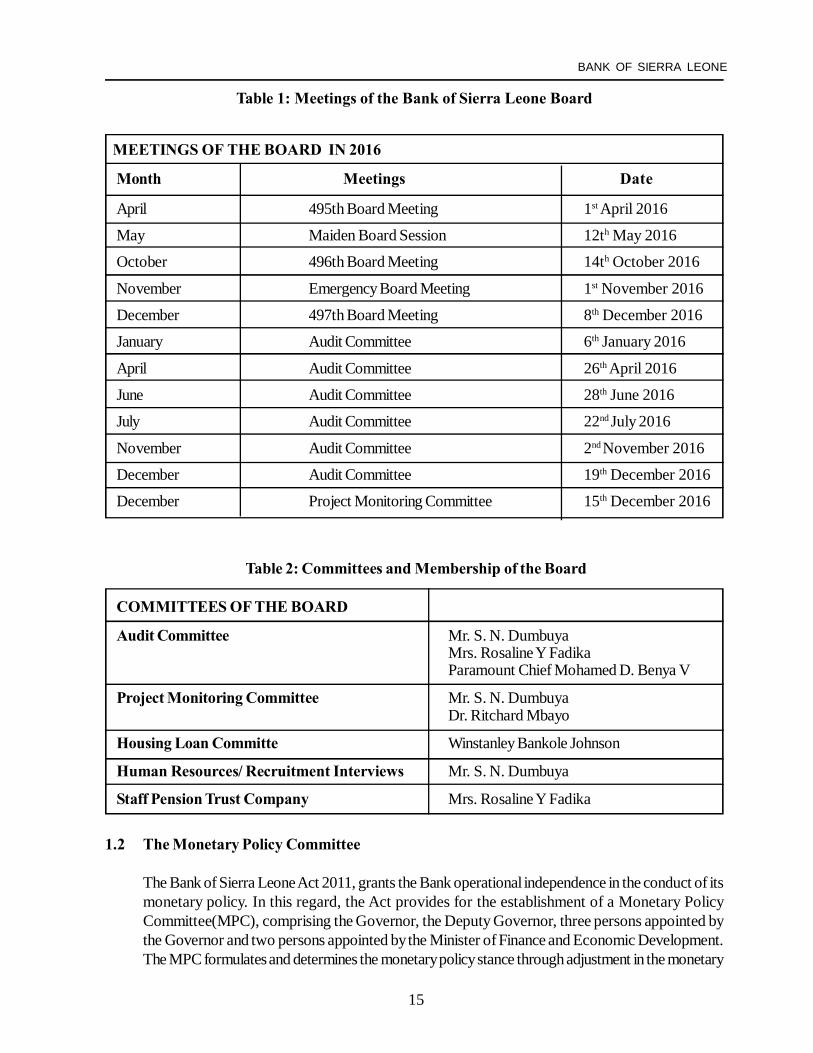
Table 1: Meetings of the Bank of Sierra Leone Board
MEETINGS OF THE BOARD IN 2016
Month Meetings Date
April 495th Board Meeting 1st April 2016
May Maiden Board Session 12th May 2016
October 496th Board Meeting 14th October 2016
November Emergency Board Meeting 1st November 2016
December 497th Board Meeting 8th December 2016
January Audit Committee 6th January 2016
April Audit Committee 26th April 2016
June Audit Committee 28th June 2016
July Audit Committee 22nd July 2016
November Audit Committee 2nd November 2016
December Audit Committee 19th December 2016
December Project Monitoring Committee 15th December 2016
Table 2: Committees and Membership of the Board
COMMITTEES OF THE BOARD
Audit Committee Mr. S. N. DumbuyaMrs. Rosaline Y FadikaParamount Chief Mohamed D. Benya V
Project Monitoring Committee Mr. S. N. DumbuyaDr. Ritchard Mbayo
Housing Loan Committe Winstanley Bankole Johnson
Human Resources/ Recruitment Interviews Mr. S. N. Dumbuya
Staff Pension Trust Company Mrs. Rosaline Y Fadika
1.2 The Monetary Policy Committee
The Bank of Sierra Leone Act 2011, grants the Bank operational independence in the conduct of itsmonetary policy. In this regard, the Act provides for the establishment of a Monetary PolicyCommittee(MPC), comprising the Governor, the Deputy Governor, three persons appointed bythe Governor and two persons appointed by the Minister of Finance and Economic Development.The MPC formulates and determines the monetary policy stance through adjustment in the monetary
16
ANNUAL REPORT AND STATEMENT OF ACCOUNTS
policy rate. The decisions of the MPC are informed by an assessment of the balance of risksbetween inflation and economic growth, based on developments in the domestic and internationalenvironments.
The MPC meets on a quarterly basis and held four meetings in 2016. The decisions on the monetarypolicy stance is communicated through a monetary policy statement, which is published on theBank's website and local newspapers, 48 hours after the MPC meetings.
As at end December 2016, the MPC comprised:
l Dr Kaifala Marah, Governor, Bank of Sierra Leone;
l Dr Ibrahim L Stevens, Deputy Governor, Bank of Sierra Leone;
l Mr Edmund Koroma, Financial Secretary, Ministry of Finance and Economic Development;
l Dr Milton B Ashley, Acting Head, Department of Banking and Finance, IPAM, Universityof Sierra Leone
l Mr Ibrahim K Lamin, Director, Financial Markets Department, Bank of Sierra Leone.
l Mr Mohamed Mansaray, Director, Research Department, Bank of Sierra Leone.
2.0 DEVELOPMENTS IN THE GLOBAL ECONOMY
2.1 Global Output Growth
Based on the World Economic Outlook (IMF, October 2016), World output growth was estimatedat 3.1 percent in 2016 against 3.2 percent in 2015. Growth in advanced economies declined to 1.6percent in 2016 from 2.1 percent in 2015. Similarly, growth in Sub-Saharan Africa declined from3.4 percent in 2015 to 1.4 percent in 2016, driven mainly by poor economic conditions in Nigeriaand South Africa - the major economies in the region. However, growth in emerging markets anddeveloping economies improved to 4.2 percent from the 4.0 percent recorded in 2015 as Russiaand Brazil were gradually emerging out of recession.
2.2 Advanced Economies
Amongst advanced economies, the United States recorded a modest growth of 1.6 percent in2016 compared with 2.6 percent in 2015 mainly driven by a slowdown in business activity. Growthin the euro area also dropped to 1.7 percent in 2016 after recording a growth of 2.0 percent in2015. Notwithstanding, growth in Japan remained unchanged at 0.5 percent in 2016, as the countrycontinues to recover from it poor performance in the preceding four years to 2015.
2.3 Emerging Market and Developing Economies
Contraction of growth in Brazil and Russia moderated in 2016. The two economies contracted by3.3 percent and 0.8 percent compared with contraction rates of 3.8 percent and 3.7 percentrespectively, in 2015. Growth in India remained at 7.6 percent, the same level as in 2015, whilegrowth in China slowed to 6.6 percent from 6.9 percent in 2015.
17
BANK OF SIERRA LEONE
2.4 Sub-Saharan Africa
The poor economic performance of the region in 2016 was mainly driven by the economic challengesfaced by the major economies - Nigeria and South Africa. The Nigerian economy contracted by1.7 percent in 2016, compared to 2.7 percent growth in 2015, due to lower oil prices and productionvolumes combined with tight foreign exchange conditions. In South Africa, growth slowed to 0.1per cent in 2016, from 1.3 per cent in 2015 as manufacturing contracted despite some improvementin mining, general government services and real estate activities.
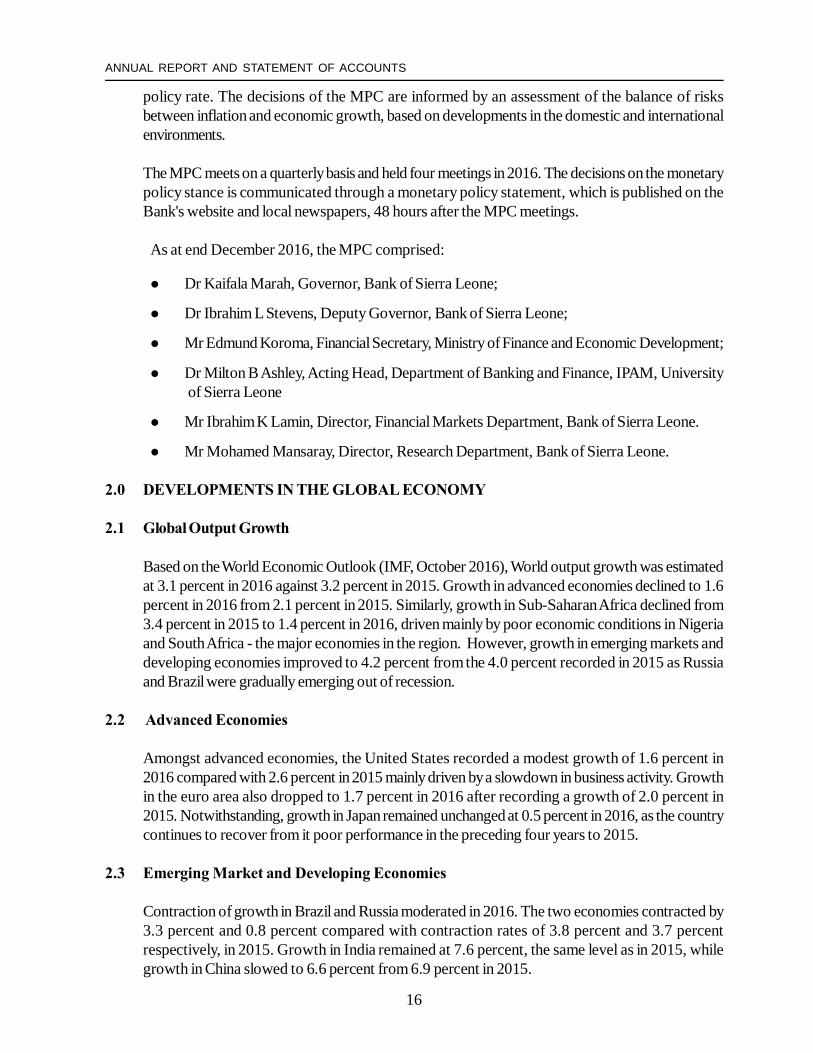
Table 3: Global Growth
Source: World Economic Outlook, October, 2016
2.5 Global Inflation
Global inflation increased in 2016 relative to 2015, but broadly remained below target levels inadvanced economies. Based on IMF estimates in October, global inflation edged up to 2.9 percentin 2016, from 2.8 percent in 2015. Inflation in advanced economies increased from 0.3 percent in2015 to 0.8 percent in 2016, characterized by rising food prices and energy costs, especially in thelast quarter of the year. Inflation in emerging market and developing economies dropped to 4.5percent in 2016, from 4.7 percent in the previous year, largely on account of a slowdown incommodityprices. In Sub-Saharan Africa however, inflation reached double-digits in 2016 at 11.3percent, compared with the rate of 7.0 percent in 2015. This was mainly predicated on the weaknessin currencies across the region, coupled with energy and water shortages. Table 4 below presentsthe inflation dynamics across the various regions.
Table 4: Global Inflation
Source: World Economic Outlook, October, 2016
2013 2014 2015 2016 2017
World Output 3.4 3.4 3.2 3.1 3.4 Advanced Economies 1.4 1.9 2.1 1.6 1.8 United States 2.2 2.4 2.6 1.6 2.2
Euro Area -0.5 1.1 2.0 1.7 1.5 Japan 1.6 0.0 0.5 0.5 0.6
Emerging Market and Developing 5.0 4.6 4.0 4.2 4.6 Brazil 2.5 0.1 -3.8 -3.3 0.5 Russia 2.5 0.7 -3.7 -0.8 1.1 India 6.9 7.2 7.6 7.6 7.6 China 7.8 7.3 6.9 6.6 6.2 Sub-Saharan Africa 5.2 5.1 3.4 1.4 2.9 Nigeria 5.4 6.3 2.7 -1.7 0.6
South Africa 2.0 1.6 1.3 0.1 0.8
Consumer Price Inflation 2013 2014 2015 2016 2017
World Inflation 3.7 3.2 2.8 2.9 3.3
Advance Economies 1.3 1.4 0.3 0.8 1.7
Emerging and Developing Economies 5.5 4.7 4.7 4.5 4.4
Sub-Saharan Africa 6.6 6.4 7.0 11.3 10.8
Source: World Economic Outlook, October, 2016
18
ANNUAL REPORT AND STATEMENT OF ACCOUNTS
2.6 Commodity Prices
There was a surge in the prices for most commodities in 2016, except crude oil which maintaineda downswing. These mixed developments were largely driven by the changing dynamics in theglobal market.
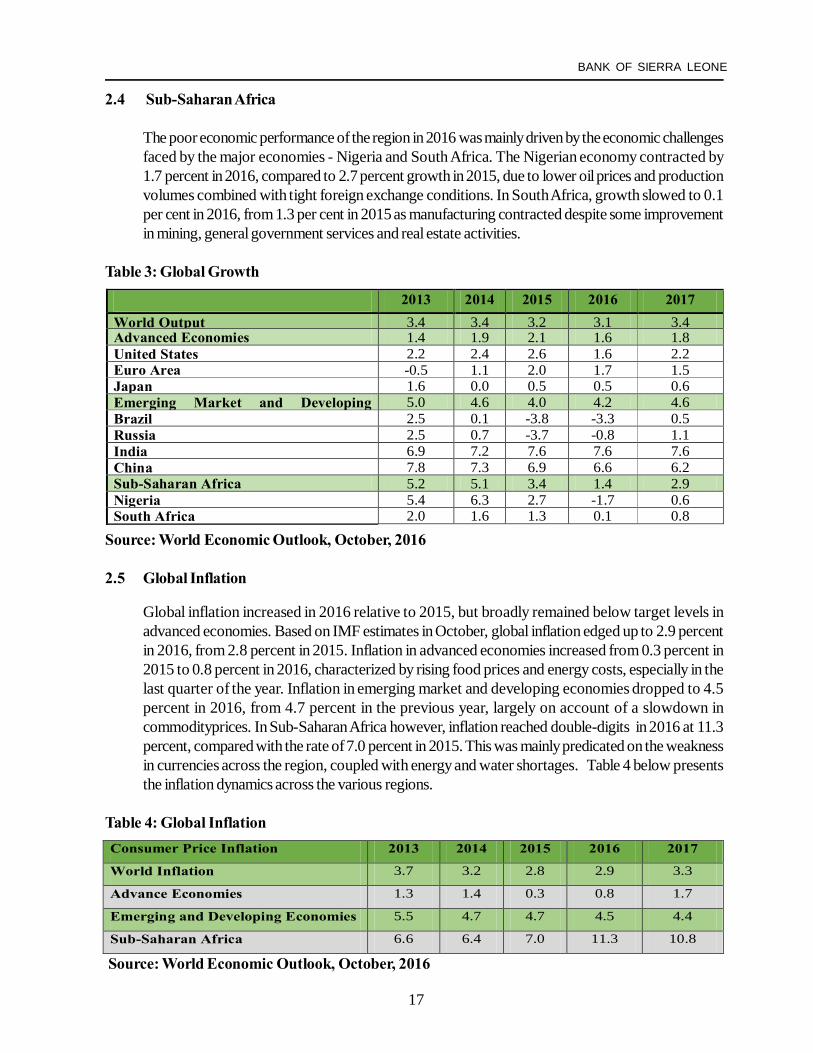
2.6.1 Crude Oil
Crude oil prices were somewhat lower in 2016 relative to 2015, reflecting an upswing in supply- mainly from Canada and OPEC producers; particularly Iran and Saudi Arabia. Prices for bothBrent and West Texas Intermediate (WTI) dropped from USD52.37/bbl and USD48.71/bbl in2015 to USD44.05/bbl and USD43.19/bbl in 2016 respectively. The average price for crude oilfollowed the same trajectory (see Figure 1).
Figure 1: Crude Oil Prices
Source: World Bank Pink Sheet (CMO), 2016
19
BANK OF SIERRA LEONE
2.6.2 Iron Ore
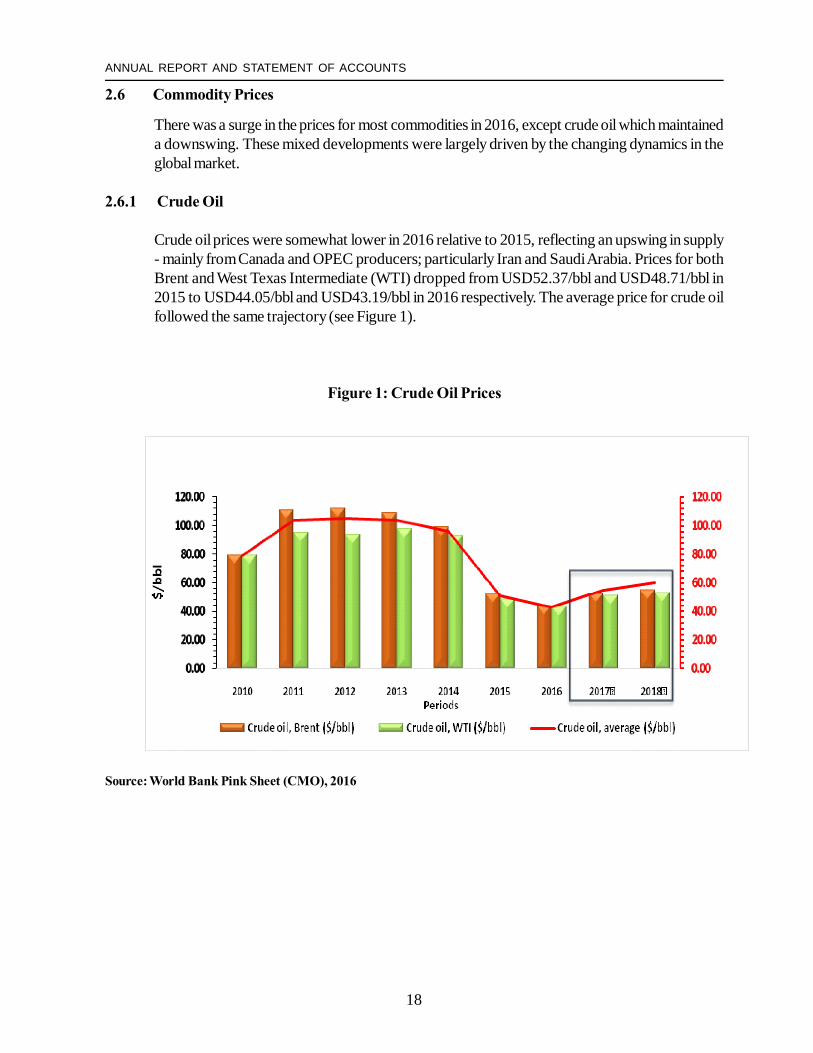
The price of iron ore recovered modestly to USD58.42/dtmu in 2016 from USD55.85/dtmu in2015. This was driven by increased demand for steel by China to support infrastructuraldevelopment, on the back of low stocks as well as reductions in global supply (see Figure 2).
Figure 2: Iron Ore Price
Source: World Bank Pink Sheet (CMO), 2016
3.0 DEVELOPMENTS IN THE SIERRA LEONE ECONOMY
3.1 Economic Growth
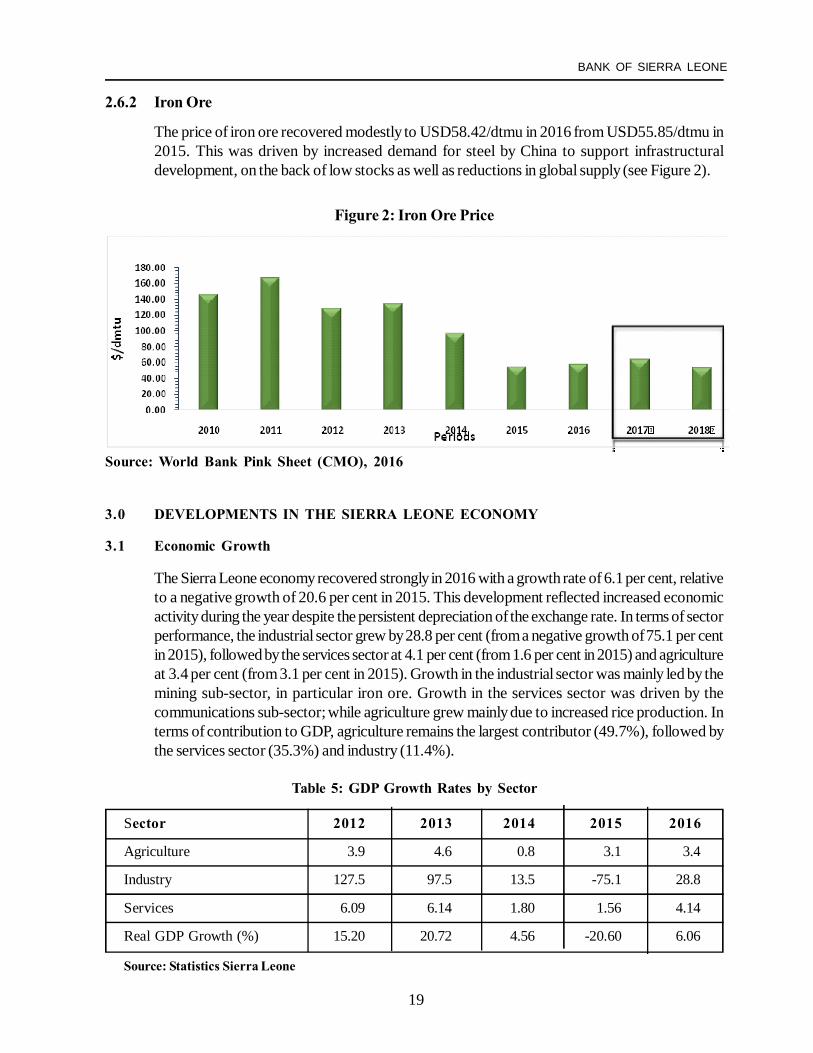
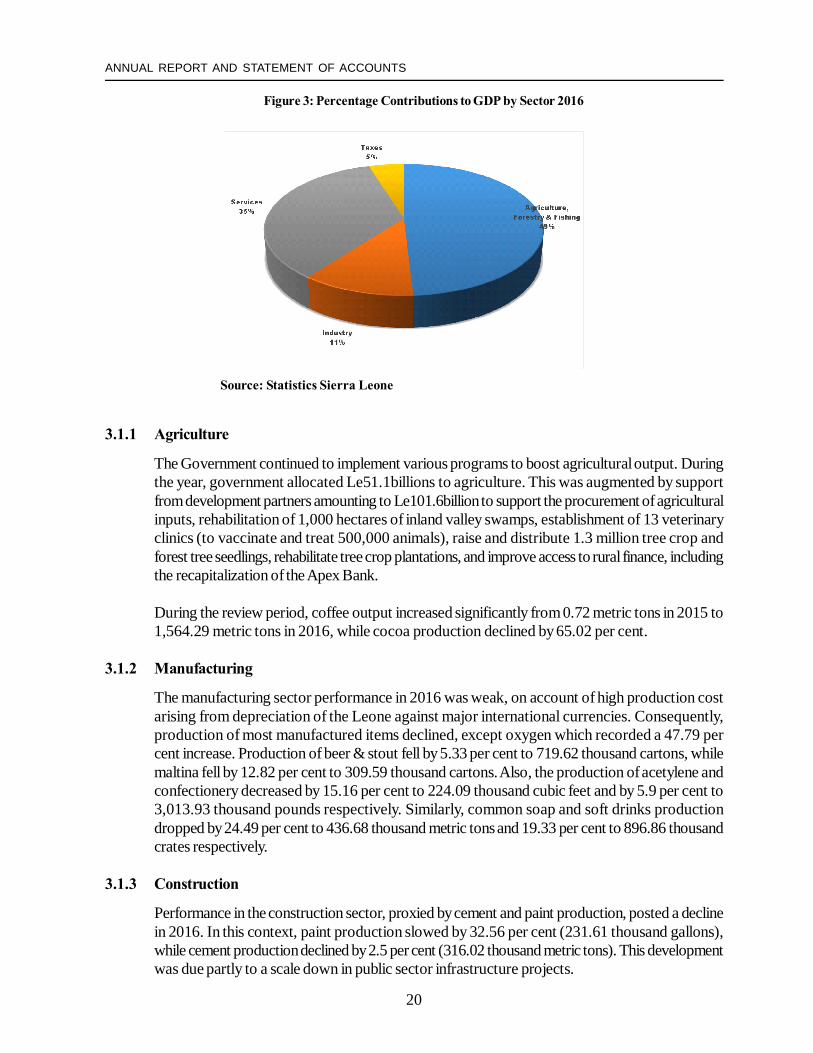
The Sierra Leone economy recovered strongly in 2016 with a growth rate of 6.1 per cent, relativeto a negative growth of 20.6 per cent in 2015. This development reflected increased economicactivity during the year despite the persistent depreciation of the exchange rate. In terms of sectorperformance, the industrial sector grew by 28.8 per cent (from a negative growth of 75.1 per centin 2015), followed by the services sector at 4.1 per cent (from 1.6 per cent in 2015) and agricultureat 3.4 per cent (from 3.1 per cent in 2015). Growth in the industrial sector was mainly led by themining sub-sector, in particular iron ore. Growth in the services sector was driven by thecommunications sub-sector; while agriculture grew mainly due to increased rice production. Interms of contribution to GDP, agriculture remains the largest contributor (49.7%), followed bythe services sector (35.3%) and industry (11.4%).
Table 5: GDP Growth Rates by Sector
Sector 2012 2013 2014 2015 2016
Agriculture 3.9 4.6 0.8 3.1 3.4
Industry 127.5 97.5 13.5 -75.1 28.8
Services 6.09 6.14 1.80 1.56 4.14
Real GDP Growth (%) 15.20 20.72 4.56 -20.60 6.06
Source: Statistics Sierra Leone
20
ANNUAL REPORT AND STATEMENT OF ACCOUNTS
Figure 3: Percentage Contributions to GDP by Sector 2016
Source: Statistics Sierra Leone
3.1.1 Agriculture
The Government continued to implement various programs to boost agricultural output. Duringthe year, government allocated Le51.1billions to agriculture. This was augmented by supportfrom development partners amounting to Le101.6billion to support the procurement of agriculturalinputs, rehabilitation of 1,000 hectares of inland valley swamps, establishment of 13 veterinaryclinics (to vaccinate and treat 500,000 animals), raise and distribute 1.3 million tree crop andforest tree seedlings, rehabilitate tree crop plantations, and improve access to rural finance, includingthe recapitalization of the Apex Bank.
During the review period, coffee output increased significantly from 0.72 metric tons in 2015 to1,564.29 metric tons in 2016, while cocoa production declined by 65.02 per cent.
3.1.2 Manufacturing
The manufacturing sector performance in 2016 was weak, on account of high production costarising from depreciation of the Leone against major international currencies. Consequently,production of most manufactured items declined, except oxygen which recorded a 47.79 percent increase. Production of beer & stout fell by 5.33 per cent to 719.62 thousand cartons, whilemaltina fell by 12.82 per cent to 309.59 thousand cartons. Also, the production of acetylene andconfectionery decreased by 15.16 per cent to 224.09 thousand cubic feet and by 5.9 per cent to3,013.93 thousand pounds respectively. Similarly, common soap and soft drinks productiondropped by 24.49 per cent to 436.68 thousand metric tons and 19.33 per cent to 896.86 thousandcrates respectively.
3.1.3 Construction
Performance in the construction sector, proxied by cement and paint production, posted a declinein 2016. In this context, paint production slowed by 32.56 per cent (231.61 thousand gallons),while cement production declined by 2.5 per cent (316.02 thousand metric tons). This developmentwas due partly to a scale down in public sector infrastructure projects.
21
BANK OF SIERRA LEONE
3.1.4 Mining
Mining activities improved in 2016 compared to 2015. Diamond production increased by 9.81per cent to 549.10 thousand carats compared to 500.04 thousand carats in 2015. Of this total,industrial diamonds accounted for 23.96 per cent, while gem accounted for 76.12 per cent.Production increases were also recorded for rutile, gold and iron ore. Rutile production grew by17.87 per cent to 148.54 thousand metric tons, Gold rose by 74.43 percent to 6.04 thousandounces, and Iron ore production expanded by 265.17 percent to 6,175.96 thousand metric tons.In contrast, Bauxite production dropped by 3.13 per cent to 1,429.59 thousand metric tons,Ileminite by 25.33 percent to 28.10 thousand metric tons, and Zircon by 4.32 percent to 1.33thousand metric tons.
3.1.5 Electricity Generation
The Government with the support of development partners (EU, AfDB, IsDB and WB)implemented various energy projects aimed at expanding electricity supply and rehabilitation ofthe national transmission network. The Government allocated Le173.1 billion to the energy sector,of which, Le4.6 billion was allocated to support research on clean energy initiatives.
Donor support amounted to Le110.1 billion of which, Abu Dhabi provided Le20.4 billion for theSolar Park Freetown Project. The United States Millennium Challenge Cooperation also providedLe15.2 billion to support reforms in the electricity sector.
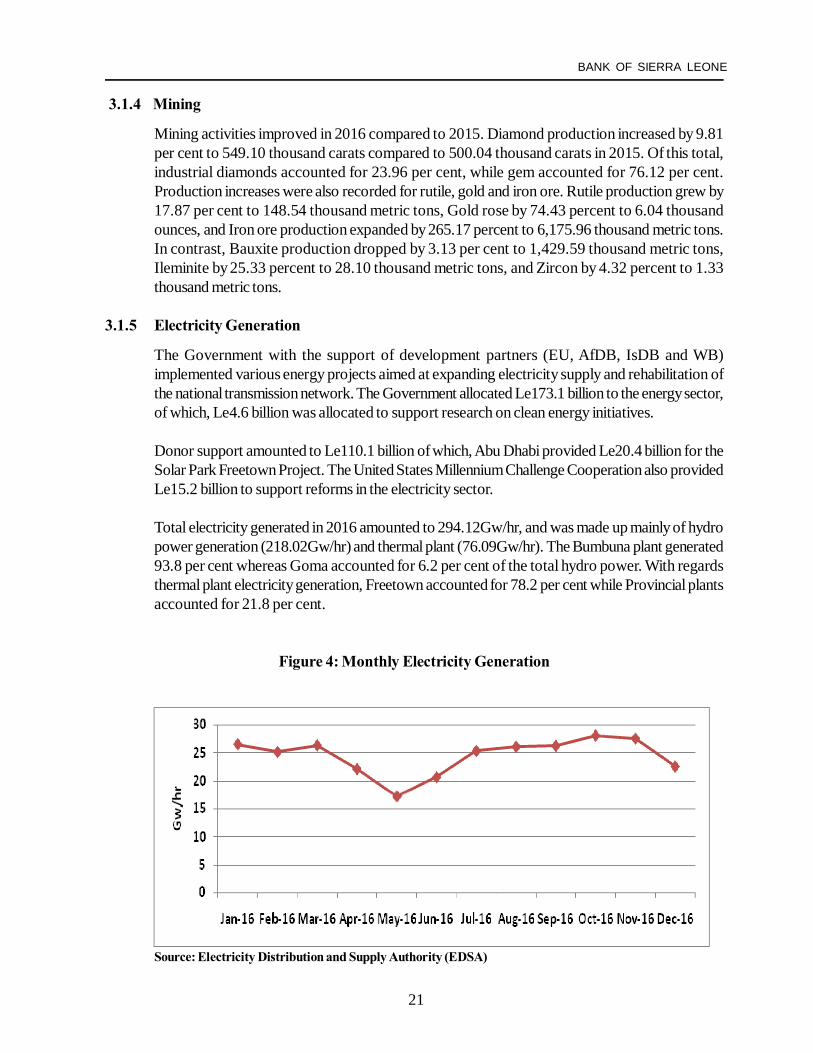
Total electricity generated in 2016 amounted to 294.12Gw/hr, and was made up mainly of hydropower generation (218.02Gw/hr) and thermal plant (76.09Gw/hr). The Bumbuna plant generated93.8 per cent whereas Goma accounted for 6.2 per cent of the total hydro power. With regardsthermal plant electricity generation, Freetown accounted for 78.2 per cent while Provincial plantsaccounted for 21.8 per cent.
Figure 4: Monthly Electricity Generation
Source: Electricity Distribution and Supply Authority (EDSA)
22
ANNUAL REPORT AND STATEMENT OF ACCOUNTS
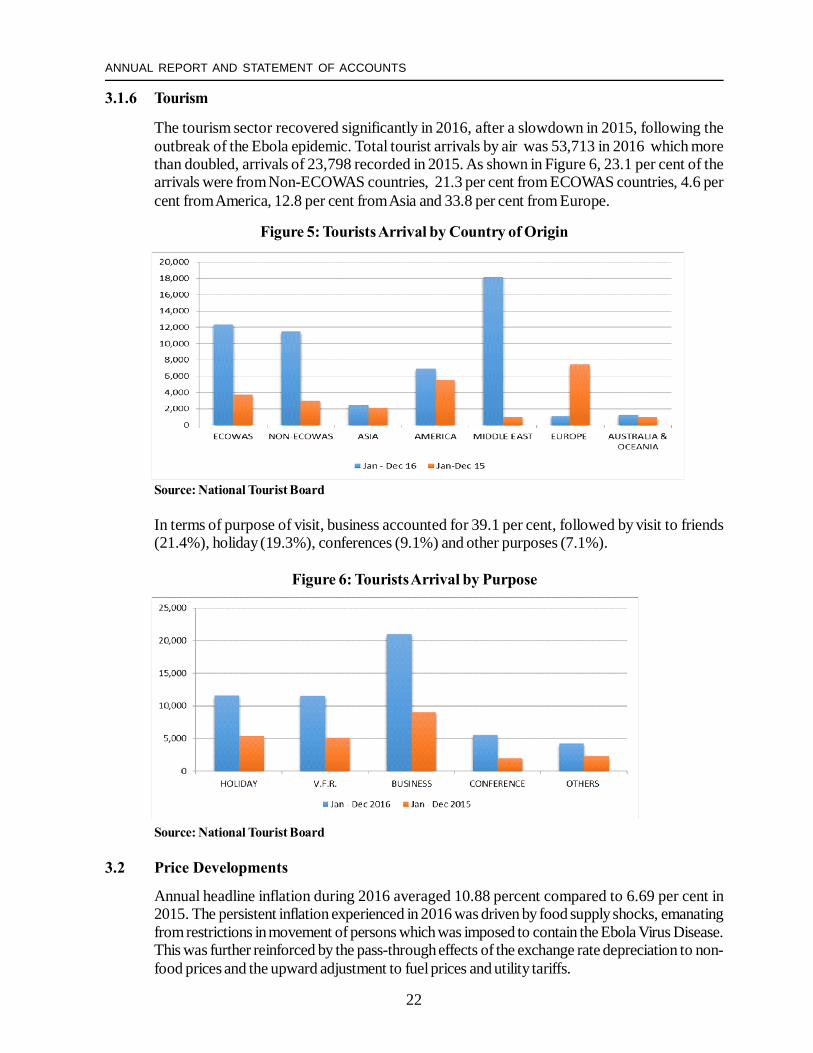
3.1.6 Tourism
The tourism sector recovered significantly in 2016, after a slowdown in 2015, following theoutbreak of the Ebola epidemic. Total tourist arrivals by air was 53,713 in 2016 which morethan doubled, arrivals of 23,798 recorded in 2015. As shown in Figure 6, 23.1 per cent of thearrivals were from Non-ECOWAS countries, 21.3 per cent from ECOWAS countries, 4.6 percent from America, 12.8 per cent from Asia and 33.8 per cent from Europe.
Figure 5: Tourists Arrival by Country of Origin
Source: National Tourist Board
In terms of purpose of visit, business accounted for 39.1 per cent, followed by visit to friends(21.4%), holiday (19.3%), conferences (9.1%) and other purposes (7.1%).
Figure 6: Tourists Arrival by Purpose
Source: National Tourist Board
3.2 Price Developments
Annual headline inflation during 2016 averaged 10.88 percent compared to 6.69 per cent in2015. The persistent inflation experienced in 2016 was driven by food supply shocks, emanatingfrom restrictions in movement of persons which was imposed to contain the Ebola Virus Disease.This was further reinforced by the pass-through effects of the exchange rate depreciation to non-food prices and the upward adjustment to fuel prices and utility tariffs.
23
BANK OF SIERRA LEONE
Source: Statistics Sierra Leone (SSL) and Research Department, BSL
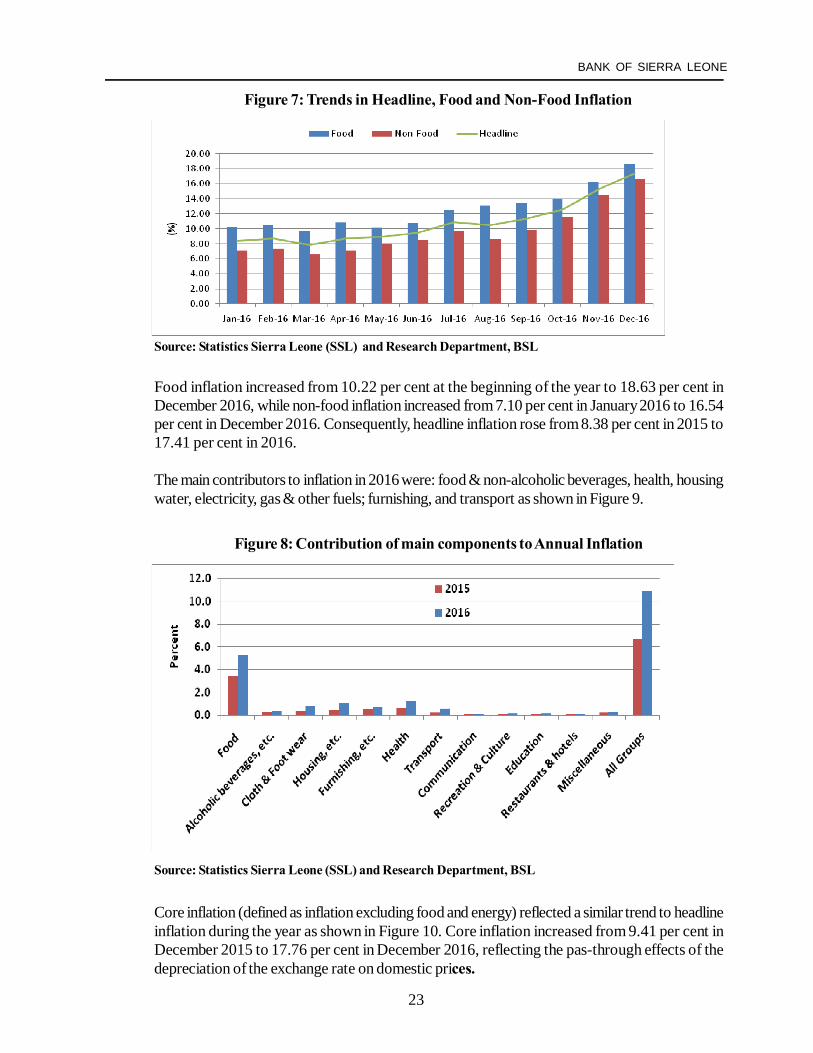
Food inflation increased from 10.22 per cent at the beginning of the year to 18.63 per cent inDecember 2016, while non-food inflation increased from 7.10 per cent in January 2016 to 16.54per cent in December 2016. Consequently, headline inflation rose from 8.38 per cent in 2015 to17.41 per cent in 2016.
The main contributors to inflation in 2016 were: food & non-alcoholic beverages, health, housingwater, electricity, gas & other fuels; furnishing, and transport as shown in Figure 9.
Figure 8: Contribution of main components to Annual Inflation
Source: Statistics Sierra Leone (SSL) and Research Department, BSL
Core inflation (defined as inflation excluding food and energy) reflected a similar trend to headlineinflation during the year as shown in Figure 10. Core inflation increased from 9.41 per cent inDecember 2015 to 17.76 per cent in December 2016, reflecting the pas-through effects of thedepreciation of the exchange rate on domestic prices.
Figure 7: Trends in Headline, Food and Non-Food Inflation

24
ANNUAL REPORT AND STATEMENT OF ACCOUNTS
Figure 9: Headline and Core Inflation
Source: Statistics Sierra Leone (SSL) and Research Department, BSL
3.3 Fiscal Policy and Government Budgetary Operations
The 2016 budget was driven by the National Ebola Recovery Strategy (NERS). The strategyfocused on fiscal sustainability through enhanced domestic revenue mobilization and expenditurerationalization with the aim of strengthening resilience and building a diversified economy.
Government fiscal deficit including grants in 2016 was 6.9 per cent of GDP against a targeteddeficit of 4.5 per cent. Overall fiscal deficit excluding grants was 9.6 per cent of GDP comparedto a target of 7.3 per cent.
3.3.1 Government Revenue
Government revenue including grants, grew by 18.2 per cent to Le3, 615.2bn and exceededthe target of LeLe3, 553.5bn by 1.7 per cent. The improvement in revenue was mainly attributedto the increase in domestic revenue collection.
Tax revenue increased by 48.6 per cent to Le2, 505.4bn (9.4 per cent of GDP) andexceeded the target of Le2, 412.8bn by 3.8 per cent. Tax revenue during the period accountedfor 69.3 per cent of total revenue and grants compared to 55.1 per cent in 2015. Thisimprovement in revenue collection was reflected in all the main tax categories: Customs andExcise, Income Tax and Goods and Services Tax (GST).
Customs and Excise receipts increased by 29.8 per cent to Le570.1bn (2.2 per cent of GDP)and exceeded the budgeted target of Le560.8bn by 1.7 per cent. This expansion was on accountof increases in receipts from import taxes by 68.3 per cent to Le381.6bn, and growth in otherexcise duties by 24 per cent to Le20bn.
25
BANK OF SIERRA LEONE
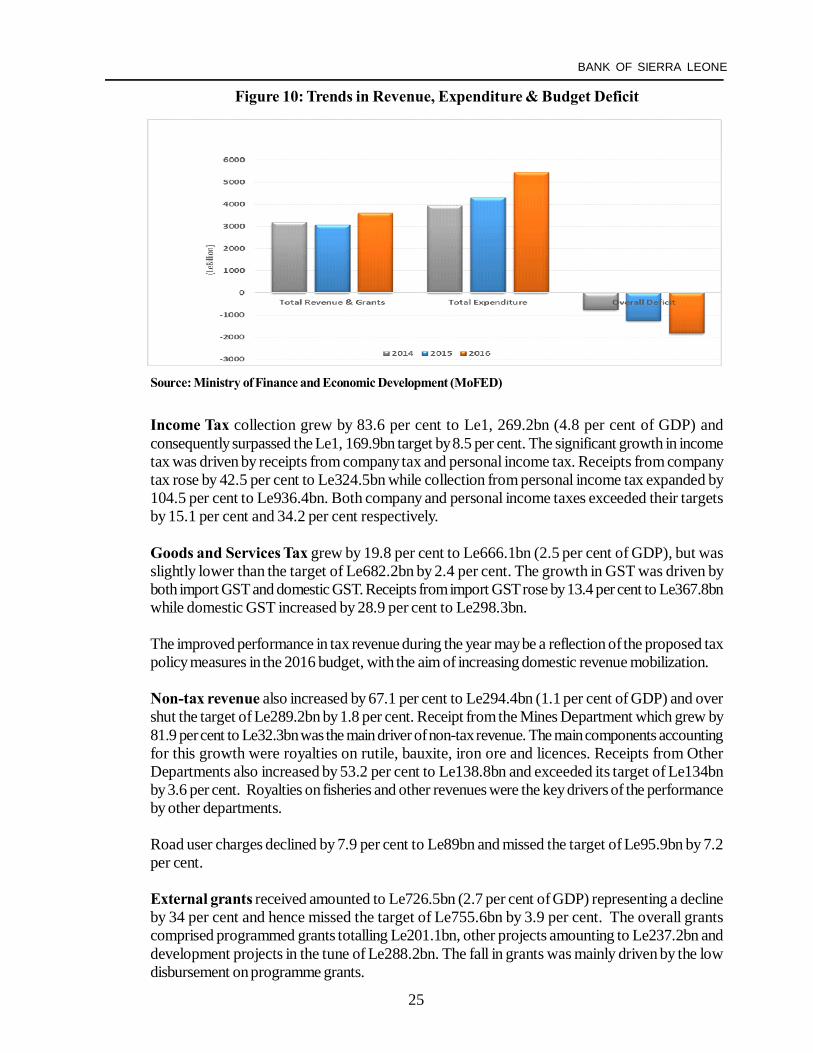
Figure 10: Trends in Revenue, Expenditure & Budget Deficit
Source: Ministry of Finance and Economic Development (MoFED)
Income Tax collection grew by 83.6 per cent to Le1, 269.2bn (4.8 per cent of GDP) andconsequently surpassed the Le1, 169.9bn target by 8.5 per cent. The significant growth in incometax was driven by receipts from company tax and personal income tax. Receipts from companytax rose by 42.5 per cent to Le324.5bn while collection from personal income tax expanded by104.5 per cent to Le936.4bn. Both company and personal income taxes exceeded their targetsby 15.1 per cent and 34.2 per cent respectively.
Goods and Services Tax grew by 19.8 per cent to Le666.1bn (2.5 per cent of GDP), but wasslightly lower than the target of Le682.2bn by 2.4 per cent. The growth in GST was driven byboth import GST and domestic GST. Receipts from import GST rose by 13.4 per cent to Le367.8bnwhile domestic GST increased by 28.9 per cent to Le298.3bn.
The improved performance in tax revenue during the year may be a reflection of the proposed taxpolicy measures in the 2016 budget, with the aim of increasing domestic revenue mobilization.
Non-tax revenue also increased by 67.1 per cent to Le294.4bn (1.1 per cent of GDP) and overshut the target of Le289.2bn by 1.8 per cent. Receipt from the Mines Department which grew by81.9 per cent to Le32.3bn was the main driver of non-tax revenue. The main components accountingfor this growth were royalties on rutile, bauxite, iron ore and licences. Receipts from OtherDepartments also increased by 53.2 per cent to Le138.8bn and exceeded its target of Le134bnby 3.6 per cent. Royalties on fisheries and other revenues were the key drivers of the performanceby other departments.
Road user charges declined by 7.9 per cent to Le89bn and missed the target of Le95.9bn by 7.2per cent.
External grants received amounted to Le726.5bn (2.7 per cent of GDP) representing a declineby 34 per cent and hence missed the target of Le755.6bn by 3.9 per cent. The overall grantscomprised programmed grants totalling Le201.1bn, other projects amounting to Le237.2bn anddevelopment projects in the tune of Le288.2bn. The fall in grants was mainly driven by the lowdisbursement on programme grants.
26
ANNUAL REPORT AND STATEMENT OF ACCOUNTS
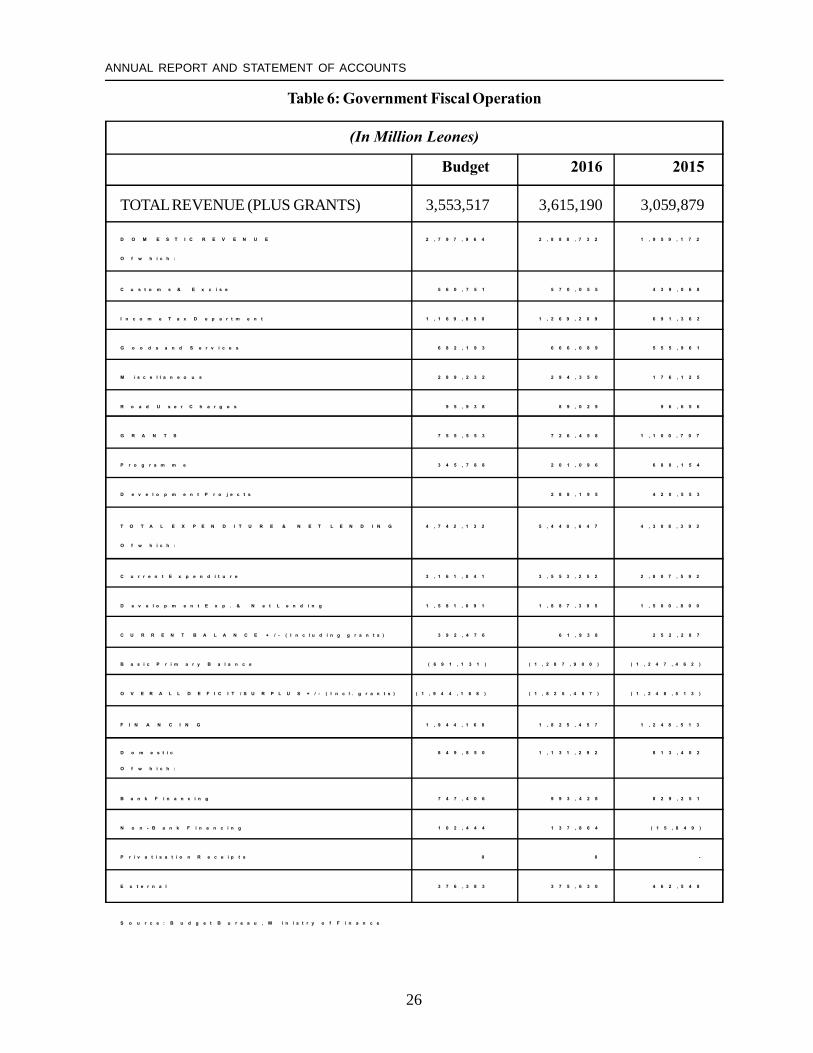
Table 6: Government Fiscal Operation
(In Million Leones)
Budget 2016 2015
TOTAL REVENUE (PLUS GRANTS) 3,553,517 3,615,190 3,059,879
D O M E S T I C R E V E N U E 2 , 7 9 7 , 9 6 4 2 , 8 8 8 , 7 3 2 1 , 9 5 9 , 1 7 2
O f w h i c h :
C u s t o m s & E x c i s e 5 6 0 , 7 5 1 5 7 0 , 0 5 5 4 3 9 , 0 6 8
I n c o m e T a x D e p a r t m e n t 1 , 1 6 9 , 8 5 0 1 , 2 6 9 , 2 0 9 6 9 1 , 3 6 2
G o o d s a n d S e r v i c e s 6 8 2 , 1 9 3 6 6 6 , 0 8 9 5 5 5 , 9 6 1
M i s c e l l a n e o u s 2 8 9 , 2 3 2 2 9 4 , 3 5 0 1 7 6 , 1 2 5
R o a d U s e r C h a r g e s 9 5 , 9 3 8 8 9 , 0 2 9 9 6 , 6 5 6
G R A N T S 7 5 5 , 5 5 3 7 2 6 , 4 5 8 1 , 1 0 0 , 7 0 7
P r o g r a m m e 3 4 5 , 7 8 8 2 0 1 , 0 9 6 6 8 0 , 1 5 4
D e v e l o p m e n t P r o j e c t s 2 8 8 , 1 9 5 4 2 0 , 5 5 3
T O T A L E X P E N D I T U R E & N E T L E N D I N G 4 , 7 4 2 , 1 3 2 5 , 4 4 0 , 6 4 7 4 , 3 0 8 , 3 9 2
O f w h i c h :
C u r r e n t E x p e n d i t u r e 3 , 1 6 1 , 0 4 1 3 , 5 5 3 , 2 5 2 2 , 8 0 7 , 5 9 2
D e v e l o p m e n t E x p . & N e t L e n d i n g 1 , 5 8 1 , 0 9 1 1 , 8 8 7 , 3 9 5 1 , 5 0 0 , 8 0 0
C U R R E N T B A L A N C E + / - ( I n c l u d i n g g r a n t s ) 3 9 2 , 4 7 6 6 1 , 9 3 8 2 5 2 , 2 8 7
B a s i c P r i m a r y B a l a n c e ( 6 9 1 , 1 3 1 ) ( 1 , 2 8 7 , 9 0 0 ) ( 1 , 2 4 7 , 4 6 2 )
O V E R A L L D E F I C I T / S U R P L U S + / - ( I n c l . g r a n t s ) ( 1 , 9 4 4 , 1 6 8 ) ( 1 , 8 2 5 , 4 5 7 ) ( 1 , 2 4 8 , 5 1 3 )
F I N A N C I N G 1 , 9 4 4 , 1 6 8 1 , 8 2 5 , 4 5 7 1 , 2 4 8 , 5 1 3
D o m e s t i c 8 4 9 , 8 5 0 1 , 1 3 1 , 2 9 2 8 1 3 , 4 0 2
O f w h i c h :
B a n k F i n a n c i n g 7 4 7 , 4 0 6 9 9 3 , 4 2 8 8 2 9 , 2 5 1
N o n - B a n k F i n a n c i n g 1 0 2 , 4 4 4 1 3 7 , 8 6 4 ( 1 5 , 8 4 9 )
P r i v a t i s a t i o n R e c e i p t s 0 0 -
E x t e r n a l 3 7 6 , 3 8 3 3 7 5 , 6 3 0 4 6 2 , 5 4 8
S o u r c e : B u d g e t B u r e a u , M i n i s t r y o f F i n a n c e
27
BANK OF SIERRA LEONE
3.3.2 Government Expenditure
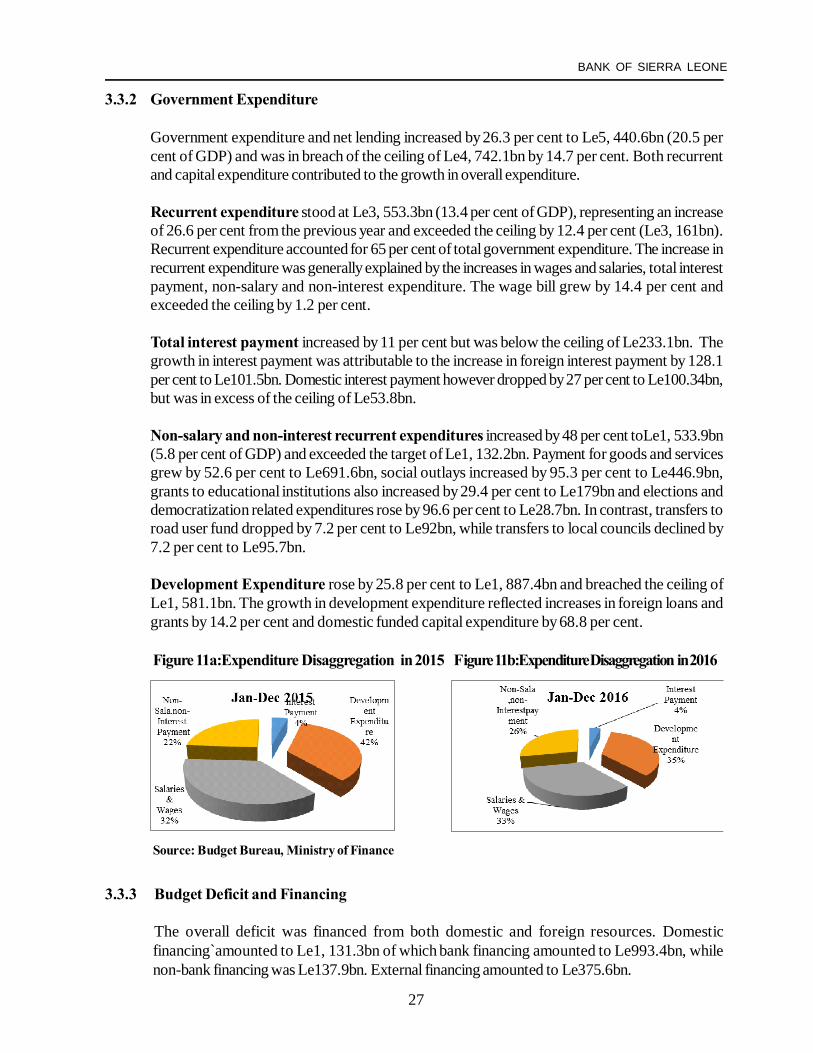
Government expenditure and net lending increased by 26.3 per cent to Le5, 440.6bn (20.5 percent of GDP) and was in breach of the ceiling of Le4, 742.1bn by 14.7 per cent. Both recurrentand capital expenditure contributed to the growth in overall expenditure.
Recurrent expenditure stood at Le3, 553.3bn (13.4 per cent of GDP), representing an increaseof 26.6 per cent from the previous year and exceeded the ceiling by 12.4 per cent (Le3, 161bn).Recurrent expenditure accounted for 65 per cent of total government expenditure. The increase inrecurrent expenditure was generally explained by the increases in wages and salaries, total interestpayment, non-salary and non-interest expenditure. The wage bill grew by 14.4 per cent andexceeded the ceiling by 1.2 per cent.
Total interest payment increased by 11 per cent but was below the ceiling of Le233.1bn. Thegrowth in interest payment was attributable to the increase in foreign interest payment by 128.1per cent to Le101.5bn. Domestic interest payment however dropped by 27 per cent to Le100.34bn,but was in excess of the ceiling of Le53.8bn.
Non-salary and non-interest recurrent expenditures increased by 48 per cent toLe1, 533.9bn(5.8 per cent of GDP) and exceeded the target of Le1, 132.2bn. Payment for goods and servicesgrew by 52.6 per cent to Le691.6bn, social outlays increased by 95.3 per cent to Le446.9bn,grants to educational institutions also increased by 29.4 per cent to Le179bn and elections anddemocratization related expenditures rose by 96.6 per cent to Le28.7bn. In contrast, transfers toroad user fund dropped by 7.2 per cent to Le92bn, while transfers to local councils declined by7.2 per cent to Le95.7bn.
Development Expenditure rose by 25.8 per cent to Le1, 887.4bn and breached the ceiling ofLe1, 581.1bn. The growth in development expenditure reflected increases in foreign loans andgrants by 14.2 per cent and domestic funded capital expenditure by 68.8 per cent.
Figure 11a:Expenditure Disaggregation in 2015 F igure 11b:Expenditure Disaggregation in 2016
Source: Budget Bureau, Ministry of Finance
3.3.3 Budget Deficit and Financing
The overall deficit was financed from both domestic and foreign resources. Domesticfinancing`amounted to Le1, 131.3bn of which bank financing amounted to Le993.4bn, whilenon-bank financing was Le137.9bn. External financing amounted to Le375.6bn.
28
ANNUAL REPORT AND STATEMENT OF ACCOUNTS
4.0 Monetary Developments
4.1 Monetary Policy Stance and Challenges
Monetary policy in 2016 was geared towards achieving an end-year inflation target of 9.5 percent,stability of the exchange rate and accumulation of a level of international reserves equivalent tothree months of imports of goods and services. In addition, monetary policy was tailored tosupport the Government's Post Ebola Recovery Priorities.
During the year 2016, the implementation of monetary policy was challenged by significantdepreciation of the exchange rate, food supply shock and upward adjustments in the pump priceof fuel and electricity tariffs, which together had knock-on effects on domestic prices. Consequently,domestic prices remained high throughout the year resulting to an inflation rate of 17.41 per cent,as of December 2016 which was above the end year target of 9.5 percent.
Notwithstanding the price developments, the Monetary Policy Committee (MPC) in its quarterone and two meetings maintained Monetary Policy Rate at 9.5 per cent, motivated by the need tosupport the economic recovery process in the face of negative output gap.
However, in the second half of the year, to contain the second round effects of additional supply-side inflationary shocks, coupled with the depreciation of the exchange rate, the MPC judged thattightening of monetary policy was warranted. Consequently, the MPR was raised cumulatively by150 basis points from 9.5 per cent in June 2016 to 11.0 per cent in December 2016.
To further improve on the transmission of monetary policy signals and limit interest rate volatility inthe money market, BSL in September 2016 introduced an Interest Rate Corridor System. Thiscorridor consists of a Standing Deposit Facility (SDF) rate set at the lower bound and a StandingLending Facility (SLF) set at the upper bound, both accessible at the discretion of the commercialbanks. At the inception of this corridor, the SDF rate was set at 400 basis points below the MPRand the SLF set at100 basis point above the MPR.
4.2 Developments in Monetary Aggregates
Broad Money (M2) expanded by 16.49 per cent, higher than the 11.34 per cent growth raterecorded in the preceding year, but was within end of year ECF program target of 17.9 per cent.The expansion in M2 was attributed to the increase in Net Domestic Assets (NDA) of the bankingsystem, which was reinforced by a moderate growth in Net Foreign Assets (NFA) of the bankingsystem. The NDA expanded by 31.69 per cent and contributed 13.10 per cent to the growth inM2. The increase in NDA was mostly as a result of fiscal operations which was financed mainlyby the banking system through increased utilization of 'Ways and Means Accounts' (from Le24.34bnin December 2015 to Le48.18bn in December 2016) and increases in government security holdingsby commercial banks amounting to (Le267.52bn).
In addition, the growth in NDA was reinforced by credit extended to the private sector bycommercial banks. Private sector credit registered a 16.93 per cent increase, far higher than the2.15 per cent growth recorded in the preceding year of 2015.
29
BANK OF SIERRA LEONE
In terms of sectorial distribution of private sector credit, the construction sector benefited themost with Le 290.02mn, followed by import trade amounting to Le 271.34mn and other sectorsas shown in Figure 13.
NFA expanded by 5.78 per cent and contributed to the growth in M2 by 3.40 per cent. Thisgrowth in NFA was mainly driven by foreign currency importation by commercial banks(Le10.47bn), export receipts and royalties paid by mining companies (Le39.70bn) and increasein the claims on overseas banks by commercial banks (Le329.32bn). Other inflows included theIMF and other donor partners in respect to the ECF programme (Le583.59bn), Airtel capitalgain tax (Le30bn), and BSL's interest income from BIS (Le11.79bn).
However the growth in NFA was moderated due to significant autonomous outflows during theyear such as; wholesale foreign exchange auction, salaries, wages and allowances for embassiesand foreign missions, rehabilitation of roads and medical projects by the government, debt servicesand subscriptions to development partners, payment for reprinting of banknotes and revaluationeffect on foreign assets and liabilities arising from the depreciation of the Leone against the USdollar and other major international currencies.
On the liability side of M2, currency-in-circulation increased by 7.57 per cent while demanddeposits increased by 6.62 per cent. Foreign currency deposits and time deposits increased by56 per cent and 24 per cent respectively, reflecting capital accumulation through the bankingsystem .
Reserve Money (RM) increased by 24.50 per cent, which is higher than the 10.46 per centgrowth recorded in 2015, and slightly above the program target (23.9%).
4.3 Interest Rates
Yields rates in government securities market generally increased in 2016, except for the interestrate on one year treasury bond which remained unchanged at 5 per cent. As at end December,2016, average yield on 91 days treasury bills increased by 830 basis points, from 1.08 per centin December, 2015 to 9.38 per cent in December, 2016 while the 182 days and 364 daysincreased by 1,306 and 2,031 basis points from 3.11 per cent to 16.17 per cent and 9.91 percentto 30.22 per cent respectively for the same period. The yield on the 364 days treasury bills wasrelatively high and rose up to 33.21 per cent on 17th November, 2016.
In the interbank market, the average weighted yield increased by 680 basis points from 2.86 percent in December 2015 to 9.66 per cent as at end December, 2016. Figure 13 below shows thetrend in the yields/rates of government securities in the primary and interbank markets.
The interest rate on savings deposits declined from 2.54 per cent to 2.38 per cent, whereasinterest rates on time deposits with different maturities declined as follows: 1-month from 2.73 percent to 2.57 per cent, 3-months from 2.98 per cent to 2.87 per cent and 6-months from 4.20 percent to 4.07 per cent. Interest rate on the twelve months' time deposit decreased slightly from6.59 per cent to 5.84 per cent, whereas the rate on nine months' time deposits was unchanged at3.38 per cent. On the lending side, the average lending rate by commercial banks moved downslightly from the range of 18.12 - 24.80 per cent to 17.92 - 24.77 per cent.

30
ANNUAL REPORT AND STATEMENT OF ACCOUNTS
Figure 12: Trend in the Yields of Government Securitiesin the Primary and Secondary Markets
Source: Bank of Sierra Leone
4.4 Developments in Government Securities Market
The primary market for Government securities in 2016, exhibited oversubscription in the 364 daysT-bills while the 91 and 182 days T-bills were under-subscribed. The one year Treasury bond wasalso largely undersubscribed in 2016. At the same time, a two years treasury bond was discontinueddue to persistent under-subscription.
The stock of marketable government securities increased by 28.06 per cent from Le2, 248.41bnrecorded in 2015, to Le2, 879.32bn in 2016. During the year, demand for Government securitieswas skewed towards the long end of the market, as the stock of the 364 days T- bills accounted for91.07 per cent in 2016.
Consequently, the 364 days T-bills increased by Le785.10bn (42.73%) from Le1, 837.23bn toLe2, 622.33bn for the same periods. On the other hand, the stock of 182 days T-bills dropped byLe151.05bn (66.58%) from Le226.85bn at end December 2015, to Le75.80bn as at end December2016, Similarly, the stock of 91 days T-bills decreased by Le20.27bn (42.35%) to Le27.59bn in2016.
With regard to the treasury bonds, the stock of one year Treasury bond decreased by Le30.95bn(40.34%) from Le76.72bn at end December, 2015 to Le45.77bn as at end December, 2016,whereas that for the two year treasury bonds increased from Le59.72bn at end December 2015 toLe66.75bn as at end December 2016. During 2016, the Government also issued 5 Year TreasuryBonds to NASSIT valued at Le41.07bn

31
BANK OF SIERRA LEONE
Figure 13: Stock of Government Securities by Tenure
Source: Bank of Sierra Leone
In 2016, holdings of marketable Government securities (see Figure 14) increased in all sectors,with commercial banks, as a major holder, increased their holdings by Le270.84bn (13.91%) toLe2, 217.28bn. Similarly, BSL holdings increased substantially by Le222.21bn to Le244.53bn in2016, mainly due to the outright purchase of T-bills from the banks to provide liquidity to themarket. Non-Bank Public Sector holdings (excluding NASSIT) increased by Le77.65bn fromLe191.67bn as at end December, 2015 to Le269.32bn as at end December, 2016. NASSITholdings also increased by Le60.21bn from Le87.98bn as at end December, 2015 to Le148.19bnas at end December, 2016.
Figure 14: Holdings of Government Securities by Sector (In Billions of Leones)
Source: Bank of Sierra Leone
With regards developments in the secondary market, the volume of interbank transactionsamounted to Le1, 370.58bn in 2016, about 54.74 per cent higher compared to the volumerecorded in 2015. As a result of liquidity constraints, commercial banks accessed the BSL'sStanding Lending Facility for the amount of Le1, 074.00bn in 2016, despite the injection ofLe608.19bn through outright purchase of T-bills by BSL.

32
ANNUAL REPORT AND STATEMENT OF ACCOUNTS
Table 7: Stock of Marketable Government Securities Outstanding by Holder (in Millions of Leones)
Dec-15 Dec-16 Change
91 Days Treasury Bearer Bonds 47,868.75 27,594.20 (20,274.15)Bank of Sierra Leone 5,090.15 - (5,090.15)Commercial Banks 21,721.55 16,965.20 (4,763.35)Non-Bank Public 19,711.40 19,636.40 (9,075.00)Nassit 1,345.65 - (1,345.65)
182 Days Treasury Bearer Bonds 226,852.75 75,802.95 (151,049.80)Bank of Sierra Leone 4,505.20 6,295.15 1,789.95Commercial Banks 195,751.15 59,658.30 (136,092.85Non-Bank Public 26,596.40 9,849.50 (16,746.90)Nassit - - -
364 Days Treasury Bearer Bonds 1,837,233.25 2,622,329.15 785,095.90Bank of Sierra Leone 6,540.50 229,041.65 222,501.15Commercial Banks 1,725,972.10 2,130,666.00 404,693.90Non-Bank Public 69,574.05 206,988.20 137,414.15Nassit 35,146.60 55,633.30 20,486.70
1Year Treasury Bonds 76,720.25 45,773.85 (30,946.40)Bank of Sierra Leone 6,184.65 9,195.45 3,010.80Commercial Banks - - -Non-Bank Public 70,535.60 36,578.40 (33,957.20)Nassit - - -
2Years Treasury Bonds 59,736.65 66,751.65 7,015.00Bank of Sierra Leone - - -Commercial Banks 3,000.00 10,000.00 7,000.00Non-Bank Public 5,249.65 5,264.65 15.00Nassit 51,487.00 51,487.00 -
5Years Treasury Bonds - 41,071.80 41,071.80Bank of Sierra Leone - - -Commercial Banks - - -Non-Bank Public - - -Nassit - 41,071.80 21,071.80
Total 2,248,411.65 2,879,324.00 630,912.35Bank of Sierra Leone 22,320.50 244,532.25 222,211.75Commercial Banks 1,946,4444.80 2,217,282.50 270,837.70Non-Bank Public 191,667.10 269,317.15 77,650.05Nassit 87,979.25 149,192.10 60,212.85
Source: Bank of Sierra Leone
33
BANK OF SIERRA LEONE
5.0 External Sector Developments
5.1 Overview of the External Sector
Despite the weak performance of the global economy in 2016, Sierra Leone's external sectorperformance improved as the trade deficit reduced significantly to US$463.49mn fromUS$1,017.11mn in 2015. This improvement was as a result of the combined effects of an increasein exports and a decrease in imports.
Figure 15: External Trade, 2016
5.2 Exports
The value of exports during the review period increased by 21.6 per cent to US$624.02mn in 2016from US$513.21mn in 2015, mainly as a result of improvement in the prices of metals (especiallythe pick-up in iron ore prices).
The value of mineral exports in 2016 reached US$469.98mn, representing an increase of 33.1 percent compared to the value in 2015 (US$353.23mn). The value of iron ore exports improvedsignificantly to US$142.33 in 2016 from US$54.39mn in 2015; as a result of the recovery in ironore prices as well as the increase in the volumes of iron ore exported in 2016. Diamond exportsincreased by 3 percent from US$154.32mn in 2015 to US$158.94mn in 2016, reflecting favorablemarket conditions as well as increased volume. The export value of rutile increased by 17.4 percent from US$91.08mn in 2015 to US$106.95 in 2016, supported by the boost in production anda moderate price rise. Additionally, export values for both gold and bauxite increased fromUS$3.67mn and US$43.16mn in 2015 to US$6.71mn and US$51.08mn in 2016 respectively,mainly as a result of increase in volumes exported in 2016.
The receipts from agricultural exports increased by 7.7 per cent to US$26.58mn in 2016 fromUS$24.66mn in 2015, reflecting significant increase in the export value of coffee and the moderatepickup in the export value of other agricultural products. However, the export value of cocoadeclined to US$18.12mn in 2016, from US$19.15mn in 2015, reflecting a decline in the worldmarket price for cocoa in 2016.
2015 2016Total imports 1,530.32 1,087.51Total exports 513.21 624.02Trade balance -1,017.11 -463.49
-1,500.00
-1,000.00
-500.00
0.00
500.00
1,000.00
1,500.00
2,000.00
US$ Million

34
ANNUAL REPORT AND STATEMENT OF ACCOUNTS
Table 8: International Trade and Reserves (US Dollars)
Jan-Dec'15 Jan-Dec'16
Merchandise Imports 1,530,320.5 1,087,509.0Consumer Goods 342,274.6 580.0123.8of which Food 527,864.2 298,730.4 Rice 141,490.0 96,887.3Beverages and Tobacco 43,609.8 38,455.3Crude Materials 41,372.3 48,767.0Mineral Fuels and Lubricants of which 277,957.7 183,748.2Fuel 245,481.4 98,691.4Animal and Vegetable Oils 8,539.8 5,088.9Chemicals 51,848.1 75,072.5Manufactured Goods 121,595.2 124,384.3Machinery and Transport Equipment 334,805.4 206,934.4Other Imports 122,727.9 106,327.8Merchandise Exports 513,207.2 624,019.2of which - -Mineral Exports 353,227.8 469,979.2Diamonds 154,320.0 158,939.5Bauxite 43,160.0 51,077.1Rutile 91,081.6 106,953.5Gold 3,667.8 6,708.6Ilmenite 5,296.6 3,141.3Iron Ore 54,386.0 142,333.0Zircom 1,272.5 826.2Other Minerals /1 43.4 -Agricultural Exports 24,657.7 26,567.7Coffee 1,346.0 3,416.5Cocoa 19,148.7 18,115.4Piassava - -Fish and Shrimps 4,163.0 5,035.8Others 110,802.3 122,721.1Re-exports 24,519.4 4,751.2Trade Balance (1,017,113.3) (463,489.8)Foreign Reserves ($mn) 580.3 503.79
Source: National Revenue Authority (NRA)
35
BANK OF SIERRA LEONE
5.3 Imports
The total value of imports (C.I.F.) declined by 28.9 per cent from US$1,530.32mn in 2015 toUS$1,087.51mn in 2016. This was driven mainly by the decline in the import bills for consumergoods, machinery & transport equipment and mineral fuel & lubricants imports.
Payments for consumer goods declined by 41 per cent to US$342.27mn in 2016 fromUS$580.01mn in 2015. This decline was reflected in all the sub-components, notably, food (includingrice), beverages & tobacco and animal & vegetable oil, which declined by 43.4 percent (31.5percent for rice), 11.8 percent and 40.4 percent, respectively.
Similarly, import bills for machinery & transport equipment and mineral fuel & lubricants declined toUS$206.93mn and US$183.75mn in 2016 from US$334.81mn and US$277.96mn in 2015respectively. Payment for fuel significantly declined by 60 per cent to US$98.69mn in 2016 fromUS$245.48mn in 2015. However, there was an increase in the import bills for intermediary andmanufactured goods by 32.8 per cent and 2.3 per cent to US$123.84mn and US$124.38mn in2016 from US$93.22mn and US$121.59mn in 2015, respectively.
Figure 16: Composition of Imports 2016
6.0 Developments in the Foreign Exchange Market
6.1 OverviewThe stability of the exchange rate was challenged in 2016, due to the structural imbalance in thesupply and demand for foreign exchange, which led to the persistent depreciation of the Le/USDexchange rate of 28.73 per cent in 2016.
The structural imbalance resulted in a reduction in the supply of foreign exchange due to the declinein post Ebola related foreign exchange inflows from donors, the speculative behavior of marketparticipants and increased demand for foreign exchange for the importation of goods and services.
36
ANNUAL REPORT AND STATEMENT OF ACCOUNTS
6.2 Foreign Exchange FlowsThe total amount traded in the Foreign exchange market in 2016 was USD1.18bn, a 32.72 percent decline compared to the amount traded in 2015. The monthly average amount traded in 2016was USD0.98bn compared to USD0.15bn in 2015.
6.3 Purchases and Sales of Foreign Exchange by Commercial BanksTotal purchase of foreign exchange in 2016 decreased by 38.44 per cent to USD 0.42bn comparedto USD 0.69bn recorded in 2015. This sharp drop in foreign exchange inflows could be partiallyattributed to the fall in real sector activities (mining, agriculture and services) including a decline indonors' disbursement.
The total sales of foreign exchange by commercial banks in 2016 decreased by 34.94 per centcompared to the total sales in 2015 which is USD0.89bn. Reduction in sales of foreign exchangewere recorded for payments for food stuff and manufactured goods, rice imports, telecommunicationsand petroleum products.
Figure 17: Commercial Banks Purchases and Sales of Foreign exchange
6.4 Receipts into and Payments from Customers Foreign Currency (CFC) accounts
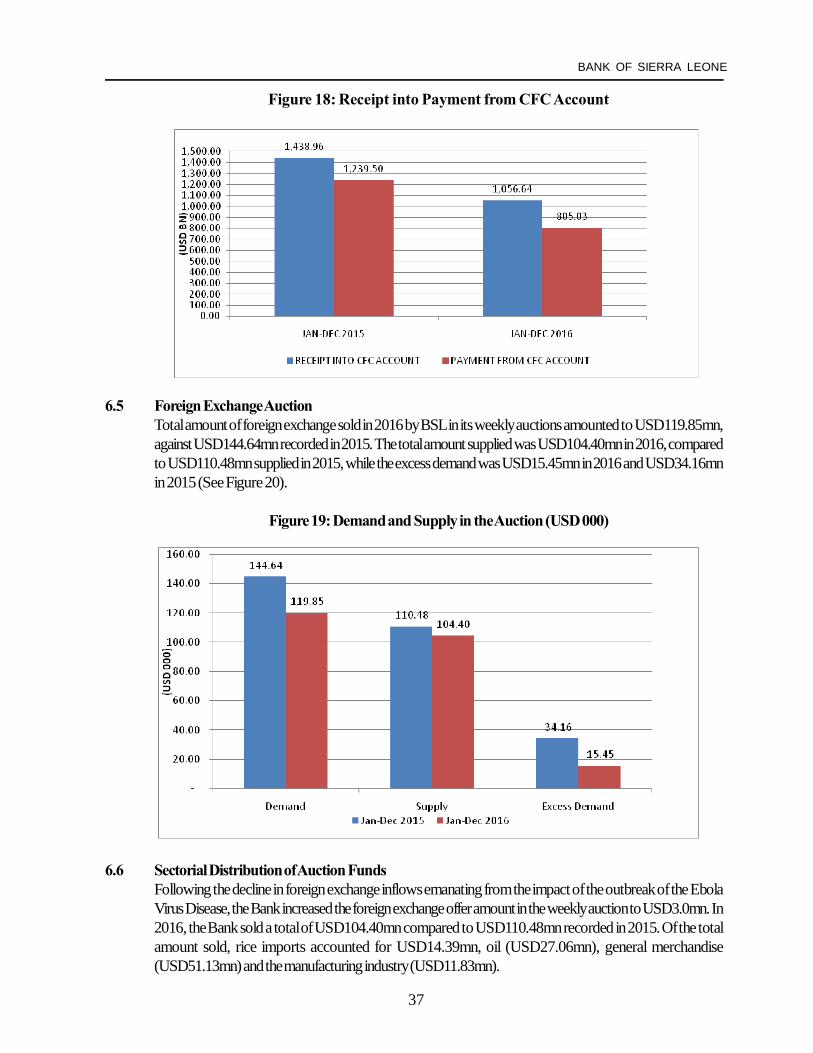
Receipts into CFC account in 2016 decreased by 26.57 per cent to USD1.06bn compared toUSD1.44bn recorded in 2015. The sectors which recorded significant decreases in foreignexchange receipts include mining, international organizations, agricultural activities and constructionactivities.
Payments from CFC account in 2016 decreased by 35.05 per cent to USD0.81bn compared toUSD1.24bn recorded in 2015. The decrease in payments reflected reduced sales of foreignexchange to food stuff and manufactured goods importers, rice importers, telecommunicationcompanies, petroleum products, logistic companies and diamond exporters.
37
BANK OF SIERRA LEONE
Figure 18: Receipt into Payment from CFC Account
6.5 Foreign Exchange AuctionTotal amount of foreign exchange sold in 2016 by BSL in its weekly auctions amounted to USD119.85mn,against USD144.64mn recorded in 2015. The total amount supplied was USD104.40mn in 2016, comparedto USD110.48mn supplied in 2015, while the excess demand was USD15.45mn in 2016 and USD34.16mnin 2015 (See Figure 20).
Figure 19: Demand and Supply in the Auction (USD 000)
6.6 Sectorial Distribution of Auction FundsFollowing the decline in foreign exchange inflows emanating from the impact of the outbreak of the EbolaVirus Disease, the Bank increased the foreign exchange offer amount in the weekly auction to USD3.0mn. In2016, the Bank sold a total of USD104.40mn compared to USD110.48mn recorded in 2015. Of the totalamount sold, rice imports accounted for USD14.39mn, oil (USD27.06mn), general merchandise(USD51.13mn) and the manufacturing industry (USD11.83mn).

38
ANNUAL REPORT AND STATEMENT OF ACCOUNTS
Figure 20: Sectorial Distribution of Auction Funds January- December 2016
6.7 Foreign Exchange Rate MovementsReflecting the developments in the volume of the transaction, the year-on-year exchange rate ofthe Leone against the United States dollar depreciated in 2016 as following: the official ratedepreciated by 28.73 per cent, BSL auction rate by 28.07 per cent and commercial banks' rateby 30.73 per cent. The parallel market rate also depreciated by 28.58 per cent.
In principle, the continuous depreciation of the Leone against major international currencies reflectsincreased demand relative to the supply of foreign exchange. However, the mismatch betweengovernment revenue and expenditure, coupled with the aggressive bidding by some commercialbanks for donor funds which were auctioned offshore by international brokerage firms have alsocontributed to the instability of the exchange rate. Speculative behavior by some market participantsalso contributed to the pressure in the market.
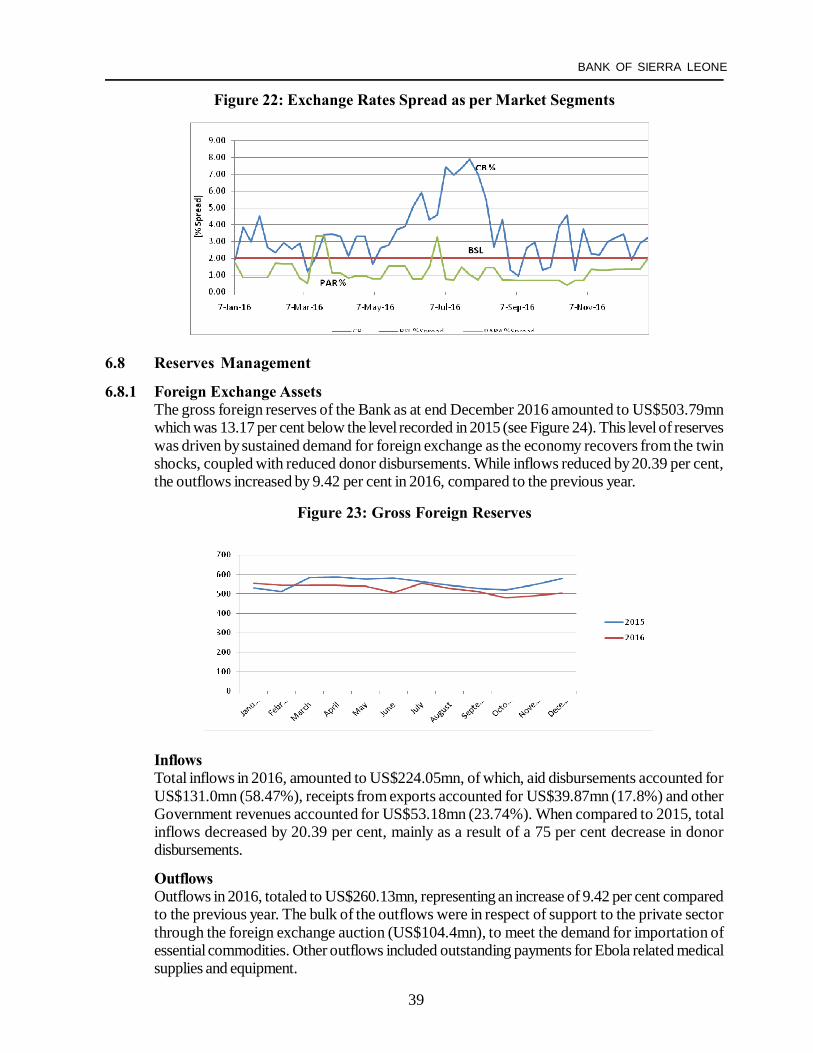
The spread in the official BSL rates remained constant at 2 per cent. However, the spreads in thecommercial banks and parallel market rates varied. While the spread in the commercial banks'rate was slightly above 3 per cent (reflecting the tightness in the market and limited flow of foreignexchange), the spread in the parallel market was mostly below 2 per cent (see Figure 22).
Figure 21: Exchange Rate Depreciation (y-o-y)
39
BANK OF SIERRA LEONE
Figure 22: Exchange Rates Spread as per Market Segments
6.8 Reserves Management
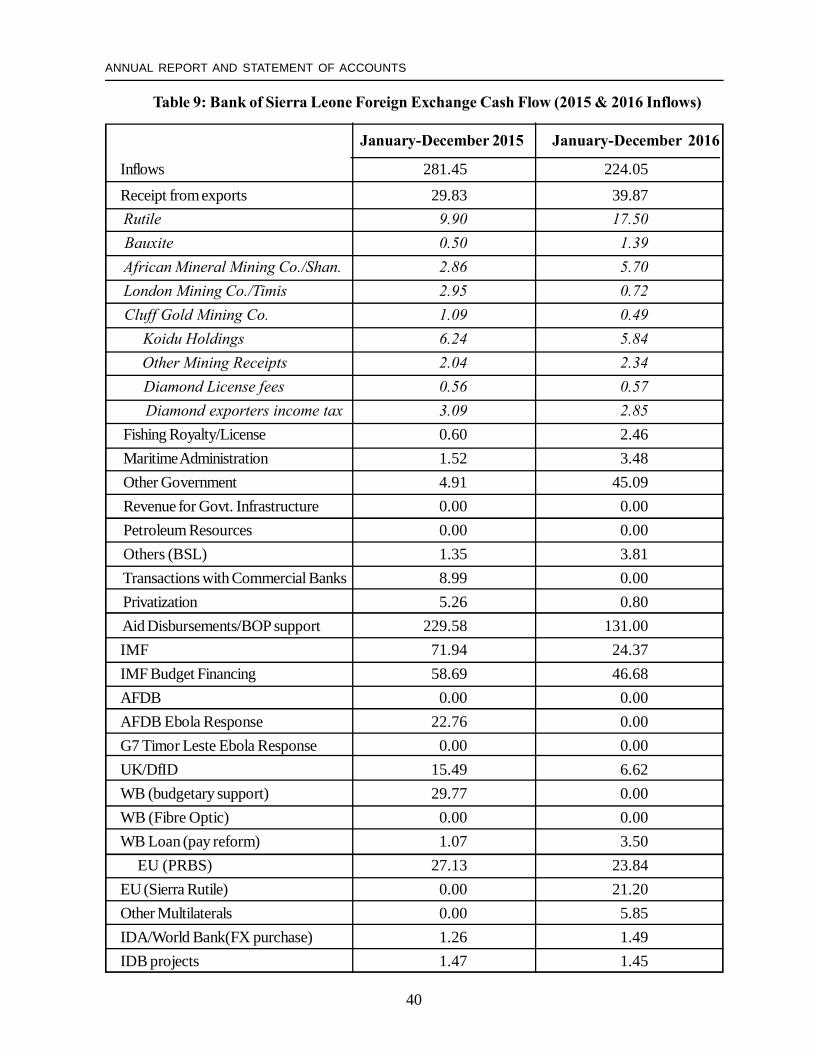
6.8.1 Foreign Exchange AssetsThe gross foreign reserves of the Bank as at end December 2016 amounted to US$503.79mnwhich was 13.17 per cent below the level recorded in 2015 (see Figure 24). This level of reserveswas driven by sustained demand for foreign exchange as the economy recovers from the twinshocks, coupled with reduced donor disbursements. While inflows reduced by 20.39 per cent,the outflows increased by 9.42 per cent in 2016, compared to the previous year.
Figure 23: Gross Foreign Reserves
InflowsTotal inflows in 2016, amounted to US$224.05mn, of which, aid disbursements accounted forUS$131.0mn (58.47%), receipts from exports accounted for US$39.87mn (17.8%) and otherGovernment revenues accounted for US$53.18mn (23.74%). When compared to 2015, totalinflows decreased by 20.39 per cent, mainly as a result of a 75 per cent decrease in donordisbursements.
OutflowsOutflows in 2016, totaled to US$260.13mn, representing an increase of 9.42 per cent comparedto the previous year. The bulk of the outflows were in respect of support to the private sectorthrough the foreign exchange auction (US$104.4mn), to meet the demand for importation ofessential commodities. Other outflows included outstanding payments for Ebola related medicalsupplies and equipment.
40
ANNUAL REPORT AND STATEMENT OF ACCOUNTS
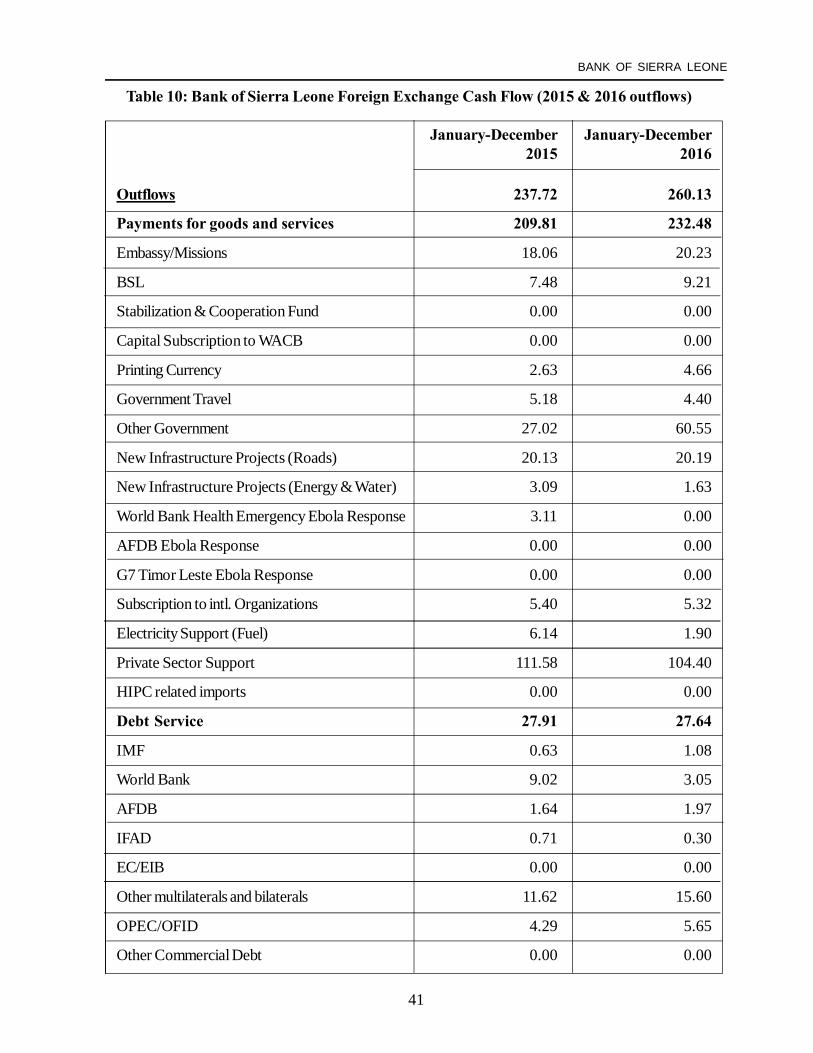
Table 9: Bank of Sierra Leone Foreign Exchange Cash Flow (2015 & 2016 Inflows)
January-December 2015 January-December 2016
Inflows 281.45 224.05Receipt from exports 29.83 39.87 Rutile 9.90 17.50 Bauxite 0.50 1.39 African Mineral Mining Co./Shan. 2.86 5.70 London Mining Co./Timis 2.95 0.72 Cluff Gold Mining Co. 1.09 0.49 Koidu Holdings 6.24 5.84 Other Mining Receipts 2.04 2.34 Diamond License fees 0.56 0.57 Diamond exporters income tax 3.09 2.85 Fishing Royalty/License 0.60 2.46 Maritime Administration 1.52 3.48 Other Government 4.91 45.09 Revenue for Govt. Infrastructure 0.00 0.00 Petroleum Resources 0.00 0.00 Others (BSL) 1.35 3.81 Transactions with Commercial Banks 8.99 0.00 Privatization 5.26 0.80 Aid Disbursements/BOP support 229.58 131.00IMF 71.94 24.37IMF Budget Financing 58.69 46.68AFDB 0.00 0.00AFDB Ebola Response 22.76 0.00G7 Timor Leste Ebola Response 0.00 0.00UK/DfID 15.49 6.62WB (budgetary support) 29.77 0.00WB (Fibre Optic) 0.00 0.00WB Loan (pay reform) 1.07 3.50 EU (PRBS) 27.13 23.84EU (Sierra Rutile) 0.00 21.20Other Multilaterals 0.00 5.85IDA/World Bank(FX purchase) 1.26 1.49IDB projects 1.47 1.45
41
BANK OF SIERRA LEONE
Table 10: Bank of Sierra Leone Foreign Exchange Cash Flow (2015 & 2016 outflows)
January-December January-December2015 2016
Outflows 237.72 260.13
Payments for goods and services 209.81 232.48
Embassy/Missions 18.06 20.23
BSL 7.48 9.21
Stabilization & Cooperation Fund 0.00 0.00
Capital Subscription to WACB 0.00 0.00
Printing Currency 2.63 4.66
Government Travel 5.18 4.40
Other Government 27.02 60.55
New Infrastructure Projects (Roads) 20.13 20.19
New Infrastructure Projects (Energy & Water) 3.09 1.63
World Bank Health Emergency Ebola Response 3.11 0.00
AFDB Ebola Response 0.00 0.00
G7 Timor Leste Ebola Response 0.00 0.00
Subscription to intl. Organizations 5.40 5.32
Electricity Support (Fuel) 6.14 1.90
Private Sector Support 111.58 104.40
HIPC related imports 0.00 0.00
Debt Service 27.91 27.64
IMF 0.63 1.08
World Bank 9.02 3.05
AFDB 1.64 1.97
IFAD 0.71 0.30
EC/EIB 0.00 0.00
Other multilaterals and bilaterals 11.62 15.60
OPEC/OFID 4.29 5.65
Other Commercial Debt 0.00 0.00

42
ANNUAL REPORT AND STATEMENT OF ACCOUNTS
6.8.2 Investment ActivitiesExternal investments in 2016, were in compliance with the BSL's Investment Guidelines.With regards currency composition, external investments were held in US dollar (US$),British Pound (GBP) and Special Drawing Rights (SDR). During the year 2016, the Bankinvested in short term fixed deposits with duration up to 3 months and overnight sweepfacility with Federal Reserve Bank NY.
Returns on the Bank's investment were influenced by the amount invested, the rate of interestand the duration of the investment. As shown in Figure 25, actual income earned by currencies(converted in US$) in 2016 amounted to US$1,545,207.66. Earnings on US$ depositsaccounted for 60.23 per cent, followed by GBP 35.14 per cent and SDR 4.63 per cent. Thelow performance on GBP investment was as a result of reduction in the deposit interest ratefrom 0.40 per cent to 0.06 per cent during 2016, whereas the encouraging performance inUS$ deposits was as a result of increase in interest rate by FED in the first and third quartersof 2016.
Figure 24: Actual Investments Income by Currencies, converted in US Dollars
Overall, the external investment of BSL in 2016 has improved compared to 2015(see Figure 23).
Figure 25: Actual Investments Income by Currencies, converted in US Dollars
43
BANK OF SIERRA LEONE
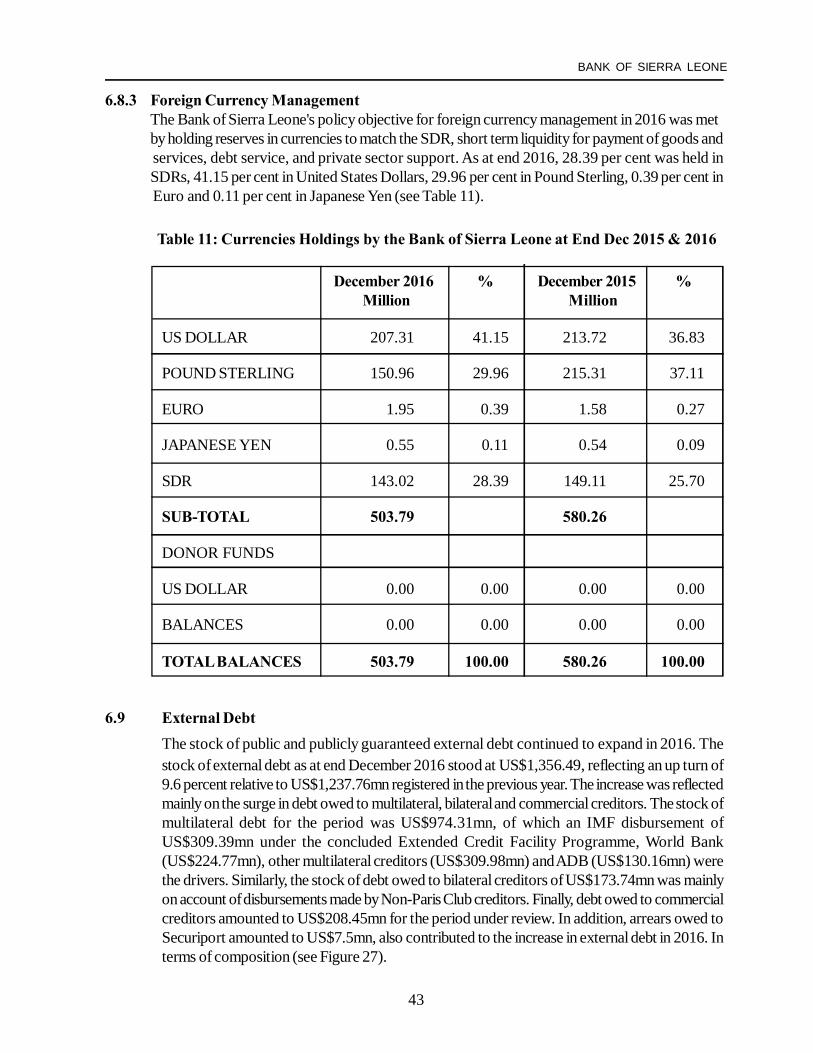
6.8.3 Foreign Currency ManagementThe Bank of Sierra Leone's policy objective for foreign currency management in 2016 was metby holding reserves in currencies to match the SDR, short term liquidity for payment of goods andservices, debt service, and private sector support. As at end 2016, 28.39 per cent was held inSDRs, 41.15 per cent in United States Dollars, 29.96 per cent in Pound Sterling, 0.39 per cent inEuro and 0.11 per cent in Japanese Yen (see Table 11).
Table 11: Currencies Holdings by the Bank of Sierra Leone at End Dec 2015 & 2016
December 2016 % December 2015 %Million Million
US DOLLAR 207.31 41.15 213.72 36.83
POUND STERLING 150.96 29.96 215.31 37.11
EURO 1.95 0.39 1.58 0.27
JAPANESE YEN 0.55 0.11 0.54 0.09
SDR 143.02 28.39 149.11 25.70
SUB-TOTAL 503.79 580.26
DONOR FUNDS
US DOLLAR 0.00 0.00 0.00 0.00
BALANCES 0.00 0.00 0.00 0.00
TOTAL BALANCES 503.79 100.00 580.26 100.00
6.9 External DebtThe stock of public and publicly guaranteed external debt continued to expand in 2016. Thestock of external debt as at end December 2016 stood at US$1,356.49, reflecting an up turn of9.6 percent relative to US$1,237.76mn registered in the previous year. The increase was reflectedmainly on the surge in debt owed to multilateral, bilateral and commercial creditors. The stock ofmultilateral debt for the period was US$974.31mn, of which an IMF disbursement ofUS$309.39mn under the concluded Extended Credit Facility Programme, World Bank(US$224.77mn), other multilateral creditors (US$309.98mn) and ADB (US$130.16mn) werethe drivers. Similarly, the stock of debt owed to bilateral creditors of US$173.74mn was mainlyon account of disbursements made by Non-Paris Club creditors. Finally, debt owed to commercialcreditors amounted to US$208.45mn for the period under review. In addition, arrears owed toSecuriport amounted to US$7.5mn, also contributed to the increase in external debt in 2016. Interms of composition (see Figure 27).
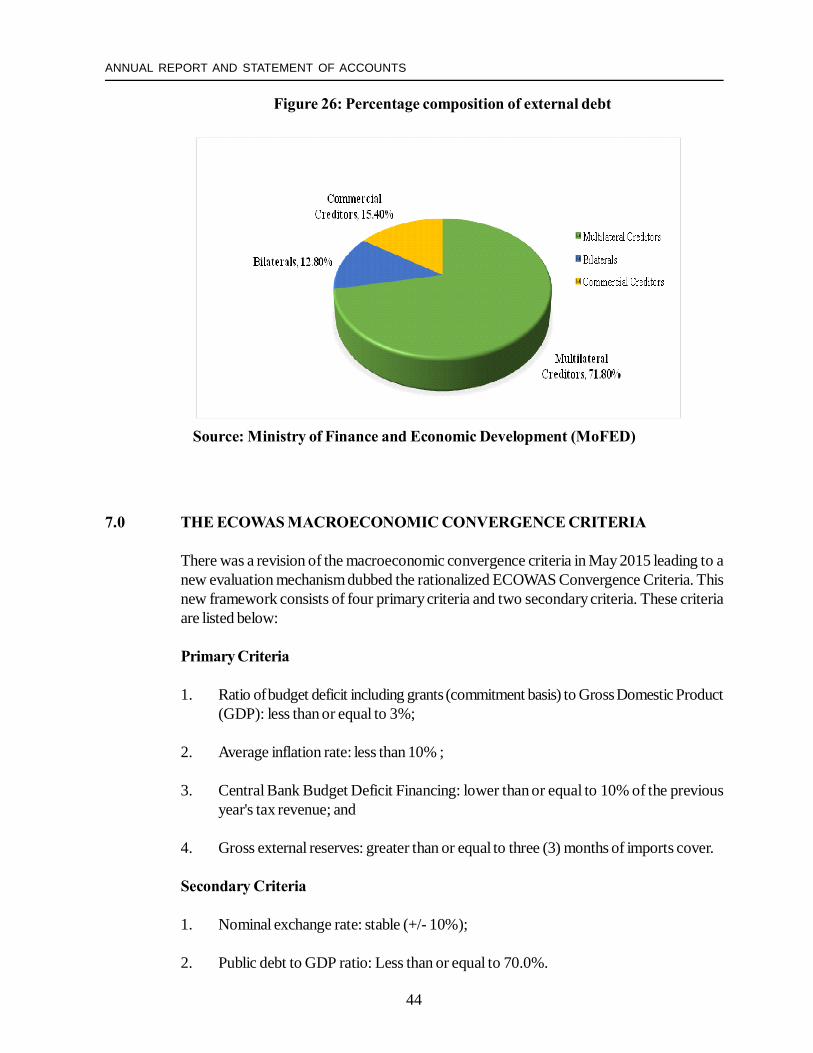
44
ANNUAL REPORT AND STATEMENT OF ACCOUNTS
Figure 26: Percentage composition of external debt
Source: Ministry of Finance and Economic Development (MoFED)
7.0 THE ECOWAS MACROECONOMIC CONVERGENCE CRITERIA
There was a revision of the macroeconomic convergence criteria in May 2015 leading to anew evaluation mechanism dubbed the rationalized ECOWAS Convergence Criteria. Thisnew framework consists of four primary criteria and two secondary criteria. These criteriaare listed below:
Primary Criteria
1. Ratio of budget deficit including grants (commitment basis) to Gross Domestic Product(GDP): less than or equal to 3%;
2. Average inflation rate: less than 10% ;
3. Central Bank Budget Deficit Financing: lower than or equal to 10% of the previousyear's tax revenue; and
4. Gross external reserves: greater than or equal to three (3) months of imports cover.
Secondary Criteria
1. Nominal exchange rate: stable (+/- 10%);
2. Public debt to GDP ratio: Less than or equal to 70.0%.
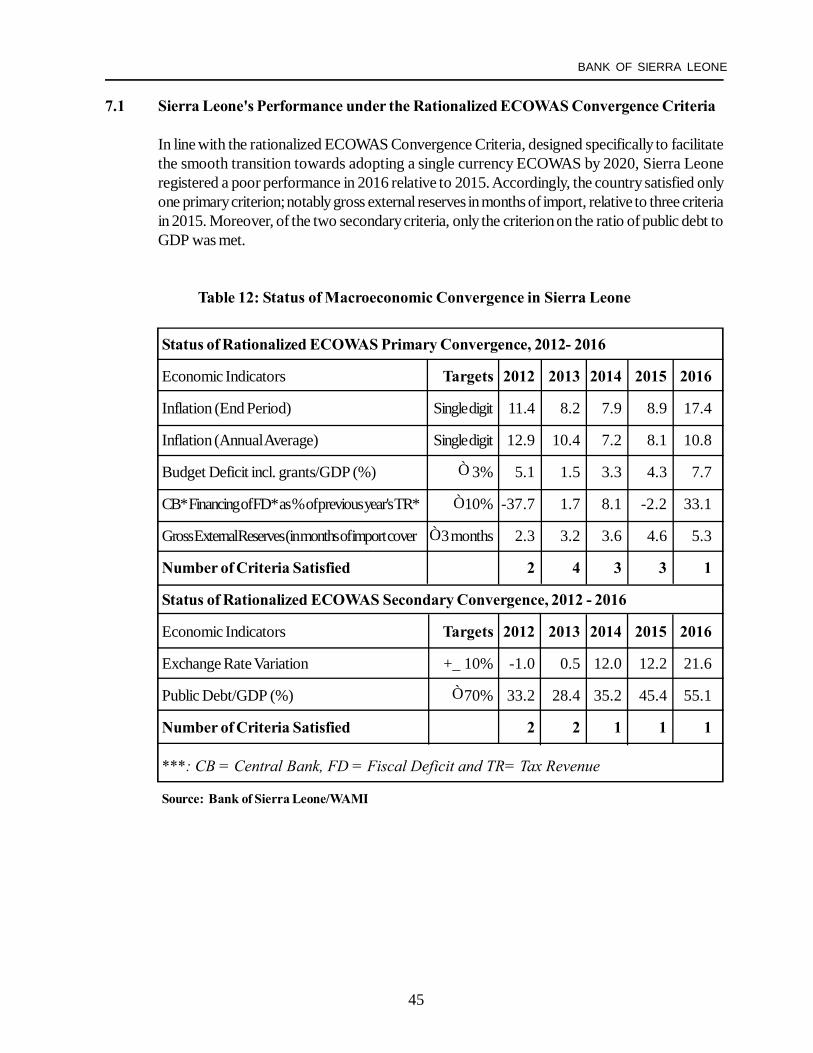
45
BANK OF SIERRA LEONE
7.1 Sierra Leone's Performance under the Rationalized ECOWAS Convergence Criteria
In line with the rationalized ECOWAS Convergence Criteria, designed specifically to facilitatethe smooth transition towards adopting a single currency ECOWAS by 2020, Sierra Leoneregistered a poor performance in 2016 relative to 2015. Accordingly, the country satisfied onlyone primary criterion; notably gross external reserves in months of import, relative to three criteriain 2015. Moreover, of the two secondary criteria, only the criterion on the ratio of public debt toGDP was met.
Table 12: Status of Macroeconomic Convergence in Sierra Leone
Status of Rationalized ECOWAS Primary Convergence, 2012- 2016
Economic Indicators Targets 2012 2013 2014 2015 2016
Inflation (End Period) Single digit 11.4 8.2 7.9 8.9 17.4
Inflation (Annual Average) Single digit 12.9 10.4 7.2 8.1 10.8
Budget Deficit incl. grants/GDP (%) 3% 5.1 1.5 3.3 4.3 7.7
CB* Financing of FD* as % of previous year's TR* 10% -37.7 1.7 8.1 -2.2 33.1
Gross External Reserves (in months of import cover 3 months 2.3 3.2 3.6 4.6 5.3
Number of Criteria Satisfied 2 4 3 3 1
Status of Rationalized ECOWAS Secondary Convergence, 2012 - 2016
Economic Indicators Targets 2012 2013 2014 2015 2016
Exchange Rate Variation +_ 10% -1.0 0.5 12.0 12.2 21.6
Public Debt/GDP (%) 70% 33.2 28.4 35.2 45.4 55.1
Number of Criteria Satisfied 2 2 1 1 1
***: CB = Central Bank, FD = Fiscal Deficit and TR= Tax Revenue
Source: Bank of Sierra Leone/WAMI
≤
≤
≤
≤
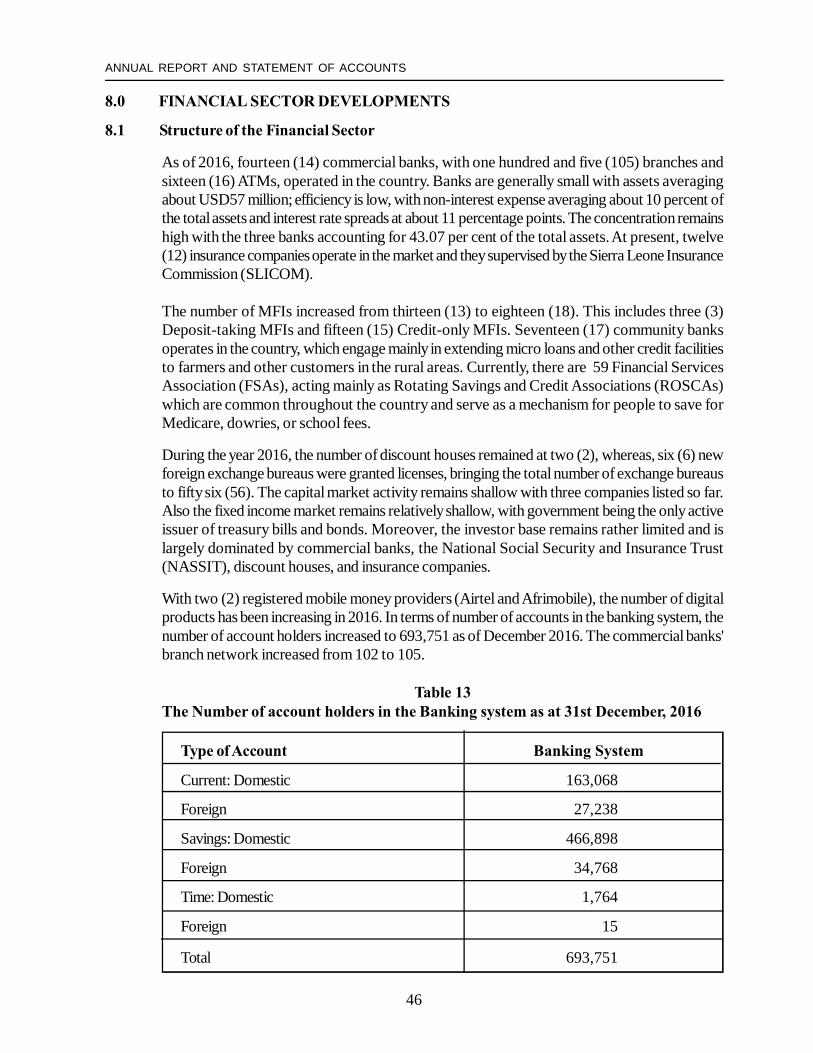
46
ANNUAL REPORT AND STATEMENT OF ACCOUNTS
8.0 FINANCIAL SECTOR DEVELOPMENTS
8.1 Structure of the Financial Sector
As of 2016, fourteen (14) commercial banks, with one hundred and five (105) branches andsixteen (16) ATMs, operated in the country. Banks are generally small with assets averagingabout USD57 million; efficiency is low, with non-interest expense averaging about 10 percent ofthe total assets and interest rate spreads at about 11 percentage points. The concentration remainshigh with the three banks accounting for 43.07 per cent of the total assets. At present, twelve(12) insurance companies operate in the market and they supervised by the Sierra Leone InsuranceCommission (SLICOM).
The number of MFIs increased from thirteen (13) to eighteen (18). This includes three (3)Deposit-taking MFIs and fifteen (15) Credit-only MFIs. Seventeen (17) community banksoperates in the country, which engage mainly in extending micro loans and other credit facilitiesto farmers and other customers in the rural areas. Currently, there are 59 Financial ServicesAssociation (FSAs), acting mainly as Rotating Savings and Credit Associations (ROSCAs)which are common throughout the country and serve as a mechanism for people to save forMedicare, dowries, or school fees.
During the year 2016, the number of discount houses remained at two (2), whereas, six (6) newforeign exchange bureaus were granted licenses, bringing the total number of exchange bureausto fifty six (56). The capital market activity remains shallow with three companies listed so far.Also the fixed income market remains relatively shallow, with government being the only activeissuer of treasury bills and bonds. Moreover, the investor base remains rather limited and islargely dominated by commercial banks, the National Social Security and Insurance Trust(NASSIT), discount houses, and insurance companies.
With two (2) registered mobile money providers (Airtel and Afrimobile), the number of digitalproducts has been increasing in 2016. In terms of number of accounts in the banking system, thenumber of account holders increased to 693,751 as of December 2016. The commercial banks'branch network increased from 102 to 105.
Table 13The Number of account holders in the Banking system as at 31st December, 2016
Type of Account Banking System
Current: Domestic 163,068
Foreign 27,238
Savings: Domestic 466,898
Foreign 34,768
Time: Domestic 1,764
Foreign 15
Total 693,751
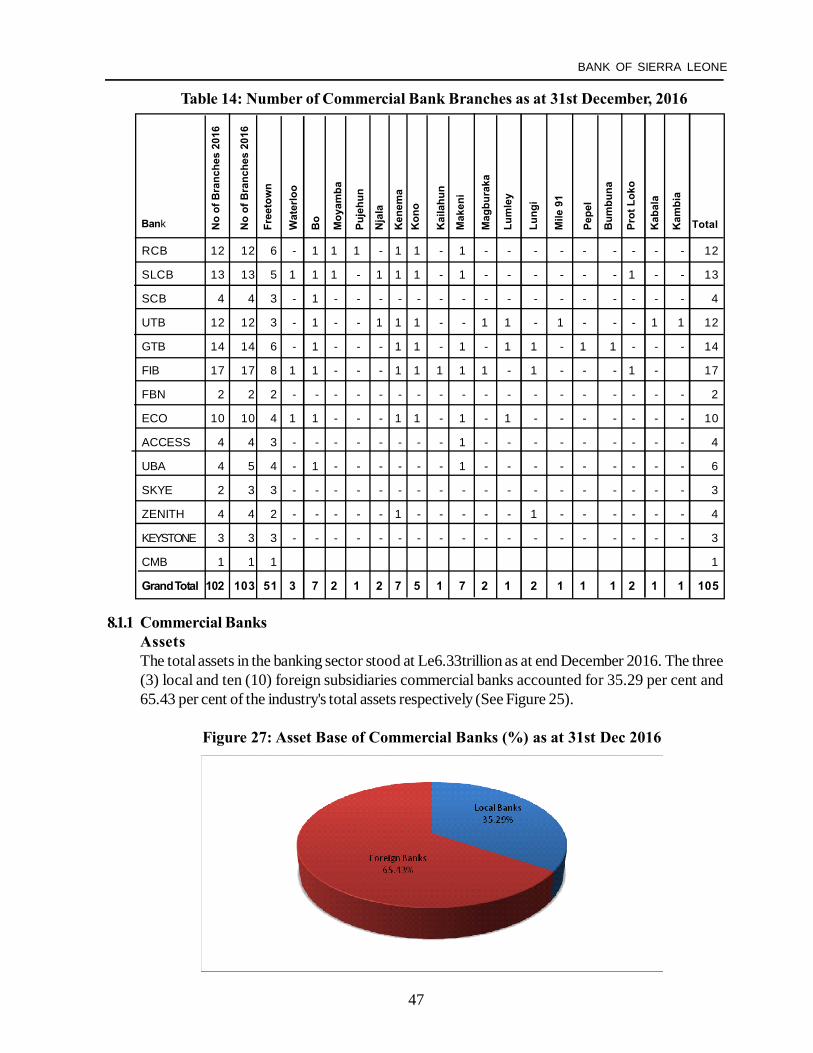
47
BANK OF SIERRA LEONE
No
of B
ranc
hes
2016
No
of B
ranc
hes
2016
Free
tow
n
Wat
erlo
o
Bo
Moy
amba
Puje
hun
Nja
la
Ken
ema
Kon
o
Kai
lahu
n
Mak
eni
Mag
bura
ka
Lum
ley
Lung
i
Mile
91
Pepe
l
Bum
buna
Prot
Lok
o
Kab
ala
Kam
bia
Bank Total
Table 14: Number of Commercial Bank Branches as at 31st December, 2016
8.1.1 Commercial BanksAssetsThe total assets in the banking sector stood at Le6.33trillion as at end December 2016. The three(3) local and ten (10) foreign subsidiaries commercial banks accounted for 35.29 per cent and65.43 per cent of the industry's total assets respectively (See Figure 25).
Figure 27: Asset Base of Commercial Banks (%) as at 31st Dec 2016
RCB 12 12 6 - 1 1 1 - 1 1 - 1 - - - - - - - - - 12
SLCB 13 13 5 1 1 1 - 1 1 1 - 1 - - - - - - 1 - - 13
SCB 4 4 3 - 1 - - - - - - - - - - - - - - - - 4
UTB 12 12 3 - 1 - - 1 1 1 - - 1 1 - 1 - - - 1 1 12
GTB 14 14 6 - 1 - - - 1 1 - 1 - 1 1 - 1 1 - - - 14
FIB 17 17 8 1 1 - - - 1 1 1 1 1 - 1 - - - 1 - 17
FBN 2 2 2 - - - - - - - - - - - - - - - - - - 2
ECO 10 10 4 1 1 - - - 1 1 - 1 - 1 - - - - - - - 10
ACCESS 4 4 3 - - - - - - - - 1 - - - - - - - - - 4
UBA 4 5 4 - 1 - - - - - - 1 - - - - - - - - - 6
SKYE 2 3 3 - - - - - - - - - - - - - - - - - - 3
ZENITH 4 4 2 - - - - - 1 - - - - - 1 - - - - - - 4
KEYSTONE 3 3 3 - - - - - - - - - - - - - - - - - - 3
CMB 1 1 1 1
Grand Total 102 103 51 3 7 2 1 2 7 5 1 7 2 1 2 1 1 1 2 1 1 105
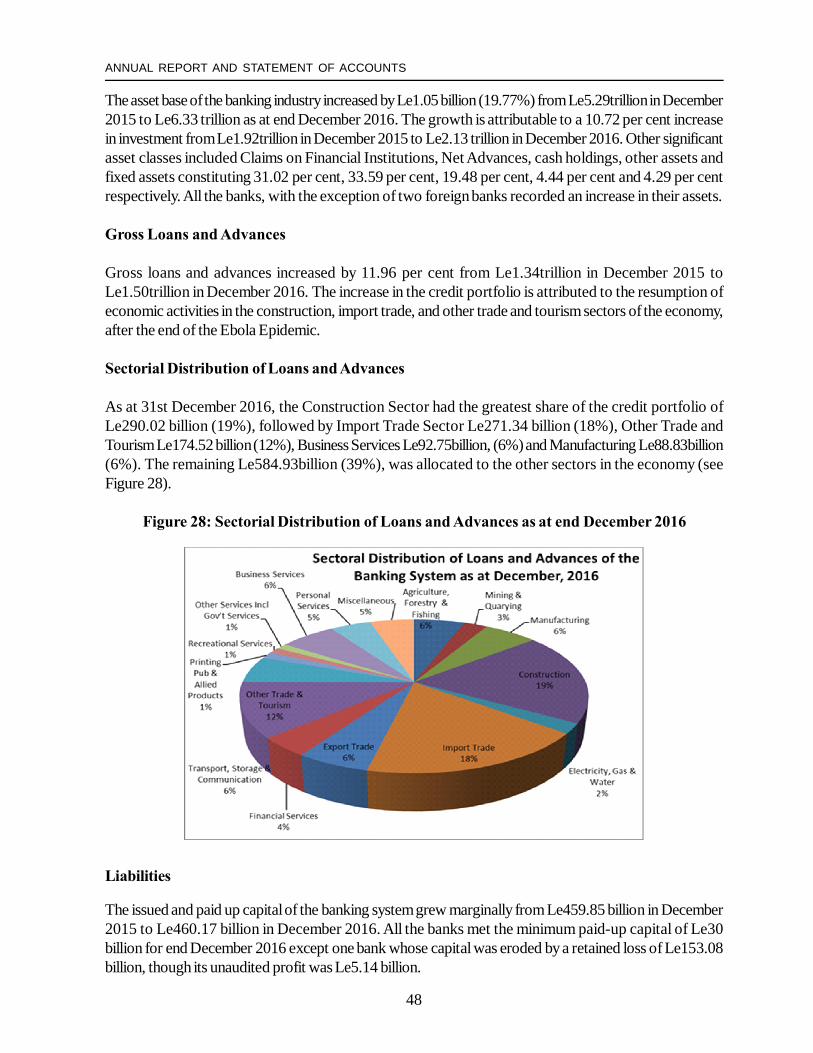
48
ANNUAL REPORT AND STATEMENT OF ACCOUNTS
The asset base of the banking industry increased by Le1.05 billion (19.77%) from Le5.29trillion in December2015 to Le6.33 trillion as at end December 2016. The growth is attributable to a 10.72 per cent increasein investment from Le1.92trillion in December 2015 to Le2.13 trillion in December 2016. Other significantasset classes included Claims on Financial Institutions, Net Advances, cash holdings, other assets andfixed assets constituting 31.02 per cent, 33.59 per cent, 19.48 per cent, 4.44 per cent and 4.29 per centrespectively. All the banks, with the exception of two foreign banks recorded an increase in their assets.
Gross Loans and Advances
Gross loans and advances increased by 11.96 per cent from Le1.34trillion in December 2015 toLe1.50trillion in December 2016. The increase in the credit portfolio is attributed to the resumption ofeconomic activities in the construction, import trade, and other trade and tourism sectors of the economy,after the end of the Ebola Epidemic.
Sectorial Distribution of Loans and Advances
As at 31st December 2016, the Construction Sector had the greatest share of the credit portfolio ofLe290.02 billion (19%), followed by Import Trade Sector Le271.34 billion (18%), Other Trade andTourism Le174.52 billion (12%), Business Services Le92.75billion, (6%) and Manufacturing Le88.83billion(6%). The remaining Le584.93billion (39%), was allocated to the other sectors in the economy (seeFigure 28).
Figure 28: Sectorial Distribution of Loans and Advances as at end December 2016
Liabilities
The issued and paid up capital of the banking system grew marginally from Le459.85 billion in December2015 to Le460.17 billion in December 2016. All the banks met the minimum paid-up capital of Le30billion for end December 2016 except one bank whose capital was eroded by a retained loss of Le153.08billion, though its unaudited profit was Le5.14 billion.
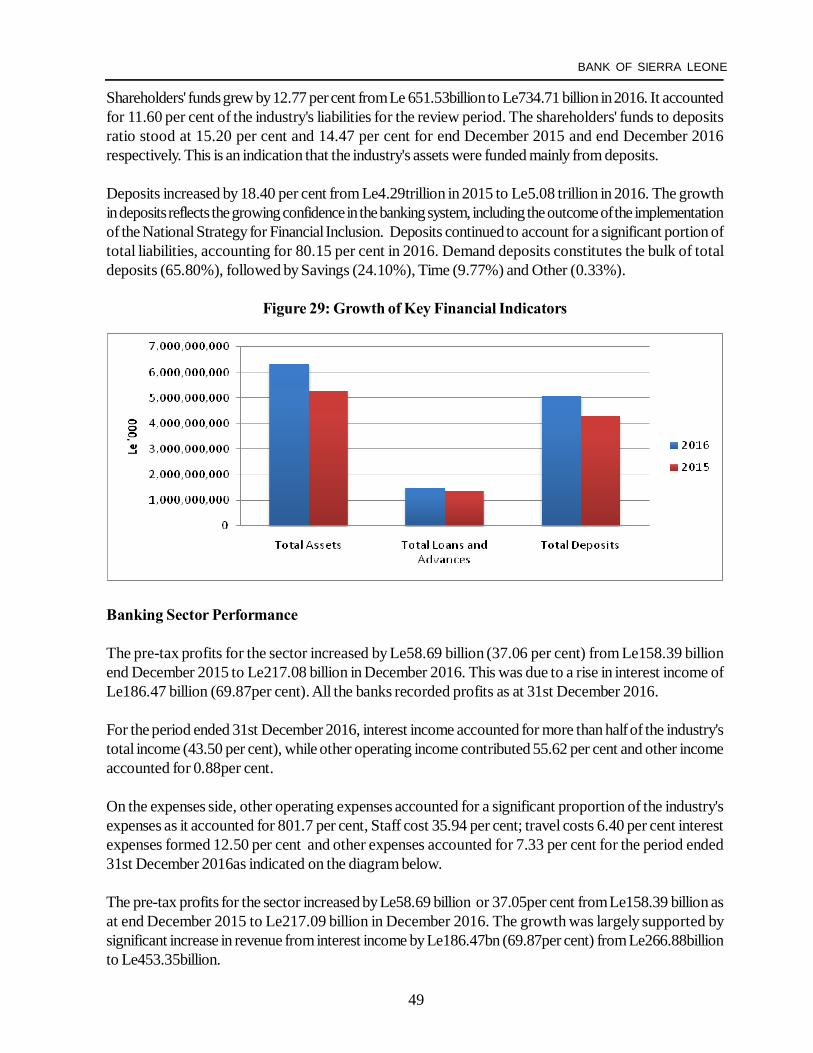
49
BANK OF SIERRA LEONE
Shareholders' funds grew by 12.77 per cent from Le 651.53billion to Le734.71 billion in 2016. It accountedfor 11.60 per cent of the industry's liabilities for the review period. The shareholders' funds to depositsratio stood at 15.20 per cent and 14.47 per cent for end December 2015 and end December 2016respectively. This is an indication that the industry's assets were funded mainly from deposits.
Deposits increased by 18.40 per cent from Le4.29trillion in 2015 to Le5.08 trillion in 2016. The growthin deposits reflects the growing confidence in the banking system, including the outcome of the implementationof the National Strategy for Financial Inclusion. Deposits continued to account for a significant portion oftotal liabilities, accounting for 80.15 per cent in 2016. Demand deposits constitutes the bulk of totaldeposits (65.80%), followed by Savings (24.10%), Time (9.77%) and Other (0.33%).
Figure 29: Growth of Key Financial Indicators
Banking Sector Performance
The pre-tax profits for the sector increased by Le58.69 billion (37.06 per cent) from Le158.39 billionend December 2015 to Le217.08 billion in December 2016. This was due to a rise in interest income ofLe186.47 billion (69.87per cent). All the banks recorded profits as at 31st December 2016.
For the period ended 31st December 2016, interest income accounted for more than half of the industry'stotal income (43.50 per cent), while other operating income contributed 55.62 per cent and other incomeaccounted for 0.88per cent.
On the expenses side, other operating expenses accounted for a significant proportion of the industry'sexpenses as it accounted for 801.7 per cent, Staff cost 35.94 per cent; travel costs 6.40 per cent interestexpenses formed 12.50 per cent and other expenses accounted for 7.33 per cent for the period ended31st December 2016as indicated on the diagram below.
The pre-tax profits for the sector increased by Le58.69 billion or 37.05per cent from Le158.39 billion asat end December 2015 to Le217.09 billion in December 2016. The growth was largely supported bysignificant increase in revenue from interest income by Le186.47bn (69.87per cent) from Le266.88billionto Le453.35billion.
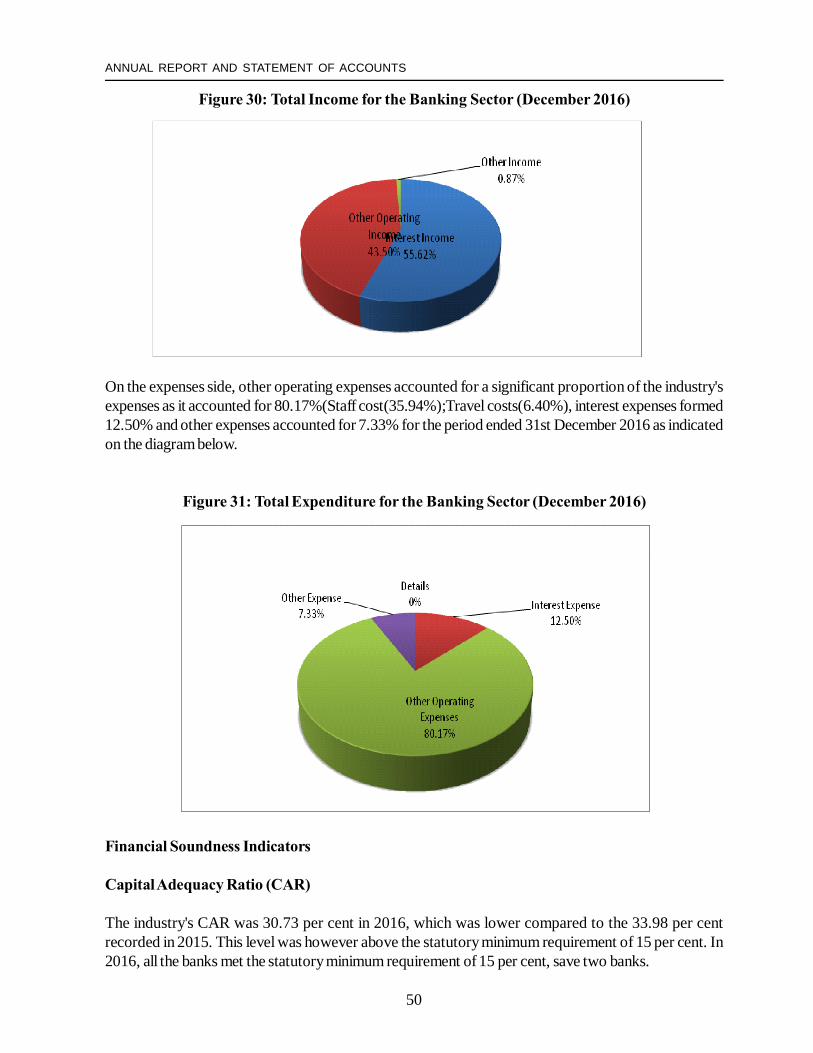
50
ANNUAL REPORT AND STATEMENT OF ACCOUNTS
Figure 30: Total Income for the Banking Sector (December 2016)
On the expenses side, other operating expenses accounted for a significant proportion of the industry'sexpenses as it accounted for 80.17%(Staff cost(35.94%);Travel costs(6.40%), interest expenses formed12.50% and other expenses accounted for 7.33% for the period ended 31st December 2016 as indicatedon the diagram below.
Figure 31: Total Expenditure for the Banking Sector (December 2016)
Financial Soundness Indicators
Capital Adequacy Ratio (CAR)
The industry's CAR was 30.73 per cent in 2016, which was lower compared to the 33.98 per centrecorded in 2015. This level was however above the statutory minimum requirement of 15 per cent. In2016, all the banks met the statutory minimum requirement of 15 per cent, save two banks.
51
BANK OF SIERRA LEONE
Non-Performing Loans (NPLs)
The NPL ratio was 22.65 per cent at end December 2016 which suggests an improvement compared to31.73 per cent as at end December 2015. The ratio remained above the tolerable limit of 10 per cent.The downward trend of the NPL was driven by the implementation of the prudential policy on bad debtwrite off by the industry coupled with recovery in economic activities in 2016.
Liquidity
The cash reserve ratio continued to be above the statutory minimum limit of 12 per cent. In 2016, this ratioregistered 17.20 per cent, which was almost the same as in 2015 (17.24%). The banking industry alsomet the overall liquidity requirement recording 83.32 per cent and 85.50 per cent in 2015 and 2016respectively, which were above the prudential requirement ratios of 30.35 per cent and 30.06 per centrespectively.
Foreign Exchange RisksThe banking sector is not susceptible to foreign exchange risk as the aggregate and single net openpositions were recorded at -2.03 per cent and -0.42 per cent, within the statutory requirements of +/-25per cent and +/-15 per cent respectively. All banks, with the exception of two banks did not meet thestatutory limits of the Net open position and four banks could not meet the single net open position for allthe currencies. The share of foreign currency liabilities to total liabilities was 32.70 per cent.
Other Developments
Stress Testing- A Stress Testing Framework has been designed to facilitate the stress testing of commercialbanks. The stress testing exercise is expected to be concluded in April 2017.
Base Rate Model- A base rate model was introduced by the BSL to ensure that interest rates are uniformlycomputed across commercial banks. A comprehensive review of the model is ongoing based on commentsreceived from banks.
Stock Exchange - The BSL has made significant progress in its effort to re-launch the Stock Exchange.Together with relevant structures, the BSL has engaged the management of Board of Directors of threesubsidiaries of NASSIT (West African Holding Company, Commerce and Mortgage Bank plc and GoldenTulip) to float their shares on the SLSE. The Securities Bill has been drafted and is now at the Office of theMinister, MOFED for his signature. The enactment of the Bill into law will pave the way for the establishmentof the Securities and Exchange Commission. The resuscitation of the SLSE will facilitate the country'sparticipation in the capital markets integral project of the West Africa Monetary Zone.
Collateral Registry - The Collateral Registry User Acceptance Test 1 & 2 has been completed and thesystem has now gone live. However, the collateral team awaits the vendors for the user training proper.
Diagnostic StudyDuring November 2016, an external consultant (Ernst and Young), conducted a diagnostic study on twodomestic banks to assess their financial and operational efficiency. This study was financed by WorldBank under the FSDP.
52
ANNUAL REPORT AND STATEMENT OF ACCOUNTS
Table 15: Selected Financial Soundness Indicators
Indicators December 2016 December 2015
Capital adequacyRegulatory capital to risk-weighted assets (%) 30.73 33.98
Primary capital to risk-weighted assets (%) 25.89 29.01
Capital (net-worth) to assets (%) 11.60 12.32
Asset quality & compositionNon- Performing Loans as a % of Total Advances 22.65% 31.73%
Loan Loss Provisions as a % of Non -Performing 22.65% 31.73%
Profitability and efficiencyReturn on Assets 2.87% 3.24%
Return on Equity Funds 22.32% 18.29%
Net Interest Spread 8.93% 6.26%
Cost to income ratio 73.37% 75.43%
Operating Expenses to Operating Income 69.55% 73.48%
LiquidityCash Ratio 17.20% 17.24%
Overall Liquidity Ratio 85.50% 83.32%
Sensitivity to market risksPercentage of aggregate Net Open position to capital Base 2.03% 6.83%
Percentage of single currency open position to capital base (%) 0.42% 8.04%
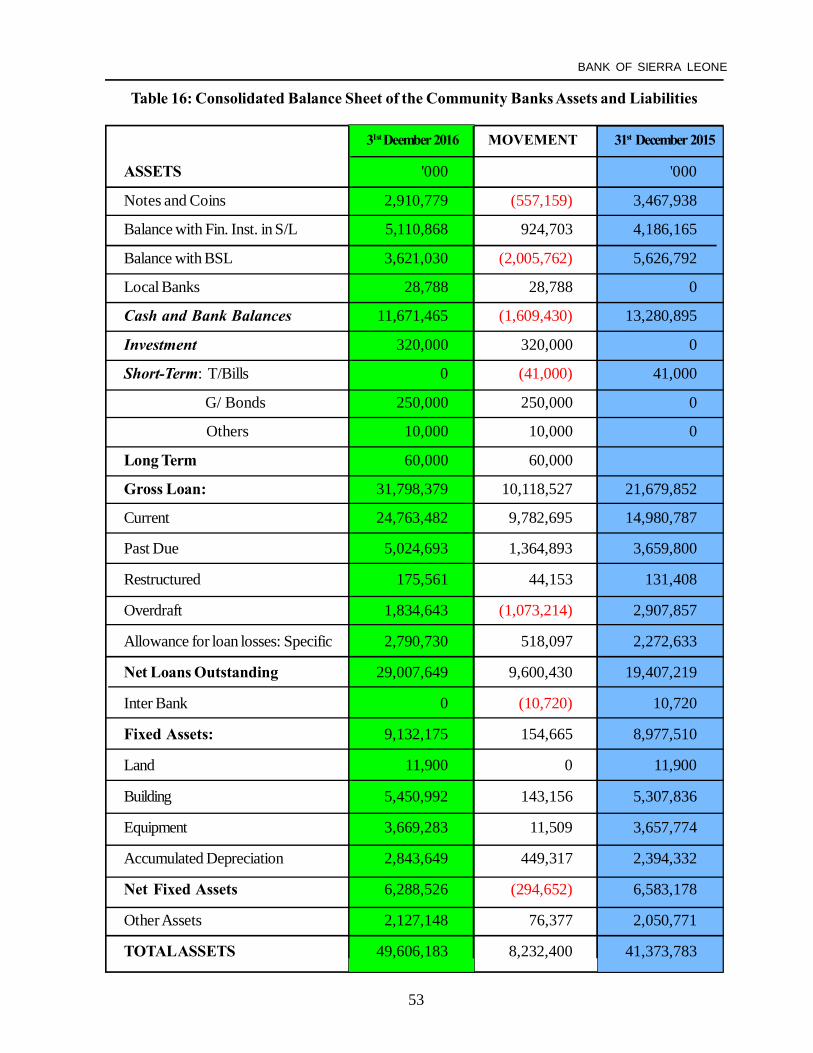
53
BANK OF SIERRA LEONE
Table 16: Consolidated Balance Sheet of the Community Banks Assets and Liabilities
31st Deember 2016 MOVEMENT 31st December 2015
ASSETS '000 '000
Notes and Coins 2,910,779 (557,159) 3,467,938
Balance with Fin. Inst. in S/L 5,110,868 924,703 4,186,165
Balance with BSL 3,621,030 (2,005,762) 5,626,792
Local Banks 28,788 28,788 0
Cash and Bank Balances 11,671,465 (1,609,430) 13,280,895
Investment 320,000 320,000 0
Short-Term: T/Bills 0 (41,000) 41,000
G/ Bonds 250,000 250,000 0
Others 10,000 10,000 0
Long Term 60,000 60,000
Gross Loan: 31,798,379 10,118,527 21,679,852
Current 24,763,482 9,782,695 14,980,787
Past Due 5,024,693 1,364,893 3,659,800
Restructured 175,561 44,153 131,408
Overdraft 1,834,643 (1,073,214) 2,907,857
Allowance for loan losses: Specific 2,790,730 518,097 2,272,633
Net Loans Outstanding 29,007,649 9,600,430 19,407,219
Inter Bank 0 (10,720) 10,720
Fixed Assets: 9,132,175 154,665 8,977,510
Land 11,900 0 11,900
Building 5,450,992 143,156 5,307,836
Equipment 3,669,283 11,509 3,657,774
Accumulated Depreciation 2,843,649 449,317 2,394,332
Net Fixed Assets 6,288,526 (294,652) 6,583,178
Other Assets 2,127,148 76,377 2,050,771
TOTAL ASSETS 49,606,183 8,232,400 41,373,783
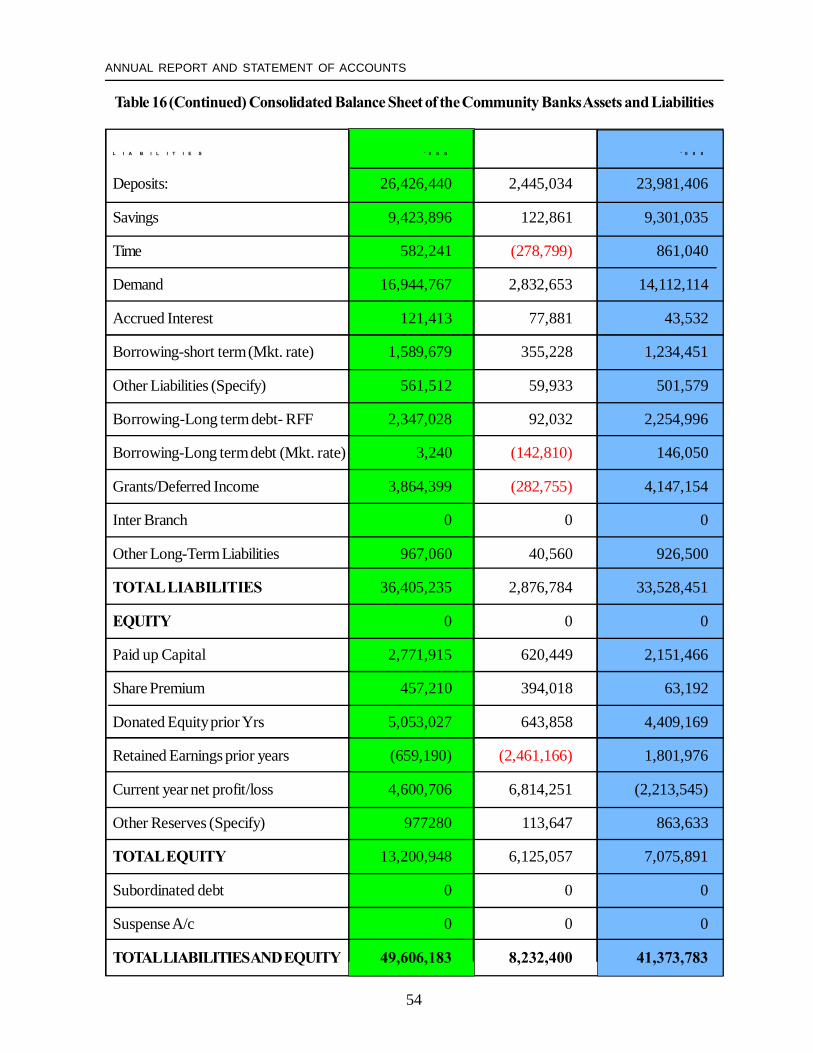
54
ANNUAL REPORT AND STATEMENT OF ACCOUNTS
Table 16 (Continued) Consolidated Balance Sheet of the Community Banks Assets and Liabilities
L I A B I L I T I E S ' 0 0 0 ' 0 0 0
Deposits: 26,426,440 2,445,034 23,981,406
Savings 9,423,896 122,861 9,301,035
Time 582,241 (278,799) 861,040
Demand 16,944,767 2,832,653 14,112,114
Accrued Interest 121,413 77,881 43,532
Borrowing-short term (Mkt. rate) 1,589,679 355,228 1,234,451
Other Liabilities (Specify) 561,512 59,933 501,579
Borrowing-Long term debt- RFF 2,347,028 92,032 2,254,996
Borrowing-Long term debt (Mkt. rate) 3,240 (142,810) 146,050
Grants/Deferred Income 3,864,399 (282,755) 4,147,154
Inter Branch 0 0 0
Other Long-Term Liabilities 967,060 40,560 926,500
TOTAL LIABILITIES 36,405,235 2,876,784 33,528,451
EQUITY 0 0 0
Paid up Capital 2,771,915 620,449 2,151,466
Share Premium 457,210 394,018 63,192
Donated Equity prior Yrs 5,053,027 643,858 4,409,169
Retained Earnings prior years (659,190) (2,461,166) 1,801,976
Current year net profit/loss 4,600,706 6,814,251 (2,213,545)
Other Reserves (Specify) 977280 113,647 863,633
TOTAL EQUITY 13,200,948 6,125,057 7,075,891
Subordinated debt 0 0 0
Suspense A/c 0 0 0
TOTAL LIABILITIES AND EQUITY 49,606,183 8,232,400 41,373,783
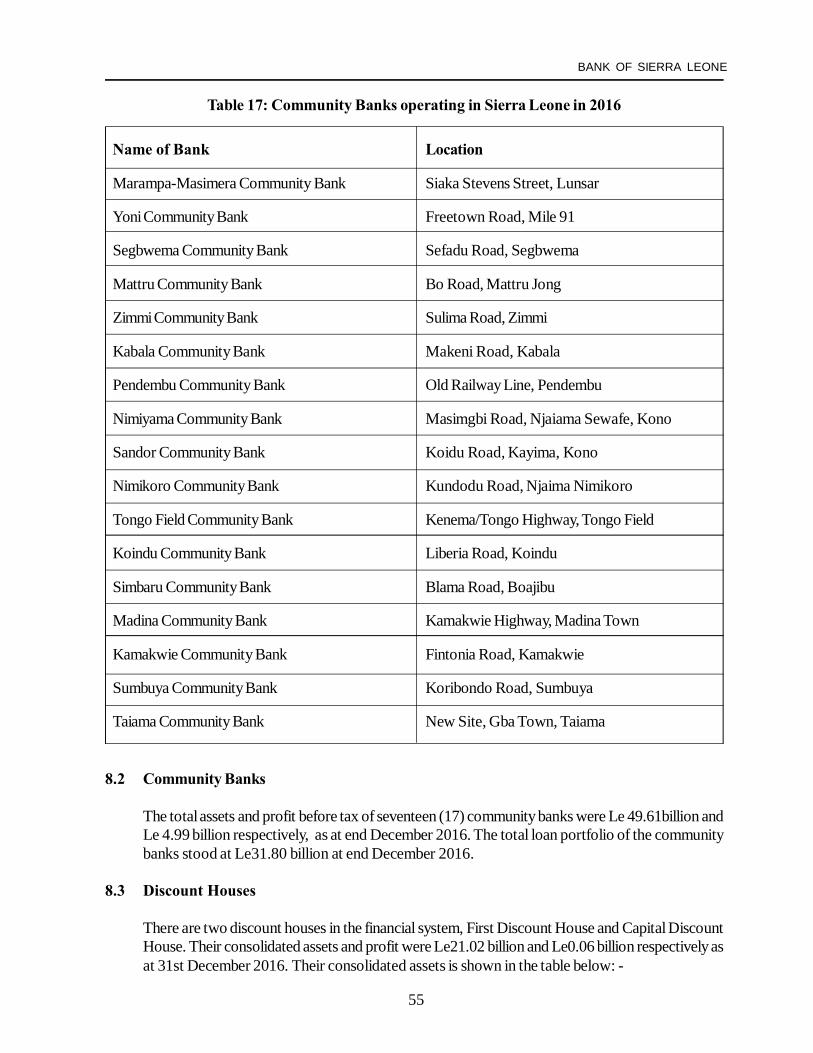
55
BANK OF SIERRA LEONE
Table 17: Community Banks operating in Sierra Leone in 2016
Name of Bank Location
Marampa-Masimera Community Bank Siaka Stevens Street, Lunsar
Yoni Community Bank Freetown Road, Mile 91
Segbwema Community Bank Sefadu Road, Segbwema
Mattru Community Bank Bo Road, Mattru Jong
Zimmi Community Bank Sulima Road, Zimmi
Kabala Community Bank Makeni Road, Kabala
Pendembu Community Bank Old Railway Line, Pendembu
Nimiyama Community Bank Masimgbi Road, Njaiama Sewafe, Kono
Sandor Community Bank Koidu Road, Kayima, Kono
Nimikoro Community Bank Kundodu Road, Njaima Nimikoro
Tongo Field Community Bank Kenema/Tongo Highway, Tongo Field
Koindu Community Bank Liberia Road, Koindu
Simbaru Community Bank Blama Road, Boajibu
Madina Community Bank Kamakwie Highway, Madina Town
Kamakwie Community Bank Fintonia Road, Kamakwie
Sumbuya Community Bank Koribondo Road, Sumbuya
Taiama Community Bank New Site, Gba Town, Taiama
8.2 Community Banks
The total assets and profit before tax of seventeen (17) community banks were Le 49.61billion andLe 4.99 billion respectively, as at end December 2016. The total loan portfolio of the communitybanks stood at Le31.80 billion at end December 2016.
8.3 Discount Houses
There are two discount houses in the financial system, First Discount House and Capital DiscountHouse. Their consolidated assets and profit were Le21.02 billion and Le0.06 billion respectively asat 31st December 2016. Their consolidated assets is shown in the table below: -
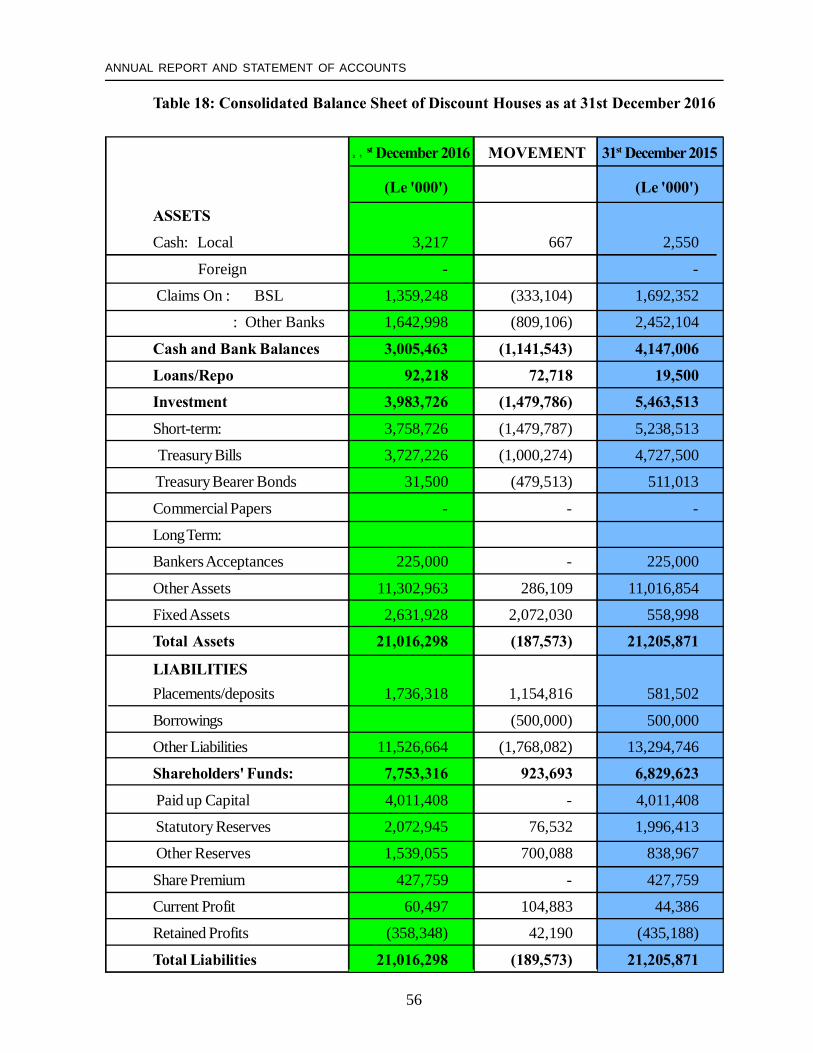
56
ANNUAL REPORT AND STATEMENT OF ACCOUNTS
Table 18: Consolidated Balance Sheet of Discount Houses as at 31st December 2016
3 1st December 2016 MOVEMENT 31st December 2015
(Le '000') (Le '000')
ASSETS
Cash: Local 3,217 667 2,550
Foreign - -
Claims On : BSL 1,359,248 (333,104) 1,692,352
: Other Banks 1,642,998 (809,106) 2,452,104
Cash and Bank Balances 3,005,463 (1,141,543) 4,147,006
Loans/Repo 92,218 72,718 19,500
Investment 3,983,726 (1,479,786) 5,463,513
Short-term: 3,758,726 (1,479,787) 5,238,513
Treasury Bills 3,727,226 (1,000,274) 4,727,500
Treasury Bearer Bonds 31,500 (479,513) 511,013
Commercial Papers - - -
Long Term:
Bankers Acceptances 225,000 - 225,000
Other Assets 11,302,963 286,109 11,016,854
Fixed Assets 2,631,928 2,072,030 558,998
Total Assets 21,016,298 (187,573) 21,205,871
LIABILITIESPlacements/deposits 1,736,318 1,154,816 581,502
Borrowings (500,000) 500,000
Other Liabilities 11,526,664 (1,768,082) 13,294,746
Shareholders' Funds: 7,753,316 923,693 6,829,623
Paid up Capital 4,011,408 - 4,011,408
Statutory Reserves 2,072,945 76,532 1,996,413
Other Reserves 1,539,055 700,088 838,967
Share Premium 427,759 - 427,759
Current Profit 60,497 104,883 44,386
Retained Profits (358,348) 42,190 (435,188)
Total Liabilities 21,016,298 (189,573) 21,205,871
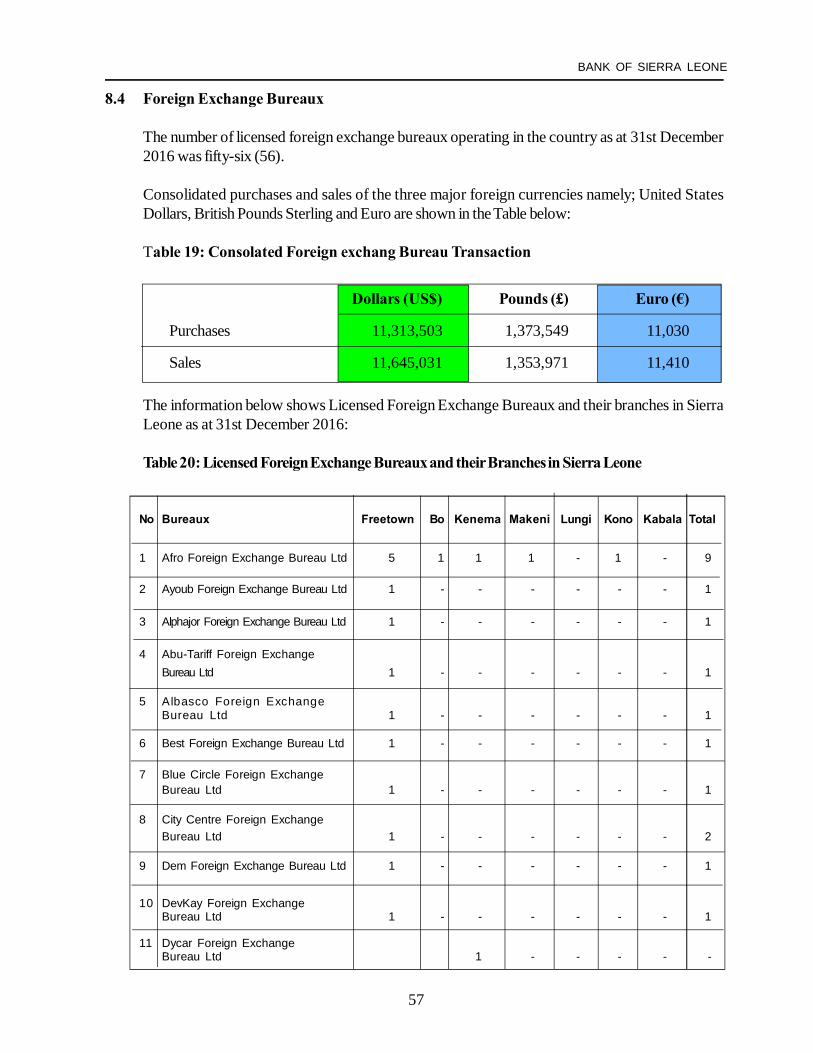
57
BANK OF SIERRA LEONE
8.4 Foreign Exchange Bureaux
The number of licensed foreign exchange bureaux operating in the country as at 31st December2016 was fifty-six (56).
Consolidated purchases and sales of the three major foreign currencies namely; United StatesDollars, British Pounds Sterling and Euro are shown in the Table below:
Table 19: Consolated Foreign exchang Bureau Transaction
Dollars (US$) Pounds (£) Euro (€)
Purchases 11,313,503 1,373,549 11,030
Sales 11,645,031 1,353,971 11,410
The information below shows Licensed Foreign Exchange Bureaux and their branches in SierraLeone as at 31st December 2016:
Table 20: Licensed Foreign Exchange Bureaux and their Branches in Sierra Leone
No Bureaux Freetown Bo Kenema Makeni Lungi Kono Kabala Total
1 Afro Foreign Exchange Bureau Ltd 5 1 1 1 - 1 - 9
2 Ayoub Foreign Exchange Bureau Ltd 1 - - - - - - 1
3 Alphajor Foreign Exchange Bureau Ltd 1 - - - - - - 1
4 Abu-Tariff Foreign ExchangeBureau Ltd 1 - - - - - - 1
5 Albasco Foreign ExchangeBureau Ltd 1 - - - - - - 1
6 Best Foreign Exchange Bureau Ltd 1 - - - - - - 1
7 Blue Circle Foreign ExchangeBureau Ltd 1 - - - - - - 1
8 City Centre Foreign ExchangeBureau Ltd 1 - - - - - - 2
9 Dem Foreign Exchange Bureau Ltd 1 - - - - - - 1
10 DevKay Foreign ExchangeBureau Ltd 1 - - - - - - 1
11 Dycar Foreign ExchangeBureau Ltd 1 - - - - -
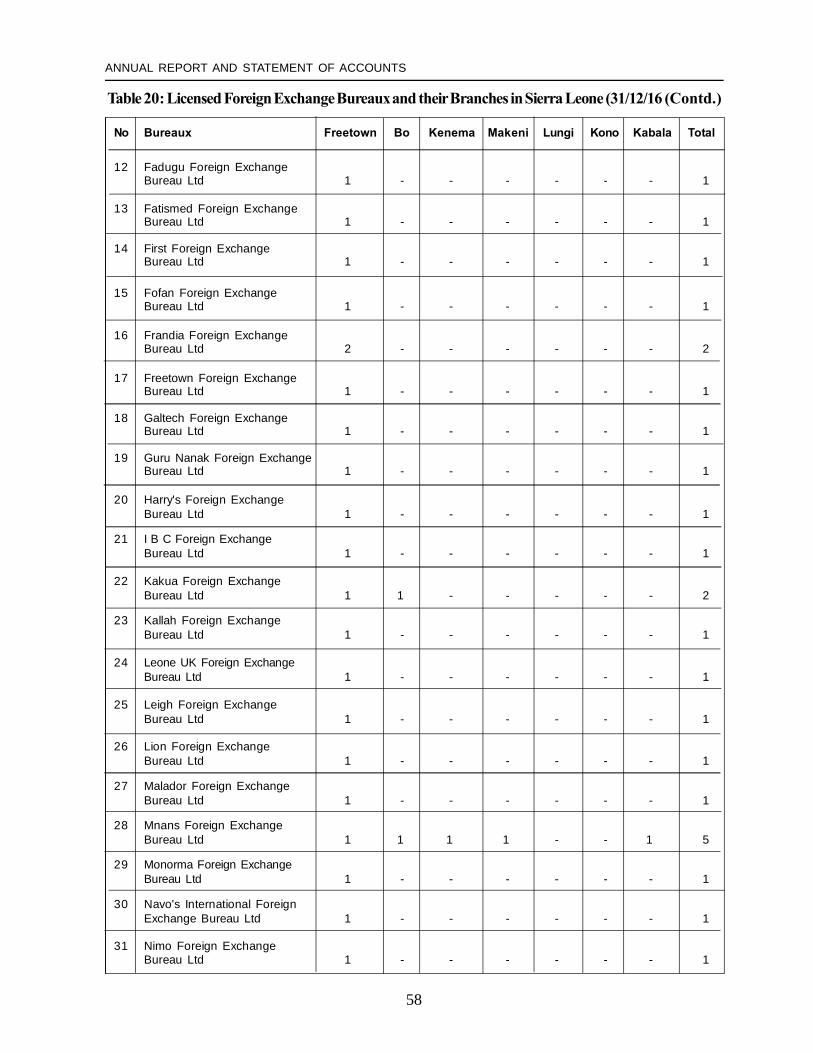
58
ANNUAL REPORT AND STATEMENT OF ACCOUNTS
Table 20: Licensed Foreign Exchange Bureaux and their Branches in Sierra Leone (31/12/16 (Contd.)
No Bureaux Freetown Bo Kenema Makeni Lungi Kono Kabala Total
12 Fadugu Foreign ExchangeBureau Ltd 1 - - - - - - 1
13 Fatismed Foreign ExchangeBureau Ltd 1 - - - - - - 1
14 First Foreign ExchangeBureau Ltd 1 - - - - - - 1
15 Fofan Foreign ExchangeBureau Ltd 1 - - - - - - 1
16 Frandia Foreign ExchangeBureau Ltd 2 - - - - - - 2
17 Freetown Foreign ExchangeBureau Ltd 1 - - - - - - 1
18 Galtech Foreign ExchangeBureau Ltd 1 - - - - - - 1
19 Guru Nanak Foreign ExchangeBureau Ltd 1 - - - - - - 1
20 Harry's Foreign ExchangeBureau Ltd 1 - - - - - - 1
21 I B C Foreign ExchangeBureau Ltd 1 - - - - - - 1
22 Kakua Foreign ExchangeBureau Ltd 1 1 - - - - - 2
23 Kallah Foreign ExchangeBureau Ltd 1 - - - - - - 1
24 Leone UK Foreign ExchangeBureau Ltd 1 - - - - - - 1
25 Leigh Foreign ExchangeBureau Ltd 1 - - - - - - 1
26 Lion Foreign ExchangeBureau Ltd 1 - - - - - - 1
27 Malador Foreign ExchangeBureau Ltd 1 - - - - - - 1
28 Mnans Foreign ExchangeBureau Ltd 1 1 1 1 - - 1 5
29 Monorma Foreign ExchangeBureau Ltd 1 - - - - - - 1
30 Navo's International ForeignExchange Bureau Ltd 1 - - - - - - 1
31 Nimo Foreign ExchangeBureau Ltd 1 - - - - - - 1
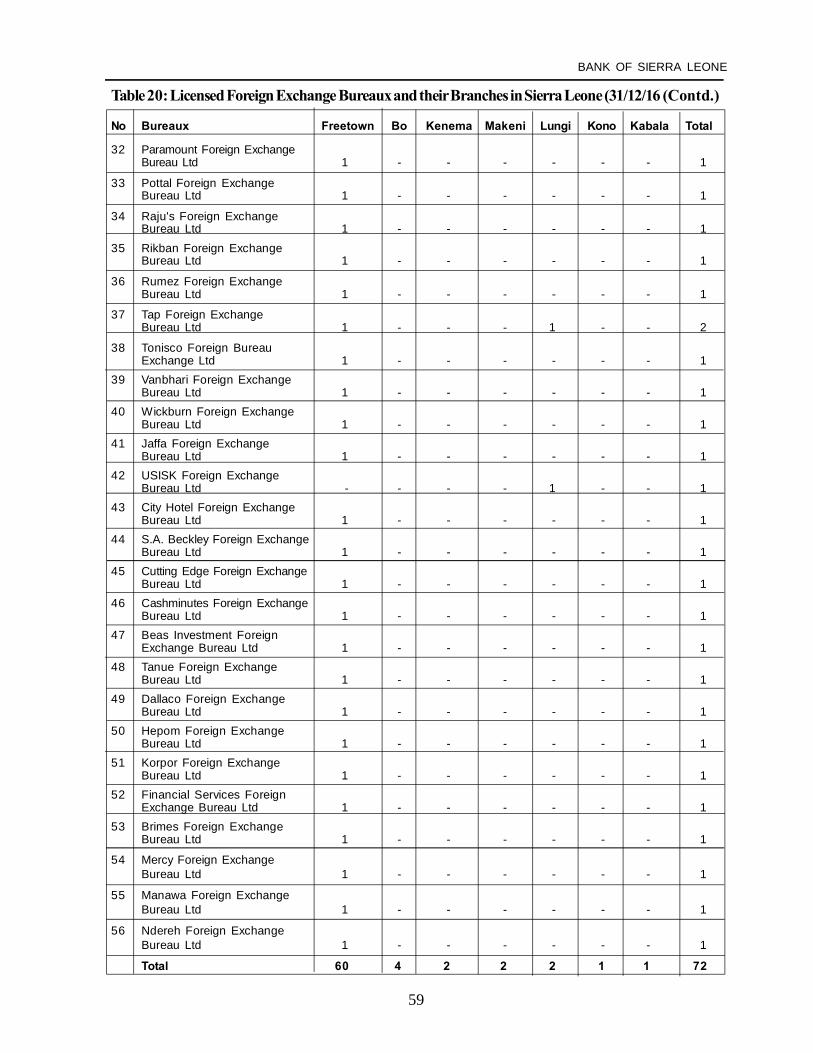
59
BANK OF SIERRA LEONE
Table 20: Licensed Foreign Exchange Bureaux and their Branches in Sierra Leone (31/12/16 (Contd.)
No Bureaux Freetown Bo Kenema Makeni Lungi Kono Kabala Total
32 Paramount Foreign ExchangeBureau Ltd 1 - - - - - - 1
33 Pottal Foreign ExchangeBureau Ltd 1 - - - - - - 1
34 Raju's Foreign ExchangeBureau Ltd 1 - - - - - - 1
35 Rikban Foreign ExchangeBureau Ltd 1 - - - - - - 1
36 Rumez Foreign ExchangeBureau Ltd 1 - - - - - - 1
37 Tap Foreign ExchangeBureau Ltd 1 - - - 1 - - 2
38 Tonisco Foreign BureauExchange Ltd 1 - - - - - - 1
39 Vanbhari Foreign ExchangeBureau Ltd 1 - - - - - - 1
40 Wickburn Foreign ExchangeBureau Ltd 1 - - - - - - 1
41 Jaffa Foreign ExchangeBureau Ltd 1 - - - - - - 1
42 USISK Foreign ExchangeBureau Ltd - - - - 1 - - 1
43 City Hotel Foreign ExchangeBureau Ltd 1 - - - - - - 1
44 S.A. Beckley Foreign ExchangeBureau Ltd 1 - - - - - - 1
45 Cutting Edge Foreign ExchangeBureau Ltd 1 - - - - - - 1
46 Cashminutes Foreign ExchangeBureau Ltd 1 - - - - - - 1
47 Beas Investment ForeignExchange Bureau Ltd 1 - - - - - - 1
48 Tanue Foreign ExchangeBureau Ltd 1 - - - - - - 1
49 Dallaco Foreign ExchangeBureau Ltd 1 - - - - - - 1
50 Hepom Foreign ExchangeBureau Ltd 1 - - - - - - 1
51 Korpor Foreign ExchangeBureau Ltd 1 - - - - - - 1
52 Financial Services ForeignExchange Bureau Ltd 1 - - - - - - 1
53 Brimes Foreign ExchangeBureau Ltd 1 - - - - - - 1
54 Mercy Foreign ExchangeBureau Ltd 1 - - - - - - 1
55 Manawa Foreign ExchangeBureau Ltd 1 - - - - - - 1
56 Ndereh Foreign ExchangeBureau Ltd 1 - - - - - - 1
Total 60 4 2 2 2 1 1 72

60
ANNUAL REPORT AND STATEMENT OF ACCOUNTS
8.5 Microfinance Institutions (MFIs)
8.5.1 Deposit-Taking Microfinance Institutions
There are three licensed Deposit-Taking Microfinance Institutions in Sierra Leone as at 31stDecember, 2016: Ecobank Microfinance (SL) Limited (EMSL), Eclipse Microfinance (SL) Ltdand Bank for Innovation and Partnership (BIP).
Though BIP was issued a license to operate as a deposit-taking MFI, it is currently operating asa credit-only MFI. Eclipse was only licensed in December, 2016. The Ecobank deposit-takingMicrofinance Institution has total assets of Le58.58 billion and a pre-tax profit of Le2.92 billionat end December 2016
8.5.2 Credit-Only Microfinance Institutions (COMFIs)
As at 31st December 2016, there were fifteen (15) registered credit-only MFIs supervised bythe Bank of Sierra Leone. The table below shows the registered credit -only MFIs and addresses:
Table 21: Credit -only Microfinance Institutions as at 31st December 2016
Name Address
1 Brac Microfinance (SL) Limited 147 Wilkinson Road, Freetown
2 A Call to Business Trading 20 Railway Line, Brookfields, Freetown
3 Finance Salone Limited 48 Bai Bureh Road, Kissy, Freetown
4 Salone Microfinance Trust Limited 3 Azzolini Highway, Makeni
5 Grassroots Gender EmpowermentMovement 57 John Street, Freetown
6 Capitol Finance Company 26A Big Waterloo Street, Freetown
7 Empire solution Ltd 25c Byrne Lane, Freetown
8 Association of Rural Development (ARD) 21 Liverpool Street, Freetown
9 Source of Hope S.L Ltd 41c Ascension Town , Grey Bush
10 ASA Microfinance Limited 51 Main Motor Road, Wilberforce , Freetown
11 LAPO Microfinance 34 John Street, Freetown
12 Counterpart in CommunityDevelopment and microfinance Ltd 350 Bai Bureh Road, Calaba Town, Freetown
13 Safe Micro Finance 21 Suku Tamba Street, Bo
14 Afri Credit (SL) Limited 1 Pivot Street, Wilberforce Freetown
15 Eagle Capital (SL) Limited 49 Siaka Steven Street

61
BANK OF SIERRA LEONE
The consolidated resource base of the institutions was Le84.91 billion. The highest resourcebase was recorded by A Call To Business (ACTB) Le34.27 billion. It accounted for 40.36 percent of the consolidated resource base of COMFIs while BRAC accounted for Le32.85 billion(38.68%).
8.5.3 Operating PerformanceThe COMFIs recorded pre-tax profit amounting to Le926.36 million. This was mainly frominterest income on loan portfolio amounting to Le14.44 billion (74.01%). The pre-tax profit/loss position of COMFIs at end December 2016 is shown in the table below:
Table 22: The pre-tax profit/loss position of COMFIs at end December 2016
Institutions Pre-tax Profit/loss(Le'000)
BRAC 147,615
ACTB 283,194
Source of Hope (45,026)
LAPO 766,383
BIP (225,811)
Total 926,355
Table 23: Portfolio, Financial and Non-Financial Information as at end December 2016
BRAC ACTB Source LAPO BIP of Hope
Asset Base (Le'bn) 32.83 34.27 0.38 16.35 1.07
Capital (Le'bn) 19.35 15.56 0.17 4.74 0.86
Gross Loan (Le'bn) 26.79 28.21 0.16 10.36 1.08
No. of Active Clients 45,828 16,816 454 19,010 3,403
Loan Officers 134 45 80 7
PaR >30days 5.78 7.86 Nil 6.10 51.11
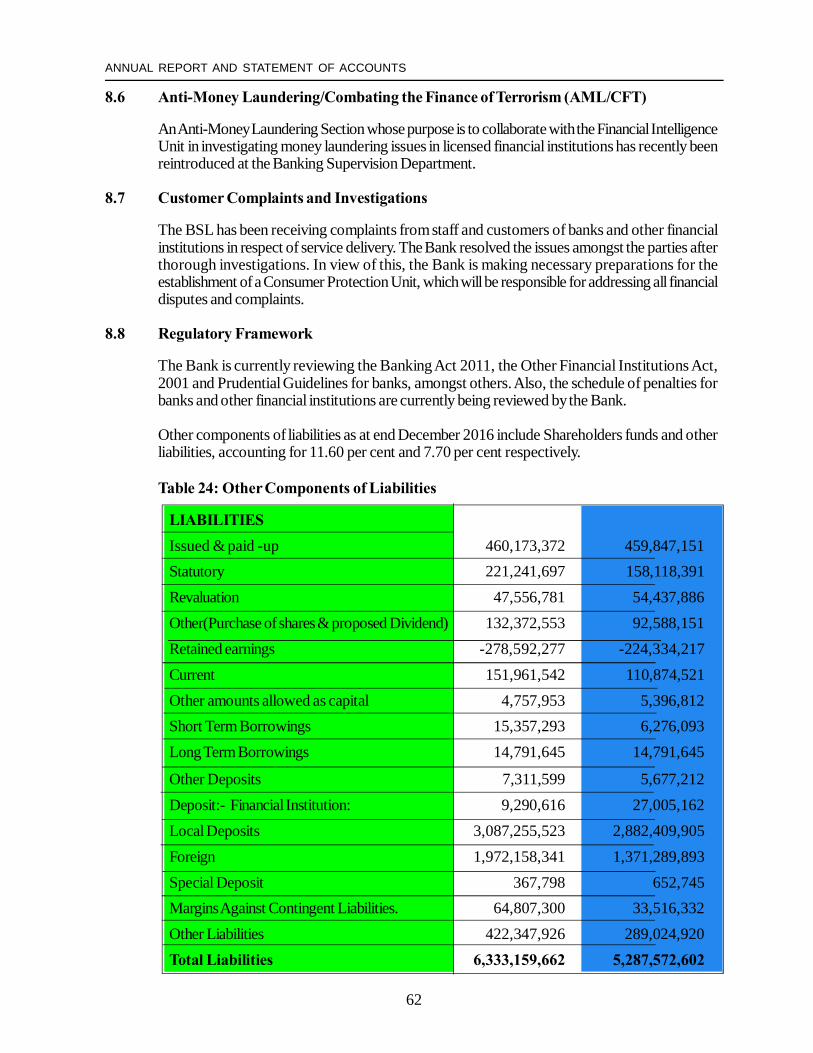
62
ANNUAL REPORT AND STATEMENT OF ACCOUNTS
8.6 Anti-Money Laundering/Combating the Finance of Terrorism (AML/CFT)
An Anti-Money Laundering Section whose purpose is to collaborate with the Financial IntelligenceUnit in investigating money laundering issues in licensed financial institutions has recently beenreintroduced at the Banking Supervision Department.
8.7 Customer Complaints and Investigations
The BSL has been receiving complaints from staff and customers of banks and other financialinstitutions in respect of service delivery. The Bank resolved the issues amongst the parties afterthorough investigations. In view of this, the Bank is making necessary preparations for theestablishment of a Consumer Protection Unit, which will be responsible for addressing all financialdisputes and complaints.
8.8 Regulatory Framework
The Bank is currently reviewing the Banking Act 2011, the Other Financial Institutions Act,2001 and Prudential Guidelines for banks, amongst others. Also, the schedule of penalties forbanks and other financial institutions are currently being reviewed by the Bank.
Other components of liabilities as at end December 2016 include Shareholders funds and otherliabilities, accounting for 11.60 per cent and 7.70 per cent respectively.
Table 24: Other Components of Liabilities
LIABILITIESIssued & paid -up 460,173,372 459,847,151Statutory 221,241,697 158,118,391Revaluation 47,556,781 54,437,886Other(Purchase of shares & proposed Dividend) 132,372,553 92,588,151Retained earnings -278,592,277 -224,334,217Current 151,961,542 110,874,521Other amounts allowed as capital 4,757,953 5,396,812Short Term Borrowings 15,357,293 6,276,093Long Term Borrowings 14,791,645 14,791,645
Other Deposits 7,311,599 5,677,212Deposit:- Financial Institution: 9,290,616 27,005,162Local Deposits 3,087,255,523 2,882,409,905Foreign 1,972,158,341 1,371,289,893Special Deposit 367,798 652,745Margins Against Contingent Liabilities. 64,807,300 33,516,332Other Liabilities 422,347,926 289,024,920Total Liabilities 6,333,159,662 5,287,572,602
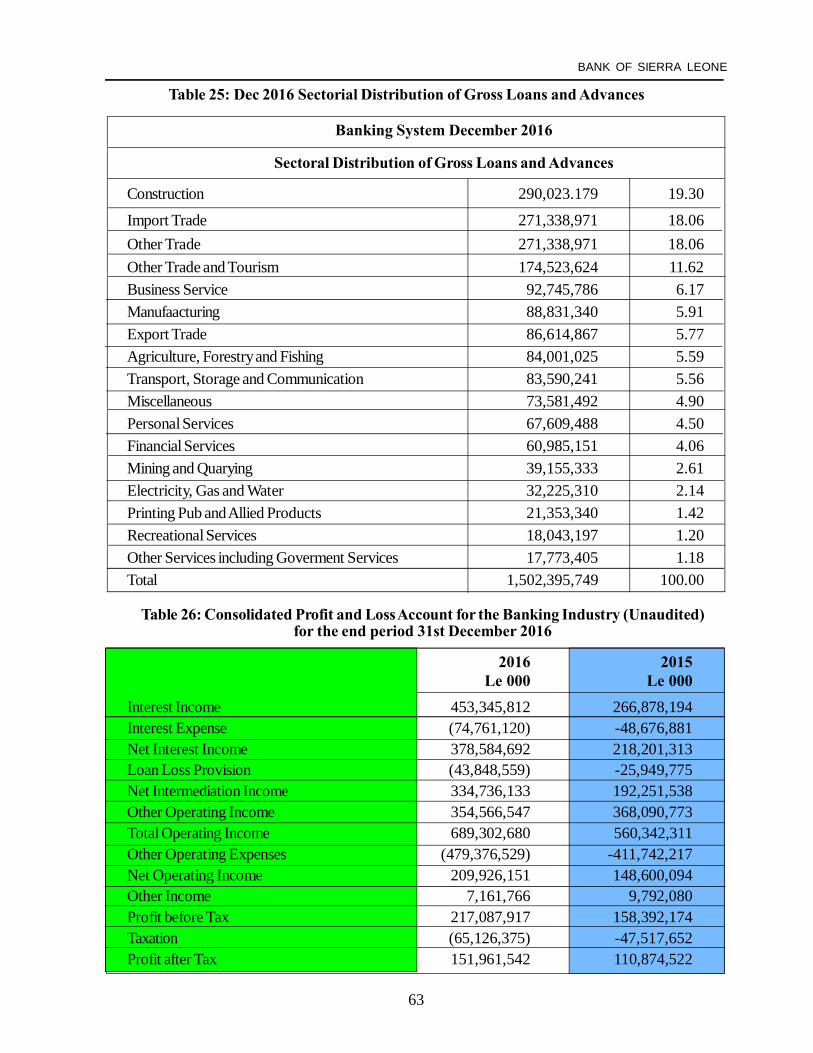
63
BANK OF SIERRA LEONE
Table 25: Dec 2016 Sectorial Distribution of Gross Loans and Advances
Banking System December 2016
Sectoral Distribution of Gross Loans and Advances
Construction 290,023.179 19.30
Import Trade 271,338,971 18.06Other Trade 271,338,971 18.06Other Trade and Tourism 174,523,624 11.62Business Service 92,745,786 6.17Manufaacturing 88,831,340 5.91Export Trade 86,614,867 5.77Agriculture, Forestry and Fishing 84,001,025 5.59Transport, Storage and Communication 83,590,241 5.56Miscellaneous 73,581,492 4.90Personal Services 67,609,488 4.50Financial Services 60,985,151 4.06Mining and Quarying 39,155,333 2.61Electricity, Gas and Water 32,225,310 2.14Printing Pub and Allied Products 21,353,340 1.42Recreational Services 18,043,197 1.20Other Services including Goverment Services 17,773,405 1.18Total 1,502,395,749 100.00
Table 26: Consolidated Profit and Loss Account for the Banking Industry (Unaudited)for the end period 31st December 2016
2016 2015Le 000 Le 000
Interest Income 453,345,812 266,878,194Interest Expense (74,761,120) -48,676,881Net Interest Income 378,584,692 218,201,313Loan Loss Provision (43,848,559) -25,949,775Net Intermediation Income 334,736,133 192,251,538Other Operating Income 354,566,547 368,090,773Total Operating Income 689,302,680 560,342,311Other Operating Expenses (479,376,529) -411,742,217Net Operating Income 209,926,151 148,600,094Other Income 7,161,766 9,792,080Profit before Tax 217,087,917 158,392,174Taxation (65,126,375) -47,517,652Profit after Tax 151,961,542 110,874,522
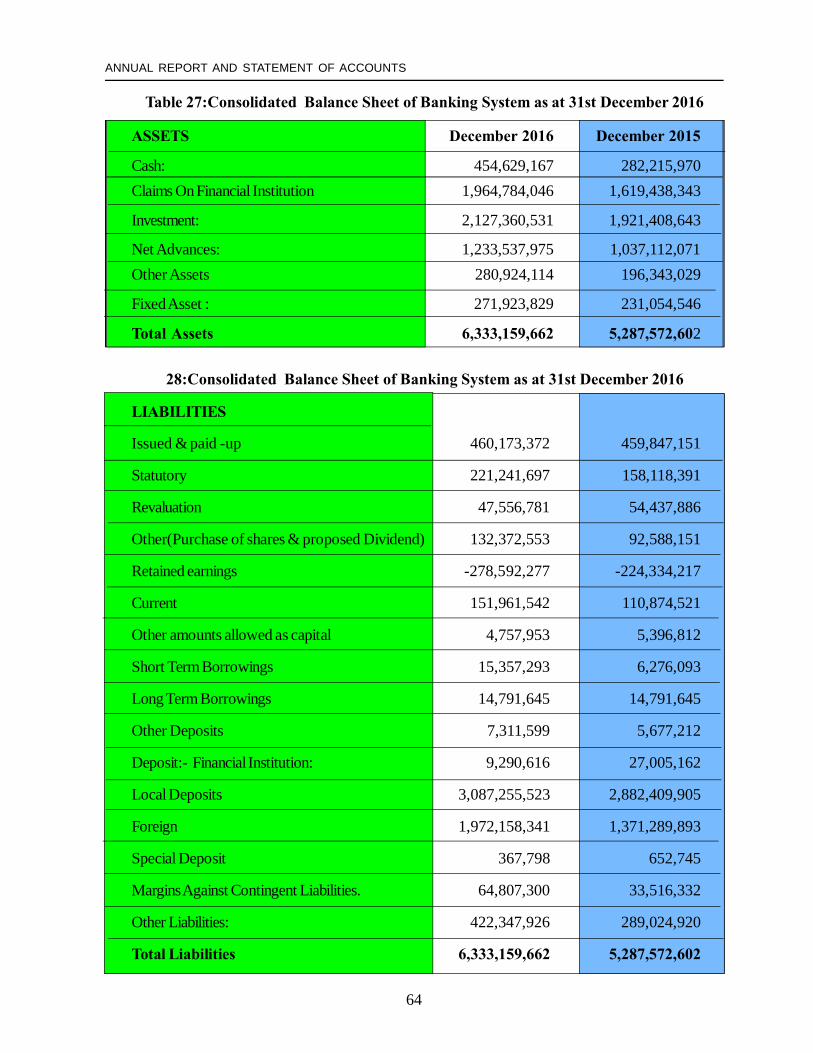
64
ANNUAL REPORT AND STATEMENT OF ACCOUNTS
Table 27:Consolidated Balance Sheet of Banking System as at 31st December 2016
ASSETS December 2016 December 2015
Cash: 454,629,167 282,215,970Claims On Financial Institution 1,964,784,046 1,619,438,343
Investment: 2,127,360,531 1,921,408,643
Net Advances: 1,233,537,975 1,037,112,071Other Assets 280,924,114 196,343,029
Fixed Asset : 271,923,829 231,054,546
Total Assets 6,333,159,662 5,287,572,602
28:Consolidated Balance Sheet of Banking System as at 31st December 2016
LIABILITIES
Issued & paid -up 460,173,372 459,847,151
Statutory 221,241,697 158,118,391
Revaluation 47,556,781 54,437,886
Other(Purchase of shares & proposed Dividend) 132,372,553 92,588,151
Retained earnings -278,592,277 -224,334,217
Current 151,961,542 110,874,521
Other amounts allowed as capital 4,757,953 5,396,812
Short Term Borrowings 15,357,293 6,276,093
Long Term Borrowings 14,791,645 14,791,645
Other Deposits 7,311,599 5,677,212
Deposit:- Financial Institution: 9,290,616 27,005,162
Local Deposits 3,087,255,523 2,882,409,905
Foreign 1,972,158,341 1,371,289,893
Special Deposit 367,798 652,745
Margins Against Contingent Liabilities. 64,807,300 33,516,332
Other Liabilities: 422,347,926 289,024,920
Total Liabilities 6,333,159,662 5,287,572,602
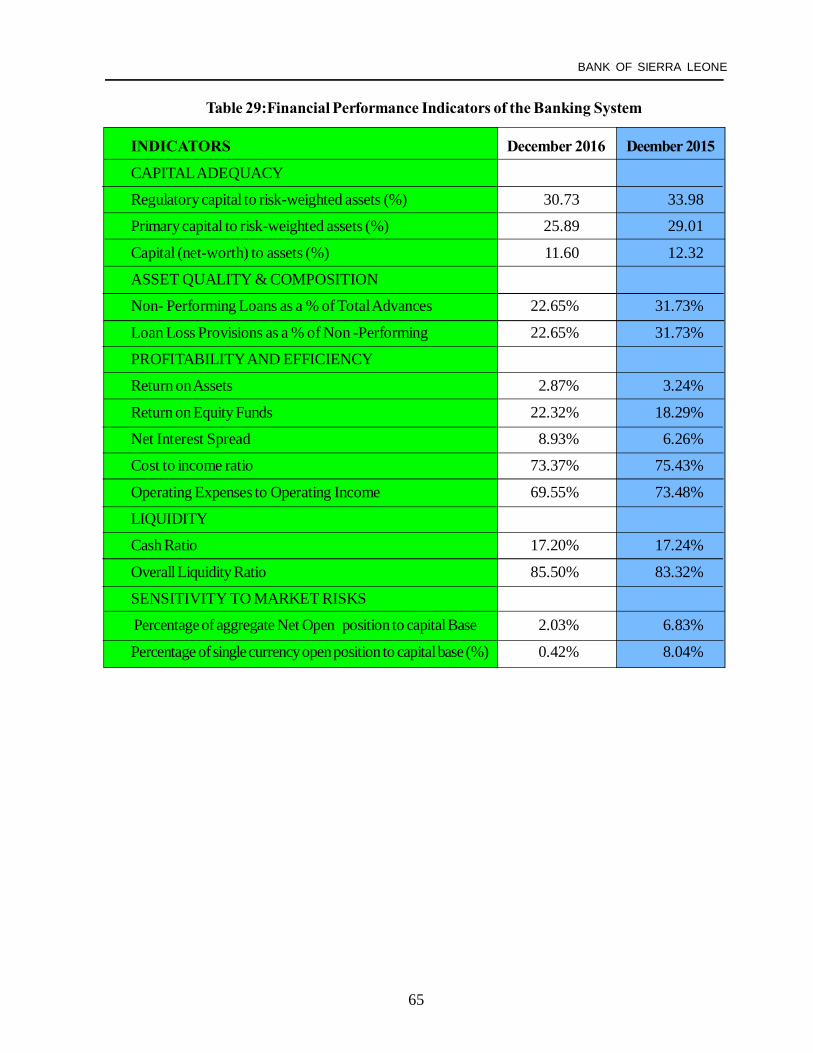
65
BANK OF SIERRA LEONE
Table 29:Financial Performance Indicators of the Banking System
INDICATORS December 2016 Deember 2015
CAPITAL ADEQUACY
Regulatory capital to risk-weighted assets (%) 30.73 33.98
Primary capital to risk-weighted assets (%) 25.89 29.01
Capital (net-worth) to assets (%) 11.60 12.32
ASSET QUALITY & COMPOSITION
Non- Performing Loans as a % of Total Advances 22.65% 31.73%
Loan Loss Provisions as a % of Non -Performing 22.65% 31.73%
PROFITABILITY AND EFFICIENCY
Return on Assets 2.87% 3.24%
Return on Equity Funds 22.32% 18.29%
Net Interest Spread 8.93% 6.26%
Cost to income ratio 73.37% 75.43%
Operating Expenses to Operating Income 69.55% 73.48%
LIQUIDITY
Cash Ratio 17.20% 17.24%
Overall Liquidity Ratio 85.50% 83.32%
SENSITIVITY TO MARKET RISKS
Percentage of aggregate Net Open position to capital Base 2.03% 6.83%
Percentage of single currency open position to capital base (%) 0.42% 8.04%
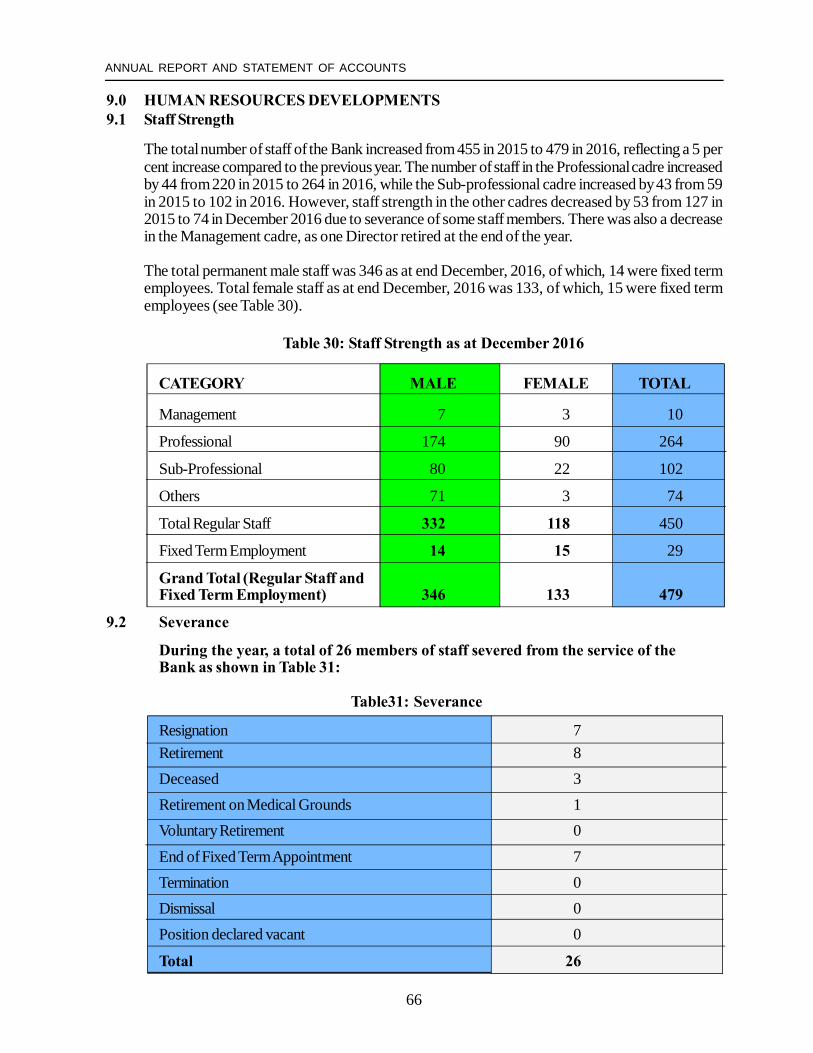
66
ANNUAL REPORT AND STATEMENT OF ACCOUNTS
9.0 HUMAN RESOURCES DEVELOPMENTS9.1 Staff Strength
The total number of staff of the Bank increased from 455 in 2015 to 479 in 2016, reflecting a 5 percent increase compared to the previous year. The number of staff in the Professional cadre increasedby 44 from 220 in 2015 to 264 in 2016, while the Sub-professional cadre increased by 43 from 59in 2015 to 102 in 2016. However, staff strength in the other cadres decreased by 53 from 127 in2015 to 74 in December 2016 due to severance of some staff members. There was also a decreasein the Management cadre, as one Director retired at the end of the year.
The total permanent male staff was 346 as at end December, 2016, of which, 14 were fixed termemployees. Total female staff as at end December, 2016 was 133, of which, 15 were fixed termemployees (see Table 30).
Table 30: Staff Strength as at December 2016
CATEGORY MALE FEMALE TOTAL
Management 7 3 10
Professional 174 90 264
Sub-Professional 80 22 102
Others 71 3 74
Total Regular Staff 332 118 450
Fixed Term Employment 14 15 29
Grand Total (Regular Staff andFixed Term Employment) 346 133 479
9.2 Severance
During the year, a total of 26 members of staff severed from the service of theBank as shown in Table 31:
Table31: Severance
Resignation 7Retirement 8Deceased 3Retirement on Medical Grounds 1Voluntary Retirement 0End of Fixed Term Appointment 7Termination 0Dismissal 0Position declared vacant 0
Total 26
67
BANK OF SIERRA LEONE
9.3 Training - 2016
During the year, enhancement of staff capacity to effectively and efficiently execute their responsibilitiesremained a key priority of the Bank. The BSL in collaboration with other sponsoring agencies suchas the Joint Partnership for Africa (JPA), the International Monetary Fund (IMF), AfricanDevelopment Bank and the World Bank, sponsored a total number of 25 overseas short coursesand two local training programmes.
Furthermore, a total number of 28 Bank staff benefitted from West African Institute for Financialand Economic Management (WAIFEM) courses in the areas of Banking Supervision, FinancialManagement and Budgeting, Debt Sustainability Analysis, Exchange Rate Regimes, Monetary Policyand Macro prudential Analysis, Financial Programming and Policies and Managing HumanResources. Also, one staff received full Bank Sponsorship to pursue the Chartered Financial AnalystProfessional Certification Course.
During the review period, 46 staff attended various overseas training programmes while 128 staffbenefitted from training programmes organized locally.
Statement of A ccountsfor year ended 31st December 2016
69
BANK OF SIERRA LEONE
GENERAL INFORMATION
BOARD OF DIRECTORS Dr. Patrick S. Conteh - Governor (appointed 18 July 2017)Dr Ibrahim Stevens - Deputy Governor (appointed 24 July 2014)Professor Richard T. M'bayo - Appointed 13 June 2014Mr.Winstanley B. Johnson - Appointed 19 April 2016P. C. Mohamed D. Benya v - Appointed 6 June 2014Mrs Rosaline Y. Fadika - Appointed 6 June 2014Mr Sorie N. Dumbuya - Re-appointed 6 June 2014
SENIOR MANAGEMENT Dr. Patrick S. Conteh - GovernorDr Ibrahim Stevens - Deputy GovernorMr Ibrahim K. Lamin - Senior Director, Special Assignment, REP,
Governor's OfficeMr Tapsiru Dainkeh - Senior Director, Special Assignment, FSS,
Governor's OfficeMr Abubakarr Jalloh - Director, Special Assignment, WAMA & ALL,
Governor's OfficeMr Ralph Ansumana - Director, Banking DepartmentMrs Hanifa Addai - Director, Banking Supervision DepartmenMr Abdul Aziz Sowe - Director, Finance DepartmentMs Jenneh Jabati - Director, General Services DepartmentMrs Mary M. Kargbo - Director, Special Assignment, M & TP,
Governor's OfficeMr Richard J D Sowa - Director, Secretary's DepartmentMr Morlai Bangura - Acting Director, Research DepartmentMr Abdul Bundu - Acting Director, Internal Audit DepartmentMr Jibao Flee - Acting Director, Financial Markets DepartmentMs Hawa Kallon - Acting Director, Human Resource DepartmentMs Fatima Mansaray - Acting Director, Management Information
Systems Department
REGISTERED OFFICE 30 Siaka Stevens StreetFreetown
SOLICITORS Yada Williams and AssociatesBarristers & Solicitors7 Walpole StreetFreetown
SECRETARY TO Mr Richard J D Sowa - Director, Secretary'sTHE BOARD
AUDITORS BDORegent House12 Wilberforce StreetFreetown
70
ANNUAL REPORT AND STATEMENT OF ACCOUNTS
REPORT OF THE DIRECTORS
The Directors have pleasure in submitting their report to the Government of Sierra Leone together withthe audited financial statements for the year ended 31 December 2016.
Principal Activity
The principal activity of the Bank is to:
(a) formulate and implement monetary policies, financial regulations and prudential standards;(b) act as banker, adviser and fiscal agent of the Government;(c) formulate and implement the foreign exchange policy of Sierra Leone;(d) conduct foreign exchange operations;(e) own, hold and maintain the official international reserves including the reserves of gold;(f) issue and manage the currency of Sierra Leone;(g) establish, promote, license and oversee sound and efficient payment and securities settlement systems;(h) license, register, regulate and supervise financial institutions as specified in the Bank of Sierra Leone
Act or any other enactment; and
(i) act as a depository for funds from international organisations.
Directors’ Responsibility Statement
The Bank’s Directors are responsible for the preparation and fair presentation of the financial statements,comprising the statement of financial position as at 31 December 2016 and the statements of comprehensiveincome, changes in equity and cashflows for the year then ended, and the notes to the financial statements,which include a summary of significant accounting policies and otherexplanatory notes, in accordancewith International Financial Reporting Standards, and in the manner required by the Bank of Sierra LeoneAct 2011 and for such internal controls as the Directors determine is necessary to enable the preparationof financial statements that are free from material misstatement, whether due to fraud or error.
The operability of the Bank on an on-going basis is guaranteed by the Government. Hence there are nogoing concern issues.
CapitalDetails of the Bank’s capital are given in note 30 to the financial statements.
Results for the periodLoss for the period was Le18 billion (2015: profit of Le68 billion).
71
BANK OF SIERRA LEONE
REPORT OF THE DIRECTORS (Contd)
Audit Committee
The Audit Committee comprising Non-Executive Directors and one Technical Expert is responsible forthe oversight function over the audit mechanism, internal controls system and the financial system of theBank. The Audit Committee meets quarterly to review and monitor the status of the audit function includingthe implementation of recommendations in the internal audit reports, external auditors’ management lettersand other oversight reports including the IMF Safeguards Assessment Reports.
Monetary Policy Committee
The Monetary Policy Committee is the highest policy making body in the Bank on monetary policymatters. Chaired by the Governor of the Bank, this Committee meets quarterly to review developmentsin the economy and the implications for monetary policy management. It takes decisions on the level ofthe key policy rate of the Bank, the Monetary Policy Rate (MPR) to signal to the market the stance anddirection of the Bank’s Monetary Policy in seeking to achieve the primary objective of price stability.
Banking Supervision Technical Committee
This committee is responsible to direct and deliberate on the operations of all financial institutions in orderto ensure financial stability in the economy.
Foreign Assets Committee
The Foreign Assets Committee meets quarterly and has responsibility to deliberate on issues relating tothe foreign assets of the Bank, exchange control regulations relating to capital account transactions; itmonitors and maintains the external reserves to safeguard the internal value of the legal currency andformulates policies that support monetary and exchange rate management.
Project Monitoring Committee
The Project Monitoring Committee is responsible to monitor on-going projects implemented by the Bankand make appropriate recommendations to Management and the Board of Directors.
Property, plant and equipment
Details of the Bank’s property, plant and equipment are shown in note 21 to the financial statements.
Employment of disabled people
The Bank does not discriminate against a qualified individual with disability with regards torecruitment,advancement, training, compensation, discharge or other terms, conditions or privileges ofemployment.
Health, safety and welfare at work
The Bank has retained the services of a medical doctor for all employees of the Bank and a conduciveoffice environment is maintained for staff and visitors, with adequate lighting and ventilation.
72
ANNUAL REPORT AND STATEMENT OF ACCOUNTS
REPORT OF THE DIRECTORS (Contd)
Employee involvement and training
There are various forums where the staff meet and discuss issues that relate to them and their progress atthe work place, these include unit meetings, and regular general meetings.
There is an approved training schedule for the Bank and staff are trained both locally and internationally invarious areas to improve their skills and knowledge. The Bank also has a staff appraisal process throughwhich staff are appraised and promotions and/or increments are awarded.
Directors and their interest
The following were Directors of the Bank as at 31 December 2016:
Dr Kaifala Marah - Governor/Chairman (appointed 14 April 2016)Dr Ibrahim Stevens - Deputy Governor (appointed 24 July 2014)Professor Richard T. M’Bayo - Director (appointed 13 June 2014)Mr Winstanley B. Johnson - Director (appointed 19 April 2016)P. C. Mohamed D. Benya v - Director (appointed 6 June 2014)Mrs Rosaline Y. Fadika - Director (appointed 6 June 2014)Mr. Sorie N. Dumbuya - Director (re-appointed 6 June 2014)
The erstwhile Governor and Deputy Governor were appointed on 14 April 2016 and 24 July 2014respectively, in accordance with section 15(2) of the Bank of Sierra Leone Act 2011, to hold office for aterm of five yearseach and to be eligible for re-appointment for another term only.
On the resignation of Dr. Kaifala Marah on 6 March 2017, Dr. Patrick S. Conteh was appointed Governorof the Bank on 18 July 2017.
The other directors are to hold offices for three years each and shall be eligible for re-appointment foranother term only.
No Director had during the year or has a material interest in any contract or arrangement of significance towhich the Bank was or is a party.
Auditors
The auditors, BDO, were appointed by the Auditor-General to conduct the audit of the financial statementsfor the period ended 31 December 2016.
Approval of the financial statements
The financial statements were approved by the Board of Directors on ……………....... 2018.
…………………….....… ……………………………… Governor Director
……………………………… Secretary
73
BANK OF SIERRA LEONE
INDEPENDENT AUDITORS’ REPORTTO THE GOVERNMENT OF SIERRA LEONE
Opinion
We have audited the financial statements of Bank of Sierra Leone set out on pages 9 to 66 which comprisethe statement of financial position as at 31 December 2016, the statement of comprehensive income,statement of changes in equity and statement of cashflows for the year then ended, and notes to thefinancial statements, including a summary of significant accounting policies.
In our opinion, the accompanying financial statements present fairly, in all material respects, the financialposition of the Bank as at 31 December 2016, its financial performance and its cashflows for the year thenended in accordance with International Financial Reporting Standards (IFRSs) and the requirements ofthe Bank of Sierra Leone Act 2011.
Basis for Opinion
We conducted our audit in accordance with International Standards on Auditing (ISAs). Our responsibilitiesunder those standards are further described in the Auditors’ Responsibilities for the Audit of the FinancialStatements section of our report. We are independent of the Bank in accordance with the InternationalEthics Standards Board for Accountants’ Code of Ethics for Professional Accountants (IESBA Code),and we have fulfilled our other ethical responsibilities in accordance with the IESBA Code. We believethat the audit evidence we have obtained is sufficient and appropriate to provide a basis for our opinion.
Key Audit Matters
Key audit matters are those matters that, in our professional judgement were of most significance in ouraudit of the financial statements of the current period. These matters were addressed in the context of ouraudit of the financial statements as a whole, and in forming our opinion thereon, we do not provide aseparate opinion on these matters.
The key audit matters which apply to the audit of the financial statements of the Bank are:
• Foreign exchange transactions including the respective net exchange gain/loss• Accuracy of assets and liabilities with respect to disclosure and valuation• Completeness of notes
Foreign exchange transactions including the respective net exchange gain/lossThe Bank holds international reserves in foreign currencies as well as assets and liabilities arising from itsmembership in the International Monetary Fund (IMF). According to the Bank’s accounting policies, allforeign currency positions should be revalued daily. With respect to the IMF assets and liabilities, thepolicies refer to IMFs Aide Memoire “Accounting for Fund Transactions” dated August 1, 2016.
74
ANNUAL REPORT AND STATEMENT OF ACCOUNTS
INDEPENDENT AUDITORS’ REPORTTO THE GOVERNMENT OF SIERRA LEONE (CONTD)
In the course of our audit we have performed a systems audit of the Bank’s system used for the accountingof foreign exchange transactions. The Bank’s system for accounting for foreign exchange transactionincluding the respective recognition of realized and unrealized gains and losses is not configured to showand work with the exchange rates at which the transactions were originally acquired. Manual recomputationsof the realized exchange gains and losses had to be performed and the amounts adjusted and restated on2016 and 2015 respectively. See note 10c for further details.
Accuracy of assets and liabilities with respect to disclosure and valuationThe Bank holds various Balances with other Central Banks, Placement with Banks, Cash Balances withBanks, Balances due from the Government as well as Deposits from Government, Banks and Others.
In the course of our audit we have performed balance sheet confirmations in compliance with internationalauditing standards. The counterparties had to complete a blank confirmation with account informationand balances. The confirmations were posted by and returned to BDO. All differences have either beencleared with alternative audit procedures or have been adjusted accordingly.
Completeness of notes
Due to fast developing Accounting Standards, the completeness and correctness of the notes had beenidentified as a key audit matter.
In the course of our audit we emphasized on the completeness and correctness of the notes. We thereforemet with the Bank, scrutinized all information in detail, took the respective evidence on file and usedinternational disclosure checklist, industry sector checklist, and the applicable accounting standards. Basedon the discussions, the information received and our findings the Bank has changed the notes accordingly.
Our IT review revealed that evidence of compliance with controls was not, in all instances, available andhence we could not establish the extent to which controls were complied with. Effective controls aroundrecord keeping and processing of transactions increase assurance on the accuracy of the financialstatements.In the circumstance, to mitigate the risk, we adopted sample sizes larger than the normal andextensive verification work in our audit strategy.
We have looked more specifically into aggregation of balances, the classification of line items and thecompletion of disclosures. Additionally work has also been done on revenue recognition and foreignexchange transactions.
Other Information
Management is responsible for the other information. The other information comprises the informationincluded in the Annual Report, but does not include the financial statements and our auditors’ reportthereon. Our opinion on the financial statements does not cover the other information and we do notexpress any form of assurance conclusion thereon.

75
BANK OF SIERRA LEONE
INDEPENDENT AUDITORS’ REPORTTO THE GOVERNMENT OF SIERRA LEONE (CONTD)
In connection with our audit of the financial statements, our responsibility is to read the other informationand, in doing so, consider whether the other information is materially inconsistent with the financial statementsor our knowledge obtained in the audit or otherwise appears to be materially misstated. If, based on thework we have performed, we conclude that there is a material misstatement of this other information, weare required to report that fact. We have nothing to report in this regard.
Responsibilities of Management and Those Charged with Governance for the FinancialStatements
Management is responsible for the preparation and fair presentation of the financial statements in accordancewith IFRSs, and for such internal control as management determines is necessary to enable the preparationof financial statements that are free from material misstatement, whether due to fraud or error.
In the capacity as the Government’s bankers, the continuance of the Bank’s operations as a going concernis guaranteed by the Government of Sierra Leone.
Those charged with governance are responsible for overseeing the financial reporting process.
Auditors’ Responsibilities for the Audit of the Financial Statements
Our Objectives are to obtain reasonable assurance about whether the financial statements as a whole arefree from material misstatement, whether due to fraud or error, and to issue an auditors’ report thatincludes our opinion. Reasonable assurance is a high level of assurance, but is not a guarantee that an auditconducted in accordance with ISAs will always detect a material misstatement when it exists. Misstatementscan arise from fraud or error and are considered material if, individually or in the aggregate, they couldreasonably be expected to influence the economic decisions of users taken on the basis of these financialstatements.
As part of an audit in accordance with ISAs, we exercise professional judgement and maintain professionalskepticism throughout the audit. We also:
Identify and assess the risks of material misstatement of the financial statements, whether due to fraud orerror, design and perform audit procedures responsive to those risks, and obtain audit evidence that issufficient and appropriate to provide a basis for our opinion. The risk of not detecting a material misstatementresulting from fraud is higher than for one resulting from error, as fraud may involve collusion, forgery,intentional omissions, misrepresentations, or the override of internal control.
Obtain an understanding of internal controls relevant to the audit in order to design audit procedures thatare appropriate in the circumstances, but not for the purpose of expressing an opinion on the effectivenessof the Bank’s internal control.
Evaluate the appropriateness of accounting policies used and the reasonableness of Iaccounting estimatesand related disclosures made by management.
76
ANNUAL REPORT AND STATEMENT OF ACCOUNTS
INDEPENDENT AUDITORS’ REPORTTO THE GOVERNMENT OF SIERRA LEONE (CONTD)
Conclude on the appropriateness of management’s use of the going concern basis of accounting and,based on the audit evidence obtained, whether a material uncertainty exists related to events or conditionsthat may cast significant doubt on the Bank’s ability to continue as a going concern. If we conclude that amaterial uncertainty exists, we are required to draw attention in our auditors’ report to the related disclosuresin the financial statements or, if such disclosures are inadequate, to modify our opinion. Our conclusionsare based on the audit evidence obtained up to the date of our auditors’ report. However, future eventsor conditions may cause the Bank to cease to continue as a going concern.
Evaluate the overall presentation, structure and content of the financial statements, including the disclosures,and whether the financial statements represent the underlying transactions and events in a manner thatachieves fair presentation.
Obtain sufficient appropriate audit evidence regarding the financial information of the entities or businessactivities within the Bank to express an opinion on the financial statements. We are responsible for thedirection, supervision and performance of the Bank audit. We remain solely responsible for our auditopinion.
We communicate with those charged with governance regarding, among other matters, the planned scopeand timing of the audit and significant audit findings, including any significant deficiencies in internal controlthat we identify during our audit.
We also provide those charged with governance with a statement that we have complied with relevantethical requirements regarding independence, and to communicate with them all relationships and othermatters that may reasonably be thought to bear on our independence, and where applicable, relatedsafeguards.
F r o m t h e m a t t e r s c o m m u n i c a t e d w i t h t h o s e c h a r g e d w i t h g o v e r n a n c e , w e d e t e r m i n e t h o s e m a t t e r s t h a t
w e r e o f m o s t s i g n i f i c a n c e i n t h e a u d i t o f t h e f i n a n c i a l s t a t e m e n t s o f t h e c u r r e n t p e r i o d a n d a r e t h e r e f o r e t h e
k e y a u d i t m a t t e r s . W e d e s c r i b e t h e s e m a t t e r s i n o u r a u d i t o r s ’ r e p o r t u n l e s s l a w o r r e g u l a t i o n p r e c l u d e s
p u b l i c d i s c l o s u r e a b o u t t h e m a t t e r o r w h e n , i n e x t r e m e l y r a r e c i r c u m s t a n c e s , w e d e t e r m i n e t h a t a m a t t e r
s h o u l d n o t b e c o m m u n i c a t e d i n o u r r e p o r t b e c a u s e t h e a d v e r s e c o n s e q u e n c e s o f d o i n g s o w o u l d r e a s o n a b l y
b e e x p e c t e d t o o u t w e i g h t h e p u b l i c i n t e r e s t b e n e f i t s o f s u c h c o m m u n i c a t i o n .
Report on Other Legal and Regulatory Requirements
In accordance with the requirements of Section 63 of the Bank of Sierra Leone Act 2011, we report that:
• we were able to examine the books and accounts of the Bank and were provided with all theinformation and explanations about its transactions required by us for the efficient performance ofour duties, and
• key matters arising from the audit and in particular on material weaknesses in internal controls inrelation to the financial reporting process have been disclosed.
The engagement partner on the audit resulting in this independent auditors’ report is Samuel Noldred.
Freetown, Sierra Leone
2018
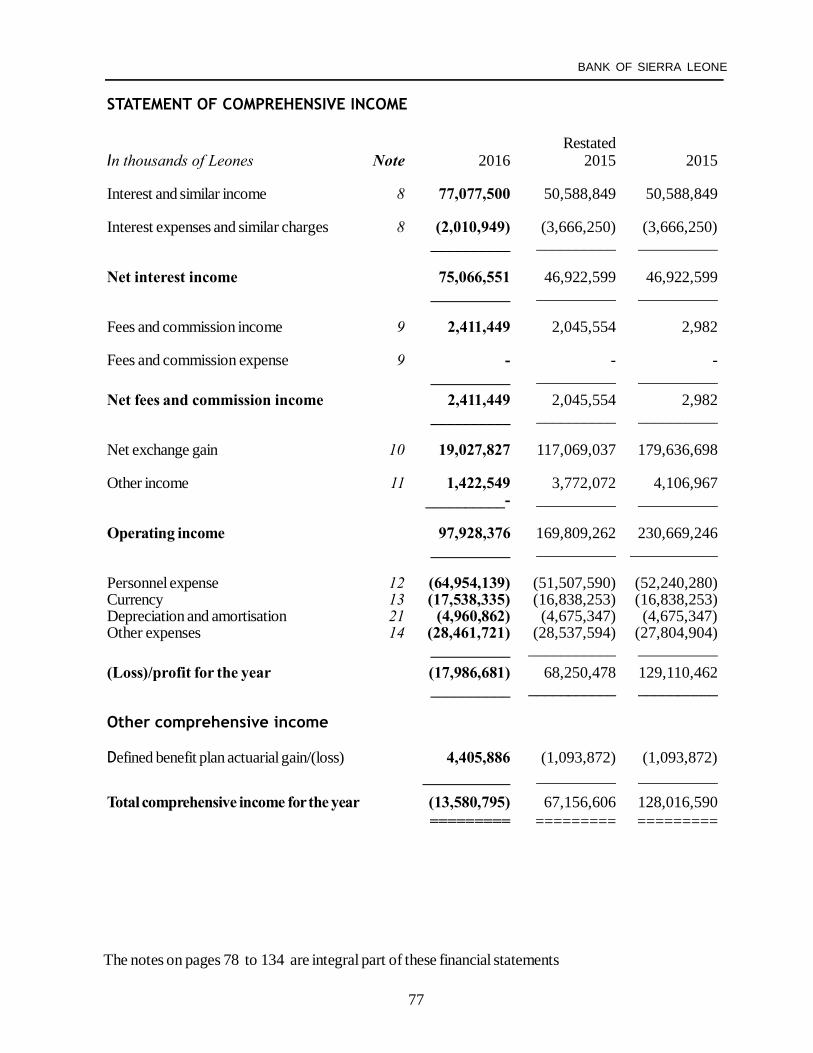
77
BANK OF SIERRA LEONE
STATEMENT OF COMPREHENSIVE INCOME
RestatedIn thousands of Leones Note 2016 2015 2015
Interest and similar income 8 77,077,500 50,588,849 50,588,849
Interest expenses and similar charges 8 (2,010,949) (3,666,250) (3,666,250)__________ __________ __________
Net interest income 75,066,551 46,922,599 46,922,599__________ __________ __________
Fees and commission income 9 2,411,449 2,045,554 2,982
Fees and commission expense 9 - - -__________ __________ __________
Net fees and commission income 2,411,449 2,045,554 2,982__________ __________ __________
Net exchange gain 10 19,027,827 117,069,037 179,636,698
Other income 11 1,422,549 3,772,072 4,106,967__________- __________ __________
Operating income 97,928,376 169,809,262 230,669,246__________ __________ ___________
Personnel expense 12 (64,954,139) (51,507,590) (52,240,280)Currency 13 (17,538,335) (16,838,253) (16,838,253)Depreciation and amortisation 21 (4,960,862) (4,675,347) (4,675,347)Other expenses 14 (28,461,721) (28,537,594) (27,804,904)
__________ ___________ __________(Loss)/profit for the year (17,986,681) 68,250,478 129,110,462
__________ ___________ __________
Other comprehensive income
Defined benefit plan actuarial gain/(loss) 4,405,886 (1,093,872) (1,093,872)___________ __________ __________
Total comprehensive income for the year (13,580,795) 67,156,606 128,016,590========= ========= =========
The notes on pages 78 to 134 are integral part of these financial statements
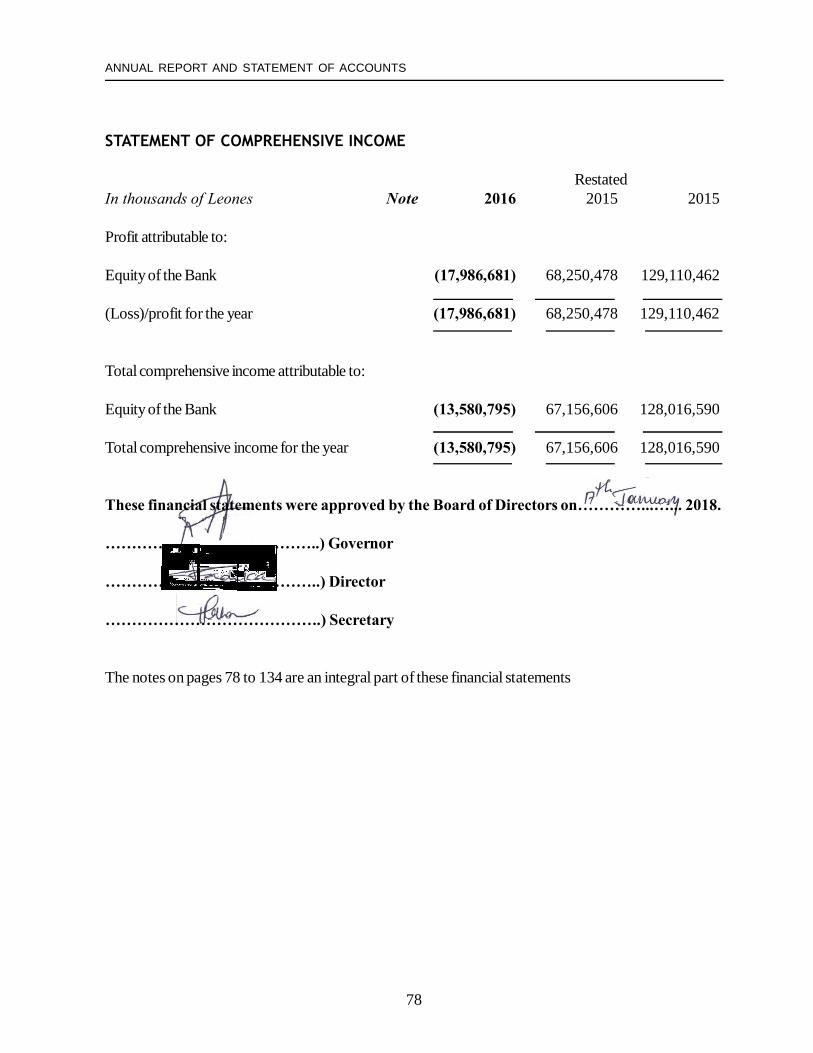
78
ANNUAL REPORT AND STATEMENT OF ACCOUNTS
STATEMENT OF COMPREHENSIVE INCOME
RestatedIn thousands of Leones Note 2016 2015 2015
Profit attributable to:
Equity of the Bank (17,986,681) 68,250,478 129,110,462
(Loss)/profit for the year (17,986,681) 68,250,478 129,110,462
Total comprehensive income attributable to:
Equity of the Bank (13,580,795) 67,156,606 128,016,590
Total comprehensive income for the year (13,580,795) 67,156,606 128,016,590
These financial statements were approved by the Board of Directors on…………...…... 2018.
…………………………………..) Governor
…………………………………..) Director
…………………………………..) Secretary
The notes on pages 78 to 134 are an integral part of these financial statements
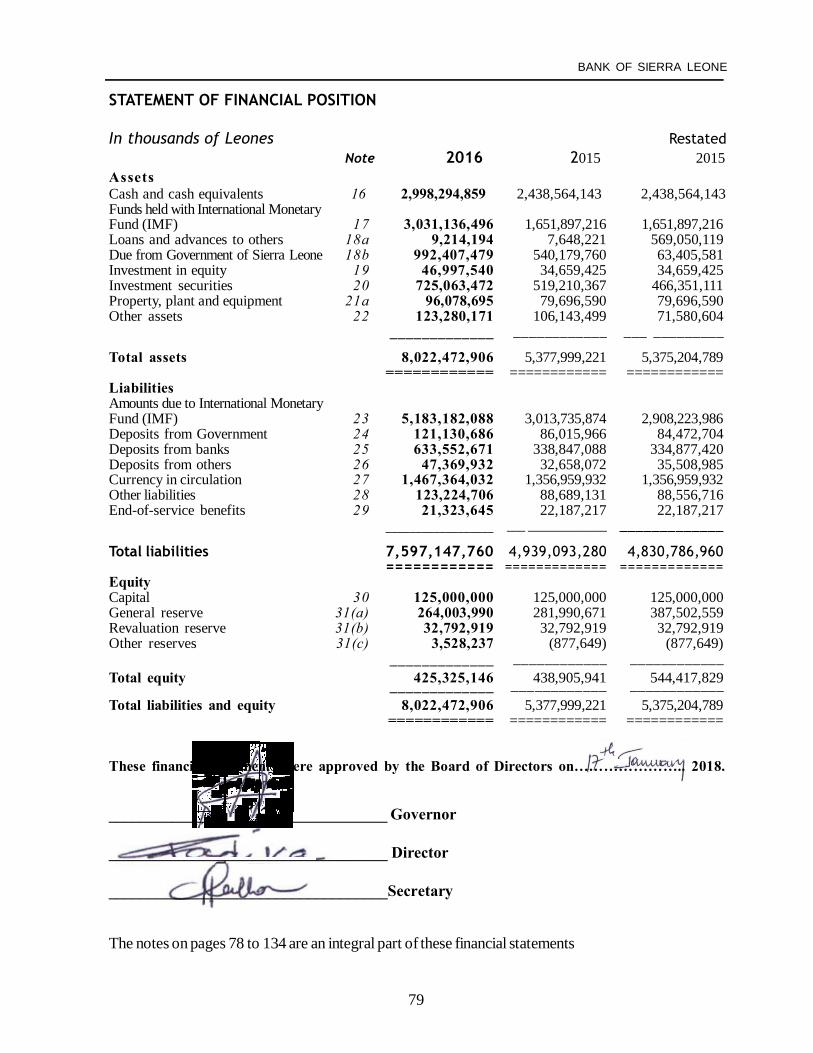
79
BANK OF SIERRA LEONE
STATEMENT OF FINANCIAL POSITION
In thousands of Leones Restated Note 2016 2015 2015
AssetsCash and cash equivalents 16 2,998,294,859 2,438,564,143 2,438,564,143Funds held with International MonetaryFund (IMF) 17 3,031,136,496 1,651,897,216 1,651,897,216Loans and advances to others 18a 9,214,194 7,648,221 569,050,119Due from Government of Sierra Leone 18b 992,407,479 540,179,760 63,405,581Investment in equity 19 46,997,540 34,659,425 34,659,425Investment securities 20 725,063,472 519,210,367 466,351,111Property, plant and equipment 21a 96,078,695 79,696,590 79,696,590Other assets 22 123,280,171 106,143,499 71,580,604
_____________ ____________ ___ _________
Total assets 8,022,472,906 5,377,999,221 5,375,204,789============ ============ ============
LiabilitiesAmounts due to International MonetaryFund (IMF) 23 5,183,182,088 3,013,735,874 2,908,223,986Deposits from Government 24 121,130,686 86,015,966 84,472,704Deposits from banks 25 633,552,671 338,847,088 334,877,420Deposits from others 26 47,369,932 32,658,072 35,508,985Currency in circulation 27 1,467,364,032 1,356,959,932 1,356,959,932Other liabilities 28 123,224,706 88,689,131 88,556,716End-of-service benefits 29 21,323,645 22,187,217 22,187,217
__________________ ___ _____________ _____________
Total liabilities 7,597,147,760 4,939,093,280 4,830,786,960============ ============= =============
EquityCapital 30 125,000,000 125,000,000 125,000,000General reserve 31(a) 264,003,990 281,990,671 387,502,559Revaluation reserve 31(b) 32,792,919 32,792,919 32,792,919Other reserves 31(c) 3,528,237 (877,649) (877,649)
_____________ ____________ ____________Total equity 425,325,146 438,905,941 544,417,829_____________ ____________ ____________Total liabilities and equity 8,022,472,906 5,377,999,221 5,375,204,789
============ ============ ============
These financial statements were approved by the Board of Directors on………………….. 2018.
___________________________________ Governor
___________________________________ Director
___________________________________Secretary
The notes on pages 78 to 134 are an integral part of these financial statements

80
ANNUAL REPORT AND STATEMENT OF ACCOUNTS
STA
TEM
ENT
OF
CHA
NG
ES IN
EQ
UIT
Y
In th
ousa
nds o
f Leo
nes
Prop
erty
Shar
eR
eval
uatio
nG
ener
alO
ther
Cap
ital
Res
erve
Res
erve
Res
erve
sT
otal
Bal
ance
at 1
Janu
ary
2015
1
25,0
00,0
00 3
2,79
2,91
9
25
6,68
4,42
0 2
16,3
2341
4,69
3,66
2T
otal
com
preh
ensi
ve in
com
e fo
r th
e ye
arN
et p
rofit
for t
he y
ear
-
-
1
29,1
10,4
62-
129,
110,
462
Secu
ritie
s res
erve
s
-
-
--
Prio
r per
iod
adju
stm
ents
-
-
1
,707
,677
- 1
,707
,677
Oth
er c
ompr
ehen
sive
inco
me
Fair
valu
e re
serv
e (n
on-in
tere
st-b
earin
g se
curit
ies)
-
-
--
Act
uaria
l gai
n
-
-
-(1
,093
,972
) (1
,093
,972
)
Tot
al o
ther
com
preh
ensi
ve in
com
e fo
r th
e ye
ar
-
-
1
30,8
18,1
39 (1
,093
,972
)12
9,72
4,16
7
Tot
al c
ompr
ehen
sive
inco
me
and
othe
r tr
ansf
ers
Subs
crib
ed d
urin
g th
e ye
ar
-
-
-
--
Dep
osit
for s
hare
s
-
-
--
-
Bal
ance
at 3
1 D
ecem
ber
2015
125,
000,
000
32,7
92,9
1938
7,50
2,55
9(8
77,6
49)
544,
417,
829
The
note
s on
page
s 78
to 1
34 a
re a
n in
tegr
al p
art o
f the
se fi
nanc
ial s
tate
men
ts
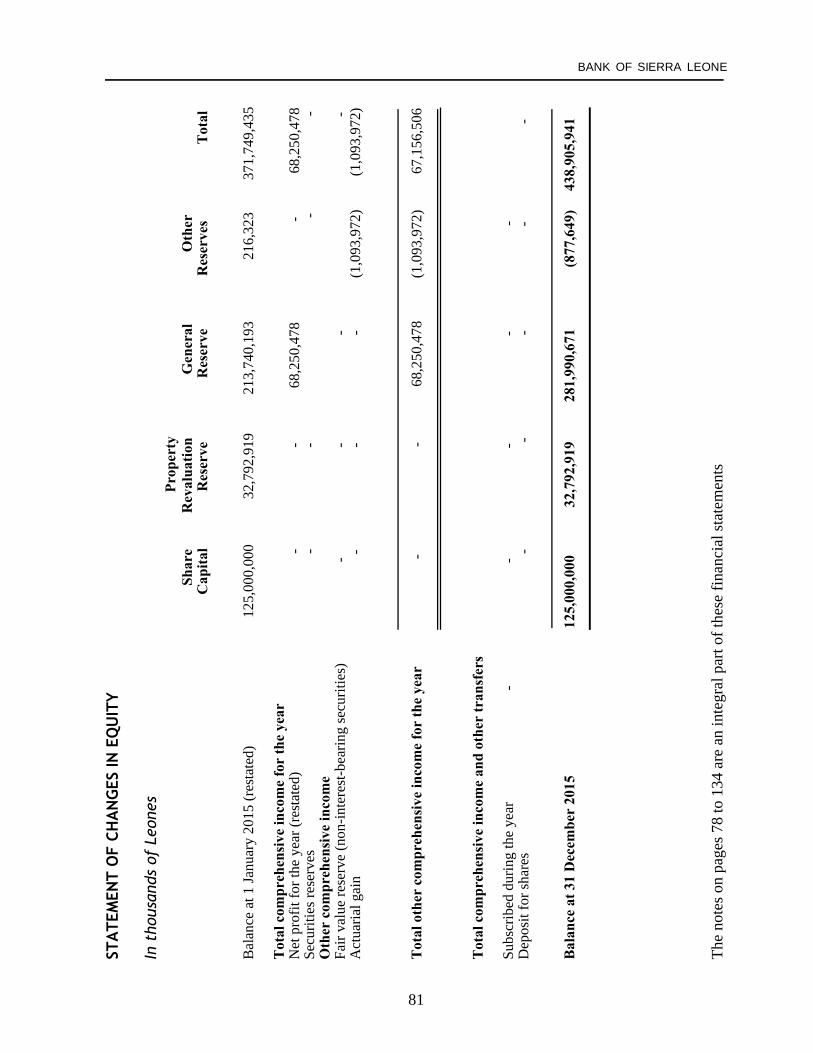
81
BANK OF SIERRA LEONE
STA
TEM
ENT
OF
CHA
NG
ES IN
EQ
UIT
Y
In t
hous
ands
of
Leon
esPr
oper
tySh
are
Rev
alua
tion
Gen
eral
Oth
erC
apita
lR
eser
veR
eser
veR
eser
ves
Tot
al
Bal
ance
at 1
Janu
ary
2015
(res
tate
d)12
5,00
0,00
0
32,
792,
919
21
3,74
0,19
3
21
6,32
337
1,74
9,43
5
Tot
al c
ompr
ehen
sive
inco
me
for
the
year
Net
pro
fit fo
r the
yea
r (re
stat
ed)
-
-
68
,250
,478
-
68,
250,
478
Secu
ritie
s res
erve
s-
-
--
Oth
er c
ompr
ehen
sive
inco
me
Fair
valu
e re
serv
e (n
on-in
tere
st-b
earin
g se
curit
ies)
-
-
-
-A
ctua
rial g
ain
-
-
-
(1,0
93,9
72)
(1,0
93,9
72)
Tot
al o
ther
com
preh
ensi
ve in
com
e fo
r th
e ye
ar
-
-
68,
250,
478
(1,0
93,9
72)
67,
156,
506
Tot
al c
ompr
ehen
sive
inco
me
and
othe
r tr
ansf
ers
Subs
crib
ed d
urin
g th
e ye
ar
-
-
-
-
-D
epos
it fo
r sha
res
-
-
-
-
-
Bal
ance
at 3
1 D
ecem
ber
2015
125,
000,
000
32,7
92,9
1928
1,99
0,67
1
(877
,649
)43
8,90
5,94
1
The
note
s on
page
s 78
to 1
34 a
re a
n in
tegr
al p
art o
f the
se fi
nanc
ial s
tate
men
ts
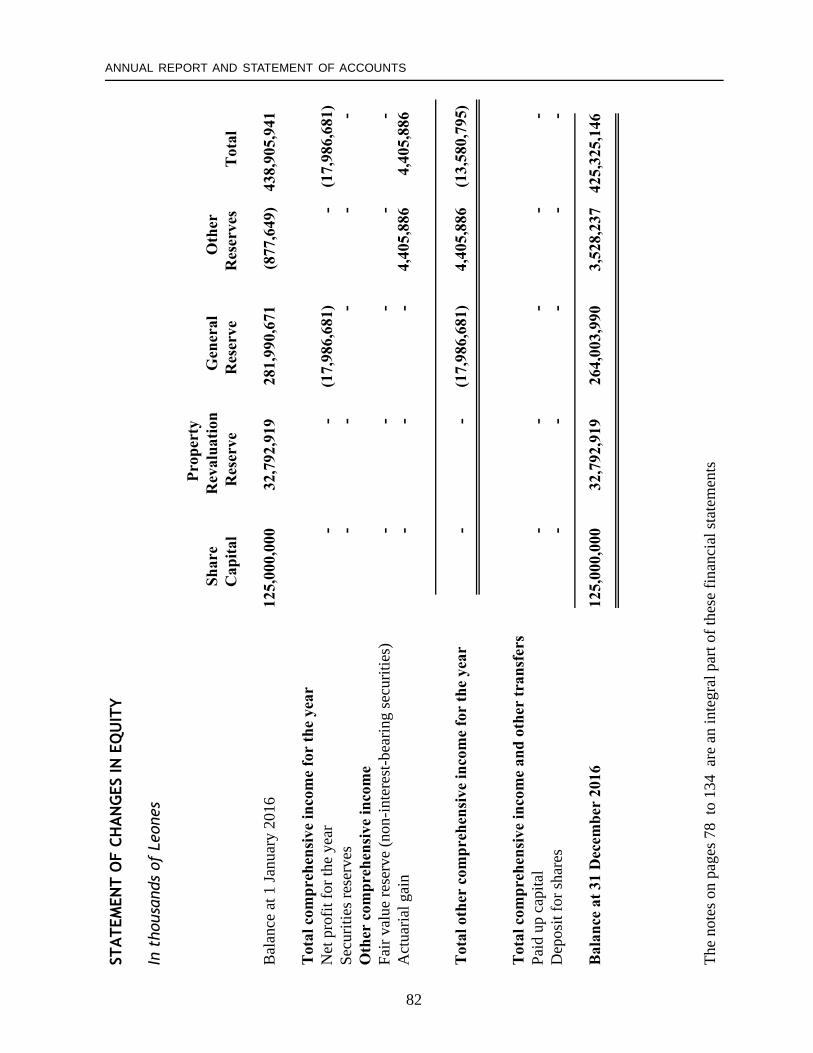
82
ANNUAL REPORT AND STATEMENT OF ACCOUNTS
STA
TEM
ENT
OF
CHA
NG
ES IN
EQ
UIT
Y
In t
hous
ands
of
Leon
es
P
rope
rty
S
hare
R
eval
uatio
n
Gen
eral
O
ther
C
apita
l
Res
erve
R
eser
ve
R
eser
ves
Tot
al
Bal
ance
at 1
Janu
ary
2016
125,
000,
000
32,
792,
919
28
1,99
0,67
1
(8
77,6
49)
438
,905
,941
Tot
al c
ompr
ehen
sive
inco
me
for
the
year
Net
pro
fit fo
r the
yea
r
-
-
(17,
986,
681)
-
(
17,9
86,6
81)
Secu
ritie
s res
erve
s
-
-
-
-
-O
ther
com
preh
ensi
ve in
com
eFa
ir va
lue
rese
rve
(non
-inte
rest
-bea
ring
secu
ritie
s)
-
-
-
-
-A
ctua
rial g
ain
-
-
-
4,
405,
886
4,4
05,8
86
Tot
al o
ther
com
preh
ensi
ve in
com
e fo
r th
e ye
ar
-
-
(17,
986,
681)
4,40
5,88
6
(13,
580,
795)
Tot
al c
ompr
ehen
sive
inco
me
and
othe
r tr
ansf
ers
Paid
up
capi
tal
-
-
-
-
-
Dep
osit
for s
hare
s
-
-
-
-
-
Bal
ance
at 3
1 D
ecem
ber
2016
125,
000,
000
32,7
92,9
1926
4,00
3,99
0
3,
528,
237
425,
325,
146
The
note
s on
page
s 78
to 1
34 a
re a
n in
tegr
al p
art o
f the
se fi
nanc
ial s
tate
men
ts
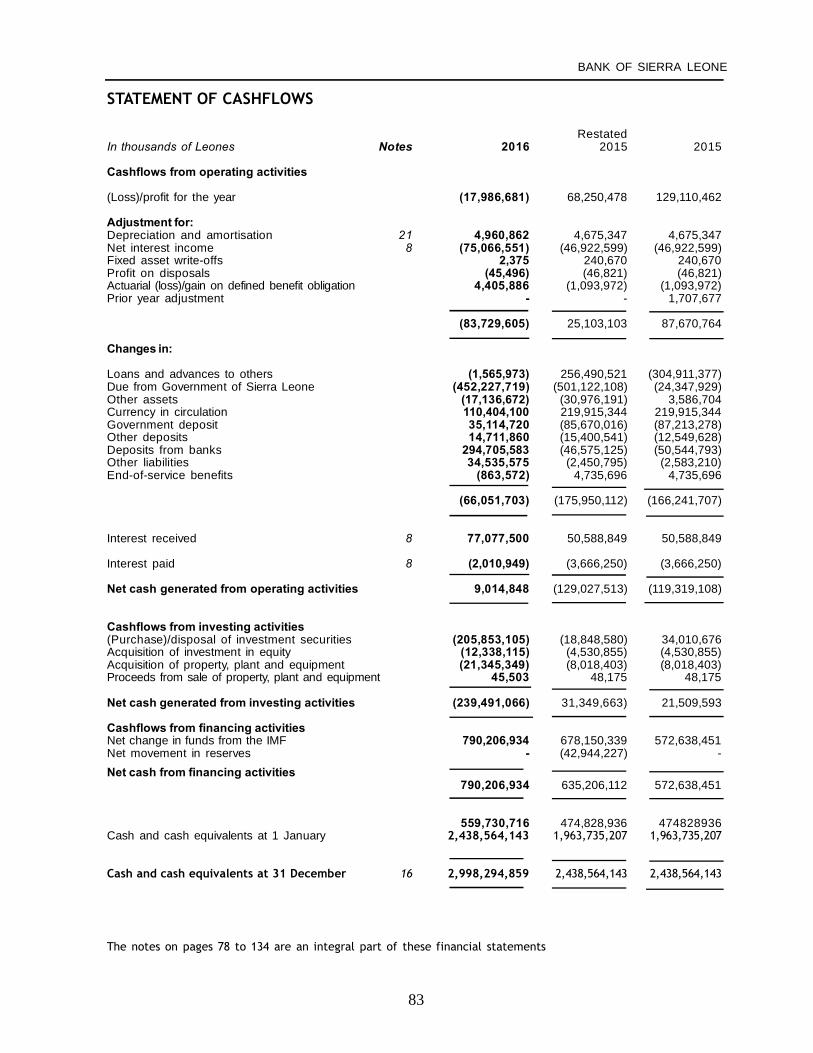
83
BANK OF SIERRA LEONE
STATEMENT OF CASHFLOWS
RestatedIn thousands of Leones Notes 2016 2015 2015
Cashflows from operating activities
(Loss)/profit for the year (17,986,681) 68,250,478 129,110,462
Adjustment for:Depreciation and amortisation 21 4,960,862 4,675,347 4,675,347Net interest income 8 (75,066,551) (46,922,599) (46,922,599)Fixed asset write-offs 2,375 240,670 240,670Profit on disposals (45,496) (46,821) (46,821)Actuarial (loss)/gain on defined benefit obligation 4,405,886 (1,093,972) (1,093,972)Prior year adjustment - - 1,707,677
(83,729,605) 25,103,103 87,670,764
Changes in:
Loans and advances to others (1,565,973) 256,490,521 (304,911,377)Due from Government of Sierra Leone (452,227,719) (501,122,108) (24,347,929)Other assets (17,136,672) (30,976,191) 3,586,704Currency in circulation 110,404,100 219,915,344 219,915,344Government deposit 35,114,720 (85,670,016) (87,213,278)Other deposits 14,711,860 (15,400,541) (12,549,628)Deposits from banks 294,705,583 (46,575,125) (50,544,793)Other liabilities 34,535,575 (2,450,795) (2,583,210)End-of-service benefits (863,572) 4,735,696 4,735,696
(66,051,703) (175,950,112) (166,241,707)
Interest received 8 77,077,500 50,588,849 50,588,849
Interest paid 8 (2,010,949) (3,666,250) (3,666,250)
Net cash generated from operating activities 9,014,848 (129,027,513) (119,319,108)
Cashflows from investing activities(Purchase)/disposal of investment securities (205,853,105) (18,848,580) 34,010,676Acquisition of investment in equity (12,338,115) (4,530,855) (4,530,855)Acquisition of property, plant and equipment (21,345,349) (8,018,403) (8,018,403)Proceeds from sale of property, plant and equipment 45,503 48,175 48,175
Net cash generated from investing activities (239,491,066) 31,349,663) 21,509,593
Cashflows from financing activitiesNet change in funds from the IMF 790,206,934 678,150,339 572,638,451Net movement in reserves - (42,944,227) -Net cash from financing activities
790,206,934 635,206,112 572,638,451
559,730,716 474,828,936 474828936Cash and cash equivalents at 1 January 2,438,564,143 1,963,735,207 1,963,735,207
Cash and cash equivalents at 31 December 16 2,998,294,859 2,438,564,143 2,438,564,143
The notes on pages 78 to 134 are an integral part of these financial statements
84
ANNUAL REPORT AND STATEMENT OF ACCOUNTS
NOTES TO THE FINANCIAL STATEMENTS
1 REPORTING ENTITY
The Bank of Sierra Leone is domiciled in Sierra Leone and its capital was subscribed wholly bytheGovernment of Sierra Leone. The address of the Bank’s registered office is 30 Siaka StevensStreet,Freetown. The Bank is primarily established to foster the liquidity, solvency and properfunctioning of a stable market-based financial system and to license and supervise institutions thatengage in the business of receiving money deposits or other repayable funds from the public andextending credits to their customers, including bureaux of exchange and foreign exchange dealers.
2 BASIS OF ACCOUNTING
The financial statements of Bank of Sierra Leone have been prepared in accordance with InternationalFinancial Reporting Standards (IFRSs) as issued by the International Accounting Standards Board(IASB) and the Bank of Sierra Leone Act 2011. They were authorised for issue by the Bank’sBoard of Directors.
Details of the Bank’s accounting policies, including changes during the year, are included in notes 37to 39.
3 FUNCTIONAL AND PRESENTATION CURRENCY
These financial statements are presented in Leones, which is the Bank’s functional currency. Allfinancial information presented in Leones has been rounded to the nearest thousand.
4 USE OF JUDGEMENTS AND ESTIMATES
In preparing these financial statements, management has made judgements, estimates and assumptionsthat affect the application of the bank’s accounting policies and the resulted reported amounts ofassets, liabilities, income and expenses. Actual effects may differ from these estimates.
Estimates and underlying assumptions are reviewed on an ongoing basis. Revisions to accountingestimates are recognised prospectively.
Assumptions and estimation uncertainties
Information about assumptions and estimation uncertainties that have a significant risk of resulting in a material adjustment in the year ended 31 December 2016 is set out below in relationto the impairment of financial instruments and in the following notes:
• Note 39 (g) - determination of fair value of financial instruments with significantunobservable inputs;
• Note 39 (q) - measurement of defined benefit obligations: Key actuarial assumptions;• Note 39 (o) - recognition and measurement of provisions and contingencies: key
assumptions about the likelihood and magnitude of an outflow of resources.
85
BANK OF SIERRA LEONE
NOTES TO THE FINANCIAL STATEMENTS (Contd)
4 USE OF JUDGEMENTS AND ESTIMATES (Contd)
Assumptions and estimation uncertainties (contd)
Impairment of financial instrumentsNon-financial assets are evaluated for impairment on the basis described in note 39 (m). The individualcomponent of the total allowance for impairment applies to financial assets evaluated individually forimpairment and is based on management’s best estimate of the present value of the cashflows that areexpected to be received. In estimating these cashflows, management makes judgements about adebtor’s financial situation and the net realisable value of any underlying collateral. Eachimpaired asset is assessed on its merits, and the walkout strategy and estimate of cashflows consideredrecoverable are determined by management and approved by the Board.
Where appropriate, a collective component of the total allowance is established for:
• groups of homogeneous loans that are not considered individually significant; and
• groups of assets that are individually significant but that were not found to be individuallyimpaired (loss ‘incurred but not reported’ or IBNR).
The collective allowance for groups of homogeneous loans is established using statisticalanalysis of historical data on delinquency to estimate the amount of loss. Management applies judgementto ensure that the estimate of loss arrived at on the basis of historical information is appropriatelyadjusted to reflect the economic conditions at the reporting date.
Where inherent loss is apparent management may make assumptions to define the pattern of inherentlosses and to determine the required input parameters, based on historical experience and currenteconomic conditions.
5 FINANCIAL RISK REVIEWThis note presents information about the bank’s exposure to financial risks and the bank’s managementof capital. Further details on the Bank’s policies have been provided in note 36.

86
ANNUAL REPORT AND STATEMENT OF ACCOUNTS
NOTES TO THE FINANCIAL STATEMENTS (Contd)
FINANCIAL RISK REVIEW (Contd)
(a) Credit risk
For the definition of credit risk and information on how credit risk is managed by the bank, seenote 36(a).
Credit qualityThe Bank lends principally to the Government of Sierra Leone repayment of which is guaranteedby the borrower. On its investment portfolio and other assets on which it may be exposed to creditrisk, the Bank minimizes its exposure related to investment made in foreign debt securities andshort term deposits by establishing limits on investments with different credit quality. Credit qualityis evaluated on the basis of the ratings set by the International Rating Agencies. The bulk of thefunds is placed with triple “A” rated Banks (i.e. Central Banks and other international financialinstitutions as approved by the Foreign Assets Committee (FAC), Management and the Board).
The following table represents the Bank’s financial assets based on Standard and Poor’s creditrating of the issuer. AAA is the highest quality rating possible and indicates that the entity hasanextremely strong capacity and A is an upper medium grade, indicating a strong capacity to payinterest and principal. BBB is the lowest investment grade rating, indicating a medium capacity topay interest and principal. N/R indicated that the entity has not been rated by Standard and Poor.
The substantial portion of the investment held with non-rated issuers are guaranteed by theGovernment of Sierra Leone.
Credit rating 2016 % of FA 2015 % of FACash balances withCentral Banks AAA `1,481,968,024 18.99 1,357,111,331 26.03Cash and balances withBanksand fixed deposits A 1,516,326,835 19.43 1,081,452,812 20,65International MonetaryFund assets N/R 3,031,136,496 38.85 1,651,897,216 31.62Advances N/R 1,001,621,673 12.84 547,827,981 12.11Investment in equity N/R 46,997,540 0.60 34,659,425 0.66Investment securities N/R 725,063,472 9.29 519,210,367 8.93
___________ _______ ___________ _____
Total 7,803,114,040 100 5,192,159,132 100========== ======= ========== ====
The maximum loss that the Bank would suffer as a result of a security issuer defaulting is the valuereported in the statement of financial position.
The Bank writes off an advance or an investment (and any related allowances for impairmentlosses) when Management and the Board determine that the assets are uncollectible. Thisdetermination is reached after considering information on the probability of collectability of thesaid balance.
To enable it manage risk, the Bank analyses its assets portfolio and liabilities using variousparameters, the result of which is the provision of information which facilitates investmentdecisions.
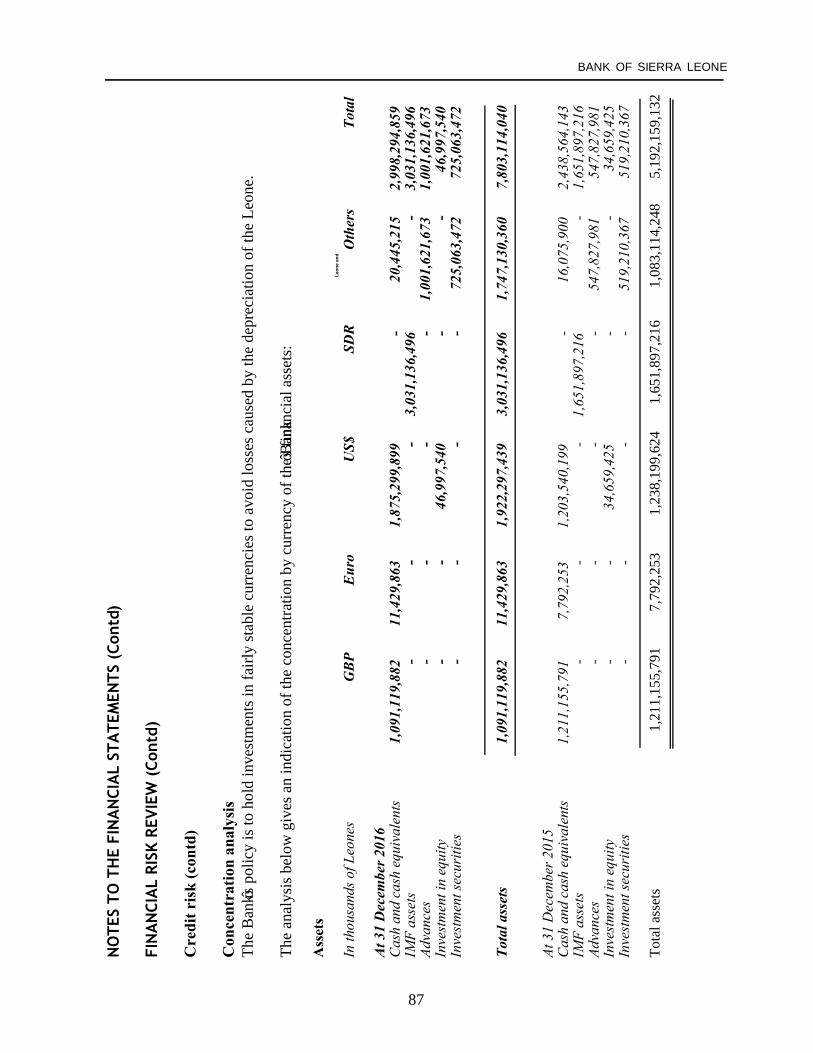
87
BANK OF SIERRA LEONE
NO
TES
TO T
HE
FIN
AN
CIA
L ST
ATE
MEN
TS (
Cont
d)
FIN
AN
CIA
L RI
SK R
EVIE
W (
Cont
d)
Cre
dit r
isk
(con
td)
Con
cent
ratio
n an
alys
isTh
e B
ank’s
pol
icy
is to
hol
d in
vest
men
ts in
fairl
y st
able
cur
renc
ies t
o av
oid
loss
es c
ause
d by
the
depr
ecia
tion
of th
e Le
one.
The
anal
ysis
bel
ow g
ives
an
indi
catio
n of
the
conc
entra
tion
by c
urre
ncy
of th
e B
ank
’s fin
anci
al a
sset
s:
Ass
ets
Leon
e an
d
In th
ousa
nds o
f Leo
nes
GBP
Euro
US$
SDR
Oth
ers
Tota
l
At 3
1 D
ecem
ber 2
016
Cas
h an
d ca
sh e
quiv
alen
ts
1,09
1,11
9,88
2
11,
429,
863
1,8
75,2
99,8
99
-
20,
445,
215
2,
998,
294,
859
IMF
asse
ts
-
-
-
3,0
31,1
36,4
96
-
3,03
1,13
6,49
6Ad
vanc
es
-
-
-
-
1,0
01,6
21,6
73
1,00
1,62
1,67
3In
vest
men
t in
equi
ty
-
-
46
,997
,540
-
-
4
6,99
7,54
0In
vest
men
t sec
uriti
es
-
-
-
-
7
25,0
63,4
72
72
5,06
3,47
2
Tota
l ass
ets
1,
091,
119,
882
1
1,42
9,86
3 1
,922
,297
,439
3,0
31,1
36,4
96
1,7
47,1
30,3
60
7,80
3,11
4,04
0
At 3
1 D
ecem
ber 2
015
Cas
h an
d ca
sh e
quiv
alen
ts
1,2
11,1
55,7
91
7
,792
,253
1
,203
,540
,199
-
16,
075,
900
2
,438
,564
,143
IMF
asse
ts
-
-
-
1,6
51,8
97,2
16
-
1,6
51,8
97,2
16Ad
vanc
es
-
-
-
-
54
7,82
7,98
1
5
47,8
27,9
81In
vest
men
t in
equi
ty
-
-
34,
659,
425
-
-
34,
659,
425
Inve
stm
ent s
ecur
ities
-
-
-
-
519,
210,
367
519
,210
,367
Tota
l ass
ets
1
,211
,155
,791
7,7
92,2
53
1,2
38,1
99,6
24
1,6
51,8
97,2
16
1,
083,
114,
248
5
,192
,159
,132

88
ANNUAL REPORT AND STATEMENT OF ACCOUNTS
NOTES TO THE FINANCIAL STATEMENTS (Contd)
FINANCIAL RISK REVIEW (Contd)
(b) Liquidity riskThe risk that the Bank may not be able to meet short term financial demands which usually occurwhen it is unableto convert security or non-liquid assets to cash without loss of capital or revenue.
This risk is not relevant to domestic assets and liabilities because of the ability of the Bank to createLeones when required. However, liquidity risk is present with respect to the foreign assets andliabilities andthe Bank mitigates this risk by fixing limits to holding sizes and maturity of its investments.
Cash and cash equivalents
To ensure it is enabled to meet its financial obligations as they fall due, the Bank closely monitors itsliquid resources (cash and cash equivalents).
The value of cash and cash equivalents held by the Bank at 31 December 2016 is analysed below:
31 December 2016 Balance with Investment other Central Balance with securities Banks other Banks Total
In thousands of Leones
Cash and cash equivalents - 1,481,968,024 1,516,326,835 2,998,294,859Investment securities (1-3 months) 4,202,188 - - 4,202,188
__________ ____________ ____________ ____________Total cash and cash equivalents 4,202,188 1,481,968,024 1,516,326,835 3,002,497,047
========== ============ ============ ============
Investment securities not included incash and cash equivalents (3-12 months) 6,295,150 - - 6,295,150
_________ __________ ___________ ____________
Total cash and cash equivalents andinvestment securities (available within 12 months) 10,497,338 1,481,968,024 1,516,326,835 3,008,792,197
======== ========== ========== ==========
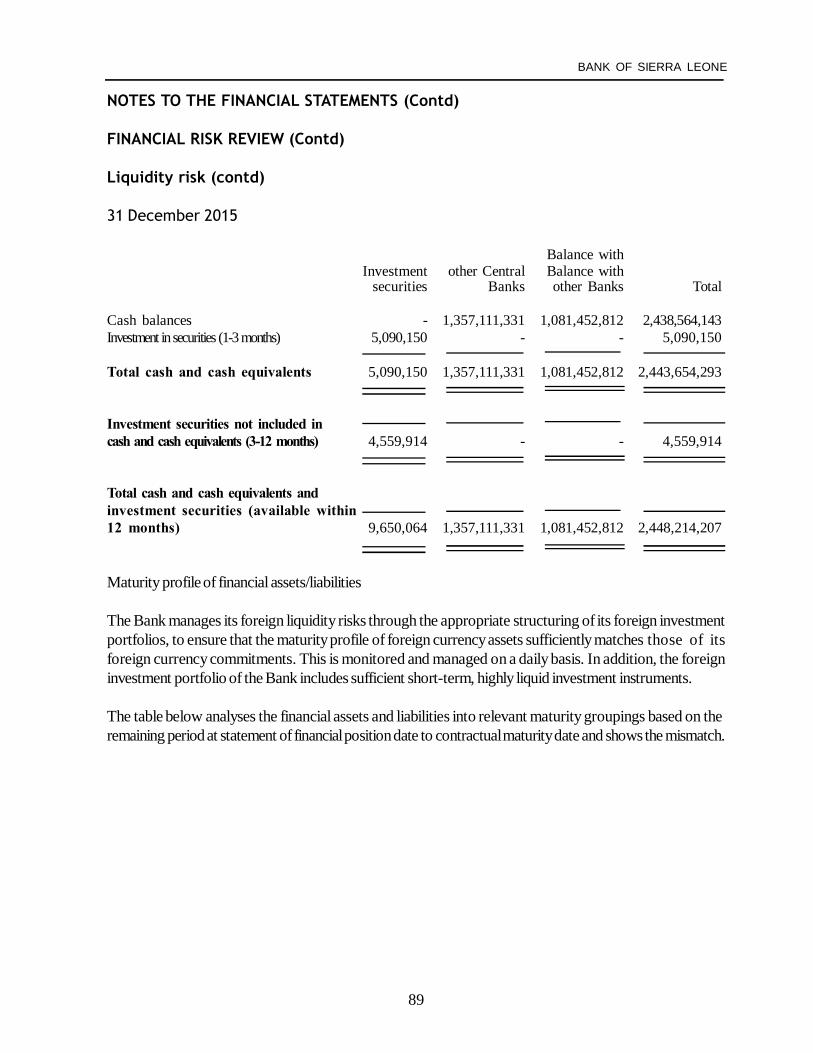
89
BANK OF SIERRA LEONE
NOTES TO THE FINANCIAL STATEMENTS (Contd)
FINANCIAL RISK REVIEW (Contd)
Liquidity risk (contd)
31 December 2015
Balance withInvestment other Central Balance with
securities Banks other Banks Total
Cash balances - 1,357,111,331 1,081,452,812 2,438,564,143Investment in securities (1-3 months) 5,090,150 - - 5,090,150
Total cash and cash equivalents 5,090,150 1,357,111,331 1,081,452,812 2,443,654,293
Investment securities not included incash and cash equivalents (3-12 months) 4,559,914 - - 4,559,914
Total cash and cash equivalents andinvestment securities (available within12 months) 9,650,064 1,357,111,331 1,081,452,812 2,448,214,207
Maturity profile of financial assets/liabilities
The Bank manages its foreign liquidity risks through the appropriate structuring of its foreign investmentportfolios, to ensure that the maturity profile of foreign currency assets sufficiently matches those of itsforeign currency commitments. This is monitored and managed on a daily basis. In addition, the foreigninvestment portfolio of the Bank includes sufficient short-term, highly liquid investment instruments.
The table below analyses the financial assets and liabilities into relevant maturity groupings based on theremaining period at statement of financial position date to contractual maturity date and shows the mismatch.

90
ANNUAL REPORT AND STATEMENT OF ACCOUNTS
NO
TES
TO T
HE
FIN
AN
CIA
L ST
ATE
MEN
TS (
Cont
d)
FIN
AN
CIA
L RI
SK R
EVIE
W (
Cont
d)
Liqu
idit
y ri
sk (
cont
d)
In th
ousa
nds
of L
eone
sC
arry
ing
Gro
ss n
omin
alLe
ss th
an1
- 33
mon
ths
1 - 5
Mor
e th
anN
ote
amou
ntin
flow
/(out
flow
)1
mon
thM
onth
sto
1 y
ear
Year
s5
year
s31
Dec
embe
r 201
6
Fina
ncia
l ass
et b
y ty
peN
on-d
eriv
ativ
e lia
bilit
ies
Cas
h an
d ca
sh e
quiv
alen
ts16
2,99
8,29
4,85
92,
998,
294,
859
1,
482,
246,
325
1,5
16,0
48,5
34
-
-
-In
tern
atio
nal M
onet
ary
Fund
Rel
ated
Ass
ets
173,
031,
136,
496
3,0
31,1
36,4
96
-
-
3,0
31,1
36,4
96
-
-
Inve
stm
ent s
ecur
ities
2072
5,06
3,47
272
5,06
3,47
2 -
4
,202
,188
6,2
95,1
50 6
58,3
16,1
34
56,2
50,0
00In
vest
men
t in
equi
ty19
46,9
97,5
4046
,997
,540
-
-
-
2
1,44
8,55
3
25,5
48,9
87Ad
vanc
es18
1,00
1,62
1,67
31,
001,
621,
673
-
111,
587,
023
-
8,
086,
698
881
,947
,952
7,80
3,11
4,04
07,
803,
114,
040
1,
482,
246,
325
1,6
31,8
37,7
45 3
,037
,431
,646
687
,851
,385
963
,746
,939
Fina
ncia
l lia
bilit
y by
type
Non
-der
ivat
ive
liabi
litie
sAm
ount
s du
e to
Inte
rnat
iona
l Mon
etar
y Fu
nd (I
MF)
235,
183,
182,
088
5,18
3,18
2,08
8
-
-
1,9
99,6
59,0
09 9
60,5
13,7
71
2,2
23,0
09,3
08D
epos
its fr
om G
over
nmen
t24
121
,130
,686
121
,130
,686
121,
130,
686
-
-
-
-D
epos
its fr
om B
anks
2563
3,55
2,67
163
3,55
2,67
1
-
-
6
33,5
52,6
71
-
-
Dep
osits
from
oth
ers
26 4
7,36
9,93
247
,369
,932
47,
369,
932
-
-
-
-En
d-of
-ser
vice
ben
efits
29 2
1,32
3,64
5 2
1,32
3,64
5 -
-
-
2
1,32
3,64
5
-U
nrec
ogni
sed
loan
com
mitm
ent
--
-
-
-
-
-
6,0
06,5
59,0
22
6,00
6,55
9,02
216
8,50
0,61
8
-
2,6
33,2
11,6
80 9
81,8
37,4
16
2,2
23,0
09,3
08
Net
on-
bala
nce
shee
t pos
ition
1,7
96,5
55,0
18
1
,796
,555
,018
1,
313,
745,
707
1,63
1,83
7,74
5
404
,219
,966
(293
,986
,031
)(1
,259
,262
,369
)
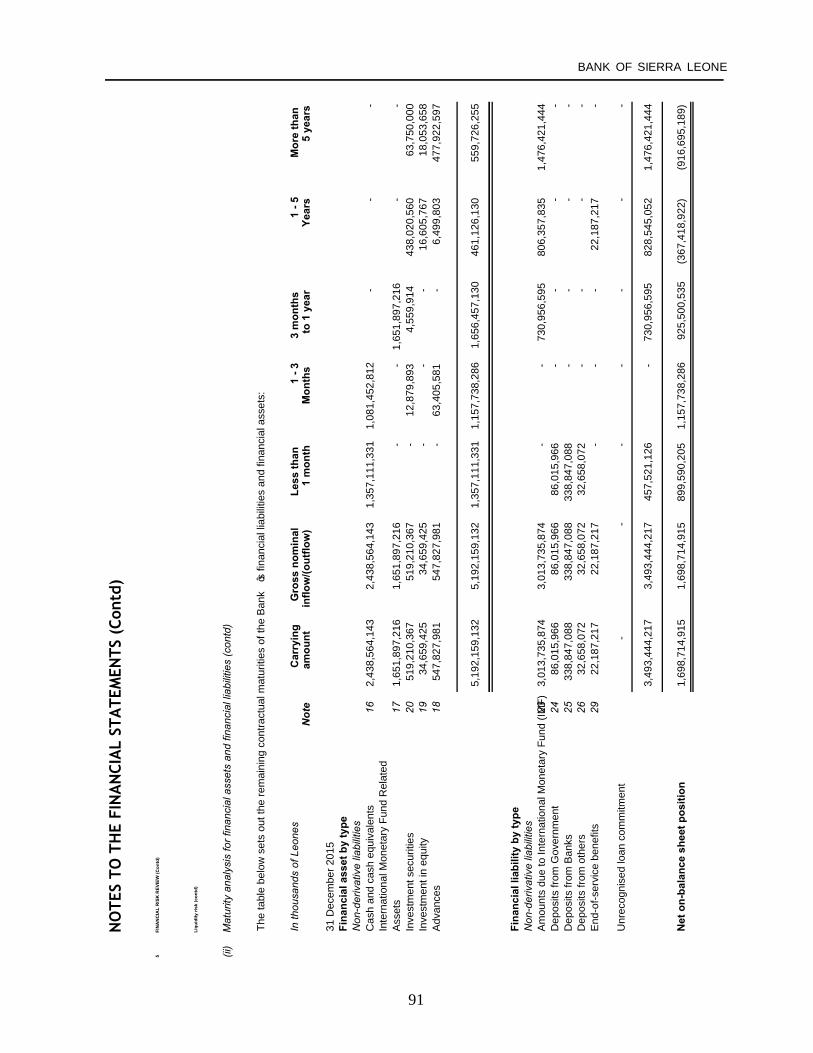
91
BANK OF SIERRA LEONE
NO
TES
TO T
HE
FIN
AN
CIA
L ST
ATE
MEN
TS (
Cont
d)
5FI
NA
NC
IAL
RIS
K R
EVIE
W (C
ontd
)
Liqu
idity
risk
(con
td)
(ii)
Mat
urity
ana
lysi
s fo
r fin
anci
al a
sset
s an
d fin
anci
al li
abili
ties
(con
td)
The
tabl
e be
low
set
s ou
t the
rem
aini
ng c
ontra
ctua
l mat
uriti
es o
f the
Ban
k’s
fina
ncia
l lia
bilit
ies
and
finan
cial
ass
ets:
In th
ousa
nds
of L
eone
s
C
arry
ing
Gro
ss n
omin
alLe
ss th
an1
- 33
mon
ths
1 - 5
Mor
e th
anN
ote
a
mou
nt
inf
low
/(out
flow
)1
mon
thM
onth
sto
1 y
ear
Year
s5
year
s
31 D
ecem
ber 2
015
Fina
ncia
l ass
et b
y ty
peN
on-d
eriv
ativ
e lia
bilit
ies
Cas
h an
d ca
sh e
quiv
alen
ts16
2
,438
,564
,143
2
,438
,564
,143
1
,357
,111
,331
1
,081
,452
,812
-
-
-
Inte
rnat
iona
l Mon
etar
y Fu
nd R
elat
edAs
sets
17
1,6
51,8
97,2
16
1,6
51,8
97,2
16
-
-
1,6
51,8
97,2
16
-
-
Inve
stm
ent s
ecur
ities
20
5
19,2
10,3
67
5
19,2
10,3
67
-
12,
879,
893
4
,559
,914
4
38,0
20,5
60
63,7
50,0
00In
vest
men
t in
equi
ty19
34
,659
,425
34
,659
,425
-
-
-
16
,605
,767
18
,053
,658
Adva
nces
18
5
47,8
27,9
81
5
47,8
27,9
81
-
63,
405,
581
-
6
,499
,803
477
,922
,597
5
,192
,159
,132
5
,192
,159
,132
1
,357
,111
,331
1
,157
,738
,286
1
,656
,457
,130
4
61,1
26,1
30
5
59,7
26,2
55
Fina
ncia
l lia
bilit
y by
type
Non
-der
ivat
ive
liabi
litie
sAm
ount
s du
e to
Inte
rnat
iona
l Mon
etar
y Fu
nd (I
MF)
23
3,0
13,7
35,8
74
3,0
13,7
35,8
74
-
-
7
30,9
56,5
95
806
,357
,835
1
,476
,421
,444
Dep
osits
from
Gov
ernm
ent
24
86,0
15,9
66
86,0
15,9
66
8
6,01
5,96
6
-
-
-
-
Dep
osits
from
Ban
ks25
338
,847
,088
338
,847
,088
338,
847,
088
-
-
-
-D
epos
its fr
om o
ther
s26
32
,658
,072
32
,658
,072
32,
658,
072
-
-
-
-En
d-of
-ser
vice
ben
efits
29
22,1
87,2
17
22,1
87,2
17
-
-
-
22,1
87,2
17
-
Unr
ecog
nise
d lo
an c
omm
itmen
t
-
-
-
-
-
-
-
3
,493
,444
,217
3,
493,
444,
217
457
,521
,126
-
7
30,9
56,5
95
828
,545
,052
1
,476
,421
,444
Net
on-
bala
nce
shee
t pos
ition
1
,698
,714
,915
1
,698
,714
,915
899,
590,
205
1
,157
,738
,286
925
,500
,535
(3
67,4
18,9
22)
(916
,695
,189
)
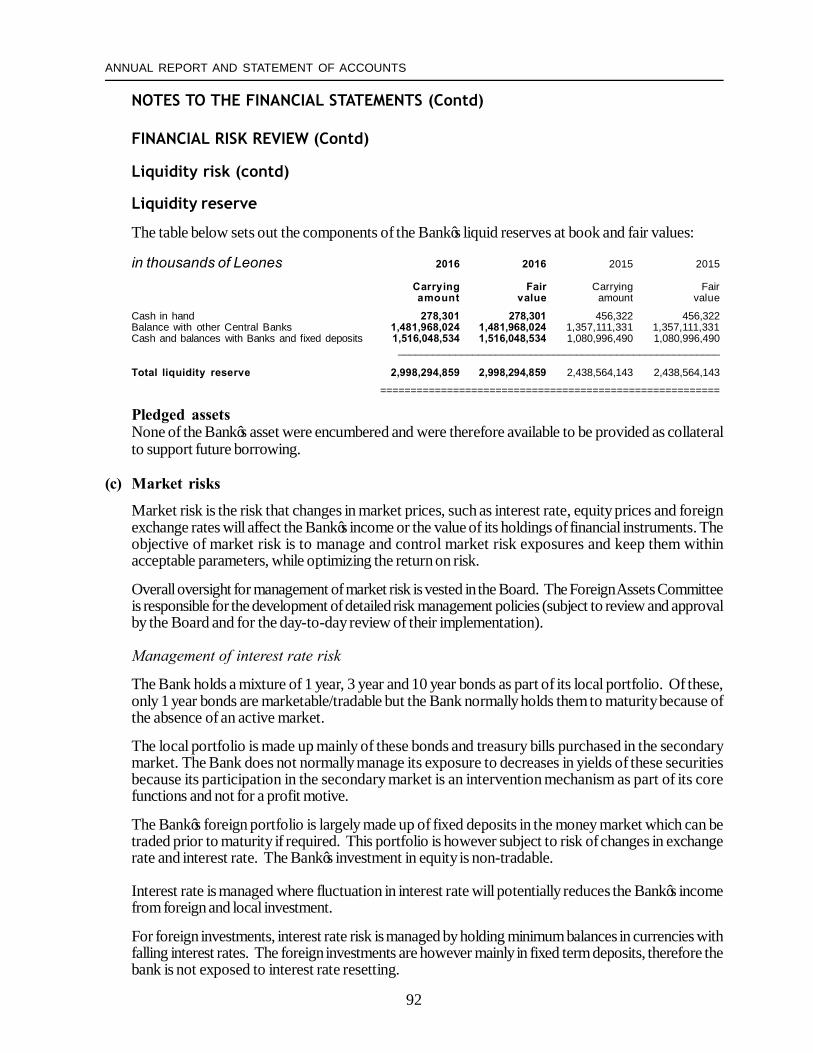
92
ANNUAL REPORT AND STATEMENT OF ACCOUNTS
NOTES TO THE FINANCIAL STATEMENTS (Contd)
FINANCIAL RISK REVIEW (Contd)
Liquidity risk (contd)
Liquidity reserve
The table below sets out the components of the Bank’s liquid reserves at book and fair values:
in thousands of Leones 2016 2016 2015 2015
Carrying Fair Carrying Fairamount value amount value
Cash in hand 278,301 278,301 456,322 456,322Balance with other Central Banks 1,481,968,024 1,481,968,024 1,357,111,331 1,357,111,331Cash and balances with Banks and fixed deposits 1,516,048,534 1,516,048,534 1,080,996,490 1,080,996,490 ________________________________________________________
Total liquidity reserve 2,998,294,859 2,998,294,859 2,438,564,143 2,438,564,143 ========================================================
Pledged assetsNone of the Bank’s asset were encumbered and were therefore available to be provided as collateralto support future borrowing.
(c) Market risks
Market risk is the risk that changes in market prices, such as interest rate, equity prices and foreignexchange rates will affect the Bank’s income or the value of its holdings of financial instruments. Theobjective of market risk is to manage and control market risk exposures and keep them withinacceptable parameters, while optimizing the return on risk.
Overall oversight for management of market risk is vested in the Board. The Foreign Assets Committeeis responsible for the development of detailed risk management policies (subject to review and approvalby the Board and for the day-to-day review of their implementation).
Management of interest rate risk
The Bank holds a mixture of 1 year, 3 year and 10 year bonds as part of its local portfolio. Of these,only 1 year bonds are marketable/tradable but the Bank normally holds them to maturity because ofthe absence of an active market.
The local portfolio is made up mainly of these bonds and treasury bills purchased in the secondarymarket. The Bank does not normally manage its exposure to decreases in yields of these securitiesbecause its participation in the secondary market is an intervention mechanism as part of its corefunctions and not for a profit motive.
The Bank’s foreign portfolio is largely made up of fixed deposits in the money market which can betraded prior to maturity if required. This portfolio is however subject to risk of changes in exchangerate and interest rate. The Bank’s investment in equity is non-tradable.
Interest rate is managed where fluctuation in interest rate will potentially reduces the Bank’s incomefrom foreign and local investment.
For foreign investments, interest rate risk is managed by holding minimum balances in currencies withfalling interest rates. The foreign investments are however mainly in fixed term deposits, therefore thebank is not exposed to interest rate resetting.
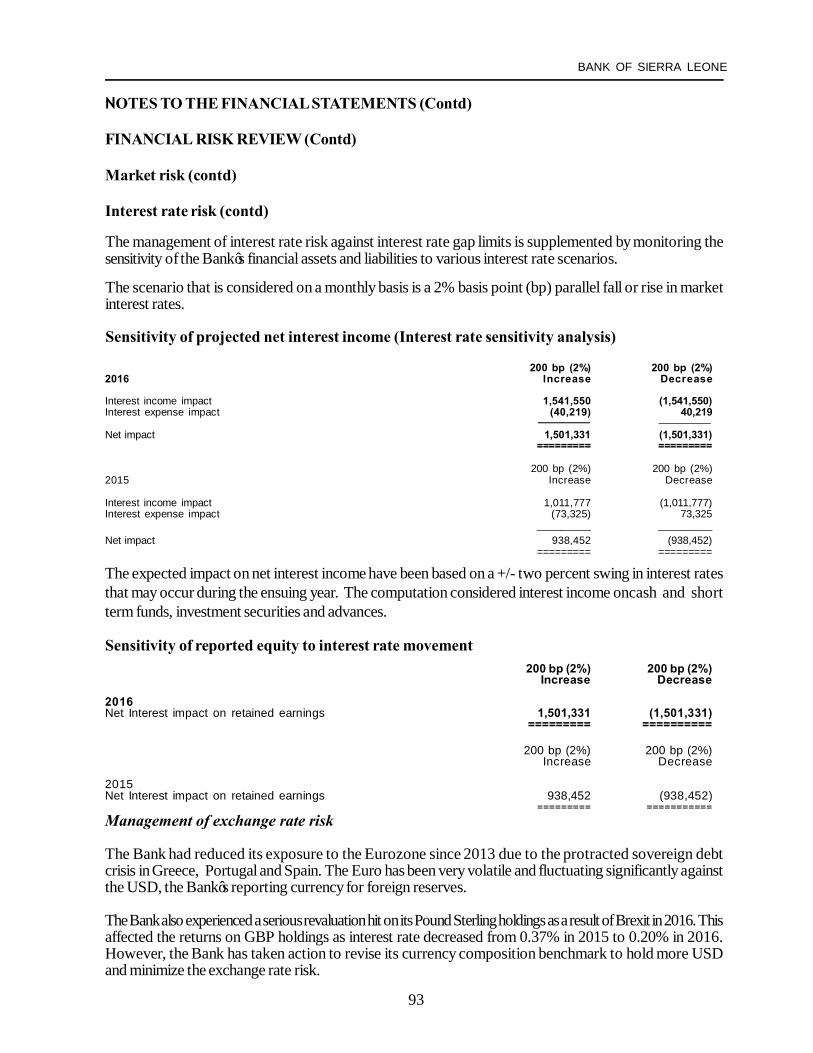
93
BANK OF SIERRA LEONE
NOTES TO THE FINANCIAL STATEMENTS (Contd)
FINANCIAL RISK REVIEW (Contd)
Market risk (contd)
Interest rate risk (contd)
The management of interest rate risk against interest rate gap limits is supplemented by monitoring thesensitivity of the Bank’s financial assets and liabilities to various interest rate scenarios.
The scenario that is considered on a monthly basis is a 2% basis point (bp) parallel fall or rise in marketinterest rates.
Sensitivity of projected net interest income (Interest rate sensitivity analysis)
200 bp (2%) 200 bp (2%)2016 Increase Decrease
Interest income impact 1,541,550 (1,541,550)Interest expense impact (40,219) 40,219
Net impact 1,501,331 (1,501,331)========= =========
200 bp (2%) 200 bp (2%)2015 Increase Decrease
Interest income impact 1,011,777 (1,011,777)Interest expense impact (73,325) 73,325
_________ _________Net impact 938,452 (938,452)
========= =========
The expected impact on net interest income have been based on a +/- two percent swing in interest ratesthat may occur during the ensuing year. The computation considered interest income oncash and shortterm funds, investment securities and advances.
Sensitivity of reported equity to interest rate movement200 bp (2%) 200 bp (2%)
Increase Decrease
2016Net Interest impact on retained earnings 1,501,331 (1,501,331)
========= ==========
200 bp (2%) 200 bp (2%)Increase Decrease
2015Net Interest impact on retained earnings 938,452 (938,452)
========= ===========Management of exchange rate risk
The Bank had reduced its exposure to the Eurozone since 2013 due to the protracted sovereign debtcrisis in Greece, Portugal and Spain. The Euro has been very volatile and fluctuating significantly againstthe USD, the Bank’s reporting currency for foreign reserves.
The Bank also experienced a serious revaluation hit on its Pound Sterling holdings as a result of Brexit in 2016. Thisaffected the returns on GBP holdings as interest rate decreased from 0.37% in 2015 to 0.20% in 2016.However, the Bank has taken action to revise its currency composition benchmark to hold more USDand minimize the exchange rate risk.

94
ANNUAL REPORT AND STATEMENT OF ACCOUNTS
NOTES TO THE FINANCIAL STATEMENTS (Contd)
FINANCIAL RISK REVIEW (Contd)
Market risk (contd)
Concentrations of assets, liabilities and off-balance sheet items
In thousands of Leones GBP Euro US$ SDR Others Total
At 31 December 2016
Cash and cash equivalents 1,091,119,882 11,429,863 1,875,299,899 - 20,445,215 2,998,294,859IMF Assets - - - 3,031,136,496 - 3,031,136,496Advances - - - - 1,001,621,673 1,001,621,673Investment in equity - - 46,997,540 - - 46,997,540Investment in securities - - - - 725,063,472 725,063,472
Total assets 1,091,119,882 11,429,863 1,922,297,439 3,031,136,496 1,747,130,360 7,803,114,040
Liabilities
IMF drawing rights allocation - - - 5,183,182,088 - 5,183,182,088Deposits from Government - - - - 121,130,686 121,130,686Deposits from banks - - - - 633,552,671 633,552,671Deposit from others - - - - 47,369,932 47,369,932End-of-service benefits - - - - 21,323,645 21,323,645
Total liabilities - - - 5,183,182,088 823,376,934 6,006,559,022 ____________________________________________________________________________
Net on-balance sheet position 1,091,119,882 11,429,863 1,922,297,439 (2,152,045,592) 923,753,426 1,796,555,018 =============================================================================
At 31 December 2015Cash and cash equivalents 1,211,155,791 7,792,253 1,203,540,199 - 16,075,900 2,438,564,143IMF assets - - - 1,651,897,216 - 1,651,897,216Advances - - - - 547,827,981 547,827,981Investment in equity - - 34,659,425 - - 34,659,425Investment securities - - - - 519,210,367 519,210,367
Total assets 1,211,155,791 7,792,253 1,238,199,624 1,651,897,216 1,083,114,248 5,192,159,132 =============================================================================
LiabilitiesIMF drawing rights allocation - - - 3,013,735,874 - 3,013,735,874Deposits from Government - - - - 86,015,966 86,015,966Deposits from banks - - - - 338,847,088 338,847,088Deposit from others - - - - 32,658,072 32,658,072End-of-service benefits - - - - 22,187,217 22,187,217
Total liabilities - - - 3,013,735,874 479,708,343 3,493,444,217
Net on-balance sheet position 1,211,155,791 7,792,253 1,238,199,624 (1,361,838,658) 603,405,905 1,698,714,915 ============================================================================

95
BANK OF SIERRA LEONE
NOTES TO THE FINANCIAL STATEMENTS (Contd)
FINANCIAL RISK REVIEW (Contd)
Market risk (contd)
Foreign currency sensitivity analysis
Concentration of Leone equivalent of foreign currency denominated assets and liabilities.
The following sensitivity analysis has been based on a 10% change in the exchange rates of variouscurrencies against the Leone. The Leone appreciated during the first half of 2015 due to increasedinflows from international organisations. By the end of the year, the appreciation had reversed as a resultof supply constraints in the foreign exchange market. This shortage was mainly due to the effects of thetwin shocks of the decline of the iron ore price and the effect of the Ebola crisis and later the decline offunding for Ebola.
2016
In thousands of Leones US$ GBP EUR SDR Others Total
Assets
Cash and cash equivalents 187,529,990 109,111,988 1,142,986 - 2,044,522 299,829,486IMF assets - - - 303,113,650 - 303,113,650Advances - - - - 100,162,167 100,162,167Investment in equity 4,699,754 - - - - 4,699,754Investment securities - - - - 72,506,347 72,506,347 -----------------------------------------------------------------------------------------------------------Total assets 192,229,744 109,111,988 1,142,986 303,113,650 174,713,036 780,311,404 ------------------------------------------------------------------------------------------------------------LiabilitiesIMF drawing rights allocation - - - 518,318,209 - 518,318,209Deposits from Government - - - - 12,113,069 12,113,069Deposits from banks - - - - 63,355,267 63,355,267Deposit from others - - - - 4,736,993 4,736,993End-of-service benefits - - - - 2,132,365 2,132,365
Total liabilities - - - 518,318,209 82,337,693 600,655,902
Net-on-balance sheet position 192,229,744 109,111,988 1,142,986 (215,204,559) 92,375,343 179,655,502 =========================================================================
2015US$ GBP EUR SDR Others Total
AssetsCash and cash equivalents 120,354,020 121,115,579 779,225 - 1,607,590 243,856,414IMF assets - - - 165,189,722 - 165,189,722Advances - - - - 54,782,798 54,782,798Investment in equity 3,465,943 - - - - 3,465,943Investment securities - - - - 51,921,037 51,921,037
Total assets 123,819,962 121,115,579 779,225 165,189,722 108,311,425 519,215,913
LiabilitiesIMF drawing rights allocation - - - 301,373,587 - 301,373,587Deposits from Government - - - - 8,601,597 8,601,597Deposits from banks - 33,884,709 33,884,709Deposit from others 3,265,807 3,265,807End-of-service benefits 2,218,722 2,218,722Total liabilities - - - 301,373,587 47,970,834 349,344,422
Net-on-balance sheet position 123,819,962 121,115,579 779,225 (136,183,866) 60,340,591 169,871,492 =================================================================+++++++
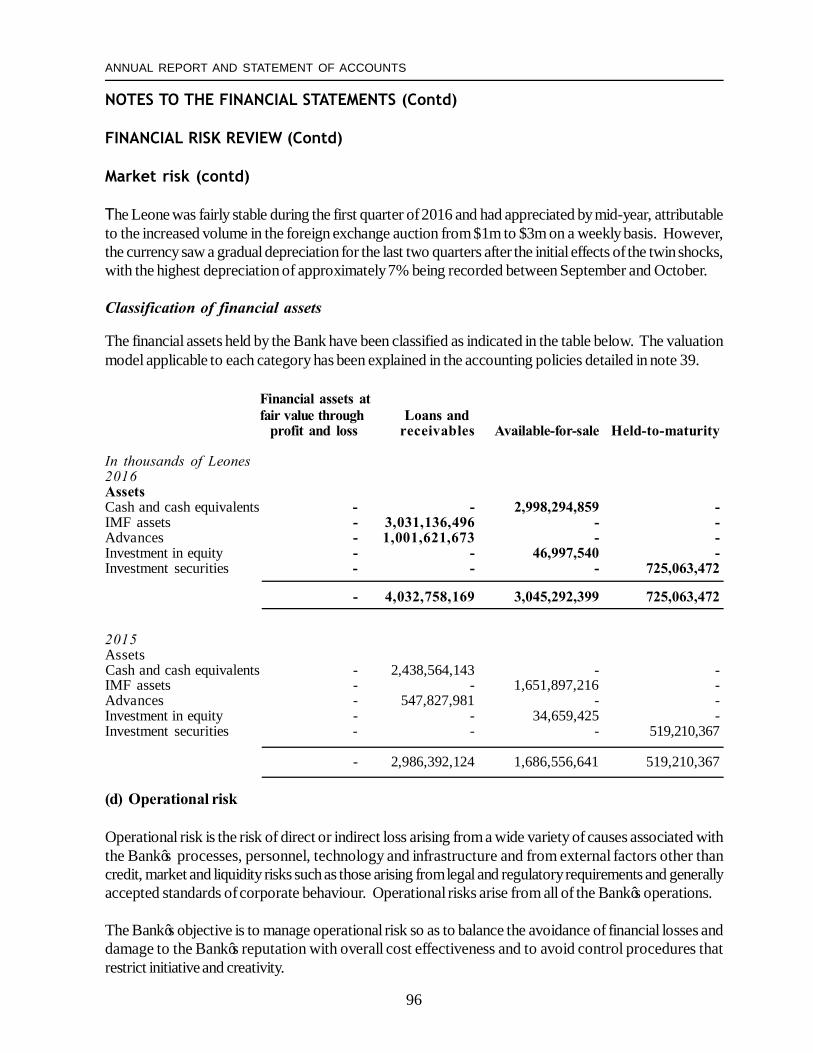
96
ANNUAL REPORT AND STATEMENT OF ACCOUNTS
NOTES TO THE FINANCIAL STATEMENTS (Contd)
FINANCIAL RISK REVIEW (Contd)
Market risk (contd)
The Leone was fairly stable during the first quarter of 2016 and had appreciated by mid-year, attributableto the increased volume in the foreign exchange auction from $1m to $3m on a weekly basis. However,the currency saw a gradual depreciation for the last two quarters after the initial effects of the twin shocks,with the highest depreciation of approximately 7% being recorded between September and October.
Classification of financial assets
The financial assets held by the Bank have been classified as indicated in the table below. The valuationmodel applicable to each category has been explained in the accounting policies detailed in note 39.
Financial assets atfair value through Loans and
profit and loss receivables Available-for-sale Held-to-maturity
In thousands of Leones2016AssetsCash and cash equivalents - - 2,998,294,859 -IMF assets - 3,031,136,496 - -Advances - 1,001,621,673 - -Investment in equity - - 46,997,540 -Investment securities - - - 725,063,472
- 4,032,758,169 3,045,292,399 725,063,472
2015AssetsCash and cash equivalents - 2,438,564,143 - -IMF assets - - 1,651,897,216 -Advances - 547,827,981 - -Investment in equity - - 34,659,425 -Investment securities - - - 519,210,367
- 2,986,392,124 1,686,556,641 519,210,367
(d) Operational risk
Operational risk is the risk of direct or indirect loss arising from a wide variety of causes associated withthe Bank’s processes, personnel, technology and infrastructure and from external factors other thancredit, market and liquidity risks such as those arising from legal and regulatory requirements and generallyaccepted standards of corporate behaviour. Operational risks arise from all of the Bank’s operations.
The Bank’s objective is to manage operational risk so as to balance the avoidance of financial losses anddamage to the Bank’s reputation with overall cost effectiveness and to avoid control procedures thatrestrict initiative and creativity.
97
BANK OF SIERRA LEONE
NOTES TO THE FINANCIAL STATEMENTS (Contd)
FINANCIAL RISK REVIEW (Contd)
Operational risk (contd)The primary responsibility for the development and implementation of controls to addressoperational risk is assigned to senior management of the Bank. This responsibility is supportedby the development of policies for the management of operational risk in the following areas:
• Requirements for appropriate segregation of duties, including the independent authorisationof transactions;
• Requirements for the reconciliation and monitoring of transactions;• Compliance with regulatory and other legal requirements;• Documentation of controls and procedures;• Requirements for the periodic assessment of operational risks faced, and the adequacy
of controls and procedures to address the risk identified;• Requirements for the reporting of operational losses and proposed remedial action;• Development of contingency plans;• Training and professional development;• Ethical and business standards;• Risk mitigation, including insurance where this is effective;
Compliance with the Bank’s policies is monitored by the Internal Audit Department.
6 FAIR VALUE OF FINANCIAL INSTRUMENTS
See accounting policy in note 39(g)(v).
The fair values of financial assets and financial liabilities are ideally based on quoted market pricesor dealer price quotations. For all other financial instruments, the Bank determines fair valuesusing other valuation techniques.
For financial instruments that trade infrequently and have little price transparency, fair value is lessobjective, and requires varying degrees of judgement depending on liquidity, concentration,uncertainty of market factors, pricing assumptions and other risks affecting the specific instrument.
(a) Valuation models
The Bank measures fair values using the following fair value hierarchy, which reflects thesignificance of the inputs used in making the measurements.
• Level 1: inputs that are quoted market prices (unadjusted) in active markets foridentical instruments.
98
ANNUAL REPORT AND STATEMENT OF ACCOUNTS
NOTES TO THE FINANCIAL STATEMENTS (Contd)
FAIR VALUE OF FINANCIAL INSTRUMENTS (Contd)
• Level 2: inputs other than quoted prices included within Level 1 that are observable eitherdirectly (i.e. as prices) or indirectly (i.e. derived from prices). This category includes instrumentsvalued using: quoted market prices in active markets for similar instruments;quoted pricesfor identical or similar instruments in markets that are considered less than active; or othervaluation techniques in which all significant inputs are directly or indirectly observable frommarket data.
• Level 3: inputs that are unobservable. This category includes all instruments for whichthevaluation technique includes inputs not based on observable data and the unobservableinputs have a significant effect on the instrument’s valuation. This category includes instrumentsthat are valued based on quoted prices for similar instruments for which significant unobservableadjustments or assumptions are required to reflect differences between the instruments.
Valuation techniques include net present value and discounted cashflow models, comparison withsimilar instruments for which market observable prices exist and other valuation models.Assumptions and inputs used in valuation techniques include risk-free interest rates, foreign currencyexchange rates and expected price volatilities and correlations.
The objective of valuation techniques is to arrive at a fair value measurement that reflects the pricethat would be received if the asset is sold or the entity is paid to transfer the liability in an orderlytransaction between market participants at the measurement date.
Availability of observable market prices and model inputs reduces the need for managementjudgement and estimation and also reduces the uncertainty associated with determining fair values.Availability of observable market prices and inputs varies depending on the products and marketsand is prone to changes based on specific events and general conditions in the financial markets.
(b) Valuation framework
The Financial Markets and Finance departments are responsible for spotting any indicatorsof fair value adjustment and to ensure such adjustments are properly booked.
(c) Financial instruments measured at fair value – fair value hierarchy
The Bank does not have financial instruments measured at fair value at the reporting date.
7 SEGMENT REPORTING
The current IT environment of the Bank is not able to reflect discrete financial information foroperational segments. The Bank has planned to migrate to a new IT environment in 2018. After themigration, discrete financial information will be available for the operational segments of the Bankwhich will facilitate segmental reporting.
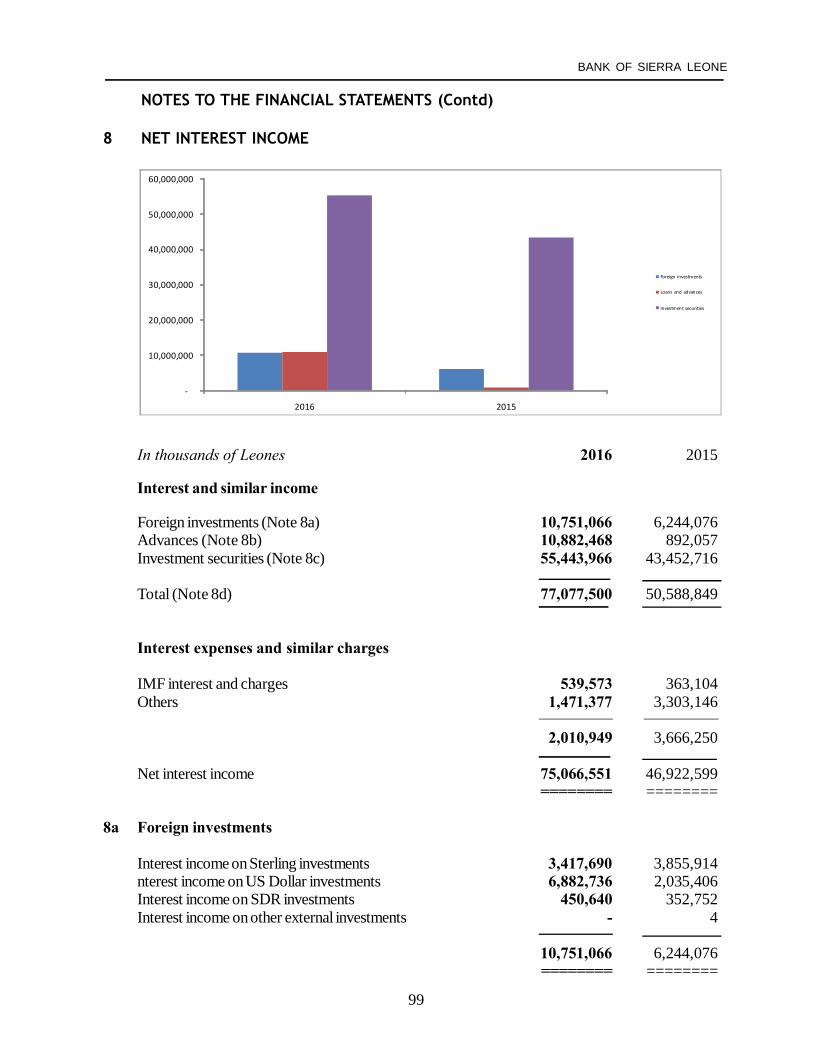
99
BANK OF SIERRA LEONE
-
10,000,000
20,000,000
30,000,000
40,000,000
50,000,000
60,000,000
2016 2015
Foreign investments
Loans and advances
Investment securities
NOTES TO THE FINANCIAL STATEMENTS (Contd)
8 NET INTEREST INCOME
In thousands of Leones 2016 2015
Interest and similar income
Foreign investments (Note 8a) 10,751,066 6,244,076Advances (Note 8b) 10,882,468 892,057Investment securities (Note 8c) 55,443,966 43,452,716
Total (Note 8d) 77,077,500 50,588,849
Interest expenses and similar charges
IMF interest and charges 539,573 363,104Others 1,471,377 3,303,146
2,010,949 3,666,250
Net interest income 75,066,551 46,922,599======== ========
8a Foreign investments
Interest income on Sterling investments 3,417,690 3,855,914nterest income on US Dollar investments 6,882,736 2,035,406Interest income on SDR investments 450,640 352,752Interest income on other external investments - 4
10,751,066 6,244,076 ======== ========
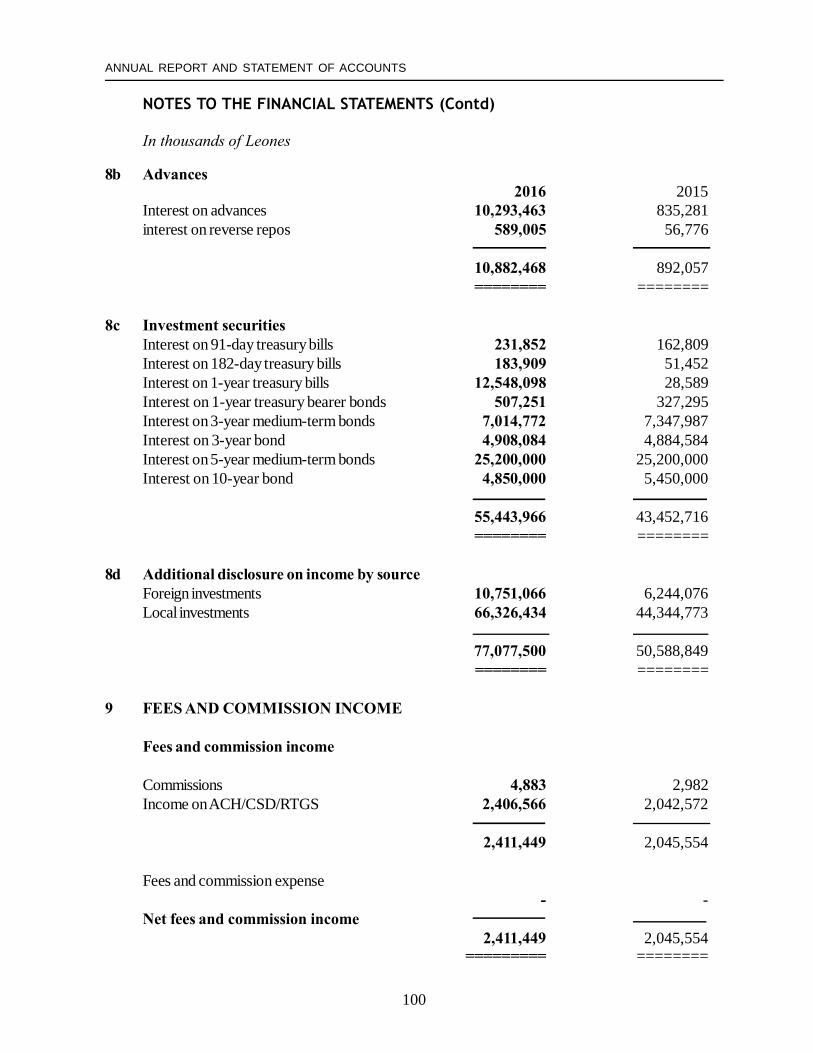
100
ANNUAL REPORT AND STATEMENT OF ACCOUNTS
NOTES TO THE FINANCIAL STATEMENTS (Contd)
In thousands of Leones
8b Advances2016 2015
Interest on advances 10,293,463 835,281interest on reverse repos 589,005 56,776
10,882,468 892,057======== ========
8c Investment securitiesInterest on 91-day treasury bills 231,852 162,809Interest on 182-day treasury bills 183,909 51,452Interest on 1-year treasury bills 12,548,098 28,589Interest on 1-year treasury bearer bonds 507,251 327,295Interest on 3-year medium-term bonds 7,014,772 7,347,987Interest on 3-year bond 4,908,084 4,884,584Interest on 5-year medium-term bonds 25,200,000 25,200,000Interest on 10-year bond 4,850,000 5,450,000
55,443,966 43,452,716======== ========
8d Additional disclosure on income by sourceForeign investments 10,751,066 6,244,076Local investments 66,326,434 44,344,773
77,077,500 50,588,849 ======== ========
9 FEES AND COMMISSION INCOME
Fees and commission income
Commissions 4,883 2,982Income on ACH/CSD/RTGS 2,406,566 2,042,572
2,411,449 2,045,554
Fees and commission expense - -
Net fees and commission income2,411,449 2,045,554
========= ========
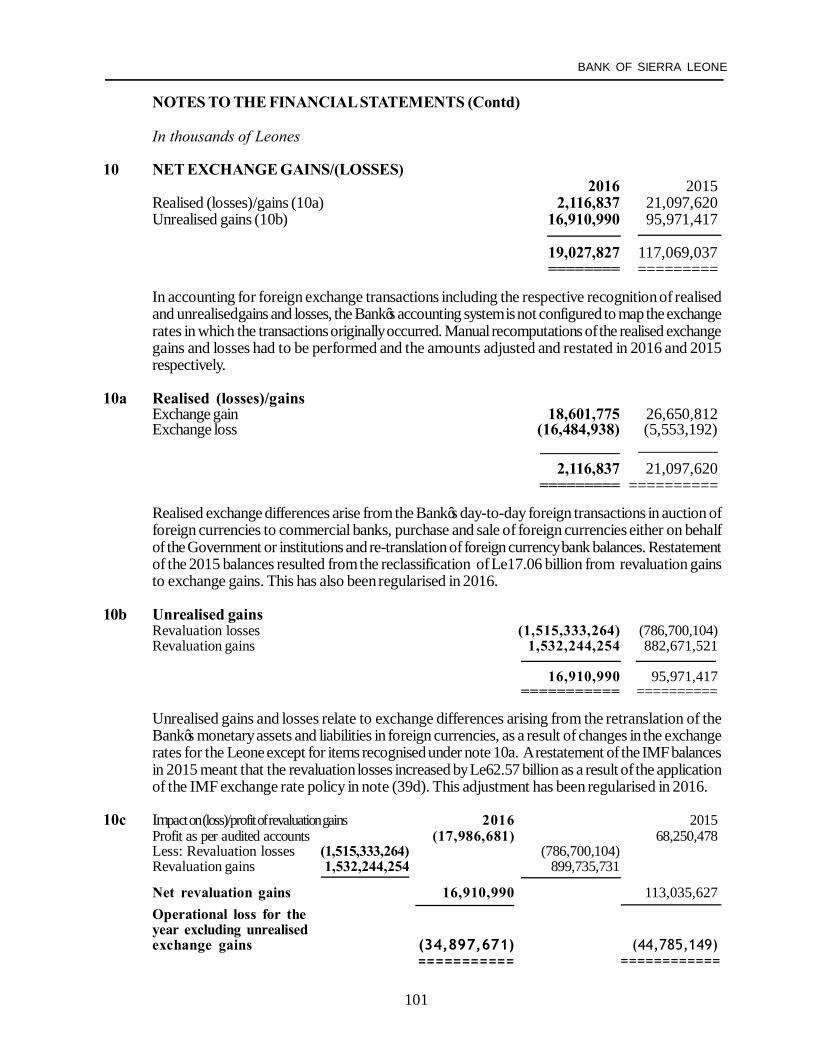
101
BANK OF SIERRA LEONE
NOTES TO THE FINANCIAL STATEMENTS (Contd)
In thousands of Leones
10 NET EXCHANGE GAINS/(LOSSES)2016 2015
Realised (losses)/gains (10a) 2,116,837 21,097,620Unrealised gains (10b) 16,910,990 95,971,417
19,027,827 117,069,037======== =========
In accounting for foreign exchange transactions including the respective recognition of realisedand unrealisedgains and losses, the Bank’s accounting system is not configured to map the exchangerates in which the transactions originally occurred. Manual recomputations of the realised exchangegains and losses had to be performed and the amounts adjusted and restated in 2016 and 2015respectively.
10a Realised (losses)/gainsExchange gain 18,601,775 26,650,812Exchange loss (16,484,938) (5,553,192)
__________ __________2,116,837 21,097,620
========= ==========
Realised exchange differences arise from the Bank’s day-to-day foreign transactions in auction offoreign currencies to commercial banks, purchase and sale of foreign currencies either on behalfof the Government or institutions and re-translation of foreign currency bank balances. Restatementof the 2015 balances resulted from the reclassification of Le17.06 billion from revaluation gainsto exchange gains. This has also been regularised in 2016.
10b Unrealised gainsRevaluation losses (1,515,333,264) (786,700,104)Revaluation gains 1,532,244,254 882,671,521
16,910,990 95,971,417=========== ==========
Unrealised gains and losses relate to exchange differences arising from the retranslation of theBank’s monetary assets and liabilities in foreign currencies, as a result of changes in the exchangerates for the Leone except for items recognised under note 10a. A restatement of the IMF balancesin 2015 meant that the revaluation losses increased by Le62.57 billion as a result of the applicationof the IMF exchange rate policy in note (39d). This adjustment has been regularised in 2016.
10c Impact on (loss)/profit of revaluation gains 2016 2015Profit as per audited accounts (17,986,681) 68,250,478Less: Revaluation losses (1,515,333,264) (786,700,104)Revaluation gains 1,532,244,254 899,735,731
Net revaluation gains 16,910,990 113,035,627Operational loss for theyear excluding unrealisedexchange gains (34,897,671) (44,785,149)
=========== ============
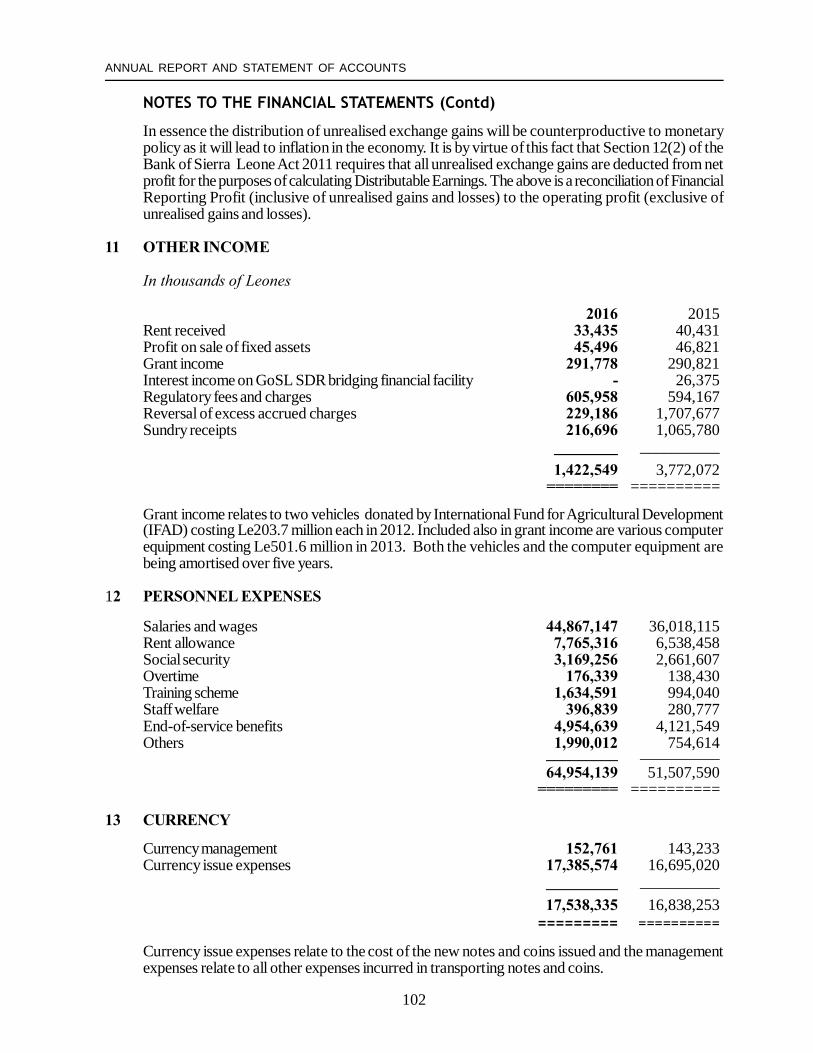
102
ANNUAL REPORT AND STATEMENT OF ACCOUNTS
NOTES TO THE FINANCIAL STATEMENTS (Contd)
In essence the distribution of unrealised exchange gains will be counterproductive to monetarypolicy as it will lead to inflation in the economy. It is by virtue of this fact that Section 12(2) of theBank of Sierra Leone Act 2011 requires that all unrealised exchange gains are deducted from netprofit for the purposes of calculating Distributable Earnings. The above is a reconciliation of FinancialReporting Profit (inclusive of unrealised gains and losses) to the operating profit (exclusive ofunrealised gains and losses).
11 OTHER INCOME
In thousands of Leones
2016 2015Rent received 33,435 40,431Profit on sale of fixed assets 45,496 46,821Grant income 291,778 290,821Interest income on GoSL SDR bridging financial facility - 26,375Regulatory fees and charges 605,958 594,167Reversal of excess accrued charges 229,186 1,707,677Sundry receipts 216,696 1,065,780
________ __________ 1,422,549 3,772,072
======== ==========
Grant income relates to two vehicles donated by International Fund for Agricultural Development(IFAD) costing Le203.7 million each in 2012. Included also in grant income are various computerequipment costing Le501.6 million in 2013. Both the vehicles and the computer equipment arebeing amortised over five years.
12 PERSONNEL EXPENSES
Salaries and wages 44,867,147 36,018,115Rent allowance 7,765,316 6,538,458Social security 3,169,256 2,661,607Overtime 176,339 138,430Training scheme 1,634,591 994,040Staff welfare 396,839 280,777End-of-service benefits 4,954,639 4,121,549Others 1,990,012 754,614_________ __________
64,954,139 51,507,590 ========= ==========
13 CURRENCY
Currency management 152,761 143,233Currency issue expenses 17,385,574 16,695,020
_________ __________ 17,538,335 16,838,253========= ==========
Currency issue expenses relate to the cost of the new notes and coins issued and the managementexpenses relate to all other expenses incurred in transporting notes and coins.

103
BANK OF SIERRA LEONE
NOTES TO THE FINANCIAL STATEMENTS (Contd)
In thousands of Leones
14 OTHER EXPENSES
2016 2015Occupancy cost 341,059 271,074Audit fees 290,000 260,000Legal and professional fees 5,419,836 7,106,631Directors’ remuneration 3,085,868 1,726,730Advertisement 153,370 57,540Electricity 2,056,896 2,119,579Insurance 1,009,154 1,107,323Passage and overseas allowances 4,554,680 3,922,509Repairs and maintenance 1,306,731 822,284Hospitality 1,190,735 825,641Contributions to International organisations 5,063,369 4,743,905General office expenses 639,521 596,639Vehicle running expenses 359,432 268,453Others 2,991,070 4,709,286
28,461,721 28,537,594========= ==========
15 PROFIT FOR THE YEAR
The profit for the year has been stated after charging:
Depreciation and amortisation 4,960,862 4,675,347Directors remuneration 3,085,868 1,726,730Audit fees 290,000 260,000
======== ==========
16 CASH AND CASH EQUIVALENTS
Cash in hand 278,301 456,322Balances with other Central Banks 1,481,968,024 1,357,111,331Placement with Banks (fixed deposits) 895,632,116 878,383,555Cash and balances with Banks 620,416,418 202,612,935
2,998,294,859 2,438,564,143 =========== ==========
17 FUNDS HELD WITH THE INTERNATIONAL MONETARY FUND (IMF)
IMF Quota subscription 2,000,947,498 810,993,109SDR Holdings 1,030,188,998 840,904,107
3,031,136,496 1,651,897,216 =========== ============
These are International Monetary Fund related assets and they represent Sierra Leone’s interestin the International Monetary Fund.Sierra Leone has been a member of the International MonetaryFund (IMF) since 1962.
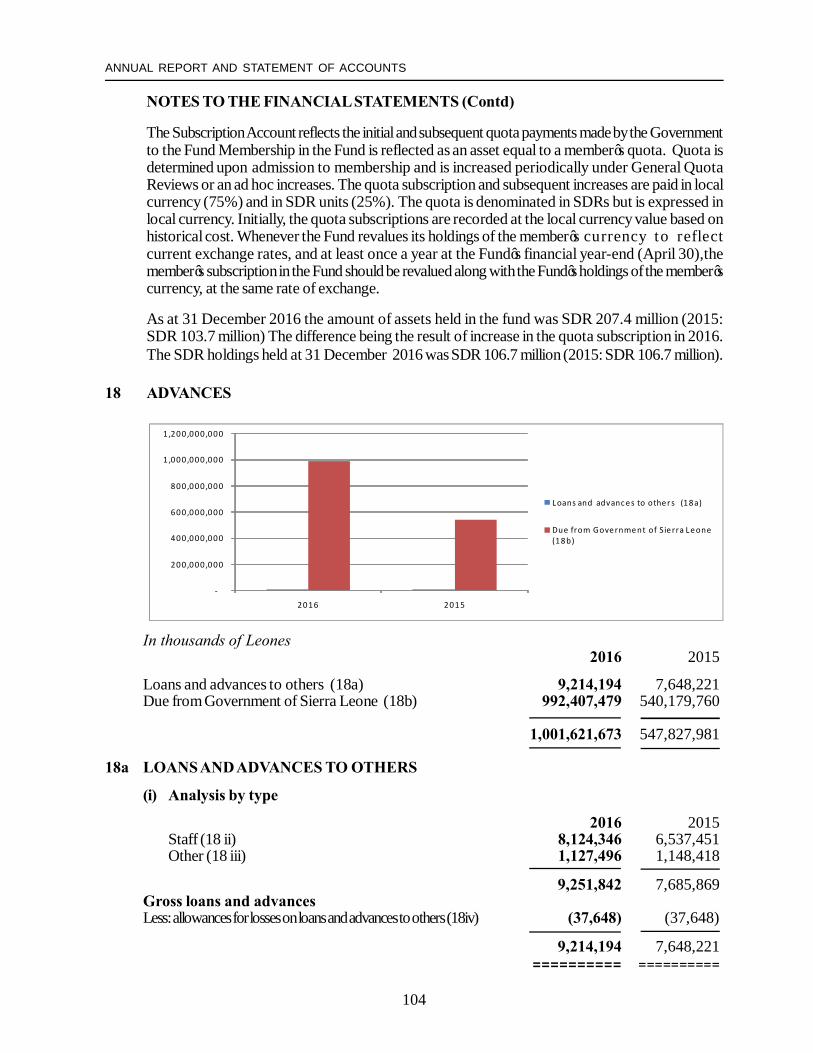
104
ANNUAL REPORT AND STATEMENT OF ACCOUNTS
NOTES TO THE FINANCIAL STATEMENTS (Contd)
The Subscription Account reflects the initial and subsequent quota payments made by the Governmentto the Fund Membership in the Fund is reflected as an asset equal to a member’s quota. Quota isdetermined upon admission to membership and is increased periodically under General QuotaReviews or an ad hoc increases. The quota subscription and subsequent increases are paid in localcurrency (75%) and in SDR units (25%). The quota is denominated in SDRs but is expressed inlocal currency. Initially, the quota subscriptions are recorded at the local currency value based onhistorical cost. Whenever the Fund revalues its holdings of the member’s currency to reflectcurrent exchange rates, and at least once a year at the Fund’s financial year-end (April 30),themember’s subscription in the Fund should be revalued along with the Fund’s holdings of the member’scurrency, at the same rate of exchange.
As at 31 December 2016 the amount of assets held in the fund was SDR 207.4 million (2015:SDR 103.7 million) The difference being the result of increase in the quota subscription in 2016.The SDR holdings held at 31 December 2016 was SDR 106.7 million (2015: SDR 106.7 million).
18 ADVANCES
In thousands of Leones2016 2015
Loans and advances to others (18a) 9,214,194 7,648,221Due from Government of Sierra Leone (18b) 992,407,479 540,179,760
1,001,621,673 547,827,981
18a LOANS AND ADVANCES TO OTHERS
(i) Analysis by type
2016 2015Staff (18 ii) 8,124,346 6,537,451Other (18 iii) 1,127,496 1,148,418
9,251,842 7,685,869Gross loans and advancesLess: allowances for losses on loans and advances to others (18iv) (37,648) (37,648)
9,214,194 7,648,221========== ==========
-
200,000,000
400,000,000
600,000,000
800,000,000
1 ,000,000,000
1 ,200,000,000
2016 2015
L oans and advanc e s to othe r s (18a)
Due from Gove rnme nt of Sie rra L e one (18b)
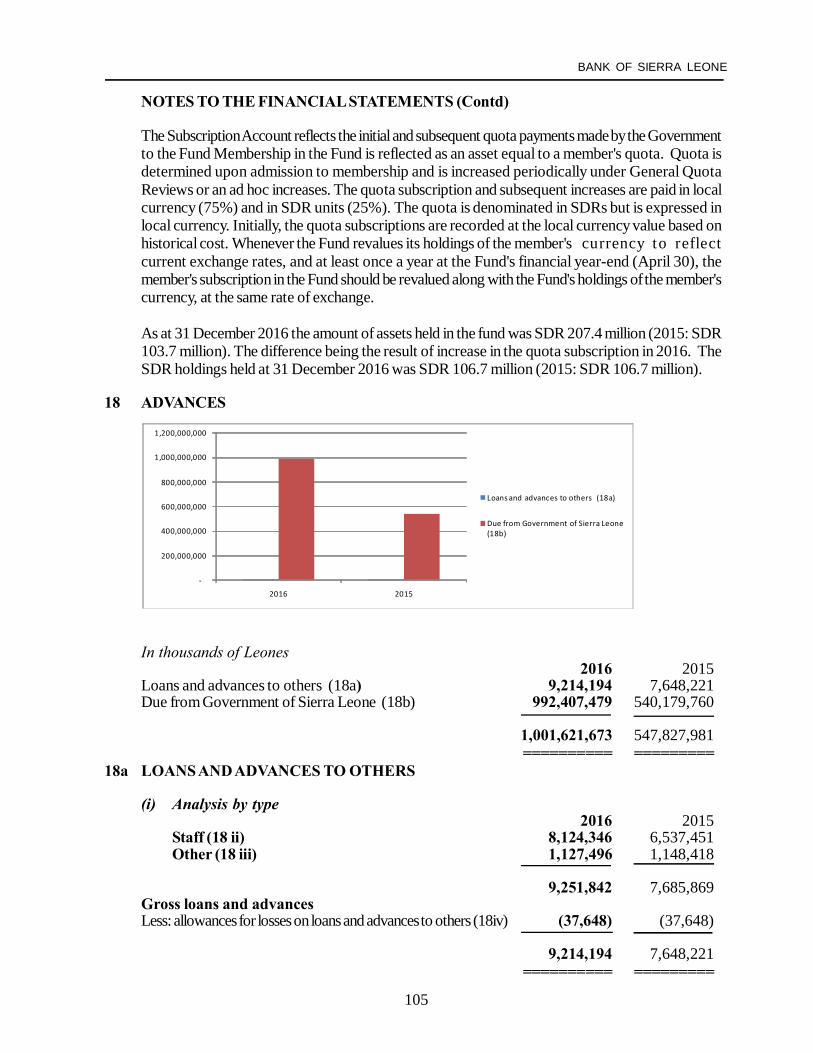
105
BANK OF SIERRA LEONE
NOTES TO THE FINANCIAL STATEMENTS (Contd)
The Subscription Account reflects the initial and subsequent quota payments made by the Governmentto the Fund Membership in the Fund is reflected as an asset equal to a member's quota. Quota isdetermined upon admission to membership and is increased periodically under General QuotaReviews or an ad hoc increases. The quota subscription and subsequent increases are paid in localcurrency (75%) and in SDR units (25%). The quota is denominated in SDRs but is expressed inlocal currency. Initially, the quota subscriptions are recorded at the local currency value based onhistorical cost. Whenever the Fund revalues its holdings of the member's currency to reflectcurrent exchange rates, and at least once a year at the Fund's financial year-end (April 30), themember's subscription in the Fund should be revalued along with the Fund's holdings of the member'scurrency, at the same rate of exchange.
As at 31 December 2016 the amount of assets held in the fund was SDR 207.4 million (2015: SDR103.7 million). The difference being the result of increase in the quota subscription in 2016. TheSDR holdings held at 31 December 2016 was SDR 106.7 million (2015: SDR 106.7 million).
18 ADVANCES
In thousands of Leones2016 2015
Loans and advances to others (18a) 9,214,194 7,648,221Due from Government of Sierra Leone (18b) 992,407,479 540,179,760
1,001,621,673 547,827,981========== =========
18a LOANS AND ADVANCES TO OTHERS
(i) Analysis by type2016 2015
Staff (18 ii) 8,124,346 6,537,451Other (18 iii) 1,127,496 1,148,418
9,251,842 7,685,869Gross loans and advancesLess: allowances for losses on loans and advances to others (18iv) (37,648) (37,648)
9,214,194 7,648,221========== =========
-
200,000,000
400,000,000
600,000,000
800,000,000
1,000,000,000
1,200,000,000
2016 2015
Loans and advances to others (18a)
Due from Government of Sierra Leone (18b)
106
ANNUAL REPORT AND STATEMENT OF ACCOUNTS
NOTES TO THE FINANCIAL STATEMENTS (Contd)
In thousands of Leones
2016 2015(ii) Staff
Personal loan 3,817,174 3,628,594Housing loan 1,275,717 227,109Vehicle loan 3,015,160 2,652,358Staff advance 16,295 29,390
8,124,346 6,537,451======== =========
(iii) Others
Loan to Sierra Leone Stock Exchange Company Limited 1,000,000 1,000,000Other advances 127,496 148,418
1,127,496 1,148,418 ======== ========
(iv) Allowances for impairment
Specific allowances for impairment - -Balance at 1 January 37,648 166,345Write-off during the year - (128,697)
Balance at 31 December 37,648 37,648
Collective allowance for impairmentBalance at 1 January - -Impairment loss for the year - -
Balance at 31 December - -
Total allowances for impairment 37,648 37,648 ======== ========
18b DUE FROM GOVERNMENT OF SIERRA LEONEAdvances to Government:Ways and means advances (i) 111,587,023 63,405,581 Others (ii) 880,820,456 476,774,179
992,407,479 540,179,760========= =========

107
BANK OF SIERRA LEONE
NOTES TO THE FINANCIAL STATEMENTS (Contd)
In thousands of Leones2016 2015
(i) Ways and means advancesWays and means advances brought forward 63,405,581 39,057,652Advances during the year 1,924,932,093 1,704,577,191Receipts during the year (1,876,750,651) (1,680,229,262)
Ways and means advances carried forward 111,587,023 63,405,581 =========== ===========
Under the provisions of Section 56(5) of the Bank of Sierra Leone Act, 2011, the limit on the Waysand Means Advances that the Bank can grant to the Government shall not exceed five percent ofthe Government’s actual domestic revenue excluding privatisation receipts in the previous year’sbudget.
(ii) OthersWorld Bank Bridging Loan 120,000,000 -GoSL/IMF budget financing 760,820,456 476,774,179
880,820,456 476,774,179=========== ===========
The bridging loan of Le 120 billion represents amount on-lent from the Bank’s SDR allocation withthe IMF to support the Government in liquidating non-discretionary statutory commitments.Theloan accrues an annual interest equal to the variable SDR interest rate set at 0.05%.
GoSL/IMF budget financing is a loan granted by the IMF under the Extended Credit Facility(ECF) arrangement. The ECF funds has supported the fight against the Ebola outbreak through theCatastrophe Containment and Relief (CRR) Trust, budgetary and balance of payment needs andstrengthening of the international reserves.
108
ANNUAL REPORT AND STATEMENT OF ACCOUNTS
NOTES TO THE FINANCIAL STATEMENTS (Contd)
In thousands of Leones
18b Due from Government of Sierra Leone (contd)
2016 2015Ways and means advances 111,587,023 63,405,581
========== ==========
Government’s actual revenue in previous year 2,328,428,637 2,226,025,966
5% thereof 116,421,432 111,301,298 ___________ ____________
Buffer in Government lending (4,834,409) (47,895,718) ========== ===========
The Directors report the balance of advances due from the Government of Sierra Leone as at 31December 2016 amounting to Le111,587,023 - (2015: Le63,405,581). The balance outstandingwas within the limit specified in the Bank of Sierra Leone Act 2011.
19 INVESTMENT IN EQUITY
Afrexim Bank Capital Investment 25,548,987 18,053,658Afrexim Bank Dividend Investment 1,108,670 803,258Stabilization and Cooperation Fund 20,339,883 15,802,509
46,997,540 34,659,425 ========= =========
Afrexim investments disclosed above includes the cash received and the dividend re-invested bythe Bank.
The amount of Le20.3 billion relates to the Bank’s contribution to the Stabilization and Cooperation Fund managed by the West African Monetary Institute and held at the Bank of Ghana.

109
BANK OF SIERRA LEONE
NOTES TO THE FINANCIAL STATEMENTS (Contd)
In thousands of Leones
20 INVESTMENT SECURITIES
The Bank’s holdings of treasury investment securities comprised the following:
2016 201591-day treasury bills held for monetary policy 4,202,188 12,879,893182-day treasury bills 6,295,150 4,505,200One-year treasury bills 220,803,627 3,540,500364-day treasury bond held for monetary policy 9,195,450 6,184,650BSL holding three-year medium-term bond 154,887,804 154,887,804Five-year medium-term bond 273,407,606 273,407,606Holdings of ten-year bond 56,250,000 63,750,000Others 21,647 54,714
725,063,472 519,210,367========== ============
BSL Holding 3-year medium-term bond
The Bank held two individual three-year medium-term bonds. This includes Le81.8 billion three-year marketable security issued at an interest rate of 6% payable semi-annually.
Following instruction from the Government to convert the remaining stock of the 2010 Ways andMeans Advances into three year medium-term bond at an interest rate of 9% per annum, the saidinvestment was recognised.
Five year medium term bonds
There is a Memorandum of Understanding (MOU) between the Government of Sierra Leoneand the Bank of Sierra Leone for the conversion of Non-negotiable Non-interest Bearing Securities(NNIBS) to Five-year medium term bonds at an annual interest rate of 9% to be paid semi-annually. It is subject to rollover upon maturity.
The amount of Le 56.25 billion represents the outstanding balance due to the Bank from theGovernment of Sierra Leone following the issue of a 10-year marketable bond at an interest rateof 8% for the purpose of fully subscribing to the minimum paid-up capital of the Bank.The bondwas issued on 1 May 2014 with interest repayable semi-annually. As at 31 December 2016,Le18.75 billion had been repaid by the Government to the Bank out of the principal amount ofLe75.00 billion.

110
ANNUAL REPORT AND STATEMENT OF ACCOUNTS
NO
TES
TO T
HE
FIN
AN
CIA
L ST
ATE
MEN
TS (C
ontd
)In
thou
sand
s of
Leo
nes
21a
PRO
PER
TY, P
LAN
T A
ND
EQ
UIP
MEN
TM
otor
Offi
ce fu
rnitu
rePl
ant a
nd W
ork-
inC
OST
Prem
ises
vehi
cle
and
equi
pmen
tm
achi
nery
Pro
gres
sTo
tal
Bala
nce
at 1
Jan
uary
201
5
63,
680,
751
6
,085
,343
22,
667,
827
6,96
2,87
8
17,3
76,1
4011
6,77
2,93
9Ad
ditio
ns d
urin
g th
e ye
ar
- 1
32,0
46
-
-7,
886,
357
8,
018,
403
Rec
lass
ifica
tion
282
,344
9,
200
1,
068,
769
3,68
9,71
3
(5,0
50,0
26)
Writ
e-of
f
-
-
-
-
(24
0,67
0)
(2
40,6
70)
Dis
posa
l
-
(8
47,6
16)
(2,3
75)
-
-
(849
,991
)
Bal
ance
at 3
1 D
ecem
ber 2
015
6
3,96
3,09
5
5,37
8,97
3
2
3,73
4,22
1
10,
652,
591
19,
971,
801
123,
700,
681
=
====
====
====
====
====
====
====
====
====
====
====
====
====
====
====
====
====
====
====
====
====
====
====
Bala
nce
at 1
Jan
uary
201
6
63,
963,
095
5,37
8,97
3
23,
734,
221
10,
652,
591
19,9
71,8
01
123
,700
,681
Addi
tions
dur
ing
the
year
-
-
-
-
21,
345,
349
21,
345,
349
Rec
lass
ifica
tion
3
,814
,495
-
5
,598
,486
1,2
99,5
38
(10,
712,
519)
-W
rite-
off
-
-
-
-
(2
,375
)
(2,
375)
Dis
posa
l
- (
268,
800)
-
-
-
(268
,800
)Ad
just
men
tsB
alan
ce a
t 31
Dec
embe
r 201
6
6
7,77
7,59
0
5
,110
,173
29,
332,
707
11,9
52,1
29
30,
602,
256
1
44,7
74,8
55
==
====
====
====
====
====
====
====
====
====
====
====
====
====
====
====
====
====
====
====
====
====
====
====
DEP
REC
IATI
ON
Bala
nce
at 1
Jan
uary
201
5
13,
998,
830
5,1
98,6
6616
,964
,787
4,0
15,0
98-
40,1
77,3
81D
epre
ciat
ion
for t
he y
ear
1
,251
,140
33
8,82
1
2,55
3,49
9
5
55,2
42
-
4,6
98,7
02Ad
just
men
ts
-
(2,
283)
(
19,7
61)
(1,3
11)
-
(
23,3
55)
Dis
posa
l
-
(8
45,3
05)
(3
,332
)-
-
(84
8,63
7)
Bal
ance
at 3
1 D
ecem
ber 2
015
1
5,24
9,97
0
4
,689
,899
19,4
95,1
93
4,5
69,0
29
-
44,0
04,0
91
=
====
====
====
====
====
====
====
====
====
====
====
====
====
====
====
====
====
====
====
====
====
====
====
=
Bala
nce
at 1
Jan
uary
201
6
15,
249,
970
4,68
9,89
9
19,
495,
193
4
,569
,029
-
44,0
04,0
91D
epre
ciat
ion
for t
he y
ear
1
,319
,687
303,
658
2
,470
,060
867
,457
-
4,9
60,8
62D
ispo
sal
-
(2
68,7
93)
-
-
-
(
268,
793)
Bal
ance
at 3
1 D
ecem
ber 2
016
16,
569,
657
4
,724
,764
21
,965
,253
5,4
36,4
86
-
48,
696,
160
==
====
====
====
====
====
====
====
====
====
====
====
====
====
====
====
====
====
====
====
====
====
====
====
CA
RR
YIN
G A
MO
UN
T
At 3
1 D
ecem
ber 2
015
4
8,71
3,12
5
68
9,07
4
4,2
39,0
28
6,0
83,5
62
1
9,97
1,80
179
,696
,590
At 3
1 D
ecem
ber 2
016
51,
207,
933
3
85,4
09
7,3
67,4
54
6,5
15,6
43
30,
602,
256
96,
078,
695
=
====
====
====
====
====
====
====
====
====
====
====
====
====
====
====
====
====
====
====
====
====
====
====
=
Wor
k in
pro
gres
s rep
rese
nts a
mou
nt sp
ent o
n su
pply
and
inst
alla
tion
of li
ft, p
aym
ents
for O
racl
e so
ftwar
e an
d ha
rdw
are
for t
he V
alte
chpr
ojec
t, W
AM
Z sy
stem
s pro
ject
, reh
abili
tatio
n of
the
Mai
n B
ank
and
Ken
ema
Bra
nch
build
ings
, pay
men
t for
the
supp
ly o
f Har
dwar
e fo
rth
e C
olla
tera
l Reg
istry
Pro
gram
me
and
re-c
onst
ruct
ion
of b
road
wal
k at
the
Ban
k C
ompl
ex.
111
BANK OF SIERRA LEONE
NOTES TO THE FINANCIAL STATEMENTS (Contd)
In thousands of Leones
22 OTHER ASSETS
Gold stock 742,166 532,287Items in transit 5,620,453 15,200,822Consumables 971,620 749,237Prepayment 2,694,635 1,431,200Advances to contractors 16,829,158 23,805,247Interest receivable 24,014,178 11,106,264Deferred currency issue expense 72,253,054 46,842,769Other receivables 163,639 3,484,405Reverse repo account - 3,000,000Less:Allowances for impairment (8,732) (8,732)
123,280,171 106,143,499========== =========
Allowances for impairment:At 1 January (8,732) (8,732)Impairment charge for the year - -Written off during the year - -
(8,732) (8,732)========== =========
23 AMOUNTS DUE TO THE INTERNATIONALMONETARY FUND (IMF)
2016 2015IMF Special Drawing Rights 960,513,771 778,190,628IMF Poverty Reduction and Growth Facility 2,222,919,091 1,424,667,795IMF securities 75,846,659 77,470,809IMF No. 1 1,923,812,350 733,333,473IMF No. 2 90,217 73,169
5,183,182,088 3,013,735,874========== ==========
The IMF Special Drawing Rights and Poverty Reduction and Growth Facility accounts relate toamounts due to the International Monetary Fund (IMF) for SDRs allocated to the Bank fortransactions with IMF and to support programs, strengthen balance of payments position and fosterdurable growth, leading to higher living standards and a reduction in poverty.
The IMF No. 1 Account represents part of the IMF currency holding in member’s designateddepository account which is used for the IMF’s operations, including, inter alia, quota subscription payments, purchases, and repurchases. The No. 1 Account is a cash account. Members are requiredto maintain a minimum in No. 1 Account equal to 1/4 of 1 percent of the member’s quota at alltimes.
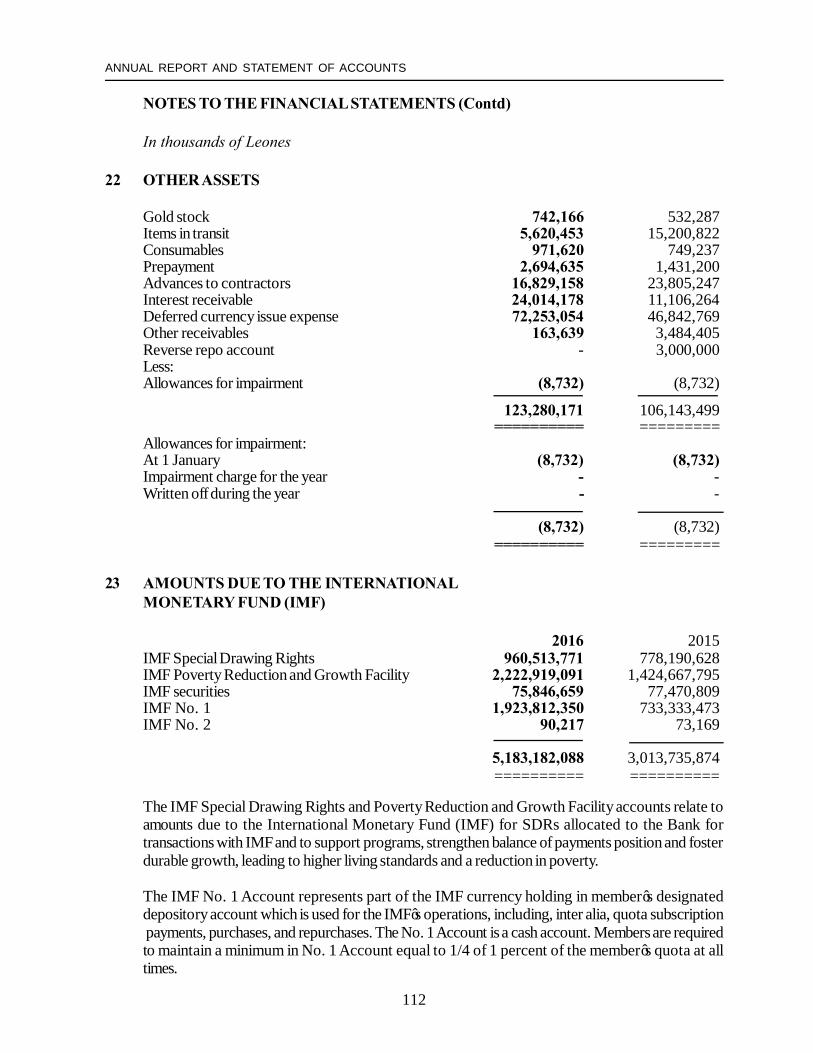
112
ANNUAL REPORT AND STATEMENT OF ACCOUNTS
NOTES TO THE FINANCIAL STATEMENTS (Contd)
In thousands of Leones
22 OTHER ASSETS
Gold stock 742,166 532,287Items in transit 5,620,453 15,200,822Consumables 971,620 749,237Prepayment 2,694,635 1,431,200Advances to contractors 16,829,158 23,805,247Interest receivable 24,014,178 11,106,264Deferred currency issue expense 72,253,054 46,842,769Other receivables 163,639 3,484,405Reverse repo account - 3,000,000Less:Allowances for impairment (8,732) (8,732)
123,280,171 106,143,499========== =========
Allowances for impairment:At 1 January (8,732) (8,732)Impairment charge for the year - -Written off during the year - -
(8,732) (8,732)========== =========
23 AMOUNTS DUE TO THE INTERNATIONALMONETARY FUND (IMF)
2016 2015IMF Special Drawing Rights 960,513,771 778,190,628IMF Poverty Reduction and Growth Facility 2,222,919,091 1,424,667,795IMF securities 75,846,659 77,470,809IMF No. 1 1,923,812,350 733,333,473IMF No. 2 90,217 73,169
5,183,182,088 3,013,735,874========== ==========
The IMF Special Drawing Rights and Poverty Reduction and Growth Facility accounts relate toamounts due to the International Monetary Fund (IMF) for SDRs allocated to the Bank fortransactions with IMF and to support programs, strengthen balance of payments position and fosterdurable growth, leading to higher living standards and a reduction in poverty.
The IMF No. 1 Account represents part of the IMF currency holding in member’s designateddepository account which is used for the IMF’s operations, including, inter alia, quota subscription payments, purchases, and repurchases. The No. 1 Account is a cash account. Members are requiredto maintain a minimum in No. 1 Account equal to 1/4 of 1 percent of the member’s quota at alltimes.

113
BANK OF SIERRA LEONE
NOTES TO THE FINANCIAL STATEMENTS (Contd)
In thousands of Leones
The IMF No. 2 Account represents part of the IMF currency holdings held in member’sdesignated depository account and it is used for the payment of administrative expensesincurred by the IMF in the member’s currency, e.g., expenses of the IMF representativeoffices.
The IMF Securities Account represents part of the IMF currency holdings held in members’depository account which contain member’s non-negotiable, non-interest bearing notesencashable on demand.
A restatement of the 2015 balances in accordance with note 39c of IMF securities Le10.08billion; IMF No 1 Le95.42 billion and IMF No 2 Le9.52 million accounts respectively.
24 DEPOSITS FROM GOVERNMENT
This represents Governments special deposit accounts.
25 DEPOSITS FROM BANKS
Commercial banks’ reserve accounts 618,187,727 324,851,642Rural and community banks’ reserve accounts 9,631,550 13,877,686Others 5,733,394 117,760
633,552,671 338,847,088========= =========
26 DEPOSITS FROM OTHERS
Deposits from insurance brokers 5,792,379 2,964,358Multilateral organisations 33,509,754 25,470,918Financial institutions 2,499,195 1,572,170Others 5,568,604 2,650,626
47,369,932 32,658,072 ========= ==========
27 CURRENCY IN CIRCULATION2016 2015
Notes 1,453,717,058 1,346,317,059Coins 13,646,974 10,642,873
____________ _____________Balance at 31 December 1,467,364,032 1,356,959,932
=========== ============
Currency in circulation represents the face value of bank notes and coins in circulation.
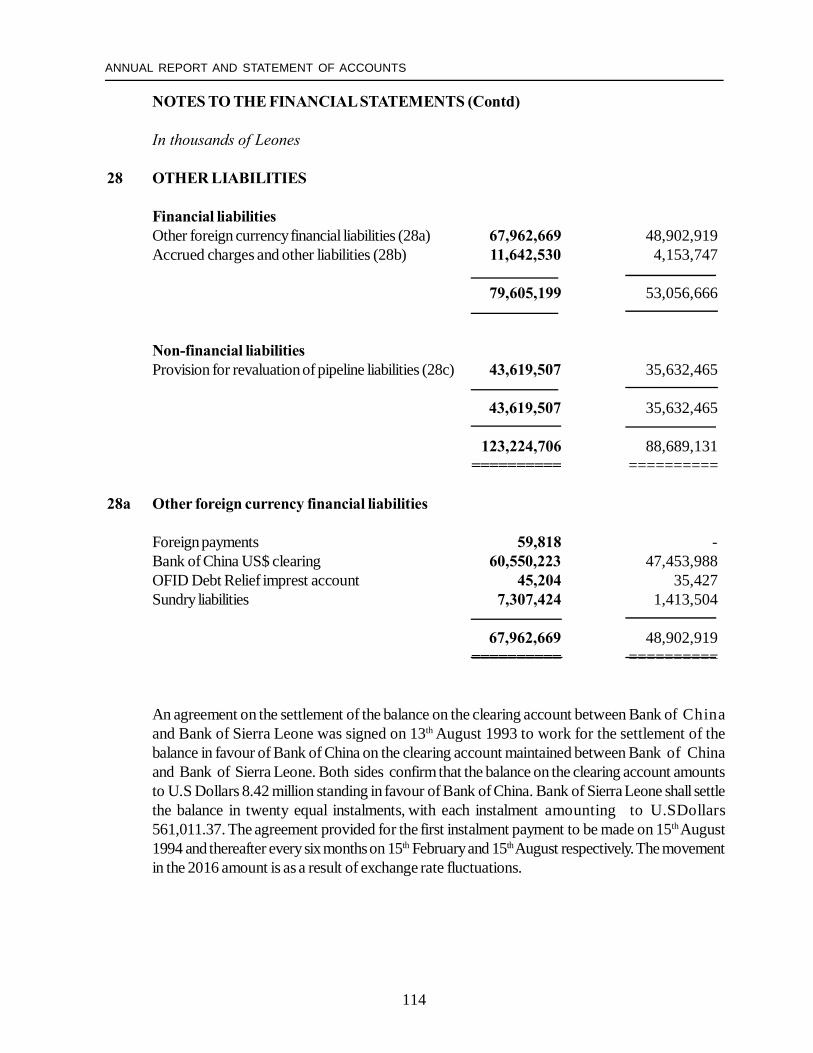
114
ANNUAL REPORT AND STATEMENT OF ACCOUNTS
NOTES TO THE FINANCIAL STATEMENTS (Contd)
In thousands of Leones
28 OTHER LIABILITIES
Financial liabilitiesOther foreign currency financial liabilities (28a) 67,962,669 48,902,919Accrued charges and other liabilities (28b) 11,642,530 4,153,747
79,605,199 53,056,666
Non-financial liabilitiesProvision for revaluation of pipeline liabilities (28c) 43,619,507 35,632,465
43,619,507 35,632,465
123,224,706 88,689,131========== ==========
28a Other foreign currency financial liabilities
Foreign payments 59,818 -Bank of China US$ clearing 60,550,223 47,453,988OFID Debt Relief imprest account 45,204 35,427Sundry liabilities 7,307,424 1,413,504
67,962,669 48,902,919========== ==========
An agreement on the settlement of the balance on the clearing account between Bank of Chinaand Bank of Sierra Leone was signed on 13th August 1993 to work for the settlement of thebalance in favour of Bank of China on the clearing account maintained between Bank of Chinaand Bank of Sierra Leone. Both sides confirm that the balance on the clearing account amountsto U.S Dollars 8.42 million standing in favour of Bank of China. Bank of Sierra Leone shall settlethe balance in twenty equal instalments, with each instalment amounting to U.SDollars561,011.37. The agreement provided for the first instalment payment to be made on 15th August1994 and thereafter every six months on 15th February and 15th August respectively. The movementin the 2016 amount is as a result of exchange rate fluctuations.
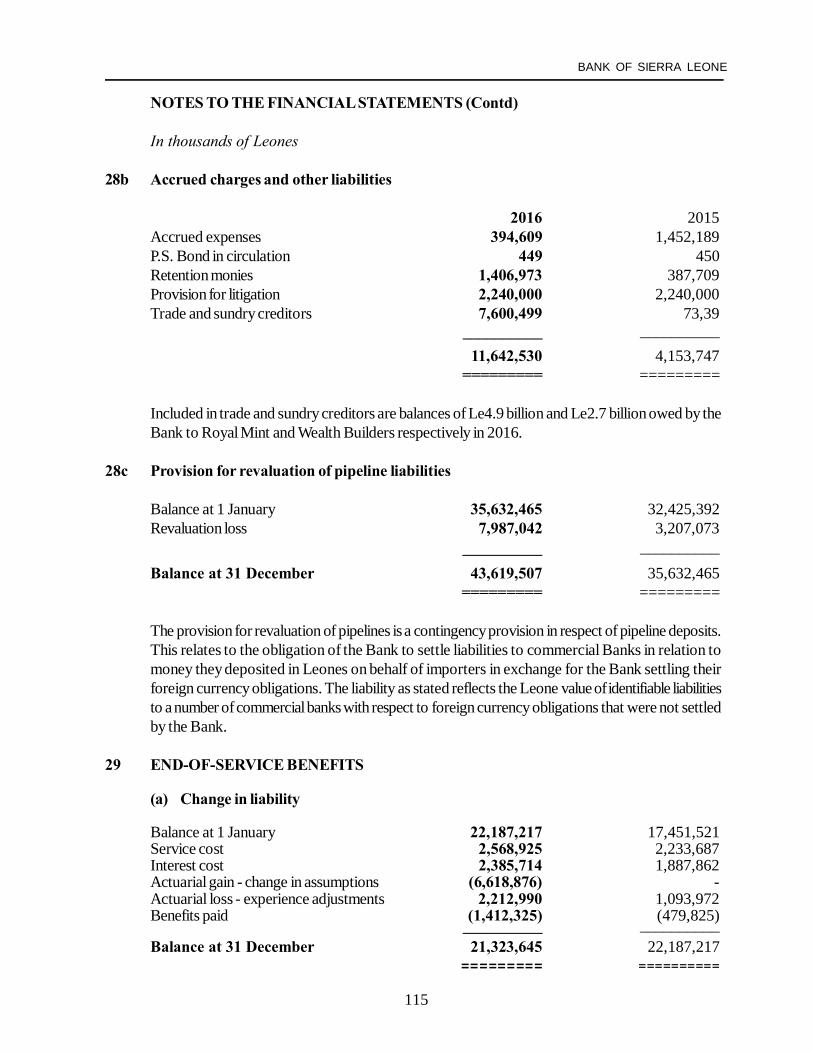
115
BANK OF SIERRA LEONE
NOTES TO THE FINANCIAL STATEMENTS (Contd)
In thousands of Leones
28b Accrued charges and other liabilities
2016 2015Accrued expenses 394,609 1,452,189P.S. Bond in circulation 449 450Retention monies 1,406,973 387,709Provision for litigation 2,240,000 2,240,000Trade and sundry creditors 7,600,499 73,39
__________ __________ 11,642,530 4,153,747 ========= =========
Included in trade and sundry creditors are balances of Le4.9 billion and Le2.7 billion owed by theBank to Royal Mint and Wealth Builders respectively in 2016.
28c Provision for revaluation of pipeline liabilities
Balance at 1 January 35,632,465 32,425,392Revaluation loss 7,987,042 3,207,073
__________ __________Balance at 31 December 43,619,507 35,632,465
========= =========
The provision for revaluation of pipelines is a contingency provision in respect of pipeline deposits.This relates to the obligation of the Bank to settle liabilities to commercial Banks in relation tomoney they deposited in Leones on behalf of importers in exchange for the Bank settling theirforeign currency obligations. The liability as stated reflects the Leone value of identifiable liabilitiesto a number of commercial banks with respect to foreign currency obligations that were not settledby the Bank.
29 END-OF-SERVICE BENEFITS
(a) Change in liability
Balance at 1 January 22,187,217 17,451,521Service cost 2,568,925 2,233,687Interest cost 2,385,714 1,887,862Actuarial gain - change in assumptions (6,618,876) -Actuarial loss - experience adjustments 2,212,990 1,093,972Benefits paid (1,412,325) (479,825) __________ __________Balance at 31 December 21,323,645 22,187,217
========= ==========

116
ANNUAL REPORT AND STATEMENT OF ACCOUNTS
NOTES TO THE FINANCIAL STATEMENTS (Contd)
In thousands of Leones
(b) Change in plan assets
2016 2015Balance at 1 January - -Actual return on plan assets - -
_________ ________Expected returns at 31 December - -Contribution by employer 1,412,325 479,825
Total contribution 1,412,325 479,825
Benefits paid by the employer (1,412,325) (479,825)Foreign exchange rate effect - -
Total benefits (1,412,325) (479,825)
Balance at 31 December - -========= =========

117
BANK OF SIERRA LEONE
NOTES TO THE FINANCIAL STATEMENTS (Contd)
In thousands of Leones
(d) Balance Sheet2016 2015
Projected benefit obligation 21,323,645 22,187,217Plan assets - -
Net obligation/(assets) 21,323,645 22,187,217
Unrecognised actuarial gains/(losses) - -Unrecognised past service cost - -Unrecognised transitional obligation - -Unrecognised (asset ceiling) - -
Net obligation/(asset) to be in balance sheet 21,323,645 22,187,217======== =========
(e) Income StatementService cost 2,568,925 2,233,687Net interest cost 2,385,714 1,887,862 - Interest cost - - - Expected return on plan assets - - - Return on asset ceiling - -Interest cost - -Expected return on plan asset - -Actuarial loss/(gain) recognised -Transitional obligation recognised - -Past service cost recognised - -
Amount recognised in income statement 4,954,639 4,121,549========= =========
Other comprehensive income (OCI)
Actuarial (gains)/loss: experience adjustments 2,212,990 1,093,972 change in assumption (6,618,876) -Return on plan asset not in other comprehensive income - -Effect of asset ceiling not in other comprehensive income - -
Amount recognised in OCI (4,405,886) 1,093,972======== =========
Initial adjustment to capital amount recognised -
Cumulative amount recognised in OCI (4,405,886) 1,093,972========= ==========
.....................
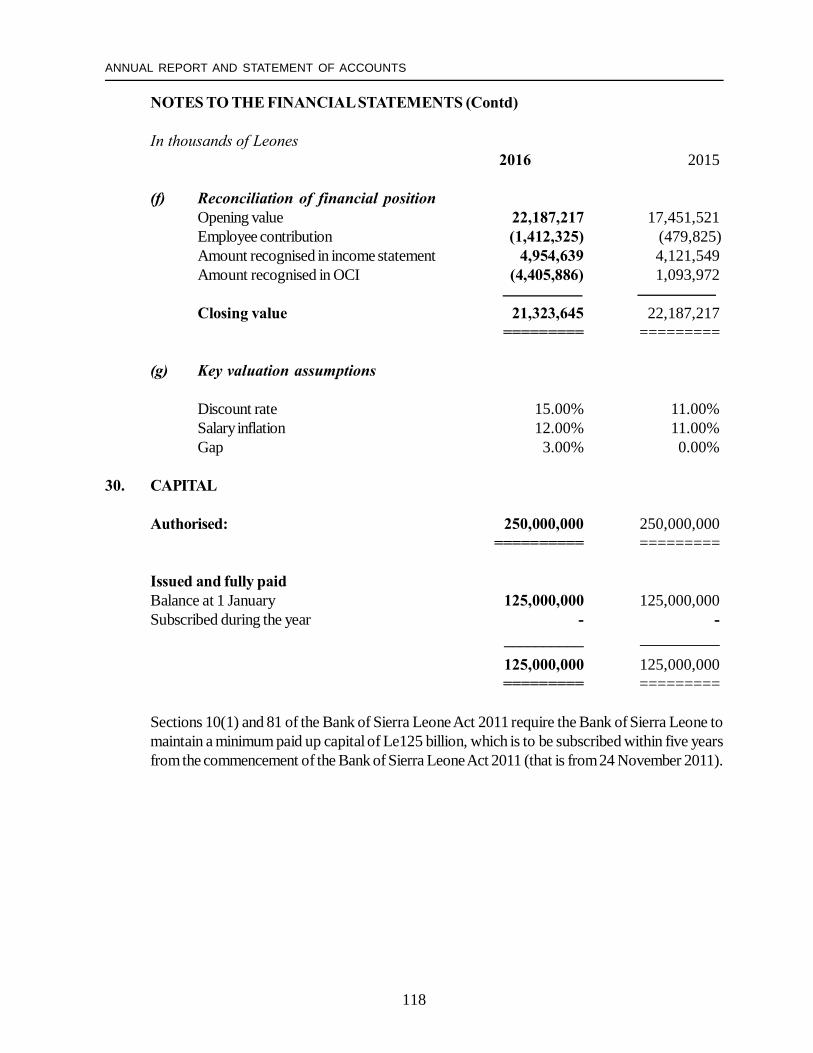
118
ANNUAL REPORT AND STATEMENT OF ACCOUNTS
NOTES TO THE FINANCIAL STATEMENTS (Contd)
In thousands of Leones2016 2015
(f) Reconciliation of financial positionOpening value 22,187,217 17,451,521Employee contribution (1,412,325) (479,825)Amount recognised in income statement 4,954,639 4,121,549Amount recognised in OCI (4,405,886) 1,093,972
Closing value 21,323,645 22,187,217========= =========
(g) Key valuation assumptions
Discount rate 15.00% 11.00%Salary inflation 12.00% 11.00%Gap 3.00% 0.00%
30. CAPITAL
Authorised: 250,000,000 250,000,000========== =========
Issued and fully paidBalance at 1 January 125,000,000 125,000,000Subscribed during the year - -
__________ __________ 125,000,000 125,000,000========= =========
Sections 10(1) and 81 of the Bank of Sierra Leone Act 2011 require the Bank of Sierra Leone tomaintain a minimum paid up capital of Le125 billion, which is to be subscribed within five yearsfrom the commencement of the Bank of Sierra Leone Act 2011 (that is from 24 November 2011).
119
BANK OF SIERRA LEONE
NOTES TO THE FINANCIAL STATEMENTS (Contd)
In thousands of Leones
31 RESERVES
2016 2015General reserve (a) 264,003,990 281,990,671
Other reserves (b) 32,792,919 32,792,919__________ ___________
Total reserves as at 31 December 296,796,909 314,783,590 ========= ==========
(a) General reserve
Balance at start of the year 281,990,671 213,740,193Net (loss)/profit for the year (17,986,681) 68,250,478
264,003,990 281,990,671Securities reserves - -
__________ ___________Balance at 31 December 264,003,990 281,990,671
========= ==========
Under Section 14(1) and subject to section 81 of the Bank of Sierra Leone Act 2011,where inthe audited annual financial statements of the Bank, the value of its assets falls below the sum ofits liabilities, its unimpaired issued capital and general reserves, the Board, on the advice of theexternal auditors of the Bank, shall assess the situation and prepare a report on the causes andextent of the shortfall within a period of not more than thirty days. In the event that the Boardapproves the report, the Bank shall request the Minister for a capital contribution by the Governmentto remedy the deficit and upon receipt of this request the Government shall, within a period ofnot more than thirty calendar days, transfer to the Bank the necessary amount in currency or innegotiable debt instruments with a specified maturity issued at market-related interest rates, asdetermined by the Board.
As at 31 December 2016, the total value of the assets of the Bank exceeds the sum of itsliabilities, unimpaired issued capital and general reserves.
A restatement of the 2015 general reserves opening balance to account for the IMF balances ofLe42.94 billion for prior years.
120
ANNUAL REPORT AND STATEMENT OF ACCOUNTS
NOTES TO THE FINANCIAL STATEMENTS (Contd)
In thousands of Leones
(b) Revaluation reserve
2016 2015Balance at start of the year and end of the year 32,792,919 32,792,919
Balance at 31 December 32,792,919 32,792,919========= ========
The Bank maintains a property revaluation reserve to which is transferred revaluation gains onrevaluation of its properties. The revaluation was last done in 2001.
(c) Other reserve
This comprised actuarial gains/losses and is analysed below:
Balance at start of the year (877,649) 216,323Actuarial loss on end-of-service benefits 4,405,886 (1,093,972)
3,528,237 (877,649) ========= =========
The movement in the other reserve accounts for acturial loss of the provision of end-of-servicebenefits of Le4.41 billion.
32 CONTINGENCIES AND COMMITMENTS
32a Contingent liabilities
Guarantees and endorsement 222,902,272 179,292,620
222,902,272 179,292,620========= =========
The loans in the guarantees and endorsements ledger are long outstanding debts contracted bytheGovernment and guaranteed by the Bank in foreign currencies. There has been no claims on theseguarantees over the last 10 years. The Bank holds only little information on the terms of thearrangements.
The Bank also issued a Letter of Credit (LC) for USD $1,000,000 in February 2016 on behalf oftheGovernment of Sierra Leone. Full cash deposit collateral was taken by the Bank and as such theBank is not considered to be exposed.
32b Capital commitments
Capital expenditure 69,125,000 18,734,524African Export Import Bank 14,658,763 13,872,186
83,783,763 32,606,710========= =========
121
BANK OF SIERRA LEONE
NOTES TO THE FINANCIAL STATEMENTS (Contd)
32c Pending law suits, legal proceedings and claimsThe Bank has pending litigations against it in relation to three former employees who are claimingdamages for wrongful dismissal, upward revision of pension and payment of terminal benefits andother allowances. However, the Bank has appealed against the judgements and the matters arepresently at the Court of Appeal. In the event that the appeals are not successful, the Bank wouldbe liable to pay an amount not less than Le2.24 billion excluding interest at the rate of 35% perannum and solicitor’s costs. As judgement was given against the Bank at the lower court, provisionhas been made in these accounts for the amounts that might become payable. The provisionshave been maintained as the decision is still pending.
33 RELATED PARTIES
Although the Bank is an autonomous entity, the Government of Sierra Leone being the solesubscriber to the capital of the Bank, is in principle the owner of the Bank. The Bank continued toact as the banker and adviser to, and fiscal agent of, the Government of Sierra Leone as laiddown in statutes. In the course of executing these duties, the Bank facilitates payments to theGovernment’s suppliers and creditors, and extends credit facilities to the Government.
As at 31 December 2016, total net advances to the Government was Le111.6 trillion (2015:Le63.4 billion).
The Board of Directors (including the Governor and Deputy Governor) receivedremuneration amounting to Le 2.96 billion (2015: Le1.73 billion).
34 EVENTS SUBSEQUENT TO THE REPORTING DATE
Events subsequent to the reporting date are reflected only to the extent that they relate directly tothe financial statements and their effect is material.
On the resignation of the erstwhile Governor of the Bank on 6 March 2017, Dr. Patrick S.Conteh was appointed Governor on 18 July 2017. The operations of the Bank has not beenaffected by this change.
A suspected fraud was reported in April 2017 pointing to illegal trading in foreign currencies. Thematter has been charged to court and the staff involved have been suspended from work whilstthe case is being heard. The Bank contracted KPMG Sierra Leone to investigate the allegedfraud and report on how the fraud was perpetuated, control weaknesses which facilitated thefraud and the extent of any financial loss. Following the conclusion of the investigation and judgementon the matter, any required adjustments to the accounts will be considered by the Bank.

122
ANNUAL REPORT AND STATEMENT OF ACCOUNTS
NOTES TO THE FINANCIAL STATEMENTS (Contd)
35. COMPARATIVES
The comparative figures have been adjusted to conform to changes in presentation in the currentyear. A summary of these adjustments is detailed below:Financial Statements Area Restated
Assets 2015 2015 Explanations
Loans and advances to others 7,648,221 569,050,119
Due from Government ofSierra Leone 540,179,760 63,405,581
Investment securities 519,210,367 466,351,111
Other asset 106,143,499 71,580,604
LiabilitiesAmounts due to the InternationalMonetary Fund (IMF) 3,013,735,874 2,908,223,986
Deposits from Government 86,015,966 84,472,704
Deposits from Banks 338,847,088 334,877,420
Deposits from others 32,658,072 35,508,985
Other liabilities 88,689,131 88,556,716
Revenue and expenditure
Interest and similar income 50,588,849 50,588,849
Fees and commission income 2,045,554 2,982
Net exchange gain 117,069,037 179,636,698
Other income 3,772,072 4,106,967
Personnel expense 51,507,590 52,240,280
Other Expenses 28,537,594 27,804,904
Exclusion of balances for whichGovernment have issuedbonds (investment securities of Le63.75 billion 10-year bond);Government of Sierra Leone/International Monetary Fundbudget financing of Le476.77 billion due from Government ofSierra Leone; and advances to contractors of Le20.88 billion.
Inclusion of Government of Sierra Leone/InternationalMonetary Fund budget financing.
Exclusion of accrued interest of Le10.89 billion and inclusionof balances for which Government have issued bonds(investment securities of Le63.75 billion 10-year bond)
Inclusion of advances to contractors of Le20.88 billion;accrued interest of Le10.89 billion; and debit balances ofdeposits from bank and other liabilities of Le2.66 billion andLe132.4 million respectively.
Re-translation of balances due to IMF amounting Le105.51billion of IMF securities, No 1 and No2 accounts.
Inclusion of Government special deposits of Le1.54 billionfrom Deposits from Others.
Inclusion of commercial banks' reserve accounts of Le1.25billion, rural and community banks of Le5.7 million and otherdeposits of Le55.8 mil lion from deposits f rom othersrespectively; and exclusion of debit balances of depositsfrom banks of Le2.66 billion to other assets.
Exclusion of commercial banks' reserve accounts of Le1.25billion, rural and community banks of Le5.7 million and otherdeposits of Le55.8 mil lion from deposits f rom othersrespectively to deposits from banks; and Government specialdeposits of Le1.54 billion to deposits from Government.
Exclusion of debit balances of other liabilities of Le132.4million to other assets.
Interest on 3-year and 10-year bonds of Le4.88 billion andLe5.45 billion respectively included in advances reclassifiedto interest on investment securities; and cash and short-term funds (note 8c) which represents interest on 91-daytreasury bills reclassified to investment securities.
Inclusion of income from automated clearing house (ACH),central securities depository (CSD) and real time grosssettlement systems (RTGS) of Le2.04 billion from other income.
Re-translation of IMF balances and the apportionment ofLe62.57 billion which relates to 2015. Inclusion of Le17.06billion million from revaluation gains to exchange gains toaccount for the Bank's accounting system lapses.
Exclusion of income from automated clearing house (ACH),central securities depository (CSD) and real time grosssettlement systems (RTGS) of Le2.04 billion to fees andcommission income; and reversal of prior year adjustment ofLe1.71 billion.
Exclusion of directors expenses of Le1.73 billion to otherexpenses; and inclusion of staff training of Le994 millionfrom other expenses.
Inclusion of directors expenses of Le1.73 billion frompersonnel expenses; and exclusion of staff training of Le994million to personnel expenses.
123
BANK OF SIERRA LEONE
NOTES TO THE FINANCIAL STATEMENTS (Contd)
36 FINANCIAL RISK MANAGEMENT
Introduction and overview
The Bank has exposure to the following risks from its use of financial instruments:
• credit risk• liquidity risk• market risks• operational risks
This note presents information about the Bank’s exposure to each of the above risks, the Bank’sobjectives, policies and processes for measuring and managing risk, and the Bank’s managementof capital.
Risk management framework
The Board of Directors has overall responsibility for the establishment and oversight of the Bank’sframework and has authorised the establishment of a Risk Management Function to ensure effectivedischarge of its risk oversight responsibility.
The Risk Management Function would be responsible for monitoring compliance with the riskmanagement policies and procedures, reviewing the adequacy of the risk management frameworkin relation to the risks faced by the Bank, the appropriateness and effectiveness of the Bank’srisk management systems and controls and also consider the implications of changes proposed toregulations and legislation that are relevant to the Bank’s risk management activity. The AuditCommittee is assisted in these functions by the Head of Internal Audit. The Head of InternalAudit undertakes both regular and ad-hoc reviews of risk management controls and procedures,the results of which are reported to the Audit Committee.
The Board Audit Committee is responsible for monitoring the Bank’s compliance with financialaccounting policies and pronouncements, keeping under review the appropriateness of theaccounting policies and internal controls systems, considering external auditors' report and alsoreviewing the resources, scope, authority and operations of the Internal Audit function. TheBoard Audit Committee is assisted in these functions by the Head of Internal Audit. The Head ofInternal Audit undertakes both regular and ad-hoc reviews or audits of management controls andprocedures, the results of which are reported to the Audit Committee.
(a) Credit risk
Credit risk is the risk of financial loss to the Bank if a customer or counterparty to afinancial instrument fails to meet its contractual obligations, and arises principally from theBank’s advances and other receivables. For risk management reporting purposes, theBank considers and consolidates all elements of the credit risk exposure including default risk.
The Bank grants advances mainly to the Government of Sierra Leone in its capacity asthe Government's bankers. The Bank of Sierra Leone Act specifies the credit limit andthe credit limit is strictly monitored to provide a safeguard against breach. The Governmentprovides a guaranty against the risk of failure to finance the facility; therefore credit risk inthis regard is considered to be minimal.
The Bank also pays keen attention to the quality of its investment portfolio making surethe bulk of its holdings/deposits are with triple "A" financial institutions.
124
ANNUAL REPORT AND STATEMENT OF ACCOUNTS
NOTES TO THE FINANCIAL STATEMENTS (Contd)
In thousands of Leones
(b) Liquidity risk
Liquidity risk is the risk that the Bank will encounter difficulty in meeting obligations from its financialliabilities that are settled by delivering cash or another financial assets.
Management of liquidity risk
The Bank’s approach to managing liquidity is to ensure, as far as possible, that it will always havesufficient liquidity to meet its liabilities when due, under both normal and stressed conditions, withoutincurring unacceptable losses or risking damage to the Bank’s reputation. The key elements of theBank’s liquidity strategy are as follows:
• Maintaining its diversified deposits base consisting of Government and multilateral agencies.
• Carrying a portfolio of highly liquid assets, diversified by currency and maturity.
• Monitoring liquidity ratios, maturity mismatches, behavioural characteristics of the Bank’sfinancial assets and financial liabilities, and the extent to which the Bank’s assets areencumbered and so not available as potential collateral for obtaining funding.
• Carrying out stress testing of the Bank’s liquidity position.
Management receives information from various Departments of the Bank regarding the liquidityprofile of their financial assets and liabilities and details of other projected cashflows. The liquidityrequirements of the Bank are met through short-term investment to cover any short-term fluctuationsand longer term funding to address any structural liquidity requirements.
(c) Market risks
Market risk is the risk that changes in market prices, such as interest rate, equity prices and foreignexchange rates will affect the Bank’s income or the value of its holdings of financial instruments. Theobjective of market risk management is to manage and control market risk exposures withinacceptable parameters, while optimizing the return on the investment.
Management of market risks
The Bank is exposed to exchange rate risk on its financial assets and liabilities denominated inforeign currencies. The safeguard against this risk is the holding of assets in various currencieswhich mitigates the risk.
The Bank is also exposed to interest rate risk on its foreign reserve deposits in instances where thecontract provides for the application of floating interest rates.
125
BANK OF SIERRA LEONE
NOTES TO THE FINANCIAL STATEMENTS (Contd)
39 SIGNIFICANT ACCOUNTING POLICIES
Except for the changes explained in Note 38 the Bank has consistently applied the followingaccounting policies to all periods presented in these financial statements.
Set out below is an index of the significant accounting policies, the details of which are available onthe pages noted:
(a) Foreign currency 56(b) Interest 57(c) Fees and commissions 57(d) Net exchange gains/losses 57(e) Lease payments 58(f) Income tax expense 58(g) Financial assets and financial liabilities 58(h) Cash and cash equivalents 59(i) Advances 60(j) Investment securities 60(k) Property, plant and equipment 61(l) Leased assets – lessee 61(m) Impairment of non-financial assets 62(n) Deposits 62(o) Provisions 62(p) Financial guarantees 63(q) Employee benefits 63(r) Capital and reserves 64(s) Amounts repayable under Repurchase Agreement (REPOs)/Reverse REPOs 64(t) Currency in circulation 65(u) Special drawing rights and International Monetary Fund (IMF) related transactions 65(v) Gold 65(w) Commitments on behalf of Treasury 65(x) Comparative 65
(a) Foreign currency
Transactions in foreign currencies are translated to the functional currency of the Bank at exchangerates at the dates of the transactions. Monetary assets and liabilitiesdenominated in foreign currenciesat the reporting date are re-translated to the functional currency at the exchange rates at that date.
Foreign currency differences arising on retranslation are recognised in the profit and loss accountas required by the Bank of Sierra Leone Act 2011, except for differences arising on the re-translationof available-for-sale equity instruments.at exchange rates at the dates of the transactions.Monetary assets and liabilities denominated in foreign currencies at the reporting date are re-translatedto the functional currency at the exchange rates at that date.
`Foreign currency differences arising on retranslation are recognised in the profit and loss accountas required by the Bank of Sierra Leone Act 2011, except for differences arising on the re-translationof available-for-sale equity instruments.
126
ANNUAL REPORT AND STATEMENT OF ACCOUNTS
NOTES TO THE FINANCIAL STATEMENTS (Contd)
(b) Interest
Interest income and expenses are recognized in the profit or loss account for all interest-bearinginstruments on accruals basis, using the effective interest rate method.
The recognition of interest ceases when the payment of interest or principal is in doubt; interestbeing included in income thereafter, only when it is received.
The effective interest rate is the rate that exactly discounts the estimated future cash payments andreceipts through the expected life of the financial asset or financial liability (or, where appropriate, ashorter period) to the carrying amount of the financial asset or financial liability.
The calculation of the effective interest rate includes all fees and interest paid or received, transactioncosts (which are incremental costs that are directly attributable to the acquisition, issue or disposalof a financial asset or financial liability) and discounts or premiums that are an integral part of theeffective interest rate.
Interest income and expense on all trading assets and liabilities are considered to be incidental to theBank’s trading operations and are presented together with all other changes in the fair value oftrading assets and liabilities in net trading income.
(c) Fees and commissionsFees and commissions that are integral to the effective interest rate on a financial asset or financialliability are included in the measurement of the effective interest rate.
Other fees and commission expense relate mainly to transaction and service fees, which are expensedas the services are received.
(d) Net exchange gains/losses
Net exchange gains/losses comprise gains less losses related to the translation of foreign monetaryassets and liabilities.
The US Dollar exchange rate policy of the Bank is flexible, which implies that the exchange rateis market determined. The exchange rate is calculated based on the weighted average rate ofcommercial Banks and foreign exchange bureaux for purchase transactions during the precedingfive business days and the weekly auction transactions if any. The Bank applies a +/- 1% spread onthe weighted average exchange rate derived to determine its official selling and buying rates.
The Bank collects/obtains the exchange rates (buying and selling) of the British Pound Sterling andother major international currencies from the Reuters website on daily basis. These are imputedinto an Excel spreadsheet maintained by the Bank. This is programmed to derive the exchange rateof all international currencies reference to the US Dollar.
Foreign exchange assets and liabilities are revalued on a daily basis. For the purposes of IMFassets and liabilities the bank applies the following rules:
127
BANK OF SIERRA LEONE
NOTES TO THE FINANCIAL STATEMENTS (Contd)
At least once every year, all Fund currency holdings are revalued based on the prevailingSDRexchange rate. The difference between the Fund’s currency holdings translated at the previousrate and the currency holdings valued at the new rate gives rise to currency valuation adjustments
(CVA) and is placed in a CVA account. This account records the amount which is payable to orreceivable from the Fund depending on whether the Leone has depreciated or appreciated vis-à-vis the SDR since the last revaluation. The CVA receivable payable is also part of the Fund’sholdings of currency and is also subject to maintenance of value obligations. From the Fund’sperspective, the total currency holdings remain the same in SDR terms, but the differences arisingfrom the revaluation give rise to a change in the currency terms, as reflected in the CVA accountbalance. The Bank records a CVA as either a payable or receivable from the Fund, with thebalancing elements treated,depending on the circumstances and legal requirement, as an expense(income), a charge against a reserve account, or a charge against the Government. Cumulativemaintenance of value chargesshould not be carried as an asset on the statement of financial position.
(e) Lease payments
Payments made under operating leases are recognised in profit or loss on a straight line basis overthe term of the lease. Lease incentives received (if any) are recognised as an integral part of thetotal lease expense, over the term of the lease.
The Bank held no finance leases during/at the end of the year.
(f) Income tax expense
In accordance with section 70 (3) of the Bank of Sierra Leone Act 2011, the profits of the Bankare not liable to Income Tax, or any other tax.
(g) Financial assets and financial liabilities
(i) Recognition
The Bank initially recognises advances and deposits on the date that they are originated.Allother financial assets and liabilities including assets and liabilities designated at fair valuethrough profit or loss are initially recognised on the trade date at which the Bank becomesa party to the contractual provisions of the instrument.
(ii) Derecognition
The Bank derecognises a financial asset when the contractual rights to the cashflows fromthe asset expire, or it transfers the right to receive the contractual cashflow on the financialasset in a transaction in which substantially all the risks and rewards of ownership of thefinancial assets are transferred.
The Bank derecognises a financial liability when its contractual obligations are dischargedor cancelled or on expiration.

128
ANNUAL REPORT AND STATEMENT OF ACCOUNTS
NOTES TO THE FINANCIAL STATEMENTS (Contd)
(iii) Offsetting
Financial assets and liabilities are set off and the net amount presented in the statement of financialposition when, and only when the Bank has a legal right to set off the amounts and intends either tosettle them on a net basis or to realise the asset and settle the liability simultaneously.
Income and expenses are presented on a net basis only when permitted under IFRS, or for gainsand losses arising from a group of related transactions in the Bank’s trading activity.
(iv) Amortised cost measurement
The amortised cost of a financial asset or liability is the amount at which the financial asset orliability is measured at initial recognition, minus principal repayments, plus or minus the cumulativeamortisation using the effective interest method of any differences between the initial amountrecognised and the maturity amount minus any reduction for impairment.
(v) Fair value measurement
The determination of fair value of financial assets and financial liabilities is based on quotedmarket prices or dealer price quotation for financial instruments traded in active markets. For allother financial instruments, fair value is determined using valuation techniques which in the judgementof the Board approximate the fair value.
(vi) Identification and measurement of impairment
At each financial position date the Bank assesses whether there is objective evidence that financialassets are impaired. Financial assets are impaired when objective evidence demonstrates that aloss event has occurred after the initial recognition of the asset, and that the loss event has animpact on the future cashflows of the asset and the same can be estimated reliably.
The Bank considers evidence of impairment at both specific asset and collective levelwhereappropriate. All individually significant financial assets are assessed for specific impairment.
All significant assets found not to be specifically impaired are then collectively assessed for anyimpairment that has been incurred but not yet identified. Assets that are not individually significantare collectively assessed for impairment by grouping together financial assets (carried at amortisedcost) with similar risk characteristics.
Impairment losses on assets carried at amortised cost are recognised in the statement ofcomprehensive income and reflected in impairment provisions account. When a subsequent eventcauses the amount of impairment loss to decrease, the impairment loss is reversed through thestatement of comprehensive income.
Any significant recovery in the fair value of an impaired available-for-sale equity security is recogniseddirectly in equity.

129
BANK OF SIERRA LEONE
NOTES TO THE FINANCIAL STATEMENTS (Contd)
(h) Cash and cash equivalents
Cash and cash equivalents include notes and coins on hand and balances with other foreignCentral Banks and highly liquid financial assets with original maturities of less than three months,which are subject to insignificant risk of changes in their value and are used by the Bank in themanagement of its short-term commitments.
Cash and cash equivalents are carried at amortised cost in the statement of financial position.
(i) Advances
Advances are non-derivative financial assets with fixed or determinable payments that are notquotedin an active market and that the Bank does not intend to sell immediately or in the nearterm.
Advances are initially measured at fair value plus incremental direct transaction costs, andsubsequently at their amortised cost using the effective interest method.
(j) Investment securities
Investment securities are initially measured at fair value plus incremental direct transaction costsand subsequently accounted for depending on their classification as either held-to-maturity, fairvalue through profit or loss, or available-for-sale.
(i) Held-to-maturity
Held-to-maturity investments are non-derivative assets with fixed or determinable paymentsand fixed maturity that the Bank has the positive intent and ability to hold to maturity, andwhich are not designated at fair value through profit or loss or available-for-sale.
Held-to-maturity investments are carried at amortised cost using the effective interestmethod. Any sale or reclassification of a significant amount of held-to-maturity investmentsnot close to their maturity would result in the reclassification of those investments asavailable-for-sale, and would prevent the Bank from reversing the reclassification for thecurrent and the following two financial years.
(ii) Available-for-sale
Available-for-sale investments are non-derivative investments that are not designated asanother category of financial assets. Unquoted equity securities whose fair value cannotbe reliably measured are carried at cost. All other available-for-sale investments arecarried at fair value.
Interest income (where applicable) is recognised in profit or loss using the effective interestmethod. Foreign exchange gains or losses on available-for-sale debt security investmentsare recognised in profit or loss.
Other fair value changes are recognised directly in equity until the investment is soldor impaired when the balance in equity is recognised in profit or loss.
130
ANNUAL REPORT AND STATEMENT OF ACCOUNTS
NOTES TO THE FINANCIAL STATEMENTS (Contd)
(m) Impairment of non-financial assetsThe carrying amounts of the Bank’s non-financial assets are reviewed at each reporting date todetermine whether there is any indication of impairment. If any such indication exists then theasset’s recoverable amount is estimated.
An impairment loss is recognised if the carrying amount of an asset or a cash-generating unitexceeds its recoverable amount. A cash-generating unit is the smallest identifiableasset group thatgenerates cashflows that largely are independent from other assets and groups. Impairment lossesare recognised in profit or loss. Impairment losses recognised in respect of cash-generating unitsare allocated first to reduce the carrying amount of any goodwill allocated to the units and then toreduce the carrying amount of the other assets in the unit on a pro rata basis.
The recoverable amount of an asset or cash-generating unit is the greater of its value in use and itsfair value less costs to sell. In assessing value in use, the estimated future cashflows are discountedto their present value using a pre-tax discount rate that reflects current market assessments of thetime value of money and the risks specific to the asset.
Impairment losses recognised in prior periods are assessed at each reporting date for any indicationsthat the loss has decreased or no longer exists. An impairment loss is reversed if there has been achange in the estimates used to determine the recoverable amount. An impairment loss is reversedonly to the extent that the asset’s carrying amount does not exceed the carrying amount that wouldhave been determined, net of depreciation or amortisation, if no impairment loss had been recognised.
(n) DepositsDeposits are initially measured at fair value including transaction costs, and subsequently measuredat their amortised cost using the effective interest method.
(o) ProvisionsA provision is recognised if, as a result of a past event, the Bank has a present legal or constructiveobligation that can be estimated reliably, and it is probable that an outflow of economic benefitswill be required to settle the obligation. Provisions are determined by discounting the expectedfuture cashflows at a pre-tax rate that reflects current market assessments of the time value ofmoney and, where appropriate, the risks specific to the liability.
A provision for onerous contracts is recognised when the expected benefits to be derived by theBank from a contract are lower than the unavoidable cost of meeting its obligations under thecontract. The provision is measured at the present value of the lower of the expected cost ofterminating the contract and the expected net cost of continuing with the contract. Before aprovision is established, the Bank recognises any impairment loss on the assets associated withthat contract.
131
BANK OF SIERRA LEONE
NOTES TO THE FINANCIAL STATEMENTS (Contd)
(p) Financial guarantees
Financial guarantees are contracts that require the Bank to make specified payments to reimbursethe holder for a loss it incurs because a specified debtor fails to make payment when due inaccordance with the terms of a debt instrument.
All financial guarantee liabilities are disclosed by way of notes in the financial statements and areonly included in other liabilities if the liability has crystallised or becomes probable that it willcrystallise.
(q) Employee benefits
(i) Short term benefits
Short term employee benefit obligations are measured on an undiscounted basis and areexpensed as the related services are provided.
A provision is recognised for the amount expected to be paid under short term cashbonus or profit sharing plans if the Bank has a present legal or constructive obligation topay this amount as a result of past service provided by the employee, and the obligationcan be reliably estimated.
(ii) Defined contribution plan
The Bank contributes towards a defined contribution plan. The plan is funded throughpayments to the National Social Security and Insurance Trust (NASSIT) Scheme. Thisdefined contribution plan is a Pension Scheme under which the Bank pays fixedcontributions into a separate entity. The Bank has no legal or constructive obligations topay further contributions if the Scheme does not hold sufficient assets to pay all employeesthe benefit relating to employee service in the current and prior periods and has no furtherpayment obligations once the contributions have been paid. The contributions arerecognised as employee benefits expense when due.
(iii) Defined benefit plan
The bank provides end-of-service benefits to its retirees. The entitlement to these benefitsis conditional on the completion of a minimum service period. End of service benefit is apost-employment benefit plan. The liability recognised in the statement of financial positionis the present value of the end-of-service benefits obligation at the reporting date, togetherwith adjustments for actuarial gains or losses and past service costs. The present value ofthe obligation is determined by discounting the estimated future cash outflows taking intoaccount average service period and salary increases and using interest rates of Governmenttreasury bonds that are denominated in Leones, the currency in which the obligation willbe paid and that matures in one year’s time. The calculation is performed by an actuaryusing the projected unit credit method.
The bank recognises all actuarial gains and losses for end-of-service benefits immediatelyin Other Comprehensive Income (OCI).
132
ANNUAL REPORT AND STATEMENT OF ACCOUNTS
NOTES TO THE FINANCIAL STATEMENTS (Contd)
(iv) Termination benefits
Termination benefits are payable when employment is terminated by the Bank before the normalretirement date, or whenever an employee accepts voluntary redundancy in exchange for thesebenefits. The Bank recognises termination benefits when it is demonstrably committed to terminatingthe employment of current employees according to a detailed formal plan without possibility ofwithdrawal. Benefits falling due more than 12 months after the reporting date are discounted topresent value.
(r) Capital and reserves
Share capital
The Bank classifies capital instruments as financial liabilities or equity instruments in accordancewith the substance of the contractual terms of the instruments. Sections 10(1) and 81 of theBank of Sierra Leone Act 2011 require that the minimum paid up capital of the Bank must beLe 125bn, to be subscribed within five years from commencement of the Act (that is commencing24 November 2011). The capital has been fully subscribed for as at year end.
(s) Amounts repayable under Repurchase Agreement (REPOs)/Reverse REPOs
REPO is an arrangement involving the sale for cash, of investment security at a specified pricewith a commitment to repurchase the same or similar securities at a fixed price either at a specificfuture date or at maturity.
For monetary purposes (liquidity management), the Bank from time to time mops up money fromthe financial market (REPO) or injects money into the market (Reverse REPO). The Bankengages in the above with commercial banks only.
When the Bank mops money from commercial banks, it creates a liability in its financial statementsand secures this borrowing (liability) by assigning part of the securitised debt holding to thecommercial banks it has mopped from. The commercial banks usually hold the investments tomaturity.
Similarly the Bank also lends money to commercial banks (reverse repo). In this process, theBank creates an asset in the financial statements and takes a security from the borrowing bankusually in the form of Treasury Bills or Bonds. The bank earns interest on this lending. Theinjected money stays with the borrowing bank until maturity.
(i) The bank treats reverse REPO as collateralised loans for accounting purposes. In thiscase, a reverse REPO is recognised as a secured advance and is shown separately asAdvance to Banks while repurchase agreements are shown as a liability in the booksof the Bank.
(ii) REPOs continue to be recognised in the statement of financial position and are measuredin accordance with the terms of the agreement.
(iii) The difference between sale and repurchase price is treated as interest expenditure andis recognised in the profit or loss.
133
BANK OF SIERRA LEONE
NOTES TO THE FINANCIAL STATEMENTS (Contd)
(t) Currency in circulation
Currency issued by the Bank represents a claim on the Bank in favour of the holder. Currency incirculation is recognised at face value in these financial statements. Bank notes and coins held bythe Bank as cash in main vault and with cashiers at the end of the financial year are excluded fromthe liability of notes and coins in circulation because they do not represent currency in circulation.
Bank notes printing expenses for each denomination which include ordering, printing, freight,insurance and handling costs are initially deferred. Based on the currency issued into circulation,the respective proportional actual costs incurred are released to the profit or loss from the deferredcost account. The stock is issued on a first in first out basis. The receipt of new notes and coinsare recorded in the vault register as stock and the movement accounted for as the notes and coinsare issued.
(u) Special drawing rights and International Monetary Fund Related transactions
The Bank, on behalf of the Government of Sierra Leone, manages assets and liabilities denominatedin Special Drawing Rights (SDRs) held with the International Monetary Fund (IMF). Exchangegains and losses arising from translation of SDRs at period ends are recognised in the statement ofcomprehensive income.
(v) Gold
Gold is held by the Bank as part of its foreign reserves and is classified as available-for-sale for thepurpose of measurement. Gold holdings are included in the statement of financial position at theprevailing closing spot market price on the London Bullion Market on that date. Foreign exchangegains and losses on gold holdings are transferred to the revaluation account.
(w) Commitments on behalf of Treasury
The Bank issues Treasury bills and bonds and capital commitments on behalf of Treasury. TheseTreasury Bills and Treasury bonds are not included in these financial statements as the Bank isinvolved in such transactions only as an agent.
(x) Comparatives
Where necessary, comparative figures have been adjusted to conform to changes in presentationin the current year. All adjustments of comparative figures are referred to as “restatements”.
134
ANNUAL REPORT AND STATEMENT OF ACCOUNTS
NOTES TO THE FINANCIAL STATEMENTS (Contd)
40 NEW STANDARDS AND INTERPRETATIONS NOT YET ADOPTED
A number of new standards, amendments to standards and interpretations are effective for annualperiods beginning after 1 January 2016, and have not been applied in preparing these financialstatements. Those that may be relevant to the Bank are set out below. The Bank does not plan toadopt these standards early.
(a) IFRS 9, Financial Instruments
IFRS 9, published in July 2014 and effective for reporting periods beginning on or after 1January 2018, introduces new requirements for the classification and measurement model offinancial assets and details, dependent on both the entity’s business model objective formanaging financial assets and the contractual cashflow characteristics of financial assets.
IFRS 9 removes the requirements to separate embedded derivatives from financial assetshost contract (it instead requires a hybrid contract to be classified in its entirety at eitheramortised cost or fair value). Separation of embedded derivatives has been retained forfinancial liabilities (subject to criteria being met).
The Bank is considering the impact of the standard on its reporting framework and willdetermine appropriate treatment in the 2017 financial statements.
Other standards which have been promulgated but not expected to have any significantimpact on the Bank’s financials include IAS 19, Defined Benefits Plans (Amended).