Embed Size (px)
Citation preview
HAL Id: hal-00918577https://hal-unilim.archives-ouvertes.fr/hal-00918577
Preprint submitted on 13 Dec 2013
HAL is a multi-disciplinary open accessarchive for the deposit and dissemination of sci-entific research documents, whether they are pub-lished or not. The documents may come fromteaching and research institutions in France orabroad, or from public or private research centers.
L’archive ouverte pluridisciplinaire HAL, estdestinée au dépôt et à la diffusion de documentsscientifiques de niveau recherche, publiés ou non,émanant des établissements d’enseignement et derecherche français ou étrangers, des laboratoirespublics ou privés.
Bank Regulatory Capital Adjustment and UltimateOwnership Structure: Evidence from European
Commercial BanksLaetitia Lepetit, Amine Tarazi, Nadia Zedek
To cite this version:Laetitia Lepetit, Amine Tarazi, Nadia Zedek. Bank Regulatory Capital Adjustment and UltimateOwnership Structure: Evidence from European Commercial Banks. 2012. �hal-00918577�
Electronic copy available at: http://ssrn.com/abstract=2080459
- 1 -
Bank Regulatory Capital Adjustment and Ultimate Ownership Structure:
Evidence from European Commercial Banks
Laetitia Lepetit, Amine Tarazi, Nadia Zedek*
Université de Limoges, LAPE, 5 rue Félix Eboué, 87031 Limoges Cedex, France
Preliminary draft : May 24, 2012
Please do not quote without the permission of the authors
Abstract
We empirically investigate whether a bank’s decision to recapitalize is influenced by its
ownership characteristics, particularly the separation between voting and cash-flow rights of
the bank's ultimate owner. We use a novel hand-collected dataset on bank ultimate control
and ownership structure of 442 European commercial banks to estimate an ownership-
augmented capital adjustment model. We find that when the ultimate owner’s voting and
cash-flow rights are identical, banks actively (as opposed to passively shifting earnings to
capital stock) and equally adjust their capital upwards (i.e. raise equity) and downwards (i.e.
repurchase equity) to reach their target level. However, a gap between voting and cash-flow
rights of the ultimate owner makes banks reluctant to actively adjust their capital position
upwards, presumably because they fear control dilution. Further investigation shows that such
a behavior is more pronounced if the ultimate owner is a family or a state, or if the bank is
headquartered in a country with weak shareholder protection. Our findings have several
policy implications on the road to the final stage of Basel III in 2019.
JEL Classification: G21, G28, G32
Keywords: Ownership structure, pyramids, regulatory bank capital, European banking,
adjustment speed, voting rights, cash-flow rights
*Corresponding author. Tel: + 33 5 55 14 92 51
E-mail addresses: [email protected] (L. Lepetit), [email protected] (A. Tarazi), [email protected] (N. Zedek)
Electronic copy available at: http://ssrn.com/abstract=2080459
- 2 -
1 Introduction
Bank capital plays a central role in bank regulation. The global financial crisis triggered in
2007 has led the Basel Committee on Banking Supervision (BIS, 2010a) to strengthen the
existing capital requirements and to improve the quality of regulatory capital. The definition
of Tier 1 regulatory capital has been narrowed by excluding preference shares that were
included in the previous (Basel II) definition of Tier 1 capital. To comply with these new
regulatory capital requirements, banks need to raise their equity capital or reduce their scale.
Although banks usually hold regulatory capital buffers (i.e. above the minimum requirements)
these changes raise an important question: how do banks adjust their capital depending on
their control and ownership structure? We specifically question how control and ownership
structure, namely the gap between voting and cash-flow rights of the ultimate owner, affect
the bank’s decision to adjust toward target capital.
It is well known that banks are often reluctant to raise equity capital. The arguments
provided by the existing theoretical and empirical literature regarding the reluctance of banks
to recapitalize focus on the costs related to raising equity. According to the pecking-order
theory, issuing new equity in the context of asymmetric information signals bad news to the
market (Myers & Majluf, 1984). This may lead to share price reductions affecting the bank’s
economic value negatively. Accordingly, banks rely more on internal funds and raise equity in
last resort. Altinkihc and Hansen (2000) also report higher transaction costs for equity
issuance (5.38% of the issue proceeds versus 1.09% for debt). Furthermore, increasing equity
requires a time delay which impedes immediate recapitalization (Peura & Keppo, 2006).
During this delay, banks might breach the minimum capital requirements. Hence, banks face
high costs due to increased regulatory intervention and surveillance (Peek & Rosengren,
1997), as well as liquidation and financial distress costs including the loss of charter value
(Keeley, 1990). Because of these adjustment costs, banks hold capital buffers and are likely to
adjust their capital ratios by modifying the size of their balance sheet. The empirical literature
on how banks manage their capital ratios provides ambiguous results. Ivashina & Scharfstein
(2010) show that banks preferred to cut their risky assets (new lending) instead of issuing new
equity during the 2008 financial crisis. Laderman (1994) finds that undercapitalized bank
holding companies decrease asset growth rather than issue new common stock, because
issuing new equity reduces shareholders’ wealth. Jacques and Nigro (1997) find that severely
undercapitalized banks increase their capital ratios by mainly reducing portfolio asset risk
- 3 -
because they face higher recapitalization costs. Conversely, Rime (2001) finds that Swiss
banks adjusted their regulatory risk-based capital ratios by increasing capital rather than
reducing asset risk due to the absence of a developed market for asset-backed securities in
Switzerland.
While there is a very large strand of literature that investigates why banks avoid
recapitalization, research on the driving forces behind banks’ decision to recapitalize is
relatively scarce. Managers/controlling shareholders may adapt their financing policies to
inflate their voting power and avoid the dilution of their control rights ((Stulz, 1988), (Harris
& Raviv, 1988)). Other studies investigate how firms choose between different equity issue
methods (for instance rights offerings and private placements). They find that family-
controlled firms favor rights offerings to avoid control threats (Cronqvist & Nilsson, 2005).
Focusing on banking firms, Hyun and Rhee (2011) theoretically show that if a bank’s decision
to recapitalize is made by existing powerful shareholders, it will satisfy the higher capital ratio
by reducing risky assets (especially loans) rather than by issuing new shares. Banks are
therefore likely to reduce loans in order to avoid ownership dilution of the existing
shareholders.
In our study, we build on the law and finance theory (La Porta et al., 1998) and
empirically test whether ownership characteristics affect the banks’ decision to recapitalize.
More precisely, we focus on the separation between voting and cash-flow rights of the
ultimate owner and examine whether banks controlled by a shareholder with and without
deviation between both rights behave differently in adjusting their capital ratios. The
performance of banks depends on the extent of the deviation between voting and cash-flow
rights (Azofra & Santamaria, 2011) and therefore banks' capital ratios might fluctuate and
adjust to their optimal levels differently. A controlling shareholder without deviation between
both rights is more oriented toward profit maximization and consequently has stronger
incentives to force the bank to adjust its capital ratio and maintain it at its optimal level,
regardless of the potential control and ownership dilution costs that may arise from
recapitalization. Conversely, a controlling shareholder with deviation between both rights is
more oriented to reap private benefits of control ((Bebchuk et al., 2000), (Claessens et al.,
2002)). Hence, we conjecture that a controlling shareholder with deviation between both
rights is more averse to control dilution leading her/him to curb recapitalization that could
dilute her/his controlling position by allowing a new shareholder’s entry that may contest
her/his current voting power.
- 4 -
We contribute to the existing literature in several directions. First, we compile new data
on ultimate control and ownership structure of 442 commercial banks across 17 European
countries. Unlike previous studies ((Caprio et al., 2007), (Laeven & Levine, 2009)), we
include both publicly listed and privately owned banks. We then compute the ultimate
owner’s voting and cash-flow rights following La Porta et al. (1999) and disentangle between
shareholders with and without separation between both rights. Second, we examine whether
such a separation affects a bank’s decision to recapitalize, a question which to our knowledge
has not been addressed before. For this purpose, we adapt a capital adjustment model used in
the literature and test for potential asymmetries in the adjustment speed toward long term
capital targets. Such asymmetries could possibly be the outcome of differences in
control/ownership dilution costs depending on the presence or absence of a gap between
ultimate owners’ voting and cash-flow rights. Hence, we contribute to the literature1
investigating differences in adjustment speeds by considering the impact of control/ownership
dilution costs beyond the well documented costs (transaction, asymmetric information and
regulatory costs). Third, by focusing on Europe we are able to draw policy implications for
bank regulators. Deviation between voting and cash-flow rights is more acute in Europe
compared to other countries (for instance the U.S.) with more diffused ownership (La Porta et
al., 1998). We hence carry out a study on European regulatory bank capital and provide
another driving factor behind the reluctance of banks to raise equity: ownership structure.
Finally, we contribute to the recent regulatory debate regarding the limitation of Tier 1
regulatory capital to ordinary shares and draw potential implications.
Our key findings are as follows. On the one hand, banks controlled by a shareholder
without separation between voting and cash-flow rights equally adjust their capital upwards
and downwards and do not appear to fear control dilution. On the other hand, banks controlled
through a gap between both rights adjust their capital downwards identically to banks without
such a gap but are reluctant to actively adjust their capital position upwards. This finding
suggests that banks controlled through separation between both rights fear control dilution
and consequently curb recapitalization. Furthermore, we find that the fear of control dilution
is more pronounced if the shareholder is a family or a state or when the bank is established in
a country with weak shareholder protection.
The remainder of the paper proceeds as follows. In section 2, we present our research
hypotheses. Section 3 describes the data, defines ownership variables and provides some
1 See (Flannery & Rangan, 2006), (Berger et al., 2008), (Jokipii & Milne, 2011), (Memmel & Raupach, 2010) and (Byoun, 2008).
- 5 -
descriptive statistics. In section 4, we specify the model used to test our hypotheses. Section 5
provides estimation results. In section 6, we carry out some extensions and perform
robustness checks. Section 7 concludes.
2 Research hypotheses
In this paper, we build on two strands of the literature: the bank capital ratio adjustment
literature and the corporate governance and ownership structure literature.
Banks face a trade-off when they choose the appropriate level of their capital ratios. On
the one hand, banks have to hold a minimum level to comply with regulatory requirements
and to satisfy market participants (market discipline). On the other hand, banks are also
expected to maximize the return to shareholders. This leads them to a target capital ratio.
Previous studies find evidence of such a target and argue that bank capital ratios do not
fluctuate randomly ((Memmel & Raupach, 2010), (Berger et al., 2008), (Flannery & Rangan,
2008)). However, positive (negative) random shocks may affect bank capital ratios leading to
positive (negative) deviations of the capital ratio from the target level. Consequently, bank
management is expected to periodically adjust the capital ratio. When a positive exogenous
shock leads to a positive deviation of the current capital ratio from its target value, bank
insiders will decrease the current capital ratio to adjust to the target. This can be achieved via
a combination of equity repurchase, an increase in dividend payment, or an upward
adjustment in asset size (or in risk-weighted assets). In the event of a negative shock the bank
will need to issue new equity, decrease its dividend payment, or decrease its asset size (or
risk-weighted assets). For the controlling shareholder recapitalization (equity issues) may
dilute both the control and cash-flow (dividend) rights whereas equity repurchase may
reinforce both rights. We therefore expect that the behavior of banks in terms of capital
adjustment will be influenced by their control/ownership characteristics. Hence, beyond the
costs highlighted in the literature (transaction, asymmetric information and regulatory costs),
we conjecture that banks will also consider potential control and/or ownership dilution costs
against operating with a suboptimal capital ratio (below or above the target capital ratio).
Using the law and finance theory (La Porta et al., 1998), we consider in our analysis two
kinds of shareholders that may potentially behave differently when capital levels move above
or below their target level. Many studies focus on the separation between voting and cash-
- 6 -
flow rights of the controlling shareholder2. A shareholder may control/hold a company
without any discrepancy between voting (i.e. the right to control) and cash-flow (i.e. the right
to earn dividends) rights. However, pyramidal ownership structures, dual class shares and
cross-holding mechanisms allow large shareholders to exercise effective control over a
company with a relatively small stake of cash-flow rights (Bebchuk et al., 2000), i.e. control
the company with a large gap between voting and cash-flow rights.
Previous studies argue that fi rms controlled by a shareholder without separation between
voting and cash-flow rights exhibit higher performance ((Azofra & Santamaria, 2011),
(Claessens et al., 2002)). Thus, a shareholder without separation between both rights has
stronger incentives to achieve better performance and is more likely to timely adjust the
bank's capital closely to its optimal level. Such a shareholder is expected to adjust the capital
ratio in both directions: upwards (i.e. equity issues) and downwards (equity repurchases). In
addition, such a shareholder may have lower incentives to curb recapitalization through new
equity issue because the positive effect of recapitalization (moving to the target capital ratio)
might outweigh its potential negative effect (loss in dividends).
Hypothesis 1.a (H1.a): Banks controlled by a shareholder with equal voting and cash-flow
rights adjust their capital regardless of their initial position; i.e. above (equity repurchase) or
below (equity issue) the target capital ratio.
Hypothesis 1.b (H1.b): When there is no difference between the ultimate owner’s voting and
cash-flow rights, upward and downward equity adjustments are identical. Such a shareholder
equally weighs equity issues and repurchases.
A broad literature argues that deviation between voting and cash-flow rights leads to
poorer performance. This is due to the ability of the controlling shareholder to expropriate
minority shareholders without bearing the financial costs of expropriation 3 ((Azofra &
Santamaria, 2011), (Claessens et al., 2002)). Thus, a controlling shareholder with separation
between both rights is less oriented toward profit achievement and is consequently expected
to have lower incentives to adjust the bank's capital ratios and operate with a target.
Furthermore, such a shareholder will differently weigh equity issues and repurchases. It could
be argued that, to raise equity capital, such a shareholder could provide the required equity 2 See (La Porta et al., 1999), (Claessens et al., 2000), (Claessens et al., 2002), (Faccio & Lang, 2002), (Almeida & Wolfenzon, 2006), (Boubakri & Ghouma, 2010), (Almeida et al., 2011), (Anon., n.d.), (Azofra & Santamaria, 2011)… 3 Many studies argue that expropriation is costly (Maury & Pajuste, 2005), (La Porta et al., 2002), (Burkart et al., 1998).
- 7 -
itself or take it from any entity she/he controls in the pyramid (Almeida & Wolfenzon, 2006).
However, this may increase the proportion of cash-flow rights held in the bank leading to high
expropriation costs ((La Porta et al., 2002), (Maury & Pajuste, 2005)). Furthermore, entities
located at the bottom of the pyramid, i.e. with deviation between control and ownership, are
generally less profitable (Almeida et al., 2011). This may reduce the controlling shareholder’s
incentives to increase-by providing new equity- her/his cash-flow rights in such entities. The
other option to recapitalize is to issue new equity to outsiders. However, this may dilute both
the control and dividend rights of the controlling shareholder if she/he has lower cash-flow
rights than voting rights. Assuming that recapitalization is made by issuing common shares
that provide one share one vote, ownership dilution is less constraining for such a shareholder
since her/his ownership share is in general very small. For example, in the case of Spain,
Azofra and Santamaria (2011) find that whenever there is a gap between voting and cash-flow
rights of the controlling shareholder, her/his cash-flow rights reach on average only 17%
while the voting rights rise to 81%. In contrast, the dilution of voting rights is more
troublesome. The entry of a new shareholder with a considerable voting power could contest
the current controlling shareholder. The literature distinguishes two potential situations. First,
if the new shareholder colludes4 with the current controlling shareholder to expropriate
minority shareholders ((Shleifer & Wolfenzon 2002), (Laeven & Levine, 2008)), the latter
would have to share with the former the diverted resources that she/he would have solely
pocketed in the absence of the new shareholder. Second, if the new shareholder monitors the
current controlling shareholder ((Maury & Pajuste 2005), (Pagano & Röell, 1998),
(Bennedsen & Wolfenzon, 2000), (Gomes & Novaes, 2001)), the latter would not be able to
divert resources as easily as before. In any case, the current shareholder has something to lose
and her/his loss will not be offset by the positive outcomes of recapitalization (moving to the
target level) as her/his cash-flow rights are very limited in the bank. If such banks feel the
need to adjust their capital ratios because of extra pressure from regulators or from the
market, it might be optimal for them to increase their capital ratios by selling assets instead of
raising equity.
Hypothesis 2 (H2): Banks with and without divergence between voting and cash-flow rights
behave identically when they face a surplus in capital: the downward adjustment speed toward
the target is the same for both types of banks. 4 The literature on complex ownership structures argues that coalitions may increase the efficiency of expropriation by reducing expropriation cost (Maury & Pajuste, 2005). However, the resulting benefit from increased expropriation efficiency might not always compensate the loss in the diverted share for the current controlling shareholder.
- 8 -
Hypothesis 3 (H3): When there is divergence between voting and cash-flow rights, the
adjustment speed toward the target capital is asymmetric: slow if the bank needs to raise
equity and fast if it has to decrease equity.
3 Data, Ultimate Ownership Variables and Descriptive Statistics
3.1 Sample
Our sample covers 442 commercial banks across 17 Western European countries5. Data
on bank balance sheets and income statements come from Bankscope while data on bank
ultimate ownership and control are collected from several sources: Bankscope, Amadeus and
annual reports. We also use the World Bank database to collect our macroeconomic
indicators. We identify in Bankscope 1533 commercial banks for which income statements
and balance sheets are provided for the 2002–2010 period. We use consolidated data but also
refer to unconsolidated statements when consolidated data are not available. Among these
1533 commercial banks, information on risk-based Tier 1 capital ratio was missing for 1047
banks. This leaves us with 486 commercial banks. We further delete 8 banks for which the
Tier 1 risk-based capital ratio is greater than 40%. We also omit 8 other banks involved in
mergers and acquisitions6. Hence, we end up with a sample of 470 commercial banks. We
then move to construct the control chains of these banks.
3.2 Building of Control C hains
Based on this sample of 470 banks, we gather data on bank ultimate control/ownership.
We start by collecting information on direct ownership from Bankscope. For incomplete
information or information not available in Bankscope, we search in annual reports. We
classify a bank as a controlled bank if it has at least one shareholder with direct voting rights
that sum up to 10% or more7. This control level is used because it provides a significant
threshold of votes and most of our sample countries mandate disclosure of at least 5% of
ownership8. In addition, this control level is more accurate in the case of banks due to greater
5 These countries are: Austria, Belgium, Denmark, Finland, France, Germany, Greece, Ireland, Italy, Luxembourg, Netherlands, Norway, Portugal, Spain, Sweden, Switzerland and United Kingdom. 6 We identify all banks for which total asset growth rate is greater than 35%. Then we check in Bankscope if such a bank experienced a merger-acquisition event. This applies to 8 banks. 7 As a robustness check, we carry out the same analysis by considering 20% as a control threshold. 8 For example in France, Germany and Spain, owners that hold more than 5% must disclose their identity. The disclosure threshold is 2% in Italy and 3% in the United Kingdom.
- 9 -
diffusion of ownership compared to non-financial firms ((Prowse 1995), (Faccio & Lang,
2002)). Out of 470 commercial banks, we have 40 banks that are widely-held (i.e. no
shareholder controls 10% or more) and 430 are controlled banks. To build the control chains,
we focus on these 430 controlled banks. If the controlling shareholder is independent, i.e.
she/he is not controlled by another shareholder, we consider her/him as the ultimate owner of
the votes. If, however, the controlling shareholders identified at this stage are themselves
corporations, we continue the process and identify large shareholders (control 10% or more)
in these corporations until we find the ultimate owners of the votes. We are not able to
complete the full process for 28 banks because of lack of data. Hence, we end up with a final
sample of 442 commercial banks. Most of our data on ownership structure are for 2007 and
2008. We occasionally use observations from 2005, 2006, 2009 and 20109. Previous studies
argue that ownership patterns are relatively stable over time ((La Porta et al., 1999), (Caprio
et al., 2007), (Laeven & Levine, 2008)). We therefore do not view this as a serious
shortcoming to perform our analysis where the focus is on a dummy variable that captures the
presence or absence of a gap between control and ownership (control-ownership wedge).
Once we get our control chains, we classify the ultimate owners of the controlled banks into
four main categories: BANK if the ultimate owner is a widely-held bank, FAMILY if the
ultimate owner is an individual or a family, STATE if the ultimate owner is a state or a public
authority, and finally the category OTHER which includes the other types of ultimate owners
(Industrial firm, financial and insurance companies, Mutual and Pension funds, Foundations
and Research institutes, Managers and finally Cross-holdings) 10.
Table 1 presents the distribution of European commercial banks by country as well as the
representativeness of our final sample. To assess the representativeness of our sample, we
compare the aggregate total assets of sample banks in a given country to the aggregate assets
of all the banks covered by Bankscope in the same country. On average our final sample
accounts for more than 50% of total bank assets in every country except for Austria
(43%).Table 2 presents some general descriptive statistics for both the full sample available in
Bankscope and our final sample. It shows no major differences between the two samples.
[Insert Tables 1 and 2 about here]
9 Observations on ownership are respectively 48%, 29%, 11%, 6%, 4% and 2% for 2007, 2008, 2009, 2010, 2006 and 2005. 10 We consider the classification provided in Bankscope.
- 10 -
3.3 Measuring Ultimate Ownership
To investigate the potential asymmetries in the dynamics of bank capital depending on the
presence or the absence of control-ownership deviation, we compute the voting and the cash-
flow rights of the ultimate owner. For this purpose, we use the last link principle method
initially proposed by (La Porta et al., 1999).This method is described below.
Voting Rights (VR) and Cash-Flow Rights (CFR)
The controlling shareholder can control (hold) a bank directly and/or indirectly. The
voting rights (cash-flow rights) of the controlling shareholder are the sum of direct and
indirect control (ownership) in the bank. Direct control (ownership) involves shares registered
in the controlling shareholder’s name. Indirect voting rights (cash-flow rights) involve bank
shares held by entities that the ultimate owner controls.
For example, assume that UO is the ultimate owner of bank B and the control chain from UO
to B is a sequence of two other corporations C1 and C2 (each entity in the control chain holds
10 per cent or more of voting rights over the next one). Assume UO holds 10% in C2, C2
holds 20% in C1 which in turn holds 30% in the bank (B), i.e. the control chain is presented as
follows , indirect voting rights of UO computed on
the basis of the last link principle method are equal to 30% whereas the cash-flow rights are
equal to 0.6%, i.e. 10%*20%*30%. If the ultimate owner controls bank B through multiple
chains, we sum the voting rights (cash-flow rights) across all of these chains. Suppose that
UO controls (holds) directly an additional proportion of 40% in bank B, the voting rights of
UO are equal to 70%, i.e. whereas the cash flow-rights are 40.6%, i.e. . If the bank is widely-held or in the case of cross holdings we set its
voting rights (cash-flow rights) equal to zero. When multiple shareholders have 10% or more
of the votes in the bank, we define the controlling shareholder as the owner with the greatest
voting rights.
Divergence between Voting and Cash-Flow Rights (WEDGE)
Substantial discrepancies between voting and cash-flow rights may exist in the presence
of indirect control chains. In our analysis we define the control-ownership deviation as the
difference between the voting and the cash-flow rights (WEDGE) (La Porta et al., 1999). We
- 11 -
note W the dummy variable equal to one if WEDGE is not null, and zero otherwise. In the
previous example, WEDGE is equal to 29.4%, i.e. 70%-40.6%.
Appendix A reports some examples on the control chains and the calculation of the voting
and the cash-flow rights using a 10% control threshold as well as a 20% control level.
3.4 Ultimate Ownership in Western Europe and Descriptive Statistics
Panel A of Table 3 reports the composition of our sample according to ownership
structure using a control threshold of 10%. Our data show that 89% of European commercial
banks are controlled by at least one shareholder whereas widely-held banks account only for
11%. This sample composition allows us to easily test our hypotheses. The data also suggest
that the nature of controlling shareholders is diverse. On average, widely-held banks (BANK)
control 38% of the banks in our sample. Further, individuals/families (FAMILY) and
government (STATE) are important owners in our sample of European banks. They control
21% and 14% of banks respectively. When we divide our sample in two subsamples
depending on the presence or the absence of the separation between VR and CFR, we observe
that more than 44% of the controlled banks have an owner with control-ownership deviation.
Besides, we notice that FAMILY ownership and STATE ownership prevail in the subsample
where the ultimate owner exerts control through control-ownership gap. They respectively
control 27% and 24% of the banks with control-ownership divergence against 17% and 7% of
the banks without such divergence. This finding is consistent with the view that divergence
between control and ownership could enable ultimate owners and especially families to
expropriate minority shareholders and divert a large fraction of resources (Almeida &
Wolfenzon, 2006). In contrast, widely-held banks (BANK) control 53% of the banks without
control-ownership deviation and only 19% of the banks with such a deviation. This is
consistent with the view that widely-held banks are less likely to engage in expropriation as
the resulting benefits are distributed among multiple owners and because regulation makes
expropriation more costly (Haw et al., 2010).
[Insert Table 3 about here]
On the whole, the descriptive statistics reported in Table 4 show that banks controlled
through different rights hold lower Tier 1 risk-based capital ratios, are less profitable and rely
more on credit activities. Furthermore, the proportion of banks with equal rights that pay
dividends is higher than that of banks with different rights. The latter might pay lower
- 12 -
dividends to more easily adjust their capital ratios via internal funds, or because of the effect
of expropriation (Faccio et al., 2001). Finally, our data show that on average, the ultimate
owner holds almost 57% of equity capital (equivalent to 70% if we focus only on controlled-
banks) when the gap between both rights is zero. This high percentage (70%) is consistent
with the presumption that a controlling shareholder with equal rights is more inclined toward
profit maximization (Azofra & Santamaria, 2011). In contrast, a controlling shareholder with
different rights holds on average around 19% (CFR) and controls 84% (VR). On average, the
wedge between VR and CFR is 65%. These figures suggest that when there is a gap between
both rights, the controlling shareholder is more inclined to protect her/his voting rights rather
than her/his cash-flow rights as the latter are almost three times lower than the former.
We now move to the approach we follow to investigate the impact of ownership structure
and divergence between VR and CFR on banks' capital adjustments.
[Insert Table 4 about here]
4 Methodology
In this paper we aim to investigate how banks adjust their Tier 1 capital ratio depending
on their control/ownership pattern. Banks have two main channels to adjust their capital
ratios: the liability side, i.e. changes in capital and the asset side, i.e. adjustments in asset size
or risk-weighted assets. To test our hypotheses, we adapt a capital adjustment model
commonly used in the literature to focus only on adjustments through the liability side
(changes in capital). We also introduce flexibility to allow for asymmetric upward and
downward capital adjustment rates depending on the presence or absence of a gap between
voting and cash-flow rights of banks’ ultimate owners. Asymmetries in capital adjustment
rates possibly reflect differences in the cost of control dilution stemming from
recapitalization. Hence, if a bank adjusts its capital at the same rate when it faces an upward
or downward change, we would presume that such a bank does not fear control/ownership
dilution. If a bank adjusts its capital at a lower rate when it needs to increase capital (upwards)
than when it has to reduce it (downwards) we conjecture such a behavior is driven by the fear
of control/ownership dilution and that the bank will most likely move to the target by
adjusting the asset side of the balance sheet (by selling assets or reshuffling its asset portfolio
by substituting safe assets to risky assets).
- 13 -
4.1 Baseline Capital Adjustment Model
Based on previous studies ((Berger et al., 2008), (Byoun, 2008), (Flannery & Rangan,
2006)), we consider the following capital partial adjustment model:
[( ) ] (1)
Where refers to the book value of capital for bank i at time t, measured as Tier 1
regulatory capital (T1). is either bank total assets (TA) or risk-weighted assets (RWA). is the target (desired) Tier 1 simple (non risk-based) or risk-based capital ratio for
bank i at time t, depending on the definition of we consider. is the adjustment
model’s starting point. The right-hand side of equation (1) corresponds to the required change
in bank capital to adjust to the target whereas the left-hand side is the observed change in
bank capital, i.e. the amount of bank capital devoted to adjust to the target between t-1 and t.
Hence, in this specification, the coefficient represents the capital adjustment speed, i.e. the
proportion a bank adjusts via capital changes to move to the target level.
The observed change in bank capital in equation (1) can arise from passive management, i.e.
shifting earnings to the stock of capital in the preceding period or active management, i.e. a
change in dividend policy and equity issues/repurchases. To distinguish between these two
alternatives, we consider two different definitions for . First, is defined as ,
i.e. the lagged value of . In this case, the left-hand side of equation (1) is the sum of both
passive and active changes in bank capital (i.e. the whole change). The second definition for allows us to isolate the active change in bank capital, i.e. equity issues/repurchases11. is therefore computed as the sum of the lagged value of Tier 1 regulatory capital ( )
and the current net income ( ) minus the current dividend payment ( ). Formally,
considering this second definition is computed as follows:
(2)
11 Note that in this study, active adjustment in bank capital refers to equity issues/repurchases solely and excludes the change in dividend policy (payout ratio). Our aim is to focus on external capital adjustment.
- 14 -
By dividing both sides of equation (1) by , we specify the capital partial adjustment
model as follows:
(3)
Where: , the Actual Deviation and , the Target
Deviation.
4.2 Ownership Augmented Capital Adjustment Model
To test our hypotheses, we allow the capital adjustment speed ( ) in equation (3) to be
asymmetric with regards to upward and downward adjustments depending on the presence or
the absence of a deviation between the ultimate owner’s control and ownership. We therefore
specify the following estimation model:
(4)
Where is a dummy variable equal to one if the bank needs to increase capital or
decrease its assets (risk-weighted assets) to move toward the target, and zero otherwise. is
a dummy variable equal to one if the bank is controlled by a shareholder with a gap between
voting and cash-flow rights, and zero otherwise.
The parameters and refer to banks with no divergence between control and
ownership ( =0). They measure the proportion of capital used to adjust to the target either
downwards ( ) or upwards ( ). Consistent with hypothesis
(H1.a), we expect the parameters and to be positive and significant. If there is no fear
of control/ownership dilution consistent with hypothesis H1.b we expect the coefficient to
be non-significantly different from zero, i.e. such banks devote the same proportion of capital
to adjust to the target upwards and downwards. The coefficients and respectively correspond to downward and upward adjustment rates of banks with control-
ownership wedge ( =1). Consistent with hypothesis (H2), we expect the coefficient to
be statistically non-significant, i.e. banks with and without deviation between both rights
adjust their capital at the same rate when they need to reduce it. If the controlling shareholder
with control-ownership wedge fears the dilution of her/his control power, according to
hypothesis (H3) the coefficient is expected to be negative and significant. In the extreme
case, the sum could be equal to zero which would mean that banks with
control-ownership wedge do not at all increase their capital to move to the target level.
- 15 -
Table B.1 in appendix B summarizes the expected sign and the relative magnitude of the
adjustment speed under each case.
4.3 Estimating the Target Capital Ratio
We recall that
in equation (1) is not observable. Thus estimating the target capital
ratio
is a prerequisite to our analysis. We use several proxies to obtain fitted values of
.
First, we use the following partial adjustment model:
(5)
Where is the book value of Tier 1 regulatory capital ( ) divided by either total assets
(T1_TA) or risk-weighted assets (T1_RWA). is the vector of coefficients to be estimated.
is the speed of adjustment. is the lagged Tier 1 capital ratio and is the error term. is the matrix of a set of observable variables commonly used in the previous literature
on the determinants of optimal bank capital ratios. Table C.1 in Appendix C describes these
variables.
Second, we estimate
considering the following complete adjustment model:
(6)
Where is the error term.
5 Results
In this study, we aim to test for the presence of potential asymmetries in banks' capital
adjustment depending on their ownership structure. We proceed in two steps. In the first step,
we estimate the target capital ratio
. For this purpose, we use two models: a partial and a
complete adjustment model. We estimate the partial adjustment model specified in equation
(5) using the Generalized Method of Moments (GMM) estimator developed for dynamic
models by (Arellano & Bond, 1991). The complete adjustment model specified in equation
(6) is estimated using random effects estimator. The results obtained for this first step are
- 16 -
reported in Table 5. Table D.1 in appendix D reports the correlation matrix of the explanatory
variables used in this step. On the whole, the correlation coefficients are low. To deal with
multi-colinearity issues, we orthogonalize the natural logarithm of assets (LN_TA) on charter
value (CV) and the return on assets (ROA) on the cost of equity (COST_EQ).
[Insert Table 5 about here]
In the second step, we replace in equation (4) the target capital ratio
by its fitted
value obtained from the first step estimation, compute both the target deviation ( ) and
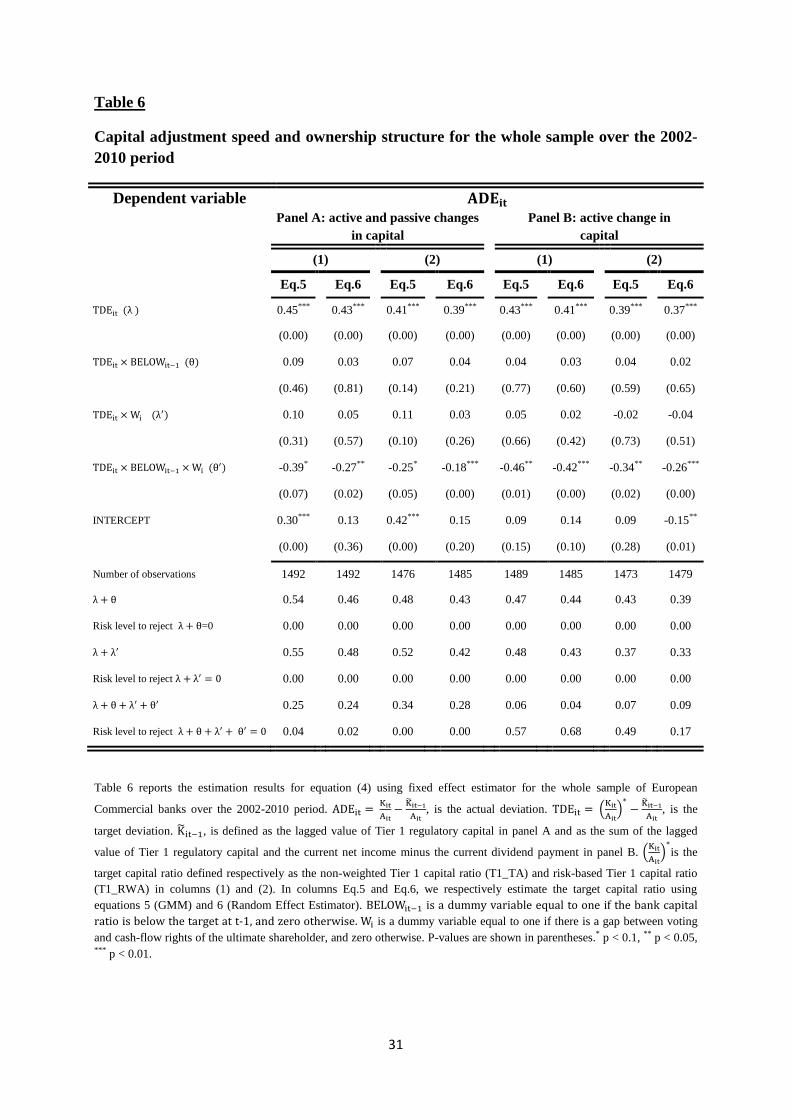
the actual deviation ( ) and estimate equation (4) using fixed effects estimator12. Table 6
reports the results obtained from this second step estimation. Panel A of Table 6 reports
estimation results of equation (4) considering both passive and active components of bank
capital. Panel B presents estimation results focusing only on the active variation in Tier 1
capital.
[Insert Table 6 about here]
We first interpret the results in Panel B. The parameters estimates and are both
positive and highly significant. They range from 0.37 to 0.43 and from 0.39 to 0.47
respectively. As expected, the coefficient of the interaction term is
statistically non-significant. These results confirm the predictions of hypotheses H1.a and
H1.b. Banks controlled by a shareholder with equal rights adjust their capital upwards ( )
and downwards ( ) at the same rate ( ). Such banks actively manage their capital and fill
almost half of the required change in capital through equity issues/repurchases. For banks
controlled by a shareholder with a gap between both rights, the parameter estimate (downward adjustment) is highly significant and ranges from 0.33 to 0.48, while the
parameter estimate (upward adjustment) is significantly lower (between 0.04
and 0.09). The Wald-test indicates that the latter is statistically non-significant. Consistent
with hypothesis H2, such banks adjust their capital identically to banks without control-
ownership gap ( ) when they need to repurchase equity. Conversely, such banks are
reluctant to actively adjust their position when they have to issue equity, possibly because of
the fear of control dilution.
12 We favor this estimator because previous studies (Gropp & Heider, 2011) argue that fixed effects contribute to explain the adjustment speed. We also perform the regressions using OLS and Random Effects estimators. The results, not reported here, are almost similar.
- 17 -
Regarding Panel A of Table 6 (both active and passive changes in bank capital) the results
again show that banks controlled through equal rights (voting and cash-flow) symmetrically
adjust their capital upwards and downwards ( and are both positive and significant,
is statistically non-significant). Banks controlled via discrepancy between both rights adjust
their capital upwards ( ) and downwards ( ) although the upward
adjustment rate is lower (24%-34% versus 42%-55% for downward adjustment). This finding
suggests that such banks counterbalance their reluctance to actively adjust their capital
upwards by passively managing their capital (i.e. earnings retention or a decrease in dividend
payment).
In summary, the results show that the dynamics of bank Tier 1 capital are actually
influenced by the presence or absence of a deviation between the ultimate owner’s voting and
cash-flow rights. Banks with equal rights of the ultimate owner are found to adjust their
capital at the same rate regardless of their initial position (below or above the target level).
Conversely, banks with deviation between voting and cash-flow rights significantly adjust
their capital only when they need to reduce it to move closer to the target level. When the
adjustment process requires an increase in capital, such banks tend to passively adjust their
position, possibly because of the fear of control dilution. Our findings also indicate that such
“specific” banks prevail in Europe (around 50% of the banks in our sample are controlled
through deviation between both rights). Such institutions rely more on traditional
intermediation activities (loans), and contribute up to 50% of total loans granted to the
economy as a whole13. Our results suggest that to preserve their control, banks with
divergence between voting and cash-flow rights are reluctant to actively manage their Tier 1
regulatory capital upwards. Given this finding, we presume that such a behavior might be
more pronounced under Basel III as the Basel Committee has narrowed the definition of Tier
1 capital to ordinary shares only. Because such banks are less able to actively adjust their Tier
1 capital without incurring changes in voting rights, they might increase their reliance on
passive adjustments and asset downsizing. Given their prevalence in Europe and their
important contribution to the economy as major lenders our findings have important policy
implications.
13 For more details se table E.1 in appendix E.
- 18 -
6 Deeper Investigation and Robustness Checks
In this section, we first make some extensions to go deeper in our investigation and then
carry out some robustness checks.
6.1 Extensions
Our main results support the conjecture that controlling shareholders with deviation
between voting and cash-flow rights avoid recapitalization to preserve their control. We now
go further by analyzing the conditions under which the fear of control dilution is more or less
pronounced. We consider shareholder type and shareholder protection.
Capital Adjustment and Ultimate Controlling Shareholder Type
The fear of control dilution may be stronger if the controlling shareholder is a family or a
state and weaker if the controlling shareholder is a bank or other categories. The literature
argues that the deviation between both rights attracts families and states if these expect
diverting higher resources (Almeida & Wolfenzon, 2006). Cronqvist and Nilsson (2005) find
that family-controlled firms avoid equity issuing methods that may dilute their control
benefits or impose more monitoring on them. Thus, family and state controlled banks are
expected to have significant incentives to influence capital adjustment decisions that could
threaten their control position.
To test this hypothesis, we split the full sample into two subsamples based on the type of
the controlling shareholder. We isolate family and state ownership from other categories
(BANK, OTHER). We run regressions separately on the two subsamples. The results
regarding the estimation of the target capital ratio, not reported here, are similar to those
previously obtained. The results for the adjustment speed on both subsamples are presented in
Table 7.1 and Table 7.2. For the subsample of banks controlled by a family or a state (Table
7.1), the findings are almost similar to those previously obtained, i.e. unlike banks controlled
by a shareholder with equal rights, banks controlled by a shareholder with a gap between both
rights differently weigh increases and decreases in capital. Regarding the subsample of banks
controlled by a bank or any other category (different from a family and a state), again, banks
with no gap between both rights do not distinguish between increases and decreases in capital
and adjust their capital in both cases. However, unlike the results obtained on the previous
subsample (family or state), banks with deviation between VR and CFR adjust their capital
- 19 -
both upwards and downwards although the upward adjustment rate is lower. The results in
Panel B of Table 7.2 show that the adjustment rate for such banks when they face a shortage
in capital ranges from 10% to 20%. The Wald test indicates that this capital adjustment is
significantly different from zero (except in column (1) Eq.6). These results are consistent with
our predictions that family and state ultimate owners have stronger incentives protect their
control compared to other categories.
Capital Adjustment and Shareholder Protection
We further test how shareholder protection rights may affect the relationship between
capital adjustment and ownership structure. Expropriation is more likely to occur in countries
with weak shareholder protection (La Porta et al., 2002). Hence, we conjecture that the
controlling shareholder with different VR and CFR might be more reluctant to raise equity in
countries with low shareholder protection. This is because control in such countries is more
valuable in the sense that a controlling owner can divert significant resources and protect
herself/himself from becoming a minority shareholder and suffer expropriation.
To examine this hypothesis, we again split the full sample into two subsamples based on
the cross-country median value of the shareholder protection index14. We perform regressions
on these two subsamples. Estimating the target capital ratio, not reported here, again yields
similar results as before. Table 8.1 and Table 8.2 illustrate respectively the estimation of
equation (4) for the subsamples with weak and strong shareholder protection. The results
reported in Table 8.1 confirm those previously obtained. Banks controlled through equal
rights adjust their capital upwards and downwards at the same rate. However, in the presence
of a gap between both rights, banks do adjust their capital downwards but are reluctant to
adjust it upwards. The results shown in Table 8.2 indicate that banks with deviation between
VR and CFR and established in countries with good shareholder protection adjust their capital
even when they face a capital shortage. This result is consistent with our prediction: in
countries with good shareholder protection the fear of control dilution is tempered,
consequently banks with deviation between voting and cash-flow rights adjust their capital
ratio upwards and downwards even though downward adjustment rate is higher.
14 We consider the shareholder protection index as calculated in (La Porta et al., 1998).
- 20 -
6.2 Sensitivity analysis
We perform several regressions to check the robustness of our results. Appendix F reports
the estimation results15.
First, we carry out the following robustness checks, still considering the control threshold
of 10%.
We focus on the sample of controlled banks, i.e. we exclude from the initial sample 40
widely-held banks. This criterion leaves us with 402 European controlled banks. Regression
results are shown in Table F.1. Then, we restrict our sample to listed banks. The results are
shown in
Table F.2. In addition, we consider only a pre-crisis period and re-estimate the whole
process for the 2002-2006 period. The estimation results are reported in Table F.3.
Furthermore, we exclude from the initial sample observations for which the Tier 1 risk-based
capital ratio is below the regulatory minimum ratio (4%). The results are shown in Table F.4.
Finally, we re-estimate the target capital ratio considering the dummy variable that reflects the
presence or absence of a gap between control and ownership ( ). This check is motivated by
our finding that on average banks without a gap between both rights hold higher Tier 1 capital
ratios than their counterparts (see table 4). The results obtained for the second step estimations
are reported in Table F.5.
In all cases, the results are consistent with those previously obtained for both steps.
Second, we change the control threshold and re-estimate all the regressions considering
this new control level. We recalculate ownership variables considering a control level of 20%
instead of 10%. This new minimum control threshold changes our database both
quantitatively and qualitatively (see Table 3). First, we add some of the banks for which we
fail to follow the track until the ultimate owner when we use a 10% control level.
Accordingly, 22 banks16 are added to our sample reaching 464 banks corresponding to 2647
observations. In addition, the structure of the initial sample has changed. The number of
widely-held banks increases from 40 to 66 (178 additional observations). Furthermore, the
nature of the ultimate owner is modified. For example, the number of family or state
15 Note that in each case we re-estimate the target capital ratio (step 1) using the considered sample. The results, not reported here, are available on request. The results are almost identical for each sub-sample. 16 We are not able to end the process for 28 banks when we consider the 10% control threshold and for 6 banks with the 20% threshold.
- 21 -
controlled banks diminishes by 30 whereas the number of banks controlled by a bank
increases by 46.
Table F.6 reports the estimation results when we use this new control threshold. The results
remain unchanged and are consistent with those previously obtained.
We also check the robustness of our results by performing further estimations using this new
control threshold (20%). We consider the following samples (1) Controlled banks (2) Listed
banks (3) 2002-2006 period and (4) Banks above the regulatory capital minimum. In all cases,
our main results -not reported here- remain unchanged.
7 Conclusion and Policy Implications
The purpose of this study is to empirically test whether bank ownership characteristics,
especially the separation between voting and cash-flow rights affect the bank’s decision to
recapitalize. We specifically question whether banks with and without separation between
both rights behave differently when they face a shortage or a surplus in capital. For this
purpose, we assemble a novel hand-collected dataset on bank ultimate control and ownership
structure and work on an unbalanced panel of 442 commercial banks across 17 European
countries over the 2002-2010 period.
On the whole, the results confirm the conjecture that the dynamics of equity capital, that is
its adjustment to the target level, is different for banks controlled by a shareholder with or
without deviation between voting and cash-flow rights. On the one hand, when there is no gap
between both rights, banks equally adjust their capital upwards or downwards and do not
appear to fear control dilution. On the other hand, when there is deviation between both
rights, banks differently weigh the need to increase or decrease equity. They are reluctant to
actively adjust their capital upwards to reach the target level. Our findings suggest that
controlling shareholders with divergence between both rights curb recapitalization to preserve
their control position and encourage equity repurchase to strengthen their voting power.
Our findings have several policy implications. We show that during the 2002-2010 period
covered by the Basel I and II accords, European banks with and without deviation between
voting and cash-flow rights of the ultimate owner behave differently when they adjust their
Tier 1 regulatory capital to move to the target level. Consequently it is important for
regulators and supervisors to consider that changes in capital requirements, particularly
narrowing the definition of Tier 1 capital to ordinary shares, might impact banks differently
- 22 -
depending on their ownership pattern. According to our results, banks controlled by a
shareholder with divergence between both rights are reluctant to raise equity that may dilute
the voting power. Consequently, we presume that the propensity to adjust their Tier 1 capital
ratio through alternative methods (i.e. reduce their dividend payment, proceed to downward
adjustment in asset size or risk-weighted assets) other than raising equity might be higher
under Basel III schemes because such banks have not only to raise new equity but also to use
ordinary shares which, unlike preferred shares (in general carrying only cash-flow rights),
may dilute the voting rights of the controlling shareholder. Hence, credit crunch phenomena
are more likely to occur in the transition from Basel II to Basel III which is supposed to be
completed in 2019. Such banks should be closely monitored by regulators and supervisors. A
better disclosure of banks' ownership structures following the recommendations of the Basel
Committee on Banking Supervision (BIS, 2010b) should be encouraged to improve regulatory
but also market monitoring and discipline.
- 23 -
References
Almeida, H., Park, S.Y., Subrahmanyam, M.G. & Wolfenzon, D., 2011. The Structure and Formation of Business Groups: Evidence from Korean Chaebols. Journal of Financial Economics, 99(2), pp.447-75.
Almeida, H. & Wolfenzon, D., 2006. A Theory of Pyramidal Ownership and Family Business Groups. Journal of Finance, 61(6), pp.2637-81.
Altinkihc, O. & Hansen, R.S., 2000. Are There Economies of Scale in Underwriting Fees? Evidence of Rising External Financing Costs. Review of Financial Studies, 13(1), pp.191-218.
Arellano, M. & Bond, S., 1991. Some Tests of Specification for Panel Data: Monte Carlo Evidence and an Application to Employment Equations. Review of Economic Studies, 58(2), pp.277-97.
Ayuso, J., Perez, D. & Saurina, J., 2004. Are capital buffers pro-cyclical?: Evidence from Spanish panel data. Journal of Financial Intermediation, 13(2), pp.249-64.
Azofra, V. & Santamaria, M., 2011. Ownership, control, and pyramids in Spanish commercial banks. Journal of Banking and Finance, 35(6), p.1464–1476.
Bank of International Settlements, 2010a. Group of Governors and Heads of Supervision announces higher global minimum capital standards. Consultative Document.
Bank of International Settlements, 2010b. Principles for enhancing bank corporate governance. Consultative Document.
Barth, J., Caprio, G. & Levine, R., 2004. Bank regulation and supervision: what works best? Journal of Financial Intermediation, 13(2), pp.205-48.
Bebchuk, L., Kraakman, R. & Triantis, G., 2000. Stock Pyramids, Cross-Ownership, and Dual Class Equity: The Creation and Agency Costs of Separating Control From Cash-Flow Rights. In: Concentrated Corporate Ownership (R. Morck, ed.), 460(249), pp.445-60.
Bennedsen, M. & Wolfenzon, D., 2000. The balance of power in closely held corporations. Journal of Financial Economics, 58(1-2), pp.113-39.
Berger, A.N. et al., 2008. How Do Large Banking Organizations Manage their capital ratios? Journal of Financial Services Research, 34(2), p.123–149.
Berger, A.N., Herring, R.J. & Szegö, G.P., 1995. The Role of Capital in Financial Institutions. Journal of Banking and Finance, 19(3-4), pp.393-430.
Boubakri, N. & Ghouma, H., 2010. Control/ownership structure, creditor rights protection, and the cost of debt financing: International evidence. Journal of Banking and Finance, 34(10), p.2481–2499.
Brewer, E., Kaufman, G.G. & Wall, L.D., 2008. Bank Capital Ratios Across Countries: Why Do They Vary? Journal of Financial Services Research, 34(2), pp.177-201.
Burkart, M., Gromb, D. & Panunzi, F., 1998. Why Higher Takeover Premia Protect Minority Shareholders. Journal of Political Economy, 106(1), pp.172-204.
Byoun, S., 2008. How and When Do Firms Adjust Their Capital Structures Toward Targets? Journal of Finance, 63(6), pp.3069-96.
Caprio, G., Laeven, L. & Levine, R., 2007. Governance and bank valuation. Journal of Financial Intermediation, 16(4), p.584–617.
- 24 -
Claessens, S., Djankov, S., Fan, J.P.H. & Lang, L.H.P., 2002. Disentangling the Incentive and Entrenchment Effects of Large Shareholdings. Journal of Finance, 57(6), pp.2741-71.
Claessens, S., Djankov, S. & Lang, L.H.P., 2000. The separation of ownership and control in East Asian Corporations. Journal of Financial Economics, 58(1-2), pp.81-112.
Cronqvist, H. & Nilsson, M., 2005. The choice between rights offerings and private equity placements. Journal of Financial Economics, 78(2), pp.375-407.
Faccio, M. & Lang, L.H.P., 2002. The ultimate ownership of Western European corporations. Journal of Financial Economics, 65(3), p.365–395.
Faccio, M., Lang, L.H.P. & Young, L., 2001. Dividends and Expropriation. American Economic Review, 91(1), pp.54-78.
Flannery, M.J. & Rangan, K.P., 2006. Partial adjustment toward target capital structures. Journal of Financial Economics, 79(3), p.469–506.
Flannery, M.J. & Rangan, K.P., 2008. What Caused the Bank Capital Build-Up of the 1990s? Review of Finance, 12(2), pp.391-429.
Fonseca, A.R. & González, F., 2010. How bank capital buffers vary across countries: The influence of cost of deposits, market power and bank regulation. Journal of Banking and Finance, 34(4), p.892–902.
Gomes, A. & Novaes, W., 2001. Sharing of Control as a Corporate Governance Mechanism. PIER Working Paper.
Gropp, R. & Heider, F., 2011. The determinants of bank capital structure. Review of Finance, 15, pp.29-74.
Harris, M. & Raviv, A., 1988. Corporate governance : Voting rights and majority rules. Journal of Financial Economics, 20(1-2), pp.203-35.
Haw, I.-M., Ho, S.S.M. & Hu, B., 2010. Concentrated control, institutions, and banking sector: An international study. Journal of Banking and Finance, 34(3), p.485–497.
Hyun, J.-S. & Rhee, B.-K., 2011. Bank capital regulation and credit supply. Journal of Banking and Finance, 35(2), pp.323-30.
Ivashina, V. & Scharfstein, D., 2010. Bank Lending During the Financial Crisis of 2008. Journal of Financial Economics, 97(3), pp.319-38.
Jacques, K. & Nigro, P., 1997. Risk-based capital, portfolio risk, and bank capital: a simultaneous equation approach. Journal of Economics and Business, 49(6), pp.533-47.
Jokipii, T. & Milne, A., 2008. The cyclical behaviour of European bank capital buffers. Journal of Banking and Finance, 32(8), p.1440–1451.
Jokipii, T. & Milne, A., 2011. Bank capital buffer and risk adjustment decisions. Journal of Financial Stability, 7(3), p.165–178.
Keeley, M.C., 1990. Deposit insurance, risk, and market power in banking. American Economic Review, 80(5), pp.1183-200.
La Porta, R., Lopez-de-Silane, F., Shleifer, A. & Vishny, R.W., 1998. Law and Finance. Journal of Political Economy, 106(6), pp.1113-55.
La Porta, R., Lopez-de-Silanes, F. & Shleifer, A., 1999. Corporate Ownership around the World. Journal of Finance, 54(2), pp.471-517.
La Porta, R., Lopez-de-Silanes, F. & Shleifer, A., 2002. Investor Protection and Corporate Valuation. Journal of Finance, 57(3), pp.1147-70.
- 25 -
Laderman, E.S., 1994. Wealth effects of bank holding company securities issuance and loan growth under the risk-based capital requirements. Economic Review, 2, pp.30-41.
Laeven, L. & Levine, R., 2008. Complex Ownership Structures and Corporate Valuations. Review of Financial Studies, 21(2), pp.579-604.
Laeven, L. & Levine, R., 2009. Bank governance,regulation and risk taking. Journal of Financial Economics, 93(2), p.259–275.
Lin, C., Ma, Y., Malatesta, P. & Xuan, Y., 2011. Ownership structure and the cost of corporate borrowing. Journal of Financial Economics, 100(1), pp.1-23.
Marcus, A.J., 1983. The Bank Capital Decision: A Time Series--Cross Section Analysis. Journal of Finance, 38(4), pp.1217-32.
Maury, B. & Pajuste, A., 2005. Multiple Large Shareholders and Firm Value. Journal of Banking and Finance, 29(7), pp.1813-34.
Memmel, C. & Raupach, P., 2010. How Do Banks Adjust Their Capital Ratios? Journal of Financial Intermediation, 19(4), pp.509-28.
Myers, S.C., 1977. Determinants of Corporate Borrowing. Journal of Financial Economics, 5(2), pp.147-75.
Myers, S.C. & Majluf, N.S., 1984. Corporate financing and investment decisions when firms have information that investors do not have. Journal of Financial Economics, 13(2), p.187–221.
Nier, E. & Baumann, U., 2006. Market discipline, disclosure and moral hazard in banking. Journal of Financial Intermediation, 15(3), pp.332-61.
Pagano, M. & Röell, A., 1998. The Choice Of Stock Ownership Structure: Agency Costs, Monitoring, And The Decision To Go Public. The Quarterly Journal of Economics, 113(1), pp.187-225.
Peek, J. & Rosengren, E.S., 1997. How well capitalized are well-capitalized banks? New England Economic Review, 19, pp.41-51.
Peura, S. & Keppo, J., 2006. Optimal Bank Capital with Costly Recapitalization. Journal of Business, 79(4), pp.2163-201.
Prowse, S., 1995. Alternative methods of corporate control in commercial banks. Economic and Financial Policy Review, pp.24-36.
Rime, B., 2001. Capital requirements and bank behaviour: Empirical evidence for Switzerland. Journal of Banking and Finance, 25(4), pp.789-805.
Shehzad, C.T., Haan, J.d. & Scholtens, B., 2010. The impact of bank ownership concentration on impaired loans and capital adequacy. Journal of Banking and Finance, 34(2), p.399–408.
Shleifer, A. & Wolfenzon, D., 2002. Investor protection and equity markets. Journal of Financial Economics, 66(1), pp.3-27.
Stulz, R., 1988. Managerial control of voting rights : Financing policies and the market for corporate control. Journal of Financial Economics, 20(1-2), pp.25-54.
- 26 -
Table 1
Distribution of European Commercial Banks and Representativeness of the Sample
Country Banks available in Bankscope Banks in the final sample
All Banks Listed Banks All Banks Listed Banks Per cent a
Austria 88 5 18 3 42.81 Belgium 50 2 11 1 98.43 Denmark 61 42 45 35 93.80 Finland 10 2 3 0 82.72 France 191 18 25 6 79.42 Germany 208 20 30 9 74.83 Greece 19 11 13 9 96.47 Ireland 35 5 15 4 96.70 Italy 188 27 128 17 86.92 Luxembourg 107 4 18 4 53.93 Netherlands 47 5 22 4 63.02 Norway 20 4 8 3 73.85 Portugal 27 5 11 2 84.70 Spain 92 17 18 10 91.71 Sweeden 25 2 13 2 83.32 Switzerland 182 7 15 3 87.21 United Kingdom 183 9 49 5 72.16
Total 1533 185 442 117 -
a is the percentage of total assets of all commercial banks in our sample in the aggregate total assets of all commercial banks provided by Bankscope in a given country over the 2002-2010 period.
27
Table 2
General Descriptive Statistics, on average over the 2002-2010 period
TA DEP_TA TF_TA LO_TA LLP EQ_TA TCR T1_RWA ROA ROE MARG_TA
Full sample of commercial banks in Bankscope (1533 banks)
Mean 25268.59 69.31 80.45 47.92 0.73 14.25 19.95 17.00 0.70 6.89 1.22
Median 1037.50 76.26 87.38 51.32 0.35 8.16 13.13 10.55 0.52 6.58 0.15 Std. Dev. 120352.05 23.07 21.58 30.22 2.07 17.48 33.50 32.80 3.78 14.11 4.04 Minimum 0.10 0.00 0.00 0.00 -19.23 0.00 0.10 -0.40 -56.54 -97.35 -14.56
Maximum 2202423 150.18 850.00 99.96 17.81 100.00 877.00 753.00 75.50 79.77 48.91
Final sample of commercial banks (442 banks)
Mean 72333.56 65.38 85.57 55.18 0.77 9.16 14.33 12.34 0.60 7.20 0.54
Median 4864.10 68.86 88.13 60.75 0.47 6.74 12.50 10.10 0.52 8.24 0.04 Std. Dev. 213529.13 20.15 11.12 26.09 1.51 9.22 6.47 7.10 1.77 12.68 2.55 Minimum 6.90 0.00 0.00 0.00 -19.23 0.00 0.10 0.10 -15.04 -90.70 -0.51
Maximum 2202423 94.93 99.31 99.07 17.13 95.95 50.00 36.05 19.65 79.77 28.95
All variables are expressed in percentage except TA which is in million Euros. TA is the bank’s total asset. DEP_TA is the ratio of total deposits to total assets. TF_TA is the ratio of total funding to total asset. LO_TA is the ratio of net loans to total asset. LLP is the ratio of loan loss provisions to net loans. EQ_TA is the ratio of total equity to total asset. TCR is the risk-based total capital ratio. T1_RWA is the risk-based Tier 1 capital ratio. ROA is the return on asset. ROE is the return on equity. MARG_TA is the ratio of net interest margin to total asset.
28
Table 3
Ultimate Ownership of European Commercial Banks
This table reports Ultimate Ownership Structure for European commercial banks using a minimum control threshold of 10% (PANEL A) and 20% (PANEL B) for the whole sample (WHOLE SAMPLE) and the subsamples of banks controlled by a shareholder with equal voting and cash-flow rights (VR=CFR) and different rights (VR≠CFR). In columns (a), we report the percentage and the number of observations (between brackets) for each ownership category. In columns (b), we present the corresponding number of banks. WIDELY is a dummy variable equal to one if the bank is widely-held, and zero otherwise. CONTROLLED is a dummy variable equal to one if the bank is controlled by at least one shareholder, and zero otherwise. BANK is a dummy variable equal to one if the bank is controlled by a bank, and zero otherwise. FAMILY is a dummy variable equal to one if the bank is controlled by a family/individual, and zero otherwise. STATE is a dummy variable equal to one if the bank is controlled by a state/public authority, and zero otherwise. OTHER is a dummy variable equal to one if the bank is controlled by any of these categories: Industrial firm, financial and insurance companies, Mutual and Pension funds, Foundations and Research institutes, Managers or cross-holdings, and zero otherwise.
PANEL A: Control Threshold 10% PANEL B: Control Threshold 20%
WHOLE SAMPLE VR=CFR VR ≠ CFR WHOLE SAMPLE VR=CFR VR ≠ CFR
(a) (b) (a) (b) (a) (b) (a) (b) (a) (b) (a) (b)
WIDELY
11.54
(297) 40 - - - -
17.94
(475) 66 - - - -
CONTROLLED
88.46
(2 277) 402
55.78
(1 270) 215
44.22
(1 007) 187
82.06
(2 172) 398
57.41
(1 247) 225
42.59
(925) 173
BANK
38.29
(872) 155
53.46
(679) 119
19.16
(193) 36
51.70
(1123) 201
64.15
(800) 144
34.91
(323) 57
FAMILY
21.82
(497) 90
17.16
(218) 38
27.70
(279) 52
16.94
(368) 73
13.15
(164) 31
22.05
(204) 42
STATE
14.84
(338) 65
7.16
(91) 14
24.52
(247) 51
11.74
(255) 52
6.09
(76) 13
19.35
(179) 39
OTHER
25.05
(570) 92
22.22
(282) 44
28.62
(288) 48
19.62
(426) 72
16.61
(207) 37
23.69
(219) 35
Total
observations/banks 2574 442 1270 215 1007 187 2647 464 1247 225 925 173
29
Table 4 Summary Statistics of the main variables over the 2002-2010 period
Variables Number of
observations
Sample VR CFR Sample VR ≠ CFR T-test
Mean Median Std.Dev. Minimum Maximum Mean Median Stan.dev Minimum Maximum
TA 2573 78614.30 4470.70 238175.84 6.90 2202423
64463.08 5623.30 171384.27 50.80 1967121.9
1.63
LO_TA 2563 52.52 55.98 24.14 0.00 98.87
57.46 62.22 27.99 0.00 99.07
-4.74***
ROA 2569 0.64 0.57 1.79 -15.04 19.65
0.47 0.45 1.16 -10.60 7.78
2.64***
ROE 2544 7.28 8.12 12.30 -90.70 79.77
7.09 8.42 13.26 -78.82 64.41
0.36***
LLP 2436 0.78 0.49 1.40 -7.32 17.13
0.74 0.40 1.66 -19.23 13.33
0.53
NPL 1714 3.70 2.23 4.75 0.00 67.99
4.26 2.45 6.32 0.00 64.04
-2.06**
MKT_DISC 2247 19.44 16.45 17.61 0.00 100.00
17.00 10.59 19.33 0.00 96.83
3.07***
DIV 2075 0.92 1.00 0.27 0.00 1.00
0.86 1.00 0.35 0.00 1.00
3.59***
TCR 2491 17.06 12.78 23.77 2.69 50.00
16.58 12.31 31.07 0.10 48.03
0.43
T1_RWA 2511 12.71 10.54 7.45 1.87 36.05
11.76 9.68 6.50 0.10 34.97
3.28***
LIST ED 2574 0.45 0.00 0.50 0.00 1.00
0.21 0.00 0.41 0.00 1.00
-
VR 2574 56.14 55.22 40.40 0.00 100.00
84.76 98.82 22.01 15.95 100.00
-
CFR 2574 56.14 55.22 40.40 0.00 100.00
18.97 23.29 29.18 2.81 99.98
-
WEDGE 2574 0.00 0.00 0.00 0.00 0.00 65.79 44.72 30.50 0.00 97.16 -
This table reports summary statistics of the main variables for both subsamples of banks controlled by a shareholder with equal voting and cash-flow rights (VR=CFR) and different rights (VR≠CFR). All variables are expressed in percentage except TA which is in million euros. TA is the bank’s total asset. LO_TA is the ratio of net loans to total asset. ROA is the return on asset. ROE is the return on equity. LLP is the ratio of loan loss provisions to net loans. NPL is the ratio of non-performing loans to gross loans. MKT_DISC is the ratio of total long term funding to total funding. DIV is a dummy variable that takes 1 if the bank pays dividends at time t, and zero otherwise. TCR is the risk-based total capital ratio. T1_RWA is the risk-based Tier 1 capital ratio. LISTED is a dummy variable equal to one if the bank is listed, and zero otherwise. VR is the ultimate owner’s voting rights. CFR is the ultimate owner’s cash-flow rights. WEDGE is the difference between the ultimate owner’s voting (VR) and cash-flow rights (CFR). T-test is the test of mean differences.
30
Table 5 Estimating the target capital ratio for the whole sample over the 2002-2010 period
Dependent variable
T1_TA T1_RWA
Eq.5 Eq.6 Eq.5 Eq.6 a b a b a b a b
T1_TA t-1 0.59*** 0.60*** - - - - - - (0.00) (0.00)
T1_RWA t-1 - - - - 0.54*** 0.54*** - - (0.00) (0.00)
LN_TA -0.28*** -0.35*** -1.31*** -1.62*** -0.73*** -0.74*** -1.37*** -1.57***
(0.00) (0.00) (0.00) (0.00) (0.00) (0.00) (0.00) (0.00)
ROA 0.64*** 0.67*** 0.14 0.13 0.69** 0.72** 0.02 0.02
(0.01) (0.00) (0.65) (0.71) (0.01) (0.01) (0.94) (0.92)
LLP 0.06 0.07 -0.06 -0.10 -0.09 -0.09 0.04 0.03
(0.16) (0.14) (0.61) (0.48) (0.22) (0.23) (0.82) (0.88)
COST_EQ -0.44*** -0.47*** -0.22** -0.24** -0.12 -0.12 0.01 0.01
(0.00) (0.00) (0.04) (0.04) (0.59) (0.56) (0.94) (0.94)
CV 0.14* 0.15* 0.25** 0.25* 0.21* 0.22* 0.10 0.16
(0.07) (0.08) (0.04) (0.05) (0.08) (0.06) (0.59) (0.41)
LO_TA 0.00 0.00 -0.01 -0.01 -0.03** -0.04*** -0.08*** -0.08***
(0.21) (0.17) (0.10) (0.14) (0.01) (0.00) (0.00) (0.00)
MKT_DISC 0.00 0.00 0.01* 0.01** 0.02** 0.02** 0.02** 0.02**
(0.82) (0.75) (0.06) (0.03) (0.04) (0.02) (0.03) (0.02)
GDPG 0.05* 0.06* 0.02 0.04 0.01 0.00 0.03 0.06
(0.09) (0.08) (0.62) (0.40) (0.84) (0.89) (0.54) (0.29)
LO_GR -0.01*** -0.01*** -0.01*** -0.01*** -0.02*** -0.02*** -0.02*** -0.02***
(0.00) (0.00) (0.00) (0.00) (0.00) (0.00) (0.00) (0.00)
BASEL2 0.35* 0.39** 0.73*** 0.67** 2.17*** 2.14*** 3.25*** 3.17***
(0.05) (0.04) (0.00) (0.01) (0.00) (0.00) (0.00) (0.00)
LISTED 0.25 0.32 1.54*** 1.92*** 0.99* 0.98* 0.89* 1.05*
(0.16) (0.14) (0.00) (0.00) (0.07) (0.07) (0.08) (0.05)
U_CAP -0.77 - -1.88*** - 0.38 - -1.28*** -2.47***
(0.18) (0.00) (0.39) (0.00) (0.00)
A_CAP -0.61 - -1.59*** - -0.18 - -1.45*** -1.45***
(0.15) (0.00) (0.53) (0.00) (0.00)
CAP_INDEX - -0.28* - -1.20** - -1.01*** - - (0.05) (0.02) (0.00)
INTERCEPT 4.05*** 5.56*** 16.82*** 24.91*** 10.39*** 16.61*** 24.54*** 39.80*** (0.00) (0.00) (0.00) (0.00) (0.00) (0.00) (0.00) (0.00)
Observations 1492 1492 1557 1557 1727 1727 1742 1742
Hansen Test 120.0 121.5 - - 168.0 170.5 - - P-Value 0.15 0.13 - - 0.24 0.20 - -
AR2 Test 0.27 0.08 - - -0.26 -0.24 - - P-Value 0.78 0.93 - - 0.79 0.81 - -
NB of banks 324 324 325 325 350 350 352 352
Table 5 reports the estimation results for the target capital ratio (step 1) for the whole sample of European commercial banks over the 2002-2010 period. In columns Eq.5 and Eq.6, we respectively estimate the target capital ratio using equations 5 (GMM) and 6 (Random Effect Estimator). T1_TA t-1 is the lagged value of T1_TA defined as the ratio of Tier 1 regulatory capital (T1) to total asset (TA). T1_RWA t-1 is the lagged value of T1_ RWA defined as the ratio of Tier 1 regulatory capital (T1) to risk-weighted asset (RWA). LN_TA is the natural logarithm of bank’s total asset. ROA is profitability measured by the return on asset. LLP is the ratio of loan loss provisions to net loans. COST_EQ is the opportunity cost of equity measured by the return on equity. CV is the bank’s charter value measured as the ratio of bank deposits in total deposits of all banks in the country to which the subject bank belongs. LO_TA is the ratio of net loans to total asset. MKT_DISC is the ratio of total long term funding to total funding. GDPG is the real gross domestic product growth. LO_GR is loan growth. BASEL2 is a dummy variable that takes the value one if year is greater than 2006, and zero otherwise. LISTED is a dummy variable equal to one if the bank is listed, and zero otherwise. U_CAP is a dummy variable equal to one if the risk-based Tier 1 capital ratio is less than or equal 4, and zero otherwise. A_CAP is a dummy variable equal to one if the risk-based Tier 1 capital ratio is between 4 and 7, and zero otherwise. CAP_INDEX is a regulatory capital index as defined in table C.1 in Appendix C. P-values are shown in parentheses. * p < 0.1, ** p < 0.05, *** p < 0.01.
31
Table 6
Capital adjustment speed and ownership structure for the whole sample over the 2002-2010 period
Dependent variable
Panel A: active and passive changes in capital
Panel B: active change in
capital
(1) (2) (1) (2)
Eq.5 Eq.6 Eq.5 Eq.6 Eq.5 Eq.6 Eq.5 Eq.6 0.45*** 0.43*** 0.41*** 0.39*** 0.43*** 0.41*** 0.39*** 0.37***
(0.00) (0.00) (0.00) (0.00) (0.00) (0.00) (0.00) (0.00) 0.09 0.03 0.07 0.04 0.04 0.03 0.04 0.02
(0.46) (0.81) (0.14) (0.21) (0.77) (0.60) (0.59) (0.65) 0.10 0.05 0.11 0.03 0.05 0.02 -0.02 -0.04
(0.31) (0.57) (0.10) (0.26) (0.66) (0.42) (0.73) (0.51) -0.39* -0.27** -0.25* -0.18*** -0.46** -0.42*** -0.34** -0.26***
(0.07) (0.02) (0.05) (0.00) (0.01) (0.00) (0.02) (0.00)
INTERCEPT 0.30*** 0.13 0.42*** 0.15 0.09 0.14 0.09 -0.15**
(0.00) (0.36) (0.00) (0.20) (0.15) (0.10) (0.28) (0.01)
Number of observations 1492 1492 1476 1485 1489 1485 1473 1479 0.54 0.46 0.48 0.43 0.47 0.44 0.43 0.39
Risk level to reject =0 0.00 0.00 0.00 0.00 0.00 0.00 0.00 0.00 0.55 0.48 0.52 0.42 0.48 0.43 0.37 0.33
Risk level to reject 0.00 0.00 0.00 0.00 0.00 0.00 0.00 0.00 0.25 0.24 0.34 0.28 0.06 0.04 0.07 0.09
Risk level to reject 0.04 0.02 0.00 0.00 0.57 0.68 0.49 0.17
Table 6 reports the estimation results for equation (4) using fixed effect estimator for the whole sample of European
Commercial banks over the 2002-2010 period. , is the actual deviation. , is the
target deviation. , is defined as the lagged value of Tier 1 regulatory capital in panel A and as the sum of the lagged
value of Tier 1 regulatory capital and the current net income minus the current dividend payment in panel B.
is the
target capital ratio defined respectively as the non-weighted Tier 1 capital ratio (T1_TA) and risk-based Tier 1 capital ratio (T1_RWA) in columns (1) and (2). In columns Eq.5 and Eq.6, we respectively estimate the target capital ratio using equations 5 (GMM) and 6 (Random Effect Estimator). is a dummy variable equal to one if the bank capital
ratio is below the target at t-1, and zero otherwise. is a dummy variable equal to one if there is a gap between voting and cash-flow rights of the ultimate shareholder, and zero otherwise. P-values are shown in parentheses.* p < 0.1, ** p < 0.05, *** p < 0.01.
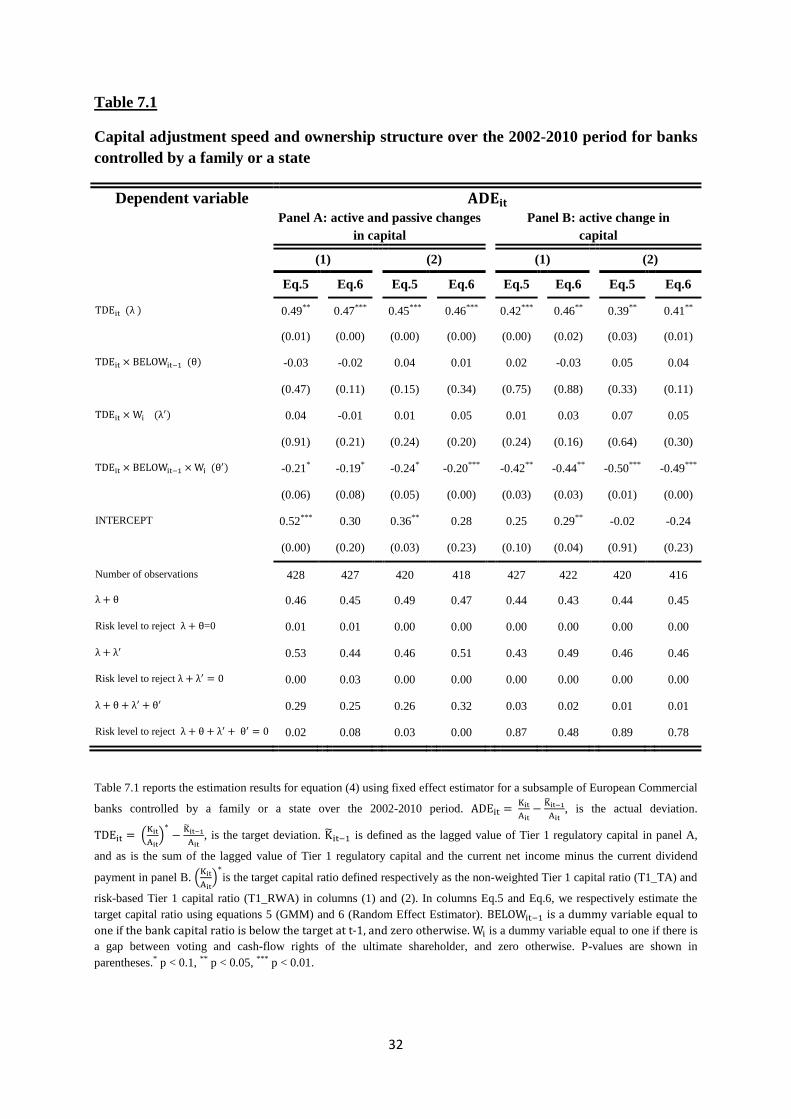
32
Table 7.1
Capital adjustment speed and ownership structure over the 2002-2010 period for banks controlled by a family or a state
Dependent variable
Panel A: active and passive changes in capital
Panel B: active change in
capital
(1) (2) (1) (2)
Eq.5 Eq.6 Eq.5 Eq.6 Eq.5 Eq.6 Eq.5 Eq.6 0.49** 0.47*** 0.45*** 0.46*** 0.42*** 0.46** 0.39** 0.41**
(0.01) (0.00) (0.00) (0.00) (0.00) (0.02) (0.03) (0.01) -0.03 -0.02 0.04 0.01 0.02 -0.03 0.05 0.04
(0.47) (0.11) (0.15) (0.34) (0.75) (0.88) (0.33) (0.11) 0.04 -0.01 0.01 0.05 0.01 0.03 0.07 0.05
(0.91) (0.21) (0.24) (0.20) (0.24) (0.16) (0.64) (0.30) -0.21* -0.19* -0.24* -0.20*** -0.42** -0.44** -0.50*** -0.49***
(0.06) (0.08) (0.05) (0.00) (0.03) (0.03) (0.01) (0.00)
INTERCEPT 0.52*** 0.30 0.36** 0.28 0.25 0.29** -0.02 -0.24
(0.00) (0.20) (0.03) (0.23) (0.10) (0.04) (0.91) (0.23)
Number of observations 428 427 420 418 427 422 420 416 0.46 0.45 0.49 0.47 0.44 0.43 0.44 0.45
Risk level to reject =0 0.01 0.01 0.00 0.00 0.00 0.00 0.00 0.00 0.53 0.44 0.46 0.51 0.43 0.49 0.46 0.46
Risk level to reject 0.00 0.03 0.00 0.00 0.00 0.00 0.00 0.00 0.29 0.25 0.26 0.32 0.03 0.02 0.01 0.01
Risk level to reject 0.02 0.08 0.03 0.00 0.87 0.48 0.89 0.78
Table 7.1 reports the estimation results for equation (4) using fixed effect estimator for a subsample of European Commercial
banks controlled by a family or a state over the 2002-2010 period. , is the actual deviation. , is the target deviation. is defined as the lagged value of Tier 1 regulatory capital in panel A,
and as is the sum of the lagged value of Tier 1 regulatory capital and the current net income minus the current dividend
payment in panel B.
is the target capital ratio defined respectively as the non-weighted Tier 1 capital ratio (T1_TA) and
risk-based Tier 1 capital ratio (T1_RWA) in columns (1) and (2). In columns Eq.5 and Eq.6, we respectively estimate the target capital ratio using equations 5 (GMM) and 6 (Random Effect Estimator). is a dummy variable equal to
one if the bank capital ratio is below the target at t-1, and zero otherwise. is a dummy variable equal to one if there is a gap between voting and cash-flow rights of the ultimate shareholder, and zero otherwise. P-values are shown in parentheses.* p < 0.1, ** p < 0.05, *** p < 0.01.
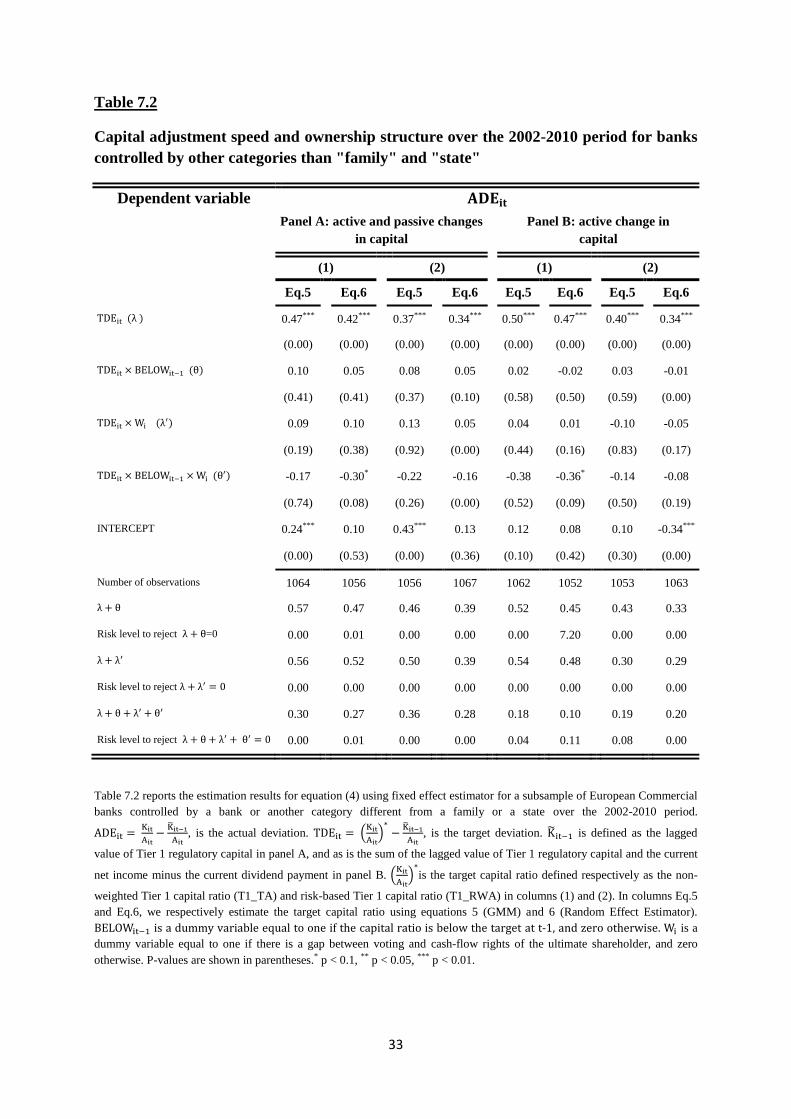
33
Table 7.2
Capital adjustment speed and ownership structure over the 2002-2010 period for banks controlled by other categories than "family" and "state"
Dependent variable
Panel A: active and passive changes in capital
Panel B: active change in
capital
(1) (2) (1) (2)
Eq.5 Eq.6 Eq.5 Eq.6 Eq.5 Eq.6 Eq.5 Eq.6 0.47*** 0.42*** 0.37*** 0.34*** 0.50*** 0.47*** 0.40*** 0.34***
(0.00) (0.00) (0.00) (0.00) (0.00) (0.00) (0.00) (0.00) 0.10 0.05 0.08 0.05 0.02 -0.02 0.03 -0.01
(0.41) (0.41) (0.37) (0.10) (0.58) (0.50) (0.59) (0.00) 0.09 0.10 0.13 0.05 0.04 0.01 -0.10 -0.05
(0.19) (0.38) (0.92) (0.00) (0.44) (0.16) (0.83) (0.17) -0.17 -0.30* -0.22 -0.16 -0.38 -0.36* -0.14 -0.08
(0.74) (0.08) (0.26) (0.00) (0.52) (0.09) (0.50) (0.19)
INTERCEPT 0.24*** 0.10 0.43*** 0.13 0.12 0.08 0.10 -0.34***
(0.00) (0.53) (0.00) (0.36) (0.10) (0.42) (0.30) (0.00)
Number of observations 1064 1056 1056 1067 1062 1052 1053 1063 0.57 0.47 0.46 0.39 0.52 0.45 0.43 0.33
Risk level to reject =0 0.00 0.01 0.00 0.00 0.00 7.20 0.00 0.00 0.56 0.52 0.50 0.39 0.54 0.48 0.30 0.29
Risk level to reject 0.00 0.00 0.00 0.00 0.00 0.00 0.00 0.00 0.30 0.27 0.36 0.28 0.18 0.10 0.19 0.20
Risk level to reject 0.00 0.01 0.00 0.00 0.04 0.11 0.08 0.00
Table 7.2 reports the estimation results for equation (4) using fixed effect estimator for a subsample of European Commercial banks controlled by a bank or another category different from a family or a state over the 2002-2010 period. , is the actual deviation. , is the target deviation. is defined as the lagged
value of Tier 1 regulatory capital in panel A, and as is the sum of the lagged value of Tier 1 regulatory capital and the current
net income minus the current dividend payment in panel B.
is the target capital ratio defined respectively as the non-
weighted Tier 1 capital ratio (T1_TA) and risk-based Tier 1 capital ratio (T1_RWA) in columns (1) and (2). In columns Eq.5 and Eq.6, we respectively estimate the target capital ratio using equations 5 (GMM) and 6 (Random Effect Estimator). is a dummy variable equal to one if the capital ratio is below the target at t-1, and zero otherwise. is a dummy variable equal to one if there is a gap between voting and cash-flow rights of the ultimate shareholder, and zero otherwise. P-values are shown in parentheses.* p < 0.1, ** p < 0.05, *** p < 0.01.

34
Table 8.1
Capital adjustment speed and ownership structure over the 2002-2010 period for banks headquartered in countries with weak shareholder protection
Dependent variable
Panel A: active and passive changes in capital
Panel B: active change in
capital
(1) (2) (1) (2)
Eq.5 Eq.6 Eq.5 Eq.6 Eq.5 Eq.6 Eq.5 Eq.6 0.43*** 0.41*** 0.39*** 0.38*** 0.42*** 0.39*** 0.36*** 0.35***
(0.00) (0.00) (0.00) (0.00) (0.00) (0.00) (0.00) (0.00) 0.07 0.04 0.05 0.02 -0.02 0.04 0.05 0.02
(0.21) (0.51) (0.85) (0.50) (0.19) (0.39) (0.24) (0.21) 0.09 0.04 0.08 0.02 0.03 0.01 -0.01 -0.03
(0.20) (0.26) (0.31) (0.00) (0.27) (0.48) (0.19) (0.23) -0.38*** -0.29* -0.27** -0.18*** -0.41** -0.43*** -0.39*** -0.32**
(0.00) (0.05) (0.01) (0.00) (0.06) (0.00) (0.00) (0.01)
INTERCEPT 0.51*** 0.16 0.60*** 0.15 0.17** 0.16 0.32*** -0.26*
(0.00) (0.42) (0.00) (0.33) (0.02) (0.18) (0.00) (0.06)
Number of observations 1094 1076 1079 1084 1092 1072 1077 1082 0.50 0.45 0.44 0.40 0.40 0.43 0.41 0.37
Risk level to reject =0 0.00 0.00 0.00 0.00 0.00 0.00 0.00 0.00 0.52 0.45 0.47 0.40 0.45 0.40 0.35 0.32
Risk level to reject 0.00 8.68 4.57 4.00 0.00 0.00 0.00 0.00 0.21 0.20 0.25 0.24 0.02 0.01 0.01 0.02
Risk level to reject 0.01 0.01 0.00 0.00 0.46 0.65 0.71 0.39
Table 8.1 reports the estimation results for equation (4) using fixed effect estimator for a subsample of European Commercial banks headquartered in countries with weak shareholder protection (the shareholder index is less than the median value) over
the 2002-2010 period. , is the actual deviation. , is the target deviation. is
defined as the lagged value of Tier 1 regulatory capital in panel A, and as is the sum of the lagged value of Tier 1 regulatory
capital and the current net income minus the current dividend payment in panel B.
is the target capital ratio defined
respectively as the non-weighted Tier 1 capital ratio (T1_TA) and risk-based Tier 1 capital ratio (T1_RWA) in columns (1) and (2). In columns Eq.5 and Eq.6, we respectively estimate the target capital ratio using equations 5 (GMM) and 6 (Random Effect Estimator). is a dummy variable equal to one if the bank capital ratio is below the target at t-1, and
zero otherwise. is a dummy variable equal to one if there is a gap between voting and cash-flow rights of the ultimate shareholder, and zero otherwise. P-values are shown in parentheses.* p < 0.1, ** p < 0.05, *** p < 0.01.
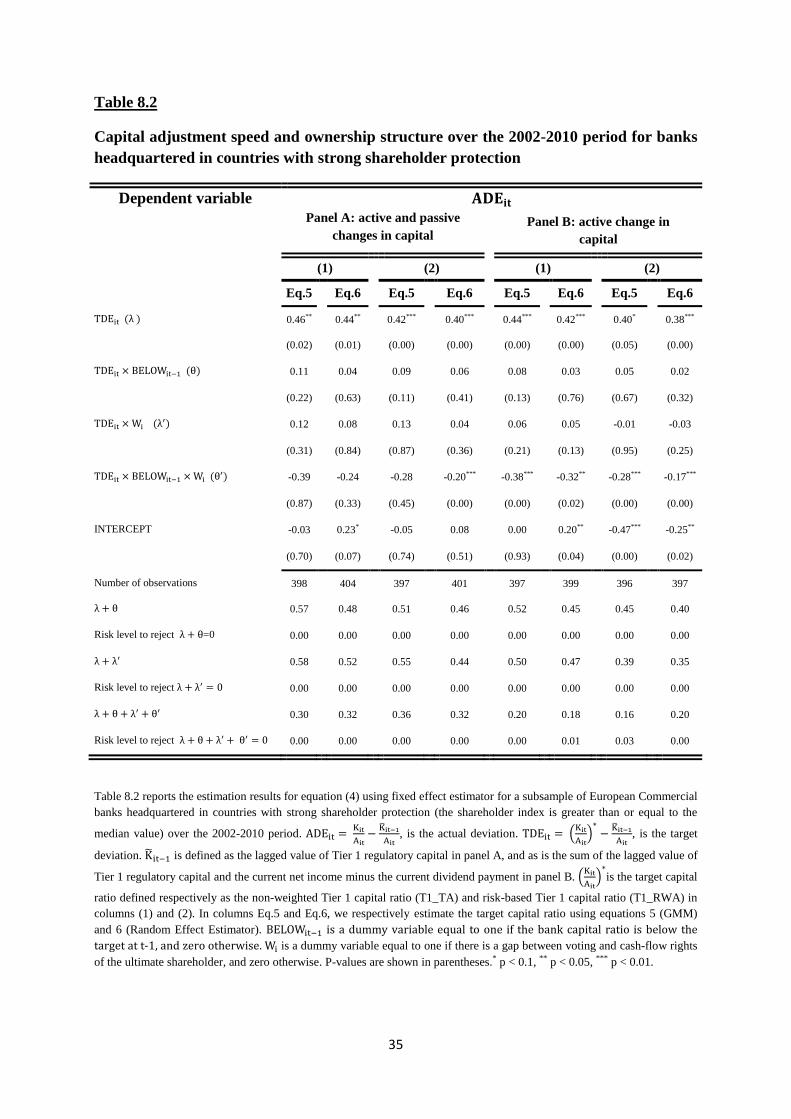
35
Table 8.2
Capital adjustment speed and ownership structure over the 2002-2010 period for banks headquartered in countries with strong shareholder protection
Dependent variable
Panel A: active and passive changes in capital
Panel B: active change in
capital
(1) (2) (1) (2)
Eq.5 Eq.6 Eq.5 Eq.6 Eq.5 Eq.6 Eq.5 Eq.6 0.46** 0.44** 0.42*** 0.40*** 0.44*** 0.42*** 0.40* 0.38***
(0.02) (0.01) (0.00) (0.00) (0.00) (0.00) (0.05) (0.00) 0.11 0.04 0.09 0.06 0.08 0.03 0.05 0.02
(0.22) (0.63) (0.11) (0.41) (0.13) (0.76) (0.67) (0.32) 0.12 0.08 0.13 0.04 0.06 0.05 -0.01 -0.03
(0.31) (0.84) (0.87) (0.36) (0.21) (0.13) (0.95) (0.25) -0.39 -0.24 -0.28 -0.20*** -0.38*** -0.32** -0.28*** -0.17***
(0.87) (0.33) (0.45) (0.00) (0.00) (0.02) (0.00) (0.00)
INTERCEPT -0.03 0.23* -0.05 0.08 0.00 0.20** -0.47*** -0.25**
(0.70) (0.07) (0.74) (0.51) (0.93)
(0.04)
(0.00)
(0.02)
Number of observations 398 404 397 401 397 399 396 397 0.57 0.48 0.51 0.46 0.52 0.45 0.45 0.40
Risk level to reject =0 0.00 0.00 0.00 0.00 0.00 0.00 0.00 0.00 0.58 0.52 0.55 0.44 0.50 0.47 0.39 0.35
Risk level to reject 0.00 0.00 0.00 0.00 0.00 0.00 0.00 0.00 0.30 0.32 0.36 0.32 0.20 0.18 0.16 0.20
Risk level to reject 0.00 0.00 0.00 0.00 0.00 0.01 0.03 0.00
Table 8.2 reports the estimation results for equation (4) using fixed effect estimator for a subsample of European Commercial banks headquartered in countries with strong shareholder protection (the shareholder index is greater than or equal to the
median value) over the 2002-2010 period. , is the actual deviation. , is the target
deviation. is defined as the lagged value of Tier 1 regulatory capital in panel A, and as is the sum of the lagged value of
Tier 1 regulatory capital and the current net income minus the current dividend payment in panel B.
is the target capital
ratio defined respectively as the non-weighted Tier 1 capital ratio (T1_TA) and risk-based Tier 1 capital ratio (T1_RWA) in columns (1) and (2). In columns Eq.5 and Eq.6, we respectively estimate the target capital ratio using equations 5 (GMM) and 6 (Random Effect Estimator). is a dummy variable equal to one if the bank capital ratio is below the
target at t-1, and zero otherwise. is a dummy variable equal to one if there is a gap between voting and cash-flow rights of the ultimate shareholder, and zero otherwise. P-values are shown in parentheses.* p < 0.1, ** p < 0.05, *** p < 0.01.
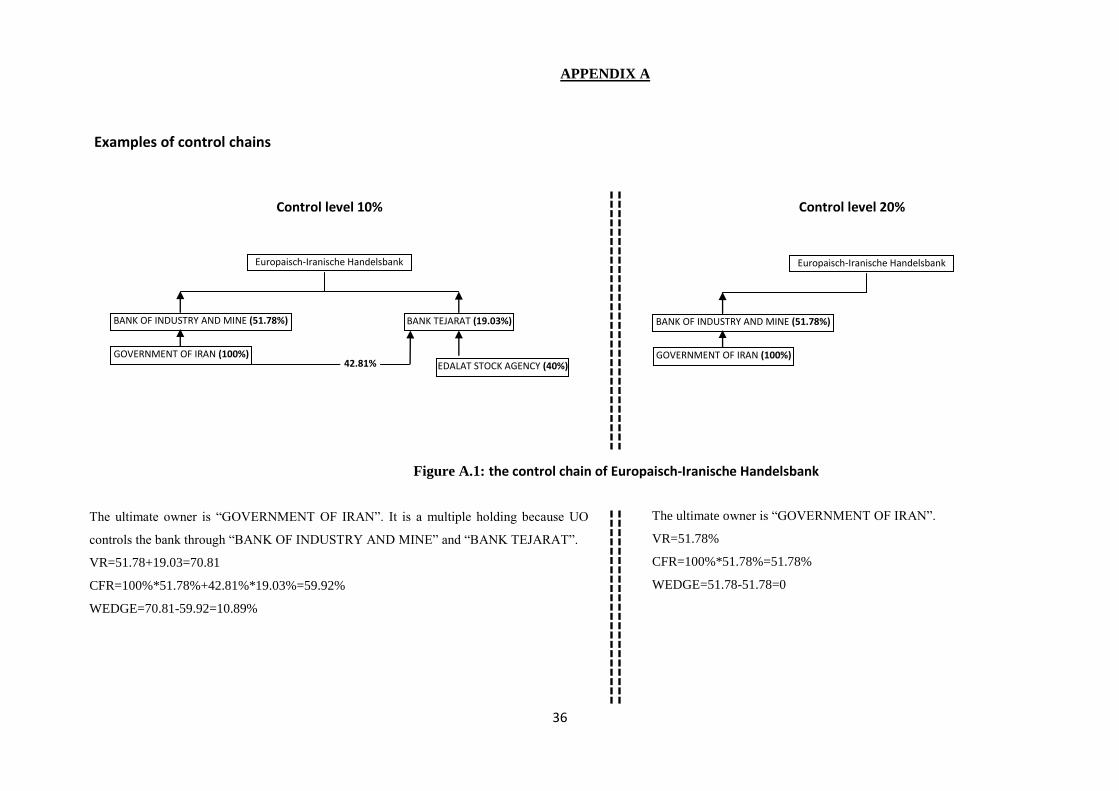
36
Examples of control chains
Europaisch-Iranische Handelsbank
AG
BANK OF INDUSTRY AND MINE (51.78%) BANK TEJARAT (19.03%)
GOVERNMENT OF IRAN (100%) EDALAT STOCK AGENCY (40%) 42.81%
Control level 20% Control level 10%
Europaisch-Iranische Handelsbank
AG
BANK OF INDUSTRY AND MINE (51.78%)
GOVERNMENT OF IRAN (100%)
The ultimate owner is “GOVERNMENT OF IRAN”. It is a multiple holding because UO
controls the bank through “BANK OF INDUSTRY AND MINE” and “BANK TEJARAT”.
VR=51.78+19.03=70.81
CFR=100%*51.78%+42.81%*19.03%=59.92%
WEDGE=70.81-59.92=10.89%
The ultimate owner is “GOVERNMENT OF IRAN”.
VR=51.78%
CFR=100%*51.78%=51.78%
WEDGE=51.78-51.78=0
Figure A.1: the control chain of Europaisch-Iranische Handelsbank
APPENDIX A
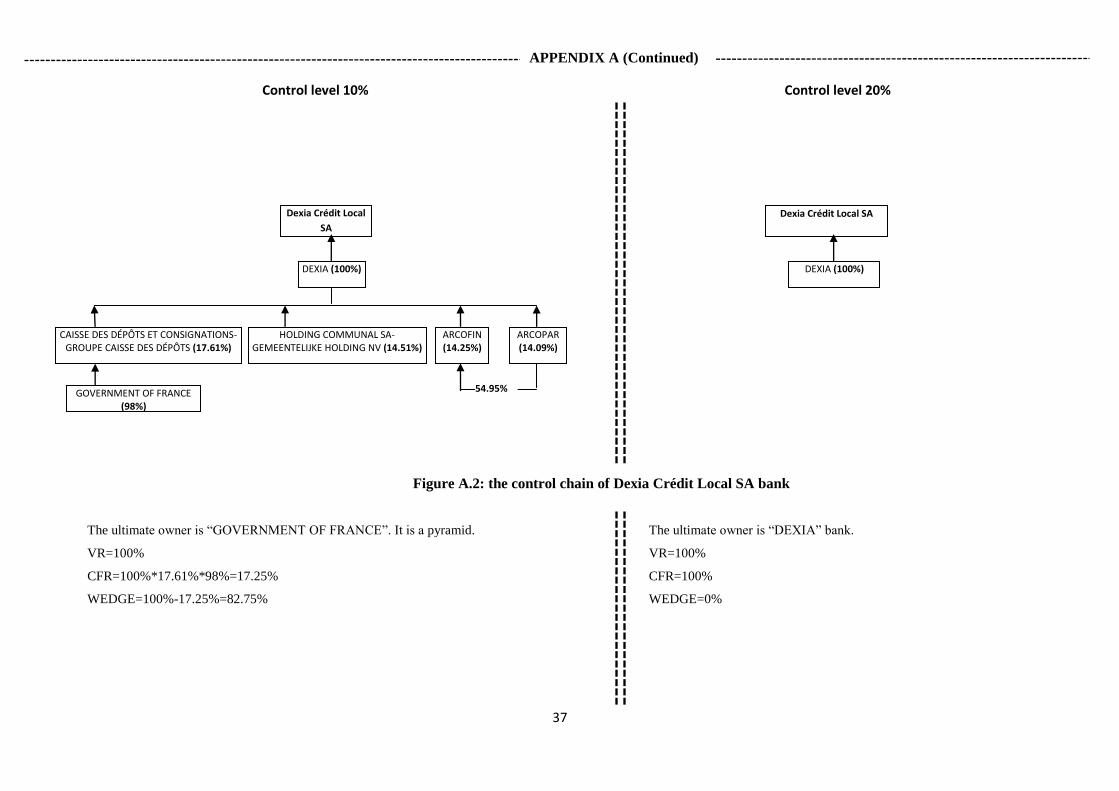
37
Dexia Crédit Local
SA
CAISSE DES DÉPÔTS ET CONSIGNATIONS-GROUPE CAISSE DES DÉPÔTS (17.61%)
DEXIA (100%)
HOLDING COMMUNAL SA-GEMEENTELIJKE HOLDING NV (14.51%)
ARCOFIN (14.25%)
ARCOPAR (14.09%)
GOVERNMENT OF FRANCE (98%)
54.95%
APPENDIX A (Continued)
The ultimate owner is “GOVERNMENT OF FRANCE”. It is a pyramid.
VR=100%
CFR=100%*17.61%*98%=17.25%
WEDGE=100%-17.25%=82.75%
Dexia Crédit Local SA
DEXIA (100%)
The ultimate owner is “DEXIA” bank.
VR=100%
CFR=100%
WEDGE=0%
Control level 20% Control level 10%
Figure A.2: the control chain of Dexia Crédit Local SA bank
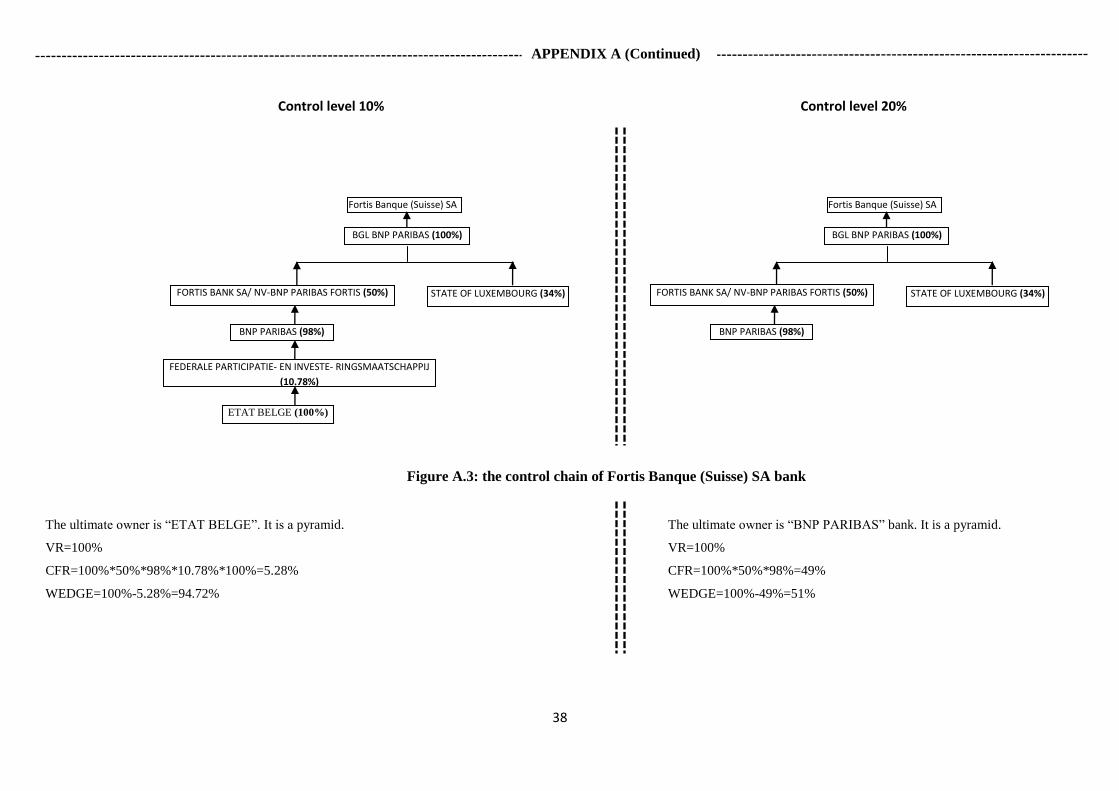
38
Fortis Banque (Suisse) SA
BGL BNP PARIBAS (100%)
FORTIS BANK SA/ NV-BNP PARIBAS FORTIS (50%) STATE OF LUXEMBOURG (34%)
BNP PARIBAS (98%)
FEDERALE PARTICIPATIE- EN INVESTE- RINGSMAATSCHAPPIJ
(10.78%)
ETAT BELGE (100%)
The ultimate owner is “ETAT BELGE”. It is a pyramid.
VR=100%
CFR=100%*50%*98%*10.78%*100%=5.28%
WEDGE=100%-5.28%=94.72%
Fortis Banque (Suisse) SA
BGL BNP PARIBAS (100%)
FORTIS BANK SA/ NV-BNP PARIBAS FORTIS (50%) STATE OF LUXEMBOURG (34%)
BNP PARIBAS (98%)
The ultimate owner is “BNP PARIBAS” bank. It is a pyramid.
VR=100%
CFR=100%*50%*98%=49%
WEDGE=100%-49%=51%
Control level 20% Control level 10%
Figure A.3: the control chain of Fortis Banque (Suisse) SA bank
APPENDIX A (Continued)
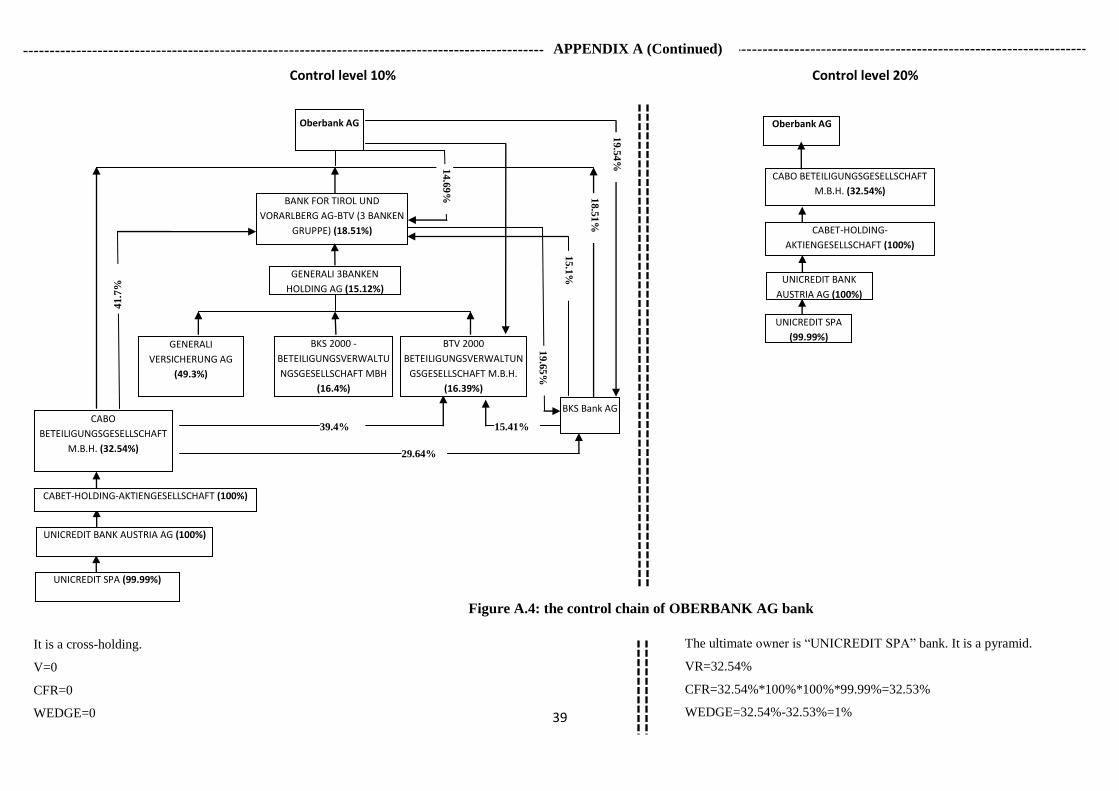
39
UNICREDIT SPA (99.99%)
GENERALI
VERSICHERUNG AG
(49.3%)
BKS 2000 -
BETEILIGUNGSVERWALTU
NGSGESELLSCHAFT MBH
(16.4%)
BTV 2000
BETEILIGUNGSVERWALTUN
GSGESELLSCHAFT M.B.H.
(16.39%)
CABO
BETEILIGUNGSGESELLSCHAFT
M.B.H. (32.54%)
BKS Bank AG
CABET-HOLDING-AKTIENGESELLSCHAFT (100%)
UNICREDIT BANK AUSTRIA AG (100%)
Oberbank AG
BANK FOR TIROL UND
VORARLBERG AG-BTV (3 BANKEN
GRUPPE) (18.51%)
GENERALI 3BANKEN
HOLDING AG (15.12%)
19.54%
29.64%
39.4%
18.51%
19.65%
15.1%
14.69%
15.41%
41.7
%
UNICREDIT SPA
(99.99%)
CABO BETEILIGUNGSGESELLSCHAFT
M.B.H. (32.54%)
CABET-HOLDING-
AKTIENGESELLSCHAFT (100%)
UNICREDIT BANK
AUSTRIA AG (100%)
Oberbank AG
Control level 20% Control level 10%
Figure A.4: the control chain of OBERBANK AG bank
The ultimate owner is “UNICREDIT SPA” bank. It is a pyramid.
VR=32.54%
CFR=32.54%*100%*100%*99.99%=32.53%
WEDGE=32.54%-32.53%=1%
It is a cross-holding.
V=0
CFR=0
WEDGE=0
APPENDIX A (Continued)
40
APPENDIX B
Table B.1
Expected signs and magnitudes of capital adjustment speeds
Downward adjustment
Upward adjustment = 0
= 1
= 0 significant
positive and significant
positive and non-significant
' positive and significant
' non-significant ' negative and significant
Extreme case: ' + ' is non-significant
41
APPENDIX C
Table C.1
Description of the variables used to estimate the target capital ratio
Variable Description Source Expected
sign Authors
LN_TA Natural logarithm of total assets Bankscope Negative (-) (Brewer et al., 2008), (Gropp & Heider, 2011)
ROA Net income to total asset ratio Bankscope Ambiguous (+/-) (Flannery & Rangan, 2008), (Marcus, 1983), (Ayuso
et al., 2004), (Gropp & Heider, 2011)
LLP Loan loss provisions to net loans ratio Bankscope Ambiguous (+/-) (Ayuso et al., 2004), (Nier & Baumann, 2006), (Gropp
& Heider, 2011).
COST_EQ Net income to equity ratio Bankscope Ambiguous (+/-) (Ayuso et al., 2004), (Berger et al., 1995), (Nier &
Baumann, 2006)
CV Charter value defined as the ratio of bank deposits in total deposits of all
banks in a given country
Bankscope Ambiguous (+/-) (Fonseca & González, 2010), (Gropp & Heider, 2011),
(Berger et al., 2008)
LO_TA Net loans to total asset ratio Bankscope Negative (-) (Ayuso et al., 2004)
MKT_DISC Market discipline variable defined as total long term market funding to
total funding ratio
Bankscope Positive (+) (Nier & Baumann, 2006)
GDPG Real Growth Domestic Product World bank database Ambiguous (+/-) (Ayuso et al., 2004), (Jokipii & Milne, 2008), (Nier &
Baumann, 2006), (Berger et al., 1995)
LO_GR
BASEL2
Loan growth
Dummy equal to one if year is greater than 2006, and 0 otherwise
Bankscope
Author’s definition
Ambiguous (+/-)
Positive (+)
(Shehzad et al., 2010)
Authors’ calculation
42
LISTED Dummy equal to one if the bank is listed, and 0 otherwise Bankscope Ambiguous (+/-) (Shehzad et al., 2010)
U_CAP Dummy equal to one if Tier 1 risk based capital ratio is lower or equal to
4%, and 0 otherwise
Bankscope Negative (-) (Rime, 2001), (Jokipii & Milne, 2011), (Jacques &
Nigro, 1997)
A_CAP Dummy equal to one if Tier 1 risk based capital ratio is between 4 and
7%, and 0 otherwise
Bankscope Negative (-) (Rime, 2001), (Jokipii & Milne, 2011), (Jacques &
Nigro, 1997)
CAP_INDEX Capital index which is the total number of affirmative answers to eleven
questions17
(Barth et al., 2004)
database
Positive (+) (Shehzad et al., 2010), (Laeven & Levine, 2009)
17 Q1: Is the minimum capital ratio in line with the Basel guidelines? Q2: Does the minimum capital ratio vary as a function of market risk? Q3: Does the minimum capital ratio vary as a function of credit risk? Q4: Does the minimum capital ratio vary as a function of operational risk? Q5: Is there a simple leverage ratio that is required? Q6: Is market value of loan losses not realized in accounting books deducted from the book value of capital before minimum capital adequacy is determined? Q7: Are unrealized losses in securities portfolios deducted from the book value of capital before minimum capital adequacy is determined? Q8: Are unrealized foreign exchange losses deducted from the book value of capital before minimum capital adequacy is determined? Q9: Are accounting practices for banks in accordance with International Accounting Standards (IAS)? Q10: Is subordinated debt allowed as part of regulatory capital? Q11: Is subordinated debt required as part of regulatory capital?
Table C.1 (Continued)
43
APPENDIX D
Table D.1
Correlation matrix of the main explanatory variables used to estimate the target capital ratio
LN_TA LO_TA ROA COST_EQ LLP MKT_DISC LO_GR CV GDPG BASEL2 LISTED U_CAP A_CAP CAP_INDEX
LN_TA 1.00
LO_TA -0.02 1.00
ROA -0.09 -0.04 1.00
COST_EQ 0.12 -0.01 0.72 1.00
LLP -0.08 0.03 -0.23 -0.24 1.00
MKT_DISC 0.13 0.23 -0.06 -0.01 -0.03 1.00
LO_GR -0.10 0.18 0.11 0.14 -0.14 0.00 1.00
CV 0.60 -0.08 -0.03 0.10 -0.08 -0.02 -0.05 1.00
GDPG 0.05 -0.01 0.17 0.27 -0.26 -0.03 0.21 0.13 1.00
BASEL2 0.06 0.00 -0.09 -0.12 0.10 0.01 -0.08 -0.07 -0.25 1.00
LISTED 0.27 0.12 0.05 0.09 0.04 -0.04 0.02 0.25 0.09 -0.08 1.00
U_CAP 0.19 -0.19 -0.09 0.00 -0.06 0.03 -0.06 0.24 -0.06 0.13 0.02 1.00
A_CAP 0.18 0.21 -0.05 0.00 0.01 0.07 -0.04 0.04 -0.06 0.10 0.06 -0.27 1.00
CAP_INDEX 0.15 -0.11 -0.00 0.01 0.00 -0.03 -0.06 0.01 0.00 0.05 -0.09 0.07 0.05 1.00
LN_TA is the natural logarithm of bank’s total asset. LO_TA is the ratio of net loans to total asset. ROA is profitability measured by the return on asset. COST_EQ is the opportunity cost of equity measured by the return on equity. LLP is the ratio of loan loss provisions to net loans. MKT_DISC is the ratio of total long term funding to total funding. LO_GR is loan growth. CV is the bank’s charter value measured as the share of bank deposits in total deposits of all banks in a given country. GDPG is the real Gross domestic product growth. BASEL2 is a dummy variable that takes the value one if year is greater to 2006, and zero otherwise. Listed is a dummy variable equal to one if the bank is listed, and zero otherwise. U_CAP is a dummy variable equal to one if the risk-based Tier 1 capital ratio is less than or equal 4, and zero otherwise. A_CAP is a dummy variable equal to one if the risk-based Tier 1 capital ratio is between 4 and 7, and zero otherwise. CAP_INDEX is a regulatory capital index as defined in Table C.1.
44
APPEDIX E
Table E.1
Loans of European commercial banks and the proportion of total loans of sample banks in total loans of all commercial banks available in Bankscope by country
Country
Commercial Banks available in Bankscope
Commercial Banks in the final sample
Loans
Banks with wedge Banks without wedge Loans Per cent a Loans Per cent a
Austria 131550.80 21454.89 0.16 29040.48 0.22
Belgium 514323.90 445577.09 0.87 63650.83 0.12
Denmark 477270.00 394232.14 0.83 44727.45 0.09
Finland 105520.10 83157.88 0.79 184.27 0.00
France 1649908.00 545681.05 0.33 769708.36 0.47
Germany 1350270.00 719554.39 0.53 209164.20 0.15
Greece 202621.80 93066.05 0.46 102861.95 0.51
Ir eland 444870.70 1590.48 0.00 446800.36 1.00
Italy 1900353.00 679888.37 0.36 964233.78 0.51
Luxembourg 159875.90 73036.14 0.46 34944.70 0.22
Netherlands 1347776.00 394729.16 0.29 500981.22 0.37
Norway 181535.50 126625.49 0.70 2923.40 0.02
Portugal 138297.50 7963.75 0.06 107902.20 0.78
Spain 1330837.00 274207.22 0.21 944216.41 0.71
Sweeden 286477.20 470.35 0.00 231430.02 0.81
Switzerland 544670.60 11623.94 0.02 388547.82 0.71
United Kingdom 2900402.00 1974273.54 0.68 428936.23 0.15
Total 13666560.00 5847131.95 0.43 5270253.66 0.39
a is the proportion of loans of a commercial bank with or without wedge in total loans of all commercial banks provided in Bankscope in a given country.
45
APPENDIX F
Table F.1
Capital adjustment speed and ownership structure over the 2002-2010 period for controlled banks
Dependent variable
Panel A: active and passive changes in capital
Panel B: active change
in capital
(1) (2) (1) (2)
Eq.5 Eq.6 Eq.5 Eq.6 Eq.5 Eq.6 Eq.5 Eq.6 0.49*** 0.47*** 0.40*** 0.37*** 0.46*** 0.43*** 0.39*** 0.38***
(0.00) (0.00) (0.00) (0.00) (0.00) (0.00) (0.00) (0.00) 0.02 0.03 0.08 0.03 0.00 0.03 0.03 0.02
(0.90) (0.82) (0.37) (0.00) (0.97) (0.65) (0.75) (0.74) 0.07 -0.04 0.11 0.05 0.05 0.05 -0.00 0.04
(0.57) (0.68) (0.12) (0.00) (0.69) (0.56) (0.91) (0.47) -0.37 -0.17 -0.31 -0.18** -0.47* -0.46*** -0.37*** -0.36***
(0.14) (0.49) (0.13) (0.02) (0.05) (0.00) (0.00) (0.00)
INTERCEPT 0.35*** 0.11 0.46*** 0.20 0.13* 0.15* 0.13 -0.26**
(0.00) (0.48) (0.00) (0.14) (0.09) (0.08) (0.21) (0.03)
Number of observations 1259 1263 1243 1249 1256 1254 1240 1243 0.51 0.50 0.48 0.40 0.47 0.46 0.42 0.40
Risk level to reject =0 0.00 0.00 0.00 0.00 0.00 0.00 0.00 0.00 0.56 0.43 0.51 0.42 0.51 0.48 0.39 0.42
Risk level to reject 0.00 0.00 0.00 0.00 0.00 0.00 0.00 0.00 0.22 0.29 0.28 0.27 0.04 0.05 0.05 0.08
Risk level to reject 0.06 0.00 0.00 0.00 0.70 0.19 0.58 0.75
Table F.1 reports the estimation results for equation (4) using fixed effect estimator for a subsample of European Commercial
controlled banks over the 2002-2010 period. , is the actual deviation. , is the target
deviation. is defined as the lagged value of Tier 1 regulatory capital in panel A, and as is the sum of the lagged value of
Tier 1 regulatory capital and the current net income minus the current dividend payment in panel B.
is the target capital
ratio defined respectively as the non-weighted Tier 1 capital ratio (T1_TA) and risk-based Tier 1 capital ratio (T1_RWA) in columns (1) and (2). In columns Eq.5 and Eq.6, we respectively estimate the target capital ratio using equations 5 (GMM) and 6 (Random Effect Estimator). is a dummy variable equal to one if the bank capital ratio is below the
target at t-1, and zero otherwise. is a dummy variable equal to one if there is a gap between voting and cash-flow rights of the ultimate shareholder, and zero otherwise. P-values are shown in parentheses.* p < 0.1, ** p < 0.05, *** p < 0.01.
46
Table F.2
Capital adjustment speed and ownership structure over the 2002-2010 period for listed banks
Dependent variable
Panel A: active and passive changes in capital
Panel B: active change in
capital
(1) (2) (1) (2)
Eq.5 Eq.6 Eq.5 Eq.6 Eq.5 Eq.6 Eq.5 Eq.6 0.49*** 0.47*** 0.44** 0.45*** 0.46*** 0.45*** 0.38*** 0.41***
(0.00) (0.00) (0.01) (0.00) (0.00) (0.00) (0.00) (0.00) -0.03 -0.04 0.05 0.05 0.04 -0.01 0.06 0.02
(0.56) (0.34) (0.59) (0.55) (0.39) (0.18) (0.67) (0.29) 0.04 0.02 0.02 0.05 -0.01 -0.02 0.04 0.02
(0.43) (0.25) (0.27) (0.58) (0.10) (0.51) (0.46) (0.26) -0.23** -0.19* -0.16** -0.23* -0.42** -0.36** -0.40*** -0.40**
(0.04) (0.07) (0.02) (0.05) (0.03) (0.01) (0.00) (0.01)
INTERCEPT 0.27*** 0.81*** 0.02 -0.07 -0.07 0.09 -0.43*** -0.33***
(0.00) (0.00) (0.96) (0.55) (0.30)
(0.20)
(0.00)
(0.00)
Number of observations 629 635 630 635 629 630 630 631 0.46 0.43 0.49 0.50 0.50 0.44 0.44 0.43
Risk level to reject =0 0.00 0.00 0.00 0.00 0.00 0.00 0.00 0.00 0.53 0.49 0.46 0.50 0.45 0.43 0.42 0.43
Risk level to reject 0.00 0.00 0.00 0.00 0.00 0.00 0.00 0.00 0.27 0.26 0.30 0.32 0.07 0.06 0.08 0.05
Risk level to reject 0.00 0.01 0.00 0.00 0.21 0.32 0.20 0.48
Table F.2 reports the estimation results for equation (4) using fixed effect estimator for a subsample of European Commercial
listed banks over the 2002-2010 period. , is the actual deviation. , is the target
deviation. is defined as the lagged value of Tier 1 regulatory capital in panel A, and as is the sum of the lagged value of
Tier 1 regulatory capital and the current net income minus the current dividend payment in panel B.
is the target capital
ratio defined respectively as the non-weighted Tier 1 capital ratio (T1_TA) and risk-based Tier 1 capital ratio (T1_RWA) in columns (1) and (2). In columns Eq.5 and Eq.6, we respectively estimate the target capital ratio using equations 5 (GMM) and 6 (Random Effect Estimator). is a dummy variable equal to one if the bank capital ratio is below the
target at t-1, and zero otherwise. is a dummy variable equal to one if there is a gap between voting and cash-flow rights of the ultimate shareholder, and zero otherwise. P-values are shown in parentheses.* p < 0.1, ** p < 0.05, *** p < 0.01.
47
Table F.3
Capital adjustment speed and ownership structure over the 2002-2006 period
Dependent variable
Panel A: active and passive changes in capital
Panel B: active change in
capital
(1) (2) (1) (2)
Eq.5 Eq.6 Eq.5 Eq.6 Eq.5 Eq.6 Eq.5 Eq.6 0.47*** 0.45*** 0.39*** 0.40*** 0.46*** 0.45*** 0.42*** 0.38***
(0.00) (0.00) (0.00) (0.00) (0.00) (0.00) (0.00) (0.00) -0.02 -0.04 -0.03 -0.03 0.05 0.03 0.02 0.04
(0.34) (0.24) (0.87) (0.33) (0.56) (0.68) (0.88) (0.42) 0.06 0.05 0.04 0.03 0.00 0.03 0.03 0.04
(0.75) (0.59) (0.74) (0.37) (0.99) (0.39) (0.73) (0.48) -0.20 -0.21 -0.16** -0.13* -0.45*** -0.46*** -0.42*** -0.43***
(0.33) (0.12) (0.03) (0.09) (0.00) (0.00) (0.00) (0.00)
INTERCEPT 0.55*** 0.46 0.94*** -0.13 0.28** 0.61*** 0.52*** -0.50***
(0.00) (0.16) (0.00) (0.47) (0.02)
(0.00)
(0.00)
(0.00)
Number of observations 620 631 609 623 618 629 608 624 0.45 0.41 0.36 0.37 0.51 0.48 0.44 0.42
Risk level to reject =0 0.00 0.00 0.00 0.00 0.00 0.00 0.00 0.00 0.53 0.50 0.43 0.43 0.46 0.48 0.45 0.42
Risk level to reject 0.00 0.00 0.00 0.00 0.00 0.00 0.00 4.45 0.31 0.25 0.24 0.27 0.06 0.05 0.05 0.03
Risk level to reject 0.00 0.00 0.01 0.00 0.45 0.79 0.36 0.55
Table F.3 reports the estimation results for equation (4) using fixed effect estimator for the whole sample of European
Commercial over the period 2002-2006. , is the actual deviation. , is the target
deviation. is defined as the lagged value of Tier 1 regulatory capital in panel A, and as is the sum of the lagged value of
Tier 1 regulatory capital and the current net income minus the current dividend payment in panel B.
is the target capital
ratio defined respectively as the non-weighted Tier 1 capital ratio (T1_TA) and risk-based Tier 1 capital ratio (T1_RWA) in columns (1) and (2). In columns Eq.5 and Eq.6, we respectively estimate the target capital ratio using equations 5 (GMM) and 6 (Random Effect Estimator). is a dummy variable equal to one if the bank capital ratio is below the
target at t-1, and zero otherwise. is a dummy variable equal to one if there is a gap between voting and cash-flow rights of the ultimate shareholder, and zero otherwise. P-values are shown in parentheses.* p < 0.1, ** p < 0.05, *** p < 0.01.
48
Table F.4
Capital adjustment speed and ownership structure over the 2002-2010 period for banks above the regulatory capital requirement
Dependent variable
Panel A: active and passive changes in capital
Panel B: active change in
capital
(1) (2) (1) (2)
Eq.5 Eq.6 Eq.5 Eq.6 Eq.5 Eq.6 Eq.5 Eq.6 0.44*** 0.43*** 0.40*** 0.42*** 0.42*** 0.39*** 0.39*** 0.37***
(0.00) (0.00) (0.00) (0.00) (0.00) (0.00) (0.00) (0.00) 0.01 0.03 0.01 0.02 0.01 0.02 0.05 0.03
(0.30) (0.53) (0.12) (0.29) (0.40) (0.29) (0.57) (0.35) 0.01 0.01 0.02 0.02 0.06 0.04 -0.02 0.01
(0.34) (0.38) (0.19) (0.52) (0.60) (0.48) (0.73) (0.45) -0.21 -0.17* -0.17** -0.17* -0.42** -0.38*** -0.38** -0.35***
(0.15) (0.09) (0.04) (0.06) (0.01) (0.00) (0.03) (0.00)
INTERCEPT 0.26*** 0.14 0.43*** 0.183 0.07 0.12 0.10 -0.33***
(0.00) (0.34) (0.00) (0.134) (0.27)
(0.17)
(0.24)
(0.00)
Number of observations 1488 1485 1472 1477 1485 1477 1469 1472 0.45 0.46 0.41 0.44 0.43 0.41 0.44 0.40
Risk level to reject =0 0.00 0.00 0.00 0.00 0.00 0.00 0.00 0.00 0.45 0.44 0.42 0.44 0.48 0.43 0.37 0.38
Risk level to reject 0.00 0.00 0.00 0.00 0.00 0.00 0.00 0.00 0.25 0.30 0.26 0.29 0.07 0.07 0.04 0.06
Risk level to reject 0.00 0.00 0.00 0.00 0.50 0.16 0.60 0.23
Table F.4 reports the estimation results for equation (4) using fixed effect estimator on the subsample of European
Commercial banks above the regulatory capital minimum over the 2002-2010 period. , is the actual
deviation. , is the target deviation. is defined as the lagged value of Tier 1 regulatory capital in
panel A, and as is the sum of the lagged value of Tier 1 regulatory capital and the current net income minus the current
dividend payment in panel B.
is the target capital ratio defined respectively as the non-weighted Tier 1 capital ratio
(T1_TA) and risk-based Tier 1 capital ratio (T1_RWA) in columns (1) and (2). In columns Eq.5 and Eq.6, we respectively estimate the target capital ratio using equations 5 (GMM) and 6 (Random Effect Estimator). is a dummy
variable equal to one if the bank capital ratio is below the target at t-1, and zero otherwise. is a dummy variable equal to one if there is a gap between voting and cash-flow rights of the ultimate shareholder, and zero otherwise. P-values are shown in parentheses.* p < 0.1, ** p < 0.05, *** p < 0.01.
49
Table F.5
Capital adjustment speed and ownership structure over the 2002-2010 period for the whole sample using a target capital ratio that controls for ownership structure
Dependent variable
Panel A: active and passive changes in capital
Panel B: active change in
capital
(1) (2) (1) (2)
Eq.5 Eq.6 Eq.5 Eq.6 Eq.5 Eq.6 Eq.5 Eq.6 0.45*** 0.46*** 0.47*** 0.45*** 0.43*** 0.40*** 0.39*** 0.42***
(0.00) (0.00) (0.00) (0.00) (0.00) (0.00) (0.00) (0.00) 0.01 0.03 -0.01 0.02 0.01 -0.01 0.03 -0.01
(0.15) (0.27) (0.39) (0.36) (0.26) (0.12) (0.19) (0.43) 0.02 0.04 0.03 0.04 -0.01 0.01 0.03 -0.02
(0.17) (0.37) (0.10) (0.32) (0.22) (0.32) (0.20) (0.21) -0.24 -0.25** -0.22 -0.23* -0.35** -0.34*** -0.35* -0.30***
(0.10) (0.06) (0.26) (0.09) (0.04) (0.00) (0.06) (0.00)
INTERCEPT 0.21*** 0.32** 0.23* 0.25 0.20 0.12 0.11 0.12** *
(0.00) (0.04) (0.09) (0.20) (0.26)
(0.31)
(0.29)
(0.00)
Number of observations 1492 1492 1476 1485 1489 1485 1473 1479 0.46 0.49 0.46 0.47 0.44 0.39 0.42 0.41
Risk level to reject =0 0.00 0.00 0.00 0.00 0.00 0.00 0.00 0.00 0.47 0.50 0.50 0.49 0.42 0.41 0.42 0.40
Risk level to reject 0.00 0.00 0.00 0.00 0.00 0.00 0.00 0.00 0.31 0.27 0.27 0.28 0.08 0.06 0.10 0.09
Risk level to reject 0.00 0.00 0.00 0.00 0.42 0.46 0.18 0.39
Table F.6 reports the estimation results for equation (4) using fixed effect estimator for the whole sample of European
Commercial over the period 2002-2010 using a target capital ratio that controls for ownership structure. ,
is the actual deviation. , is the target deviation. is defined as the lagged value of Tier 1 regulatory
capital in panel A, and as is the sum of the lagged value of Tier 1 regulatory capital and the current net income minus the
current dividend payment in panel B.
is the target capital ratio defined respectively as the non-weighted Tier 1 capital
ratio (T1_TA) and risk-based Tier 1 capital ratio (T1_RWA) in columns (1) and (2). In columns Eq.5 and Eq.6, we respectively estimate the target capital ratio using equations 5 (GMM) and 6 (Random Effect Estimator). is a
dummy variable equal to one if the bank capital ratio is below the target at t-1, and zero otherwise. is a dummy variable equal to one if there is a gap between voting and cash-flow rights of the ultimate shareholder, and zero otherwise. P-values are shown in parentheses.* p < 0.1, ** p < 0.05, *** p < 0.01.
50
Table F.6
Capital adjustment speed and ownership structure over the 2002-2010 period for the whole sample using a 20% control threshold
Dependent variable
Panel A: active and passive changes in capital
Panel B: active change in
capital
(1) (2) (1) (2)
Eq.5 Eq.6 Eq.5 Eq.6 Eq.5 Eq.6 Eq.5 Eq.6 0.46*** 0.46*** 0.44*** 0.43*** 0.41*** 0.37*** 0.39*** 0.40***
(0.00) (0.00) (0.00) (0.00) (0.00) (0.00) (0.00) (0.00) 0.05 0.02 0.08 0.06 -0.01 0.03 0.02 0.01
(0.55) (0.15) (0.25) (0.63) (0.39) (0.31) (0.21) (0.18) 0.06 0.03 0.06 0.06 -0.03 0.02 -0.01 0.01
(0.68) (0.72) (0.51) (0.26) (0.31) (0.20) (0.12) (0.12) -0.26* -0.24 -0.29 -0.25** -0.32** -0.38*** -0.32** -0.35***
(0.08) (0.38) (0.67) (0.04) (0.03) (0.00) (0.02) (0.47)
INTERCEPT 0.33*** 0.29*** 0.31*** 0.20 0.07 -0.06 -0.01 -0.26**
(0.00) (0.00) (0.00) (0.11) (0.18)
(0.38)
(0.87)
(0.02)
Number of observations 1522 1524 1507 1513 1518 1514 1503 1506 0.51 0.48 0.52 0.49 0.40 0.40 0.41 0.41
Risk level to reject =0 0.00 0.00 0.00 0.00 0.00 0.00 0.00 0.00 0.52 0.49 0.50 0.49 0.38 0.39 0.38 0.41
Risk level to reject 0.00 0.00 0.00 0.00 0.00 0.00 0.00 0.00 0.31 0.27 0.29 0.30 0.05 0.04 0.08 0.07
Risk level to reject 0.00 0.00 0.00 0.00 0.58 0.56 0.67 0.60
Table F.5 reports the estimation results for equation (4) using fixed effect estimator on the whole sample of European
Commercial using a 20% control threshold over the 2002-2010 period. , is the actual deviation. , is the target deviation. is defined as the lagged value of Tier 1 regulatory capital in panel A,
and as is the sum of the lagged value of Tier 1 regulatory capital and the current net income minus the current dividend
payment in panel B.
is the target capital ratio defined respectively as the non-weighted Tier 1 capital ratio (T1_TA) and
risk-based Tier 1 capital ratio (T1_RWA) in columns (1) and (2). In columns Eq.5 and Eq.6, we respectively estimate the target capital ratio using equations 5 (GMM) and 6 (Random Effect Estimator). is a dummy variable equal to
one if the bank capital ratio is below the target at t-1, and zero otherwise. is a dummy variable equal to one if there is a gap between voting and cash-flow rights of the ultimate shareholder, and zero otherwise. P-values are shown in parentheses.* p < 0.1, ** p < 0.05, *** p < 0.01.