Embed Size (px)
Citation preview
Bankable Business Plans
Most people who aim at nothing ……hit it with remarkable accuracy!
Presented by: Brendan Binchy E: [email protected] :+353-862657321 W: www.rocg.com
© ROCG - Page 2
FundamentalsReporting and Planning Status Quo
© ROCG - Page 3
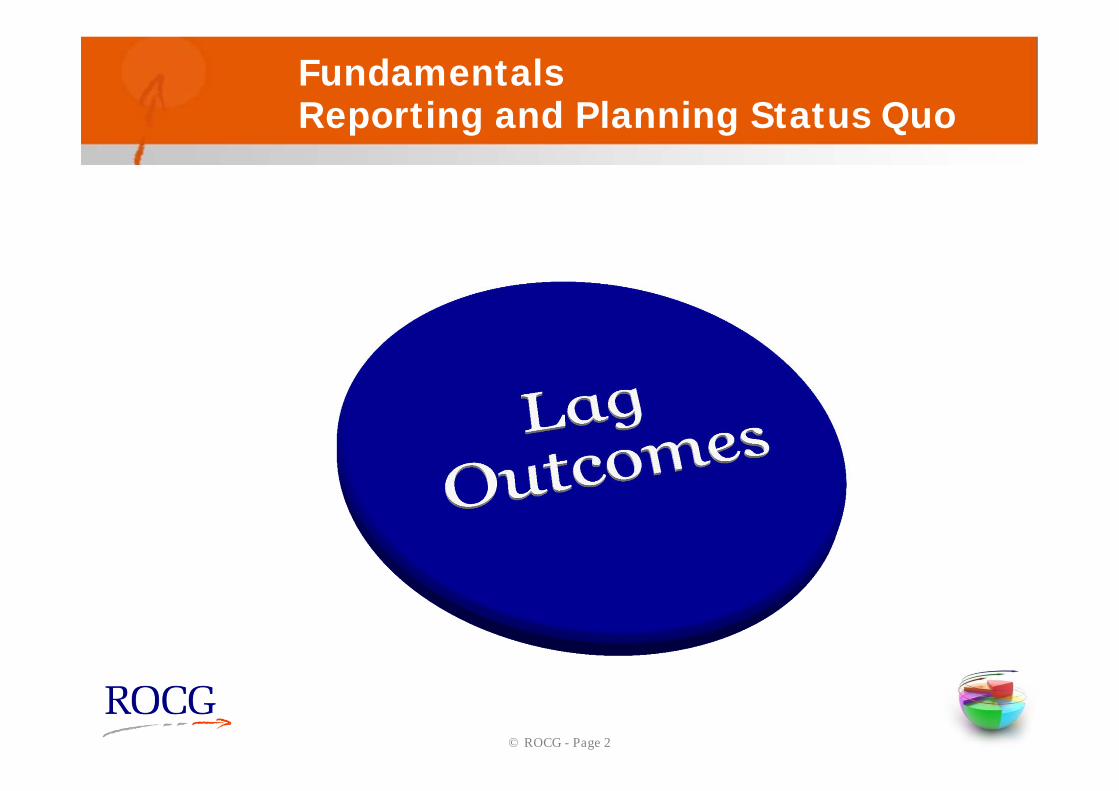
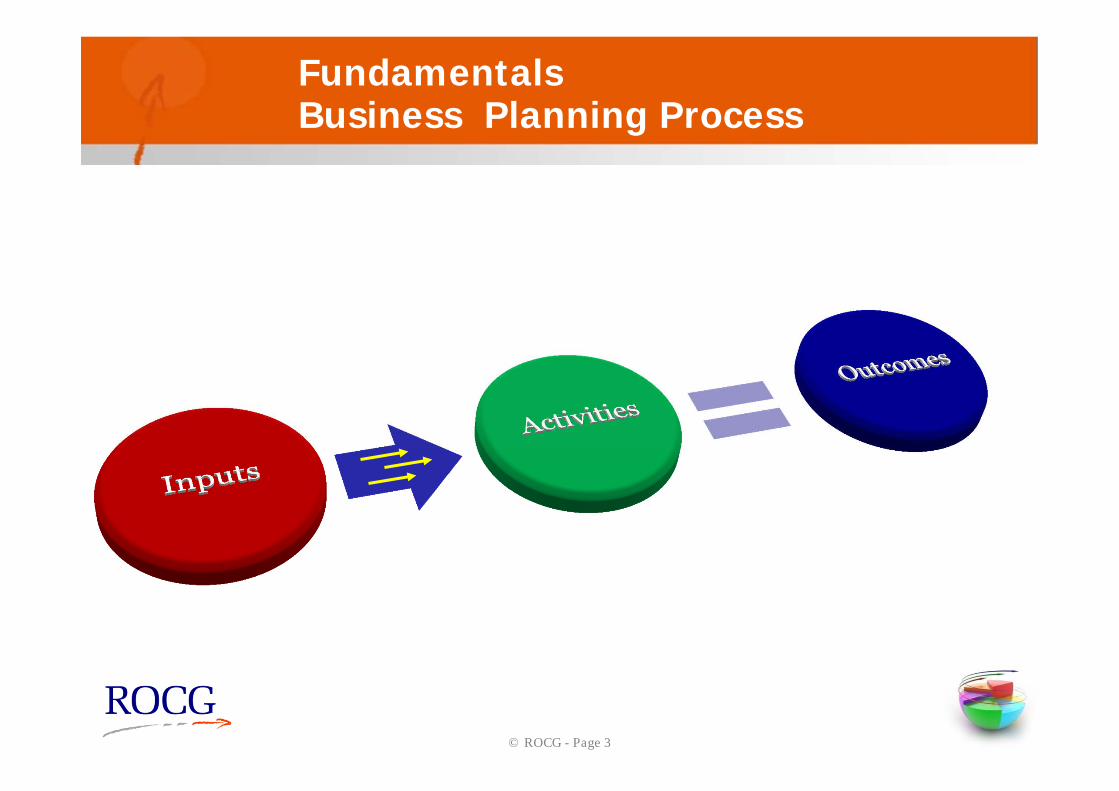
FundamentalsBusiness Planning Process

© ROCG - Page 4
Strategy – how you are going to get there…
2
1
Vision
CurrentPosition
Time
Objective
All roads lead to Rome, but which is the best?
© ROCG - Page 5
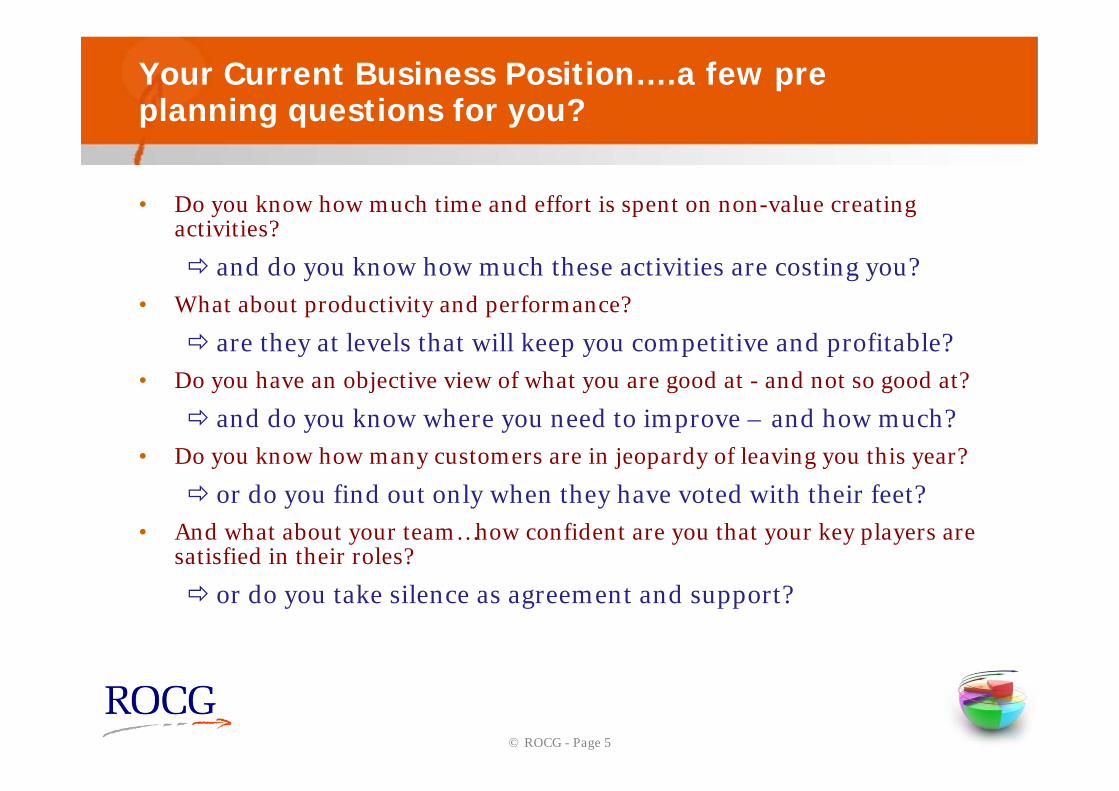
Your Current Business Position….a few pre planning questions for you?
• Do you know how much time and effort is spent on non-value creating activities?
and do you know how much these activities are costing you?• What about productivity and performance?
are they at levels that will keep you competitive and profitable?• Do you have an objective view of what you are good at - and not so good at?
and do you know where you need to improve – and how much?• Do you know how many customers are in jeopardy of leaving you this year?
or do you find out only when they have voted with their feet?• And what about your team…how confident are you that your key players are
satisfied in their roles?
or do you take silence as agreement and support?
© ROCG - Page 6
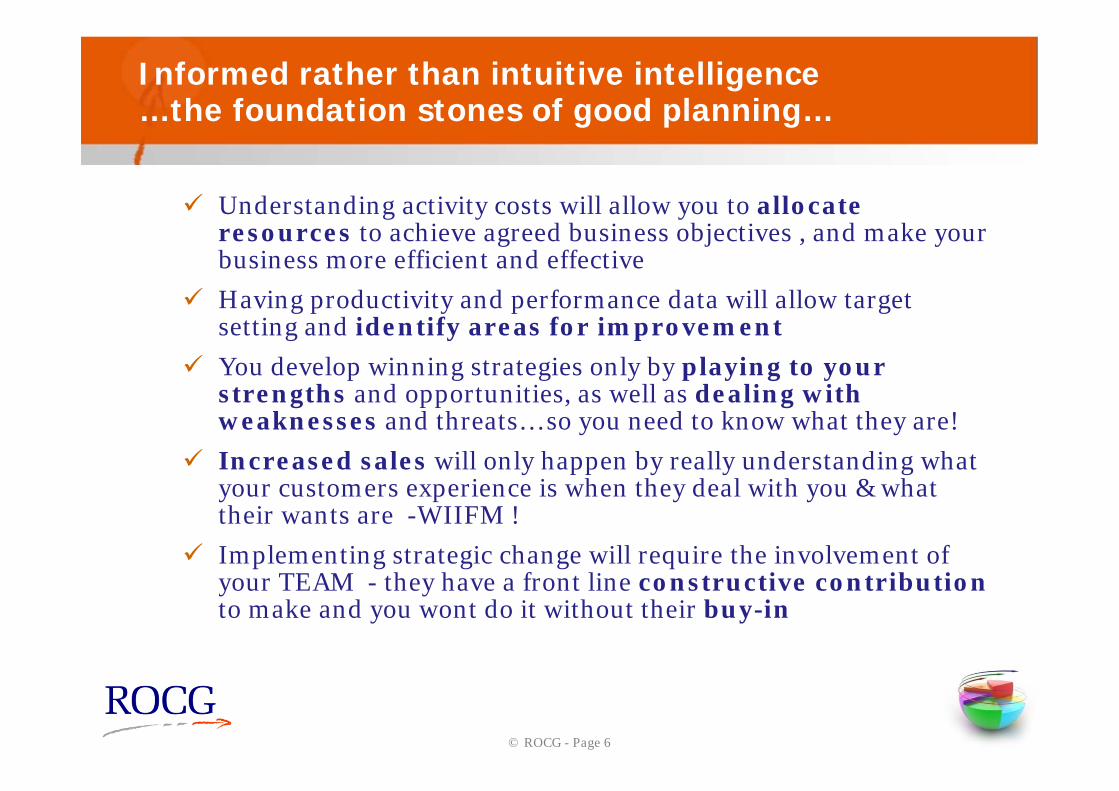
Informed rather than intuitive intelligence …the foundation stones of good planning…
Understanding activity costs will allow you to allocate resources to achieve agreed business objectives , and make your business more efficient and effective
Having productivity and performance data will allow target setting and identify areas for improvement
You develop winning strategies only by playing to your strengths and opportunities, as well as dealing with weaknesses and threats… so you need to know what they are!
Increased sales will only happen by really understanding what your customers experience is when they deal with you & what their wants are -WIIFM !
Implementing strategic change will require the involvement of your TEAM - they have a front line constructive contribution to make and you wont do it without their buy-in
© ROCG - Page 7
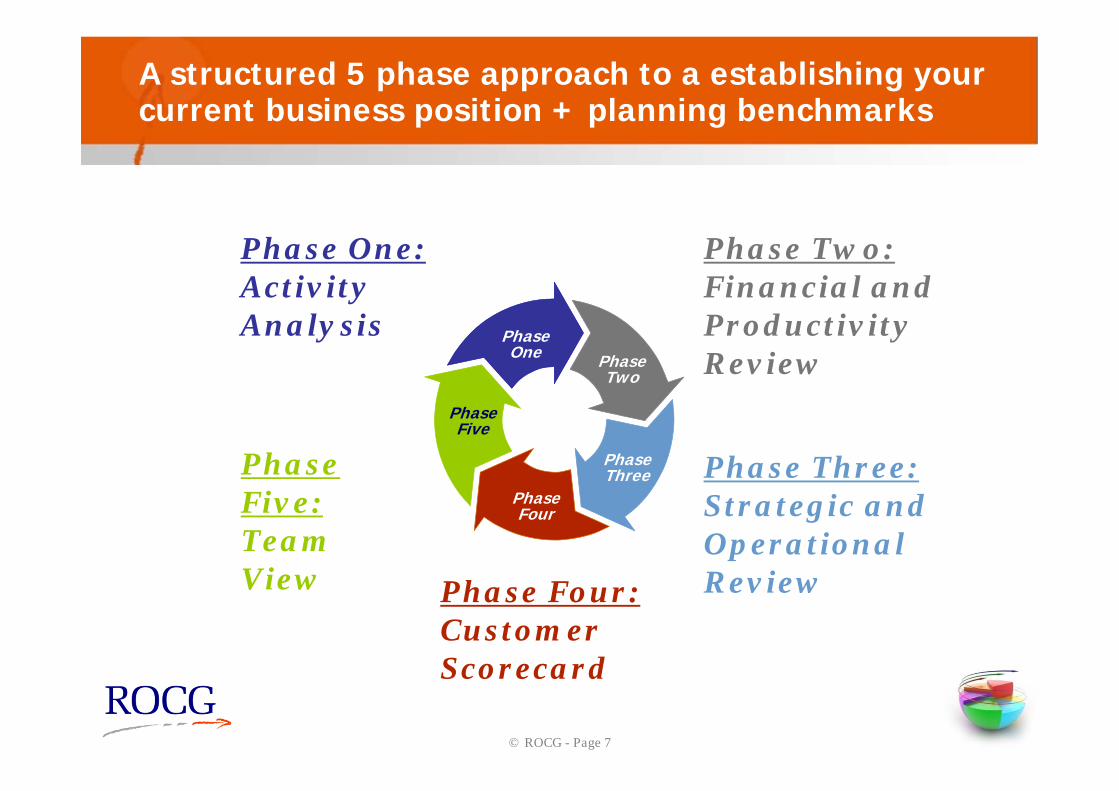
A structured 5 phase approach to a establishing your current business position + planning benchmarks
Phase Four:Customer Scorecard
Phase Three:Strategic and Operational Review
Phase One:Activity Analysis
Phase Five:Team View
Phase Two:Financial and Productivity ReviewPhase
Two
Phase Three
Phase Four
Phase Five
Phase One
© ROCG - Page 8
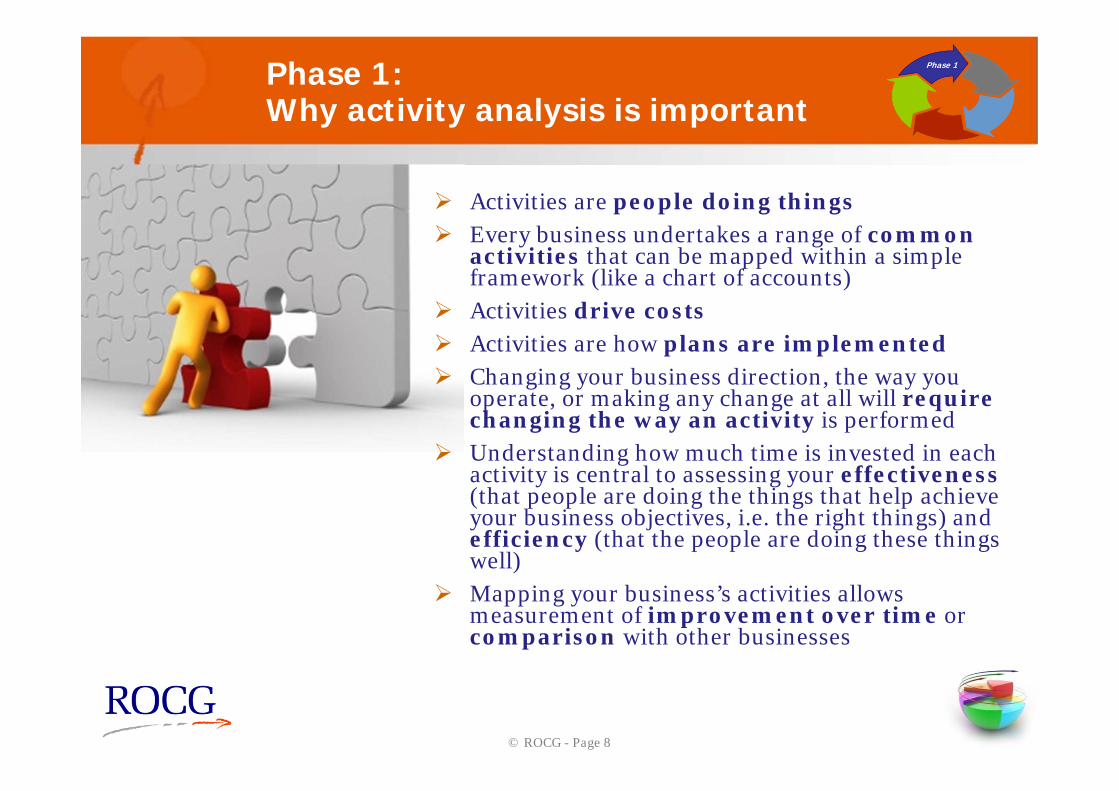
Phase 1: Why activity analysis is important
Activities are people doing things Every business undertakes a range of common
activities that can be mapped within a simple framework (like a chart of accounts)
Activities drive costs Activities are how plans are implemented Changing your business direction, the way you
operate, or making any change at all will require changing the way an activity is performed
Understanding how much time is invested in each activity is central to assessing your effectiveness(that people are doing the things that help achieve your business objectives, i.e. the right things) and efficiency (that the people are doing these things well)
Mapping your business’s activities allows measurement of improvement over time or comparison with other businesses
Phase 1
© ROCG - Page 9
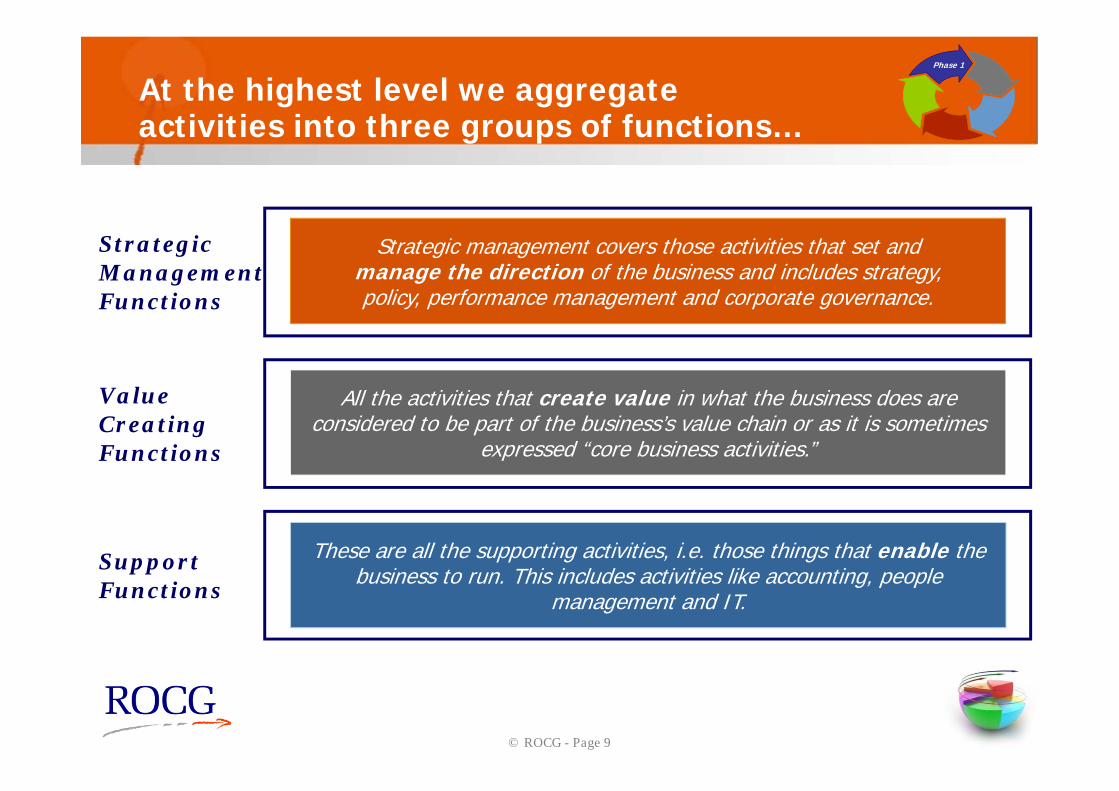
At the highest level we aggregate activities into three groups of functions…
Phase 1
Strategic management covers those activities that set and manage the direction of the business and includes strategy, policy, performance management and corporate governance.
All the activities that create value in what the business does are considered to be part of the business’s value chain or as it is sometimes
expressed “core business activities.”
These are all the supporting activities, i.e. those things that enable the business to run. This includes activities like accounting, people
management and IT.
Strategic Management Functions
Value Creating Functions
Support Functions
© ROCG - Page 10
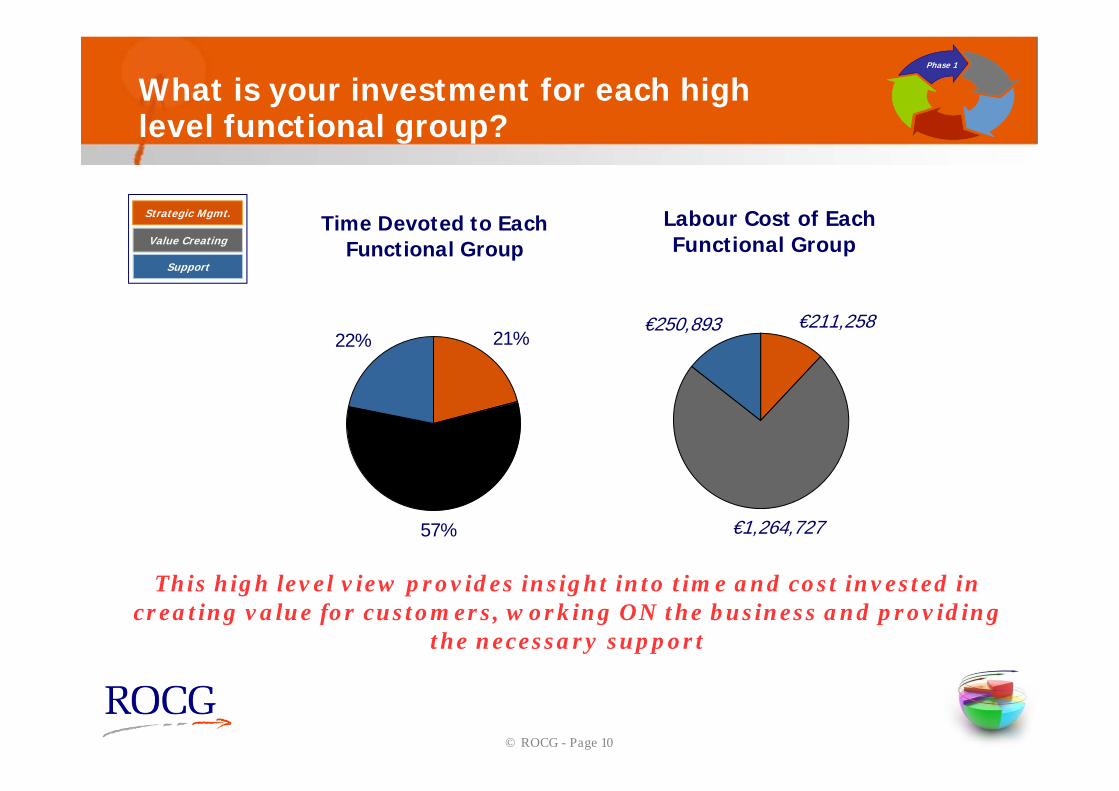
What is your investment for each high level functional group?
Strategic Mgmt.
Value Creating
Support
Time Devoted to EachFunctional Group
21%
57%
22%
This high level view provides insight into time and cost invested in creating value for customers, working ON the business and providing
the necessary support
Labour Cost of EachFunctional Group
€211,258
€1,264,727
€250,893
Phase 1
© ROCG - Page 11
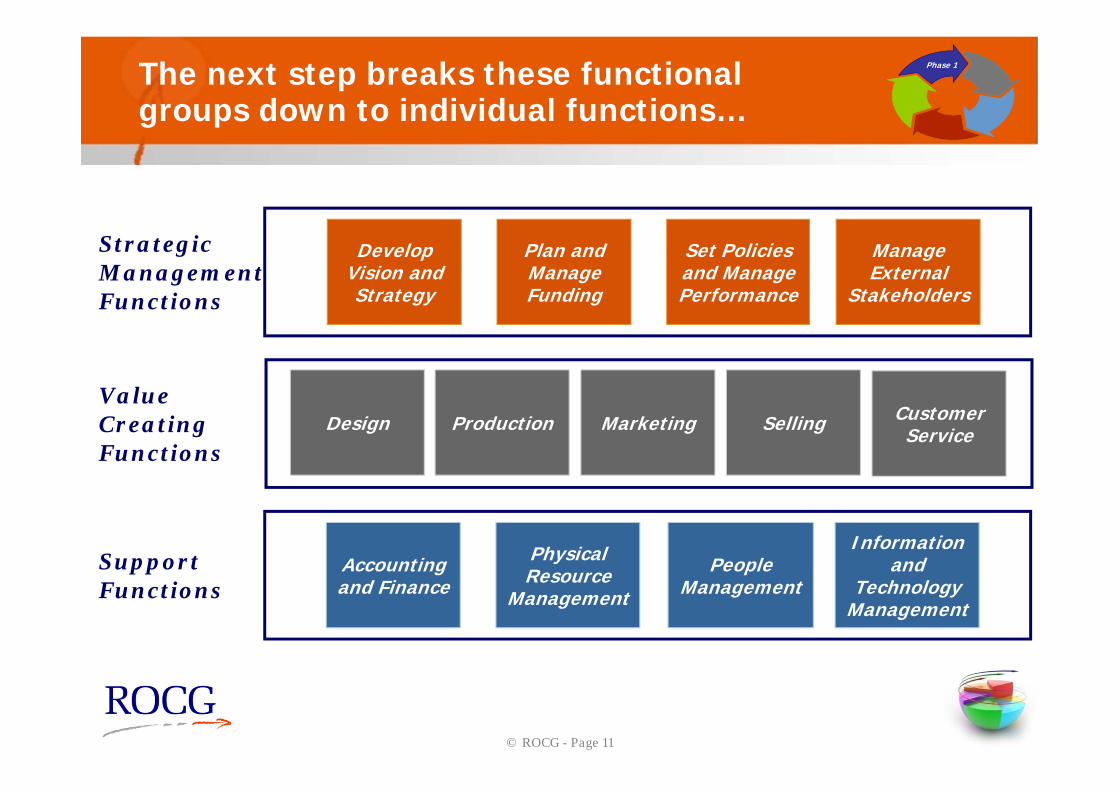
The next step breaks these functional groups down to individual functions…
Phase 1
Develop Vision and Strategy
Plan and Manage Funding
Set Policies and Manage Performance
Manage External
Stakeholders
Design Production Marketing Selling Customer Service
Accounting and Finance
Physical Resource
Management
People Management
Information and
Technology Management
Strategic Management Functions
Value Creating Functions
Support Functions
© ROCG - Page 12
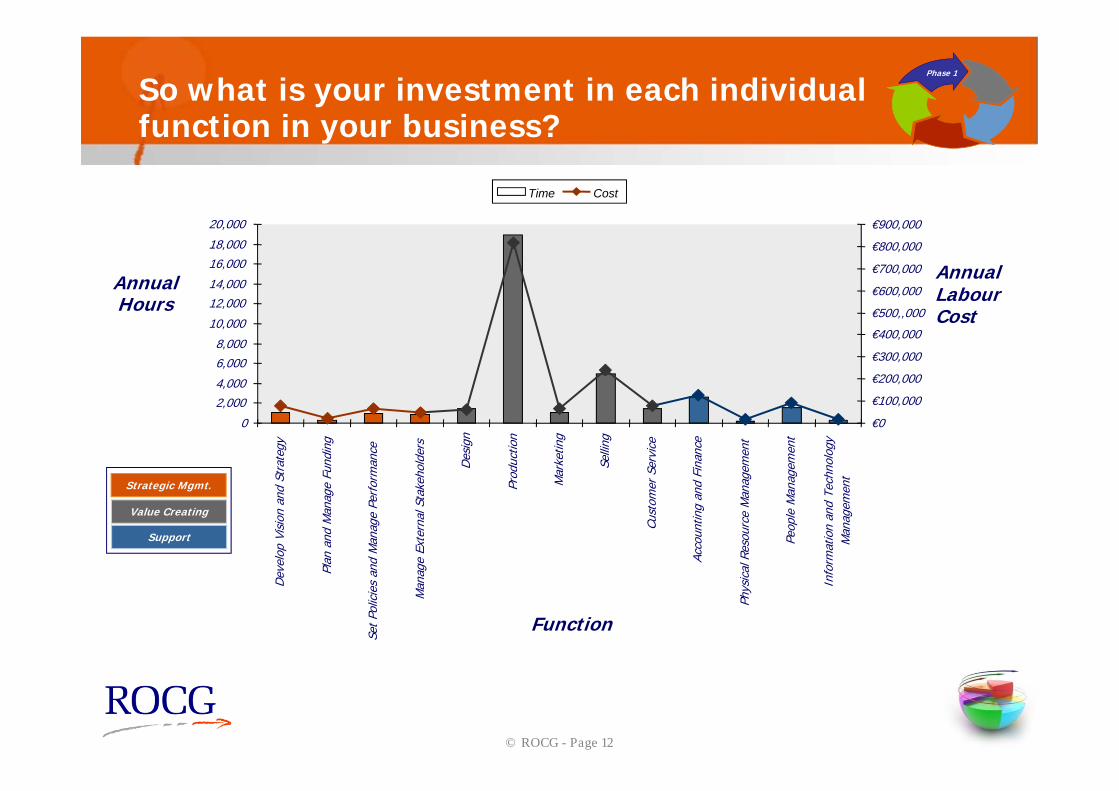
So what is your investment in each individual function in your business?
0
2,0004,000
6,0008,000
10,000
12,00014,000
16,00018,000
20,000
Dev
elop
Vis
ion
and
Stra
tegy
Plan
and
Man
age
Fund
ing
Set P
olic
ies
and
Man
age
Perf
orm
ance
Man
age
Exte
rnal
Sta
keho
lder
s
Des
ign
Prod
uctio
n
Mar
ketin
g
Selli
ng
Cust
omer
Ser
vice
Acco
untin
g an
d Fi
nanc
e
Phys
ical
Res
ourc
e M
anag
emen
t
Peop
le M
anag
emen
t
Info
rmat
ion
and
Tech
nolo
gyM
anag
emen
t
€0
€100,000
€200,000
€300,000
€400,000
€500,,000
€600,000
€700,000
€800,000
€900,000
Time Cost
Annual Hours
Function
Strategic Mgmt.
Value Creating
Support
AnnualLabourCost
Phase 1
© ROCG - Page 13
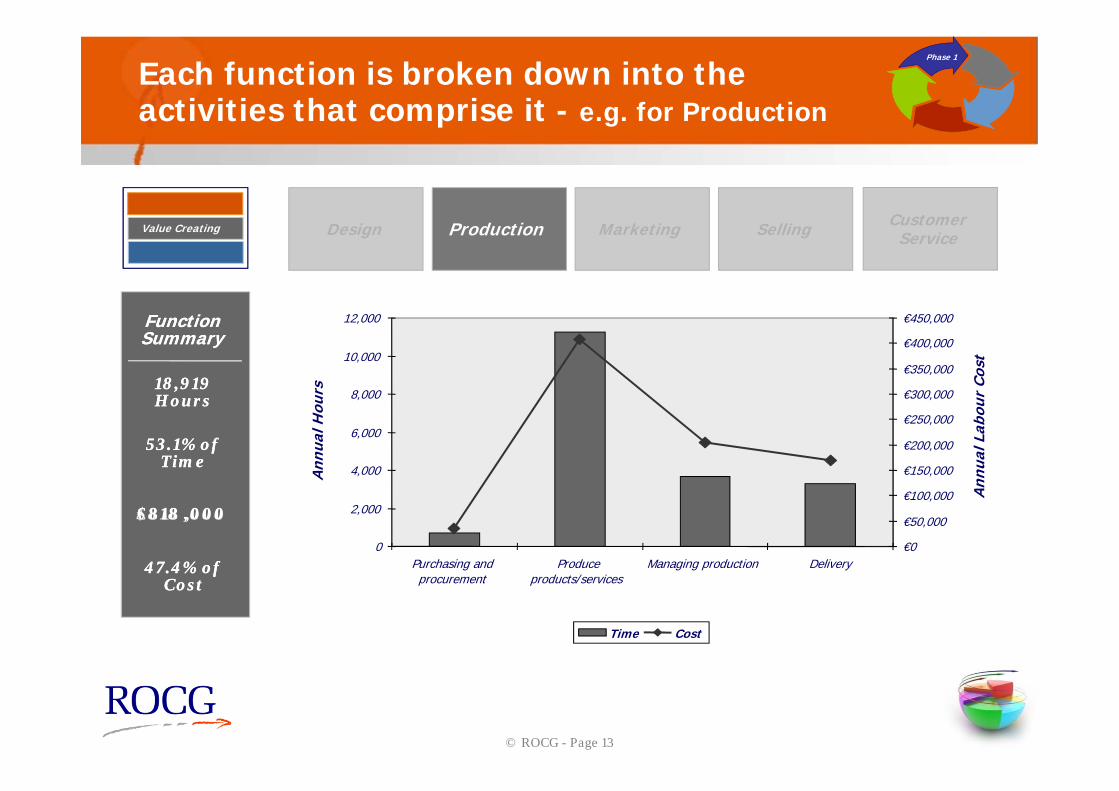
Each function is broken down into theactivities that comprise it - e.g. for Production
Design Production Marketing Selling Customer Service
Value CreatingValue Creating
0
2,000
4,000
6,000
8,000
10,000
12,000
Purchasing andprocurement
Produceproducts/services
Managing production Delivery
Ann
ual H
ours
€0
€50,000
€100,000
€150,000
€200,000
€250,000
€300,000
€350,000
€400,000
€450,000
Ann
ual L
abou
r Co
st
Time Cost
Function Summary
47.4% of Cost
$818 ,000
53.1% of Time
18,919 Hours
Function Summary
47.4% of Cost
€818 ,000
53.1% of Time
18,919 Hours
Phase 1
© ROCG - Page 14
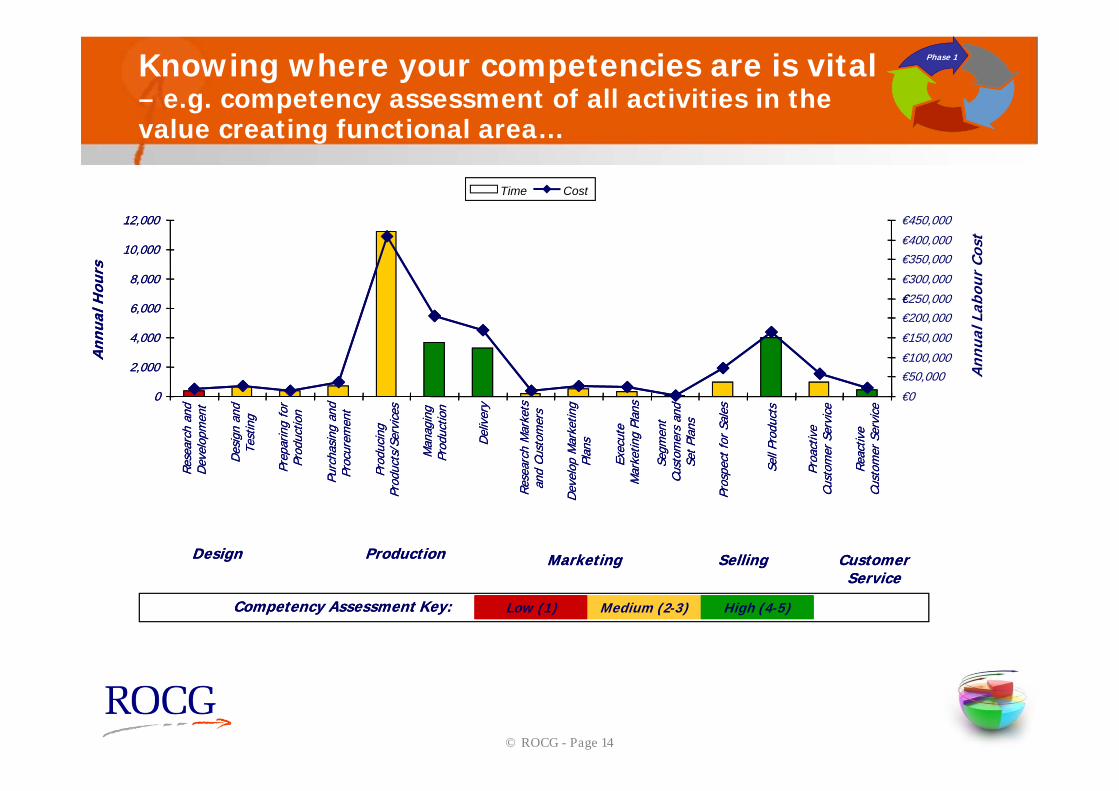
Knowing where your competencies are is vital– e.g. competency assessment of all activities in the value creating functional area…
0
2,000
4,000
6,000
8,000
10,000
12,000
Rese
arch
and
Dev
elop
men
t
Des
ign
and
Test
ing
Prep
arin
g fo
rPr
oduc
tion
Purc
hasi
ng a
ndPr
ocur
emen
t
Prod
ucin
gPr
oduc
ts/S
ervi
ces
Man
agin
gPr
oduc
tion
Del
iver
y
Rese
arch
Mar
kets
and
Cust
omer
s
Dev
elop
Mar
ketin
gPl
ans
Exec
ute
Mar
ketin
g Pl
ans
Segm
ent
Cust
omer
s an
dSe
t Pla
ns
Pros
pect
for
Sale
s
Sell
Prod
ucts
Proa
ctiv
eCu
stom
er S
ervi
ce
Reac
tive
Cust
omer
Ser
vice
Ann
ual H
ours
€0
€50,000€100,000
€150,000
€200,000€250,000€300,000
€350,000€400,000
€450,000
Ann
ual L
abou
r Co
st
Time Cost
Design Production Marketing Selling Customer Service
Low (1) Medium (2-3) High (4-5)Competency Assessment Key:
0
2,000
4,000
6,000
8,000
10,000
12,000
Rese
arch
and
Dev
elop
men
t
Des
ign
and
Test
ing
Prep
arin
g fo
rPr
oduc
tion
Purc
hasi
ng a
ndPr
ocur
emen
t
Prod
ucin
gPr
oduc
ts/S
ervi
ces
Man
agin
gPr
oduc
tion
Del
iver
y
Rese
arch
Mar
kets
and
Cust
omer
s
Dev
elop
Mar
ketin
gPl
ans
Exec
ute
Mar
ketin
g Pl
ans
Segm
ent
Cust
omer
s an
dSe
t Pla
ns
Pros
pect
for
Sale
s
Sell
Prod
ucts
Proa
ctiv
eCu
stom
er S
ervi
ce
Reac
tive
Cust
omer
Ser
vice
Ann
ual H
ours
€
Time Cost
Design Production Marketing Selling Customer Service
Low (1) Medium (2-3) High (4-5)Competency Assessment Key: Low (1) Medium (2-3) High (4-5)Low (1) Medium (2-3) High (4-5)Competency Assessment Key:
Phase 1
© ROCG - Page 15
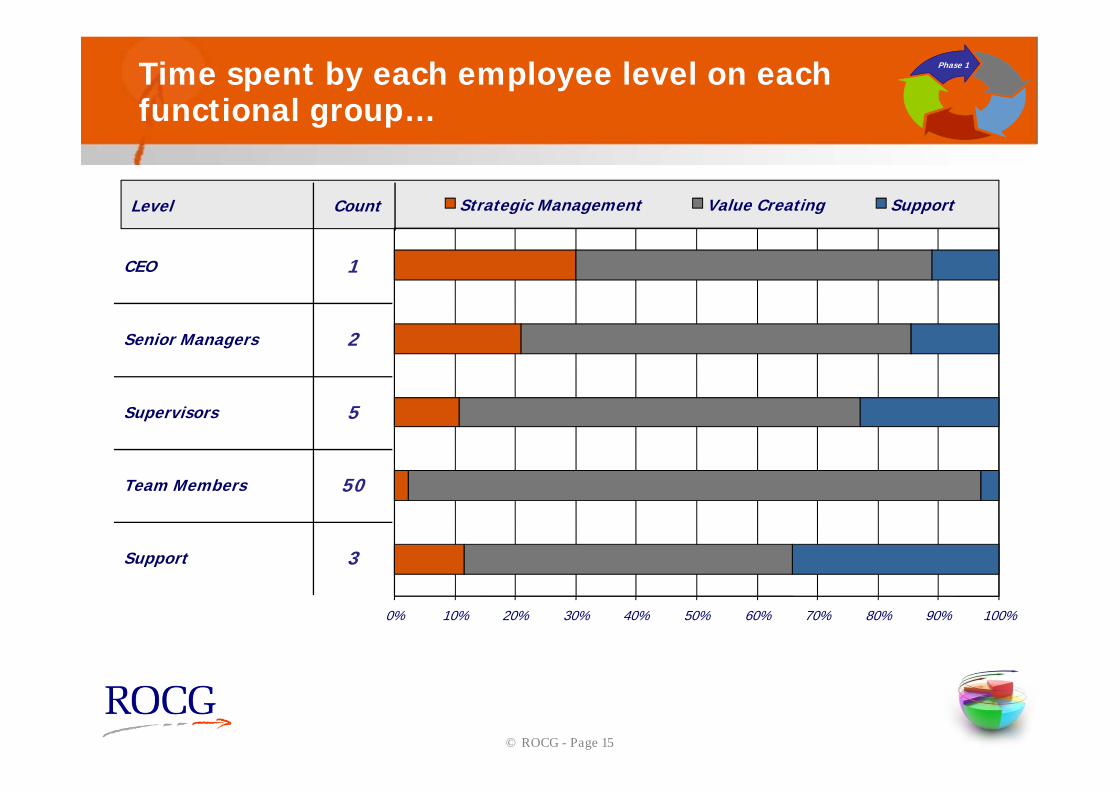
Time spent by each employee level on each functional group…
0% 10% 20% 30% 40% 50% 60% 70% 80% 90% 100%
Strategic Management Value Creating Support
50Team Members
3Support
5Supervisors
2Senior Managers
1CEO
CountLevel
Phase 1
© ROCG - Page 16
How activity analysis contributes to the planning process
Activity analysis provides a unique insight into what activities are consuming available labour resources and for how long (for all people across all activities) it shows where costs are actually incurred and not how they
are recorded Combining this information with traditional financial data allows
real calculations of productivity
You can make an internal assessment of areas of core competence of the business which can be subsequently tested from other perspectives
The next stage is to examine the outputs to measure productivity and performance
Phase 1
© ROCG - Page 17
Phase 2: How financial and productivity reviews contribute to planning
Traditional financial statements are lag indicators of recent business performance
However, when subjected to non traditional analysis & combined with other key information about the business’s output and with information from the activity analysis, a more insightful picture emerges
Numbers do not lie - as long as you use meaningful and comprehensive numbers - you will get a true picture of the trends & patterns in your business
The results can be used to develop further qualitative assessment as the overall position of the business
Phase 2
© ROCG - Page 18
Financial ratio analysis is a powerful starting point…
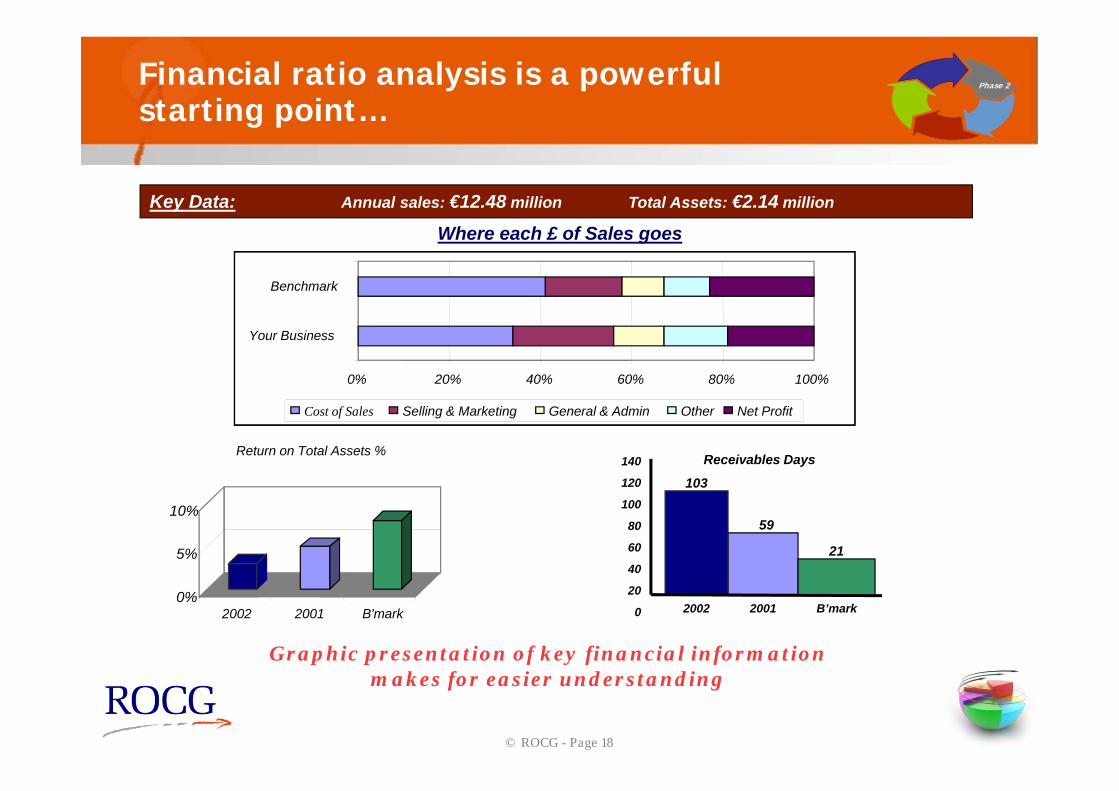
Key Data: Annual sales: €12.48 million Total Assets: €2.14 million
Where each £ of Sales goes
0%
5%
10%
2002 2001 B'mark
Return on Total Assets %
0% 20% 40% 60% 80% 100%
Your Business
Benchmark
Cost of Sales Selling & Marketing General & Admin Other Net Profit
2002 2001 B’mark
140
120
100
80
60
40
20
0
Receivables Days
103
59
21
Graphic presentation of key financial information makes for easier understanding
Phase 2
© ROCG - Page 19
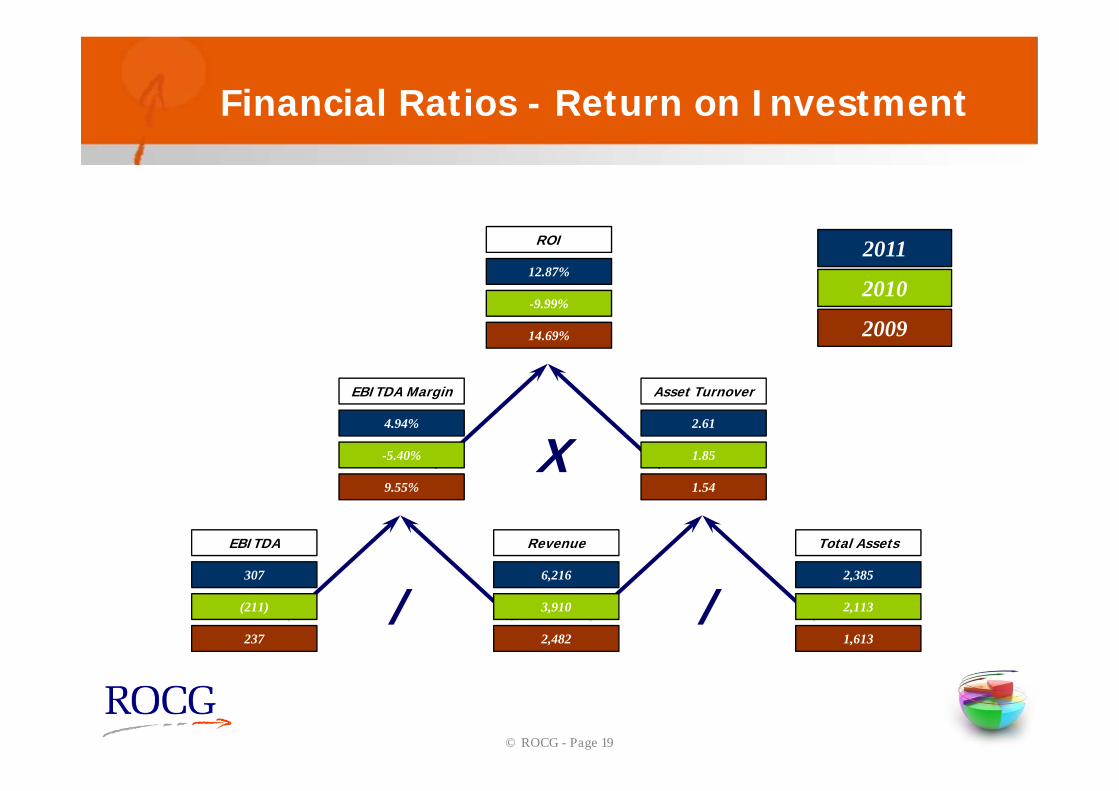
Financial Ratios - Return on Investment
EBITDA
307
(211)
237
Revenue
6,216
3,910
2,482
Total Assets
2,385
2,113
1,613
EBITDA Margin
4.94%
-5.40%
9.55%
Asset Turnover
2.61
1.85
1.54
ROI
12.87%
-9.99%
14.69%
2011
2010
2009
/ /
X
© ROCG - Page 20
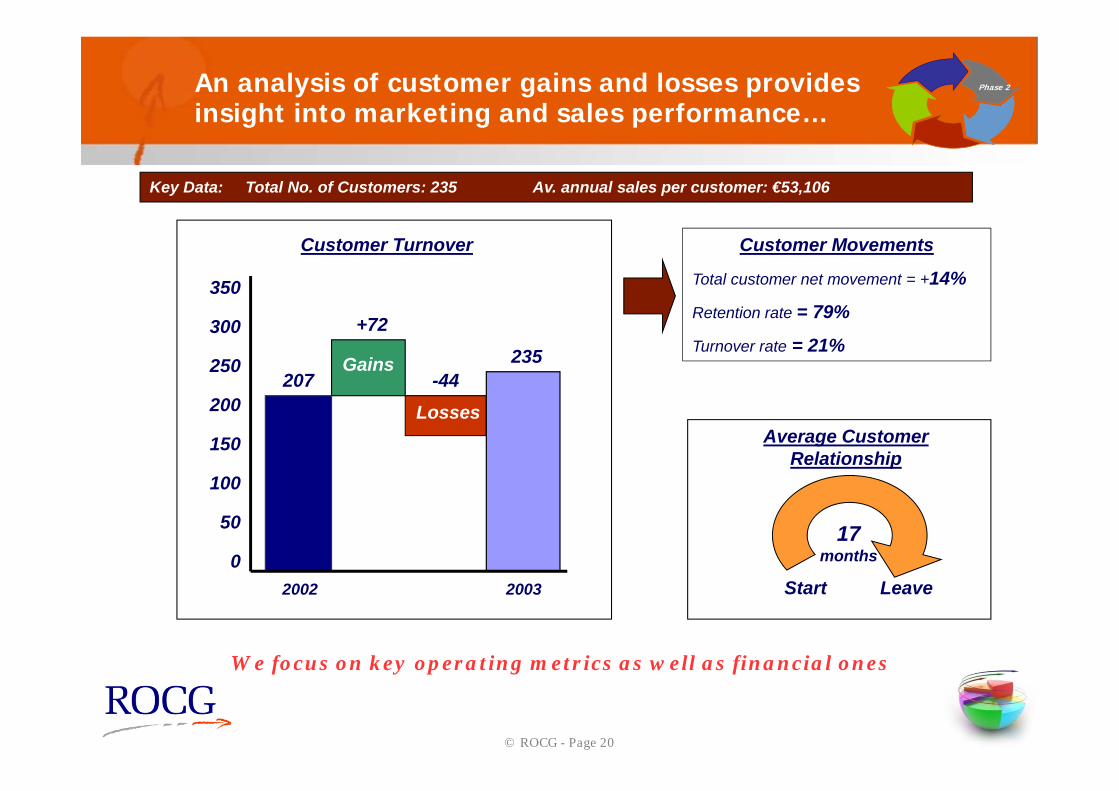
An analysis of customer gains and losses provides insight into marketing and sales performance…
Key Data: Total No. of Customers: 235 Av. annual sales per customer: €53,106
Start Leave
17 months
Average Customer Relationship
2002 2003
350
300
250
200
150
100
50
0
Customer Turnover
Gains
Losses207
+72
-44235
Customer Movements
Total customer net movement = +14%
Retention rate = 79%
Turnover rate = 21%
We focus on key operating metrics as well as financial ones
Phase 2
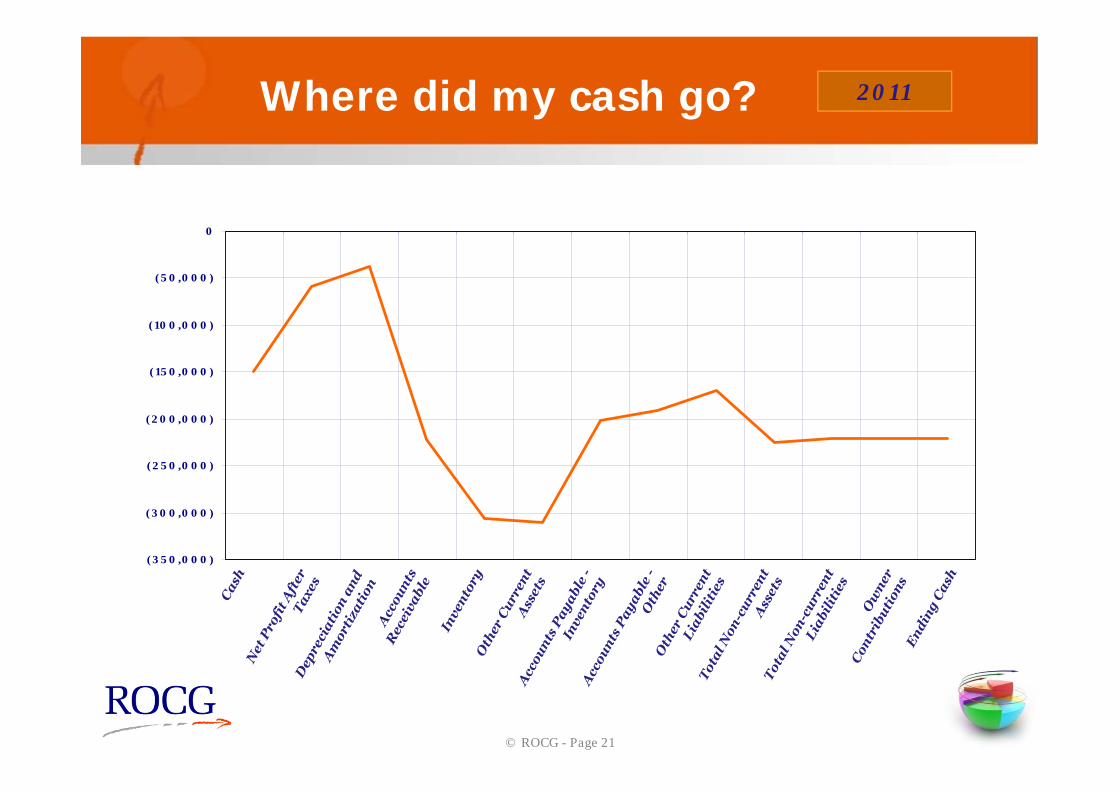
© ROCG - Page 21
Where did my cash go? 2011
(350,000)
(300,000)
(250,000)
(200,000)
(150,000)
(100,000)
(50,000)
0
© ROCG - Page 22
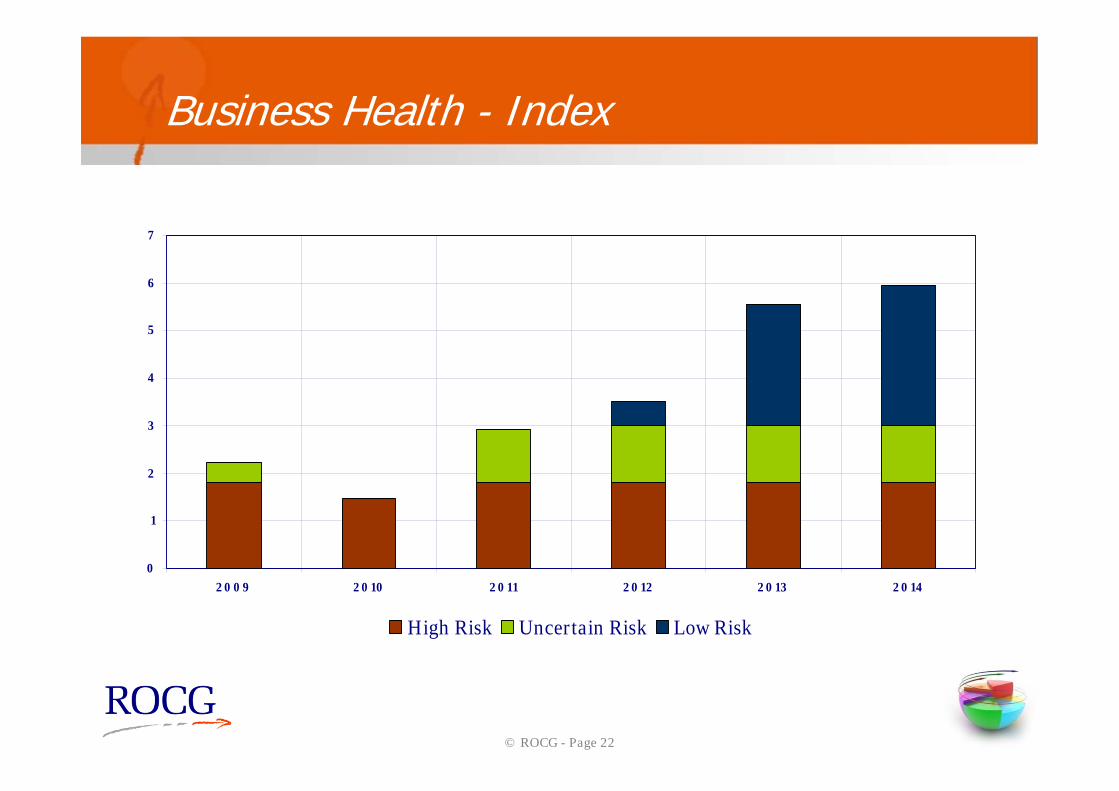
Business Health - Index
0
1
2
3
4
5
6
7
2009 2010 2011 2012 2013 2014
High Risk Uncertain Risk Low Risk
© ROCG - Page 23
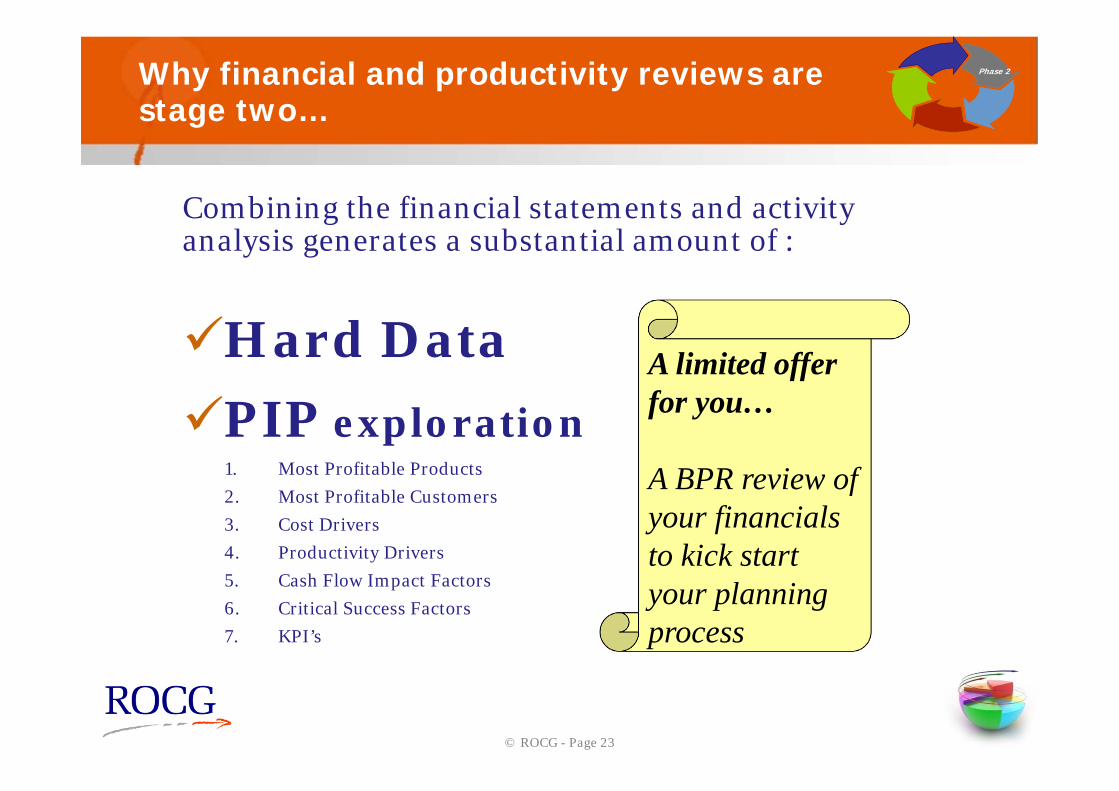
Why financial and productivity reviews are stage two…
Combining the financial statements and activity analysis generates a substantial amount of :
Hard DataPIP exploration
1. Most Profitable Products2. Most Profitable Customers3. Cost Drivers4. Productivity Drivers5. Cash Flow Impact Factors6. Critical Success Factors7. KPI’s
Phase 2
A limited offer for you…
A BPR review of your financials to kick start your planning process
© ROCG - Page 24
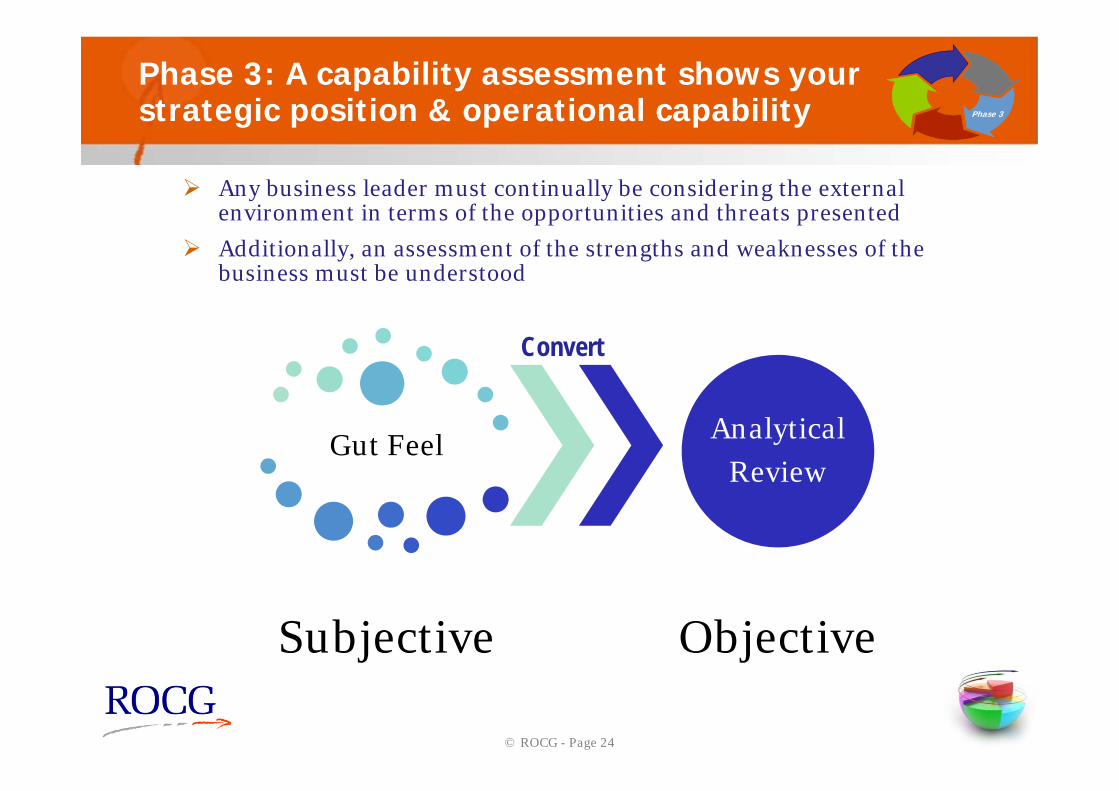
Phase 3: A capability assessment shows your strategic position & operational capability
Any business leader must continually be considering the external environment in terms of the opportunities and threats presented
Additionally, an assessment of the strengths and weaknesses of the business must be understood
Convert
Phase 3
Gut Feel
Subjective
Analytical Review
Objective
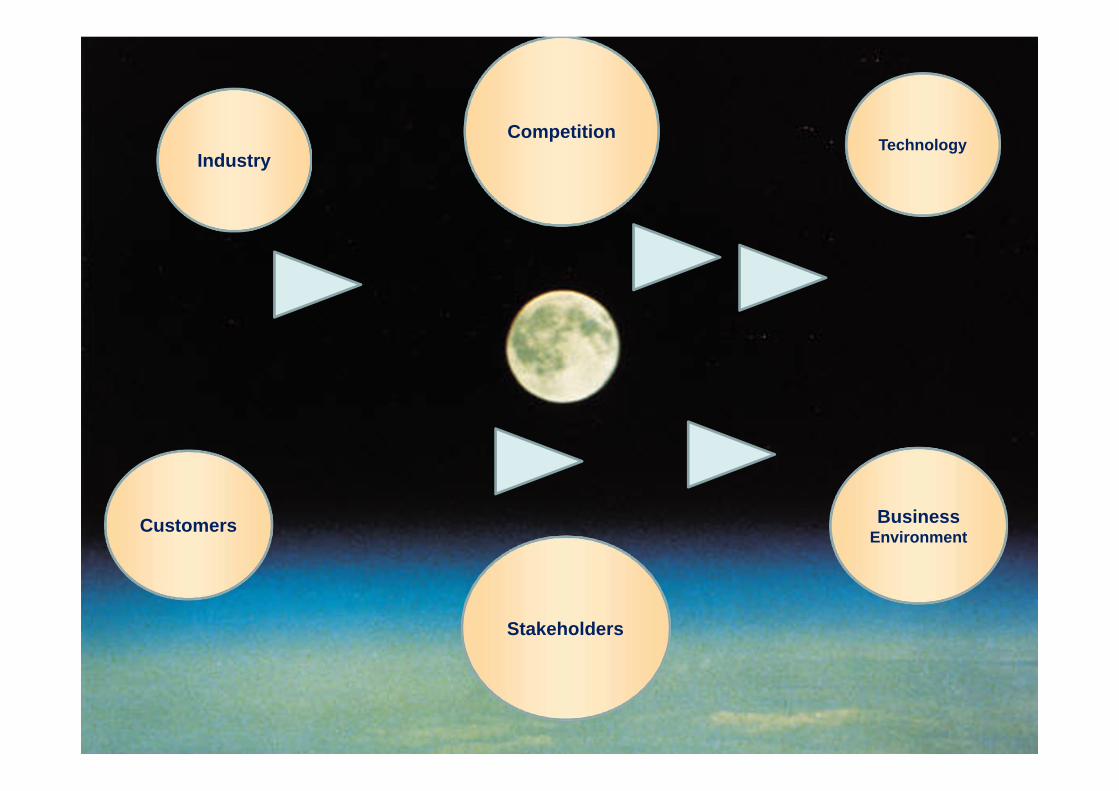
Industry
BusinessEnvironment
Stakeholders
TechnologyCompetition
Customers
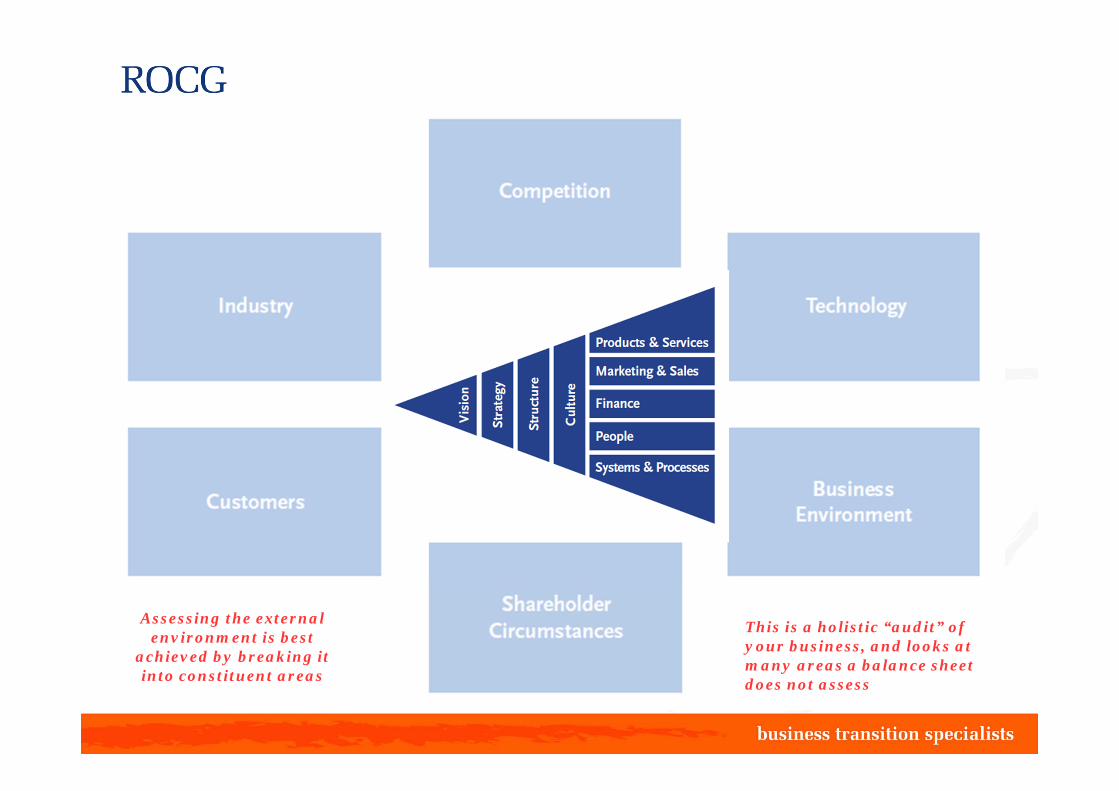
Assessing the external environment is best
achieved by breaking it into constituent areas
This is a holistic “audit” of your business, and looks at many areas a balance sheet does not assess
© ROCG - Page 27
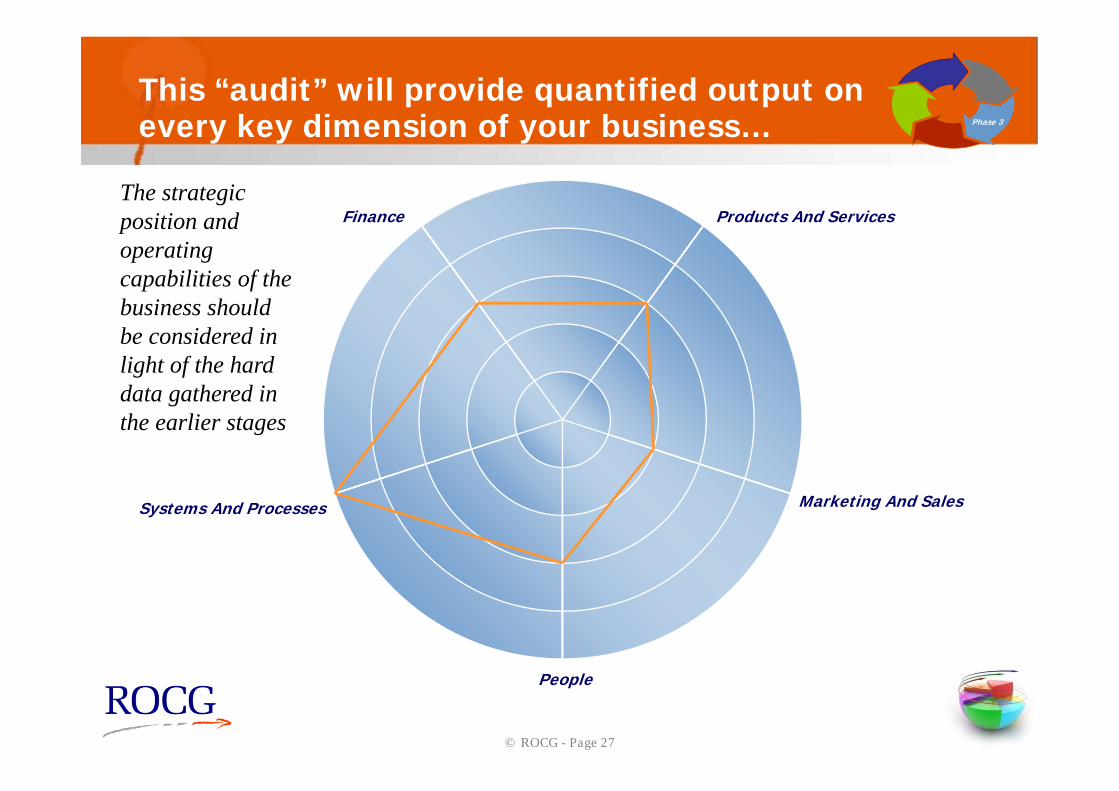
This “audit” will provide quantified output on every key dimension of your business… Phase 3
Finance
Systems And Processes
People
Marketing And Sales
Products And ServicesThe strategic position and operating capabilities of the business should be considered in light of the hard data gathered in the earlier stages
© ROCG - Page 28
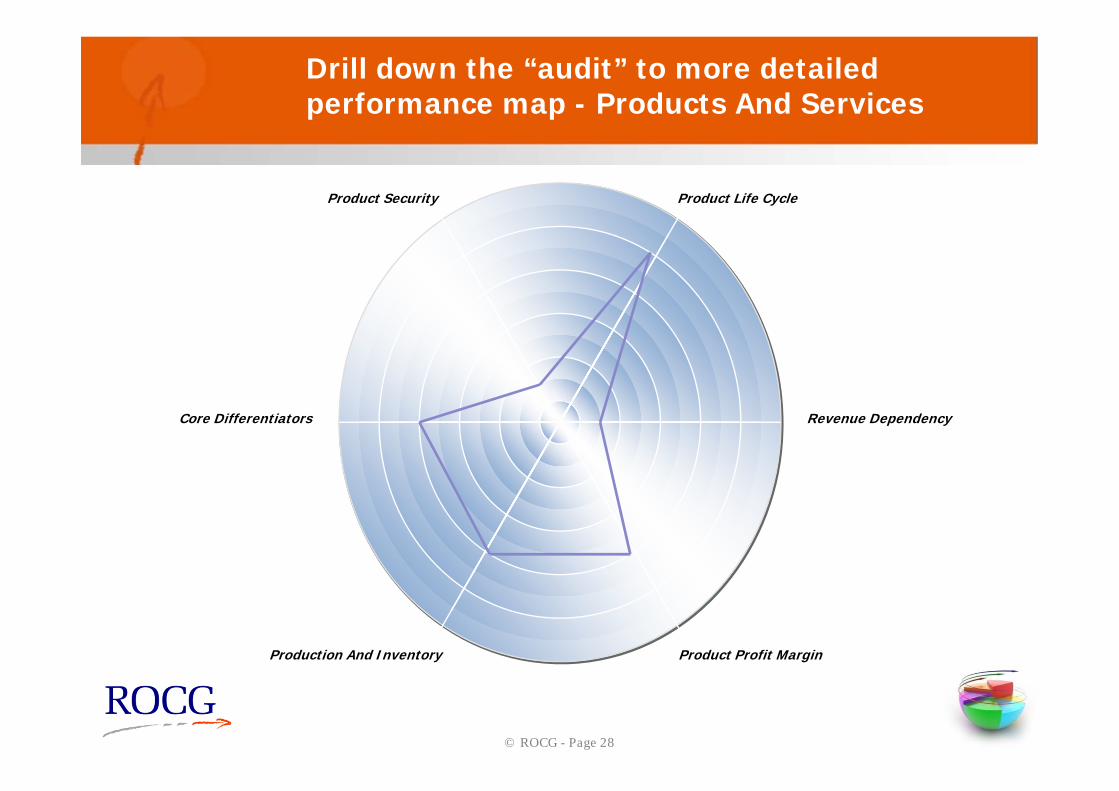
Product Security
Core Differentiators
Production And Inventory Product Profit Margin
Revenue Dependency
Product Life Cycle
Drill down the “audit” to more detailed performance map - Products And Services
© ROCG - Page 29
Phase 4: The customer view – the one that really matters
You may have an acceptable financial performance, a stable team, and clear direction in your mind, but …..
• ….an undercurrent of dissatisfaction may exist amongst your customers that is not yet reflected in your lag indicators
Often an external, independent facilitator can gain your customers’ views on the business in a way that you never can
Most customers actually appreciate being asked their opinion in an objective, constructive, independent way – it reflects well on your business and shows you do really care and listen
Phase 4
© ROCG - Page 30
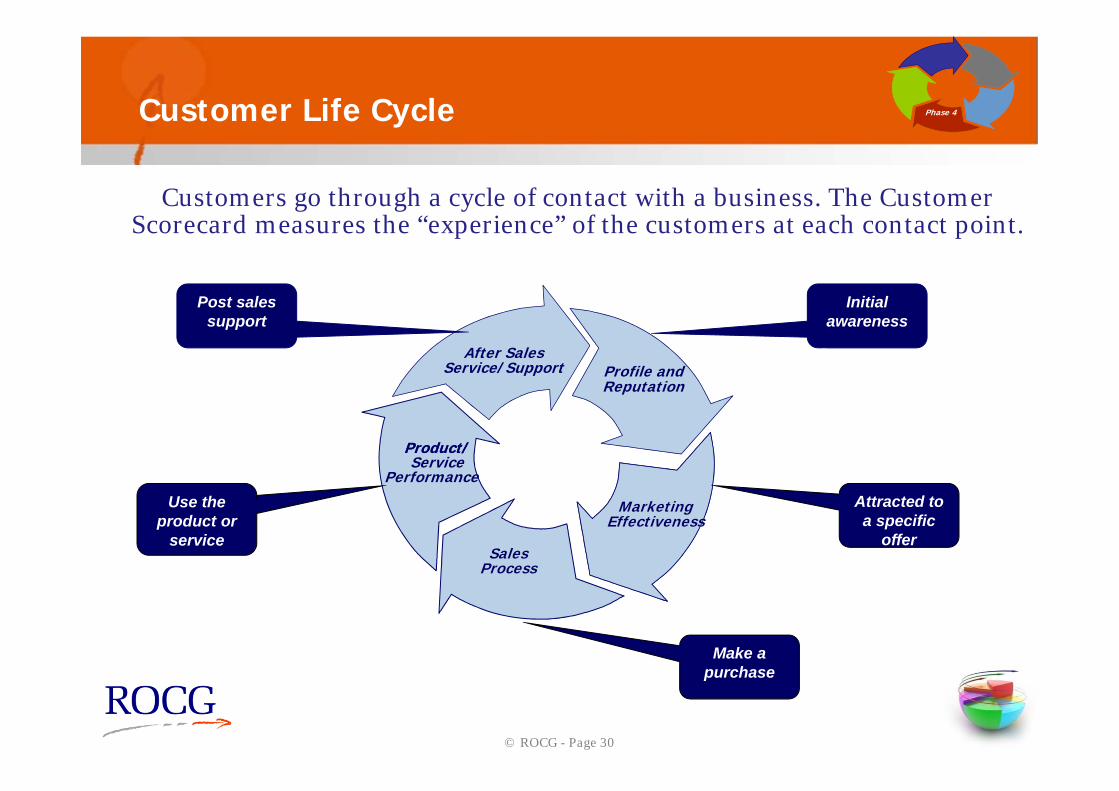
Customer Life Cycle
Customers go through a cycle of contact with a business. The Customer Scorecard measures the “experience” of the customers at each contact point.
Phase 4
Profile and Reputation
Marketing Effectiveness
Sales Process
Product/ Service
Performance
After Sales Service/Support Profile and
Reputation
MarketingEffectiveness
Sales Process
Product/
After Sales Service/Support
Post sales support
Initial awareness
Attracted to a specific
offer
Make a purchase
Use the product or
service
© ROCG - Page 31
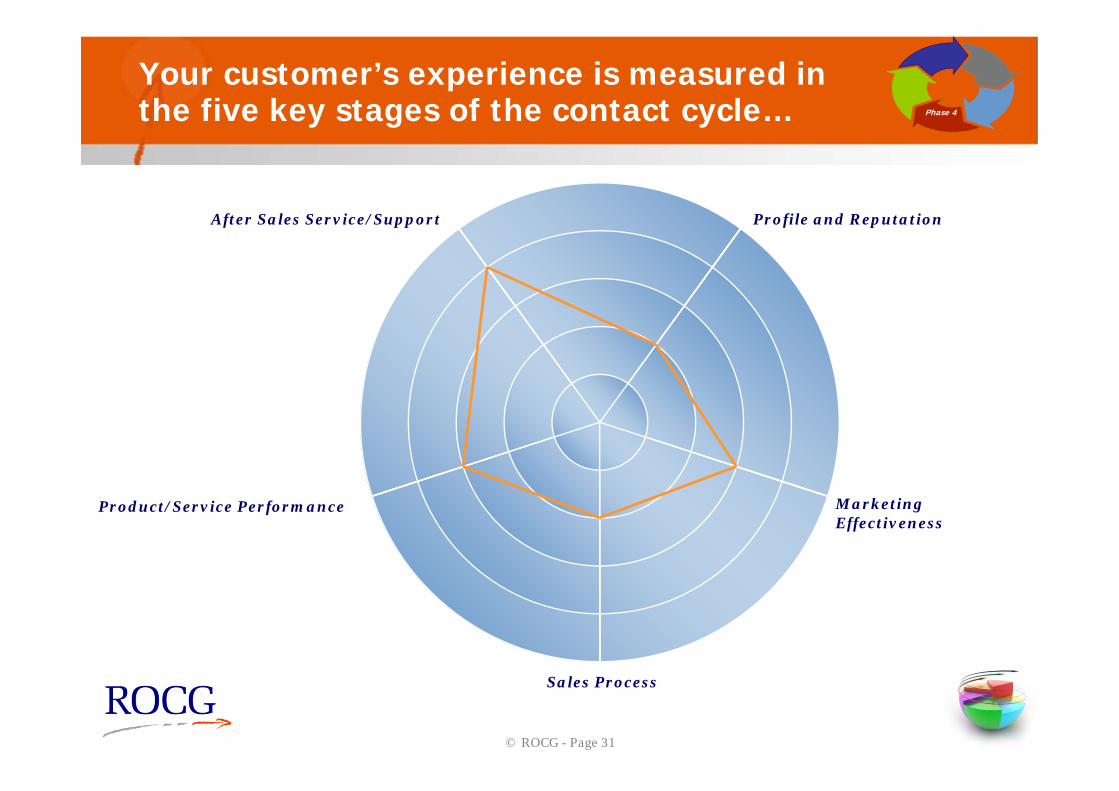
Your customer’s experience is measured in the five key stages of the contact cycle… Phase 4
After Sales Service/Support
Product/Service Performance
Sales Process
Marketing Effectiveness
Profile and Reputation
© ROCG - Page 32
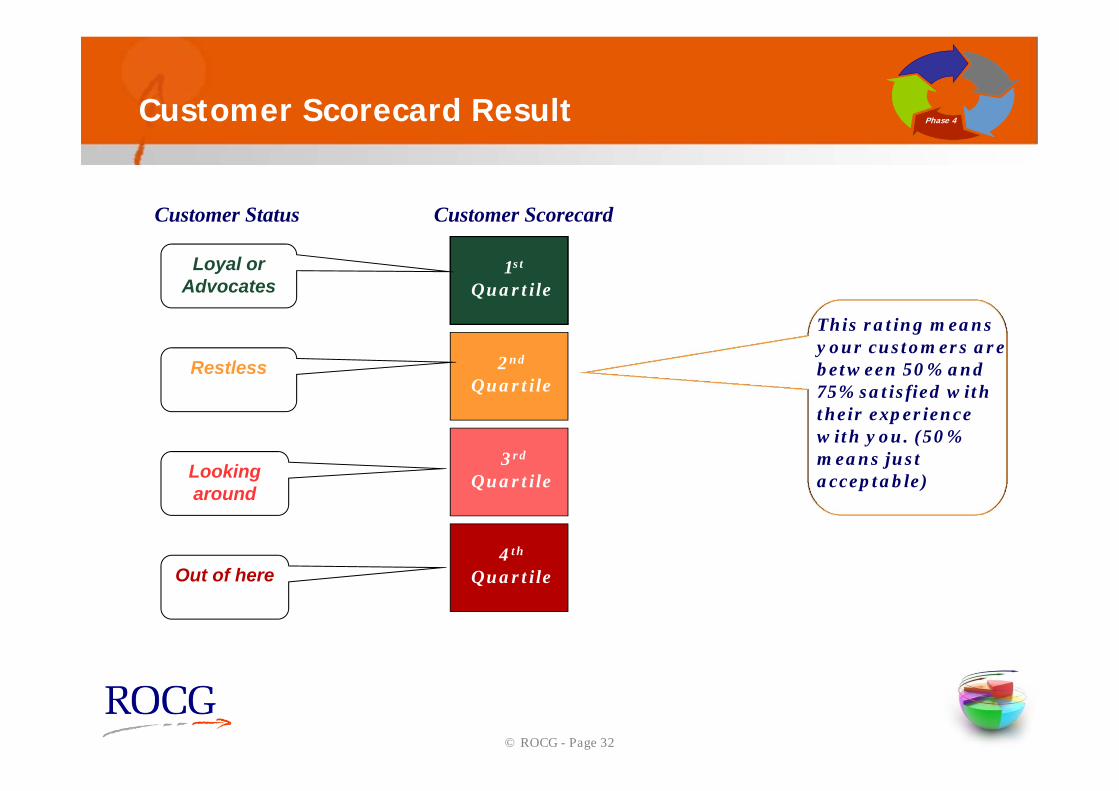
Customer Scorecard Result
1st
Quartile
Out of here
Looking around
Restless
Loyal or Advocates
Customer Status Customer Scorecard
This rating means your customers arebetween 50% and 75% satisfied with their experience with you. (50% means just acceptable)
Phase 4
2nd
Quartile
3rd
Quartile
4th
Quartile
© ROCG - Page 33
Why the customer view is important in the planning process…
1. To test the understanding developed during the internal reviews – Activity, Financial & Capability
2. The views of the customer are paramount and should never be assumed
Phase 4
Setting up the customer meeting can take some time and needs good planning, and time efficiency … for best results use an independent facilitator
© ROCG - Page 34
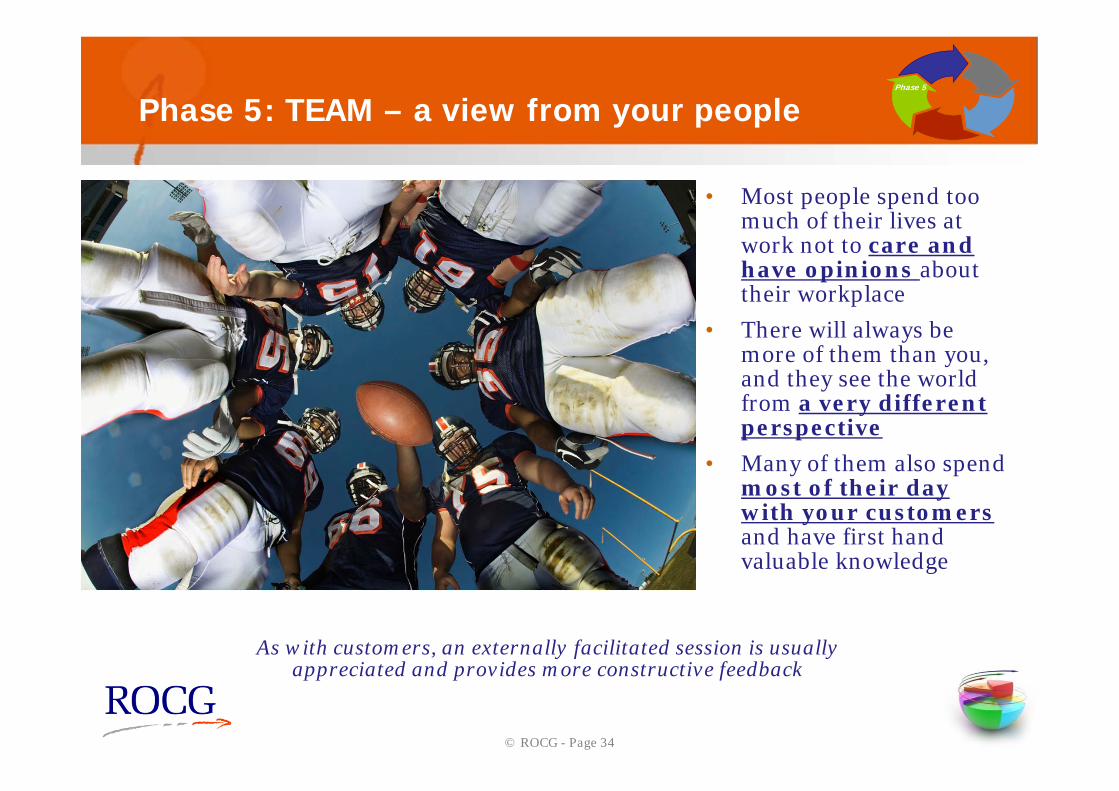
Phase 5: TEAM – a view from your people
• Most people spend too much of their lives at work not to care and have opinions about their workplace
• There will always be more of them than you, and they see the world from a very different perspective
• Many of them also spend most of their day with your customersand have first hand valuable knowledge
Phase 5
As with customers, an externally facilitated session is usually appreciated and provides more constructive feedback
© ROCG - Page 35
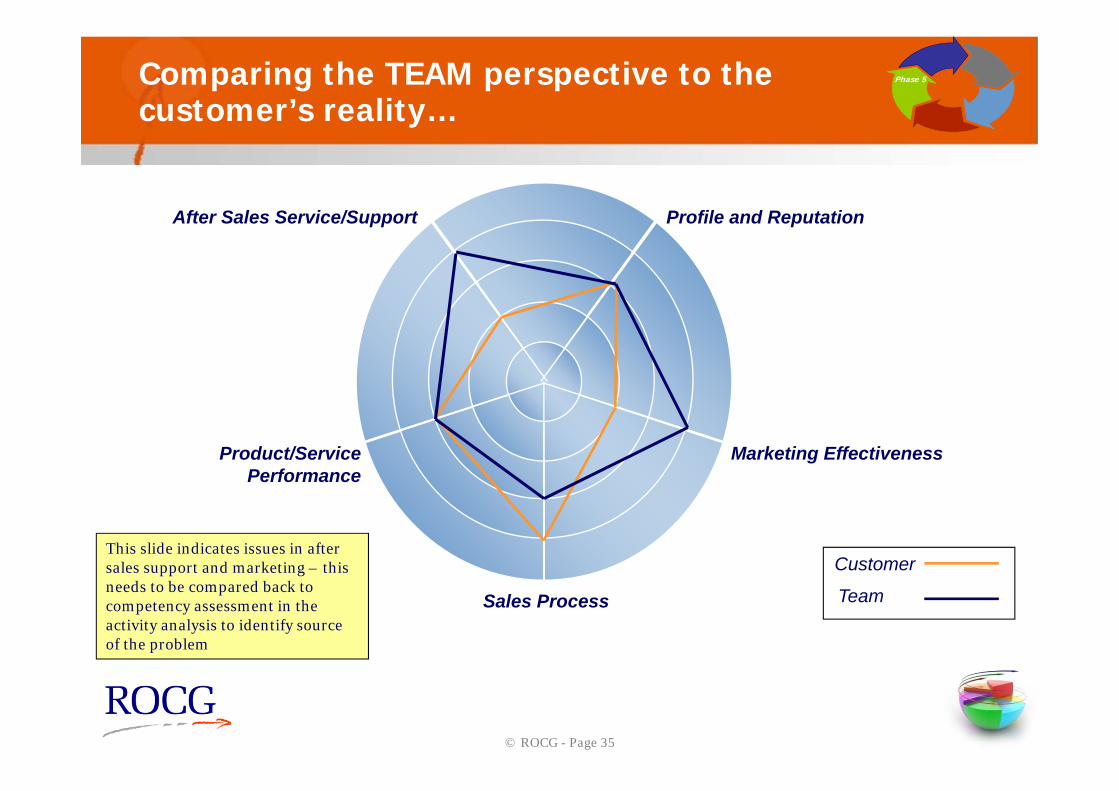
Comparing the TEAM perspective to the customer’s reality…
After Sales Service/Support
Product/Service Performance
Sales Process
Marketing Effectiveness
Profile and Reputation
Customer
Team
Phase 5
This slide indicates issues in after sales support and marketing – this needs to be compared back to competency assessment in the activity analysis to identify source of the problem
© ROCG - Page 36
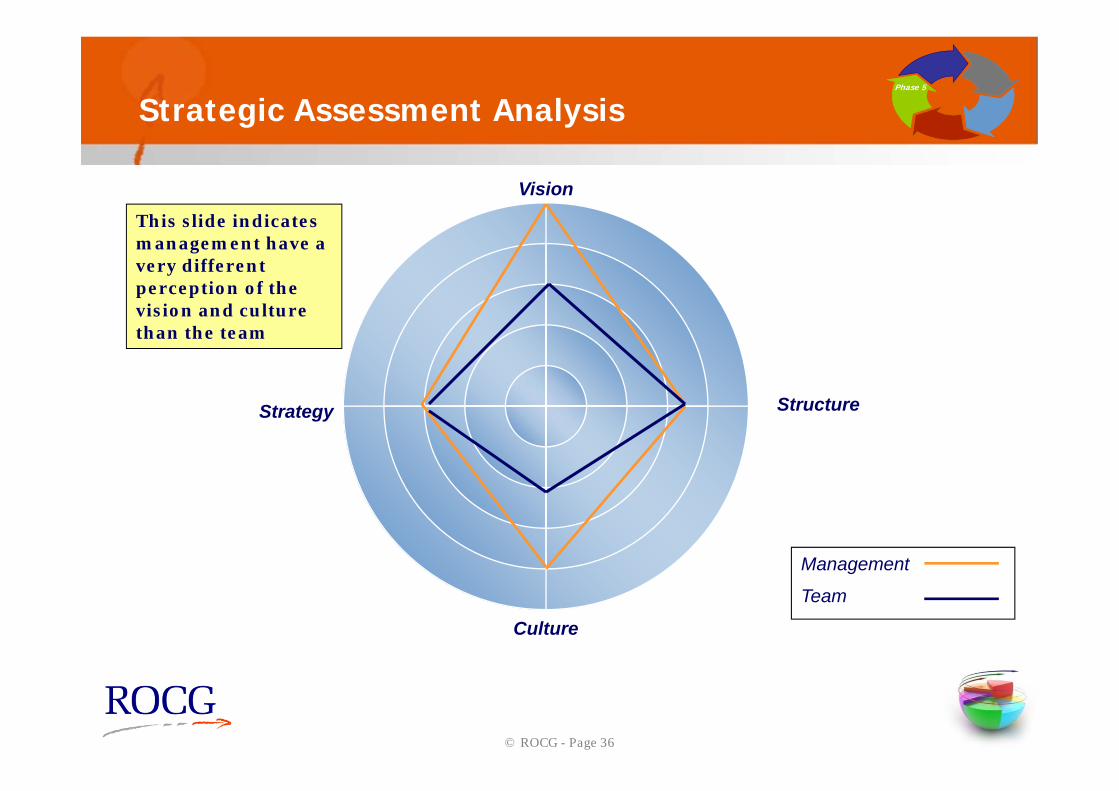
Strategic Assessment Analysis
Structure
Vision
Strategy
Culture
Phase 5
Management
Team
This slide indicates management have a very different perception of the vision and culture than the team
© ROCG - Page 37
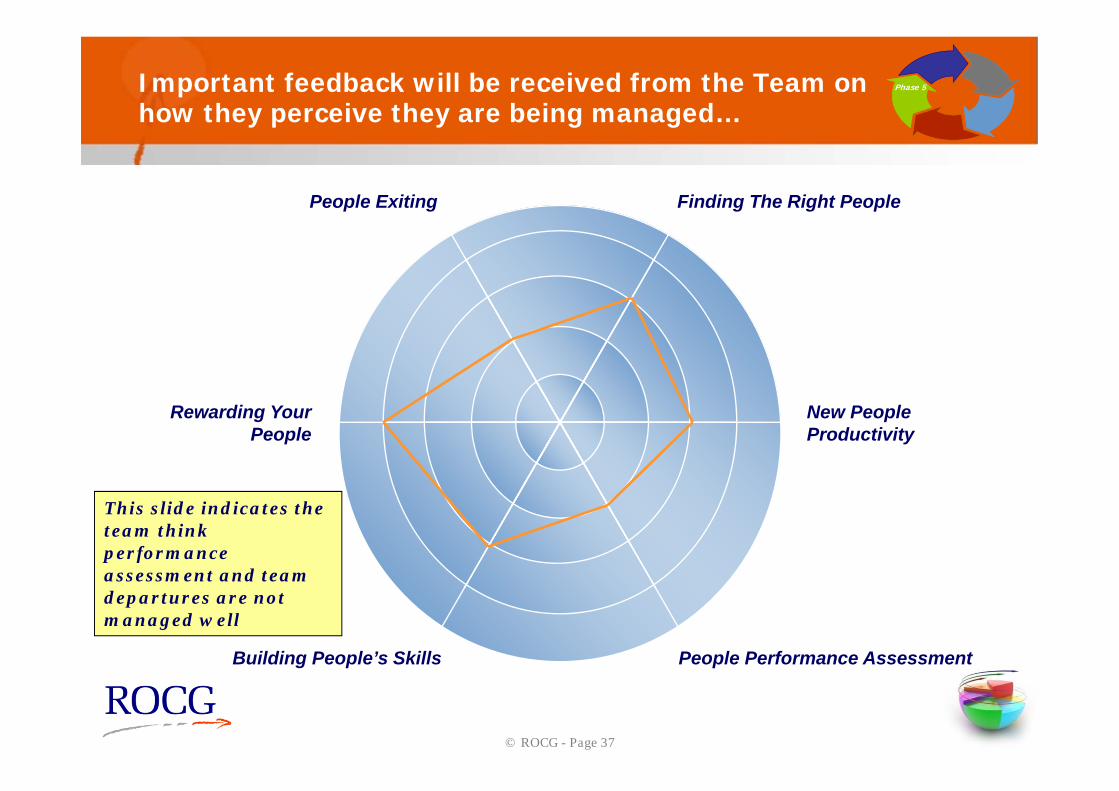
Important feedback will be received from the Team on how they perceive they are being managed…
People Exiting
Rewarding Your People
Building People’s Skills People Performance Assessment
New People Productivity
Finding The Right People
Phase 5
This slide indicates the team think performance assessment and team departures are not managed well
© ROCG - Page 38
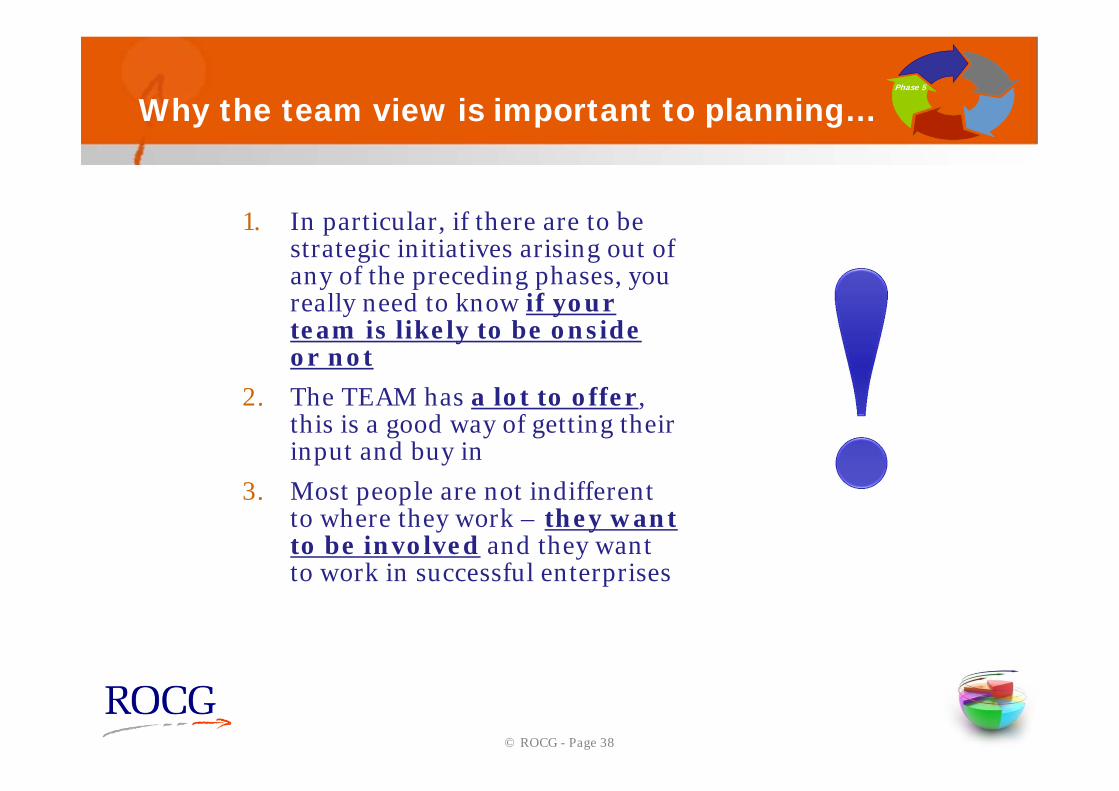
Why the team view is important to planning…
1. In particular, if there are to be strategic initiatives arising out of any of the preceding phases, you really need to know if your team is likely to be onside or not
2. The TEAM has a lot to offer, this is a good way of getting their input and buy in
3. Most people are not indifferent to where they work – they want to be involved and they want to work in successful enterprises
Phase 5
© ROCG - Page 39
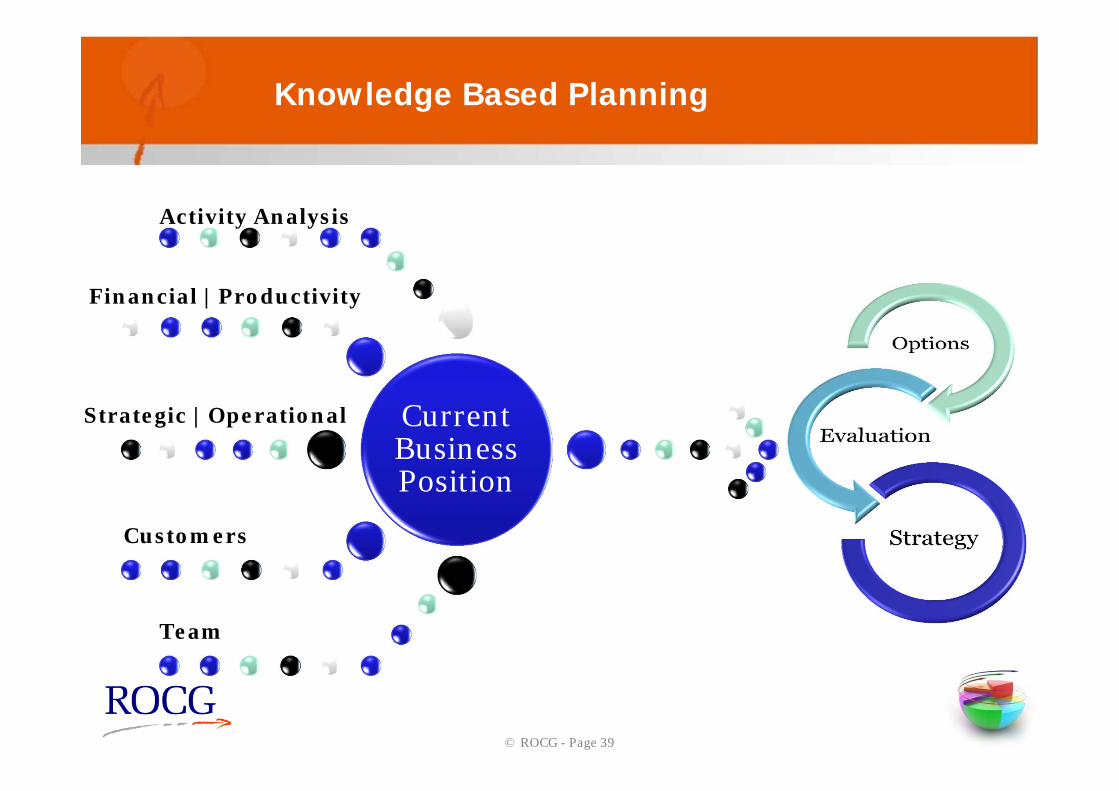
Knowledge Based Planning
Current Business Position
Activity Analysis
Financial | Productivity
Strategic | Operational
Customers
Team
© ROCG - Page 40
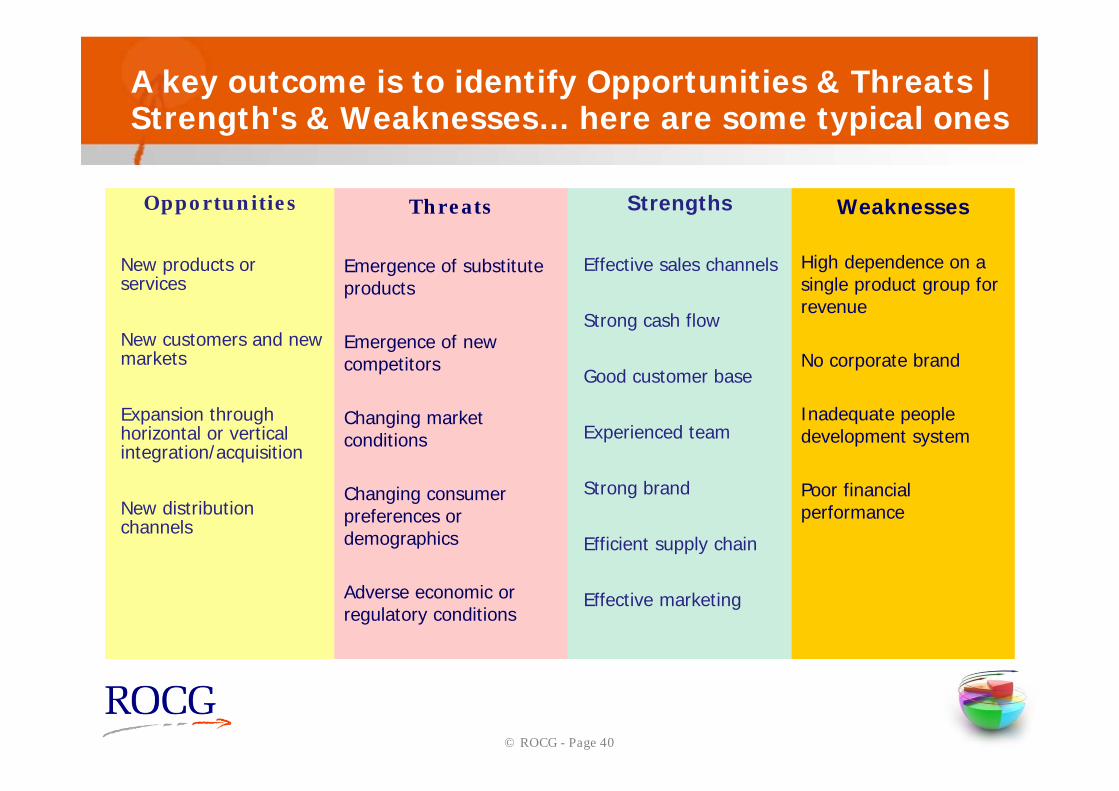
A key outcome is to identify Opportunities & Threats | Strength's & Weaknesses… here are some typical ones
Opportunities
New products or services
New customers and new markets
Expansion through horizontal or vertical integration/acquisition
New distribution channels
Threats
Emergence of substitute products
Emergence of new competitors
Changing market conditions
Changing consumer preferences or demographics
Adverse economic or regulatory conditions
Strengths
Effective sales channels
Strong cash flow
Good customer base
Experienced team
Strong brand
Efficient supply chain
Effective marketing
Weaknesses
High dependence on a single product group for revenue
No corporate brand
Inadequate people development system
Poor financial performance
© ROCG - Page 41
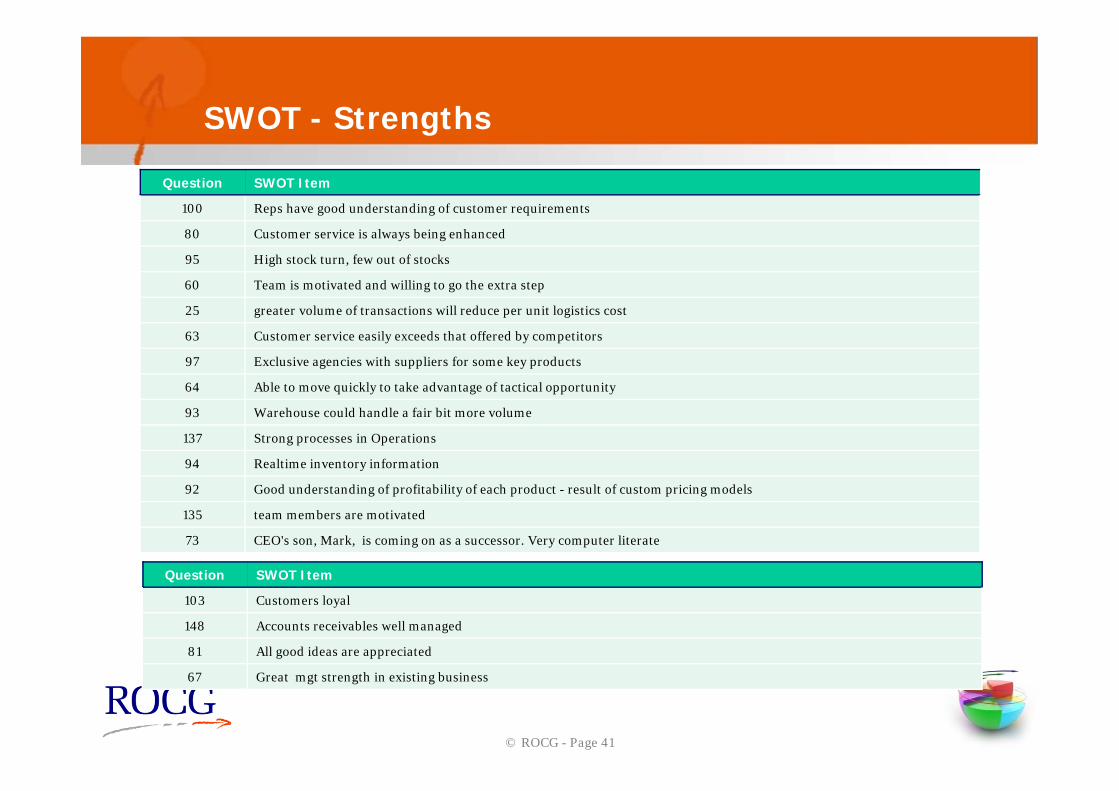
SWOT - Strengths
Question SWOT Item
100 Reps have good understanding of customer requirements
80 Customer service is always being enhanced
95 High stock turn, few out of stocks
60 Team is motivated and willing to go the extra step
25 greater volume of transactions will reduce per unit logistics cost
63 Customer service easily exceeds that offered by competitors
97 Exclusive agencies with suppliers for some key products
64 Able to move quickly to take advantage of tactical opportunity
93 Warehouse could handle a fair bit more volume
137 Strong processes in Operations
94 Realtime inventory information
92 Good understanding of profitability of each product - result of custom pricing models
135 team members are motivated
73 CEO's son, Mark, is coming on as a successor. Very computer literate
Question SWOT Item
103 Customers loyal
148 Accounts receivables well managed
81 All good ideas are appreciated
67 Great mgt strength in existing business
© ROCG - Page 42
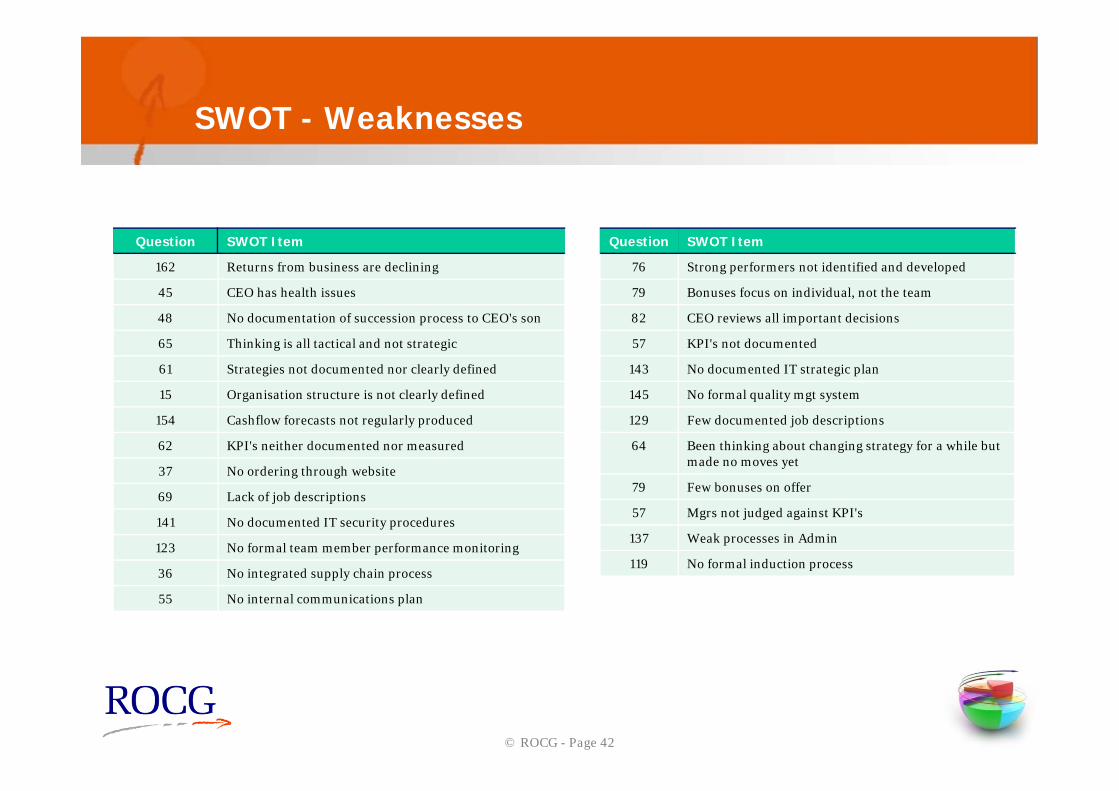
SWOT - Weaknesses
Question SWOT Item
162 Returns from business are declining
45 CEO has health issues
48 No documentation of succession process to CEO's son
65 Thinking is all tactical and not strategic
61 Strategies not documented nor clearly defined
15 Organisation structure is not clearly defined
154 Cashflow forecasts not regularly produced
62 KPI's neither documented nor measured
37 No ordering through website
69 Lack of job descriptions
141 No documented IT security procedures
123 No formal team member performance monitoring
36 No integrated supply chain process
55 No internal communications plan
Question SWOT Item
76 Strong performers not identified and developed
79 Bonuses focus on individual, not the team
82 CEO reviews all important decisions
57 KPI's not documented
143 No documented IT strategic plan
145 No formal quality mgt system
129 Few documented job descriptions
64 Been thinking about changing strategy for a while but made no moves yet
79 Few bonuses on offer
57 Mgrs not judged against KPI's
137 Weak processes in Admin
119 No formal induction process
© ROCG - Page 43
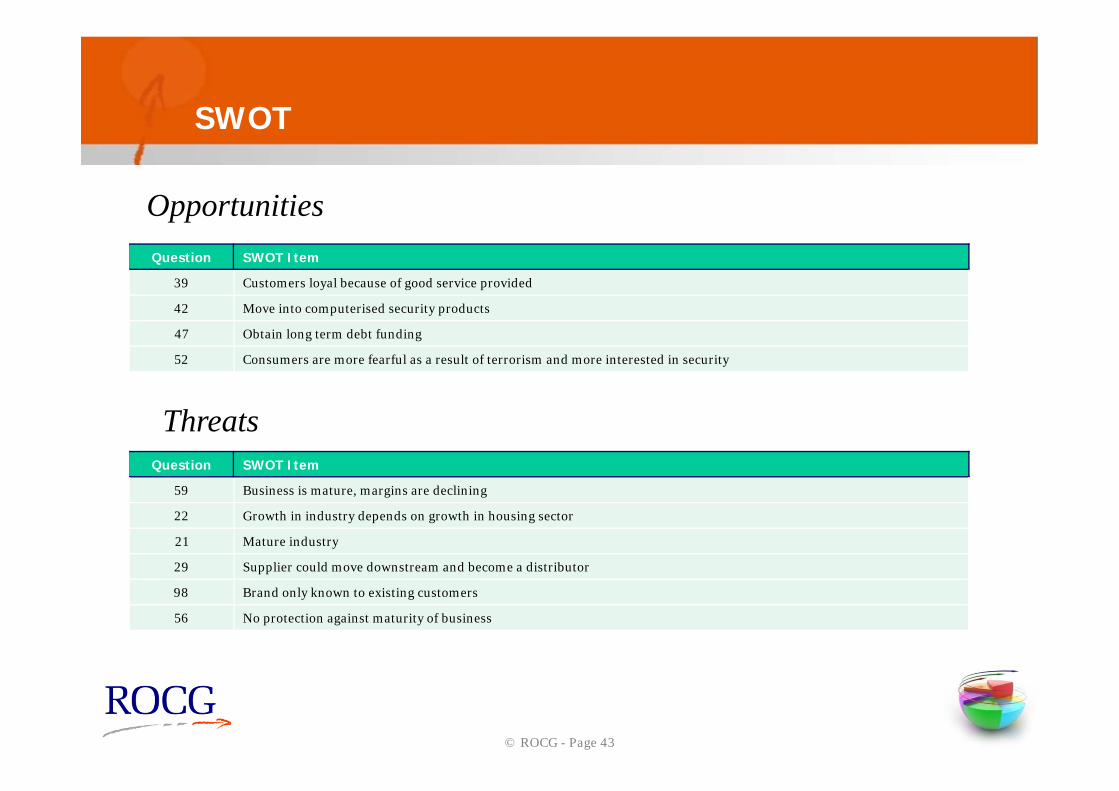
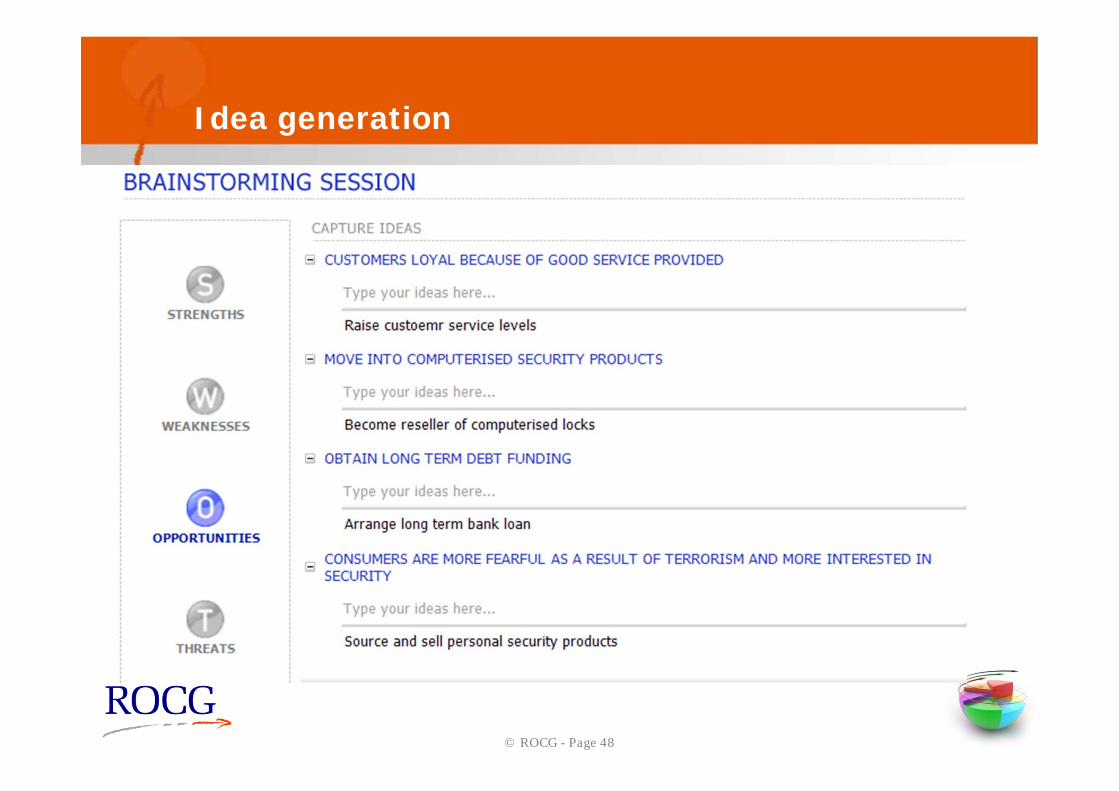
SWOT
Question SWOT Item
39 Customers loyal because of good service provided
42 Move into computerised security products
47 Obtain long term debt funding
52 Consumers are more fearful as a result of terrorism and more interested in security
Question SWOT Item
59 Business is mature, margins are declining
22 Growth in industry depends on growth in housing sector
21 Mature industry
29 Supplier could move downstream and become a distributor
98 Brand only known to existing customers
56 No protection against maturity of business
Threats
Opportunities
© ROCG - Page 44
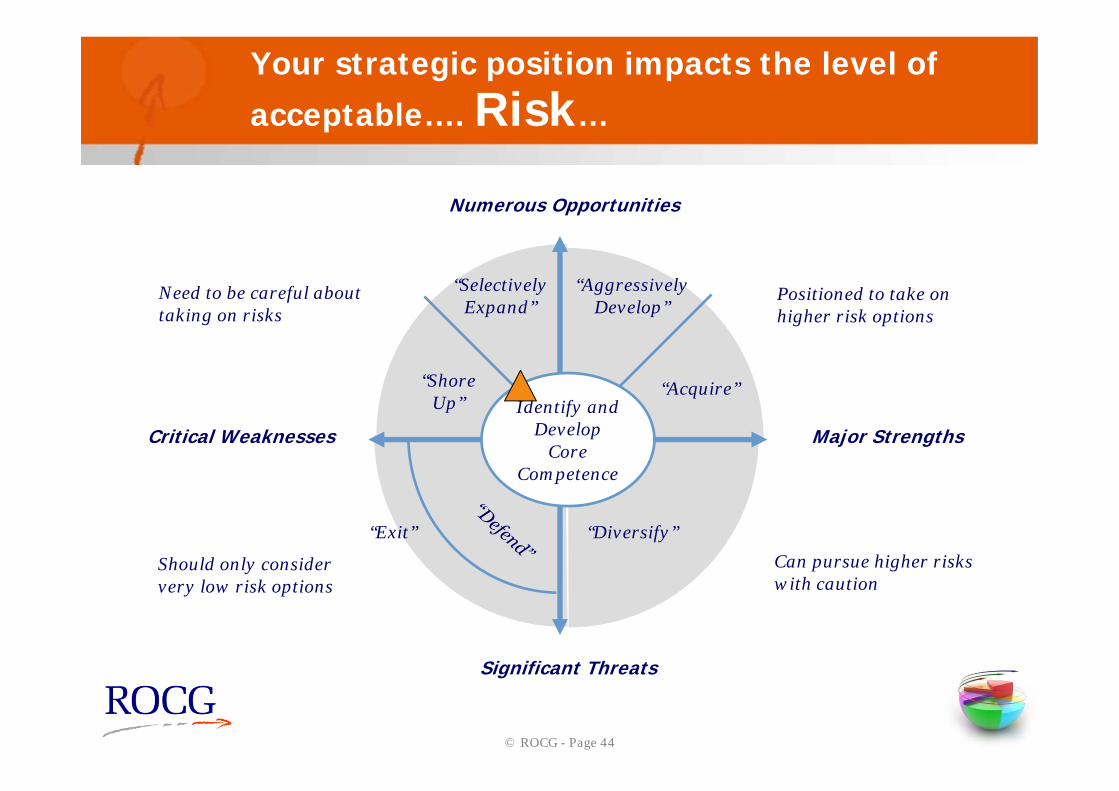
Need to be careful abouttaking on risks
Should only consider very low risk options
Can pursue higher risks with caution
Positioned to take on higher risk options
Your strategic position impacts the level of
acceptable…. Risk…
Identify and Develop
Core Competence
“Selectively Expand”
“Shore Up”
“Exit” “Diversify”
“Acquire”
“Aggressively Develop”
Numerous Opportunities
Significant Threats
Major StrengthsCritical Weaknesses
© ROCG - Page 45
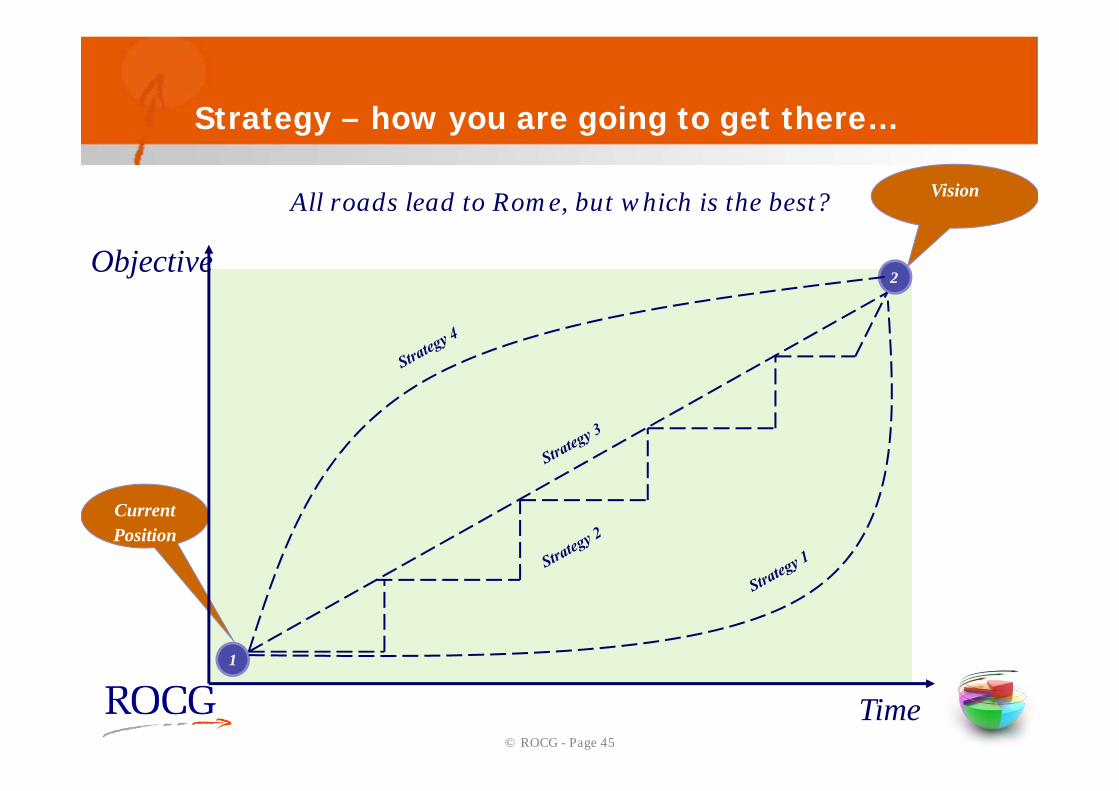
Strategy – how you are going to get there…
2
1
Vision
CurrentPosition
Time
Objective
All roads lead to Rome, but which is the best?
© ROCG - Page 46
How do we develop alternative strategic options, evaluate and select the preferred option…
• To develop alternative strategic options we need to assess the current strategic position of the business and what impact this has in terms of the aggressiveness and risk of options considered
• Then brainstorm a range of options using opportunities and strengths identified
• Finally evaluate options to identify the preferred way forward
© ROCG - Page 47
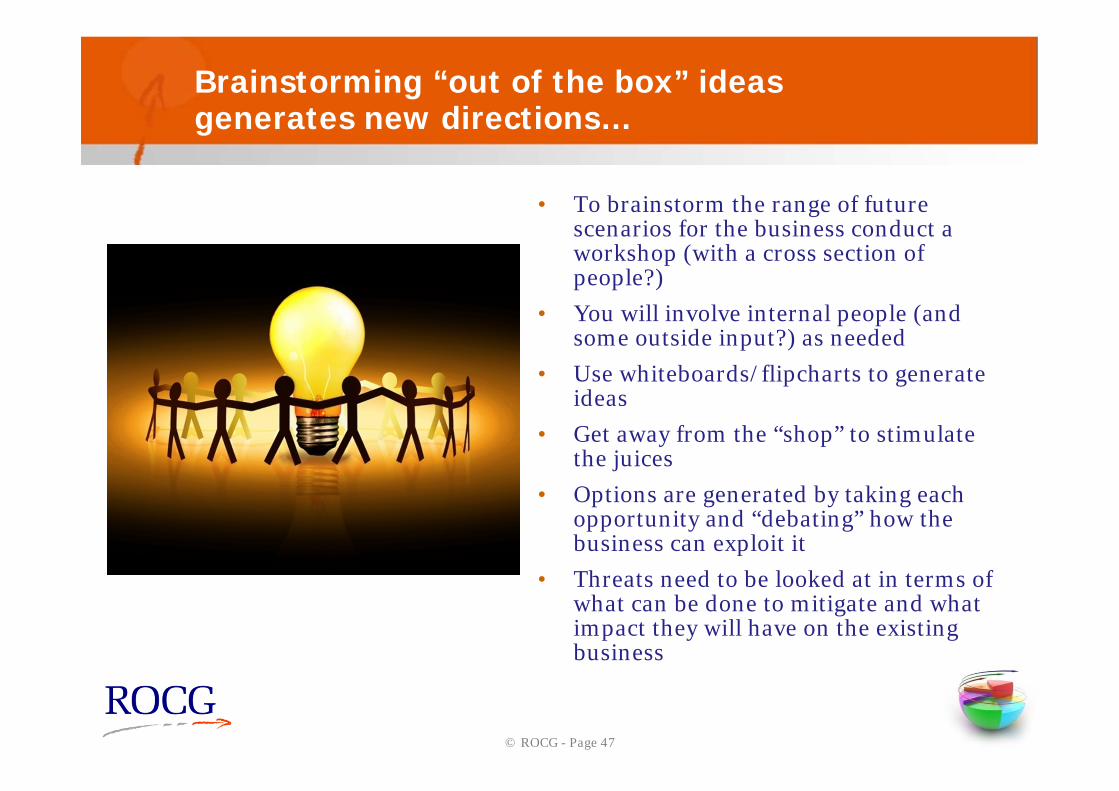
Brainstorming “out of the box” ideas generates new directions…
• To brainstorm the range of future scenarios for the business conduct a workshop (with a cross section of people?)
• You will involve internal people (and some outside input?) as needed
• Use whiteboards/flipcharts to generate ideas
• Get away from the “shop” to stimulate the juices
• Options are generated by taking each opportunity and “debating” how the business can exploit it
• Threats need to be looked at in terms of what can be done to mitigate and what impact they will have on the existing business
© ROCG - Page 48
Idea generation
© ROCG - Page 49
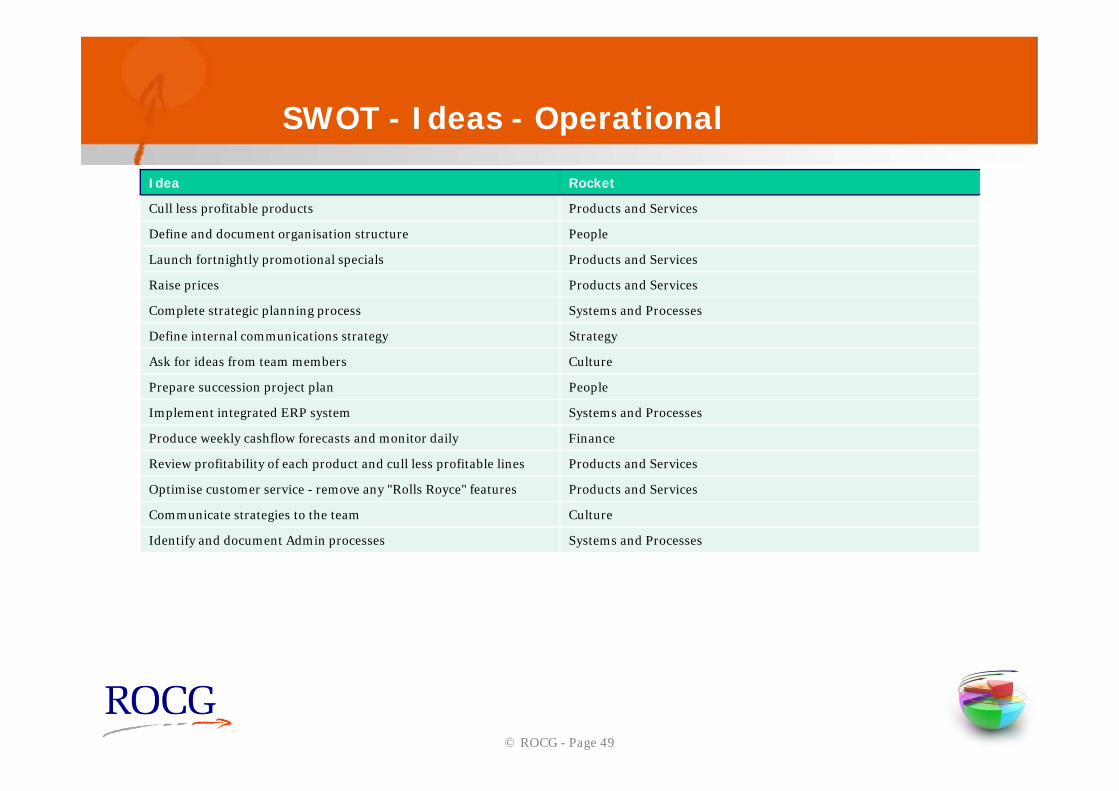
SWOT - Ideas - Operational
Idea Rocket
Cull less profitable products Products and Services
Define and document organisation structure People
Launch fortnightly promotional specials Products and Services
Raise prices Products and Services
Complete strategic planning process Systems and Processes
Define internal communications strategy Strategy
Ask for ideas from team members Culture
Prepare succession project plan People
Implement integrated ERP system Systems and Processes
Produce weekly cashflow forecasts and monitor daily Finance
Review profitability of each product and cull less profitable lines Products and Services
Optimise customer service - remove any "Rolls Royce" features Products and Services
Communicate strategies to the team Culture
Identify and document Admin processes Systems and Processes
© ROCG - Page 50
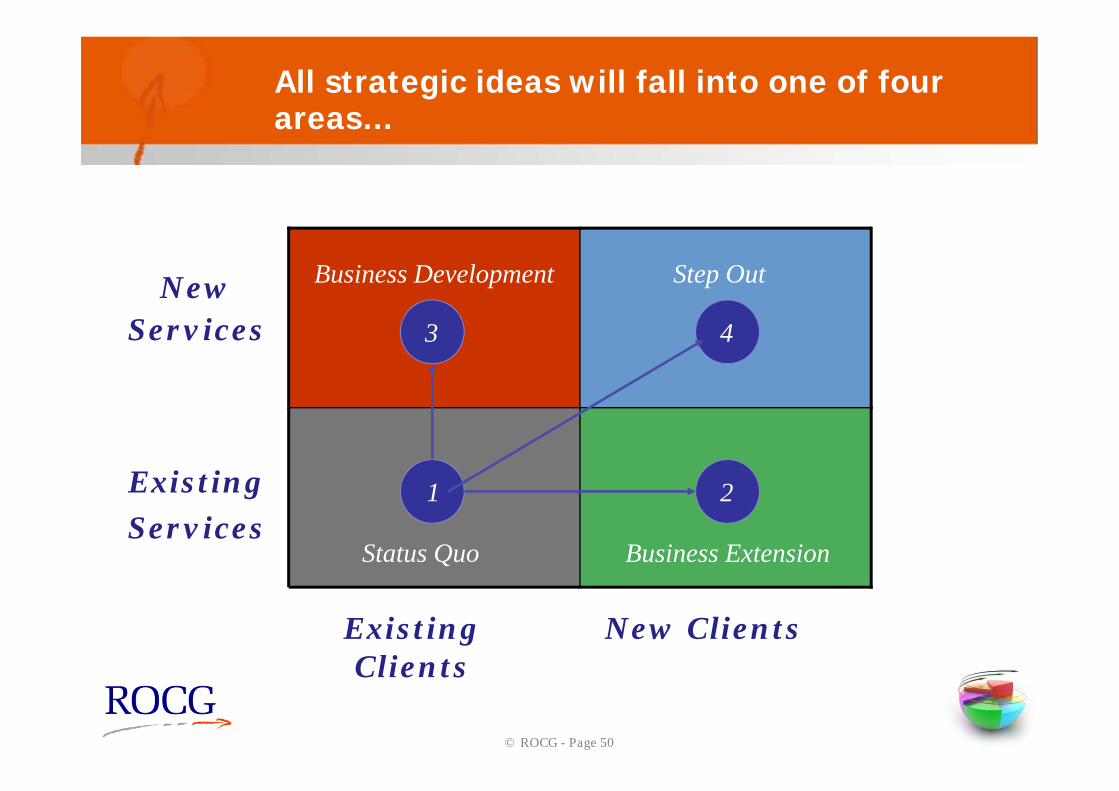
All strategic ideas will fall into one of four areas…
Existing Clients
New Clients
Existing Services
NewServices
1
3 4
2
Status Quo
Step Out
Business Extension
Business Development
© ROCG - Page 51
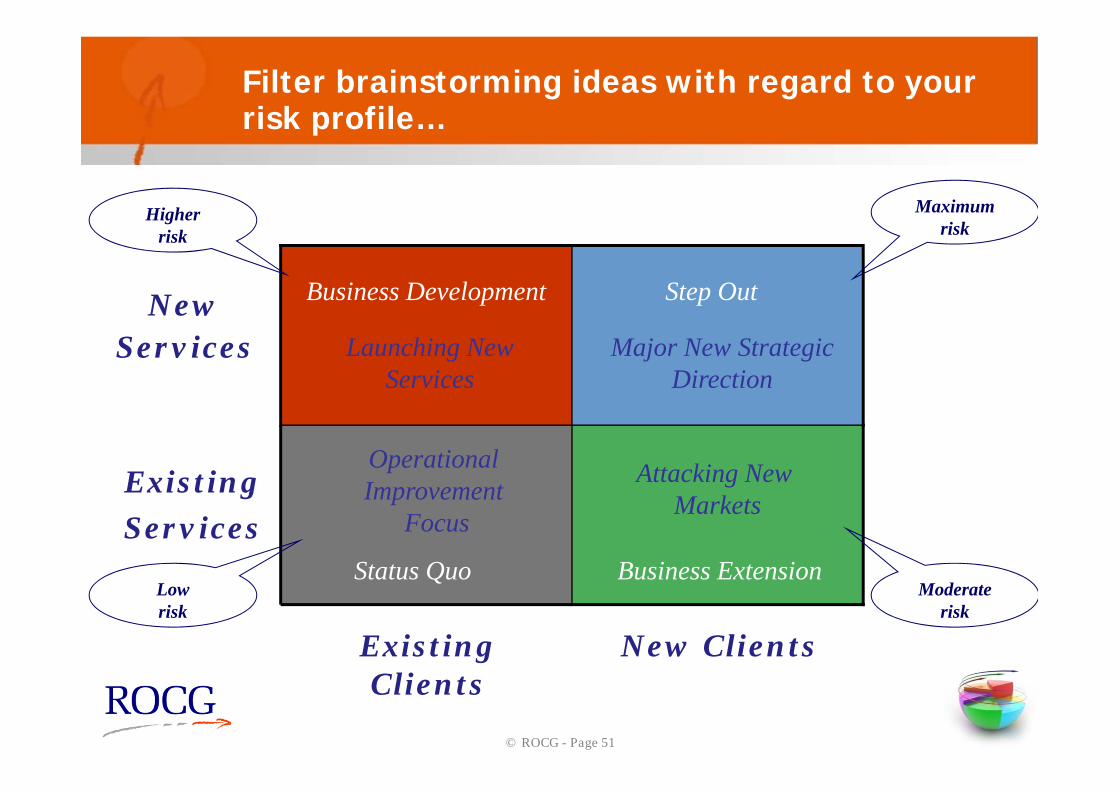
Existing Clients
New Clients
Existing Services
NewServices
OperationalImprovement
Focus
Launching NewServices
Major New StrategicDirection
Attacking New Markets
Filter brainstorming ideas with regard to your risk profile…
Status Quo
Step Out
Business Extension
Business Development
Maximum risk
Moderate risk
Higherrisk
Lowrisk
© ROCG - Page 52
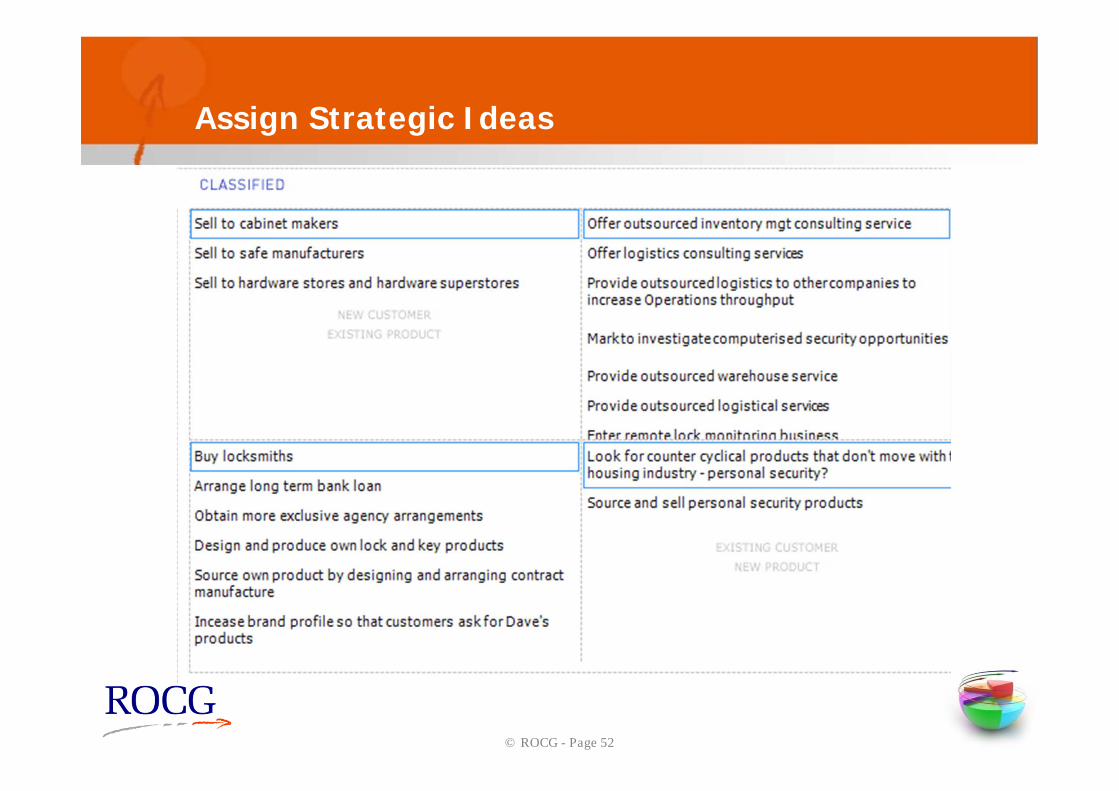
Assign Strategic Ideas
© ROCG - Page 53
Evaluating options…
• Increased objectivity can be achieved by selecting evaluation criteria (before the options are identified) and using these to do an objective evaluation
• You cannot decide the best course for the company until you decide what is important to you
• We will apply evaluation criteria to the filtered list of options (we won’t do it for all options as it will take too long)
© ROCG - Page 54
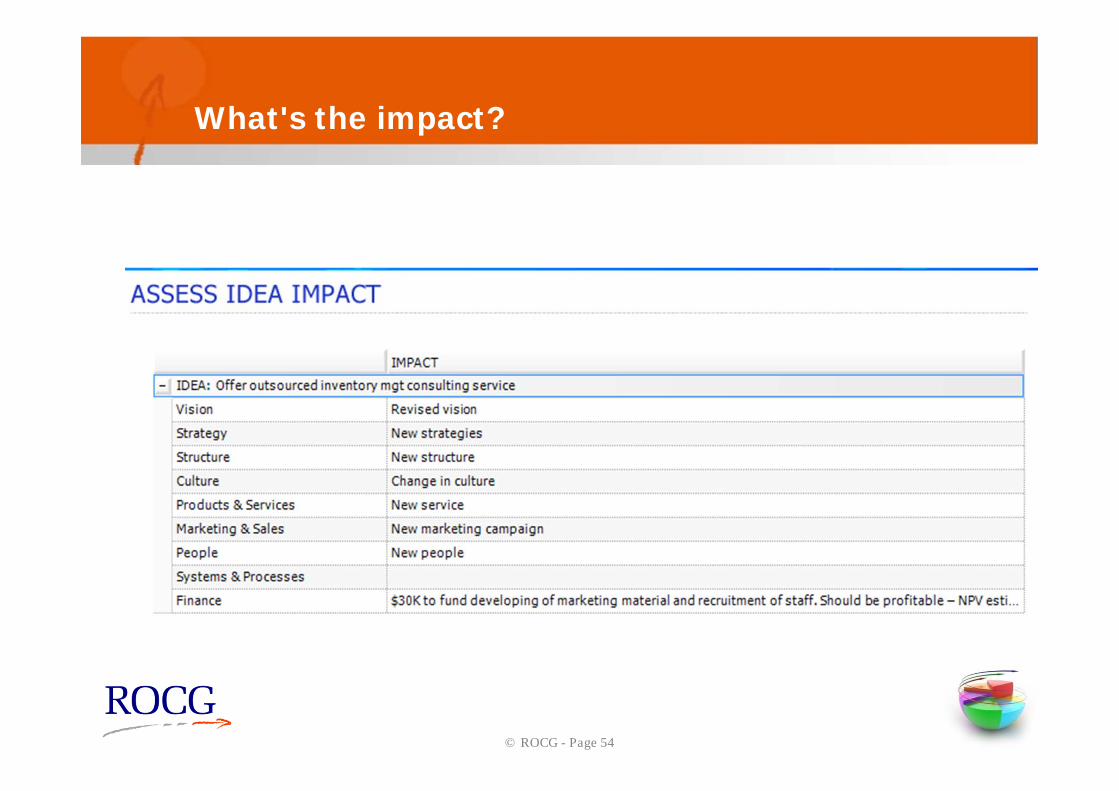
What's the impact?
© ROCG - Page 55
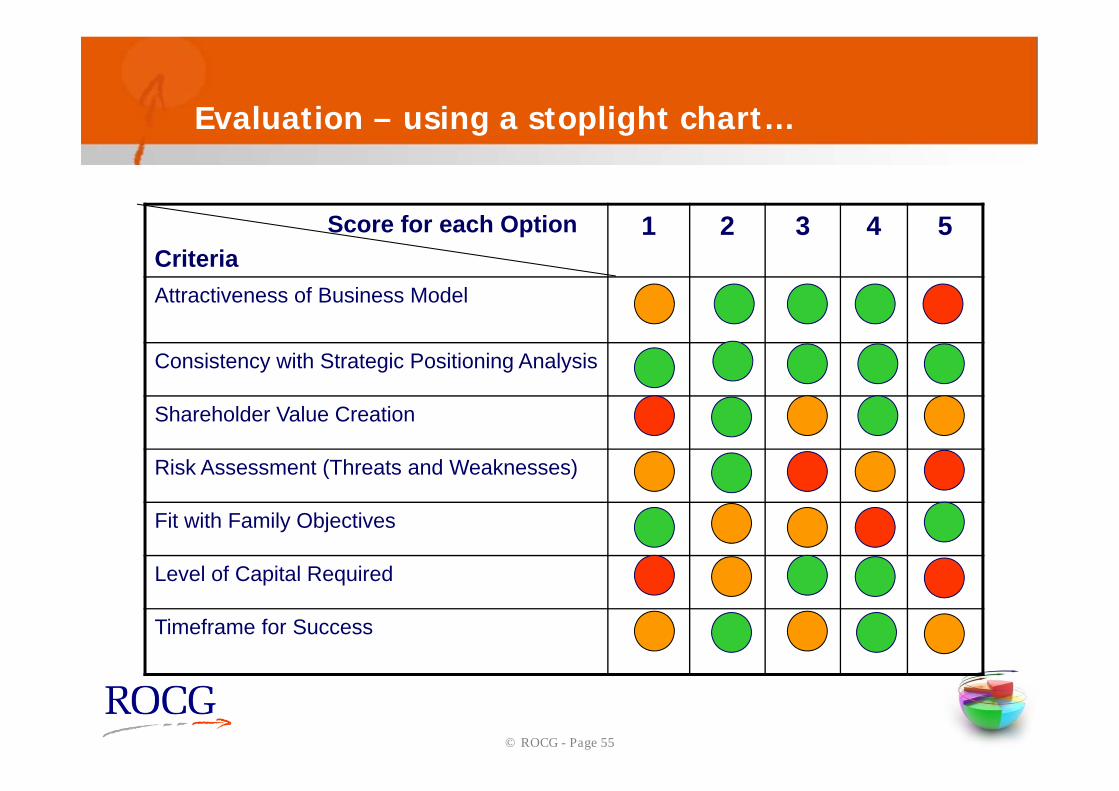
Evaluation – using a stoplight chart…
Score for each OptionCriteria
1 2 3 4 5
Attractiveness of Business Model
Consistency with Strategic Positioning Analysis
Shareholder Value Creation
Risk Assessment (Threats and Weaknesses)
Fit with Family Objectives
Level of Capital Required
Timeframe for Success
© ROCG - Page 56
A key outcome is the preferred option…
• The preferred option is the new vision for the business
• We need to document the new way forward in terms of products/services provided, customers sought after and how the business will make a profit
• This is what we define as our business model
© ROCG - Page 57
Now develop the strategic business plan that will deliver the vision…
• We need to expand the Business Model into a full strategic business plan
• The strategic business plan will be the roadmap that takes the business to its desired vision
• It will outline goals for each functional area of the business, which, if achieved, will ensure the vision becomes a reality
© ROCG - Page 58
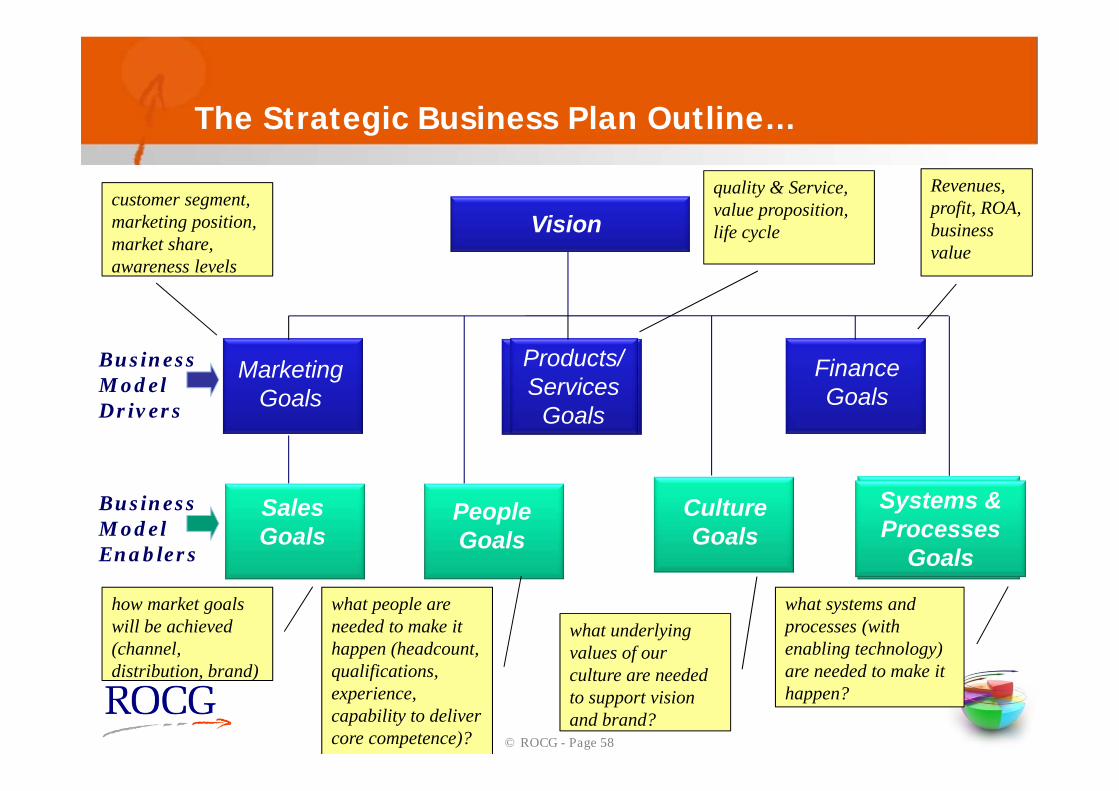
The Strategic Business Plan Outline…
Vision
Products/Services
Goals
Finance Goals
Marketing Goals
Sales Goals
People Goals
CultureGoals
Systems & Processes
Goals
Business Model Drivers
Business Model Enablers
customer segment, marketing position, market share, awareness levels
quality & Service, value proposition, life cycle
Revenues, profit, ROA, business value
how market goals will be achieved (channel, distribution, brand)
what people are needed to make it happen (headcount, qualifications, experience, capability to deliver core competence)?
what underlying values of our culture are needed to support vision and brand?
what systems and processes (with enabling technology) are needed to make it happen?
© ROCG - Page 59
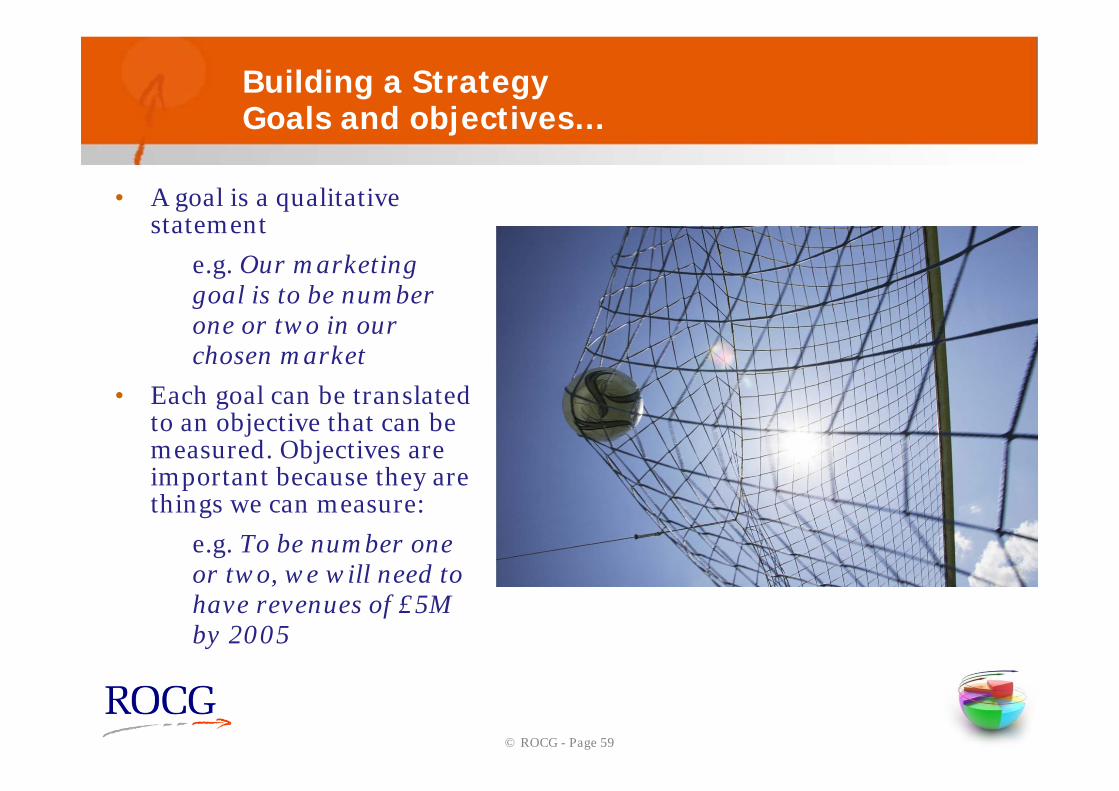
Building a StrategyGoals and objectives…
• A goal is a qualitative statement
e.g. Our marketing goal is to be number one or two in our chosen market
• Each goal can be translated to an objective that can be measured. Objectives are important because they are things we can measure:
e.g. To be number one or two, we will need to have revenues of £5M by 2005
© ROCG - Page 60
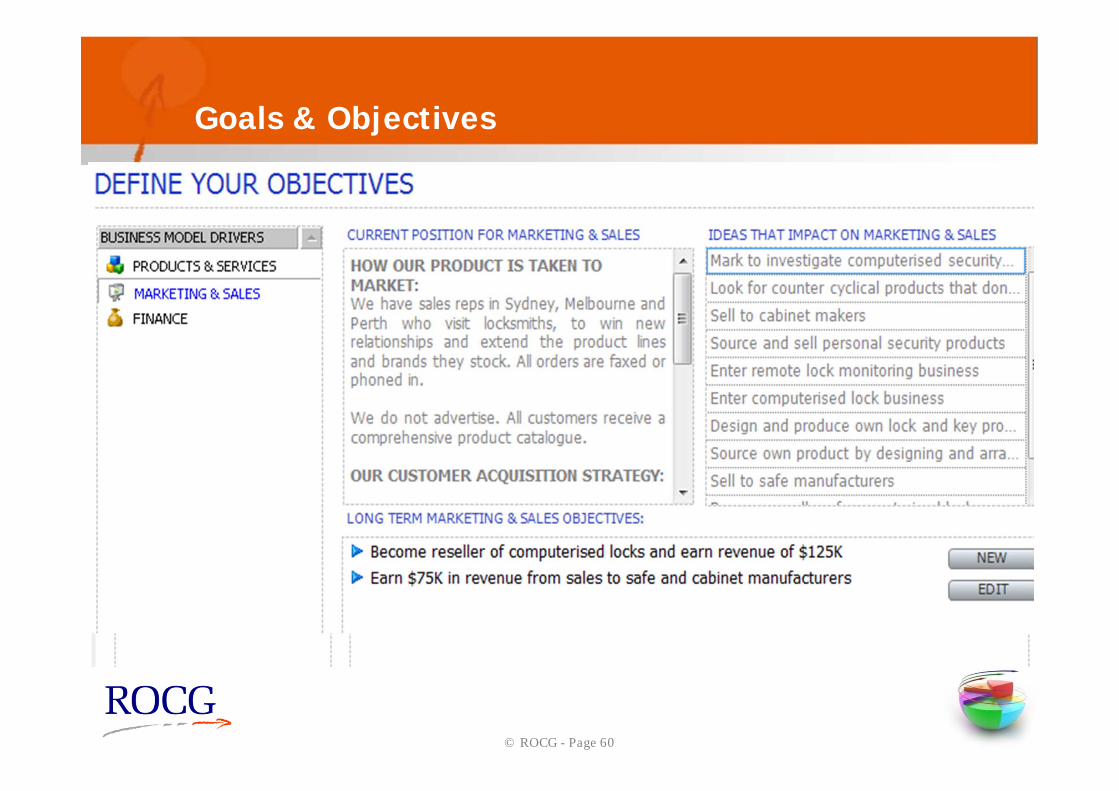
Goals & Objectives
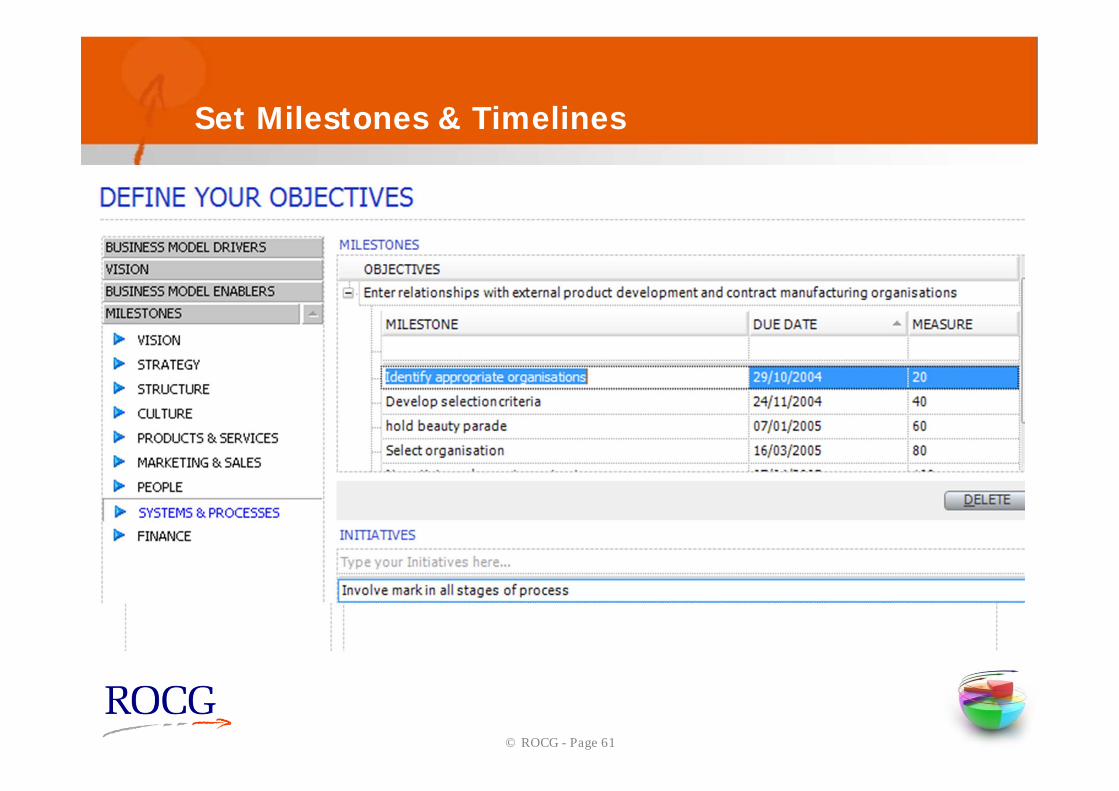
© ROCG - Page 61
Set Milestones & Timelines
© ROCG - Page 62
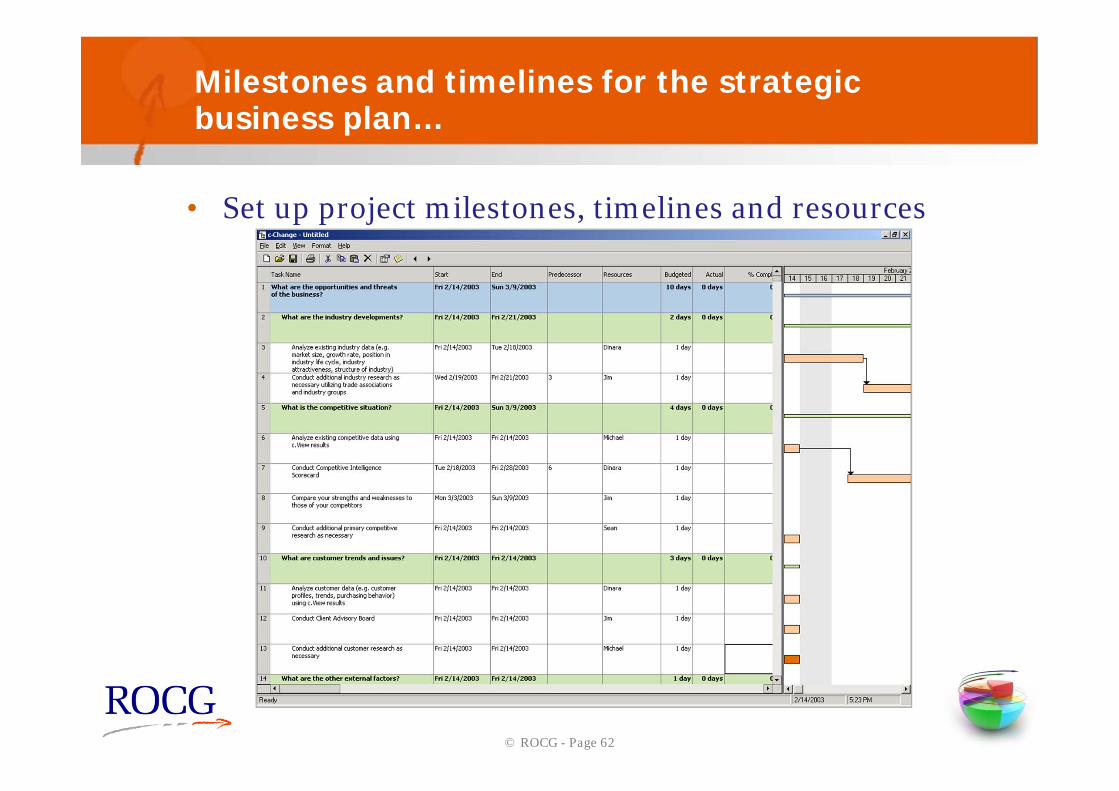
Milestones and timelines for the strategic business plan…
• Set up project milestones, timelines and resources
© ROCG - Page 63
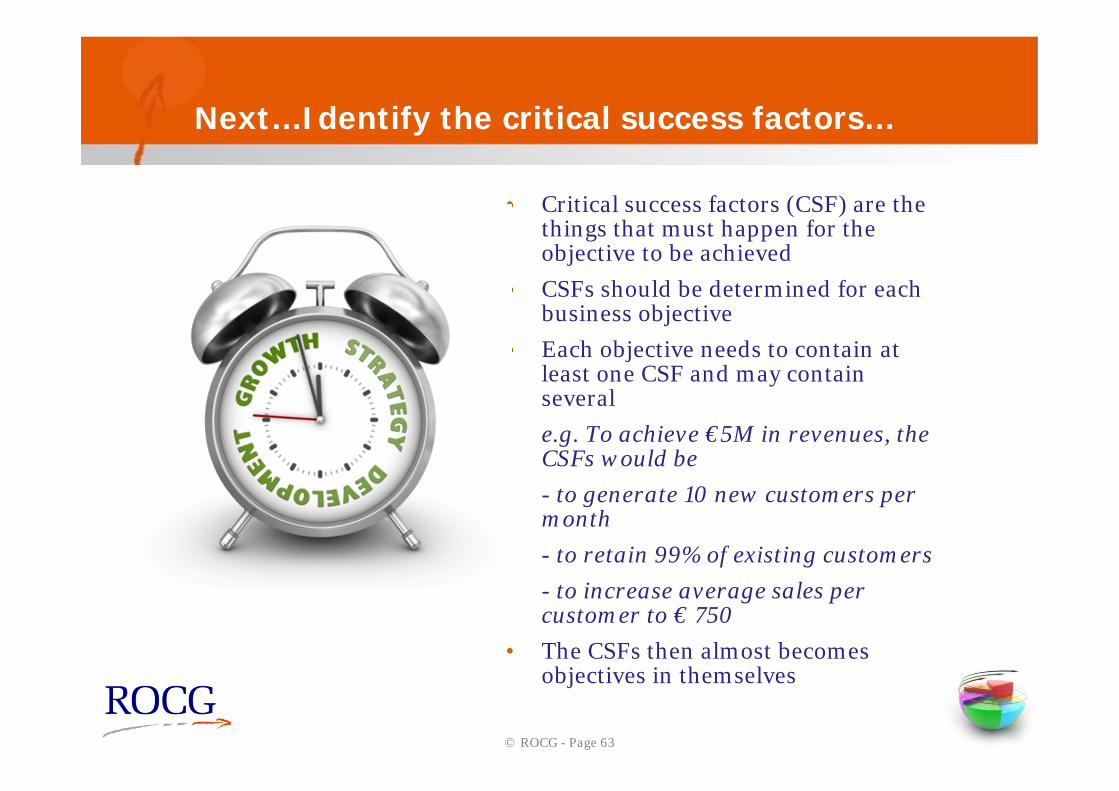
Next…Identify the critical success factors…
• Critical success factors (CSF) are the things that must happen for the objective to be achieved
• CSFs should be determined for each business objective
• Each objective needs to contain at least one CSF and may contain severale.g. To achieve €5M in revenues, the CSFs would be- to generate 10 new customers per month- to retain 99% of existing customers- to increase average sales per customer to € 750
• The CSFs then almost becomes objectives in themselves
© ROCG - Page 64
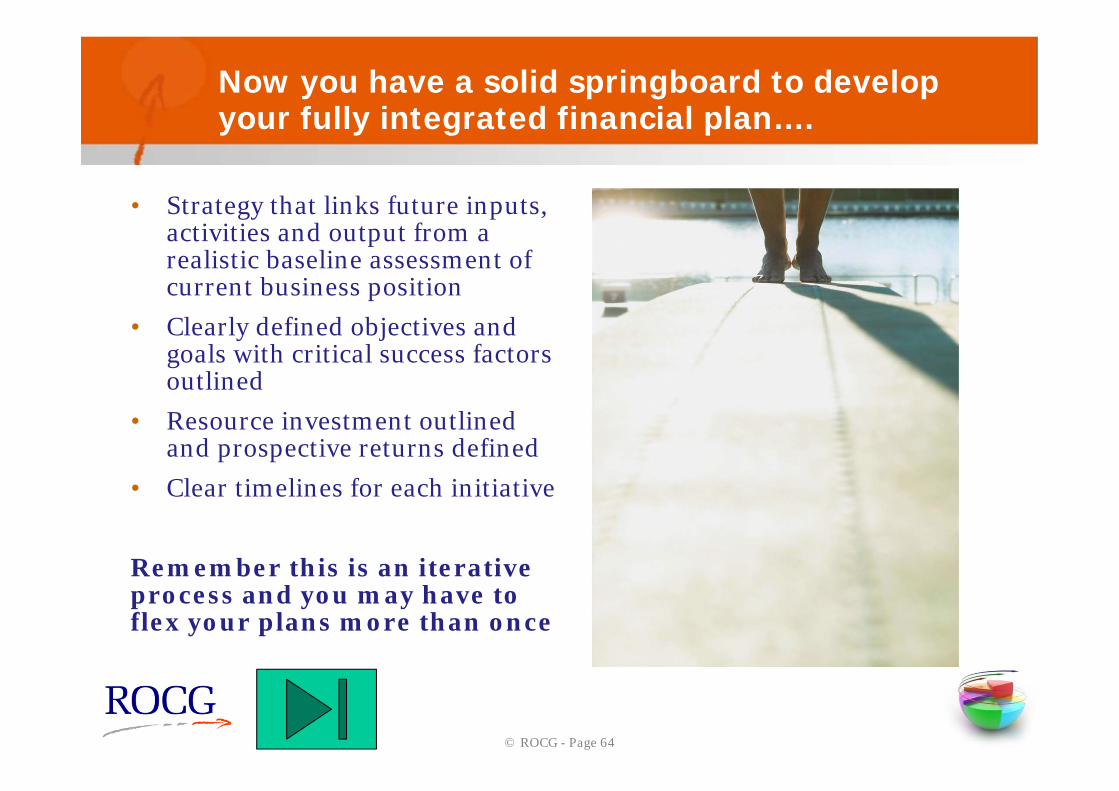
Now you have a solid springboard to develop your fully integrated financial plan….
• Strategy that links future inputs, activities and output from a realistic baseline assessment of current business position
• Clearly defined objectives and goals with critical success factors outlined
• Resource investment outlined and prospective returns defined
• Clear timelines for each initiative
Remember this is an iterative process and you may have to flex your plans more than once
© ROCG - Page 65
The Bankable Business PlanAssessing Funding Risk - Financial and Commercial
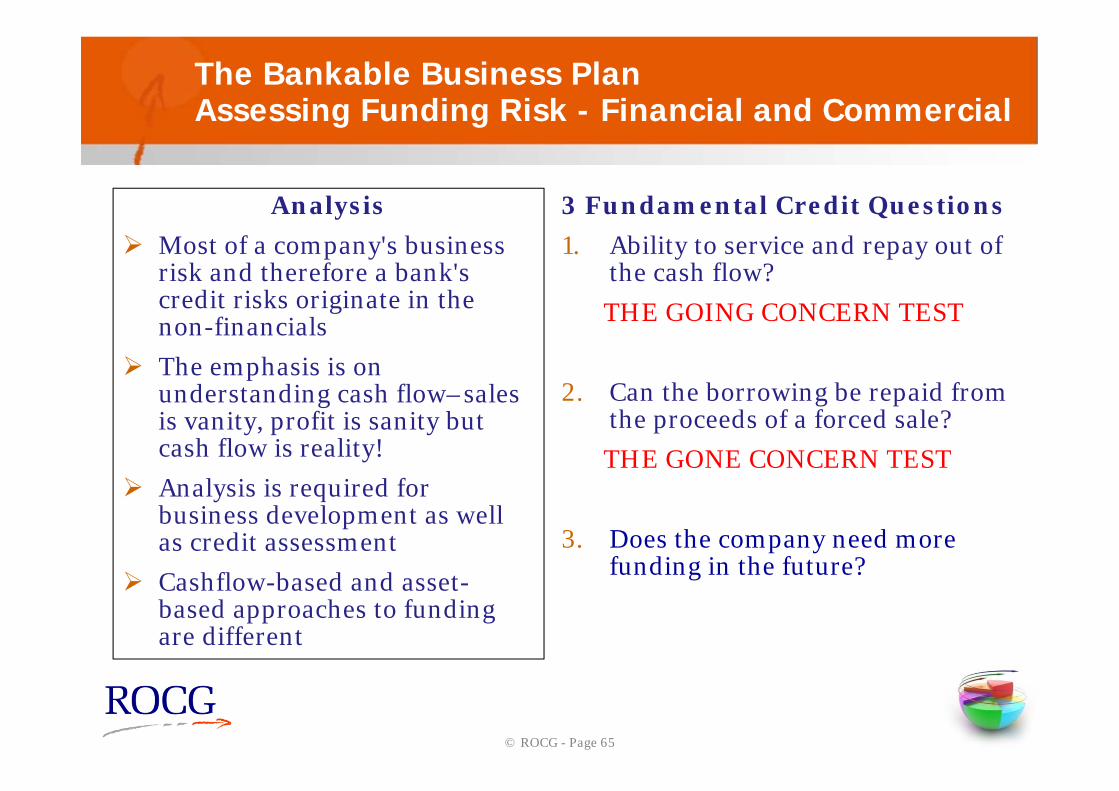
Analysis Most of a company's business
risk and therefore a bank's credit risks originate in the non-financials
The emphasis is on understanding cash flow–sales is vanity, profit is sanity but cash flow is reality!
Analysis is required for business development as well as credit assessment
Cashflow-based and asset-based approaches to funding are different
3 Fundamental Credit Questions1. Ability to service and repay out of
the cash flow?THE GOING CONCERN TEST
2. Can the borrowing be repaid from the proceeds of a forced sale?THE GONE CONCERN TEST
3. Does the company need more funding in the future?
© ROCG - Page 66
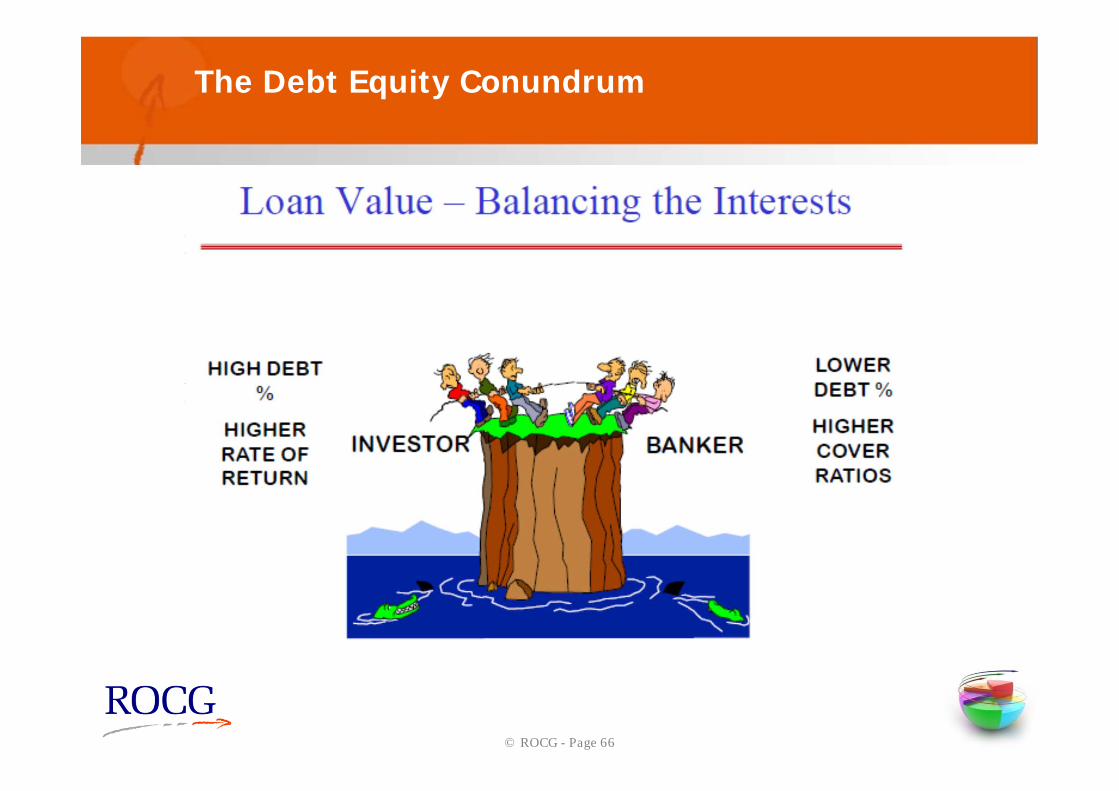
The Debt Equity Conundrum
Equity Providers accept more risk
and receive more upside –return on money is more important than return of money
Risk money shares the upside but is lost in the downside
Debt Lenders accept less risk
because they receive less reward – return of money is more important than return on money
Does not share in the upside – returns to the provider are fixed and low and therefore must be protected from downside
© ROCG - Page 67
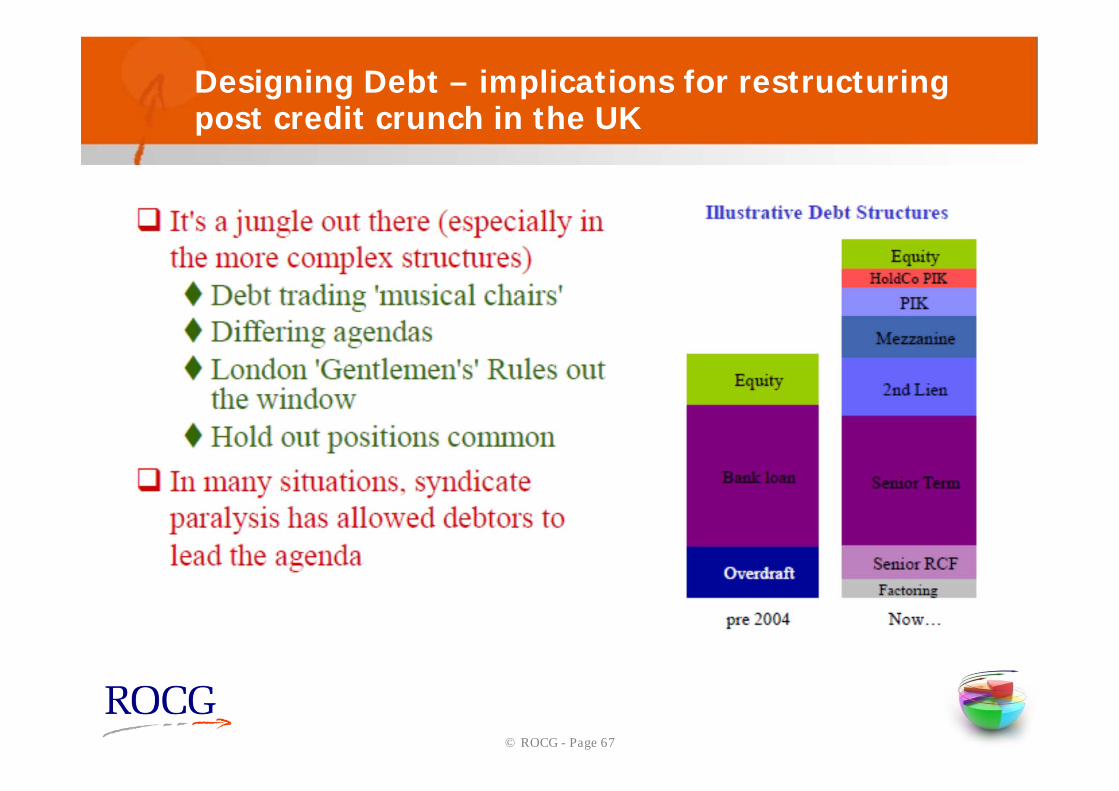
Designing Debt – implications for restructuring post credit crunch in the UK
© ROCG - Page 68
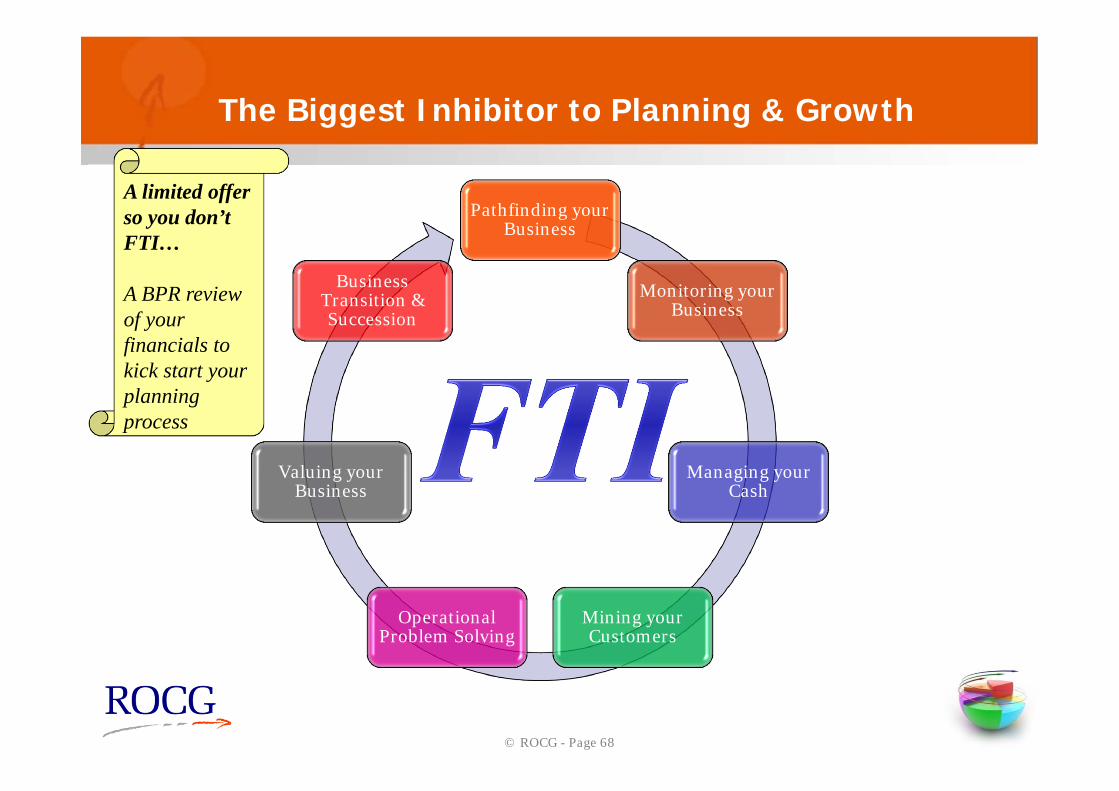
The Biggest Inhibitor to Planning & Growth
Pathfinding your Business
Monitoring your Business
Managing your Cash
Mining your Customers
Operational Problem Solving
Valuing your Business
Business Transition & Succession
A limited offer so you don’t FTI…
A BPR review of your financials to kick start your planning process