Embed Size (px)
Citation preview
BANKING BUSINESS PERFORMANCE AND PRIORITIES BGEO Investor Day 9 November 2017 Tbilisi, Georgia Speaker: Kaha Kiknavelidze, CEO, Bank of Georgia
1
CONTENT
Banking industry highlights
Banking business targets and priorities
Banking business performance update – 3Q17 & 9M17
Q&A
Macroeconomic overview
2
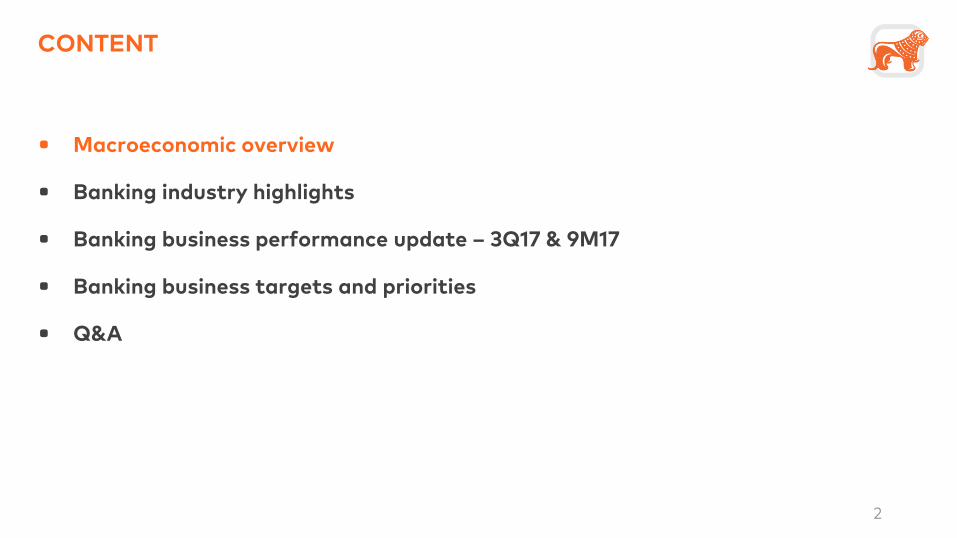
ATTRACTIVE PLACE TO DO BUSINESS
Global Corruption Barometer 2016
Source: Transparency International
Doing Business Ranking, 2018
1
2
6
8
9
12
20
27
30
35
36
46
47
57
60
76
100
New Zealand
Singapore
US
Norway
Georgia
Estonia
Germany
Poland
Czech rep.
Russia
Kazakhstan
Italy
Armenia
Azerbaijan
Turkey
Ukraine
India
up from 16 in 2017
Source: The World Bank
3
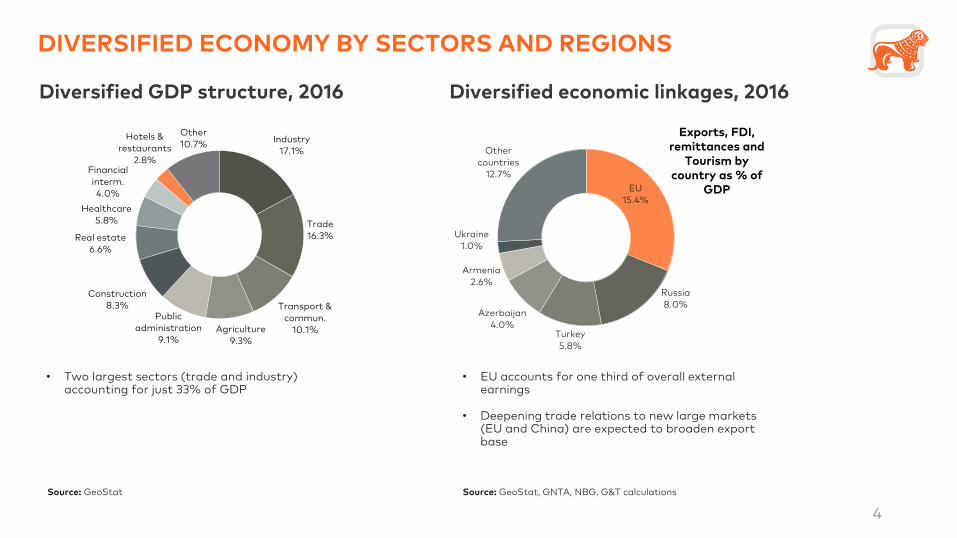
DIVERSIFIED ECONOMY BY SECTORS AND REGIONS
Diversified GDP structure, 2016 Diversified economic linkages, 2016
Industry
17.1%
Trade
16.3%
Transport &
commun.
10.1% Agriculture
9.3%
Public
administration
9.1%
Construction
8.3%
Real estate
6.6%
Healthcare
5.8%
Financial
interm.
4.0%
Hotels &
restaurants
2.8%
Other
10.7%
EU
15.4%
Russia
8.0%
Turkey
5.8%
Azerbaijan
4.0%
Armenia
2.6%
Ukraine
1.0%
Other
countries
12.7%
Exports, FDI, remittances and
Tourism by country as % of
GDP
Source: GeoStat Source: GeoStat, GNTA, NBG, G&T calculations
• Two largest sectors (trade and industry) accounting for just 33% of GDP
• EU accounts for one third of overall external earnings
• Deepening trade relations to new large markets (EU and China) are expected to broaden export base
4
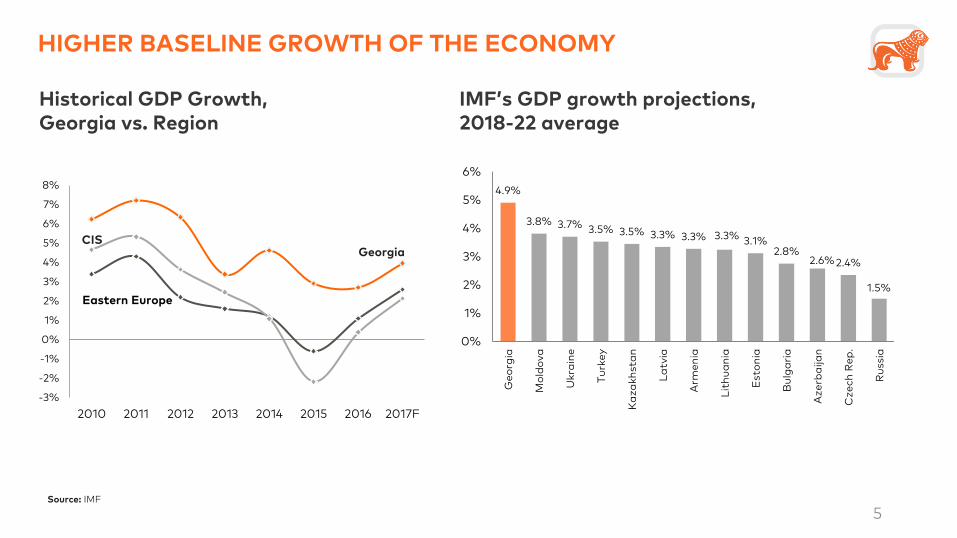
HIGHER BASELINE GROWTH OF THE ECONOMY
Historical GDP Growth, Georgia vs. Region
IMF’s GDP growth projections, 2018-22 average
Source: IMF
-3%
-2%
-1%
0%
1%
2%
3%
4%
5%
6%
7%
8%
2010 2011 2012 2013 2014 2015 2016 2017F
Georgia CIS
Eastern Europe
4.9%
3.8% 3.7% 3.5% 3.5% 3.3% 3.3% 3.3% 3.1% 2.8%
2.6% 2.4%
1.5%
0%
1%
2%
3%
4%
5%
6%
Ge
org
ia
Mo
ldo
va
Ukra
ine
Tu
rke
y
Ka
za
kh
sta
n
La
tvia
Arm
en
ia
Lit
hu
an
ia
Est
on
ia
Bu
lga
ria
Az
erb
aija
n
Cz
ech
Re
p.
Ru
ssia
5
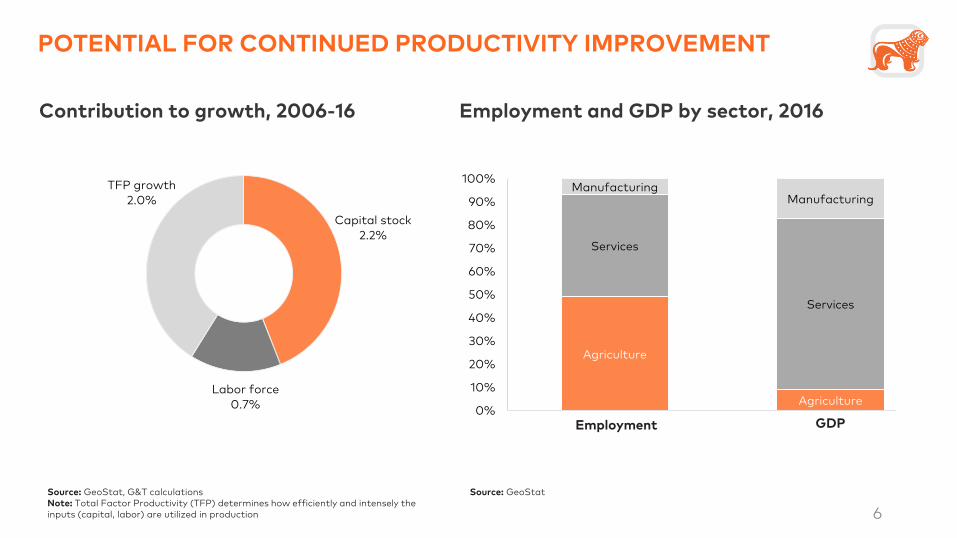
POTENTIAL FOR CONTINUED PRODUCTIVITY IMPROVEMENT
Contribution to growth, 2006-16 Employment and GDP by sector, 2016
Capital stock
2.2%
Labor force
0.7%
TFP growth
2.0%
Source: GeoStat, G&T calculations Note: Total Factor Productivity (TFP) determines how efficiently and intensely the inputs (capital, labor) are utilized in production
Source: GeoStat
Agriculture
Agriculture
Services
Services
Manufacturing Manufacturing
0%
10%
20%
30%
40%
50%
60%
70%
80%
90%
100%
Employment GDP
6
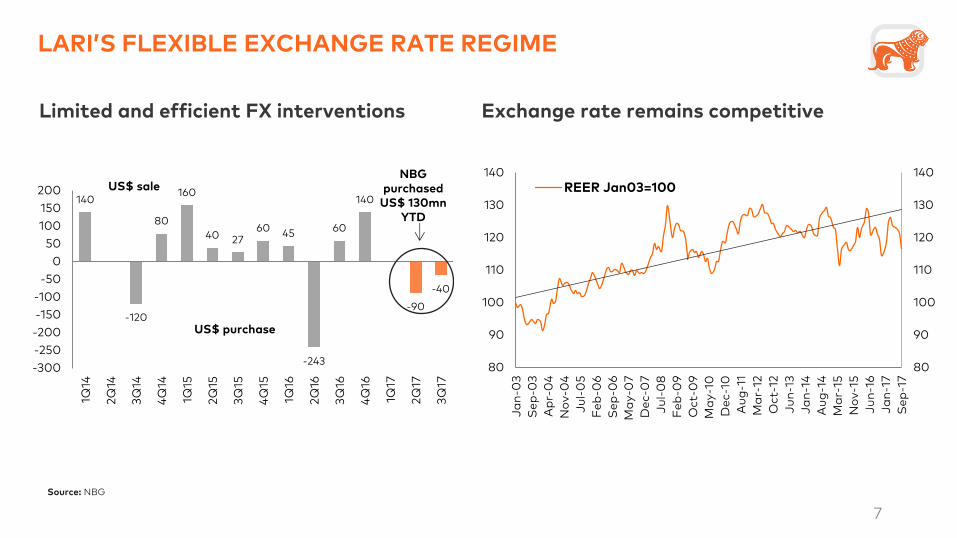
LARI’S FLEXIBLE EXCHANGE RATE REGIME
Limited and efficient FX interventions Exchange rate remains competitive
Source: NBG
140
-120
80
160
40 27 60
45
-243
60
140
-90
-40
-300
-250
-200
-150
-100
-50
0
50
100
150
200
1Q14
2Q
14
3Q
14
4Q
14
1Q15
2Q
15
3Q
15
4Q
15
1Q16
2Q
16
3Q
16
4Q
16
1Q17
2Q
17
3Q
17
NBG purchased
US$ 130mn YTD
US$ sale
US$ purchase
80
90
100
110
120
130
140
80
90
100
110
120
130
140
Ja
n-0
3
Se
p-0
3
Ap
r-0
4
No
v-0
4
Ju
l-0
5
Fe
b-0
6
Se
p-0
6
Ma
y-0
7
De
c-0
7
Ju
l-0
8
Fe
b-0
9
Oct-
09
Ma
y-1
0
De
c-1
0
Au
g-1
1
Ma
r-12
Oct-
12
Ju
n-1
3
Ja
n-1
4
Au
g-1
4
Ma
r-15
No
v-1
5
Ju
n-1
6
Ja
n-1
7
Se
p-1
7
REER Jan03=100
7
CONTENT
Banking industry highlights
Banking business targets and priorities
Banking business performance update – 3Q17 & 9M17
Q&A
Macroeconomic overview
8

ROOM FOR FURTHER CREDIT GROWTH
Source: NBG Source: Central Banks, IMF, as of 31 Dec 2016
Banking sector loan portfolio growth Banking Penetration (Sector Loans to GDP)
84.9%
74.7%
64.6%
62.1%
57.9%
56.9%
55.7%
53.2%
48.1%
41.4%
Estonia
Serbia
Russia
Lithuania
Latvia
Turkey
Georgia
Bulgaria
Armenia
Ukraine
• Loan portfolio increased 16.0% y/y excluding FX effect in Sep-17
0%
10%
20%
30%
40%
50%
60%
0%
10%
20%
30%
40%
50%
60%
Ja
n-1
4
Ma
r-14
Ma
y-1
4
Ju
l-14
Se
p-1
4
No
v-1
4
Ja
n-1
5
Ma
r-15
Ma
y-1
5
Ju
l-15
Se
p-1
5
No
v-1
5
Ja
n-1
6
Ma
r-16
Ma
y-1
6
Ju
l-16
Se
p-1
6
No
v-1
6
Ja
n-1
7
Ma
r-17
Ma
y-1
7
Ju
l-17
Se
p-1
7
GEL-denominated loans, % change y/y
FX-denominated loans, % change y/y (exc. FX effect)
Total loan portfolio, % change y/y (exc. FX effect)
9
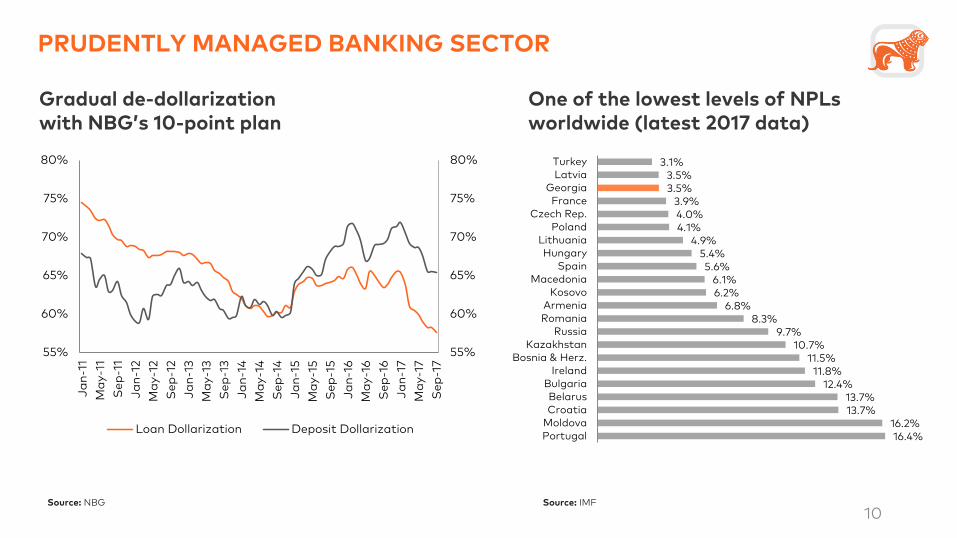
PRUDENTLY MANAGED BANKING SECTOR
Source: NBG Source: IMF
Gradual de-dollarization with NBG’s 10-point plan
One of the lowest levels of NPLs worldwide (latest 2017 data)
55%
60%
65%
70%
75%
80%
55%
60%
65%
70%
75%
80%
Ja
n-1
1
Ma
y-1
1
Se
p-1
1
Ja
n-1
2
Ma
y-1
2
Se
p-1
2
Ja
n-1
3
Ma
y-1
3
Se
p-1
3
Ja
n-1
4
Ma
y-1
4
Se
p-1
4
Ja
n-1
5
Ma
y-1
5
Se
p-1
5
Ja
n-1
6
Ma
y-1
6
Se
p-1
6
Ja
n-1
7
Ma
y-1
7
Se
p-1
7Loan Dollarization Deposit Dollarization
16.4% 16.2%
13.7% 13.7%
12.4% 11.8%
11.5% 10.7%
9.7% 8.3%
6.8% 6.2% 6.1%
5.6% 5.4%
4.9% 4.1% 4.0% 3.9%
3.5% 3.5%
3.1%
PortugalMoldovaCroatiaBelarus
BulgariaIreland
Bosnia & Herz.Kazakhstan
RussiaRomaniaArmenia
KosovoMacedonia
SpainHungary
LithuaniaPoland
Czech Rep.France
GeorgiaLatviaTurkey
10
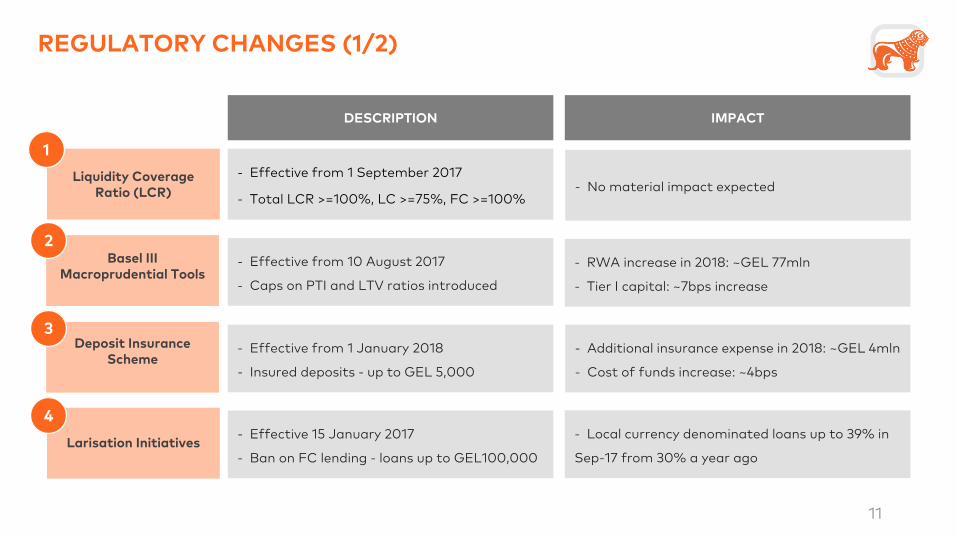
REGULATORY CHANGES (1/2)
Liquidity Coverage Ratio (LCR)
Basel III Macroprudential Tools
Deposit Insurance Scheme
- Effective from 1 September 2017
- Total LCR >=100%, LC >=75%, FC >=100%
- Effective from 10 August 2017
- Caps on PTI and LTV ratios introduced
- Effective from 1 January 2018
- Insured deposits - up to GEL 5,000
- No material impact expected
- RWA increase in 2018: ~GEL 77mln
- Tier I capital: ~7bps increase
- Additional insurance expense in 2018: ~GEL 4mln
- Cost of funds increase: ~4bps
DESCRIPTION
Larisation Initiatives
- Local currency denominated loans up to 39% in
Sep-17 from 30% a year ago
- Effective 15 January 2017
- Ban on FC lending - loans up to GEL100,000
IMPACT
1
2
3
4
11
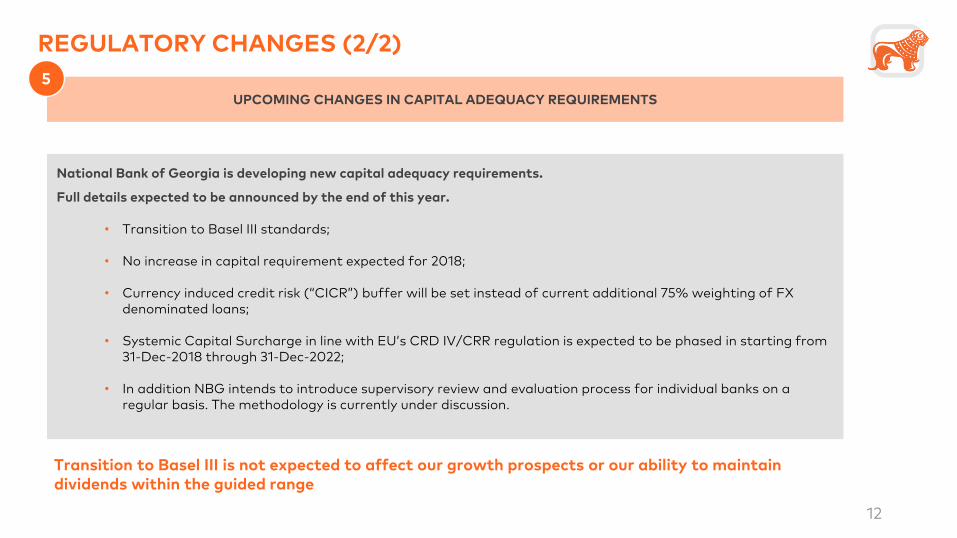
REGULATORY CHANGES (2/2)
UPCOMING CHANGES IN CAPITAL ADEQUACY REQUIREMENTS
5
National Bank of Georgia is developing new capital adequacy requirements.
Full details expected to be announced by the end of this year.
• Transition to Basel III standards;
• No increase in capital requirement expected for 2018;
• Currency induced credit risk (“CICR”) buffer will be set instead of current additional 75% weighting of FX denominated loans;
• Systemic Capital Surcharge in line with EU’s CRD IV/CRR regulation is expected to be phased in starting from 31-Dec-2018 through 31-Dec-2022;
• In addition NBG intends to introduce supervisory review and evaluation process for individual banks on a regular basis. The methodology is currently under discussion.
12
Transition to Basel III is not expected to affect our growth prospects or our ability to maintain dividends within the guided range
CONTENT
Banking industry highlights
Banking business targets and priorities
Banking business performance update – 3Q17 & 9M17
Q&A
Macroeconomic overview
13
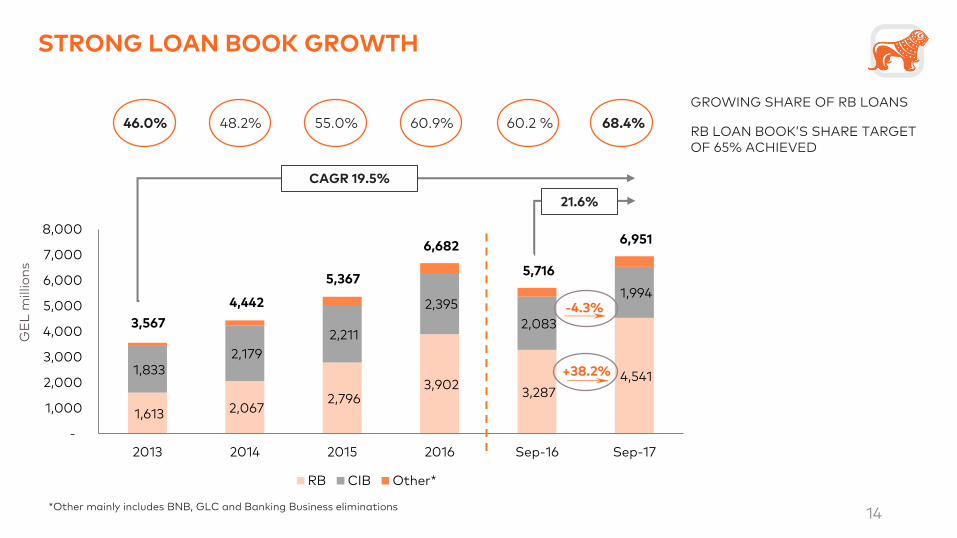
STRONG LOAN BOOK GROWTH
GROWING SHARE OF RB LOANS
RB LOAN BOOK’S SHARE TARGET OF 65% ACHIEVED
*Other mainly includes BNB, GLC and Banking Business eliminations
1,613 2,067 2,796
3,902 3,287
4,541 1,833 2,179
2,211
2,395
2,083
1,994
3,567
4,442
5,367
6,682
5,716
6,951
-
1,000
2,000
3,000
4,000
5,000
6,000
7,000
8,000
2013 2014 2015 2016 Sep-16 Sep-17
RB CIB Other*
CAGR 19.5%
68.4% 60.2 % 60.9% 55.0% 48.2% 46.0%
-4.3%
+38.2%
GE
L m
illio
ns
14
21.6%
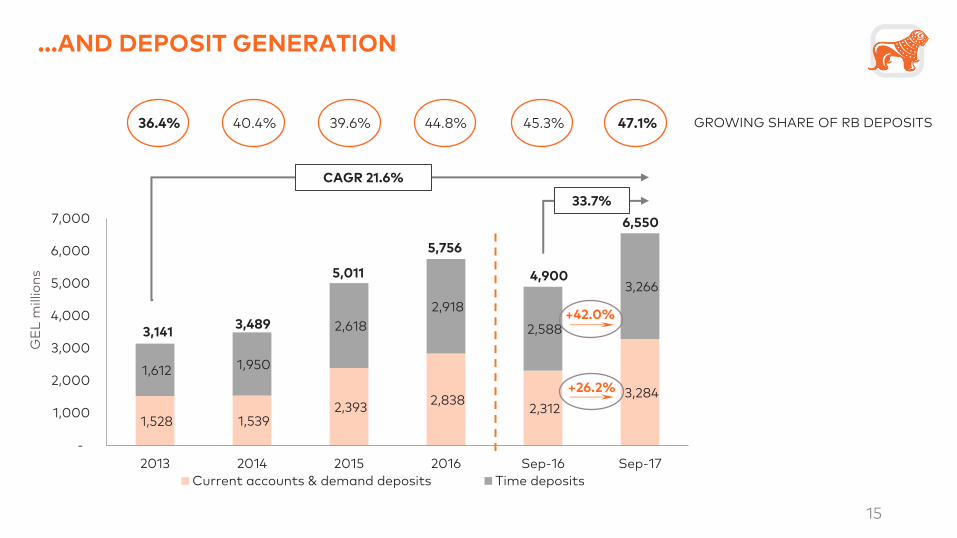
…AND DEPOSIT GENERATION
GROWING SHARE OF RB DEPOSITS
1,528 1,539 2,393
2,838 2,312
3,284
1,612 1,950
2,618
2,918
2,588
3,266
3,141 3,489
5,011
5,756
4,900
6,550
-
1,000
2,000
3,000
4,000
5,000
6,000
7,000
2013 2014 2015 2016 Sep-16 Sep-17
Current accounts & demand deposits Time deposits
+26.2%
+42.0%
GE
L m
illio
ns
47.1% 45.3% 44.8% 39.6% 40.4% 36.4%
33.7%
CAGR 21.6%
15
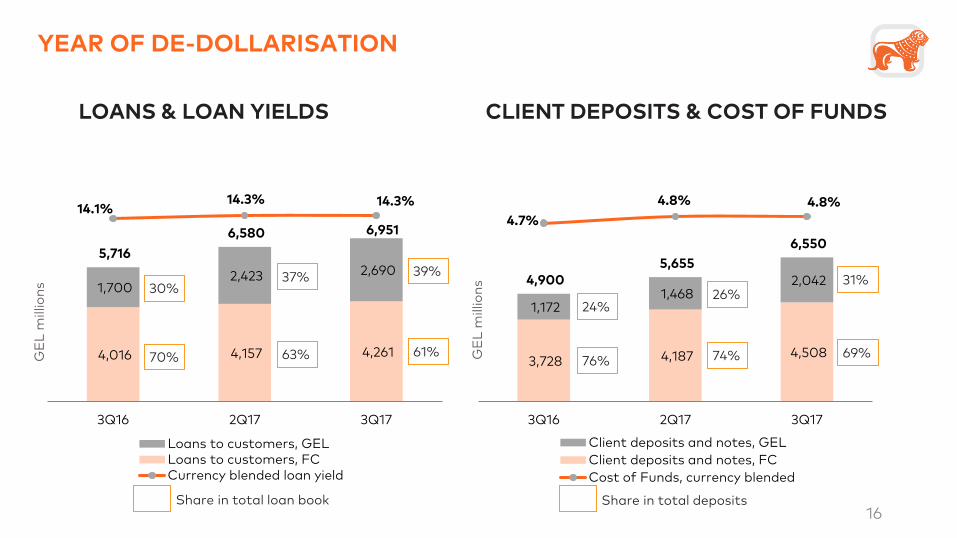
YEAR OF DE-DOLLARISATION
LOANS & LOAN YIELDS
4,016 4,157 4,261
1,700 2,423 2,690
5,716
6,580 6,951
14.1% 14.3% 14.3%
3Q16 2Q17 3Q17
Loans to customers, GELLoans to customers, FCCurrency blended loan yield
3,728 4,187 4,508
1,172 1,468
2,042 4,900 5,655
6,550
4.7%
4.8% 4.8%
3Q16 2Q17 3Q17
Client deposits and notes, GEL
Client deposits and notes, FC
Cost of Funds, currency blended
CLIENT DEPOSITS & COST OF FUNDS
GE
L m
illio
ns
GE
L m
illio
ns 30%
70%
37%
63%
39%
61%
24%
76%
26%
74%
31%
69%
16 Share in total loan book Share in total deposits
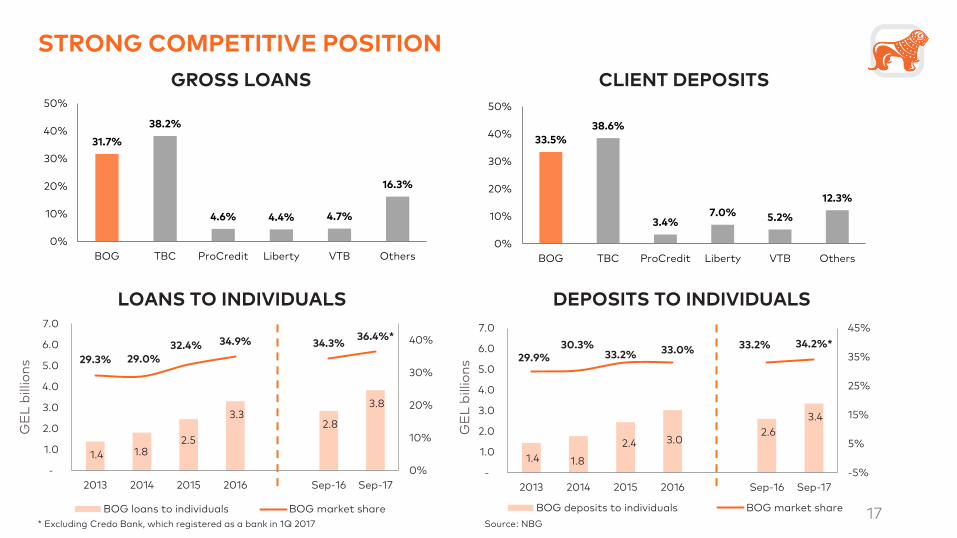
STRONG COMPETITIVE POSITION
CLIENT DEPOSITS
LOANS TO INDIVIDUALS DEPOSITS TO INDIVIDUALS
* Excluding Credo Bank, which registered as a bank in 1Q 2017 Source: NBG
31.7%
38.2%
4.6% 4.4% 4.7%
16.3%
0%
10%
20%
30%
40%
50%
BOG TBC ProCredit Liberty VTB Others
GROSS LOANS
1.4 1.8 2.5
3.3 2.8
3.8
29.3% 29.0%
32.4% 34.9% 34.3% 36.4%*
0%
10%
20%
30%
40%
-
1.0
2.0
3.0
4.0
5.0
6.0
7.0
2013 2014 2015 2016 Sep-16 Sep-17
BOG loans to individuals BOG market share
33.5%
38.6%
3.4% 7.0% 5.2%
12.3%
0%
10%
20%
30%
40%
50%
BOG TBC ProCredit Liberty VTB Others
1.4 1.8
2.4 3.0 2.6
3.4
29.9% 30.3%
33.2% 33.0% 33.2% 34.2%*
-5%
5%
15%
25%
35%
45%
-
1.0
2.0
3.0
4.0
5.0
6.0
7.0
2013 2014 2015 2016 Sep-16 Sep-17
BOG deposits to individuals BOG market share
GE
L b
illio
ns
GE
L b
illio
ns
17

129 129 138 158 161 160 168
396
489
49 48 56 66 53 52 55
154
160
178 177 194
224 214 212 223
550
649
0
100
200
300
400
500
600
700
1Q16 2Q16 3Q16 4Q16 1Q17 2Q17 3Q17 9M16 9M17
Net interest income Net non-interest income
SOLID BANKING REVENUE GROWTH
+14.9%
+5.3%
+18.1%
GE
L m
illio
ns
REVENUE
18
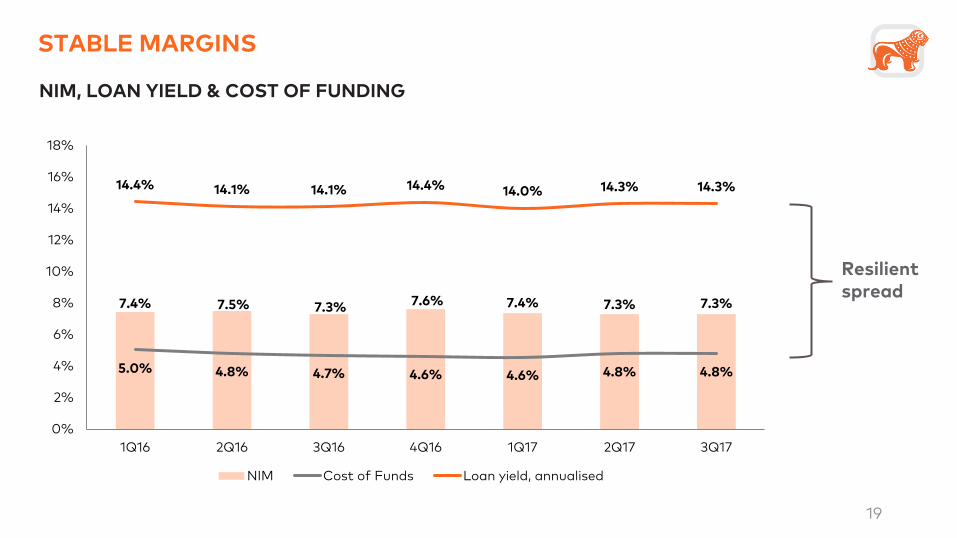
STABLE MARGINS
Resilient spread
7.4% 7.5% 7.3% 7.6% 7.4% 7.3% 7.3%
5.0% 4.8% 4.7% 4.6% 4.6% 4.8% 4.8%
14.4% 14.1% 14.1% 14.4% 14.0% 14.3% 14.3%
0%
2%
4%
6%
8%
10%
12%
14%
16%
18%
1Q16 2Q16 3Q16 4Q16 1Q17 2Q17 3Q17
NIM Cost of Funds Loan yield, annualised
NIM, LOAN YIELD & COST OF FUNDING
19

27.9 29.5 30.7 36.8 30.2 31.4 33.1
88.1 94.7
17.4 16.5 21.6
27.7 19.7 19.3 19.6
55.5 58.6
48.5 48.7 56.5
66.6
52.9 51.7 55.4
153.7 160.0
0
20
40
60
80
100
120
140
160
180
1Q16 2Q16 3Q16 4Q16 1Q17 2Q17 3Q17 9M16 9M17
Net fee and commission income Net banking foreign currency gain Net other banking income
SOLID BANKING REVENUE GROWTH G
EL
mill
ion
s
NET NON-INTEREST INCOME
20
-1.9%
+7.1%
+4.1%
23.0 26.2 26.8
33.1
27.0 28.6 29.4
76.0
85.0
0
10
20
30
40
50
60
70
80
90
1Q16 2Q16 3Q16 4Q16 1Q17 2Q17 3Q17 9M16 9M17
Net fee and commission income excluding CIB's income from documentary operations
SOLID NET FEE AND COMMISSION INCOME GROWTH G
EL
mill
ion
s
21
+9.8%
+2.7%
+11.9%
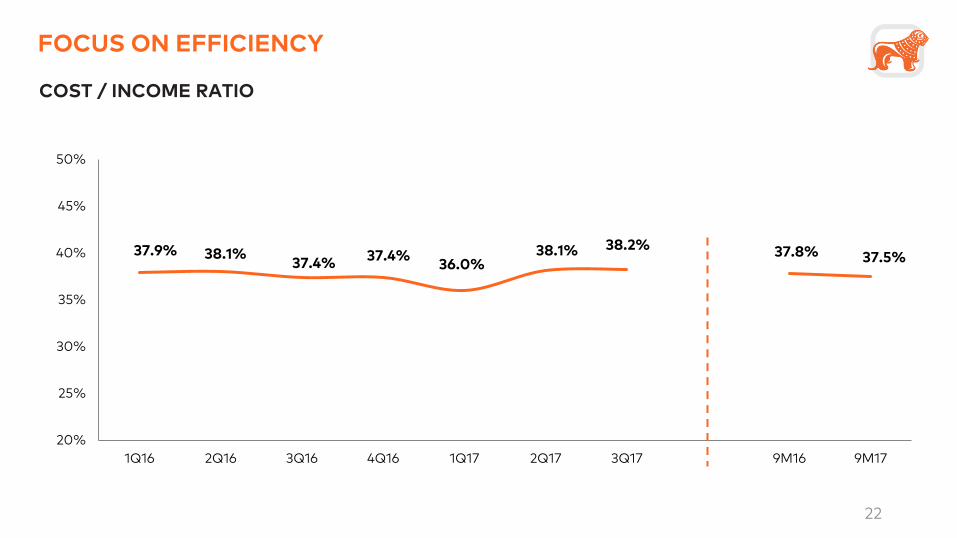
37.9% 38.1% 37.4%
37.4% 36.0%
38.1% 38.2% 37.8% 37.5%
20%
25%
30%
35%
40%
45%
50%
1Q16 2Q16 3Q16 4Q16 1Q17 2Q17 3Q17 9M16 9M17
FOCUS ON EFFICIENCY
COST / INCOME RATIO
22
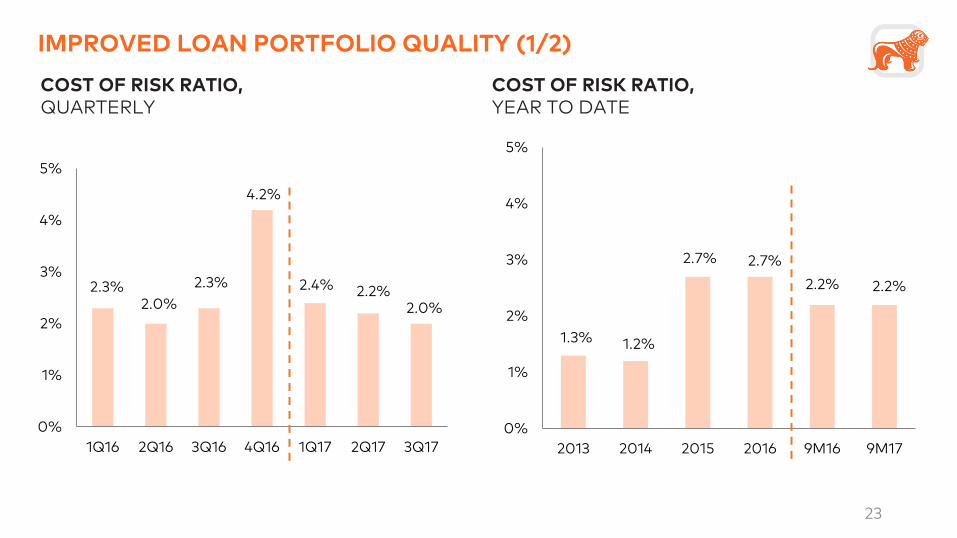
IMPROVED LOAN PORTFOLIO QUALITY (1/2)
COST OF RISK RATIO, QUARTERLY
COST OF RISK RATIO, YEAR TO DATE
1.3% 1.2%
2.7% 2.7%
2.2% 2.2%
0%
1%
2%
3%
4%
5%
2013 2014 2015 2016 9M16 9M17
2.3% 2.0%
2.3%
4.2%
2.4% 2.2% 2.0%
0%
1%
2%
3%
4%
5%
1Q16 2Q16 3Q16 4Q16 1Q17 2Q17 3Q17
23
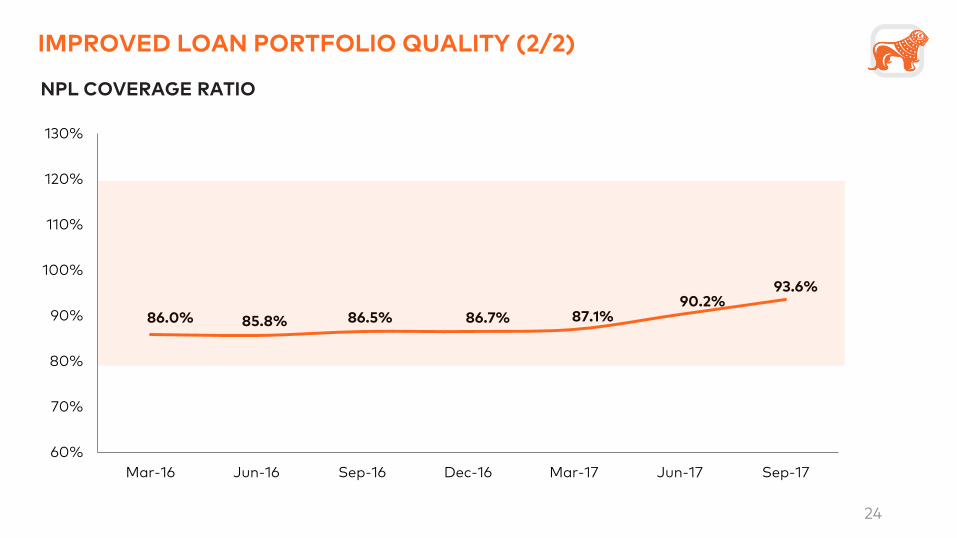
86.0% 85.8% 86.5% 86.7% 87.1% 90.2%
93.6%
60%
70%
80%
90%
100%
110%
120%
130%
Mar-16 Jun-16 Sep-16 Dec-16 Mar-17 Jun-17 Sep-17
IMPROVED LOAN PORTFOLIO QUALITY (2/2)
NPL COVERAGE RATIO
24
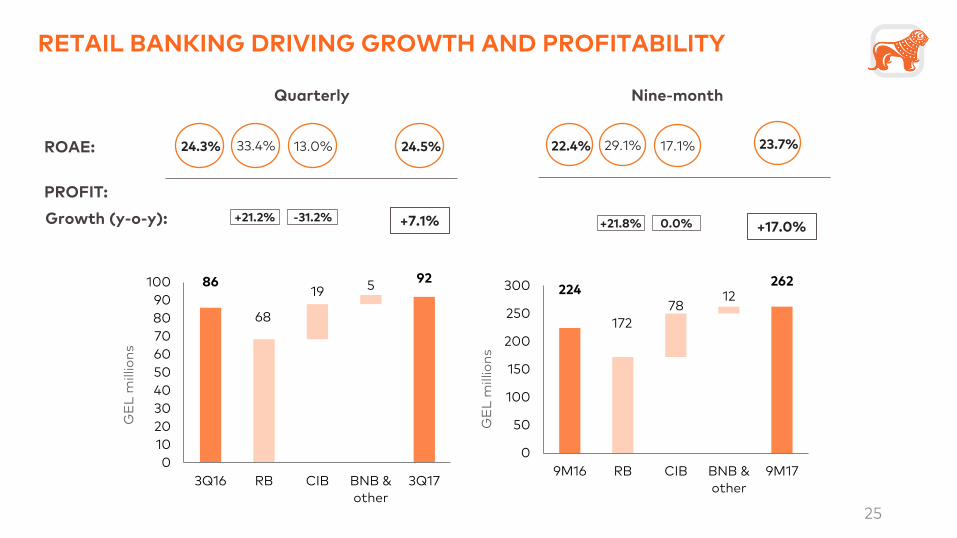
RETAIL BANKING DRIVING GROWTH AND PROFITABILITY
33.4% 24.3% 13.0% 24.5%
Quarterly
ROAE:
+21.2% -31.2% +7.1%
PROFIT:
GE
L m
illio
ns
86
68
92 19 5
0
10
20
30
40
50
60
70
80
90
100
3Q16 RB CIB BNB &
other
3Q17
Nine-month
29.1% 22.4% 17.1% 23.7%
+21.8% 0.0% +17.0%
GE
L m
illio
ns
224
172
262
78 12
0
50
100
150
200
250
300
9M16 RB CIB BNB &
other
9M17
Growth (y-o-y):
25

STRONG LIQUIDITY
LIQUIDITY RATIO
BOG Standalone
178
789
418
843 35.0%
46.2%
37.7%
44.4%
0%
5%
10%
15%
20%
25%
30%
35%
40%
45%
50%
0
200
400
600
800
1,000
1,200
Dec-14 Dec-15 Dec-16 Sep-17
Excess liquidity Liquid assets / liabilities ≥ 30%
26
GE
L m
illio
ns
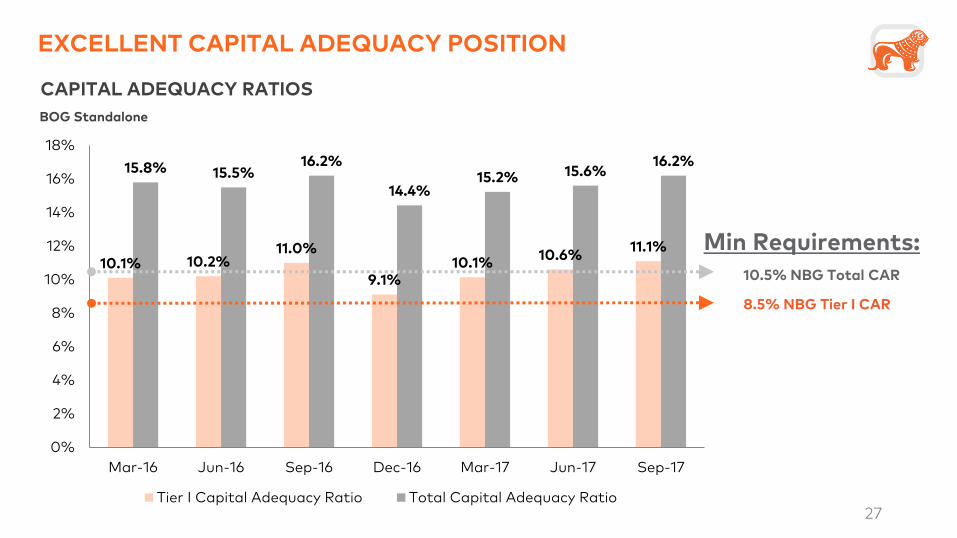
10.1% 10.2% 11.0%
9.1% 10.1%
10.6% 11.1%
15.8% 15.5% 16.2%
14.4% 15.2% 15.6%
16.2%
0%
2%
4%
6%
8%
10%
12%
14%
16%
18%
Mar-16 Jun-16 Sep-16 Dec-16 Mar-17 Jun-17 Sep-17
Tier I Capital Adequacy Ratio Total Capital Adequacy Ratio
EXCELLENT CAPITAL ADEQUACY POSITION
CAPITAL ADEQUACY RATIOS
BOG Standalone
8.5% NBG Tier I CAR
Min Requirements: 10.5% NBG Total CAR
27
CONTENT
Banking industry highlights
Banking business targets and priorities
Banking business performance update – 3Q17 & 9M17
Q&A
Macroeconomic overview
28

RESULTS IN 2017 vs. OUR TARGETS & PRIORITIES
De-concentrate corporate loan book Top-10 borrowers: 10% 11.9%
Increase Mass Retail product to client ratio 3.0 1.7
Grow retail share in loan book 65% 60.2%
ROAE 20%+
Targets
22.4%
9M16
Retail banking growth 20%+ 19.5%
NPL coverage ratio 80-120% 86.5%
10.4%
1.8
68.4%
23.7%
9M17
38.2%
93.6%
Increase number of Solo clients To 40,000 16,964 28,492
Cost of risk c.2.0% 2.2% 2.2%
Become a regional private banking hub AUM: GEL 2.5bln GEL 1.4bln GEL 1.8bln
KEY TARGETS
PRIORITIES
FINANCIAL METRICS
Cost / income c. 35% 37.8%
NIM 7.25% - 7.75% 7.4%
37.5%
7.3%
Progress
1
2
1
2
3
4
1
5
2
3
4
29
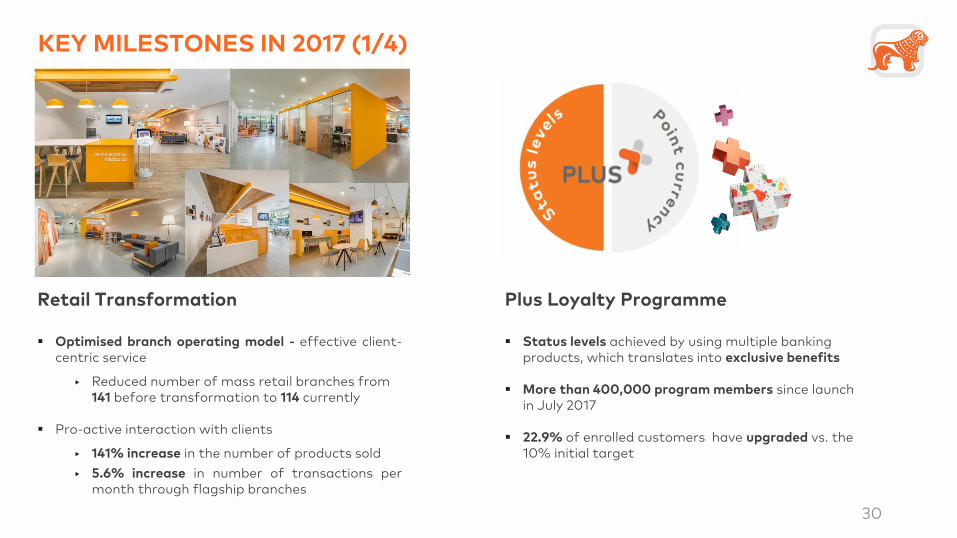
KEY MILESTONES IN 2017 (1/4)
Retail Transformation
Optimised branch operating model - effective client-centric service
‣ Reduced number of mass retail branches from 141 before transformation to 114 currently
Pro-active interaction with clients
‣ 141% increase in the number of products sold
‣ 5.6% increase in number of transactions per month through flagship branches
v
Plus Loyalty Programme
Status levels achieved by using multiple banking products, which translates into exclusive benefits
More than 400,000 program members since launch in July 2017
22.9% of enrolled customers have upgraded vs. the 10% initial target
30
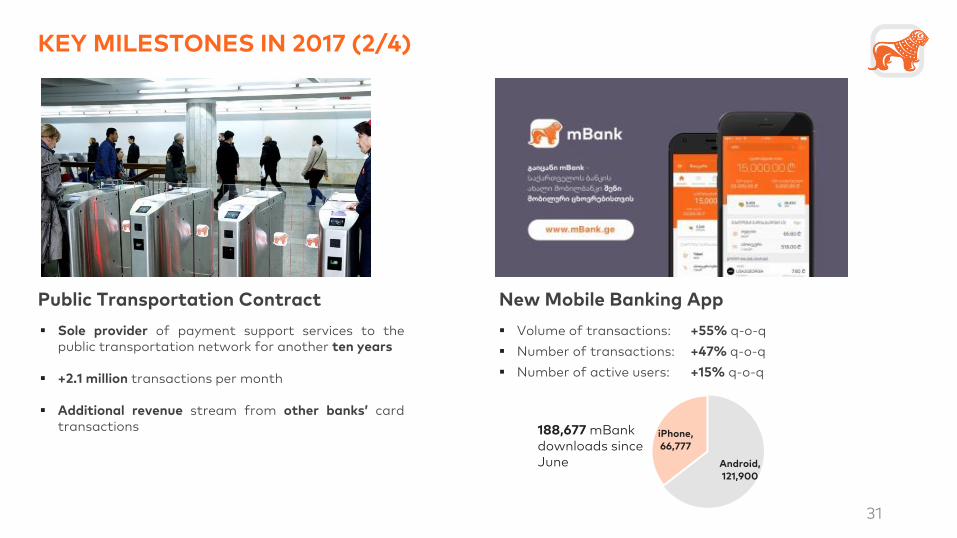
KEY MILESTONES IN 2017 (2/4)
Public Transportation Contract
Sole provider of payment support services to the public transportation network for another ten years
+2.1 million transactions per month
Additional revenue stream from other banks’ card transactions
New Mobile Banking App
Volume of transactions: +55% q-o-q
Number of transactions: +47% q-o-q
Number of active users: +15% q-o-q
Android,
121,900
iPhone,
66,777
31
188,677 mBank downloads since June
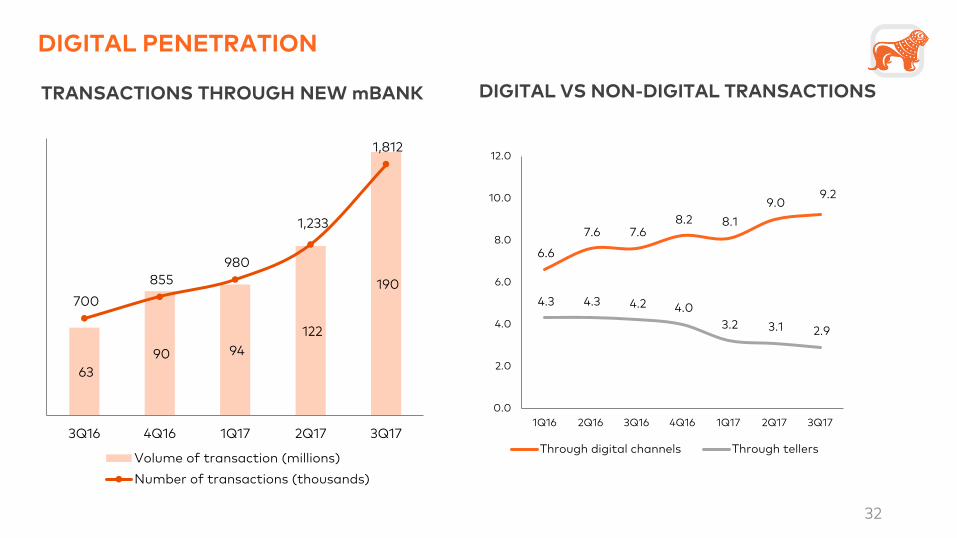
DIGITAL PENETRATION
TRANSACTIONS THROUGH NEW mBANK
63
90 94
122
190
700
855
980
1,233
1,812
3Q16 4Q16 1Q17 2Q17 3Q17
Volume of transaction (millions)
Number of transactions (thousands)
DIGITAL VS NON-DIGITAL TRANSACTIONS
6.6
7.6 7.6 8.2 8.1
9.0 9.2
4.3 4.3 4.2 4.0
3.2 3.1 2.9
0.0
2.0
4.0
6.0
8.0
10.0
12.0
1Q16 2Q16 3Q16 4Q16 1Q17 2Q17 3Q17
Through digital channels Through tellers
32
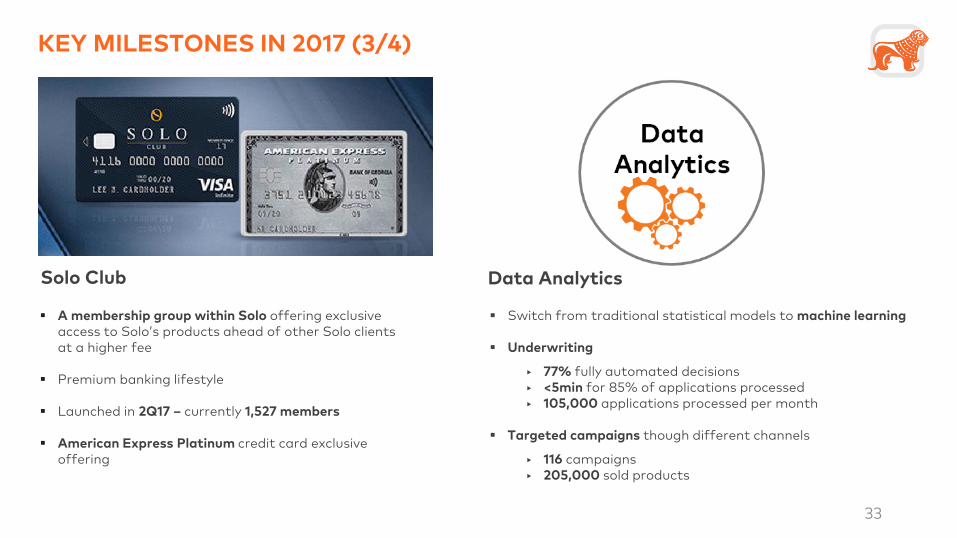
KEY MILESTONES IN 2017 (3/4)
Solo Club
A membership group within Solo offering exclusive access to Solo’s products ahead of other Solo clients at a higher fee
Premium banking lifestyle
Launched in 2Q17 – currently 1,527 members
American Express Platinum credit card exclusive offering
Switch from traditional statistical models to machine learning
Underwriting
‣ 77% fully automated decisions ‣ <5min for 85% of applications processed ‣ 105,000 applications processed per month
Targeted campaigns though different channels
‣ 116 campaigns ‣ 205,000 sold products
33
Data Analytics
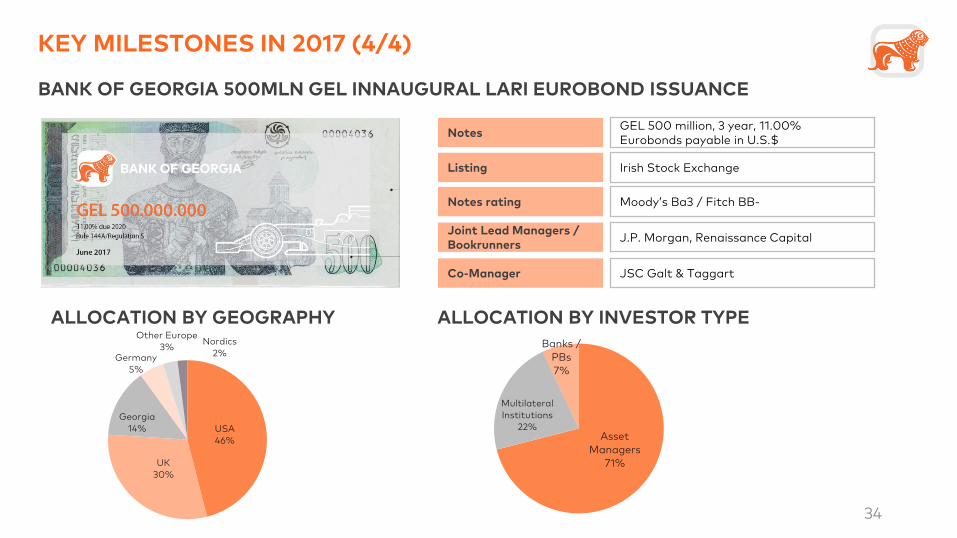
KEY MILESTONES IN 2017 (4/4)
BANK OF GEORGIA 500MLN GEL INNAUGURAL LARI EUROBOND ISSUANCE
Listing Irish Stock Exchange
GEL 500 million, 3 year, 11.00% Eurobonds payable in U.S.$
Notes
Notes rating Moody’s Ba3 / Fitch BB-
Joint Lead Managers / Bookrunners
J.P. Morgan, Renaissance Capital
Co-Manager JSC Galt & Taggart
ALLOCATION BY GEOGRAPHY
USA
46%
UK
30%
Georgia
14%
Germany
5%
Other Europe
3% Nordics
2%
ALLOCATION BY INVESTOR TYPE
Asset
Managers
71%
Multilateral
Institutions
22%
Banks /
PBs
7%
34
RETAIL BANKING CLIENT-CENTRIC, MULTI-BRAND STRATEGY
Brands & target
segments Emerging Retail Mass Retail Mass Affluent
1 2 3
Selected Operating
Data (9M17)
Strategic Focus
To
tal
No
of
Cli
en
ts
(ex
clu
din
g M
SM
E)
2
,09
6,8
43
514,183 clients
1,554,168 clients
28,492 clients
Double number of transactions
Product/client ratio growth to 3.0
Client growth to 40,000
Business Model
Product centric
cross-selling
Focused on transactional
banking
360° financial
planning
Advisory based 5-step approach
SOLO Lifestyle
1%
35
69%
23%
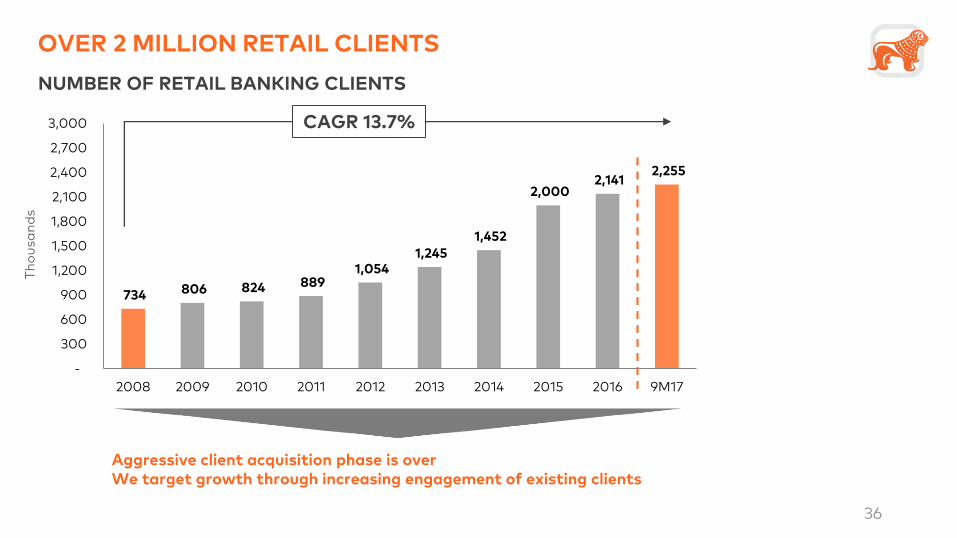
734 806 824 889 1,054
1,245
1,452
2,000 2,141
2,255
-
300
600
900
1,200
1,500
1,800
2,100
2,400
2,700
3,000
2008 2009 2010 2011 2012 2013 2014 2015 2016 9M17
OVER 2 MILLION RETAIL CLIENTS
NUMBER OF RETAIL BANKING CLIENTS
Aggressive client acquisition phase is over We target growth through increasing engagement of existing clients
CAGR 13.7%
Th
ou
san
ds
36
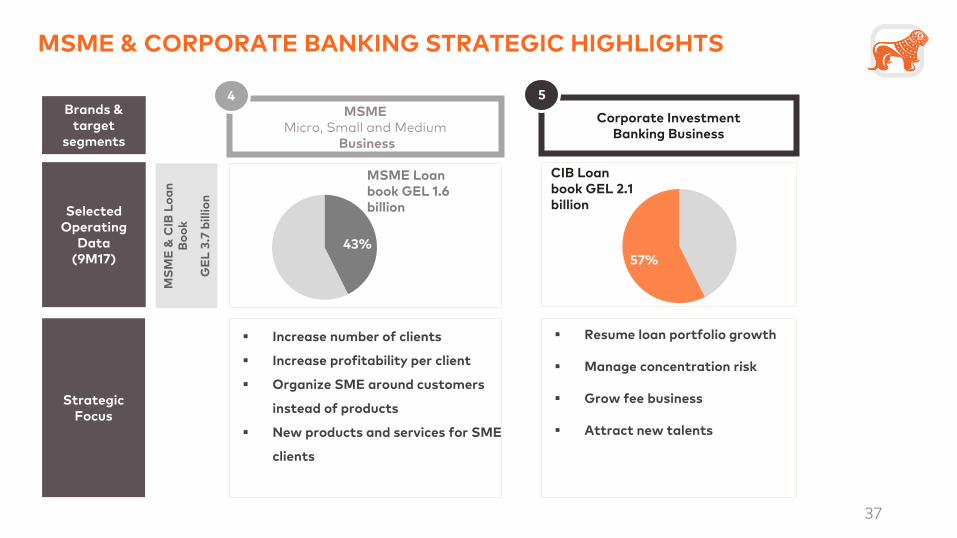
MSME & CORPORATE BANKING STRATEGIC HIGHLIGHTS
Brands & target
segments
Selected Operating
Data (9M17)
Strategic Focus
MSME Micro, Small and Medium
Business
4
Corporate Investment Banking Business
5
Resume loan portfolio growth
Manage concentration risk
Grow fee business
Attract new talents
Increase number of clients
Increase profitability per client
Organize SME around customers
instead of products
New products and services for SME
clients
MSME Loan book GEL 1.6 billion
CIB Loan book GEL 2.1 billion
MS
ME
& C
IB L
oa
n
Bo
ok
GE
L 3
.7 b
illi
on
43% 57%
37
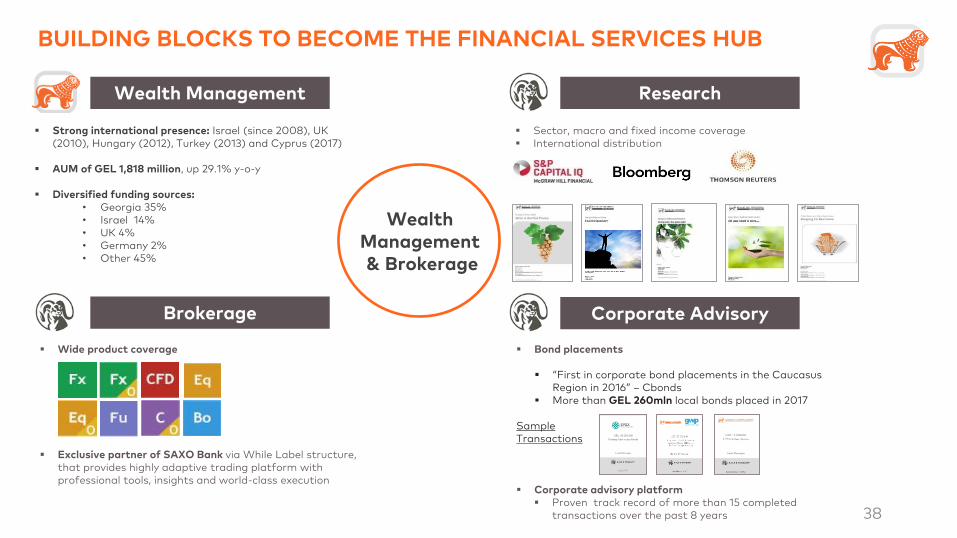
BUILDING BLOCKS TO BECOME THE FINANCIAL SERVICES HUB
Wealth Management
Brokerage
Research
Corporate Advisory
Strong international presence: Israel (since 2008), UK (2010), Hungary (2012), Turkey (2013) and Cyprus (2017)
AUM of GEL 1,818 million, up 29.1% y-o-y
Diversified funding sources: • Georgia 35% • Israel 14% • UK 4% • Germany 2% • Other 45%
Wide product coverage
Exclusive partner of SAXO Bank via While Label structure, that provides highly adaptive trading platform with professional tools, insights and world-class execution
Sector, macro and fixed income coverage International distribution
Bond placements
“First in corporate bond placements in the Caucasus Region in 2016” – Cbonds
More than GEL 260mln local bonds placed in 2017
Sample Transactions
Corporate advisory platform Proven track record of more than 15 completed
transactions over the past 8 years
Wealth Management & Brokerage
38
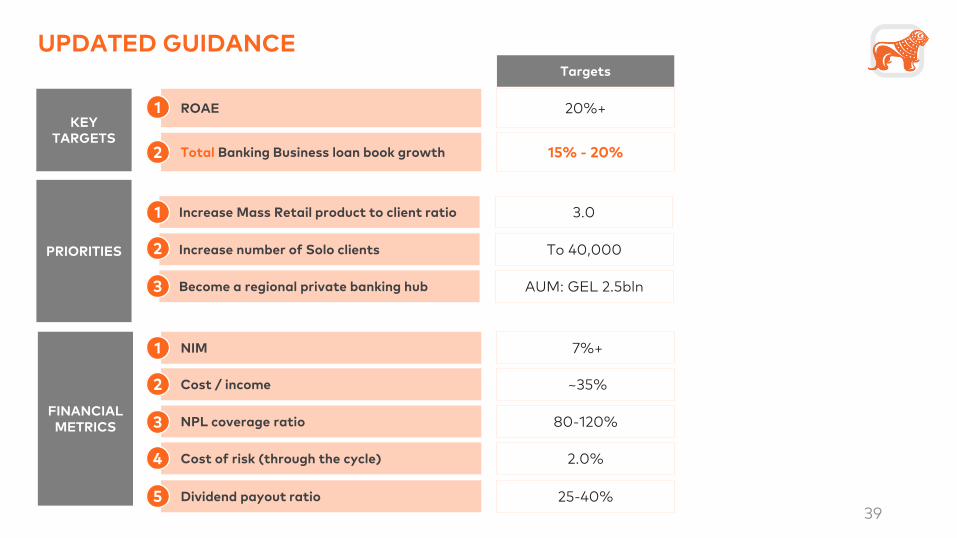
UPDATED GUIDANCE
Become a regional private banking hub AUM: GEL 2.5bln
Increase Mass Retail product to client ratio 3.0
ROAE 20%+
Targets
Total Banking Business loan book growth 15% - 20%
NPL coverage ratio 80-120%
Increase number of Solo clients To 40,000
Cost of risk (through the cycle) 2.0%
KEY TARGETS
PRIORITIES
FINANCIAL METRICS
Cost / income ~35%
NIM 7%+
Dividend payout ratio 25-40%
1
2
1
2
3
1
2
3
4
5 39
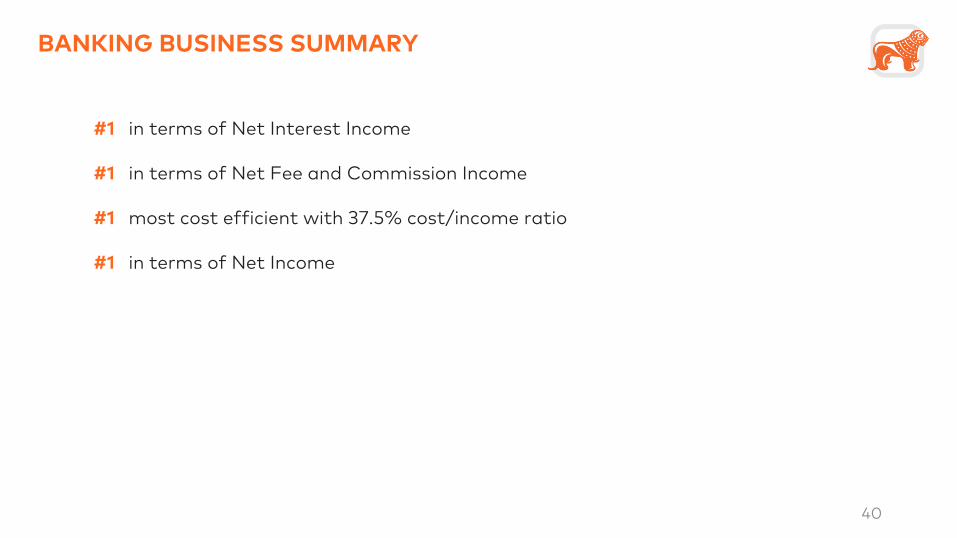
BANKING BUSINESS SUMMARY
#1 in terms of Net Interest Income #1 in terms of Net Fee and Commission Income #1 most cost efficient with 37.5% cost/income ratio #1 in terms of Net Income
40
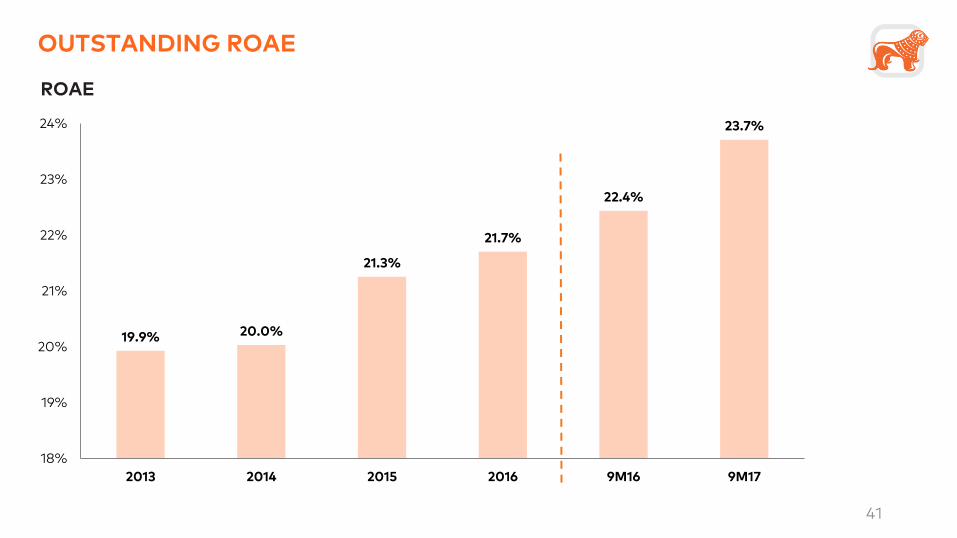
OUTSTANDING ROAE
19.9% 20.0%
21.3%
21.7%
22.4%
23.7%
18%
19%
20%
21%
22%
23%
24%
2013 2014 2015 2016 9M16 9M17
ROAE
41

QUESTIONS? BGEO Investor Day 9 November 2017 Tbilisi, Georgia
42
DISCLAIMER – FORWARD LOOKING STATEMENTS
This presentation contains forward-looking statements, including, but not limited to, statements concerning expectations, projections, objectives, targets, goals, strategies, future events, future revenues or performance, capital expenditures, financing needs, plans or intentions relating to acquisitions, competitive strengths and weaknesses, plans or goals relating to financial position and future operations and development. Although BGEO Group PLC believes that the expectations and opinions reflected in such forward-looking statements are reasonable, no assurance can be given that such expectations and opinions will prove to have been correct. By their nature, these forward-looking statements are subject to a number of known and unknown risks, uncertainties and contingencies, and actual results and events could differ materially from those currently being anticipated as reflected in such statements. Important factors that could cause actual results to differ materially from those expressed or implied in forward-looking statements, certain of which are beyond our control, include, among other things: currency fluctuations, including depreciation of the Georgian Lari, and macroeconomic risk; corporate loan portfolio exposure risk; regional tensions; regulatory risk; cyber security, information systems and financial crime risk; investment business strategy risk; and other key factors that we have indicated could adversely affect our business and financial performance, which are contained elsewhere in this presentation and in our past and future filings and reports, including the 'Principal Risks and Uncertainties' included in BGEO Group PLC's Annual Report and Accounts 2016 and in its Half Year 2017 Results announcement. No part of this presentation constitutes, or shall be taken to constitute, an invitation or inducement to invest in BGEO Group PLC or any other entity, including any future entity such as BGEO Investments PLC or Bank of Georgia PLC, and must not be relied upon in any way in connection with any investment decision. BGEO Group PLC undertakes no obligation to update any forward-looking statements, whether as a result of new information, future events or otherwise, except to the extent legally required. Nothing in this presentation should be construed as a profit forecast.
43