Embed Size (px)
Citation preview

Renewable energy consultants
Banking on Wind: gResource
AssessmentAssessment
Graham Slack
Quantum Leap in Wind Power in Asia Forum
June 2011

GL Garrad Hassan825 staff in 41 locations across 22 countries and 5 continents825 staff, in 41 locations, across 22 countries and 5 continents
HeerenveenSint Maarten
Kaiser-Wilhelm-Kaiser WilhelmKoog
Bristol
CopenhagenHinnerupOldenburgHamburg
GlasgowLondon
Slough
VancouverOttawa
PortlandSan Diego
BeijingTokyoShanghaiMumbai
BristolDublin
Paris
IzmirCairo
gWarsaw
LisbonBarcelona
Imola
San DiegoMontreal
PeterboroughAustin
MumbaiBangaloreNewcastleMelbourne
CairoZaragozaMadrid Bangkok
Ho Chi Minh
SingaporeManila
MonterreyPorto Alegre
Santiago
Wellington
Locations in red denote GL partner offices in the region.

Based On ExperienceSince 1984 - over 25 years experience in the sector
Wind Farm Energy AssessmentWind Farm Energy Assessment• analysing 20,000 MW of new projects per year
• 25% of all projects worldwide
Operational Assessment• 15% of the world’s installed capacity
Due DiligenceDue Diligence• over 25% of the world’s project financed wind farms
• world’s largest wind farm portfolio acquisition
Independent Engineer• the world’s five largest wind farm financings
• the first project financed offshore wind farm• the first project financed offshore wind farm
Short Term Forecasting• over 20% of the world’s operational wind capacity

Wind ResourceWind Resource
Wind resource is fundamentali ti l t V3- energy is proportional to V3
- Small wind error > large energy error
Mean wind speed AND distribution- Mesoscale wind maps for site ID
Reference wind data crucial- Reference wind data crucial
Assessment of energy production is a iti l j t i kcritical project risk
Wind is critical input to energy prediction
So good wind monitoring is a critical project need

Methodology Overview
Analyse and predict the long-term wind regime at site masts
gy
Predict the wind speed variations over the site
Predict gross energy output of all turbines
Predict likel energ lossesPredict likely energy losses
Result: Predicted long-term net energy output of the wind farm
At each step quantify the mean value AND the uncertainty

2. Correlate to a long-term reference
Wind farmsite masts
R f
3. Predict long-term wind regime1. Measure wind climate
400m
Reference station
20%15%10%5%
50 km
4. Wind flow modelling
Steps to long-
g
Steps to longterm energy
7. Uncertainty analysis
6. Estimate losses → Net energy80%
90%
100%
eeda
nce P90 (10 year)
5. Predict gross energy
AvailabilityTurbine WakeTopography
60%
70%
80%
Pro
babi
lity
of e
xce
P50 central estimate
P75 (10 year)
Power [kW]CpFrequency [hrs]
TopographyElectrical network
Other40%
50%
60 70 80 90 100 110
Annual average production [GWh]
P50 central estimate
wind speed

1. Measure wind climate
Masts in red Turbines in blue
Good quality instrumentsDifferent heightsClose to hub height
Mounting on mast> One year of data
Different heights for wind shear
M t t t ti l ti 1k
Calibration & records
Care for Masts at representative locations <1km
Care for local features & flow separation issues
Care for shadowing and icing
Uncertainty can be minimised through well designed measurement plans

2. Correlate to a long-term reference
Short-term measurementSite Layout
g
Site data
Long-term measurementWind Farm
1000mReference station
Reference stationAbsolute accuracy not vitalConsistency is vital
400m
50 km
Often there is no reference stationInspect reference site
MethodologyMeasure Correlate Predict (MCP)

3. Wind flow modelling
WAsP model is most common
g
s ode s os co oCFD is appearing but be careful –
different and complicated does not mean better
Wi d dWind speed map
Human Inter entionIntervention
This process has
Mast
Terrain Map
process has uncertainty

4. Predict Gross Energy
1,500
gy
900
1,100
1,300
W]
10-min mean power
0.5 m/s bin mean power 10 % 20% 30% 40%
500
700
Pow
er [k
W
Reliable power curve
-100
100
300
0 1 2 3 4 5 6 7 8 9 10 11 12 13 14 15 16 17 18 19 200-3 3-6 6-9 >9 m/s
Reliable power curve is important
Wind Speed [m/s]
Combine:Power curve – power output at each wind speed (MW)
Wind rose
Wind distribution – time spent at each wind speed over one year (hours)
Gives total MWh in each year

Losses: minimise by modellingake and topographical losses
If turbine spacing too small, d d d hi h
wake and topographical losses
reduced energy and high turbulence: -ve turbine life
S f d l t iSo preferred layout is a compromise between highest wind areas, low wake effects
Analytical tools exist for wind farm modeling, including wake losses
This allows optimised layouts to increase energy capture
WindFarmer is one example

Losses: Turbine availability
99%
100% 250
y
97%
98%
99%
200
95%
96%
97%
Ava
ilabi
lity 150
WFs
in d
atab
ase
93%
94%
Win
d Fa
rm A
100
Num
ber o
f W
91%
92% 50
Monthly Avg 3 Monthly Avg
Annual Avg Number of WFs
90%0.0 1.0 2.0 3.0 4.0 5.0 6.0 7.0 8.0 9.0 10.0
Years of operation
0
g
Result: Net energy prediction
Rated Power 50 MW
gy p
Gross Output 170 GWh/annum Wake effect 98.7% Calculated Electrical efficiency 97 0% CalculatedElectrical efficiency 97.0% CalculatedAvailability 97.0% GH assumption Icing and blade degradation 99.5% GH assumption High wind hysteresis 99.2% CalculatedHigh wind hysteresis 99.2% CalculatedSubstation maintenance 99.8% Typical value Utility downtime 100.0% GH assumption Power curve adjustment 98.5% GH assumptionj pColumnar control loss 100.0% GH assumption Cold weather shut down 100.0% GH estimate Wake effect of future projects 100.0% GH assumption to be covered in
h Fi Athe Finance Agreement
Net output 153.2 GWh/annum

Result: Uncertainty
Source of uncertainty Wind speed Energy output [%] [ / ] [%] [GWh/ ]
y
[%] [m/s] [%] [GWh/annum]Anemometer accuracy 2.5% 0.21 1.4Consistency of reference 1.0% 0.08 0.6Correlation accuracy Mast A to Mast B 1.4% 0.12 0.8Shear 40 m to 60 m 2.0% 0.17 1.1Variability of 8.8 year period 2.0% 0.17 1.1y y p
Overall historical wind speed 0.35 2.3Wake and topographic calculation 4.0% 1.3Performance and availability 1 0% 0 3Performance and availability 1.0% 0.3Substation metering 0.3% 0.1Future wind variability (1 year) 6.0% 0.50 3.4Future wind variability (10 years) 1.9% 0.16 1.1Overall energy uncertainty (1 year) 4.3Overall energy uncertainty (10 years) 2.9

Probability Distribution• Mean = 50 GWh/year • Standard deviation = 3.5 GWh/year (in this example)
y
0.1
0.12
Normal distribution
P90 = 45.5 GWh
0 06
0.08P90 = 45.5 GWh
0.04
0.06
0
0.02
35 37.5 40 42.5 45 47.5 50 52.5 55 57.5 60 62.5 65
Net energy production (GWh/year)
35 3 5 0 5 5 5 50 5 5 55 5 5 60 6 5 65
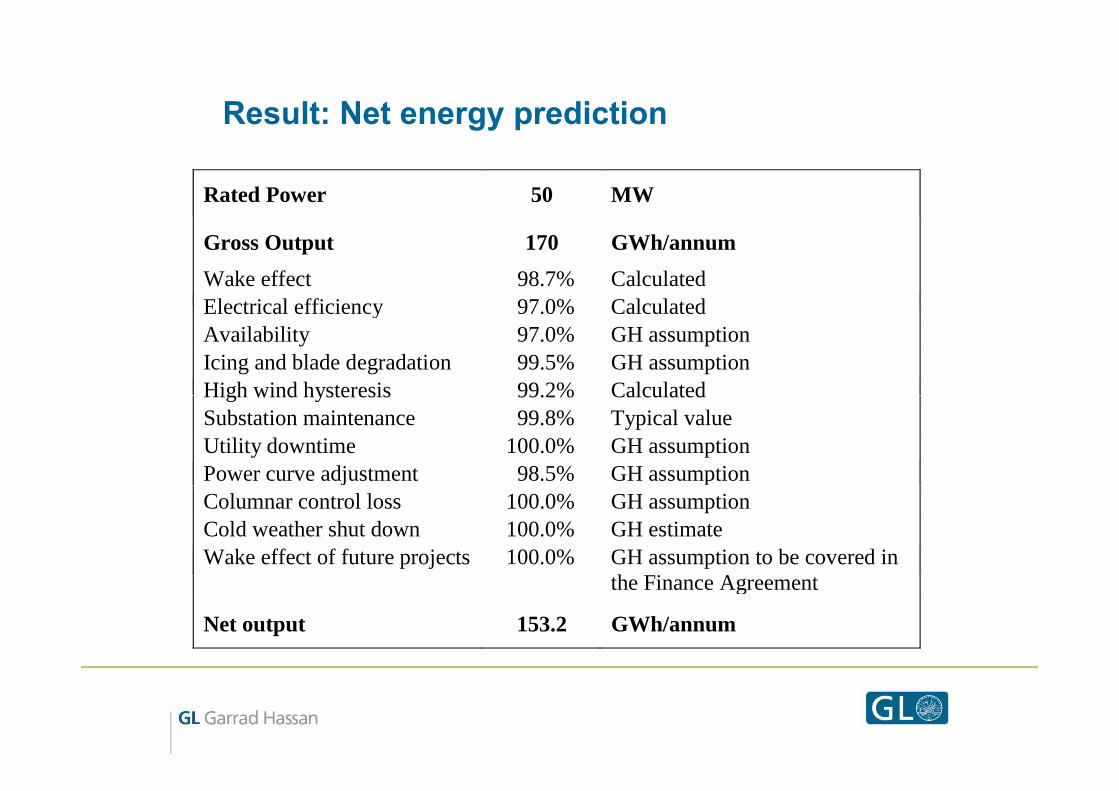
Financing IssuesFinancing IssuesUncertainty in energy production dependant on several issues- Monitoring plan for site, grid reliability, supply warranties, O+MMonitoring plan for site, grid reliability, supply warranties, O M
contracts, turbine reliability and availabilityUncertainty reflected in probability of exceedence values:

Validation of methodology – UK dataAdj sted for indiness and a ailabilit sing c rrent methodsAdjusted for windiness and availability, using current methodsActual/predicted P50 values = 100.2%

Other benefits of measurement Extreme wind speedsOther benefits of measurement - Extreme wind speedsTyphoons frequent over much of north Pacific (2009 data):

Conclusions
Accurate wind assessment is critical- Good quality instrumentsGood quality instruments- Well mounted to avoid flow distortion - Adequate number of tall masts
C lib ti d d- Calibration and records
Combine with reference data to assess the long-term wind resource
Uncertainty assessment is critical toUncertainty assessment is critical to assess technical risks
Enough operational data to demonstrateEnough operational data to demonstrate the analytical process is robust: confidence for investors and lenders


![Polynucleobacter necessarius (QLW-P1DMWA-1T)Cells of P. necessarius subsp. asymbioticus strain QLW-P1DMWA-1 T are straight rods, 0.7–1.2 by 0.4– 0.5 µm in size [1]. The multiple](https://img.pdfslide.net/doc/110x75/60e5480f82c18a307660ab85/polynucleobacter-necessarius-qlw-p1dmwa-1t-cells-of-p-necessarius-subsp-asymbioticus.jpg)