Embed Size (px)
Citation preview

University of California, Hastings College of the LawUC Hastings Scholarship Repository
Faculty Scholarship
2018
Bankruptcy Claims TradingJared A. ElliasUC Hastings College of the Law, [email protected]
Follow this and additional works at: https://repository.uchastings.edu/faculty_scholarship
This Article is brought to you for free and open access by UC Hastings Scholarship Repository. It has been accepted for inclusion in Faculty Scholarshipby an authorized administrator of UC Hastings Scholarship Repository. For more information, please contact [email protected].
Recommended CitationJared A. Ellias, Bankruptcy Claims Trading, 15 J. Empirical Legal Stud. 772 (2018).Available at: https://repository.uchastings.edu/faculty_scholarship/1717

Journal of Empirical Legal Studies
Volume 15, Issue 4, 772–799, December 2018
Bankruptcy Claims TradingJared A Ellias*
A robust secondary market has emerged over the past 20 years in the debt of Chapter 11firms. Critics worry that the trading associated with this market has undermined bankruptcygovernance by forcing managers to negotiate with shifting groups of activist investors in theChapter 11 bargaining process. This article investigates whether this is a common problemand concludes that it is not. Although trading of bond debt is pervasive, the activist groupsthat tend to participate in negotiations usually enter cases early and rarely change signifi-cantly. Trading in general, therefore, does not appear to have the impact on governancethat many claims trading critics fear, at least insofar as the average case is concerned.
I. Introduction
For at least 20 years, bankruptcy claims trading has been the subject of controversy
among bankruptcy lawyers and scholars (e.g., Tung 1996; Roe 2016).1 The Bankruptcy
Act of 1978 created a structured bargaining process, where creditors and shareholders of
distressed firms could negotiate with management and one another to solve the firm’s
financial troubles. However, in the late 20th century, a secondary market emerged in the
claims of bankrupt firms, allowing a firm’s creditors to forego negotiation and instead sell
their claims to new investors who will engage in the negotiation process (Baird 2010).
Levitin (2010:68) calls this the “single most important development in the bankruptcy
world since the Bankruptcy Code’s enactment in 1978.” The rise of claims trading is con-
troversial because many commentators believe that trading has made Chapter 11 harder
to administer, as managers find themselves in unnavigable negotiations with a revolving
cast of investors. In 2014, the American Bankruptcy Institute debated bankruptcy claims
*Visiting Associate Professor of Law, Boston University College of Law; Associate Professor of Law, University ofCalifornia, Hastings College of the Law; email: [email protected]. The author thanks two anonymous ref-erees, Ken Ayotte, Alina Ball, Vince Buccola, Ralph Brubaker, Tony Casey, John Crawford, Stephen Lubben, EdMorrison, Morris Ratner, Adriana Robertson, Fred Tung, and Manoj Viswanithan for helpful conversations andsuggestion, as well as conference audiences at the Young Bankruptcy Scholars Workshop at Brooklyn Law School,the Conference on Empirical Legal Studies at Cornell Law School, Annual Meeting of the American Law & Eco-nomics Association at Yale Law School, and the National Business Law Scholars Conference at the S.J. QuinneyCollege of Law at the University of Utah and a seminar audience at Stanford Law School. The author is especiallygrateful to Vlad Dembitsky, Ashley Duran, Philip Privitelli, Rabiah Oral, Allyson Pierce, Victoria Vlahoyiannis,Claire Zbinovich, and Jessie Zhou for their fantastic research assistance.1As noted by the Wall Street Journal (Feb. 16, 2016), “as the secondary market has grown, so have questions aboutthe practice.”
772

trading with an eye toward creating new regulations. Unfortunately, after first recognizing
the importance of claims trading, the ABI’s panel of leading practitioners was unable to
reach a consensus as to what, if anything, should be changed in light of “conflicting anec-
dotal evidence” (Harner 2014:245).
In this article, I fill an important gap in the literature and provide the first compre-
hensive empirical study of trading in the financial claims of Chapter 11 debtors.
Although the policy debate in this area among academics (e.g., Roe 2016; Casey 2016)
and lawyers (e.g., Hammer & Brandess 2010; Miller 2009) is well-established, the debate
has lacked the empirical foundation needed to bring claims trading into focus for both
scholars and practitioners. As described in greater detail below, the results show that
claims trading is an important feature of the overwhelming majority of large bankruptcy
cases. Nonetheless, while data limitations warrant caution in interpreting the findings,
the results suggest that the fears of critics are overstated.
The controversy over bankruptcy claims trading can be summarized as follows. One
group of scholars and lawyers (e.g., Rosen 2016; Baird & Rasmussen 2010; Tung 1996;
Janger 2009) worry that claims trading destabilizes the bankruptcy negotiating process.
Bankruptcy law contemplates protracted, difficult negotiations over how a firm should be
reorganized. The entrance of a new creditor into the bargaining space can have the effect
of restarting negotiations, which may increase creditor conflict and litigation. At its heart,
this is a worry about the entrance of activist investors who aim to influence the bank-
ruptcy case. These critics urge Congress to increase the level of disclosure claims traders
must provide to the bankruptcy court (Harner 2014). On the other hand, proponents of
claims trading argue that claims trading makes bargaining more efficient by consolidat-
ing smaller claims into the hands of larger holders and permitting activist investors to
enter the firm’s capital structure (Ivashina et al. 2016). Claims trading proponents worry
that increased transparency and disclosure might chill the market for distressed debt,
reducing the benefits of claims trading.
It is important to qualify the limitations of the data used in this article. This study
principally emerges from a hand-collected sample of trading in 506 bonds issued by
204 large firms that filed for bankruptcy between 2002 and 2012. To the best of my
knowledge, this sample represents a complete record of traded bonds claims during the
sample period obtainable from conventional data sources.2 This article relies on bond
trading information from the TRACE dataset, which provides the aggregate volume of
trading and the trading price on each calendar day. I do not, however, observe the iden-
tity of traders. To address this limitation, I closely study the litigation of the activist inves-
tors who are said to disrupt bankruptcy bargaining to look for evidence connecting
claims trading with the entrance of new bargaining counterparties. Unfortunately, this
approach likely misses the influence of new claims buyers who do not show up in court
or changes in activist group composition that are not disclosed. However, the sheer
2As further discussed in the Appendix, I also gathered a complete sample of equity that traded during this period,and the general patterns observed are similar to the patterns of trading in bond debt.
Bankruptcy Claims Trading 773

sparseness of the prior literature means that this article has much to contribute in illumi-
nating the average impact of claims trading across a large sample of cases.
I begin by establishing foundational facts about claims trading. Although claims
trading has been the subject of a long theoretical debate, it is not clear whether claims
trading is an important aspect of most large bankruptcy cases or only a handful of cases
that have attracted disproportionate scholarly attention. I first show that heavy claims
trading is a pervasive feature of most large Chapter 11 cases. For the median bond in the
sample, aggregate trading during the bankruptcy period is equivalent to more than
100 percent of the face value of the bond. In fact, Chapter 11 bonds are, on average,
more heavily traded than other distressed bonds and are among the most heavily traded
bonds in the corporate bond market as a whole.
The chief worry of claims trading critics is that claims trading will make it harder
for managers to negotiate with creditors as activist investors with their own agendas trade
in and out of the firm’s capital structure. As a foundational matter, debt trading appears
to be heavy enough to disrupt creditor voting on a plan of reorganization in more than
60 percent of the sample cases. However, examining disclosure statements filed by groups
of activist investors, I find that activist groups tend to appear early in the bankruptcy case
and to remain stable over time.3 On average, the cases with late activist appearances also
tend to be the cases with the most observed improvement in industry conditions over the
bankruptcy period. This suggests that latecomer activists might be inspired by exoge-
neous changes that increase the expected value of investing in activism, a relatively
uncommon occurrence during the brief period most firms are in Chapter 11. Moreover,
while I do find evidence that bankruptcy claims trading is positively correlated with a
higher likelihood of litigation, that relationship only appears in the data at the beginning
of bankruptcy, consistent with early activist entry and relative stability.
Overall, the primary contribution of the article is to provide new facts for an impor-
tant bankruptcy policy debate that has raged without an empirical foundation. Although
data limitations make it hard to come to definitive conclusions, the data support the view
that fears about the impact of claims trading on bankruptcy governance are overstated, as
least insomuch as claims trading impacts the average case. When activist investors are pre-
sent, they tend to be groups that already own most of the bond issue, which they likely
acquired prior to the bankruptcy or at the very beginning of the bankruptcy case. These
groups tend to remain stable over the bankruptcy case, neither losing nor gaining mem-
bers on average. This is not to say there are not many anecdotal stories of claims trading
upending bankruptcy bargains—there are—but the empirical approach in this article
suggests that those high-profile cases are not representative of the broader story of Chap-
ter 11 claims trading, which may be more about passive trading and speculation than was
previously understood. Clearly, the shadow of claims trading and activist entry would
weigh over any bankruptcy bargaining process, but it does not seem to lead to observed
3I also find evidence that traditional investors like mutual funds usually sell Chapter 11 bonds long before the firmfiles for bankruptcy, which is again consistent with the primary period of activist entry occurring prior to the bank-ruptcy process or at its very beginning.
774 Ellias

churn in the activist groups that are management’s typical negotiating counterparty in
the average case.
The remainder of this article proceeds as follows. Section II describes data collec-
tion and the sample. Section III provides first evidence on how active the market for
Chapter 11 debt really is and Section IV examines the view that claims trading disrupts
the bankruptcy bargaining. Section V studies the change to Rule 2019 to learn more
about how traders may have responded to changes in disclosure risk. Section VI
concludes.
II. Sample
To learn more about bankruptcy claims trading, I built a sample of trading data from the
financial claims of firms that filed for bankruptcy between July 1, 2002 and December
31, 2012. I use July 1, 2002 as the start date for the sample because this is when the
TRACE dataset (as further explained below) began recording data on bond trades. I
began with Next Generation Research’s comprehensive list of “large firms” that filed for
bankruptcy, a standard starting point for empirical research (see Ayotte & Morrison
2009). I hand-matched that list to the records of bond and equity trading described
below.4 A firm entered the sample if had loan debt, bond debt, or equity trading during
the sample period.5
The bond data in this study come from the Enhanced Trade Reporting and Com-
pliance Engine (known as TRACE) dataset maintained by the Financial Industry Regula-
tory Agency (FINRA). TRACE is a complete record of all buying and selling of corporate
bonds, with transaction-level data on all trades during the sample period.6 As TRACE
does not contain any identifying information on the bond contract beyond the CUSIP
code, I combine TRACE with MergentFISD’s information on bond contracts using CUSIP
codes to identify the issuing firm. A bond enters the sample if I observe trading in the
bond contract in TRACE’s recording of all bond trading between mid-2002 and 2012.
The Chapter 11 bond sample consists of 389,154 trades on 54,536 trading days in
494 bonds issued by 204 firms with an aggregate face value of $512 billion and an aggre-
gate market value of approximately $280 billion. One important question that goes to
the generalizability of the patterns reported in this article is what percentage of the
broader population of Chapter 11 firms with bond debt are in the sample. As I built the
4As this project evolved, the focus shifted more squarely to debt trading and the equity trading results, which aresimilar to the bond results, were moved to the Online Appendix, which also contains a detailed description of theequity sample.
5This article does not discuss or rely on records of loan debt, which were obtained from MarkIt and LSTA, as dis-cussed in greater detail in Ellias (2018). However, the larger sample of Chapter 11 debtors was assembled usingthe list of loan trades recorded by MarkIt, and many of those firms also used bonds to fund their activities.
6As a starting point, I clean the TRACE data for reporting errors as in Dick-Nielsen (2014) and I also eliminateapparent outliers.
Bankruptcy Claims Trading 775

sample by focusing on traded debt, it is possible that the sample omits some firms with
public bonds that did not trade during the sample period. As TRACE only records trades
beginning in 2002, I am unable to offer an estimate of what percentage of firms in the
overall sample that issued bond debt prior to a bankruptcy filing saw those bonds trade
while the firm was in Chapter 11 for the entire dataset. However, as an exercise, if we
make the assumption that every bond issued by a firm that filed for bankruptcy in 2005
and onward traded at some point between 2002 and 2012—providing a two-year period
during which some bonds might trade before the issuing firm filed for bankruptcy—I
observe trading in 444 bonds issued by 173 firms.7 Of this broader population, 162 firms
enter the sample linked to the trading records of 385 bonds that traded during the firm’s
Chapter 11 case. This estimate suggests that the sample includes 93.6 percent of the over-
all population of Chapter 11 debtors that issued bond debt that filed for bankruptcy
between 2005 and 2012 and 87 percent of overall bond contracts.
For each debt claim that I could match to a record of a bankruptcy filing, I hand-
gathered extensive information about the Chapter 11 case from the court docket. I began
with the affidavit supporting the bankruptcy petition (referred to as the “first day affida-
vit”) as well as the disclosure statement for the plan of reorganization. I also examined
public securities filings as well as important motions in the case in order to acquire bond
contract details like collateral, subordination, and amount outstanding. Importantly, I
analyzed the firm’s debt contracts in great detail to understand every creditor’s relative
claim against the firm’s assets in terms of collateral, structural subordination, and con-
tractual subordination. By doing so, I can understand which bonds are senior or junior
to other bonds and which bonds are pari passu with one another. I also recorded the
dates of important bankruptcy hearings from information on the court docket, through
reviewing hearing agendas, and from the captions to important motions.
The worries of claims trading critics largely center around the difficulties managers
can have negotiating a bankruptcy plan as investors trade in and out of the firm’s capital
structure. This claim focuses on the disruptive role that hedge funds are thought to play
in bankruptcy bargaining in their capacity as claims purchasers. To gain insight into this
claim, I devote special attention to identifying the role of activist investors in the Chap-
ter 11 process. Federal Rule of Bankruptcy Procedure 9010 requires all attorneys appear-
ing on behalf of a creditor to file a “notice of appearance” with their contact information
7The assumption in this exercise—which could be wrong—is that any censoring in the sample is likely to comefrom some bonds that did not trade after a Chapter 11 filing but that virtually all bonds are likely to have traded atleast once in the two years prior to bankruptcy. If that assumption is correct, then the sample contains 93.6 per-cent of all large firms with traded bonds or equity that filed for bankruptcy from 2005 onward. I believe that thesample likely contains very close to 100 percent of all large firms with traded debt or equity because all three datasources were hand-matched individually, by three separate research assistants, against the Next GenerationResearch list of Chapter 11 debtors. I checked each research assistant’s work myself to make sure it was reliableand complete. In some cases, a firm that entered the dataset because of observed loan trading also described bonddebt in its first day bankruptcy affidavit that was not in MergentFISD, but could be hand-matched against theTRACE dataset using securities filings. Similarly, firms with traded equity were sometimes not listed in Bloombergbut could be identified using a different entity name after the firm entered the dataset because of observedtraded debt.
776 Ellias

with the court. Accordingly, I identify all “notices of appearance” filed by alternative asset
managers announcing their identity to the bankruptcy court.8
Further, to examine how activist groups appear and change over time, I examine
the disclosure statements that activist groups are required to file with the court describing
the group’s composition. Although activist funds sometimes appear on their own, most
activism is performed by groups of funds that have organized together to pool resources.9
Federal Rule of Bankruptcy Procedure requires groups of creditors acting together to
file a statement disclosing their identities with the court (Janger 2009; Hu & Westbrook
2007).10 Among other things, activist groups must disclose their identity and the amount
of their holdings and they are obligated to update these disclosures when there are mate-
rial changes. Of the 174 Chapter 11 debtors in the sample with bond debt that filed for
bankruptcy in 2004 or afterward, I identify 100 bondholder groups from 67 cases filing a
total of 211 Rule 2019 disclosure statements. I connect 48 of these groups to bond trad-
ing records to examine how trading patterns relate to observed disclosure.11
III. Assessing Liquidity in Chapter 11 Bonds
The literature commonly makes contradictory claims about the robustness of trading in
Chapter 11 debt and equity. On the one hand, the literature commonly refers to a
“robust secondary market for claims of Chapter 11 debtors” (e.g., Harner 2014). On the
other hand, it is also common to see references to distressed debt as an “illiquid asset
class” (e.g., Dunkley & Palin 2014). While both of these descriptions are right some of
the time—for some debtors, trading in Chapter 11 debt is probably robust and other
debtors likely experience relatively little trading in their debt—it is important to
8Asset managers are identified by performing word searchers for “capital management,” “asset management,”“capital,” and “fund” on the docket text for all notices of appearance for the 158 cases for which I am able toobtain the entire court docket and access all the underlying documents. This yields 656 “notices of appearance”filed by apparent hedge funds, not all of which are holding bond debt. I also identify 251 apparent “ad hoc”groups of creditors acting together using word searches for “ad hoc,” “informal group,” “noteholders,” “lenders,”and “bondholders.”
9An example of this “pooling” can be found in In re Northwest Airlines Corporation, et al. (2007), where an “Ad-hocCommittee of Equity Holders” was formed and represented by a single firm. Judge Gropper found that the ad hoccommittee was a “committee” for the purposes of Rule 2019, thus compelling disclosure of individual holding andmember trading history.
10I identify Rule 2019 statements on the docket by searching for “Rule 2019” on the sample dockets and thenexamining each statement by hand to see if it came from a group of investors holding bonds or loans. The sampleof 390 Rule 2019 statements is a subsample of the 996 Rule 2019 statements on the dockets of the post-2004 sam-ple firms.
11Additionally, to provide further comfort that the pattern observed in this bondholder sample is fairly representa-tive of how activist groups change over the bankruptcy case, I also examine the disclosures of the investor groupsholding bank loans. In total, I identify an additional 101 lender groups from 75 cases that filed a total of 179 Rule2019 statements.
Bankruptcy Claims Trading 777

understand how widespread claims trading actually is. Much of the discussion in the liter-
ature has focused on a handful of high-profile cases (e.g., Baird & Rasmussen 2010),
which, while important, could be outliers.
In this section, I document aspects of the liquidity in Chapter 11 debt to provide
context for the policy debate. The financial literature has long acknowledged the chief
challenge in trying to measure liquidity: it is not directly observable (e.g., Acharya &
Pedersen 2003). While the data are helpful in assessing the trades that did happen, we
do not observe the market’s willingness to buy the claims of creditors who did not want
to sell their claims. Given this data limitation, I take two approaches to assessing liquidity
in Chapter 11 bonds. First, I summarize the raw observed turnover in Chapter 11 debt
and show how trading varies across the distribution of sample cases and over the course
of the bankruptcy process. Second, I contextualize the observed trading by showing how
trading in Chapter 11 bonds compares to trading in the corporate bond market as a
whole and to other distressed bonds. In the Appendix, I examine a sample of Chapter 11
equity and find that the broader patterns illustrated by the examination of Chapter 11
debt are qualitatively similar to trading in equity.
A. Trading in Chapter 11 Debt
Chapter 11 cases generally follow a statutory process of hearings and court orders, with
the debtor first obtaining court approval of bankruptcy financing before proposing a
plan of reorganization for a vote of creditors. Some debtors choose to sidestep the plan
process altogether, and instead sell the firm in a Section 363 sale outside of the plan pro-
cess.12 Figure 1 illustrates the major phases of the average Chapter 11 plan process as well
as the alternative of an asset sale under Section 363.
Table 1 displays the distribution of bond trading across bankruptcy cases and over
the course of the bankruptcy process. The table reveals a wide distribution of trading and
suggests that most large Chapter 11 cases appear to involve heavy trading in bond debt.
In fact, for the median bond, aggregate trading is equivalent to more than 92 percent of
the outstanding face value of the bond between the petition date and the approval of a
disclosure statement. This is not to say that 92 percent of petition date holders of the
bond sold their claim to a new investor. As I do not observe the identity of the traders, I
cannot know whether I am observing, for example, three trades of approximately 30 per-
cent of the issue, with the other 70 percent held by a patient investor, or whether 92 per-
cent of the bond issue traded once. The tails of the distribution are very different than
the median, with the 25th percentile bond only seeing 19 percent aggregate turnover
and the 75th percentile bond seeing almost 300 percent aggregate turnover during that
same period. Thus, while the majority of Chapter 11 cases involve heavy trading, the level
of trading in the most actively traded bonds is qualitatively different from the
median case.
12Section 363 of the Federal Bankruptcy Code allows Chapter 11 debtors to sell substantially all the firm’s assetsoutside of the plan of reorganization process that the statute is otherwise designed to implement.
778 Ellias

Examining the data over time shows that, on average, bond turnover falls as the
firm moves toward exiting bankruptcy court administration. Panel B of Table 1 shows the
percentage of the face value of the bond that trades during the indicated period, divided
by the number of bond market trading days. The median bond that trades during the
period between the petition date and the approval of debtor-in-possession financing sees
0.77 percent of the face value of the bond trade on each trading day. On average,
Table 1 shows that average trading volume falls as the firm moves through the bank-
ruptcy process, with a mere 0.36 percent of the median sample bond trading on each
trading day between the approval of a disclosure statement and plan confirmation.
As Table 1 shows, trading volume is most intense between the petition date and the
approval of debtor-in-possession financing. However, in unreported results, I find that
most of the trading—45 percent of all bond volume in the median case—takes place
between the date the debtor-in-possession financing package is approved and the date
that the disclosure statement for the plan of reorganization is approved. There are likely
two reasons for this. First, on average, that is the longest period of the case, so there are
more chances for traders to buy and sell their claims during that period. Second, the
plan of reorganization is normally being negotiated during this period, which may gener-
ate market interest that allows some traders to exit their positions. In some cases, the
buyers might be new investors who want to own the claim; in others, the buyers might be
other holders of the same financial claim looking to consolidate their position to
improve their bargaining leverage or increase their investment in the debtor.
Figure 1: The bankruptcy process.
NOTES: Figure 1 summarizes the stages of the bankruptcy process. When the debtor seeks to approve a plan of reor-ganization, the judicial approval of a disclosure statement will be followed by the solicitation of creditors to voteon the proposed plan of reorganization.
Bankruptcy Claims Trading 779

While turnover in Chapter 11 bonds appears heavy, the “illiquid” description of dis-tressed debt might still be accurate if Chapter 11 bonds are relatively poorly traded com-pared to the overall bond market. To assess this, I compare observed trading as a
Table 1: The Distribution of Bond Trading During the Bankruptcy Case,
by Phase of Case
Bankruptcy Period n Potential n Mean 25th Median 75th 90th Max
Panel A: Percentage of Outstanding Bond Issue Trading Between Periods of the
Bankruptcy Case, for Cases with Confirmed Plans
Petition date and DIP financing 296 377 0.61 0.07 0.23 0.67 1.52 24.81
Petition date and disclosure
statement approval
418 488 2.44 0.19 0.92 2.87 6.97 28.98
Petition date and plan
confirmation
424 491 2.79 0.27 1.13 3.45 7.25 29.00
DIP financing and disclosure
statement approval
284 354 1.93 0.11 0.59 2.07 5.20 25.54
DIP financing and plan
confirmation
303 369 2.21 0.17 0.73 2.51 5.77 25.55
Disclosure statement approval and
plan confirmation
345 455 0.49 0.06 0.19 0.46 1.08 17.54
Panel B: Percentage of Bond Issue Trading per Trading Day Between Periods of the
Bankruptcy Case, for Cases with Confirmed Plans
Petition date and DIP financing 296 376 0.03 0.00 0.01 0.02 0.06 1.55
Petition date and disclosure
statement approval
418 486 0.01 0.00 0.01 0.01 0.02 0.15
Petition date and plan
confirmation
424 491 0.01 0.00 0.01 0.01 0.02 0.12
DIP financing and disclosure
statement approval
284 351 0.01 0.00 0.00 0.01 0.02 0.04
DIP financing and plan
confirmation
303 366 0.01 0.00 0.00 0.01 0.02 0.07
Disclosure statement approval and
plan confirmation
345 455 0.01 0.00 0.00 0.01 0.02 0.16
Panel C: Percentage of Outstanding Bond Issue Trading Between Periods of the
Bankruptcy Case, for Cases with 363 Sales
Petition date and sale 61 71 1.42 0.16 0.48 1.97 3.99 10.52
Panel D: Percentage of Observed Trading That Takes Place Between Periods of the
Bankruptcy Case, for Cases with 363 Sales
Petition date and sale 61 71 0.01 0.00 0.01 0.02 0.03 0.05
NOTES: Table 1 summarizes trading over the bankruptcy process for Chapter 11 bonds. Panels A and B sum-marize trading for cases with confirmed plans, with Panel A showing the trading between bankruptcy mile-stone dates, measured as a percentage of the face value of the bond, and Panel B summarizing the averageface value of the bond issue trading for each day the bond market was open between those dates. For exam-ple, the 25th percentile bond saw 19.24 percent of the face value of the bond issue trade between the peti-tion date and the date the bankruptcy judge approved a disclosure statement to start the plan votingprocess. Between the petition date and the approval of a debtor-in-possession financing package, 0.77 per-cent of the face value median bond traded, on average, for each day the bond market was open for trading.Panels C and D show the analogous numbers for firms that sold themselves in a Section 363 sale outside theplan process. The “Potential n” column indicates the number of bonds in the dataset that could have beentrading during this period, meaning, for example, that 369 bonds were issued by debtors that obtaineddebtor-in-possession financing and confirmed a plan of reorganization, of which 303 traded during thatperiod in each debtor’s respective case.
780 Ellias

percentage of face value in each Chapter 11 bond to the level of trading in the bond marketas a whole. For each Chapter 11 bond, I create a corresponding subsample of the entirerecord of trading in the corporate bond market over the period the firm is in bankruptcy. Ithen calculate a percentile ranking to measure the Chapter 11 bond’s relative position inthe bond market. For example, a Chapter 11 bond that trades in the 90th percentile of thebond market over the course of the bankruptcy case trades is one of the top 10 percentmost actively traded corporate bonds. As it is possible that distressed bonds simply trade in
a different market than the normal corporate bond market, I create corresponding subsam-ples of “distressed” bonds and situate the Chapter 11 bonds within those records.13
Figure 2 shows the distribution of Chapter 11 bond percentiles, as compared to
the bond market as a whole as well as compared to other “distressed” bonds. The
graphs show a wide distribution of trading percentiles, with a cluster in the right cor-
ner of the graph. As the figure shows, Chapter 11 bonds are, on average, among the
most heavily traded bonds in the corporate bond market. The median Chapter 11
bond trades at the 84th percentile of the corporate bond market as a whole. Chap-
ter 11 bonds are also among the most heavily traded distressed bonds, with the
median Chapter 11 bond trading at the 77th percentile of the sample of distressed
bonds. Thus, the average Chapter 11 bond experiences both heavy trading both on an
absolute and relative basis.
Thus far, this section focused on trading volume as a proxy for liquidity, but the
financial literature also considers other aspects of liquidity, such as the cost of com-
pleting a buy and sell transaction (Kyle 1985; Bessembender & Maxwell 2008). While I
cannot observe this directly, I can estimate it using the Amihud (2002) measure, a
well-established proxy for transaction costs from the financial literature. Friewald
et al. (2012) examine a sample of defaulted bonds and find that transaction costs in
defaulted bonds appear to be relatively high.14 I follow their methodology and calcu-
late the Amihud liquidity measure over different periods of time for the bonds in the
dataset to learn how trading costs change over the bankruptcy process. I also perform
the same calculations for the bond market over those same trading windows to contex-
tualize the trading costs of Chapter 11 bonds.
At a high level, the Amihud measure is the sum of the absolute value of all
observed investment returns for days where multiple trades are observed, divided by the
volume of each trade, divided again by the number of observed trades on that day. Stated
formally, the Amihud (2002) measure for bond j of firm x on day t given observed returns
on day t indexed by the number of trades of the bond j on day t is specified as:
13I measure distress using the price of bond, where I define a bond as “distressed” if the price is 80 percent lower,which indicates that the market seriously doubts the financial health of the issuing firm. The qualitative trends inthe Figure 2 are similar if I instead use 90 percent as my measure of financial distress.
14Friewald et al. (2012) and Jankowitsch et al. (2014) also deploy the price dispersion measure to estimate transac-tion costs. However, Schestag et al. (forthcoming) caution against using price dispersion measure in OTC bondmarkets. They suggest, however, that the Amihud measure is correlated with transaction costs and captures anadditional dimension of liquidity when paired with volume information as summarized above.
Bankruptcy Claims Trading 781
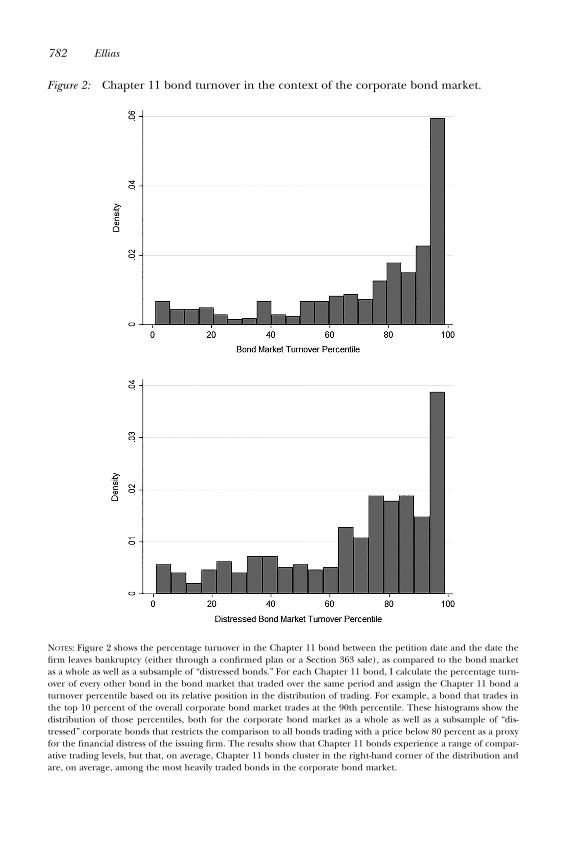
Figure 2: Chapter 11 bond turnover in the context of the corporate bond market.
NOTES: Figure 2 shows the percentage turnover in the Chapter 11 bond between the petition date and the date thefirm leaves bankruptcy (either through a confirmed plan or a Section 363 sale), as compared to the bond marketas a whole as well as a subsample of “distressed bonds.” For each Chapter 11 bond, I calculate the percentage turn-over of every other bond in the bond market that traded over the same period and assign the Chapter 11 bond aturnover percentile based on its relative position in the distribution of trading. For example, a bond that trades inthe top 10 percent of the overall corporate bond market trades at the 90th percentile. These histograms show thedistribution of those percentiles, both for the corporate bond market as a whole as well as a subsample of “dis-tressed” corporate bonds that restricts the comparison to all bonds trading with a price below 80 percent as a proxyfor the financial distress of the issuing firm. The results show that Chapter 11 bonds experience a range of compar-ative trading levels, but that, on average, Chapter 11 bonds cluster in the right-hand corner of the distribution andare, on average, among the most heavily traded bonds in the corporate bond market.
782 Ellias

Amihudj ,x, t =1
Nj ,x, t
X
kj,x, t
jrkj ,x, t jvkj ,x, t
As Table 2 shows, the Amihud measure suggests that bonds issued by Chapter 11
debtors trade with slightly above average trading costs that increase in magnitude as the
firm moves through the bankruptcy process before falling again during voting on the
plan of reorganization. This measure aims to estimate the price impact of a $1 million
transaction and it suggests a trade of $1 million of the median bond between the petition
date and the approval of bankruptcy financing is associated with a 0.76 percent price
impact, which is at the 58th percentile of all bonds traded in the market over that same
time period. The median bond’s trading costs increase once debtor-in-possession financ-
ing is approved and fall, on average, after the disclosure statement is approved and credi-
tors are voting on the plan of reorganization.
To contextualize these numbers, the transaction costs associated with trading Chap-
ter 11 bonds are slightly higher, but not by very much, than the corporate bond market.15
These results suggest that trading costs are the lowest when the firm is in the earliest part
of the bankruptcy case, which is also when the average daily trading volume appears to
be the highest according to Table 1.
IV. Does Claims Trading Disrupt Bargaining, Increase
Creditor Conflict, and Impede Negotiations?
Critics worry that claims trading destabilizes the creditor class by creating a revolving
door of creditors, where each revolution changes management’s negotiating partner and
makes reaching a consensual bargain more difficult, increasing conflict and litigation
(Miller 2009; Baird & Rasmussen 2010; Tung 1996). In many cases, they argue for
increased regulation to promote transparency (e.g., Hammer & Brandess 2010). On the
other hand, claims trading proponents argue that claims trading allows activist investors
to consolidate multiple claims, which may actually make bargaining more efficient
(e.g., Ivashina et al. 2016). In this section, I use evidence from bond trading and court fil-
ings to offer insight into how creditors change over the course of the bankruptcy process
and how trading might impact creditor conflict. I also offer suggestive evidence into the
motivations of claims traders.
The key identification challenge is that an omitted variable, such as value uncer-
tainty, could drive both creditor conflict and claims trading, making it impossible to
cleanly identify the impact of claims trading on creditor conflict. A key development in a
firm’s industry, for example, could lead to increased trading at the same time that it
15In unreported results, I compare the Chapter 11 Amihud measures to the submarket of distressed bonds and Ifind that the trading costs for Chapter 11 bonds are approximately the same as the broader universe of distressedbonds.
Bankruptcy Claims Trading 783

exacerbates existing disagreements over how the firm should reorganize. Moreover, credi-
tor conflict itself could drive claims trading as investors buy or sell based on their assess-
ment of, for example, a disagreement between senior creditors and junior creditors. This
section, then, takes three approaches to assess the relationship between claims trading,
creditor conflict, and bargaining using indirect measures and proxies. First, I look at the
volume of claims trading in each case to determine how often trading is sufficiently high
to destabilize bargaining and disrupt plan voting. Second, I examine disclosure state-
ments filed by activist investors to examine when activist investors tend to enter Chap-
ter 11 cases and how activist investor groups change, perhaps as a result of claims
trading, over the course of the bankruptcy process. Third, I use lagged measures of rela-
tive levels of trading to examine whether trading appears to predict litigation, which I
use as a proxy for creditor conflict.
A. How Often Is Claims Trading Heavy Enough to Disrupt Bargaining?
At its heart, the claim that the “creditor class” is disrupted is about negotiating and voting
on a plan. Section 1126(c) of the Bankruptcy Code provides that a class of creditors
approves the plan if favorable votes are cast by creditors holding “two-thirds in amount
and more than one-half in number of the allowed claims of such class …” Accordingly,
traders opposed to a plan of reorganization can, under some circumstances, vote it down
by buying claims equal to one-third in amount of the creditor class. Bankruptcy lawyers
colloquially refer to an investor holding one-third of the outstanding creditor class as
holding a “blocking position.”
To explore the impact claims trading might have on plan confirmation, I construct
hypothetical classes that consist of all unsecured debt claims against the debtor and
Table 3 summarizes.16 For each firm in this sample, I sum all trading between important
bankruptcy periods and divide it by the aggregate amount of outstanding unsecured debt
that the firm reported owing to financial creditors.17 I then calculate a dummy variable
that takes on a value of 1 if more than 33 percent of the aggregate amount of outstand-
ing unsecured debt appears to have traded during the bankruptcy period.
The results suggest that trading is heavy enough to disrupt the creditor class in a
sizable number of cases, if we assume that all buyers of claims are new creditors. For
example, a potential blocking position was traded between the petition date and the
beginning of the voting process (the approval of disclosure statement) in 55 percent
of the sample cases. In reality, this calculation suffers from both false positives and
16These estimates omit trade and tort claims, which are generally relatively small in comparison to the larger classof financial creditors (creditors whose claims arise from bond contracts or other unsecured investment contracts).The sample does not include trading in loan debt, so any unsecured loans that trade in the loan market instead ofthe bond market are also not included for the purposes of this analysis.
17The firm’s capital structure information comes either from the first day affidavit supporting the bankruptcy peti-tion or securities filings.
784 Ellias

false negatives. For example, a hedge fund with a 10 percent position in the class of
general unsecured claims on the petition date could acquire a blocking position by
buying 23 percent of the class and increasing its stake to 33 percent, which would not
appear to be the acquisition of a blocking position in this analysis. Alternatively, the
aggregate trading of 33 percent of a class of claims could really be three trades of
11 percent of the class, which means no blocking position would have changed hands.
Although this estimate should be interpreted with caution, it does suggest that trading
is heavy enough in more than half the cases between 2002 and 2012 with unsecured
bond debt for a blocking position to have been acquired, complicating bargaining and
voting.
Table 2: Estimated Trading Costs During the Phases of the Chapter 11 Process,
by Bond
Variable n Potential n Mean 25th Median 75th 90th Max
Panel A: Average Amihud Estimator Between Periods of the
Bankruptcy Case, for Cases with Confirmed Plans
Petition date and DIP
financing
286 376 15.02 0.18 0.76 2.81 7.64 2658.13
Petition date and disclosure
statement approval
414 486 23.62 0.19 0.96 2.85 9.70 2658.13
Petition date and plan
confirmation
422 491 22.43 0.20 0.99 2.74 9.01 2658.13
DIP financing and disclosure
statement approval
280 351 24.46 0.20 1.07 3.40 11.32 2737.81
DIP financing and plan
confirmation
297 366 21.86 0.21 1.09 3.14 12.20 2737.81
Disclosure statement approval
and DIP financing
324 455 7.37 0.10 0.68 2.04 6.42 963.74
Panel B: Amihud Estimator Percentile Between Periods of the
Bankruptcy Case, for Cases with Confirmed Plans
Petition date and DIP
financing
286 376 56 27 58 86 96 99
Petition date and disclosure
statement approval
414 486 58 28 60 88 97 99
Petition date and plan
confirmation
422 491 58 29 63 86 97 99
DIP financing and disclosure
statement approval
280 351 59 28 62 90 98 99
DIP financing and plan
confirmation
297 366 60 29 64 87 98 99
Disclosure statement approval
and DIP financing
324 455 53 19 57 83 96 99
NOTES: Table 2 shows the Amihud estimator, a measure of trading costs, for Chapter 11 bonds during key periodsin the bankruptcy case. Panel B contextualizes the numbers from Panel A in the larger corporate bond marketand reveals, for example, that the median Chapter 11 bond that trades between the petition date and the approvalof debtor-in-possession financing has estimated trading costs at the 58th percentile of the bond market, or slightlyabove average.
Bankruptcy Claims Trading 785

B. Do Activist Groups Appear to Enter, Grow, and Change Through Claims Trading?
One place to look for evidence that claims trading influences the governance of Chap-
ter 11 debtors is to focus on the observed behavior of activist investors. After all, trading
among passive investors that simply buy the claim to receive a return without any activist
behavior would not be terribly important for bankruptcy governance.18 In this subsection,
I use court documents and the bond data to learn how claims trading might be con-
nected to activist investor entry or exit.
First, I find that activist investors generally enter the bankruptcy case toward the
beginning of the bankruptcy process. All creditors who seek to be heard in court or
who want to be on the court’s mailing list must file a notice of appearance on the court
docket. Accordingly, I examine all the court dockets for the firms in the bond sample
that filed for bankruptcy in 2004 or later (n = 158).19 Within this subsample, I identify
14,387 “notices of appearance,” of which 251 appear to be from “ad hoc committees” of
activists acting together and 656 appear to be from hedge funds or other alternative
asset managers.20 As Online Appendix Table A1 shows, 58 percent of ad hoc commit-
tees file their first notice of appearance before debtor-in-possession financing is
approved, with another 30 percent appearing before the disclosure statement is
approved and plan voting starts.21 Of hedge funds, 50 percent appear before the
approval of bankruptcy financing and another 32 percent appear before the disclosure
statement is approved. To express this in terms of days of bankruptcy, the median ad
hoc group appears 24 days into the bankruptcy process, which is 12.5 percent of the
median case length of 192 days.
I also examine Rule 2019 disclosures filed by bondholder groups to assess how
activist groups change over the course of the bankruptcy process. In general, groups of
hedge funds seeking to influence the outcome of the bankruptcy case will form a group,
18While all creditors with impaired claims are entitled to vote on a plan, in practice activist investors are the partiesmost likely to vote no while passive investors tend to vote yes or not vote at all.
19I focus on this period because PACER no longer retains all information for the 2002 and 2003 Chapter 11 filings.This method is inherently inexact because some hedge funds might negotiate privately with management withoutever appearing in bankruptcy court. However, litigation is such a key part of bankruptcy negotiation that it seemslikely that I am able to observe the vast majority of hedge fund entrance by examining notices of appearance. Thewillingness and ability to litigate is a key signal of seriousness in bankruptcy negotiations (Ellias 2016).
20I identify ad hoc committees and hedge funds with searches of the court docket text. I identify ad hoc commit-tees with searches for “ad hoc,” “informal group,” “noteholders,” “lenders,” and “bondholders.” I identify hedgefunds and other alternative asset managers with searches for “capital management,” “asset management,” “capital,”and “fund.” A manual review of the results suggests that this method closely captures the real distribution of hedgefunds and ad ho committee notices of appearance in the sample.
21These numbers are slightly different than the Rule 2019 sample, which reflects the fact that some “ad hoc” groupsnever filed their required 2019 disclosure or that the Rule 2019 disclosure came after the notice of appearance,sometimes later into the bankruptcy process. The overall pattern of activist appearance, however, is the same.
786 Ellias

creating an obligation to file a Rule 2019 statement. Unfortunately, investors and lawyers
did not exhibit perfect compliance with the rule during the sample period.22 Nonethe-
less, many investor groups appear to have complied with the rule, at least in part, provid-
ing new insight into activist investors and their role in Chapter 11.23
As Table 4 summarizes, I find that activist groups largely do not change over the
course of the Chapter 11 case, with largely the same funds continuing to hold largely
the same amount of debt at the end of the bankruptcy case as they do at the begin-
ning.24 First, as Panel A shows, slightly less than half (42 percent) of bondholder
groups never file an updated Rule 2019 disclosure, indicating that they do not change
in a material way. Of the bondholder groups that do file disclosures, slightly more
than half (51 percent) change in terms of the composition of their membership, as an
investor exits the group or a new one joins. When these groups do update their hold-
ings, they usually report small decreases in the amount of debt they now hold as
opposed to an earlier time in the case, suggesting that most groups either do not
change or experience attrition that might slightly reduce the group’s bargaining
power.25
Panel B of Table 4 shows that activist investors tend to appear and change the most
in the early parts of the bankruptcy case, with 40 percent of all Rule 2019 statements and
53 percent of all bondholder activists disclosing their identity on the court docket before
bankruptcy financing is approved.26 In terms of days of bankruptcy, the median
22The rule actually became the subject of a roaring controversy during the sample period as hedge funds compliedwith it selectively in most cases and sought to have the rule amended to protect what they viewed as confidentialinformation. However, the typical level of partial compliance was to provide the name of the funds and the amountthat the funds hold in aggregate (Gerber 2009), which is enough for the analysis in this section to be reliable.
23There are least two reasons to be cautious in interpreting this analysis. First, in some cases, hedge funds act aloneinstead of in ad hoc groups with other investors, negating the need to file Rule 2019 statements. Second, it is possi-ble that this analysis reflects data truncation as some hedge funds ignore their obligation to update their holdingswhen there is a material change, as the rule requires, which would make examining updates to Rule 2019 disclo-sures unreliable. In Online Appendix Table A2, I find that the level of trading during the case is positively corre-lated with updated Rule 2019 disclosures, suggesting that heavy trading is associated with a higher likelihood of anupdated Rule 2019 statement. That provides some comfort that examining sequential Rule 2019 disclosures offersreliable information on how the composition and holdings of investor groups change over the bankruptcy case.
24In Online Appendix Table A3, I track changes in activist groups holding bank loans and find a similar pattern tothe activity of bondholders, suggesting that, in general, the activist investing groups that appear in bankruptcycourt do not consolidate the claim during the Chapter 11 case. They may very well do so, however, prior to thebankruptcy filing.
25Of course, investors may choose to exit because their activist intervention has proven successful or because it hasfailed, in which case the entrance or exit of an activist would not be terribly important for bankruptcy governance.
26There tends to be a lag between the appearance of an ad hoc group and its first Rule 2019 statement as the cred-itors’ lawyers catch up. The median “ad hoc” group files a notice of appearance 24 days into the bankruptcy case.However, as Panel A of Table 4 shows, the median bondholder activist group files its first 2019 statement aboutthree weeks later, 48 days into the bankruptcy case.
Bankruptcy Claims Trading 787

bondholder Rule 2019 statement was filed 42 days into the bankruptcy process.27 Panel C
demonstrates that the original group of activists largely remains intact throughout the
entirety of the bankruptcy process and that they continue to account for the vast majority
of the debt held by the updated group, with, on average, 84 percent of the original group
holding 86 percent of the debt held by the time of the final disclosure.
One potential explanation for this pattern is that the activists might sign confiden-
tiality agreements that restrict their ability to buy or sell debt, leaving the holdings of the
group relatively static. In that case, observed trading might largely be from passive inves-
tors to other passive investors.28 As these investors do not tend to intervene in bank-
ruptcy, their transactions occur without seriously impacting the average bankruptcy
case.29 New investors may largely avoid joining an existing group because doing so might
require signing the confidentiality agreement that allows negotiations to occur.
Moreover, the sheer existence of a group of activists might deter other investors
that want to deploy an activist strategy from entering. As the median existing activist
Table 3: Percentage of Cases with Potential Blocking Position Traded in Funded Gen-
eral Unsecured Claims Class, for Cases with Plans
Bankruptcy Period
Potential Blocking Position
Traded in % of Sample Full Sample n
Petition date and DIP financing approval 0.29 147
Petition date and disclosure statement
approval
0.55 146
Petition date and plan confirmation 0.61 148
DIP financing and disclosure statement
approval
0.44 118
DIP financing and plan confirmation 0.54 124
Disclosure statement approval and plan
confirmation
0.28 128
NOTES: Table 3 shows the percentage of sample cases in which a hypothetical blocking position (>33 percent of theoutstanding unsecured class of claims) was traded. For example, more than 33 percent of a hypothetical class ofunsecured claims traded in 28.93 percent of cases with unsecured debt. Each row of the sample is restricted tocases where a plan of reorganization is confirmed and where the second event occurred after the first (e.g., theDIP financing and disclosure statement approval row leaves out cases where DIP financing was approved by thebankruptcy court after the approval of a disclosure statement, or where they occurred on the same day) and whereunsecured debt issued by the Chapter 11 debtor is observed to trade at some point during the sample period.
27This means the group was active and disclosed with about 80 percent of the median Chapter 11 process yet torun. In reality, the group was probably active and engaged earlier, most likely before the Chapter 11 filing, but Ido not observe this systematically.
28Harner (2008) surveys distressed investors and finds that 60 percent of them never invest with an eye towardcontrolling the company through the investment.
29Moreover, it could be the case that when a firm falls into financial distress, existing creditors have multiple ideasabout how the firm should react to the distress. Those activists may buy and sell claims from and to each other,with the effect that the group has largely come to a unified approach by the time the firm enters bankruptcy,which could promote group stability.
788 Ellias

Table 4: Observed Changes in Composition and Holdings of Bondholder Activist
Groups Over Bankruptcy Process
Panel A: Summary of Bondholder Rule 2019 Statements
First 2019
Statement
Update
#1
Update
#2
Update
#3
Update
#4
Update
#5
Update
#6
Number of activist groups
appearing
100 58 25 14 9 3 2
Mean percentage of total
bond issue
0.67 0.52 0.47 0.46 0.53 0.89 N/A
Mean change in holdings N/A –0.07 –0.03 –0.03 –0.16 –0.05 N/A
% Adding funds N/A 0.37 0.52 0.55 0.66 1.00 1.00
% Subtracting funds N/A 0.26 0.30 0.36 0.66 0.33 0.00
% Some change in activist
group identity
0.51 0.70 0.57 0.88 0.66 1.00
Median # of days after
petition date
48 194 287 159.5 336 426 634
Panel B: Rule 2019 Disclosure Statements by Bondholder Activist Groups, by Period of Bankruptcy Case
Petition Date and
DIP Financing
DIP Financing and
Disclosure Statement
Approved
Disclosure Statement
Approval and Plan Approval
% of first Rule 2019 0.53 0.39 0.08
% of second Rule
2019
0.32 0.49 0.19
% of third Rule
2019
0.38 0.56 0.16
% of fourth or
higher Rule 2019
0.23 0.65 0.12
Percentage of all
2019 statements
0.4 0.47 0.12
Panel C: Average Amount of Original Bondholder Activist Group Remaining After Updating Rule 2019
Statement
First 2019 Update #1 Final Update
Percentage of funds remaining 1 0.86 0.84
Percentage of group holdings owned by original 2019 group 1 1 0.86
NOTES: Table 4 summarizes the Rule 2019 disclosures filed by groups of activists holding debt issued pursuant to abond indenture (“bond debt”). For example, Panel A shows that the average ad hoc investor group held 67 percentof the class of debt represented by the group as evidenced by the first Rule 2019 statement. Of ad hoc investorgroups filing an update to the initial Rule 2019 statement, the average group held 52 percent of the outstandingclass of debt. Panel B shows that 53 percent of ad hoc activist groups filed their initial Rule 2019 disclosure beforethe judge approved the firm’s bankruptcy financing, as did 32 percent of groups filing two Rule 2019 disclosures.Panel C shows that, for the ad hoc groups filing an updated Rule 2019 statement, 86 percent of the original inves-tors remained, holding, on average, 100 percent of the debt held by the group.
Bankruptcy Claims Trading 789

group already controls the majority of its class of bonds, there is probably very little space
for a newcomer activist to turn a profit by buying a minority position and entering the
case. Even if circumstances were to change and a different restructuring transaction
becomes optimal, the existing activist group may prefer to capture those gains itself
rather than to sell to new investors. Additionally, the expected gains to joining an existing
activist group are also probably fairly low if the existing activists are not somehow extract-
ing private benefits, which might create incentives to free ride instead of devoting money
and time to joining the activist group. The sophistication and firm-specific knowledge of
the existing group of activists may independently discourage the entry of new activists,
leaving investors with passive investment strategies to trade the portion of the firm’s debt
not owned by the activist group.
While I cannot test this hypothesis directly, I do find evidence that is consistent
with it. First, I find evidence that the traditional investors that fund the debt of healthy
corporations exit their Chapter 11 investments far in advance of bankruptcy, suggesting
that investors capable of activism have already acquired most of the Chapter 11 debt well
in advance of bankruptcy. Mutual funds and other registered investment companies—a
category that omits most of the alternative asset managers that engage in activist investing
in bankruptcy—are required to disclose their holdings twice a year through Form N-Q. I
scrape all the Form N-Q filings filed between 2008 and 2012 from the SEC server and use
machine reading to identify which mutual funds hold Chapter 11 bonds. Of the 44,162
Form N-Qs filed by 3,368 fund managers, I identify 1,346 Chapter 11 bond investments
held by 48 funds.30 Following those investors over time, I find that the average fund hold-
ing the bond of a future Chapter 11 debtor within two years of bankruptcy (n = 104) exits
the position at least four months before the petition date and perhaps as many as
10 months due to delays in reporting requirements.31 Further, of the purchases of the
bonds of Chapter 11 debtors by mutual funds (n = 66) within two years prior to the bank-
ruptcy filing, only 11 are reported after the petition date, and delays in reporting require-
ments mean they could have all come earlier in time.
Second, I do not find evidence of a disproportionate market focus on trading the
bonds that will receive control of the debtor after the bankruptcy case is over. Instead,
traders appear to be equally interested in the claims that receive debt or cash recoveries
from the bankruptcy process, which is what we might expect if a significant proportion of
claims trading was the purchasing of claims by investors interested in passively holding
30I use this period because the requirement to file Form N-Q in HTML only started in 2008. The vast majority ofmutual funds invest in debt, not equity, and fewer still focus on noninvestment grade debt, which explains why thisnumber is so low. “Chapter 11 bond” refers to a bond issued by a firm that filed for Chapter 11 during this four-year period.
31I observe snapshots of holdings, which makes it harder to identify this date with precision. Form N-Q must befiled twice a year, but a sale one day after the last report will result in a change in mutual fund holdings in the nextreport, approximately six months later.
790 Ellias

the claim and earning a return.32 For each sample case with a distribution pursuant to a
plan of reorganization, I identify the form of consideration that the bondholder will
receive from the disclosure statement. For ease of exposition, I combine these into two
groups: payments in cash or debt or payments in equity.33 As Online Appendix Table A5
shows, there is no statistical difference in the average daily turnover for the bonds that
are paid in cash or debt as opposed to the bonds that are converted to equity at the end
of the bankruptcy process.
Finally, given that activists seem to enter early, I hypothesize that late entrance
might, on average, be driven by exogeneous changes in the bargaining environment that
increase the expected value of Chapter 11 activism for some creditors. In general, activists
probably prefer to have some role in shaping the bankruptcy financing process given the
importance of debtor-in-possession loans to bankruptcy governance (Skeel 2004). How-
ever, activists might organize and intervene in the bankruptcy process relatively later in
time if there is some sort of positive news about the firm’s prospects. An exogeneous
change that improves the firm’s value might change the expected value of an activist
investing strategy and inspire investors who were not previously engaged in the case to try
to influence the outcome of the Chapter 11, perhaps because they believe their bonds
are now more valuable.
To assess this possibility, I examine a proxy for an improvement in the firm’s
prospects: the market return of industry-comparable firms. For every firm in the sam-
ple, I identify all publicly traded firms in the same industry and calculate the equally
weighted return of those firms over the period that each debtor is in bankruptcy.34 In
Figure 3, I summarize the average number of days between the petition date and the fil-
ing of the first Rule 2019 disclosure statement. As Figure 3 shows, the firms whose
industries do the best over their time in bankruptcy also are the firms most likely to see
a group of activists make an unusually late entry.35 Although other factors are likely to
also explain late activist entry, this analysis supports the view that exogeneous events
might be an important driver of shifts in the bankruptcy bargaining environment. It is
true that these late interventions may be unlikely to occur without claims trading—it is
not obvious whether these late interveners were just silent creditors before becoming
active participants or new owners of the claims—but to the extent claims trading does
drive these late interventions, it suggests that claims trading increases the exposure of
32It is also possible that investors are simply bad at identifying the future fulcrum claim. However, the average priceof a Chapter 11 claim does not change that much from the beginning of the bankruptcy case to the end (Ellias2018), suggesting that investors are, on average, very good at understanding how the bankruptcy will unfold andwhat creditor recoveries are likely going to be.
33As Online Appendix Table A4 shows, this analysis is similar if I treat debt and cash as two separate groups as com-pared to the bonds that receive equity.
34Comparable firms are identified using the firm’s three-digit SIC code.
35In Online Appendix Table A6, I show that the pattern illustrated in Figure 3 is also statistically significant in aregression analysis.
Bankruptcy Claims Trading 791

Figure 3: Average days before the filing of first Rule 2019 statement, by comparable firm
return over Chapter 11 process.
NOTES: Figure 3 shows the average number of days between the petition date and the filing of the first Rule 2019statement. The unit of analysis is a bond contract (n = 84) issued by a firm with an identifiable three-digit SIC codewhose holders filed a Rule 2019 statement disclosing their identity as an activist group. The Bankruptcy PeriodMarket Return Decile is calculated by taking the average return of publicly traded industry comparable firms overthe period each firm is in Chapter 11. The first decile contains the bottom 10 percent of industry returns whilethe 10th decile is the top 10 percent of industry returns. The figures show that bondholders whose industries dothe best over Chapter 11 tend to, on average, file initial Rule 2019 statements later in the bankruptcy process.
792 Ellias

bankruptcy governance to market developments. One reason we may see relatively few
late activist entrances is that industry conditions seldom change enough to attract new-
comer activists during the six months the median sample firm spent in Chapter 11. In
fact, the median industry return of a Chapter 11 debtor over the sample period was
only 0.02 percent.36
C. Does Claims Trading Appear to Increase the Probability of Litigation?
While it is difficult to assess any link between trading and contentious negotiations,
the court docket offers the ability to observe and examine some correlations. In par-
ticular, I focus on trading and litigation before important hearings in the bankruptcy
case and look to see whether trading in a claim is correlated with the probability of an
objection to management’s motion being filed on the court docket by holders of the
claim. Litigation is an imperfect measure of contentious negotiations, as some negoti-
ations likely do not lead to written objections while some objections may not implicate
serious issues, so caution is due in interpreting the findings in this section. Addition-
ally, it is difficult to assess the causal arrow, as traders may buy claims in anticipation
of litigation without actually increasing the likelihood that someone litigates. How-
ever, litigation is a key part of bankruptcy negotiations (Ellias 2016) and if trading is
positively associated with the likelihood of litigation it would support the view that
claims trading not only can complicate bargaining, but that it does.
Table 5 shows those regression models. The independent variable of interest in
Model 1 is the aggregate amount of trading in the month prior to the objection dead-
line. The independent variable of interest in Model 2 is an indicator variable that takes
on a value of 1 if trading in the month prior to the objection deadline was heavier than
trading in the month before that, a proxy for an uptick in investor interest in trading
the claim. For example, if the objection deadline was April 1, the variable would equal
1 if aggregate trading was higher in March than it was in February. The dependent vari-
able takes on a value of 1 if the holders of the creditor’s claim filed an objection to
management’s motion.
The results suggest that relatively higher levels of trading are associated with a
higher probability of objection when the motion at issue is the debtor-in-possession
financing motion, which is usually the beginning of the bankruptcy process.37 How-
ever, I find no relationship between the measures of trading and the likelihood of
observing an objection when I focus on objections filed later in the bankruptcy pro-
cess. This is consistent with the general pattern observed above, where the activist
investors that seek to influence the bankruptcy process enter the case early. While
36The distribution of returns is strongly skewed to the right. The top 10 percent of Chapter 11 debtor industrypublicly traded comparables saw an 80 percent or higher return over the time the firm was in Chapter 11, but the75th percentile industry only returned 20 percent, suggesting that dramatic industry shifts that might upset Chap-ter 11 bargaining expectations are relatively unusual.
37It could also be the case that investors buy claims knowing an objection is already highly likely.
Bankruptcy Claims Trading 793

some litigious activists may enter later, on average they do not, which may be why I
do not observe a systematic relationship between claims trading and objections filed
later in the plan process.38 It may also be the case that the types of investors who
speculate on bankruptcy litigation also enter the bankruptcy case early, making the
resulting correlation spurious. However, as most activist groups do not emerge on the
very first day of the bankruptcy case but instead soon thereafter, it is also possible,
and perhaps more likely, that Table 5 is picking up on activist entrance or claim con-
solidation by existing activists early in the case and trading by investors that do not
increase the probability of observing courtroom activism, on average, later in
the case.
Table 5: Claims Trading and the Probability of an Objection
(1) (2) (3) (4) (5) (6)
Claimant
Objection
to DIP
Motion?
Claimant
Objection
to DIP
Motion?
Claimant
Objection to
Disclosure
Statement?
Claimant
Objection to
Disclosure
Statement?
Claimant
Objection
to Plan?
Claimant
Objection
to Plan?
Log funded debt –0.195 –0.198 –0.029 –0.060 0.411** 0.383**(0.164) (0.166) (0.188) (0.203) (0.177) (0.186)
Log size of claim –0.230 –0.191 0.362 0.386 –0.118 –0.097
(0.146) (0.150) (0.252) (0.272) (0.251) (0.277)
Prenegotiated bankruptcy –0.103 –0.093 0.187 0.147 0.755 0.695
(0.383) (0.386) (0.424) (0.425) (0.540) (0.530)
Contractual subordination –0.278 –0.313 0.211 0.203 0.427 0.463
(0.351) (0.350) (0.344) (0.350) (0.451) (0.448)
Total bond trading in 30 days
prior to objection deadline
0.125***(0.043)
–0.027
(0.052)
–0.089
(0.066)
Increase in trading
prior to hearing
0.484**(0.242)
0.276
(0.233)
–0.301
(0.261)
Psuedo-R2 0.14 0.13 0.13 0.13 0.19 0.19
N 520 520 520 520 492 492
Unique debtors 191 191 191 191 191 191
Year fixed effects Yes Yes Yes Yes Yes Yes
Law firm fixed effects Yes Yes Yes Yes Yes Yes
*p < 0.1; **p < 0.05; ***p < 0.01.
NOTES: Table 5 shows logistic regression models. Standard errors clustered at the firm level are in parenthe-
ses. The dependent variable is a binary variable that takes on a value of 1 if the creditor filed an objection to
the debtor’s motion (either a debtor-in-possession financing motion, a disclosure statement for a plan of
reorganization, or approval of the plan itself ) and a 0 if the debtor filed the motion and the creditor did not
object. In Models 1, 3, and 5, the dependent variable of interest is the raw turnover (the percentage of the
overall issue) trading in the 30 days prior to the objection deadline for the motion of interest. In Models 2, 4,
and 6, I construct a dummy variable that takes on a value of 1 if the trading in the 30 days immediately prior
to the objection deadline was heavier than the trading in the period between 60 and 30 days prior to the
deadline, which is a proxy for increased investor interest in trading the bond.
38Latecomer investors may also have problems disrupting the results of prior bargaining, especially if the bank-ruptcy judge is likely to view new activist investors more skeptically when they engage in a late-stage intervention.
794 Ellias

V. CONCLUSION
These results are likely to dissatisfy both critics and proponents of bankruptcy claims
trading. Clearly, both critics and proponents tell a story that is accurate at least some of
the time. In some high-profile cases, claims trading has complicated and delayed a
firm’s emergence from bankruptcy. In others, claims trading has facilitated the
entrance of activist hedge funds that bring capital and expertise that aid the firm’s
restructuring. The contribution of this article is to show, over a large sample, what the
average effects of claims trading appear to be. While some caution is due in interpret-
ing the findings in this study due to identification challenges and data limitations, these
results provide a foundation for future research and policy debates about bankruptcy
claims trading.
Most importantly, I find that claims trading is a pervasive feature of Chapter 11,
but that the best interpretation of the evidence suggests that the impact of claims trad-
ing on bankruptcy outcomes is overstated. This statement comes with a strong caveat.
Observed activist entry is an imperfect proxy for changes in the composition of the
creditor body, and it is possible that there are important changes that my methodol-
ogy does not observe. For example, some of the passive investors who buy claims
might have activist capabilities whose presence at the edge of the bankruptcy case
influences negotiations and outcomes. Indeed, the possibility of activist entrance may
place pressure on the various creditors to support one restructuring transaction over
another.
Further, it is likely the investors holding the claims on the petition date are
already, in many if not most cases, secondary market purchasers, meaning that the trad-
ing of distressed debt may be very important to the governance of distressed firms, even
if it is less important to the administration of bankruptcy law. Bankruptcy law takes the
creditor body as it stands on the first day of the bankruptcy case; to the extent that
claims trading occurs prior to a bankruptcy filing, it is unlikely to trouble bankruptcy
policymakers. With all that said, the results in this article do strongly support the view
that claims trading’s disruption to bankruptcy negotiations is less severe than many
critics feared.
The results in this article conflict with Ivashina et al.’s (2016) findings that activist
investors play an important role in consolidating the class of trade claims in bankruptcy.
I hypothesize that this conflict may be a result of trade creditors largely not looking to
sell their claims until the bankruptcy case has been initiated. Bonds, on the other hand,
benefit from a strong preexisting trading infrastructure and tend to be liquid and held
by sophisticated investors before the firm even falls into financial distress.39 This suggests
that different types of claims may have different periods of intense liquidity, even though
they may be ultimately entitled to the same payoff at the end of bankruptcy.
39As Ivashina et al. (2016) find, most of their trading occurs immediately after a bankruptcy filing, which they taketo suggest that the disclosure of creditor names and addresses “catalyzes trading” in that market.
Bankruptcy Claims Trading 795

This study is missing a large part of the claims trading market: trading in corporate
loans. While the patterns of trading in corporate bonds may, in fact, be representative of
trading in loans, further research is needed to learn more about them. Corporate loans
are only increasing in importance due to the activity of private equity firms and the
increasing popularity of loan-to-own strategies. More research is urgently needed in this
area, especially to connect trading to bankruptcy outcomes and to learn more about the
motivations of traders and how they change over the course of a bankruptcy case.
References
Acharya, Viral V., & Lasse Heje Pedersen (2005) “Asset Pricing with Liquidity Risk,” 77 J. of FinancialEconomics 375.
Amihud, Yakov (2002) “Illiquidity and Stock Returns: Cross-Section and Times-Series Effects,” 5 J. ofFinancial Markets 31.
Ayotte, Kenneth M., & Edward R. Morrison (2009) “Creditor Control and Conflict in Chapter 11,” 1J. of Legal Analysis 511.
Baird, Douglas G. (2010) “The Bankruptcy Exchange,” 3 Brooklyn J. of Corporate, Financial & Commer-cial Law 23.
Baird, Douglas G., & Robert K. Rasmussen (2010) “Antibankruptcy,” 119 Yale Law J. 648.Casey, Anthony (2014) “Auction Design for Claims Trading,” 22 American Bankruptcy Institute Law
Rev. 133.Coelho, Luis, Kose John, & Richard Taffler (2010) “Bankrupt Firms: Who’s Buying?” March 19 SSRN
Electronic J. Available at http://papers.ssrn.com/sol3/papers.cfm?abstract_id=1572733.Corwin, Shane A., & Paul Schultz (2012) “A Simple Way to Estimate Bid-Ask Spreads from Daily
High and Low Prices,” 67 J. of Finance 719.Dick-Nielsen, Jens (2014) “How to Clean Enhanced TRACE Data,” Working Paper. Copenhagen Busi-
ness School, Department of Finance, Copenhagen.Dunkley, Emma, & Adam Palin (2014) “Illiquid Funds Offer Top Returns But High Risks,” March
5 Financial Times. Available at https://www.ft.com/content/c5da39f8-a38b-11e3-88b0-00144feab7de.
Ellias, Jared A. (2016) “Do Activist Investors Constrain Managerial Moral Hazard?” 8 J. of Legal Analy-sis 493.
——— (2018) “What Drives Bankruptcy Forum Shopping? Evidence from Market Data,” 47 J. of LegalStudies 119.
Friewald, Nils, Rainer Jankowitsch, & Marti G. Subrahmanyam (2012) “Illiquidity or Credit Deteriora-tion: A Study of Liquidity in the U.S. Corporate Bond Market During Financial Crises,” 105J. of Financial Economics 18.
Gerber, Robert (2009) “Letter 8-BK-M to the Advisory Committee on Bankruptcy Rules,” January9. Available at http://www.uscourts.gov/sites/default/files/fr_import/08-BK-M-Suggestion-Gerber.pdf.
Hammer, Aaron L., & Michael A. Brandess (2010) “Claims Trading: The Wild West of Chapter 11s,”July/August ABI J.
Harner, Michelle M. (2014) Commission to Study the Reform of Chapter 11: Final Report and Recommendations.American Bankruptcy Institute. Available at http://commission.abi.org/final-report.
Hu, Henry T. C., & Jay L Westbrook (2007) “Abolition of the Corporate Duty to Creditors,” 107Columbia Law Rev. 1321.
Ivashina, Victoria, Benjamin Iverson, & David C. Smith (2016) “The Ownership and Trading of DebtClaims in Chapter 11 Restructurings,” 119 J. of Financial Economics 316.
Janger, Edward J. (2009) “The Cost of Liquidity Enhancement: Transparency Cost, Risk Alterationand Coordination Problems,” 4 Brooklyn J. of Corporate, Financial & Commercial Law 39.
796 Ellias

Jankowitsch, Rainer, Florian Nagler, & Marti G. Subrahmanyam (2014) “The Determinants of Recov-ery Rates in the US Corporate Bond Market,” 114 J. of Financial Economics 155.
Levitin, Adam J. (2010) “Bankruptcy Markets: Making Sense of Claims Trading,” 4 Brooklyn J. of Corpo-rate, Financial & Commercial Law 74.
Miller, Harvey (2009) “Congressional Testimony,” in Circuit City Unplugged: Why Did Chapter 11 Fail toSave 34,000 Jobs? March 11 House Judiciary Committee.
Roe, Mark (2016) “Bankruptcy Beat, the Examiners: Rise of Claims Trading Complements 363 Sales,”February 17 Wall Street J. Available at http://blogs.wsj.com/bankruptcy/2016/02/17/the-examiners-rise-of-claims-trading-complements-363-sales/.
Rosen, Kenneth (2016) “Claims Trading Warps the Bankruptcy System,” January 14 Wall Street J. Availableat https://blogs.wsj.com/bankruptcy/2016/01/14/claims-trading-warps-the-bankruptcy-system/.
Schestag, Raphael, Philipp Schuster, & Marliese Uhrig-Homburg (Forthcoming) “Measuring Liquid-ity in Bond Markets.” Rev. of Financial Studies.
Tung, Frederick (1996) “Confirmation and Claims Trading,” 90 Northwestern Law Rev. 1684.Wall Street Journal (2016) “Bankruptcy Beat, Commentary: The Role of Claims Trading in Bankruptcy,”
February 16 Wall Street J. Available at https://blogs.wsj.com/bankruptcy/2016/02/16/the-role-of-claims-trading-in-bankruptcy/.
Cases Cited
In re Accuride (Bankr. D. Del 2010).In re Northwest Airlines Corporation, et al., 363 B.R. 701, 702 (Bankr. S.D.N.Y. 2007).In re Premier International Holdings (“Six Flags”), 2010 Bankr. Lexis 98 (Bankr. D. Del. 2010)In re Washington Mutual, 419 B.R. 271 (Bankr. D. Del 2009).
Rules Cited
Federal Bankruptcy Code § 363.Federal Bankruptcy Code § 1126.Federal Rule of Bankruptcy Procedure 2019.Federal Rule of Bankruptcy Procedure 3001.Federal Rule of Bankruptcy Procedure 9010.The Bankruptcy Act of 1978.
Appendix
Patterns of Trading in Chapter 11 Equity
In this appendix, I examine patterns of trading in Chapter 11 equity to determine how
similar it is to the patterns of trading in Chapter 11 bond debt. There are important dif-
ferences between the market for Chapter 11 bonds and Chapter 11 equity. Most impor-
tantly, the market for distressed equity is much easier for investors to access. Although
Chapter 11 equity is normally delisted from a public exchange prior to, or shortly after, a
Chapter 11 filing, it generally will continue to trade over the counter and retail investors
can easily buy and sell it. Prior work suggests that trading in the equity of bankrupt com-
panies might be driven primarily by “a particular retail investor clientele who uses [the
lottery-like characteristic of the stock of bankrupt firms] to gamble in the market”
(Coelho et al. 2010:39). The bond market, on the other hand, is harder to access and
requires larger amounts of capital as bonds tend to trade at much higher prices than
Bankruptcy Claims Trading 797

Table A1: The Distribution of Equity Trading During Bankruptcy Case, by
Phase of Case
Variable n
Potential
n Mean 25th Median 75th 90th Max
Panel A: Percentage of Outstanding Equity Trading Between Periods of the
Bankruptcy Case, for Cases with Confirmed Plans
Petition date and DIP financing 84 87 1.25 0.28 0.77 1.49 2.78 15.71
Petition date and disclosure
statement approval
99 102 2.61 0.67 1.43 3.68 6.47 14.16
Petition date and plan confirmation 99 102 3.33 0.87 2.22 4.28 8.48 18.22
DIP financing and disclosure
statement approval
78 85 1.58 0.27 0.69 1.34 5.48 14.87
DIP financing and plan confirmation 83 86 2.23 0.34 1.02 2.60 6.52 15.10
Disclosure statement approval and
plan confirmation
86 90 0.87 0.11 0.31 0.93 1.67 11.92
Panel B: Percentage of Outstanding Issue Trading per Trading Day
Between Periods of the Bankruptcy Case, for Cases with Confirmed Plans
Petition date and DIP financing 83 87 0.04 0.01 0.03 0.05 0.10 0.31
Petition date and disclosure
statement approval
99 102 0.03 0.01 0.01 0.02 0.05 0.62
Petition date and plan confirmation 99 102 0.02 0.01 0.01 0.02 0.04 0.19
DIP financing and disclosure
statement approval
78 85 0.02 0.00 0.01 0.01 0.03 0.33
DIP financing and plan confirmation 83 86 0.02 0.00 0.01 0.02 0.04 0.24
Disclosure statement approval and
plan confirmation
86 90 0.02 0.00 0.01 0.01 0.03 0.26
Panel C: Percentage of Outstanding Equity Trading Between Periods of the
Bankruptcy Case, for Cases with 363 Sales
Petition date and sale 34 35 1.91 0.34 0.92 3.06 5.19 5.82
Panel D: Percentage of Observed Trading That Takes Place Between Periods of the
Bankruptcy Case, for Cases with 363 Sales
Petition date and sale 34 35 0.03 0.00 0.01 0.03 0.11 0.16
NOTES: Appendix Table A1 summarizes trading over the bankruptcy process for Chapter 11 equity. Panels Aand B summarize trading for cases with confirmed plans, with Panel A showing the percentage of the outstand-ing equity trading between bankruptcy milestone dates and Panel B showing the average daily trading in thedebtor’s equity for each day the market was open between those two dates, again expressed as a fraction ofthe outstanding equity. For example, the 25th percentile debtor saw trading equivalent to 66.96 percent of theoutstanding equity trade between the petition date and the date the bankruptcy judge approved a disclosurestatement to start the plan voting process. Between the petition date and the approval of adebtor-in-possession financing package, 2.95 percent of outstanding equity traded, on average, for each day themarket was open for trading. Panels C and D show the analogous numbers for firms that sold themselves in aSection 363 sale outside the plan process. The “Potential n” column indicates the number of firms with tradedequity in the dataset that could have been trading during this period, meaning, for example, that 87 bondswere issued by debtors that obtained debtor-in-possession financing and confirmed a plan of reorganization, ofwhich 83 traded during that period in each debtor’s respective case.
798 Ellias

Chapter 11 equity. However, it is still useful to compare the trading patterns of equity
during the bankruptcy to the debt results in Table A1.
To do so, I gathered a sample of equity data from Bloomberg. The equity sample is
daily summaries of high, low, opening, and closing prices and traded volume for over-
the-counter or exchange traded equity during the sample period. Just as with the bond
debt, a firm entered the equity sample if it filed for Chapter 11 during the sample period
and had publicly traded equity in the records maintained by Bloomberg at any point dur-
ing the sample period. The Chapter 11 equity sample contains trades of more than 38 bil-
lion shares issued by 135 firms on 36,323 trading days with an aggregate market value of
approximately $335 million. Approximately 78 percent of observed trading days involve
transactions with a price per share of less than $1. As Chapter 11 equity nearly always
trades on every day a firm is in bankruptcy, this sample represents, to the best of my
knowledge, a complete record of trading in Chapter 11 equity.
The general pattern of equity trading in Appendix Table A1 is similar to the bond
trading in Table 1, although there are clearly some distinctions between bond and equity
trading. Most importantly, trading in the equity of Chapter 11 debtors is heavier as a raw
percentage of outstanding shares than trading in Chapter 11 bonds, just as trading in
equity markets is generally heavier than trading in bond markets. The median debtor
with observed trading sees almost 77 percent turnover in aggregate outstanding equity
between the petition date and the approval of debtor-in-possession financing, as com-
pared to 22 percent of the median outstanding bond.
Bankruptcy Claims Trading 799