Embed Size (px)
Citation preview

8/19/2019 Banks and Sovereign Risk. Deutsche Bundesbank 2013
http://slidepdf.com/reader/full/banks-and-sovereign-risk-deutsche-bundesbank-2013 1/48
Discussion PaperDeutsche Bundesbank
No 29/2013
Banks and sovereign risk:a granular view
Claudia M. Buch(University of Tübingen, IAW and CESifo)
Michael Koetter(Frankfurt School of Finance and Management)
Jana Ohls(Deutsche Bundesbank)
Discussion Papers represent the authors‘ personal opinions and do notnecessarily reflect the views of the Deutsche Bundesbank or its staff.

8/19/2019 Banks and Sovereign Risk. Deutsche Bundesbank 2013
http://slidepdf.com/reader/full/banks-and-sovereign-risk-deutsche-bundesbank-2013 2/48
Editorial Board: Klaus Düllmann
Heinz Herrmann
Mathias Hoffmann
Christoph Memmel
Deutsche Bundesbank, Wilhelm-Epstein-Straße 14, 60431 Frankfurt am Main,
Postfach 10 06 02, 60006 Frankfurt am Main
Tel +49 69 9566-0
Please address all orders in writing to: Deutsche Bundesbank,
Press and Public Relations Division, at the above address or via fax +49 69 9566-3077
Internet http://www.bundesbank.de
Reproduction permitted only if source is stated.
ISBN 978–3–86558–943 – 9 (Printversion)
ISBN 978–3–86558–944 – 6 (Internetversion)

8/19/2019 Banks and Sovereign Risk. Deutsche Bundesbank 2013
http://slidepdf.com/reader/full/banks-and-sovereign-risk-deutsche-bundesbank-2013 3/48
Non-technical summary
The European sovereign debt crisis has shown severe negative feedback loops between
sovereign stress and risk in the banking sector. Typically, banks invest in government
bonds to hold a safe and liquid asset, thus reducing their exposure to adverse liquidity
and asset price shocks. In the crisis, however, sovereign risk spreads have widened
considerably, and the liquidity of markets for government bonds in the European
periphery has become impaired. Markets have increasingly assessed banks’ risk based
on the risk of the sovereign behind these banks.
In this paper, we analyse the link between investments in sovereign bonds and bank
risk from the point of view of German banks. More specifically, we ask how Germanbanks have adjusted their sovereign bond portfolios in response to changes in risk
perceptions and changes in macroeconomic fundamentals. We also ask how investments
in government bonds have affected the risk profile of German banks. To answer these
two questions, we employ detailed bank-level panel data for German banks. We use the
Deutsche Bundesbank’s Securities Holdings Statistics, which provide information on
banks’ holdings of all securities, including sovereign bonds, bank by bank, and security
by security. The data are available on a quarterly basis from the fourth quarter of 2005,
and we use information through the end of 2010.
Our research has three main findings.
First, there is a considerable degree of heterogeneity across banks. Many banks do
not invest in sovereign bonds at all, and the degree of diversification of sovereign bond
portfolios differs across banks as well. Larger and less well-capitalised (and in this
sense riskier) banks and banks with a small depositor base hold more sovereign bonds.
Banks with a large share of liquid assets also invest more in sovereign bonds, butmainly in German bonds.
Second, banks have reacted to changing macroeconomic and risk factors only since
the collapse of Lehman Brothers. Before the financial crisis, banks did not differentiate
much between countries. Since then, banks have restructured their sovereign bond
portfolios according to macroeconomic fundamentals. German banks hold more bonds
from low-risk, low-inflation, and high-yield countries. This is in line with changing risk

8/19/2019 Banks and Sovereign Risk. Deutsche Bundesbank 2013
http://slidepdf.com/reader/full/banks-and-sovereign-risk-deutsche-bundesbank-2013 4/48
perceptions in sovereign bond markets since the financial crisis. It is also in line with
literature on the pricing of sovereign risk which shows an increasin response to
macroeconomic factors since the crisis.
Third, there is only limited evidence for the impact of sovereign bond holdings on bank
risk, measured through the banks’ z-score. Investments in low risk bonds lowered bank
risk of commercial and cooperative banks. Investments in intermediate-risk bonds
lowered bank risk only before the Lehman crisis, but not afterwards.

8/19/2019 Banks and Sovereign Risk. Deutsche Bundesbank 2013
http://slidepdf.com/reader/full/banks-and-sovereign-risk-deutsche-bundesbank-2013 5/48
Nicht-technische Zusammenfassung
Die europäische Schuldenkrise hat schwerwiegende Ansteckungseffekte zwischen dem
Risiko von Staaten und Banken gezeigt. Üblicherweise investieren Banken in
Staatsanleihen, um sichere und liquide Aktiva vorzuhalten, die die Verwundbarkeit
gegenüber negativen Liquiditäts- und Preisschocks verringern. In der Krise weiteten
sich die Risikoaufschläge für Anleihen einiger Staaten jedoch beträchtlich aus, und die
Marktliquidität einiger Staatsanleihen war beeinträchtigt. Die Märkte beurteilen die
Bankenrisiken zunehmend auch vor dem Hintergrund der Solvenzrisiken der Staaten.
In diesem Papier untersuchen wir den Zusammenhang zwischen Investitionen inStaatsanleihen und dem Risiko einer Bank aus dem Blickwinkel der deutschen Banken.
Hierbei stellen wir zum einen die Frage, wie deutsche Banken ihr Staatsanleiheportfolio
als Reaktion auf geänderte makroökonomische Fundamentaldaten und der damit
verbundenen Risiken angepasst haben. Zum anderen untersuchen wir die Frage, wie die
Investitionen in Staatsanleihen das Risikoprofil der deutschen Banken beeinflussen. Wir
beantworten diese zwei Fragen empirisch mithilfe eines detaillierten Mikro-Datensatzes
deutscher Banken, der Statistik über Wertpapierinvestments der Deutschen
Bundesbank. Dieser Datensatz enthält Informationen über die Bestände an einzelnen
Wertpapieren, einschließlich Staatsanleihen, für jede einzelne Bank in Deutschland. Die
Daten liegen quartalsweise ab dem vierten Quartal 2005 bis Ende 2010 vor.
Wir kommen zu drei Hauptergebnissen.
Erstens unterscheiden sich die Investitionsstrategien der Banken deutlich
voneinander. Viele Banken halten gar keine Staatsanleihen und bei den Instituten, die
Staatsanleihen halten, schwankt der Grad der Diversifizierung in den Portfolien.Größere und schwächer kapitalisierte (und in diesem Sinne risikoreichere) Banken und
solche mit einer geringeren Einlagenquote halten mehr Staatsanleihen. Institute mit
einem hohen Anteil an liquiden Aktiva investieren auch mehr in Staatsanleihen,
allerdings überwiegend in deutsche.
Zweitens reagieren die Banken bei der Investition in Staatsanleihen erst seit der
Insolvenz von Lehman Brothers auf Änderungen im makroökonomischen Umfeld und
auf Risikofaktoren. Vor der Finanzkrise unterschieden Banken nicht stark zwischen den

8/19/2019 Banks and Sovereign Risk. Deutsche Bundesbank 2013
http://slidepdf.com/reader/full/banks-and-sovereign-risk-deutsche-bundesbank-2013 6/48
Ländern. Seitdem haben Banken ihre Portfolien jedoch als Reaktion auf
makroökonomische Fundamentaldaten umstrukturiert. Deutsche Banken halten mehr
Anleihen von Ländern mit niedrigem Risiko, niedriger Inflation und hohen Renditen.
Diese Ergebnisse sind im Einklang mit einer geänderten Risikowahrnehmung auf
Staatsanleihemärkten seit der Finanzkrise. Ferner passen sie zu den Ergebnissen über
die Bepreisung der Risiken von Staaten, die eine steigende Reaktion auf
makroökonomische Faktoren zeigen.
Drittens finden wir nur geringe Evidenz für einen Einfluss der Staatsanleihenbestände
auf das Risiko der Bank, gemessen an deren Z -Score. Investitionen in Staatsanleihen
mit geringem Risiko haben das Risiko von Geschäftbanken und Genossenschaftsbankenreduziert. Investitionen in Staatsanleihen mit mittlerem Risiko haben das Bankenrisiko
dagegen nur vor der Finanzkrise reduziert, nicht aber danach.

8/19/2019 Banks and Sovereign Risk. Deutsche Bundesbank 2013
http://slidepdf.com/reader/full/banks-and-sovereign-risk-deutsche-bundesbank-2013 7/48
BANKS AND SOVEREIGN RISK: A GRANULAR VIEW 1
Claudia M. Buch
University of Tübingen, IAW,
CESifo
Michael Koetter
Frankfurt School of Finance and
Management
Jana Ohls
Deutsche Bundesbank
Abstract
In this paper, we use detailed data on the sovereign debt holdings of all German banks
to analyse the determinants of sovereign debt exposures and the implications of
sovereign exposures for bank risk. Our main findings are as follows. First, sovereign
bond holdings are heterogeneous across banks. Larger, weakly capitalised banks and
banks with a small depositor base hold more sovereign bonds. Around 31% of all
German banks hold no sovereign bonds at all. Second, the sensitivity of banks to
macroeconomic factors increased significantly in the post-Lehman period. Banks hold
more bonds from euro area countries, from low-inflation countries, and from countries
with high sovereign bond yields. Third, there has been no marked impact of sovereign
bond holdings on bank risk. This result could indicate the widespread absence ofmarking-to-market for sovereign bond holdings at the onset of the sovereign debt
crisis in Europe.
Keywords: sovereign debt, bank-level heterogeneity, bank risk
JEL classification: G11, G18, G21, G28
1 Corresponding author: Claudia Buch, University of Tübingen, Mohlstrasse 36, 72074 Tübingen,Germany, Tel: +49 7071 2972962. E-mail: [email protected].
This paper was partly written during visits by the authors to the Research Centre of the Deutsche
Bundesbank. The hospitality of the Bundesbank as well as access to its bank-level financial accounts
and Securities Holdings Statistics databases are gratefully acknowledged. Claudia Buch acknowledges
financial support from the Volkswagen Foundation under the project “Europe’s Global Linkages andthe Impact of the Financial Crisis: Policies for Sustainable Trade, Capital Flows, and Migration”. We
would like to thank Marco Pagano Alexander Popov, participants in the Securities Holdings Statistics
workshop at the Deutsche Bundesbank, the doctoral workshop at the Helmut-Schmidt-University, the
SUERF Colloquium, the CREDIT conference and the EMG-ESRC workshop at Cass Business School
for helpful comments and discussions. We are grateful to Markus Amann for assisting in our dataaccess. Daniel Budde has provided most efficient research assistance. Any errors and inconsistenciesare solely our own responsibility. The paper represents the authors’ personal opinions and does not
necessarily reflect the views of the Deutsche Bundesbank or its staff.
Bundesbank Discussion Paper No 29/2013

8/19/2019 Banks and Sovereign Risk. Deutsche Bundesbank 2013
http://slidepdf.com/reader/full/banks-and-sovereign-risk-deutsche-bundesbank-2013 8/48
1 Motivation
The financial crisis revealed the need for an improved understanding of banks’ investments in
sovereign bonds and of the impact of these investments on bank risk. Previous research has
focused on the determinants of sovereign bond spreads or the evolution of CDS spreads, that
is on the pricing of sovereign debt. Research on the determinants of the volume of banks’
sovereign debt exposures and the impact of sovereign bond exposures on risk at banks is more
limited. This is the gap that we fill with this paper.
We employ detailed bank-level panel data from the Deutsche Bundesbank ’s Securities
Holdings Statistics for all German banks to investigate why banks hold sovereign bonds and
how these exposures affect bank risk. These novel micro data provide information on banks’
entire security portfolios, including sovereign bonds, bank by bank, and security by security.
Our data are available on a quarterly basis for the period Q4/2005 through Q4/2010. They
allow analyzing the sovereign risk exposures of all German banks, not only the large banks
covered by the stress tests of the European Banking Authority (EBA). We combine these
sovereign bond portfolio data with detailed bank supervisory and destination-country data.
Our empirical model consists of two main parts. In a first step, we estimate a Heckman
selection model to investigate why banks hold sovereign bonds and, given that they do so,
how much they hold. One stylized fact of the data is that a significant fraction of German
banks, namely 31%, do not hold sovereign bonds at all (in 2010 Q4). The share of
investments in sovereign bonds is 4% of total assets for all German banks, ranging from 2%
for cooperative banks (incl head institutions) to 12% for mortgage banks.
In terms of the bank-level determinants of sovereign debt exposures, larger and less well-
capitalised banks hold more sovereign bonds. Banks with a retail-based business model hold
fewer sovereign bonds. Country characteristics play a role in the investment decisions of
banks as well: German banks hold more bonds from large, low-inflation, and high-yield
countries. German banks hold fewer bonds from countries under an IMF programme.
Importantly, banks have reacted to changing macroeconomic and risk factors only after the
collapse of Lehman Brothers. Since then, we observe a restructuring in sovereign bond
portfolios in response to macroeconomic fundamentals towards the home market.
In a second step, we assess the impact of banks’ investment in sovereign bonds on bank
risk. Using bond exposures directly induces an endogeneity problem. Therefore, we use
predicted bond exposures as a function of destination country-specific macro factors and of
1

8/19/2019 Banks and Sovereign Risk. Deutsche Bundesbank 2013
http://slidepdf.com/reader/full/banks-and-sovereign-risk-deutsche-bundesbank-2013 9/48
bank-specific covariates. These predicted sovereign exposures should be orthogonal to bank
risk. They are measured at the level of each country in which a bank holds sovereign bonds.
Hence, we need to aggregate them across countries in order to obtain a measure of (predicted)
sovereign bond holdings of each bank in each year. The aggregation procedure takes into
account differences in the sovereign’s ratings. Bank risk is measured by banks’ z-scores
calculated from supervisory financial accounts data reported to the Bundesbank . Thus, we are
able to gauge the risk of any German bank, which is an important advantage compared to
market-based measures of risk, which would be limited to the small number of listed German
banks.
Generally, we find little impact from sovereign bond portfolios on bank risk. There are
several explanations for this finding. First, most of our observations cover the period before
the outbreak of the European sovereign debt crisis. Spreads on sovereign bonds from
countries in Europe’s periphery increased in this period, but potential losses on these bonds
had not yet been realised. This also relates to the widespread absence of marking-to-market at
the onset of the European sovereign debt crisis. Second, policy interventions prevented the
spillover of sovereign distress onto banks’ balance sheets. Most importantly, changes in the
collateral requirements for ECB refinancing have allowed banks to maintain access to central
bank liquidity.
We contribute to a growing literature on the link between banks and sovereign risk. The
paper closest to ours is Hildebrand et al (2012) who employ the same database that we use to
analyse the entire security portfolios of banks, not just sovereign bonds. They find that, during
the crisis, banks increased the share of domestic sovereign bonds in their portfolio. This paper
complements their analysis because we control for potential selection bias using the Heckman
model, because we analyse the impact of country-level determinants on sovereign bond
exposures and because we assess the impact on bank risk of these holdings.
Another strand of literature deals with the demand for sovereign bonds. Beber et al (2009)
use data from pre-crisis euro-area sovereign bond markets. They find that credit quality
matters for the valuation of bonds but that liquidity matters for investment decisions in
periods of financial stress. The data do not permit an analysis of the effects of investor
characteristics, which is our focus. Bai et al (2012) study the period since 2006 and find that,
during the early part of the crisis, liquidity risk mattered for bond spreads but, during the later
stages of the crisis, credit risk mattered. De Grauwe and Yi (2012) argue that government
bonds in the euro area were mispriced. Our results are consistent with these findings to the
2

8/19/2019 Banks and Sovereign Risk. Deutsche Bundesbank 2013
http://slidepdf.com/reader/full/banks-and-sovereign-risk-deutsche-bundesbank-2013 10/48
extent that macroeconomic determinants of sovereign bond holdings are statistically
insignificant prior to the Lehman failure, but not thereafter. We complement these studies by
analysing volume rather than price effects and by controlling for investor (bank)
characteristics.
Acharya and Steffen (2013) use stock price data and EBA stress test data to analyse the
sovereign bond holdings of banks. They find that Euro Area banks engage in carry trades by
borrowing money at low interest rates and by investing in high-yield sovereign bonds. In line
with our results, they also find that large banks, banks with higher short-term debt, and
weakly capitalised banks are more active in these trades. Battistini et al (2013) use the EBA
stress test data to study the home bias in banks’ sovereign portfolios. They find that Euro
periphery banks increase their domestic sovereign exposure when idiosyncratic sovereign risk
rises, while banks from core countries do not. Battistini et al (2013) interpret this as evidence
for moral suasion by governments or carry trade behaviour of Euro periphery banks. Banks
from core as well as from periphery countries increase their home bias if common sovereign
risk increases (Battistini et al, 2013). In contrast to previous papers, our study includes all
German banks, not only the larger or listed banks, and we use information on the sovereign
bond exposure to all OECD countries. Furthermore, our study sheds light on the impact of
sovereign bond exposures on bank risk.
This relationship between bond holdings and bank risk presents important ramifications for
policy purposes. But only a few previous studies analyse the impact of sovereign risk on
banks’ credit default swaps (CDS) at fairly aggregate levels. Acharya et al (2011) analyse the
two-way feedback between sovereign and financial sector risk using data on bank CDS for the
euro-area countries. For the years 2007-2010, they find that announcements of financial sector
bailouts affected sovereign CDS spreads and narrowed bank CDS spreads. After the bailouts
took place, bank and sovereign risk co-moved. While they focus on banks in the crisis
countries, we study investments in sovereign bonds by German banks.
Angeloni and Wolff (2012) analyse the impact of sovereign bond holdings on banks’ share
prices using data provided by the European Banking Authority (EBA). They find that the
effects of banks’ sovereign debt holdings vary depending on the period: Greek sovereign debt
affected banks’ market values between July and October 2011 but not after October 2011.
Their study differs from ours because the EBA stress test data provide cross-sectional
information only for a small number of large European banks, whereas we use panel
information for all German banks.
3

8/19/2019 Banks and Sovereign Risk. Deutsche Bundesbank 2013
http://slidepdf.com/reader/full/banks-and-sovereign-risk-deutsche-bundesbank-2013 11/48
Our empirical model is motivated by theoretical work which leads us to expect that banks
invest in (safe) assets like sovereign bonds in order to diversify risk. Modelling banks as
portfolio managers, who optimise banks’ expected utility as a positive function of expected
profits and a negative function of expected portfolio risk, has a relatively long tradition in the
banking literature (Rochet 2008). One assumption of many portfolio models is the presence of
a risk-free asset, which is used as a pricing benchmark for all risky assets. This would imply
that all banks should hold at least some sovereign debt, which is not what we find.
Recent literature has discussed alternative reasons for banks to invest in sovereign bonds.
Bolton and Jeanne (2011) stress the importance of sovereign bonds as collateral for interbank
refinancing. According to their model, the banking sector reallocates savings from banks with
investment opportunities to banks without such opportunities. This reallocation is facilitated
via the interbank market, and interbank loans are collateralised by sovereign debt. The model
shows that banks hold a diversified portfolio of sovereign debt, and differences in sovereign
risk are reflected in the pricing of sovereign bonds. Our empirical results confirm this
prediction: banks with a heavier reliance on wholesale funding hold more sovereign bonds,
and macroeconomic factors matter for the investment decisions of banks (albeit in crisis times
only). A complementary mechanism for banks’ holdings of sovereign debt is stressed in
Gennaioli et al (2013). In their model, banks hold sovereign bonds to generate liquidity. In
both models, a deterioration of sovereign bond markets and an increase in the probability of
sovereign default have a negative impact on the lending capacity of banks. Again, we confirm
the prediction of the model in the sense that banks with a greater need for liquidity hold more
sovereign bonds.
The remainder of the paper is structured as follows. In section 2, we present the data and
descriptive statistics for German banks’ sovereign bond holdings. In section 3, we turn to our
first research question by analysing the determinants of banks’ investments in sovereign
bonds. In section 4, we analyse the impact of these sovereign bond holdings on bank risk.
Section 5 concludes.
2 Securities holdings of German banks
2.1 The data
The Securities Holdings Statistics of the Deutsche Bundesbank are a unique micro dataset
providing detailed information on banks’ investments in marketable securities (Amann et al
2011). Each bank located in Germany reports its entire securities portfolio including
4
8/19/2019 Banks and Sovereign Risk. Deutsche Bundesbank 2013
http://slidepdf.com/reader/full/banks-and-sovereign-risk-deutsche-bundesbank-2013 12/48
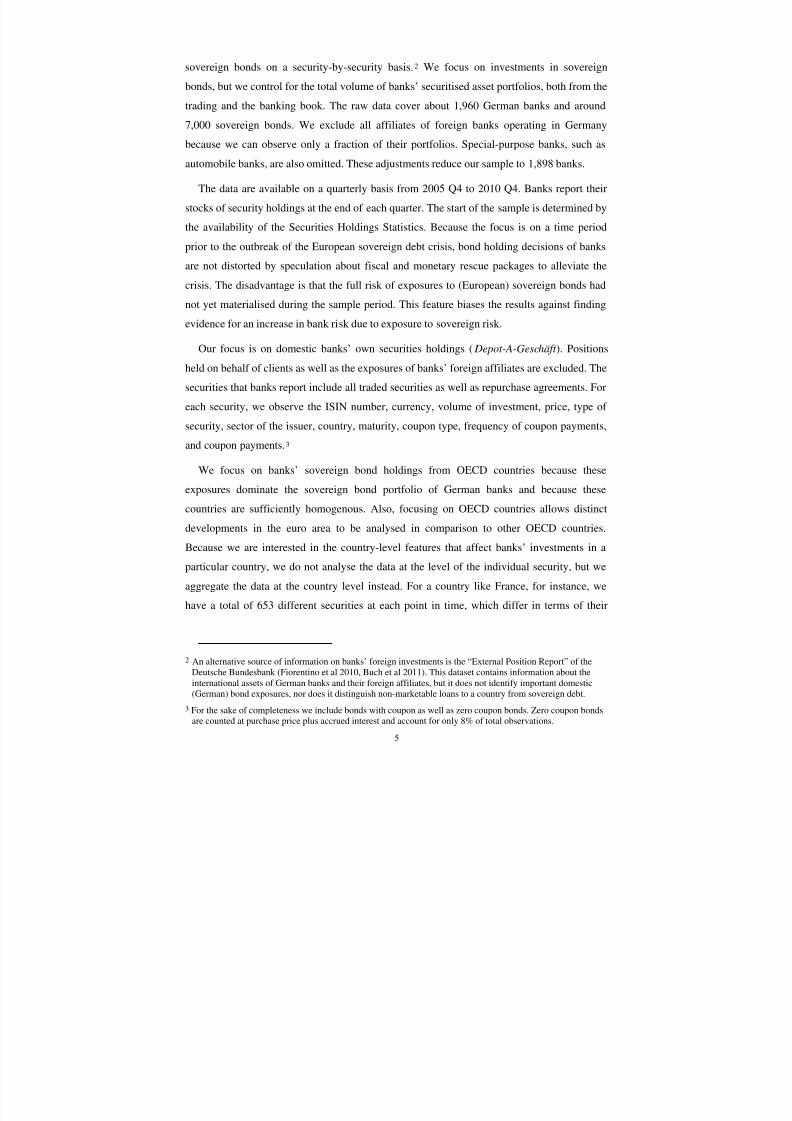
sovereign bonds on a security-by-security basis.2 We focus on investments in sovereign
bonds, but we control for the total volume of banks’ securitised asset portfolios, both from the
trading and the banking book. The raw data cover about 1,960 German banks and around
7,000 sovereign bonds. We exclude all affiliates of foreign banks operating in Germany
because we can observe only a fraction of their portfolios. Special-purpose banks, such as
automobile banks, are also omitted. These adjustments reduce our sample to 1,898 banks.
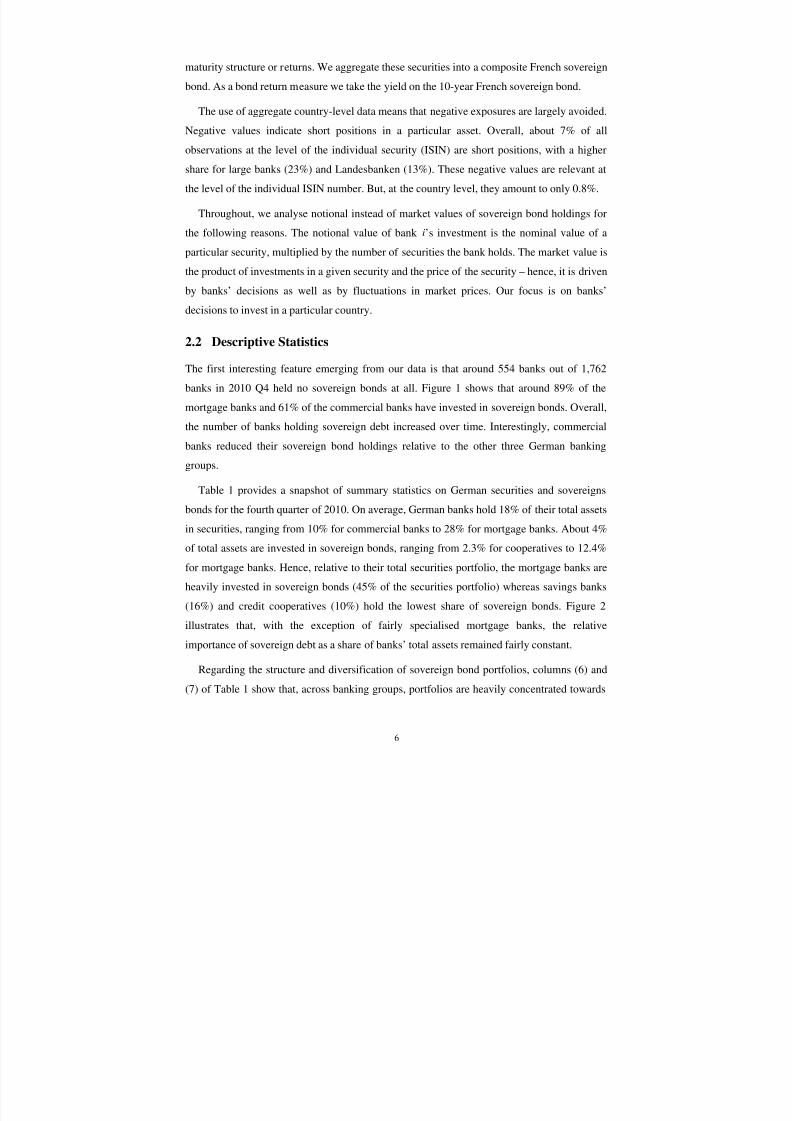
The data are available on a quarterly basis from 2005 Q4 to 2010 Q4. Banks report their
stocks of security holdings at the end of each quarter. The start of the sample is determined by
the availability of the Securities Holdings Statistics. Because the focus is on a time period
prior to the outbreak of the European sovereign debt crisis, bond holding decisions of banks
are not distorted by speculation about fiscal and monetary rescue packages to alleviate the
crisis. The disadvantage is that the full risk of exposures to (European) sovereign bonds had
not yet materialised during the sample period. This feature biases the results against finding
evidence for an increase in bank risk due to exposure to sovereign risk.
Our focus is on domestic banks’ own securities holdings ( Depot-A-Geschäft ). Positions
held on behalf of clients as well as the exposures of banks’ foreign affiliates are excluded. The
securities that banks report include all traded securities as well as repurchase agreements. For
each security, we observe the ISIN number, currency, volume of investment, price, type of
security, sector of the issuer, country, maturity, coupon type, frequency of coupon payments,
and coupon payments.3
We focus on banks’ sovereign bond holdings from OECD countries because these
exposures dominate the sovereign bond portfolio of German banks and because these
countries are sufficiently homogenous. Also, focusing on OECD countries allows distinct
developments in the euro area to be analysed in comparison to other OECD countries.
Because we are interested in the country-level features that affect banks’ investments in a
particular country, we do not analyse the data at the level of the individual security, but we
aggregate the data at the country level instead. For a country like France, for instance, we
have a total of 653 different securities at each point in time, which differ in terms of their
2 An alternative source of information on banks’ foreign investments is the “External Position Report” of the
Deutsche Bundesbank (Fiorentino et al 2010, Buch et al 2011). This dataset contains information about the
international assets of German banks and their foreign affiliates, but it does not identify important domestic
(German) bond exposures, nor does it distinguish non-marketable loans to a country from sovereign debt. 3 For the sake of completeness we include bonds with coupon as well as zero coupon bonds. Zero coupon bonds
are counted at purchase price plus accrued interest and account for only 8% of total observations.
5
8/19/2019 Banks and Sovereign Risk. Deutsche Bundesbank 2013
http://slidepdf.com/reader/full/banks-and-sovereign-risk-deutsche-bundesbank-2013 13/48
maturity structure or returns. We aggregate these securities into a composite French sovereign
bond. As a bond return measure we take the yield on the 10-year French sovereign bond.
The use of aggregate country-level data means that negative exposures are largely avoided.
Negative values indicate short positions in a particular asset. Overall, about 7% of all
observations at the level of the individual security (ISIN) are short positions, with a higher
share for large banks (23%) and Landesbanken (13%). These negative values are relevant at
the level of the individual ISIN number. But, at the country level, they amount to only 0.8%.
Throughout, we analyse notional instead of market values of sovereign bond holdings for
the following reasons. The notional value of bank i’s investment is the nominal value of a
particular security, multiplied by the number of securities the bank holds. The market value is
the product of investments in a given security and the price of the security – hence, it is drivenby banks’ decisions as well as by fluctuations in market prices. Our focus is on banks’
decisions to invest in a particular country.
2.2
Descriptive Statistics
The first interesting feature emerging from our data is that around 554 banks out of 1,762
banks in 2010 Q4 held no sovereign bonds at all. Figure 1 shows that around 89% of the
mortgage banks and 61% of the commercial banks have invested in sovereign bonds. Overall,
the number of banks holding sovereign debt increased over time. Interestingly, commercial
banks reduced their sovereign bond holdings relative to the other three German banking
groups.
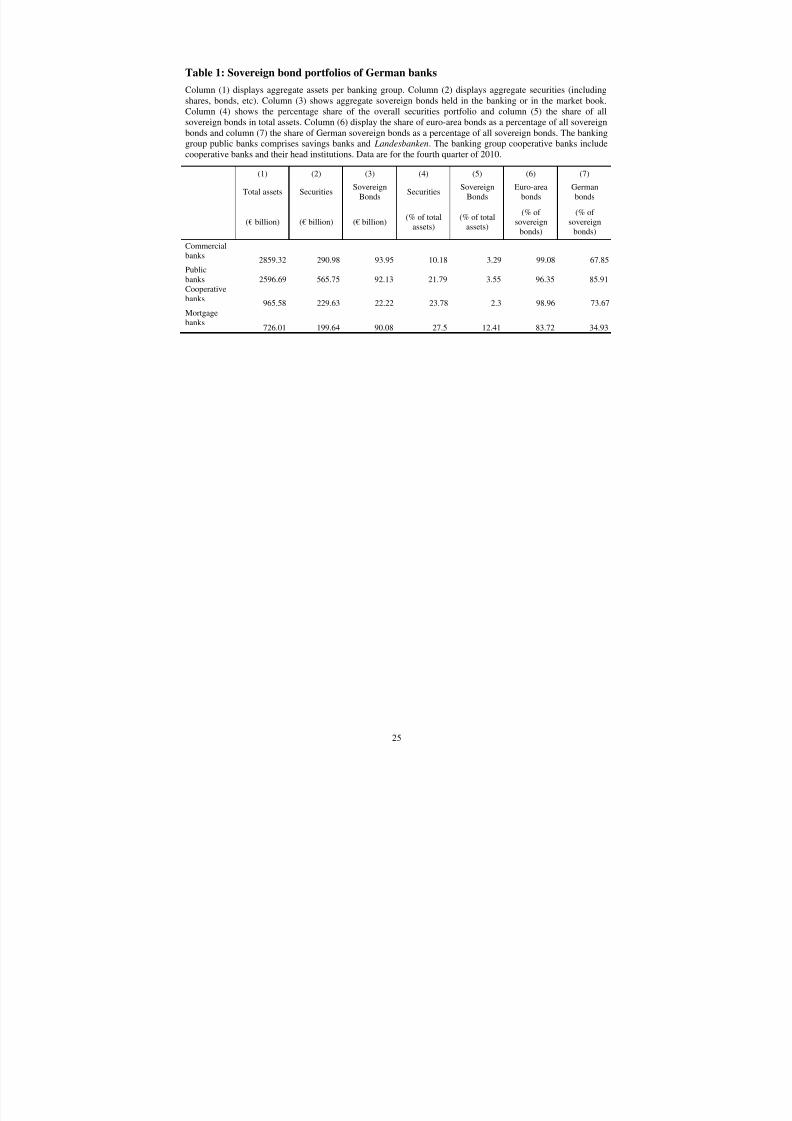
Table 1 provides a snapshot of summary statistics on German securities and sovereigns
bonds for the fourth quarter of 2010. On average, German banks hold 18% of their total assets
in securities, ranging from 10% for commercial banks to 28% for mortgage banks. About 4%
of total assets are invested in sovereign bonds, ranging from 2.3% for cooperatives to 12.4%
for mortgage banks. Hence, relative to their total securities portfolio, the mortgage banks are
heavily invested in sovereign bonds (45% of the securities portfolio) whereas savings banks
(16%) and credit cooperatives (10%) hold the lowest share of sovereign bonds. Figure 2
illustrates that, with the exception of fairly specialised mortgage banks, the relative
importance of sovereign debt as a share of banks’ total assets remained fairly constant.
Regarding the structure and diversification of sovereign bond portfolios, columns (6) and
(7) of Table 1 show that, across banking groups, portfolios are heavily concentrated towards
6

8/19/2019 Banks and Sovereign Risk. Deutsche Bundesbank 2013
http://slidepdf.com/reader/full/banks-and-sovereign-risk-deutsche-bundesbank-2013 14/48
Germany and the euro area and.4 The share of bonds held in the euro area ranges from 84%
(mortgage banks) to 99% (commercial banks), the share invested in Germany ranges from
35% (mortgage banks) to over 80% for public banks in 2010 Q4. Hence, mortgage banks hold
the most diversified sovereign bond portfolios. In terms of the number of countries where the
average bank invests, Figure 3 confirms that German banks differ considerably. Whereas
mortgage banks’ sovereign bond portfolios are quite diversified with asset holdings in 10 to
12 countries on average, the average number of country exposures ranges between 1
(cooperatives) and 4 (commercial banks) over time.5 Note, however, that the five largest
(commercial) banks hold sovereign bonds in 25 countries on average. Thus, sheer size seems
to be an important determinant for diversification strategies. Figure 4 illustrates the evolution
of aggregate German bank exposures to selected countries over time. Whereas German bonds
dominate by far, the evolution over time puts the snapshot results from Table 1 into
perspective. Especially after the fall of Lehman in 2008 Q3, we observe a steep increase in
German bond holdings and, to a lesser extent, in French bonds. This increase is accompanied
by continuously declining positions vis-à-vis distressed euro-area peripheral countries, which
was amplified after the outbreak of the sovereign debt crisis in the second quarter of 2010.
Thus, the data strongly suggest a home bias pattern to holding sovereign bonds, which is
consistent with the “flight to safety” effect documented by Hildebrand et al (2012).
In sum, the descriptive statistics reveal a couple of interesting patterns in the data. First, a
significant fraction of German banks do not invest in sovereign bonds at all. Second, with 4%
of the total, sovereign bonds account for a relatively small share of banks’ total assets. Third,
sovereign bond portfolios in particular for smaller banks are not very diversified, and a high
share is held in euro-area bonds.
3 Why do banks hold sovereign bonds?
In the remainder of this paper, we combine information on German banks’ sovereign
portfolios with country-level and bank-level information to answer two questions. First, what
are the determinants of banks’ investments in sovereign bonds? Because not all German
banks hold sovereign bonds, we need to account for selection bias in a Heckman-type model.
The decisions as to whether to hold bonds from a particular country and to what extent to hold
4 Although portfolios are dominated by German bonds, our main results are unaffected when excluding Germanbonds from the regressions.
5 Note that if we exclude banks that hold no sovereign debt at all, the average number of countries rises by one.
7

8/19/2019 Banks and Sovereign Risk. Deutsche Bundesbank 2013
http://slidepdf.com/reader/full/banks-and-sovereign-risk-deutsche-bundesbank-2013 15/48
them may not be independent. Second, what is the impact of sovereign bond holdings on
banks risk? We will use predicted values of sovereign bond holdings from the Heckman
model to answer this question in section 4.
3.1
Estimation strategy
We model the banks’ decision whether to invest in government bonds and what volume of
bonds to hold through a Heckman (1979) selection model. First, we model whether a bank i
holds sovereign bonds of country j in period q (extensive margin, EXP). Second, we explain
the size of exposures in terms of the euro volume of sovereign bonds (intensive margin, SOV ).
The empirical specification is given by the selection equation (1) and the outcome equation
(2):
Pr 1 Φ ′
′ (1)
′
′ (2)
In the selection equation (1), EXPijq is an indicator variable equal to 1 if bank i (1,772
banks) holds sovereign bonds of a specific country j (30 countries) in time period q (quarterly
data from 2005 Q4 to 2010 Q4) and 0 otherwise. The total estimation sample comprises
1,087,164 bank-quarter-country observations. Φ(.) is the standard normal distribution
function, X iq-4 are bank-specific, and X jq are country-specific control variables. We include
fixed effects for banking group, quarter and country (α 1g, α 1j, α 1t ) in equation (1). In the
outcome equation (2), we include fixed effects for bank, quarter and country. We specify
fixed effects for banking group instead of bank in selection equation (1) to avoid the
incidental parameters problem in Probit estimations. Bank-specific variables are lagged by
four quarters to alleviate simultaneity concerns. Country-specific variables enter the equations
contemporaneously.
Identification would ideally hinge on a variable that represents a valid exclusion
restriction, i.e. variables W that correlate only with the likelihood of bond holdings in a given
country in a given quarter but not the volume of such an exposure. As no quantitative
restrictions on specific sovereign bond exposures prevail and as existing regulations may
affect both the extensive and the intensive margin, we cannot specify such variables W .
Therefore, the model is identified based on functional form. Based on the predicted likelihood
of observing an exposure of bank i in country j at time q, we then calculate the inverse Mills
8

8/19/2019 Banks and Sovereign Risk. Deutsche Bundesbank 2013
http://slidepdf.com/reader/full/banks-and-sovereign-risk-deutsche-bundesbank-2013 16/48
ratio ( IMR). Together with the same bank-specific and country-specific control variables ( X iq
and X jq) and the fixed effects, the IMR is specified in the outcome equation (2) to explain
differences across banks’ observed sovereign debt exposure levels (SOV ). The coefficient η
indicates whether significant self-selection bias of banks into holding sovereign bonds
prevails.
To specify equations (1) and (2), we combine three data sources: the Securities Holdings
Statistics of the Deutsche Bundesbank , bank-level data from the supervisory department of
the Deutsche Bundesbank , and destination country characteristics from public data sources
such as Bloomberg, MarkIT, the OECD, and the Centralised Securities Database (CSDB).
Detailed data definitions are given in the Appendix.
3.2
Country-level macro data
We complement the Securities Holdings Statistics with country-level information drawn from
the CSDB, Bloomberg, MarkIT, and the OECD. The country-level variables can be grouped
into variables measuring market size, returns, and risk. We expect that banks will invest more
in larger markets, in markets with higher expected returns, and in those exhibiting lower risk.
Table 2 presents descriptive statistics for country-level variables at the bank-country-
quarter level of the analysis. The data are shown in two panels that pertain to the selection and
the outcome equation of the Heckman model, respectively. The left-hand panel contains
1,087,164 complete bank-country-quarter observations where a considerable portion of
observations are zero because banks i held no bonds of country j at time q.6 The right-hand
panel shows the sample with non-zero sovereign bond holdings. These data comprise 46,981
bank-country-quarter observations, corroborating the potential self-selection of banks into
holding sovereign debt. At any point in time German banks hold sovereign bonds in only 4%
of all destinations. The average volume of sovereign bonds in the regression sample is €90
million.
To measure market size, we use the log of a country’s GDP. Data are in constant prices as
of the year 2005 and are seasonally adjusted.
Country risk is captured by two variables. First, we include the central government debt to
GDP ratio to measure the indebtedness of a country. We interpolate quarterly data from the
6 The fully expanded dataset is even larger (1,364,440 bank-country-quarter observations), but it contains
observations for which we have incomplete information on key covariates. The structure of the fully expandedsample and of the data used in the regressions is very similar though.
9

8/19/2019 Banks and Sovereign Risk. Deutsche Bundesbank 2013
http://slidepdf.com/reader/full/banks-and-sovereign-risk-deutsche-bundesbank-2013 17/48
annual series provided. Second, we include an indicator variable for whether a country
participated in a support programme of the International Monetary Fund (IMF). These data
are obtained from the homepage of the IMF and include Extended Fund Facilities, Extended
Arrangements, and Stand-by-Arrangements. This indicator equals one from the start dates of
IMF programmes.7 We expect a negative impact from the risk variables on banks’ investment
decisions in sovereign bonds.
Finally, there are several regulatory incentives for banks to hold sovereign debt in their
portfolios. We include an indicator variable equal to one for member countries of the
European Monetary Union (EMU) because prudential regulation in Europe favours banks’
investments in sovereign debt issued by euro-area governments. Sovereign bonds
denominated in the home currency need not be backed by equity capital under the (current)
regulatory framework. This favourable treatment of sovereign bonds will be maintained under
the Basel III regime to be transposed into European law.8 Also, investments in sovereign
bonds are exempt from large exposure rules.
3.3 Bank-level supervisory data
We use financial data reported to the supervisory department of the Deutsche Bundesbank to
generate bank-specific control variables. The variables capture size effects (total assets), the
structure of assets (cash and overnight / total assets, customer loans / total loans, securities
portfolio / total assets), the funding structure (core capital / total assets, retail deposits / total
assets), profitability (return on equity), efficiency and managerial skill (cost-to-income ratio),
and the income structure (fee over interest income). Table 3 shows these data for both the
selection equation (left-hand panel) and for the outcome equations (right-hand panel). Total
assets and the funding structure are observed quarterly. Other bank variables are available
annually, and we interpolate quarterly data in the sovereign bond holdings regressions.
7 These countries are Greece (2010 Q2), Hungary (2008 Q2), Mexico (2008 Q2), and Ireland (2010 Q4). We
also tested robustness for alternative country risk proxies, namely rating downgrades (averaged over Moody’s,
Fitch, and Standard and Poor’s) and CDS spreads. Multicollinearity prohibited simultaneous specification of
these proxies, but the results remained qualitatively unaffected and are available upon request.
8 See Brussels, 20 July 2011, COM(2011) 452 final, 2011/0202 (COD), Proposal for a Regulation of the
European Parliament and of the Council on prudential requirements for credit institutions and investmentfirms, Article 109(4): “Exposures to Member States' central governments and central banks denominated and
funded in the domestic currency of that central government and central bank shall be assigned a risk weight of0%.”
10

8/19/2019 Banks and Sovereign Risk. Deutsche Bundesbank 2013
http://slidepdf.com/reader/full/banks-and-sovereign-risk-deutsche-bundesbank-2013 18/48
3.4 Baseline estimation results
Column (1) in Table 4 shows the determinants of banks’ sovereign bond holdings (intensive
margin) and column (2) presents the results for the selection equation from the Heckman
model. Column (3) provides marginal effects for the extensive margin.
The inverse Mills ratio in column (1) is significant at the 1% level, suggesting that the
choice as to whether to invest in a particular market also affects the decision on the volume of
investment. Our model explains the sovereign bond holdings of banks well. The adjusted R²
of the outcome equation in Table 4 equals 0.74. If we exclude fixed effects for bank, time and
country (unreported), the adjusted R² still amounts to 0.55.
Country-level variables exert a significant impact on sovereign bond holdings, both for the
extensive and the intensive margin. The signs of these effects are in line with expectations for
most variables: sovereign bond exposures are higher for large countries, countries with low
inflation and high government bond yields, and for countries in the euro area. The positive
euro-area effect is due to the absence of exchange rate risk and the preferential treatment of
sovereign bonds from these countries in the prudential regulation of banks, and the eligibility
for ECB refinancing. Banks withdraw from countries that are covered by an IMF programme.
Contrary to expectations, banks are more likely to hold sovereign debt from a country with
high debt-to-GDP ratios. This may reflect the (benign) neglect of some important macro
indicators because the market deemed the no-bail-out clause to lack credibility.
To interpret the size of the parameters in the equation for the extensive margin, we
calculate average marginal effects from the underlying Probit model. The economic
significances reflected by marginal effects reported in column (3) of Table 4 indicate that
country covariates are more important than bank covariates: an increase in the sovereign bond
yield by one percentage point increases the probability of being invested in that sovereign
bond by 35%. If a country is a member of the euro area, the probability that a bank will invest
in that country is about 2% higher than for a non-euro-area country.
In the lower panel of Table 4, we find that sovereign bond investments are higher for larger
banks, banks with a large securities portfolio, and banks with lower capital relative to total
assets. These results are in line with Acharya and Steffen (2013), who find that larger banks
and banks with low capital ratios invest more in sovereign bonds. The negative impact of the
capital ratio could reflect a risk effect: banks with low capital buffers should be inclined to
invest more in presumably safe assets. The positive effect of asset size could reflect a scaling
effect, in particular for the intensive margin. A complementary explanation suggested by
11

8/19/2019 Banks and Sovereign Risk. Deutsche Bundesbank 2013
http://slidepdf.com/reader/full/banks-and-sovereign-risk-deutsche-bundesbank-2013 19/48
Acharya and Steffen (2013) is that larger banks are more likely to be rescued and thus hold
more (risky) sovereign bonds of crisis countries.
Banks with a larger share of liquid assets (i.e. cash and overnight assets) also invest more
in sovereign bonds. This indicates that sovereign bonds are not used as a substitute for other
liquid assets but rather as an additional source of liquidity. Banks with a high share of retail
deposits invest less in sovereign bonds, presumably because they have a more stable funding
base and smaller liquidity needs than banks with a business model geared towards wholesale
funding. Furthermore, sovereign bonds are an important source of collateral to obtain
interbank funding, and thus sovereign bonds play a larger role for wholesale-oriented banks.
The negative impact of the customer loan and retail deposit share suggests that banks with a
retail business model invest less in sovereign bonds.
Finally, we include three dummies to capture the crisis. The first, which equals one for the
period following August 2007 and thus captures the first concerted liquidity provision by
central banks, is negative and significant. The second, which equals one for the period
following the Lehman default in September 2008, is positive and significant. The final
indicator that marks the start of the European sovereign debt crisis manifested by the debt
restructuring of Greece in the second quarter of 2010 is insignificant.
3.5
Sovereign bond holdings before and after Lehman
The result that macroeconomic variables have a considerable effect on banks’ sovereign bond
holdings and that these variables exhibit, by and large, the expected effects might seem at
odds with previous literature that reports considerable mispricing of sovereign bonds. This
literature finds that the determinants of sovereign yield spreads vary considerably over time.
Therefore, we split the sample into the pre- and post-Lehman period to test whether the
volume of banks’ sovereign bond holdings reacted differently to macroeconomic
fundamentals after the increased uncertainty in financial markets due to the Lehman collapse.
Table 5 highlights that macroeconomic factors had almost no impact on banks’ sovereign
bond investments in the period 2005 Q4 to 2008 Q2. Results reported in Table 4 for the full
sample are thus entirely driven by the post-Lehman period (2008 Q3 to 2010 Q4). This result
provides evidence of active restructuring of banks’ sovereign debt portfolios after the fall of
Lehman. It is in line with previous literature on the determinants of sovereign bond spreads
for the euro-area countries, which attributes little explanatory power to macroeconomic
factors before the crisis but considerable – and perhaps excessive – responses during the crisis
12
8/19/2019 Banks and Sovereign Risk. Deutsche Bundesbank 2013
http://slidepdf.com/reader/full/banks-and-sovereign-risk-deutsche-bundesbank-2013 20/48
(de Grauw and Ji, 2012). Our data allow the origins of these differences to be traced to bank-
level investments in sovereign bonds and shows that portfolio restructuring was largely
guided by macroeconomic fundamentals. Alternatively, we can split our sample already in
2007 Q3, when the first money market strains occurred. Results remain very similar.
In sum, before the collapse of Lehman Brothers, banks were not discriminating much
between countries on grounds of macro fundamentals. This finding is in line with a change in
the role of sovereign bonds as risk-free assets. The qualitative effects of the bank-level
determinants of sovereign bond investments did not change much over time.
3.6 Sample splits by type of bank
Next, we investigate whether the insensitivity to macroeconomic factors before the crisis is
driven by specific banking groups (Table 6). We estimate our model separately for privately
owned universal commercial and cooperative banks, government-owned regional savings
banks as well as head institutions (Landesbanken), and specialised mortgage banks. The
upshot from the results in Table 6 is the similarity of results. Bank characteristics have a
qualitatively similar impact for all banking groups. Capitalisation, size and liquid assets play
similar roles.
At the same time, the data show that the changing responsiveness of banks to
macroeconomic factors is a feature of the savings banks and, to an even greater extent, of the
cooperative banking sector. Commercial banks (and to a lesser degree mortgage banks) react
less to macroeconomic fundamentals, and they did not change their lack of responsiveness to
macroeconomic factors after the Lehman bankruptcy. For commercial banks’ and mortgage
banks’ sovereign debt holdings, neither IMF measures nor the euro-area dummy are
significant. The savings banks and the cooperative banks, in contrast, invested significantly
less in countries covered by an IMF programme after the crisis. Also, the euro-area dummy is
positive and significant for these banking groups. For the cooperatives, it turns positive and
significant after the Lehman crisis. This is primarily driven by investments in German
sovereign bonds and not in bonds of European crisis countries as indicated by further tests.9
9 These results are not reported but available upon request.
13

8/19/2019 Banks and Sovereign Risk. Deutsche Bundesbank 2013
http://slidepdf.com/reader/full/banks-and-sovereign-risk-deutsche-bundesbank-2013 21/48
3.7 Sample splits by issuer of sovereign bonds
We also estimate the Heckman model for non-euro-area bonds, euro-area bonds, euro-area
crisis countries (Greece, Ireland, Portugal, Spain, and Italy) and German bonds separately
(Table 7). Whereas most covariates have a similar impact, there are two key differences wewant to highlight.
First, the impact of the financial crisis differs between types of sovereign bonds. As
expected, banks held more German bonds after the collapse of Lehman but they withdrew
from the countries affected by the European sovereign debt crisis. For euro-area bonds, the
flight to Germany predominates. Interestingly, the outbreak of the sovereign debt crisis in
2010 Q2 has no additional impact once we control for the collapse of Lehman Brothers. The
flight into euro-area bonds after Lehman exceeded the initial withdrawal from these bondsafter the first money market strains in August 2007. The holdings of non-euro-area sovereigns
by German banks, however, increased from the beginning of the financial crisis in August
2007.
Second, euro-area members affected by the recent sovereign debt crisis seem to play a
special role. In contrast to bonds issued by other sovereigns, banks hold more euro peripheral
bonds when government bond yields are low, when bank capitalisation is high, and when the
share of liquid assets of the bank is low. The government bond yield finding might reflect the
fact that higher yields are associated with higher risk. Higher capitalisation reflects higher risk
bearing capacity and might therefore be associated with higher holdings of relatively risky
sovereign bonds.
3.8
Additional robustness tests
We performed various tests to check the robustness of our results. The following results are
not reported here but are available upon request. Our main results regarding the impact ofcountry and bank variables and the change in importance of country characteristics following
the collapse of Lehman Brothers are very robust.
First, we verified that our results are not driven by German bonds, which constitute a very
large share in banks’ portfolios. Excluding German bonds from the regressions does not
change the outcome in qualitative terms.
Second, we relaxed the assumption that banks react to macroeconomic changes
immediately. Like bank-specific covariates, we also lag the macro country variables by four
quarters. Results remain qualitatively the same.
14

8/19/2019 Banks and Sovereign Risk. Deutsche Bundesbank 2013
http://slidepdf.com/reader/full/banks-and-sovereign-risk-deutsche-bundesbank-2013 22/48
Third, we checked the importance of outliers and winsorised all covariates at the 1% and
99% quantile. The results of the Heckman estimation remain the same.
Fourth, we excluded the observations in 2005 Q4 to 2007 Q1to ensure that results were not
influenced by potential data issues in the starting phase of the Securities Holdings Statistics in
2006. Our results remain the same.
Fifth, we used market instead of notional values of sovereign bond holdings to address
concerns that banks might manage the former rather than the latter. Our results remain very
robust.
Sixth, one advantage of the Securities Holdings Statistics is that we can use information at
the level of the individual security. We thus estimate our baseline Heckman model from
Table 4 distinguishing between short-term and long-term bonds. To this end we aggregate the
sovereign bond holdings per country for three maturity bands separately: bonds with a
maturity of less than 5 years, with a maturity of between 5 and 15 years and with a maturity of
more than 15 years. Results are qualitatively very similar between short, intermediate, and
long-term bonds. Hence, macroeconomic variables seem to have the same qualitative impact
on all maturities. Another interesting security characteristic is the eligibility for refinancing
operations with the Eurosystem. We split the sample into eligible and non-eligible sovereign
bonds. Most variables turn out to have a similar impact. The main difference is that bankswithdrew from non-eligible sovereign bonds after the fall of Lehman Brothers and invested
more into eligible sovereign bonds. This might indicate that the liquidity quality of sovereign
bonds, which is stronger for bonds that can be used to obtain central bank funding, has played
a greater role since the outbreak of the financial crisis.
4 Do sovereign debt exposures affect bank risk?
4.1
Estimation strategy
The second main research question is how banks’ sovereign bond holdings affect bank risk.
To this end, we estimate a fixed effects model for a panel of 1,359 banks over 5 years. Only
banks that hold sovereign bonds are included. We aggregate predicted sovereign positions,
thus eliminating the country dimension from our data. We measure bank risk by z-scores
it zscore , which are described below, and estimate:
!" " " $%&" (3)
15
8/19/2019 Banks and Sovereign Risk. Deutsche Bundesbank 2013
http://slidepdf.com/reader/full/banks-and-sovereign-risk-deutsche-bundesbank-2013 23/48
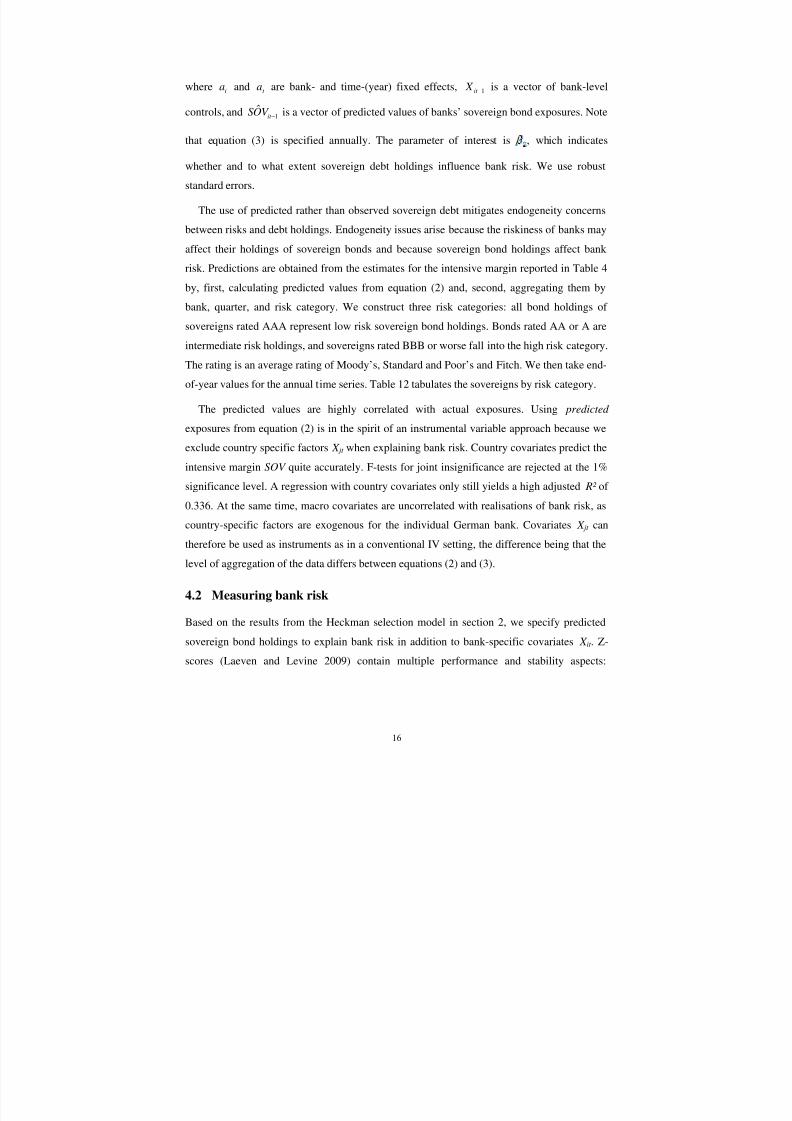
where ia and t a are bank- and time-(year) fixed effects, 1−it X is a vector of bank-level
controls, and 1ˆ
−it V OS is a vector of predicted values of banks’ sovereign bond exposures. Note
that equation (3) is specified annually. The parameter of interest is , which indicates
whether and to what extent sovereign debt holdings influence bank risk. We use robust
standard errors.
The use of predicted rather than observed sovereign debt mitigates endogeneity concerns
between risks and debt holdings. Endogeneity issues arise because the riskiness of banks may
affect their holdings of sovereign bonds and because sovereign bond holdings affect bank
risk. Predictions are obtained from the estimates for the intensive margin reported in Table 4
by, first, calculating predicted values from equation (2) and, second, aggregating them by
bank, quarter, and risk category. We construct three risk categories: all bond holdings of
sovereigns rated AAA represent low risk sovereign bond holdings. Bonds rated AA or A are
intermediate risk holdings, and sovereigns rated BBB or worse fall into the high risk category.
The rating is an average rating of Moody’s, Standard and Poor’s and Fitch. We then take end-
of-year values for the annual time series. Table 12 tabulates the sovereigns by risk category.
The predicted values are highly correlated with actual exposures. Using predicted
exposures from equation (2) is in the spirit of an instrumental variable approach because we
exclude country specific factors X jt when explaining bank risk. Country covariates predict the
intensive margin SOV quite accurately. F-tests for joint insignificance are rejected at the 1%
significance level. A regression with country covariates only still yields a high adjusted R² of
0.336. At the same time, macro covariates are uncorrelated with realisations of bank risk, as
country-specific factors are exogenous for the individual German bank. Covariates X jt can
therefore be used as instruments as in a conventional IV setting, the difference being that the
level of aggregation of the data differs between equations (2) and (3).
4.2
Measuring bank risk
Based on the results from the Heckman selection model in section 2, we specify predicted
sovereign bond holdings to explain bank risk in addition to bank-specific covariates X it . Z-
scores (Laeven and Levine 2009) contain multiple performance and stability aspects:
16
8/19/2019 Banks and Sovereign Risk. Deutsche Bundesbank 2013
http://slidepdf.com/reader/full/banks-and-sovereign-risk-deutsche-bundesbank-2013 24/48
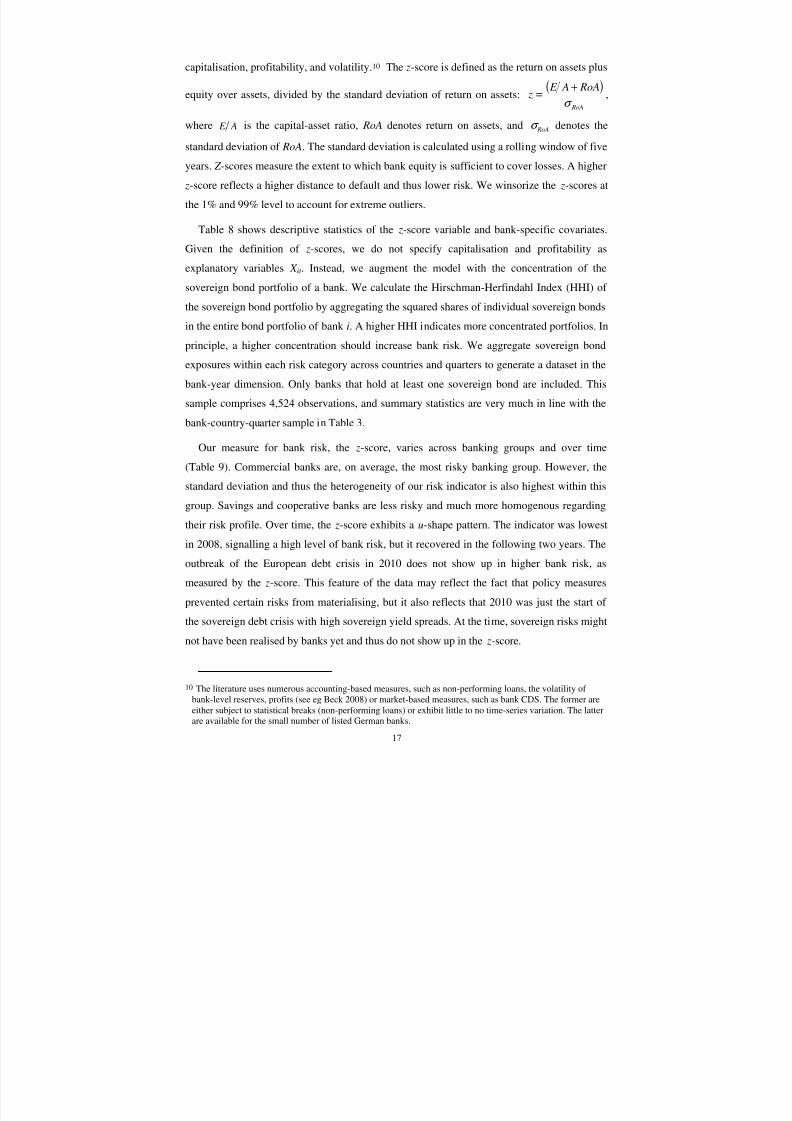
capitalisation, profitability, and volatility.10 The z-score is defined as the return on assets plus
equity over assets, divided by the standard deviation of return on assets:( )
RoA
RoA A E z
σ
+= ,
where A E is the capital-asset ratio, RoA denotes return on assets, and σ RoA denotes the
standard deviation of RoA. The standard deviation is calculated using a rolling window of five
years. Z -scores measure the extent to which bank equity is sufficient to cover losses. A higher
z-score reflects a higher distance to default and thus lower risk. We winsorize the z-scores at
the 1% and 99% level to account for extreme outliers.
Table 8 shows descriptive statistics of the z-score variable and bank-specific covariates.
Given the definition of z-scores, we do not specify capitalisation and profitability as
explanatory variables X it . Instead, we augment the model with the concentration of the
sovereign bond portfolio of a bank. We calculate the Hirschman-Herfindahl Index (HHI) of
the sovereign bond portfolio by aggregating the squared shares of individual sovereign bonds
in the entire bond portfolio of bank i. A higher HHI indicates more concentrated portfolios. In
principle, a higher concentration should increase bank risk. We aggregate sovereign bond
exposures within each risk category across countries and quarters to generate a dataset in the
bank-year dimension. Only banks that hold at least one sovereign bond are included. This
sample comprises 4,524 observations, and summary statistics are very much in line with the
bank-country-quarter sample in Table 3.
Our measure for bank risk, the z-score, varies across banking groups and over time
(Table 9). Commercial banks are, on average, the most risky banking group. However, the
standard deviation and thus the heterogeneity of our risk indicator is also highest within this
group. Savings and cooperative banks are less risky and much more homogenous regarding
their risk profile. Over time, the z-score exhibits a u-shape pattern. The indicator was lowest
in 2008, signalling a high level of bank risk, but it recovered in the following two years. The
outbreak of the European debt crisis in 2010 does not show up in higher bank risk, as
measured by the z-score. This feature of the data may reflect the fact that policy measures
prevented certain risks from materialising, but it also reflects that 2010 was just the start of
the sovereign debt crisis with high sovereign yield spreads. At the time, sovereign risks might
not have been realised by banks yet and thus do not show up in the z-score.
10
The literature uses numerous accounting-based measures, such as non-performing loans, the volatility ofbank-level reserves, profits (see eg Beck 2008) or market-based measures, such as bank CDS. The former are
either subject to statistical breaks (non-performing loans) or exhibit little to no time-series variation. The latterare available for the small number of listed German banks.
17

8/19/2019 Banks and Sovereign Risk. Deutsche Bundesbank 2013
http://slidepdf.com/reader/full/banks-and-sovereign-risk-deutsche-bundesbank-2013 25/48
4.3 Baseline estimation results
Table 10 presents results for the risk equation. As before, we split the data into observations
for the pre-Lehman period (2006-2007) and the post-Lehman period (2008-2010). Table 11
estimates similar models for the different banking groups. The explanatory power is quitehigh with an adjusted R² of 0.2 for the full sample and an R² of 0.31 for the post-Lehman
sample. The adjusted R² includes the explanatory power of the bank dummies.
We measure the effect of sovereign exposure on bank risk using information on the
concentration of sovereign bond portfolios and the structure of these portfolios in terms of
risk. We expect that a high degree of concentration and a high share invested into higher-risk
bonds increases risk, i.e. the z-score should decline. Conversely, a high share of low risk
bonds should lower risk and thus increase the z-score. As regards concentration, we find theopposite effect: for savings and cooperative banks, high concentration increased rather than
decreased risk.
As regards the impact of the structure of sovereign exposures, we find no strong effect
either. If anything, holding more intermediate-risk bonds led to lower bank risk in the pre-
Lehman period, but not afterwards (Table 10). When estimating the model for each banking
group separately, investments in low risk bonds also decreased risk of commercial banks and
of cooperative banks, but only if we allow for different effects over time by splitting the
sample (Table 11). The stabilizing impact of intermediate risk bonds on bank risk is largely
driven by savings banks. The finding that high concentration has been associated with lower
risk for savings and cooperative bank is at odds with the expectation that diversification
reduces risk (Table 11).
Overall, these results show that sovereign bond holdings have not had a marked impact on
bank risk. We find some evidence that investments in sovereign bonds reduced the risk of
German banks. There are several explanations for this finding. First, the sovereign portfolios
for the banks we investigate are highly concentrated on German government bonds. Volatility
of these bonds has been low (which increases the z-score) but returns have been low as well
(which decreases the z-score). These two effects might just have been offsetting each other.
Second, the z-score measures total bank risk, not just the risk related to sovereign exposures.
If banks use investments into sovereign bonds to actively manage their overall risk exposure,
we might indeed not find an impact on total bank risk. Third, our sample covers the period
from 2005 until the beginning of the European sovereign debt crisis. Spreads on sovereign
bonds from European peripheral countries increased in this period, thus raising the returns on
18
8/19/2019 Banks and Sovereign Risk. Deutsche Bundesbank 2013
http://slidepdf.com/reader/full/banks-and-sovereign-risk-deutsche-bundesbank-2013 26/48
these bonds. But potential losses on these bonds had not yet been realised. This relates also to
the widespread absence of marking-to-market at the outbreak of the European sovereign
crisis.
As regards the effects of the remaining covariates, we find significant effects of a few
variables only. The expected effect of bank size on bank risk is not clear-cut a priori. On the
one hand, larger banks have more diversified portfolios and should thus be less risky than
smaller banks. On the other hand, a higher degree of exposure to market risk and too-big-to-
fail considerations would imply that larger banks exhibit higher risk. We find that,
irrespective of the sample period, larger banks tend to be more risky (in the sense of having a
lower z-scores). A high share of customer loans in total loans decreases bank risk, especially
for savings and cooperative banks. After the fall of Lehman greater dependence on wholesale
rather than retail funding increased bank risk. When estimating the model separately for the
different banking groups, these findings are – by and large – confirmed.11 Overall, a large
share of the variation in the data is already captured by the bank and year fixed effects. Our
measure of bank risk thus reflects mostly cross-sectional heterogeneity between banks and
common trends over time.
We have performed various robustness tests, which leave our main results unaffected. We
altered the aggregation method for the sovereign bond holdings. Instead of taking the end-of-
year values of a bank’s sovereign holdings we took the mean holdings in each year. We used
observed (instead of predicted) sovereign bond holdings as a robustness test against the
reliance on predictions. Finally, we winsorised all explanatory variables.
5 Conclusions
Research on the link between sovereign bonds and bank risk has, so far, focused mainly on
banks in the crisis countries and on the determinants of risk spreads. We have studied this link
from a different angle by analysing the investments of German banks in sovereign bonds and
the effects of these investments on bank risks. We use detailed bank-level panel data which
provide information on the sovereign bond holdings of all German banks on a country-by-
country basis. Our panel data start in 2005 Q4, and we use information through the end of
2010.
Our research has three main findings:
11 The small number of mortgage banks (16 banks) precludes separate risk equation estimation.
19

8/19/2019 Banks and Sovereign Risk. Deutsche Bundesbank 2013
http://slidepdf.com/reader/full/banks-and-sovereign-risk-deutsche-bundesbank-2013 27/48
First, there is a considerable degree of heterogeneity across banks. Many banks do not
invest in sovereign bonds at all, and the degree of diversification of sovereign bond portfolios
differs across banks as well. Larger and less well-capitalised (and in this sense riskier) banks
hold more sovereign bonds. Banks with a large share of liquid assets also invest more in
sovereign bonds, but mainly in German bonds.
Second, banks have reacted to changing macroeconomic and risk factors only since the
collapse of Lehman Brothers. Before the financial crisis, banks did not differentiate much
between OECD countries. Since then, banks have restructured their sovereign bond portfolios
according to macroeconomic fundamentals. German banks hold more bonds from large, low-
inflation and high-yield countries. This is in line with changing risk perceptions in sovereign
bond markets since the financial crisis.
Third, the impact of sovereign bond holdings on bank risk, measured through the banks’ z-
score, depends on the time period and the banking group considered. Investments in bonds
with an intermediate risk level lowered bank risk before the crisis, but not during the crisis.
Investments in low risk bonds were associated with lower risk of commercial and cooperative
banks. These findings might reflect the policy measures which prevented a materialization of
the risks in our sample period as well as the absence of marking-to-market.
20

8/19/2019 Banks and Sovereign Risk. Deutsche Bundesbank 2013
http://slidepdf.com/reader/full/banks-and-sovereign-risk-deutsche-bundesbank-2013 28/48
6 References
Acharya, V, I Drechsler and P Schnabl (2011). A Pyrrhic Victory? Bank Bailouts and
Sovereign Credit Risk. National Bureau of Economic Research (NBER) Working
Paper 17136. Cambridge MA.
Acharya, V V, and S Steffen (2013). The “Greatest” Carry Trade Ever? Understanding
Eurozone Bank Risks. National Bureau of Economic Research (NBER) Working
Paper No. 19039. Cambridge MA.
Amann, M, M Baltzer and M Schrape (2012). Microdatabase: Securities Holdings Statistics.
Deutsche Bundesbank Technical Documentation. Frankfurt a.M.
Angeloni, C and G B Wolff (2012). Are banks affected by their holdings of government debt?
Bruegel Working Paper 2012/07. Brussels.
Bai, J, C Julliard and K Yuan (2012). Eurozone Sovereign Bond Crisis: Liquidity or
Fundamental Contagion.
http://www.greta.it/credit/credit2012/PAPERS/Speakers/Thursday/08_Bai_Julliard_Y
uan.pdf.
Battistini, N, M Pagano, und S Simonelli (2013). Systemic risk and home bias in the euro
area. European Commission Economic Papers 494.
Beber, A, M W Brandt and K A Kavajecz (2009). Flight-to-Quality or Flight-to-Liquidity?
Evidence from the Euro Area Bond Market. Review of Financial Studies 22(3): 925-
957.
Beck, T (2008). Bank competition and financial stability: Friends or foes? World Bank Policy
Research Working Paper 4656. Washington DC.
Bolton, P and O Jeanne (2011). Sovereign Default Risk and Bank Fragility in Financially
Integrated Economies. National Bureau of Economic Research (NBER) Working
Paper 16899. Cambridge MA.
Buch, C M, C T Koch and M Koetter (2011). Size, Productivity, and International Banking.
Journal of International Economics 85: 329-334.
de Grauwe, Paul and Yuemei Yi (2012). Mispricing of sovereign risk and multiple equilibria
in the Eurozone. Centre for European Policy Working Paper 361.
Fiorentino, E, C Koch and W Rudek (2010). Technical Documentation Microdatabase:
External Position Reports of German Banks. Deutsche Bundesbank. TechnicalDocumentation. Frankfurt a.M.
Gennaioli, N, A Martin and S Rossi (2013). Sovereign Default, Domestic Banks and
Financial Institutions. Journal of Finance, Forthcoming. Available at SSRN:
http://ssrn.com/abstract=2023428 or http://dx.doi.org/10.2139/ssrn.2023428.
Heckman, J J (1979). Sample Selection Bias as a Specification Error. Econometrica 47 (1):
153-161.
Hildebrand, T, J Rocholl, and A Schulz (2012). Flight to Where? Evidence from Bank
Investments During the Financial Crisis. Mimeo.
Laeven, L and Levine, R (2009). Bank governance, regulation and risk taking. Journal ofFinancial Economics 93: 259–275.
21

8/19/2019 Banks and Sovereign Risk. Deutsche Bundesbank 2013
http://slidepdf.com/reader/full/banks-and-sovereign-risk-deutsche-bundesbank-2013 29/48
Rochet, J-C (2008). Why are there so many banking crises? In: The Politics and Policy of
Bank Regulation. Princeton University Press. Princeton.
22

8/19/2019 Banks and Sovereign Risk. Deutsche Bundesbank 2013
http://slidepdf.com/reader/full/banks-and-sovereign-risk-deutsche-bundesbank-2013 30/48
Data definitions and sources
Sovereign bond portfolios
Exposure to sovereign bonds EXP: this is a dummy variable which is equal to one if the bank
i holds sovereign bonds of country j in quarter t and zero otherwise. The information is basedon the Securities Holdings Statistics of the Deutsche Bundesbank .
Sovereign Bond Holdings SOV: notional value of a bank’s sovereign bond holdings of
sovereign j in quarter t . Data are obtained from the Securities Holdings Statistics of the
Deutsche Bundesbank . Individual security data are aggregated to the issuer country level by
summing up over all ISINs per country, bank and quarter. Issuers at all levels of the
government - central, federal and municipal - are included. Only securities held on banks’
own accounts are included and data cover sovereign bonds held in the banking book and in
the market book.
Concentration of sovereign portfolio: Herschman-Herfindahl Index (HHI) of the sovereign
bond portfolio for each bank and year. The HHI is calculated by summing up the squaredshares of an individual sovereign in the sovereign bond portfolio of bank i in year t. Hence, a
higher HHI indicates higher concentration in the portfolio. Information on sovereign bond
holdings is taken from the Securities Holdings Statistics of the Deutsche Bundesbank .
Predicted volume of risk sovereign bonds: this variable is used as a regressor in the equations
explaining bank risk (Table 6). It is the predicted value of banks’ investment in sovereign
bonds from the model for the intensive margin in Table 3. The data are aggregated at the bank
level. Sovereign bond holdings are categorised into low, intermediate, and high-risk bonds
according to the country classifications in Table 9. The risk measure is based on the average
of the ratings by Moody's, Fitch and Standard and Poor's. Low risk is defined as AAA,
intermediate risk is defined as AA and A, and high risk as BBB or worse.
Bank-level variables
Total assets: log of total assets of the bank. Data is taken from the Monthly Balance Sheet
Statistics of the Deutsche Bundesbank . It is a measure for bank size.
Cash & overnight / total assets: ratio of cash and overnight interbank loans to total assets.
Information is taken from the annual financial statements submitted by banks to the Deutsche
Bundesbank . This variable reflects the liquid assets holdings of a bank (excluding sovereign
bonds).
Customer loans / total loans: ratio of claims on customers to the sum of claims on customers
and on banks. Information is taken from the annual financial statements submitted by banks to
the Deutsche Bundesbank . This variable reflects the degree of retail orientation of a bank.
Security portfolio / total assets: ratio of bonds and stocks portfolio to total assets. Information
is taken from the annual financial statements submitted by banks to the Deutsche Bundesbank .
This variable reflects the importance of securities trading in the business model of banks.
Core capital ratio: ratio of equity capital minus deficit to total assets. Information is taken
from the annual financial statements submitted by banks to the Deutsche Bundesbank . This
variable reflects the risk-bearing capacity of banks.
Retail deposits / total assets: ratio of overnight deposits from household and non-financialfirms to total assets. Information is taken from the monthly balance sheet statistics of the
Deutsche Bundesbank .
23

8/19/2019 Banks and Sovereign Risk. Deutsche Bundesbank 2013
http://slidepdf.com/reader/full/banks-and-sovereign-risk-deutsche-bundesbank-2013 31/48
8/19/2019 Banks and Sovereign Risk. Deutsche Bundesbank 2013
http://slidepdf.com/reader/full/banks-and-sovereign-risk-deutsche-bundesbank-2013 32/48
Table 1: Sovereign bond portfolios of German banks
Column (1) displays aggregate assets per banking group. Column (2) displays aggregate securities (including
shares, bonds, etc). Column (3) shows aggregate sovereign bonds held in the banking or in the market book.
Column (4) shows the percentage share of the overall securities portfolio and column (5) the share of all
sovereign bonds in total assets. Column (6) display the share of euro-area bonds as a percentage of all sovereign
bonds and column (7) the share of German sovereign bonds as a percentage of all sovereign bonds. The bankinggroup public banks comprises savings banks and Landesbanken. The banking group cooperative banks include
cooperative banks and their head institutions. Data are for the fourth quarter of 2010.
(1) (2) (3) (4) (5) (6) (7)
Total assets SecuritiesSovereign
BondsSecurities
Sovereign
Bonds
Euro-area
bonds
German
bonds
( € billion) ( € billion) ( € billion)(% of total
assets)
(% of total
assets)
(% of
sovereign
bonds)
(% of
sovereign
bonds)
Commercial
banks2859.32 290.98 93.95 10.18 3.29 99.08 67.85
Public
banks 2596.69 565.75 92.13 21.79 3.55 96.35 85.91 Cooperative
banks965.58 229.63 22.22 23.78 2.3 98.96 73.67
Mortgage
banks726.01 199.64 90.08 27.5 12.41 83.72 34.93
25

8/19/2019 Banks and Sovereign Risk. Deutsche Bundesbank 2013
http://slidepdf.com/reader/full/banks-and-sovereign-risk-deutsche-bundesbank-2013 33/48
Table 2: Descriptive statistics for macroeconomic variables
Descriptive statistics for complete observations of macro covariates in the selection and outcome equations. The
sample covers the period from 2005 Q4 to 2010 Q4, 1,898 banks, and 28 destination countries.
Selection equation
1,087,164
Outcome equation
46,981
MeanStandard
deviation MeanStandard
deviation
Holding sovereign bonds (dummy) 0.04 0.20
Volume of sovereign bonds ( € bn) 0.09 0.56
Ln GDP 5.89 1.44 6.49 1.34
Sovereign debt ratio 0.48 0.35 0.54 0.27
CPI inflation 0.02 0.02 0.02 0.02
Sovereign bond yield 0.04 0.01 0.04 0.02
IMF measures 0.04 0.18 0.05 0.22
Euro-area bond 0.44 0.50 0.75 0.43
26

8/19/2019 Banks and Sovereign Risk. Deutsche Bundesbank 2013
http://slidepdf.com/reader/full/banks-and-sovereign-risk-deutsche-bundesbank-2013 34/48
Table 3: Descriptive statistics for bank-level variables
Descriptive statistics for complete observations of bank-level covariates in the selection and outcome equations.
The sample covers the period from 2005 Q4 to 2010 Q4, 1,898 banks, and 28 destination countries. The high
standard deviation of the variable fee income / interest income is driven by few banks with an exceptionally high
share of fee income relative to interest income. Our results are robust against eliminating these outliers by
winsorizing the variable at the 1% level.
Selection equation
(1,087,164 observations)
Outcome equation
(46,981 observations)
Mean Standard deviation Mean Standard deviation
Ln total assets 12.98 1.50 14.38 2.23
Cash & overnight / total assets 0.07 0.06 0.05 0.04
Customer loans / total loans 0.80 0.15 0.76 0.17
Security portfolio / total assets 0.22 0.12 0.27 0.12
Core capital ratio 0.06 0.04 0.05 0.03
Retail deposits / total assets 0.21 0.09 0.19 0.11
Return on equity 0.04 0.10 0.03 0.17
Cost-to-income ratio 0.84 0.18 0.85 0.14
Fee income / interest income 0.45 3.10 0.37 2.17
27
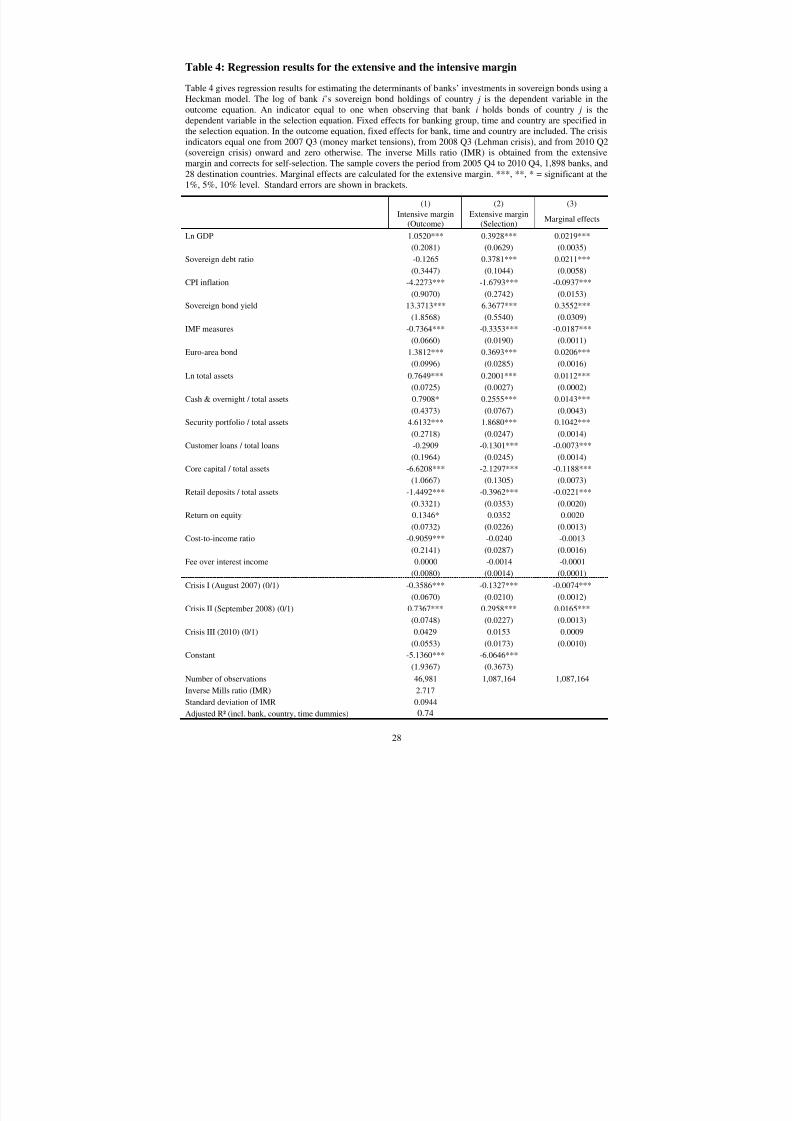
8/19/2019 Banks and Sovereign Risk. Deutsche Bundesbank 2013
http://slidepdf.com/reader/full/banks-and-sovereign-risk-deutsche-bundesbank-2013 35/48
Table 4: Regression results for the extensive and the intensive margin
Table 4 gives regression results for estimating the determinants of banks’ investments in sovereign bonds using a
Heckman model. The log of bank i’s sovereign bond holdings of country j is the dependent variable in the
outcome equation. An indicator equal to one when observing that bank i holds bonds of country j is the
dependent variable in the selection equation. Fixed effects for banking group, time and country are specified in
the selection equation. In the outcome equation, fixed effects for bank, time and country are included. The crisis
indicators equal one from 2007 Q3 (money market tensions), from 2008 Q3 (Lehman crisis), and from 2010 Q2(sovereign crisis) onward and zero otherwise. The inverse Mills ratio (IMR) is obtained from the extensive
margin and corrects for self-selection. The sample covers the period from 2005 Q4 to 2010 Q4, 1,898 banks, and
28 destination countries. Marginal effects are calculated for the extensive margin. ***, **, * = significant at the
1%, 5%, 10% level. Standard errors are shown in brackets.
(1) (2) (3)
Intensive margin
(Outcome)
Extensive margin
(Selection)Marginal effects
Ln GDP 1.0520*** 0.3928*** 0.0219***
(0.2081) (0.0629) (0.0035)
Sovereign debt ratio -0.1265 0.3781*** 0.0211***
(0.3447) (0.1044) (0.0058)
CPI inflation -4.2273*** -1.6793*** -0.0937***
(0.9070) (0.2742) (0.0153)
Sovereign bond yield 13.3713*** 6.3677*** 0.3552***
(1.8568) (0.5540) (0.0309)
IMF measures -0.7364*** -0.3353*** -0.0187***
(0.0660) (0.0190) (0.0011)
Euro-area bond 1.3812*** 0.3693*** 0.0206***
(0.0996) (0.0285) (0.0016)
Ln total assets 0.7649*** 0.2001*** 0.0112***
(0.0725) (0.0027) (0.0002)
Cash & overnight / total assets 0.7908* 0.2555*** 0.0143***
(0.4373) (0.0767) (0.0043)
Security portfolio / total assets 4.6132*** 1.8680*** 0.1042***
(0.2718) (0.0247) (0.0014)
Customer loans / total loans -0.2909 -0.1301*** -0.0073***
(0.1964) (0.0245) (0.0014)
Core capital / total assets -6.6208*** -2.1297*** -0.1188***
(1.0667) (0.1305) (0.0073)
Retail deposits / total assets -1.4492*** -0.3962*** -0.0221***
(0.3321) (0.0353) (0.0020)
Return on equity 0.1346* 0.0352 0.0020
(0.0732) (0.0226) (0.0013)
Cost-to-income ratio -0.9059*** -0.0240 -0.0013
(0.2141) (0.0287) (0.0016)Fee over interest income 0.0000 -0.0014 -0.0001
(0.0080) (0.0014) (0.0001)
Crisis I (August 2007) (0/1) -0.3586*** -0.1327*** -0.0074***
(0.0670) (0.0210) (0.0012)
Crisis II (September 2008) (0/1) 0.7367*** 0.2958*** 0.0165***
(0.0748) (0.0227) (0.0013)
Crisis III (2010) (0/1) 0.0429 0.0153 0.0009
(0.0553) (0.0173) (0.0010)
Constant -5.1360*** -6.0646***
(1.9367) (0.3673)
Number of observations 46,981 1,087,164 1,087,164
Inverse Mills ratio (IMR) 2.717Standard deviation of IMR 0.0944
Adjusted R² (incl. bank, country, time dummies) 0.74
28

8/19/2019 Banks and Sovereign Risk. Deutsche Bundesbank 2013
http://slidepdf.com/reader/full/banks-and-sovereign-risk-deutsche-bundesbank-2013 36/48
Table 5: Sample splits by time period
Table 5 gives regression results for estimating the determinants of banks’ investments in sovereign bonds using a
Heckman model and splitting the sample into the pre-Lehman (2005 Q4 to 2008 Q2) and the post-Lehman
period (2008 Q3 to 2010 Q4). The log of bank i’s sovereign bond holdings of country j is the dependent variable
in the outcome equation. An indicator equal to one when observing that bank i holds bonds of country j is the
dependent variable in the selection equation. Fixed effects for banking group, time and country are specified inthe selection equation. In the outcome equation, fixed effects for bank, time and country are included. The crisis
indicators equal one from 2007 Q3 (money market tensions) and from 2010 Q2 (sovereign crisis) onward and
zero otherwise. The inverse Mills ratio (IMR) is obtained from the extensive margin and corrects for self
selection. The sample covers the period from 2005 Q4 to 2010 Q4, 1,898 banks, and 28 destination countries.
Marginal effects are calculated for the extensive margin. ***, **, * = significant at the 1%, 5%, 10% level.
Standard errors are shown in brackets.
Before Lehman After Lehman
Intensive margin
(Outcome)
Extensive margin
(Selection)
Intensive margin
(Outcome)
Extensive margin
(Selection)
Ln GDP 0.7630** 0.0637 -0.8116* -0.1131
(0.3681) (0.1369) (0.4411) (0.1177)
Sovereign debt ratio 1.1830 0.0363 0.1177 0.5400***(1.0455) (0.3811) (0.7000) (0.1865)
CPI inflation -1.2644 0.5698 -5.8990*** -1.7936***
(1.6572) (0.6172) (1.8840) (0.4889)
Sovereign bond yield 0.5017 2.8875 11.4484*** 3.9625***
(5.3816) (2.0253) (3.0414) (0.8228)
IMF measures -0.0003 0.0298 -0.9251*** -0.3467***
(0.1174) (0.0441) (0.1142) (0.0287)
Euro-area bond 0.9479*** 0.0858 1.1055*** 0.3147***
(0.1762) (0.0619) (0.2771) (0.0697)
Ln total assets 0.4155*** 0.2132*** 0.8300*** 0.1931***
(0.1255) (0.0040) (0.1438) (0.0038)
Cash & overnight / total assets 1.2723** 0.2023* 0.8829 0.4947***(0.6483) (0.1180) (0.9641) (0.1023)
Customer loans / total loans -0.0673 0.0620 -0.9524** -0.2849***
(0.3640) (0.0377) (0.4595) (0.0332)
Security portfolio / total assets 5.0204*** 1.9463*** 4.3546*** 1.7904***
(0.4884) (0.0354) (0.5859) (0.0352)
Core capital / total assets -12.2508*** -2.3367*** -4.1909 -1.9944***
(1.6428) (0.1914) (2.6728) (0.1800)
Retail deposits / total assets -1.7767*** -0.1738*** -1.0019* -0.6022***
(0.5954) (0.0530) (0.6080) (0.0479)
Return on equity 0.1853* 0.0522* 0.0925 -0.0540
(0.0954) (0.0290) (0.1654) (0.0381)
Cost-to-income ratio -1.2018*** -0.3408*** -0.4137 0.0554**
(0.3170) (0.0595) (0.4146) (0.0252)
Fee over interest income -0.0007 0.0015 -0.0211 -0.0044**
(0.0105) (0.0024) (0.0139) (0.0018)
Crisis I (August 2007) (0/1) -0.2481*** -0.1648***
(0.0799) (0.0295)
Crisis III (2010) (0/1) 0.9440*** 0.3420***
(0.1307) (0.0331)
Constant 3.9384 -3.7536*** 3.1567 -3.2077***
(3.3801) (0.8059) (3.9445) (0.7057)
Observations 23,567 597,906 23,414 489,258
Inverse Mills ratio (IMR) 2.271 3.116Standard deviation of IMR 0.103 0.172
29
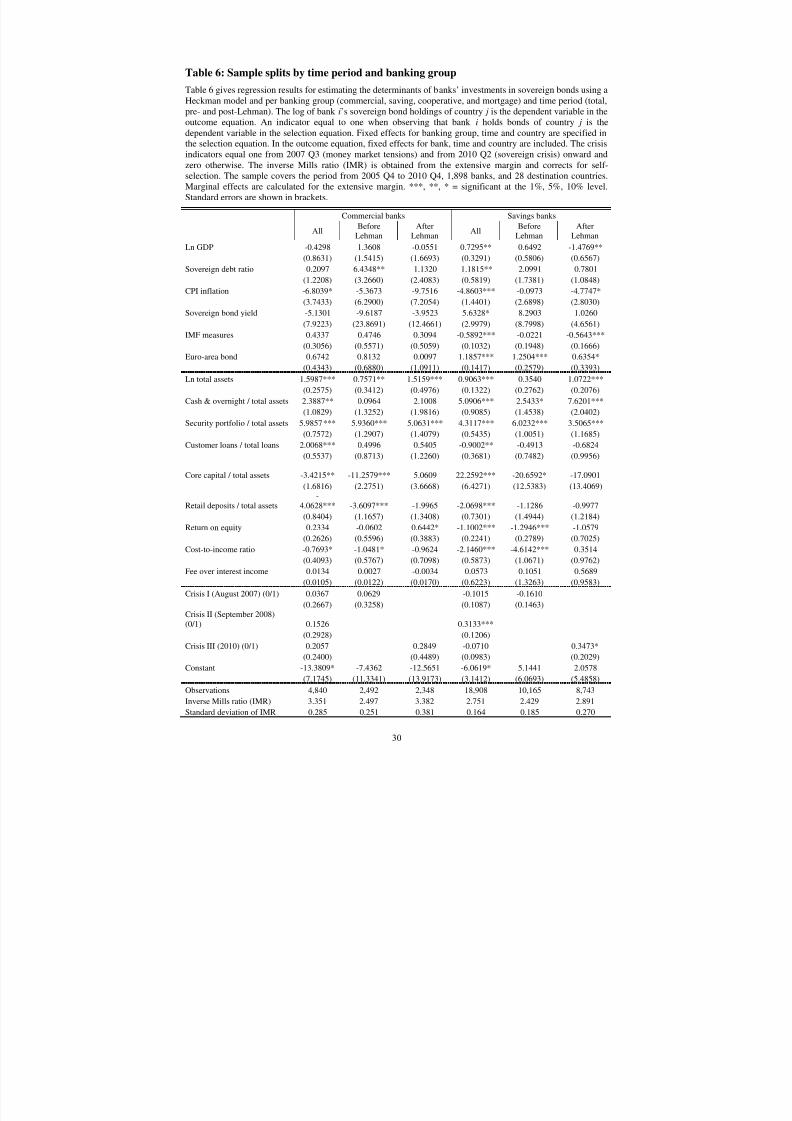
8/19/2019 Banks and Sovereign Risk. Deutsche Bundesbank 2013
http://slidepdf.com/reader/full/banks-and-sovereign-risk-deutsche-bundesbank-2013 37/48
Table 6: Sample splits by time period and banking group
Table 6 gives regression results for estimating the determinants of banks’ investments in sovereign bonds using a
Heckman model and per banking group (commercial, saving, cooperative, and mortgage) and time period (total,
pre- and post-Lehman). The log of bank i’s sovereign bond holdings of country j is the dependent variable in the
outcome equation. An indicator equal to one when observing that bank i holds bonds of country j is the
dependent variable in the selection equation. Fixed effects for banking group, time and country are specified inthe selection equation. In the outcome equation, fixed effects for bank, time and country are included. The crisis
indicators equal one from 2007 Q3 (money market tensions) and from 2010 Q2 (sovereign crisis) onward and
zero otherwise. The inverse Mills ratio (IMR) is obtained from the extensive margin and corrects for self-
selection. The sample covers the period from 2005 Q4 to 2010 Q4, 1,898 banks, and 28 destination countries.
Marginal effects are calculated for the extensive margin. ***, **, * = significant at the 1%, 5%, 10% level.
Standard errors are shown in brackets.
Commercial banks Savings banks
AllBefore
Lehman
After
LehmanAll
Before
Lehman
After
Lehman
Ln GDP -0.4298 1.3608 -0.0551 0.7295** 0.6492 -1.4769**
(0.8631) (1.5415) (1.6693) (0.3291) (0.5806) (0.6567)
Sovereign debt ratio 0.2097 6.4348** 1.1320 1.1815** 2.0991 0.7801
(1.2208) (3.2660) (2.4083) (0.5819) (1.7381) (1.0848)
CPI inflation -6.8039* -5.3673 -9.7516 -4.8603*** -0.0973 -4.7747*
(3.7433) (6.2900) (7.2054) (1.4401) (2.6898) (2.8030)
Sovereign bond yield -5.1301 -9.6187 -3.9523 5.6328* 8.2903 1.0260
(7.9223) (23.8691) (12.4661) (2.9979) (8.7998) (4.6561)
IMF measures 0.4337 0.4746 0.3094 -0.5892*** -0.0221 -0.5643***
(0.3056) (0.5571) (0.5059) (0.1032) (0.1948) (0.1666)
Euro-area bond 0.6742 0.8132 0.0097 1.1857*** 1.2504*** 0.6354*
(0.4343) (0.6880) (1.0911) (0.1417) (0.2579) (0.3393)
Ln total assets 1.5987*** 0.7571** 1.5159*** 0.9063*** 0.3540 1.0722***
(0.2575) (0.3412) (0.4976) (0.1322) (0.2762) (0.2076)
Cash & overnight / total assets 2.3887** 0.0964 2.1008 5.0906*** 2.5433* 7.6201***
(1.0829) (1.3252) (1.9816) (0.9085) (1.4538) (2.0402)Security portfolio / total assets 5.9857*** 5.9360*** 5.0631*** 4.3117*** 6.0232*** 3.5065***
(0.7572) (1.2907) (1.4079) (0.5435) (1.0051) (1.1685)
Customer loans / total loans 2.0068*** 0.4996 0.5405 -0.9002** -0.4913 -0.6824
(0.5537) (0.8713) (1.2260) (0.3681) (0.7482) (0.9956)
Core capital / total assets -3.4215** -11.2579*** 5.0609
-
22.2592*** -20.6592* -17.0901
(1.6816) (2.2751) (3.6668) (6.4271) (12.5383) (13.4069)
Retail deposits / total assets
-
4.0628*** -3.6097*** -1.9965 -2.0698*** -1.1286 -0.9977
(0.8404) (1.1657) (1.3408) (0.7301) (1.4944) (1.2184)
Return on equity 0.2334 -0.0602 0.6442* -1.1002*** -1.2946*** -1.0579
(0.2626) (0.5596) (0.3883) (0.2241) (0.2789) (0.7025)
Cost-to-income ratio -0.7693* -1.0481* -0.9624 -2.1460*** -4.6142*** 0.3514
(0.4093) (0.5767) (0.7098) (0.5873) (1.0671) (0.9762)
Fee over interest income 0.0134 0.0027 -0.0034 0.0573 0.1051 0.5689
(0.0105) (0.0122) (0.0170) (0.6223) (1.3263) (0.9583)
Crisis I (August 2007) (0/1) 0.0367 0.0629 -0.1015 -0.1610
(0.2667) (0.3258) (0.1087) (0.1463)
Crisis II (September 2008)
(0/1) 0.1526 0.3133***
(0.2928) (0.1206)
Crisis III (2010) (0/1) 0.2057 0.2849 -0.0710 0.3473*
(0.2400) (0.4489) (0.0983) (0.2029)
Constant -13.3809* -7.4362 -12.5651 -6.0619* 5.1441 2.0578
(7.1745) (11.3341) (13.9173) (3.1412) (6.0693) (5.4858)
Observations 4,840 2,492 2,348 18,908 10,165 8,743Inverse Mills ratio (IMR) 3.351 2.497 3.382 2.751 2.429 2.891
Standard deviation of IMR 0.285 0.251 0.381 0.164 0.185 0.270
30

8/19/2019 Banks and Sovereign Risk. Deutsche Bundesbank 2013
http://slidepdf.com/reader/full/banks-and-sovereign-risk-deutsche-bundesbank-2013 38/48
-- continued from previous page --
Cooperative banks Mortgage banks
All
Before
Lehman
After
Lehman All
Before
Lehman
After
Lehman
Ln GDP 3.0784*** 0.4069 1.3770 0.0134 0.7947 -1.0460
(0.5757) (0.6163) (0.8415) (0.3465) (0.6634) (0.6982)
Sovereign debt ratio 0.1170 -3.4795* 1.2892 0.8251 2.8149 -2.1942*
(0.8441) (1.8313) (1.3065) (0.6292) (1.9107) (1.3111)
CPI inflation -3.0591 1.3805 -4.6948 -1.1566 -6.3933* -2.2723
(1.9445) (2.6512) (3.3328) (2.0150) (3.3125) (3.7460)
Sovereign bond yield 29.3038*** 0.3528 22.5335*** -7.0538* -18.7462 1.5188
(4.6858) (8.1411) (5.3468) (3.9255) (11.8544) (6.3475)
IMF measures -1.3896*** 0.1967 -1.6400*** -0.1433 -0.1908 -0.1767
(0.1929) (0.1659) (0.2494) (0.1543) (0.3374) (0.2585)
Euro-area bond 2.9645*** 0.4665 2.7113*** 0.0621 0.3156 0.0229
(0.3456) (0.3154) (0.8748) (0.1691) (0.3437) (0.3447)
Ln total assets 0.7787*** 0.1709 0.4388 0.5674*** 1.0915*** 0.0578
(0.2037) (0.2131) (0.3117) (0.1822) (0.4063) (0.3231)
Cash & overnight / total assets -1.4743 0.8421 0.8655
18.8471**
* 23.7317*** 0.6902
(1.0838) (1.0373) (1.8671) (5.2974) (7.4296) (10.5310)
Customer loans / total loans -2.0530*** 0.6252 -0.7636 -1.1748 1.1249 -0.9875
(0.5620) (0.7400) (0.9208) (0.7439) (1.7628) (1.5601)
Security portfolio / total assets 6.5811*** 4.3908*** 5.1832*** -0.5011 1.1324 0.9057
(0.8381) (0.9576) (1.3012) (0.9258) (1.6833) (2.7572)
Core capital / total assets -0.4432 -4.5075 -24.1169* -17.2539* 26.3898 -8.5094
(5.9613) (6.2422) (13.6566) (9.6802) (36.3476) (15.3188)
Retail deposits / total assets -2.2513*** -1.0086 -0.2686 3.0992 4.7168 -13.5642
(0.7632) (0.9163) (1.0919) (5.7761) (7.7839) (11.0147)
Return on equity 0.7798 0.7854 2.3183 0.1474* 0.1197 -0.0836
(0.7905) (0.6455) (1.7190) (0.0787) (0.1262) (0.2046)
Cost-to-income ratio 0.1933 -0.3109 0.0468 -0.3582 -1.0332 6.5818**
(0.6033) (0.6456) (0.9664) (1.1390) (2.3758) (3.1826)
Fee over interest income 0.9135 0.3730 0.1808 0.3458 0.9373 1.2271
(0.6211) (0.7908) (1.0411) (0.4629) (1.0165) (1.0436)
Crisis I (August 2007) (0/1) -1.0306*** -0.4745*** 0.0044 0.0200
(0.1752) (0.1394) (0.1515) (0.2028)
Crisis II (September 2008)
(0/1) 1.6612*** 0.2934*
(0.2191) (0.1628)
Crisis III (2010) (0/1) 0.2388** 1.8424*** 0.1235 0.6613**
(0.1147) (0.2924) (0.1441) (0.2796)
Constant
-
24.2287*** 11.9362** -6.5594 8.3464* -9.0414 18.1159**
(6.3476) (5.6227) (8.4008) (4.6095) (9.7097) (8.8008)
Observations 20,245 9,172 11,073 2,988 1,738 1,250
Inverse Mills ratio (IMR) 3.973 2.229 3.681 0.943 0.855 0.748
Standard deviation of IMR 0.443 0.290 0.481 0.129 0.130 0.212
31

8/19/2019 Banks and Sovereign Risk. Deutsche Bundesbank 2013
http://slidepdf.com/reader/full/banks-and-sovereign-risk-deutsche-bundesbank-2013 39/48
Table 7: Sample splits by issuer of sovereign bonds
Table 7 gives regression results for estimating the determinants of banks’ investments in sovereign bonds using a
Heckman model by issuer of bonds. The log of bank i’s sovereign bond holdings of country j is the dependent
variable and we report only the outcome equation. In the outcome equation, fixed effects for bank, time and
country are included. The crisis indicators equal one from 2007 Q3 (money market tensions) and from 2010 Q2
(sovereign crisis) onward and zero otherwise. The inverse Mills ratio (IMR) is obtained from the extensivemargin and corrects for self-selection. The sample covers the period from 2005 Q4 to 2010 Q4, 1,898 banks, and
28 destination countries. Marginal effects are calculated for the extensive margin. ***, **, * = significant at the
1%, 5%, 10% level. Standard errors are shown in brackets.
Non-euro-area bonds Euro-area bonds Euro-periphery bonds German bonds
Ln GDP 0.6015** 1.6666** 1.3248*
(0.2419) (0.7751) (0.7353)
Sovereign debt ratio -0.2469 0.8505* 2.4406***
(0.6398) (0.4418) (0.6442)
CPI inflation -5.9814*** -8.1298*** -3.5439***
(1.4430) (1.2608) (1.1630)
Government bond yield (10 yrs) 22.7067*** -4.0904 -7.4596**
(3.6834) (2.7515) (3.0041)
IMF measures -1.0611*** 0.2655** 0.1317
(0.1161) (0.1249) (0.1007)
Ln total assets 0.5902*** 0.6490*** 0.7328***
(0.1302) (0.0717) (0.0952)
Cash & overnight / total assets -0.2198 1.2325*** -1.2734* 2.1133***
(0.7817) (0.4231) (0.7131) (0.2795)
Security portfolio / total assets 4.2123*** 3.8313*** 0.6652* 2.9423***
(0.5649) (0.2622) (0.3599) (0.3271)
Customer loans / total loans -0.3039 -0.1076 -0.5824** 0.1803
(0.3459) (0.1937) (0.2403) (0.1482)Core capital / total assets -16.5391*** -5.5577*** 5.7585** -5.8384***
(4.4739) (0.9315) (2.8660) (0.5883)
Retail deposits / total assets -3.1676*** -0.7702** -1.5840*** -0.3873*
(0.6459) (0.3237) (0.4861) (0.2283)
Return on equity 0.1679 0.1712** -0.1317* 0.1341
(0.1170) (0.0775) (0.0688) (0.0837)
Cost-to-income ratio -2.1653*** -0.8242*** -1.6321*** -0.2869**
(0.4675) (0.2022) (0.3094) (0.1324)
Fee over interest income 0.0440 -0.0041 0.0203 0.0004
(0.0312) (0.0068) (0.0242) (0.0038)
Crisis I (August 2007) (0/1) 0.3302*** -0.3254*** -0.1773** -0.1823***
(0.1195) (0.0869) (0.0837) (0.0457)Crisis II (September 2008) (0/1) 0.3571*** 0.5101*** -0.4479*** 0.5669***
(0.1253) (0.0839) (0.1006) (0.0569)
Crisis III (2010) (0/1) -0.0569 0.0335 -0.0177 0.0262
(0.1016) (0.0557) (0.0609) (0.0382)
Constant -5.8962* -3.2556 -2.1700 22.0397***
(3.3043) (4.5853) (5.5353) (0.2627)
Observations 11670 35 311 9 915 18 636
IMR 2.631 2.164 0.325 0.879
Standard deviation of IMR 0.252 0.0804 0.152 0.185
32

8/19/2019 Banks and Sovereign Risk. Deutsche Bundesbank 2013
http://slidepdf.com/reader/full/banks-and-sovereign-risk-deutsche-bundesbank-2013 40/48
Table 8: Descriptive statistics bank variables risk regressions
Descriptive statistics for the regression sample for bank-level covariates in the bank risk equation. The sample is
annual and covers the period from 2006 until 2010 and 1,348 banks. Only banks which hold some kind of
sovereign investment are included.
Mean Standard deviation Observations
Z -score 30.78 21.90 4,524
Risk-adjusted ROA 2.28 1.85 4,524
Risk-adjusted capitalization 28.50 20.70 4,524
Standard deviation ROA (cross-sectional) 0.34 0.44 1,403
Ln total assets 13.56 1.65 4,524
Cash & overnight / total assets 0.06 0.06 4,524
Customer loans / total loans 0.79 0.16 4,524
Security portfolio / total assets 0.26 0.12 4,524
Retail deposits / total assets 0.21 0.09 4,524
Cost-to-income ratio 0.84 0.09 4,524
Fee over interest income 0.48 3.20 4,524
Concentration of sovereign portfolio 0.81 0.27 4,524
Ln volume of sovereign bonds with low risk (predicted) 15.32 6.65 4,524
Ln volume of sovereign bonds with intermediate risk (predicted) 5.23 7.21 4,524
Ln volume of sovereign bonds with high risk (predicted) 1.78 4.69 4,524
33

8/19/2019 Banks and Sovereign Risk. Deutsche Bundesbank 2013
http://slidepdf.com/reader/full/banks-and-sovereign-risk-deutsche-bundesbank-2013 41/48
Table 9: Average z-score per banking group and year (arithmetic mean)
2005 2006 2007 2008 2009 2010
Commercial banks21.01 20.04 19.04 17.03 19.99 21.08
Savings banks34.93 35.04 33.56 32.68 35.05 36.88
Cooperative banks30.97 31.17 30.38 27.41 29.47 30.14
Mortgage banks32.69 31.97 32.74 34.83 37.63 38.65
All31.68 31.74 30.66 28.49 30.55 31.41
34

8/19/2019 Banks and Sovereign Risk. Deutsche Bundesbank 2013
http://slidepdf.com/reader/full/banks-and-sovereign-risk-deutsche-bundesbank-2013 42/48
Table 10: Baseline regressions explaining bank risk
Table 10 shows panel regression results to explain bank risk. The dependent variable is the z-score of each bankwhere a higher value indicates lower risk. The sample is split into the pre-Lehman (2006-07) and the post-
Lehman period (2008-10). The sovereign crisis covers the year 2010. Fixed effects for bank and time are
included. Robust standard errors are used and shown in brackets. ***, **, * = significant at the 1%, 5%, 10%
level.
All pre Lehman post Lehman
Ln total assets -4.3135*** -4.2862*** -1.5543**
(0.8431) (0.6240) (0.7386)
Security portfolio / total assets -1.2447 2.8122 1.7781
(2.1167) (2.3884) (2.6302)
Cost-to-income ratio -1.2544 1.4596 -0.6998
(0.8396) (0.9959) (1.0990)
Fee over interest income 0.0250 -0.0181* -0.0089
(0.0480) (0.0107) (0.0656)
Customer loans / total loans 2.2087* -2.0758 1.1558
(1.3261) (1.9029) (1.6298)
Cash & overnight / total assets -3.2057 -2.3949 -6.1508
(2.2464) (2.7639) (4.1558)
Retail deposits / total assets 5.0132 0.1266 10.3060**
(3.1934) (5.4536) (4.2782)
Concentration of sovereign portfolio 0.4192 1.3633 0.6392
(0.4152) (1.0171) (0.4497)
Ln volume of sovereign bonds with low risk (predicted) 0.0251 0.0676 0.0329
(0.0180) (0.0415) (0.0282)Ln volume of sovereign bonds with intermediate risk (predicted) 0.0033 0.0952* -0.0126
(0.0198) (0.0507) (0.0242)
Ln volume of sovereign bonds with high risk (predicted) 0.0231 0.0039 0.0233
(0.0142) (0.0355) (0.0159)
Constant 86.8844*** 86.4603*** 46.4372***
(11.5107) (7.9999) (10.0414)
Observations 4,524 1,939 2,585
R² 0.202 0.196 0.311
Number of banks 1,359 1,082 1,156
35

8/19/2019 Banks and Sovereign Risk. Deutsche Bundesbank 2013
http://slidepdf.com/reader/full/banks-and-sovereign-risk-deutsche-bundesbank-2013 43/48

8/19/2019 Banks and Sovereign Risk. Deutsche Bundesbank 2013
http://slidepdf.com/reader/full/banks-and-sovereign-risk-deutsche-bundesbank-2013 44/48
Table 12: List of countries by risk category
Table 12 shows the included countries per risk category. The risk measure is based on the average of the ratings
by Moody's, Fitch and Standard and Poor's. Low risk is defined as AAA, intermediate risk is defined as AA andA, and high risk as BBB or worse. An asterisk (*) indicates that sovereigns migrated from one category to
another between 2005 and 2010.
Low-risk sovereigns Intermediate-risk sovereigns High-risk sovereigns
Australia (AU) Czech Republic (CZ) Hungary (HU)*since 2008 Q4
Austria (AT) Belgium (BE) Greece (GR)*since 2010 Q2
Canada (CA) Hungary (HU)*until 2008 Q3 Mexico (MX)
Denmark (DK) Ireland (I.E.)*since 2009 Q2
Finland (FI) Italy (IT)
France (FR) Greece (GR)*until 2010 Q1
Germany (DE) Japan (JP)
Ireland (I.E.)*until 2009 Q1 Korea (KR)
Luxembourg (LU) Poland (PL)
Netherlands (NL) Portugal (PT)Norway (NO) Slovenia (SI)
Spain (ES)*until 2010 Q1 Spain (ES)*since 2010 Q2
Sweden (SE) Slovak Republic (SK)
Switzerland (CH)
United Kingdom (UK)
United States (US)
37
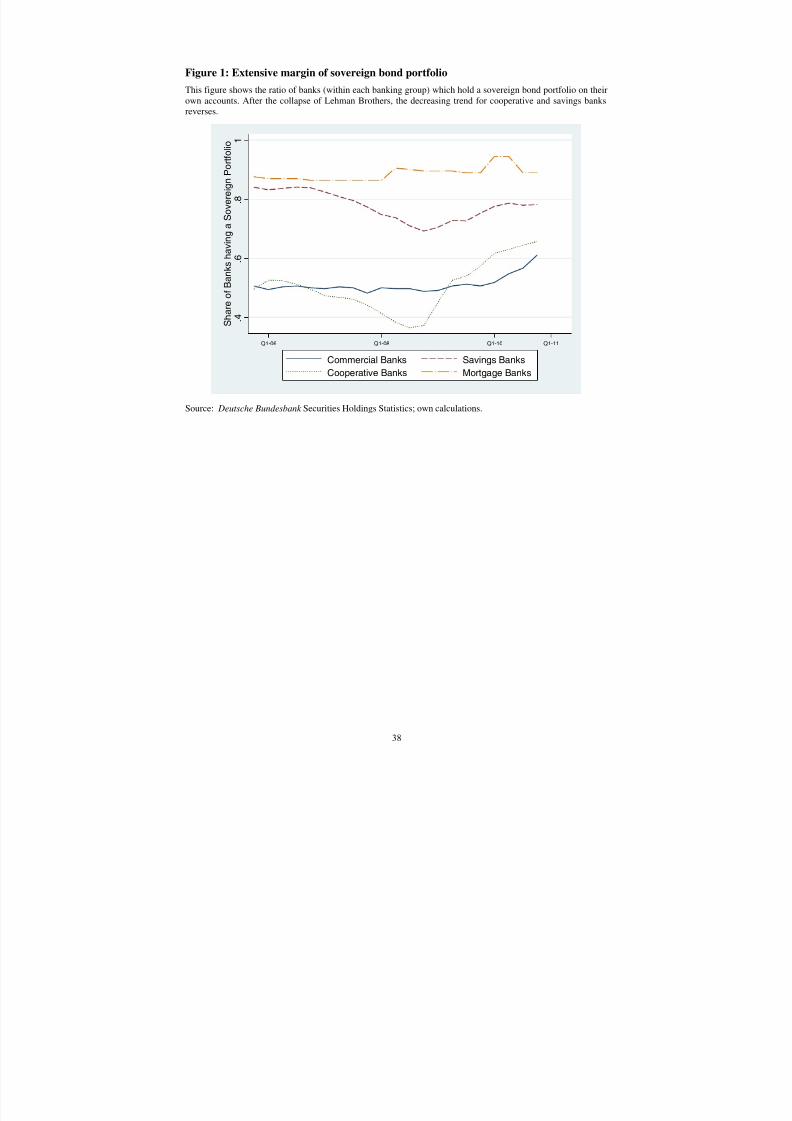
8/19/2019 Banks and Sovereign Risk. Deutsche Bundesbank 2013
http://slidepdf.com/reader/full/banks-and-sovereign-risk-deutsche-bundesbank-2013 45/48
Figure 1: Extensive margin of sovereign bond portfolio
This figure shows the ratio of banks (within each banking group) which hold a sovereign bond portfolio on their
own accounts. After the collapse of Lehman Brothers, the decreasing trend for cooperative and savings banksreverses.
. 4
. 6
. 8
1
S h a r e o f B a n k s h a v i n g a S o v e r e i g n P o r t f o l i o
Q1-06 Q1-08 Q1-10 Q1-11
Commercial Banks Savings Banks
Cooperative Banks Mortgage Banks
Source: Deutsche Bundesbank Securities Holdings Statistics; own calculations.
38

8/19/2019 Banks and Sovereign Risk. Deutsche Bundesbank 2013
http://slidepdf.com/reader/full/banks-and-sovereign-risk-deutsche-bundesbank-2013 46/48
Figure 2: Share of sovereign bonds in balance sheets of banks
This figure gives the average share of sovereign bond holdings in total assets (in %) for each banking group.
Source: Deutsche Bundesbank Securities Holdings Statistics; own calculations.
0
5
1 0
1 5
S h a r e
o f s o v e r e i g n b o n d i n t o t a l a s s e t s ( % )
Q1-06 Q1-08 Q1-10 Q1-11
Commercial Banks Savings Banks
Cooperative Banks Mortgage Banks
39
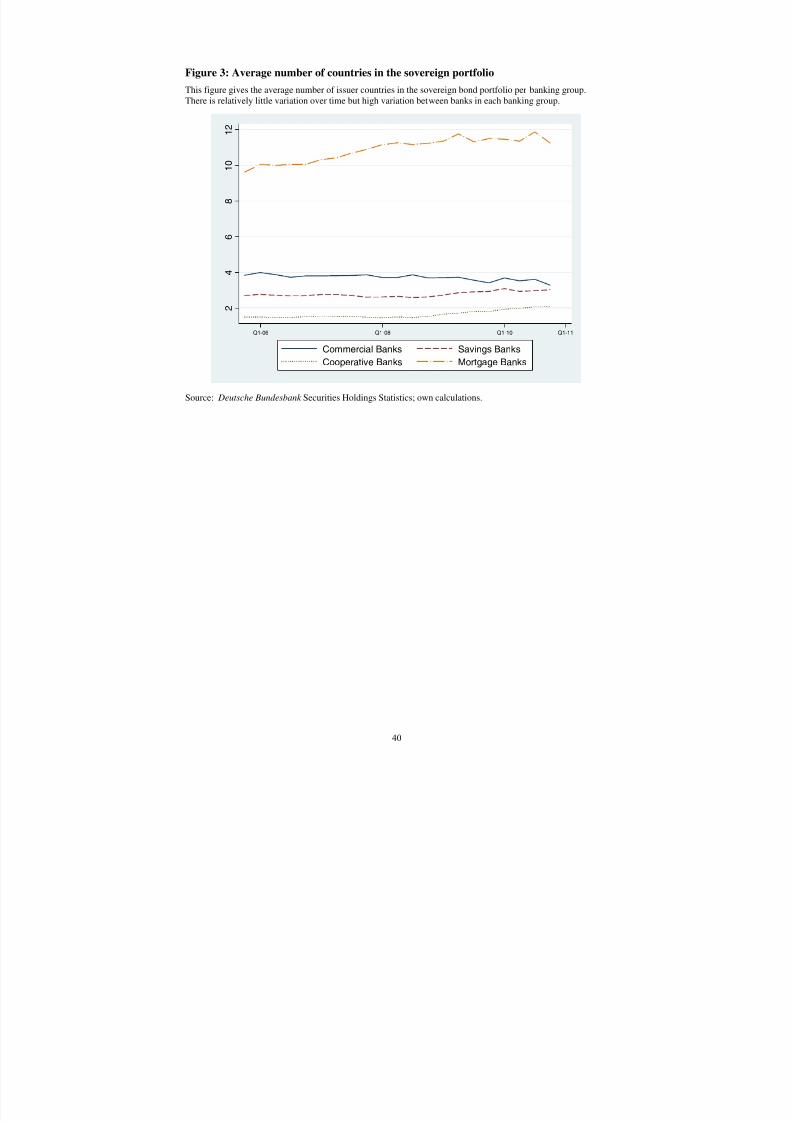
8/19/2019 Banks and Sovereign Risk. Deutsche Bundesbank 2013
http://slidepdf.com/reader/full/banks-and-sovereign-risk-deutsche-bundesbank-2013 47/48
Figure 3: Average number of countries in the sovereign portfolio
This figure gives the average number of issuer countries in the sovereign bond portfolio per banking group.
There is relatively little variation over time but high variation between banks in each banking group.
2
4
6
8
1 0
1 2
Q1-06 Q1-08 Q1-10 Q1-11
Commercial Banks Savings Banks
Cooperative Banks Mortgage Banks
Source: Deutsche Bundesbank Securities Holdings Statistics; own calculations.
40

8/19/2019 Banks and Sovereign Risk. Deutsche Bundesbank 2013
http://slidepdf.com/reader/full/banks-and-sovereign-risk-deutsche-bundesbank-2013 48/48
Figure 4: Sovereign bond holdings of all German banks (2005-11)
Data plotted in this figure are aggregated over all banks located in Germany. The scale of the vertical axis varies
in order to highlight changes in sovereign risk exposures.
1 2 0
1 4 0
1 6 0
1 8 0
2 0
0
1 0
1 5
2 0
2 5
5
1 0
1 5
2 0
5
1 0
1 5
2 0
3 0
3 5
4 0
4 5
5 0
4
6
8
Q1-06 Q1-08 Q1-10 Q1-11 Q1-06 Q1-08 Q1-10 Q1-11 Q1-06 Q1-08 Q1-10 Q1-11
DE ES FR
GR IT PT
S o v e r e
i g n B o n d H o l d i n g s ( b n E U R )
Date
Source: Deutsche Bundesbank Securities Holdings Statistics; own calculations.