Embed Size (px)
Citation preview

The financial information reported in this document is based on the unaudited interim condensed consolidated financial statements for the quarter ended January 31, 2021 and is prepared in accordance with International Financial Reporting Standards (IFRS) as issued by the International Accounting Standards Board (IASB), unless otherwise indicated. IFRS represent Canadian generally accepted accounting principles (GAAP). All amounts are presented in Canadian dollars. MONTREAL, February 24, 2021 – For the first quarter of 2021, National Bank is reporting net income of $761 million compared to $610 million in the first quarter of 2020, an increase of 25%. First-quarter diluted earnings per share stood at $2.15 compared to $1.67 in the first quarter of 2020, an increase of 29%. These year-over-year increases were driven by net income growth across all the business segments. Commenting on the Bank’s financial results for the first quarter of 2021, Louis Vachon, President and Chief Executive Officer of National Bank of Canada, stated: “I am very satisfied with our performance, which was driven by strong momentum in all of our businesses. The Bank generated a strong ROE for the quarter, while maintaining robust capital levels and significant reserves for credit losses. This speaks to the adaptability of our franchise and sound diversification of our earnings stream.”
(millions of Canadian dollars) Quarter ended January 31
2021 2020 % Change
Net income 761 610 25 Diluted earnings per share (dollars) $ 2.15 $ 1.67 29 Return on common shareholders’ equity(1) 21.2 % 18.0 % Dividend payout ratio 45.7 % 41.4 %
Excluding specified items(1) Net income excluding specified items 761 620 23 Diluted earnings per share excluding specified items (dollars) $ 2.15 $ 1.70 26 Return on common shareholders’ equity excluding specified items 21.2 % 18.3 % Dividend payout ratio excluding specified items 43.4 % 41.1 %
As at January 31,
2021
As at October 31,
2020
CET1 capital ratio under Basel III 11.9 % 11.8 % Leverage ratio under Basel III 4.3 % 4.4 %
(1) See the Financial Reporting Method section on page 6 for additional information on non-GAAP financial measures.

— Net income totalled $262 million in the first quarter of 2021 compared to $242 million in the first quarter of 2020, an increase of 8%. — Income before provisions for credit losses and income taxes(1) totalled $412 million in the first quarter of 2021, up 3% from $400 million in the first
quarter of 2020. — At $902 million, the 2021 first-quarter total revenues were up $23 million or 3% year over year, mainly due to the increase in net interest income driven
by growth in loan and deposit volumes. — Compared to a year ago, personal lending grew 6% and commercial lending grew 3%. — Net interest margin stood at 2.18% in the first quarter of 2021 versus 2.21% in the first quarter of 2020. — First-quarter non-interest expenses stood at $490 million, up 2% from the first quarter of 2020. — At 54.3%, the efficiency ratio(1) improved from 54.5% in the first quarter of 2020.
— Net income totalled $160 million in the first quarter of 2021, a 20% increase from $133 million in the first quarter of 2020. — First-quarter total revenues amounted to $519 million compared to $466 million in the first quarter of 2020, a $53 million or 11% increase driven mainly
by growth in transaction-based and other revenues as well as in fee-based revenues. — First-quarter non-interest expenses stood at $303 million, up 6% from $285 million in the first quarter of 2020. — At 58.4%, the efficiency ratio(1) improved from 61.2% in the first quarter of 2020.
— Net income totalled $250 million in the first quarter of 2021, a 37% increase from $183 million in the first quarter of 2020. — Total revenues on a taxable equivalent basis(1) amounted to $577 million, a $119 million or 26% year-over-year increase. — First-quarter non-interest expenses stood at $228 million compared to $200 million in the first quarter of 2020, an increase in part attributable to
variable compensation. — At 39.5%, the first-quarter efficiency ratio on a taxable equivalent basis(1) improved from 43.7% in the first quarter of 2020.
— Net income totalled $136 million in the first quarter of 2021, a 60% increase from $85 million in the same quarter of 2020. — First-quarter total revenues amounted to $274 million, a 41% year-over-year increase driven by revenue growth at the Credigy and ABA Bank subsidiaries. — First-quarter non-interest expenses stood at $83 million, an increase of 6%. — At 30.3%, the first-quarter efficiency ratio(1) improved by almost 10 percentage points compared to the same quarter in 2020.
— Net loss of $47 million in the first quarter of 2021 compared to a net loss of $33 million in the first quarter of 2020. This change came from a lower contribution from Treasury activities and from an increase in non-interest expenses due to higher variable compensation, COVID-19 expenses, and technology investment expenses.
— As at January 31, 2021, the Common Equity Tier 1 (CET1) capital ratio under Basel III stood at 11.9%, up from 11.8% as at October 31, 2020. — As at January 31, 2021, the Basel III leverage ratio was 4.3%, a decrease from 4.4% as at October 31, 2020.
(1) See the Financial Reporting Method section on page 6 for additional information on non-GAAP financial measures.

The following Management’s Discussion and Analysis (MD&A) presents the financial condition and operating results of National Bank of Canada (the Bank). This analysis was prepared in accordance with the requirements set out in National Instrument 51-102, Continuous Disclosure Obligations, released by the Canadian Securities Administrators (CSA). It is based on the unaudited interim condensed consolidated financial statements (the consolidated financial statements) for the quarter ended January 31, 2021 and prepared in accordance with International Financial Reporting Standards (IFRS) as issued by the International Accounting Standards Board (IASB), unless otherwise indicated. IFRS represent Canadian generally accepted accounting principles (GAAP). This MD&A should be read in conjunction with the consolidated financial statements and accompanying notes for the quarter ended January 31, 2021 and with the 2020 Annual Report. All amounts are presented in Canadian dollars. Additional information about the Bank, including the Annual Information Form, can be obtained from the Bank’s website at nbc.ca and SEDAR’s website at sedar.com.
Caution Regarding Forward-Looking Statements From time to time, the Bank makes written forward-looking statements such as those contained in this document, in other filings with Canadian securities regulators, and in other communications. In addition, representatives of the Bank may make forward-looking statements orally to analysts, investors, the media and others. All such statements are made in accordance with applicable securities legislation in Canada and the United States. Forward-looking statements in this document may include, but are not limited to, statements with respect to the economy—particularly the Canadian and U.S. economies—market changes, the Bank’s objectives, outlook and priorities for fiscal year 2021 and beyond, its strategies or future actions for achieving them, expectations for the Bank’s financial condition, the regulatory environment in which it operates, the potential impacts of—and the Bank’s response to—the COVID-19 pandemic, and certain risks it faces. These forward-looking statements are typically identified by future or conditional verbs or words such as “outlook”, “believe”, “foresee”, “forecast”, “anticipate”, “estimate”, “project”, “expect”, “intend”, “plan”, and similar expressions of future or conditional verbs such as “will”, “may”, “should”, “could” or “would”. Such forward-looking statements are made for the purpose of assisting the holders of the Bank’s securities in understanding the Bank’s financial position and results of operations as at and for the periods ended on the dates presented, as well as the Bank’s vision, strategic objectives and its financial performance targets, and may not be appropriate for other purposes. By their very nature, these forward-looking statements require assumptions to be made and involve inherent risks and uncertainties, both general and specific. Assumptions about the performance of the Canadian and U.S. economies in 2021, including in the context of the COVID-19 pandemic, and how that will affect the Bank’s business are among the main factors considered in setting the Bank’s strategic priorities and objectives, including provisions for credit losses. In determining its expectations for economic conditions, both broadly and in the financial services sector in particular, the Bank primarily considers historical economic data provided by the governments of Canada, the United States and certain other countries in which the Bank conducts business, as well as their agencies. There is a strong possibility that the Bank’s express or implied predictions, forecasts, projections, expectations or conclusions will not prove to be accurate, that its assumptions may not be confirmed and that its vision, strategic objectives and financial performance targets will not be achieved. The Bank recommends that readers not place undue reliance on forward-looking statements, as a number of factors, many of which are beyond the Bank’s control, including the impacts of the COVID-19 pandemic, could cause actual results to differ significantly from the expectations, estimates or intentions expressed in these forward-looking statements. These factors include credit risk, market risk, liquidity and funding risk, operational risk, regulatory compliance risk, reputation risk, strategic risk and environmental and social risk, all of which are described in more detail in the Risk Management section beginning on page 68 of the Bank’s 2020 Annual Report, and more specifically, general economic environment and financial market conditions in Canada, the United States and certain other countries in which the Bank conducts business; regulatory changes affecting the Bank’s business; geopolitical and sociopolitical uncertainty; important changes in consumer behaviour; the housing and household indebtedness situation and real estate market in Canada; changes in the Bank’s customers’ and counterparties’ performance and creditworthiness; changes in the accounting policies the Bank uses to report its financial condition, including uncertainties associated with assumptions and critical accounting estimates; tax laws in the countries in which the Bank operates, primarily Canada and the United States; changes to capital and liquidity guidelines and to the manner in which they are to be presented and interpreted; changes to the credit ratings assigned to the Bank; potential disruption to key suppliers of goods and services to the Bank; potential disruptions to the Bank’s information technology systems, including evolving cyberattack risk as well as identity theft and theft of personal information; and possible impacts of catastrophic events affecting local and global economies, including natural disasters and public health emergencies such as the COVID-19 pandemic. Statements about the expected impacts of the COVID-19 pandemic on the Bank’s business, results of operations, reputation, financial position and liquidity, and on the global economy may be inaccurate and differ, possibly materially, from what is currently expected as they depend on future developments that are highly uncertain and cannot be predicted. The foregoing list of risk factors is not exhaustive. Additional information about these factors can be found in the COVID-19 Pandemic and Risk Management sections of the Bank’s 2020 Annual Report and in this Report to Shareholders for the First Quarter of 2021, especially in the COVID-19 Pandemic section. Investors and others who rely on the Bank’s forward-looking statements should carefully consider the above factors as well as the uncertainties they represent and the risks they entail. Except as required by law, the Bank does not undertake to update any forward-looking statements, whether written or oral, that may be made from time to time, by it or on its behalf.
COVID-19 Pandemic 4 Securitization and Off-Balance-Sheet Arrangements 17 Economic Review and Outlook 5 Capital Management 18 Financial Reporting Method 6 Risk Management 23 Highlights 7 Risk Disclosures 38 Financial Analysis 8 Accounting Policies and Financial Disclosure 39
Consolidated Results 8 Accounting Policies and Critical Accounting Estimates 39 Results by Segment 10 Accounting Policy Changes 39 Consolidated Balance Sheet 15 Future Accounting Policy Changes 41 Acquisition 16 Financial Disclosure 41 Exposures to Certain Activities 17 Quarterly Financial Information 42 Related Party Transactions 17

On March 11, 2020, the World Health Organization (WHO) declared that the COVID-19 outbreak constituted a pandemic, requiring that important protective measures be taken to prevent overcrowding of health services and to strengthen preventive hygiene. The global pandemic prompted many countries, including Canada, to implement lockdown and social distancing measures designed to slow down new outbreaks. Those measures included the closing of borders in many countries. This exceptional situation has led to significant changes in the overall market environment, including business closures, temporary layoffs, low interest rates and the government measures implemented in response to COVID-19. Certain restrictions imposed at the start of the pandemic were eased during the summer of 2020, but a second wave of COVID-19 in early fall forced authorities in a number of countries, including Canada, to reintroduce some lockdown measures, effectively shutting down parts of the economy again. Although the recent introduction of several vaccines against COVID-19 constitutes an encouraging development, uncertainty remains as to their effectiveness, their distribution, their acceptance by the public and the reduction of the anticipated infection rates, in particular following the multiplication of cases linked to COVID-19 variants that appear to be more contagious. Authorities in a number of countries, including Canada, are working actively to ensure that vaccines are administered as quickly as possible. It is anticipated that certain measures by the public health authorities in Canada will remain in place until extensive immunization is achieved in order to continue to limit the spread of COVID-19 and its variants. In Canada, banking services are considered essential services and are therefore being maintained despite the lockdown and social distancing measures. Given the current economic and social conditions, the Bank is committed to supporting its employees, clients, and communities. The Bank has ensured the continuity of all its activities since the beginning of this unprecedented crisis. All of its experts have been mobilized to guide and support clients and answer their questions during this ongoing period of uncertainty. In addition to the impacts of the COVID-19 pandemic on the global economy and in the countries where the Bank conducts business, the pandemic has affected and may continue to affect the Bank, the way it conducts business, and its clients. The Bank continues to closely monitor the effects and potential consequences of the COVID-19 pandemic. The actual impacts will depend on future events that are highly uncertain, including the extent, severity and duration of the COVID-19 pandemic and its variants, as well as the effectiveness of actions and measures taken by governments, monetary authorities and regulators over the long term. For additional information on the impact of the COVID-19 risk factor, on relief measures offered to the Bank’s clients and on the measures introduced by regulators, see the COVID-19 Pandemic section of the 2020 Annual Report, on pages 16 to 21. A number of relief measures offered to the Bank’s clients ended at the end of 2020, although some new measures are being offered in connection with various government programs in which the Bank continues to participate. These new measures mainly consist of loans subject to government guarantees, particularly for businesses in sectors that were among the hardest hit by the pandemic. The Bank is continuing to address the specific needs of its clients in the normal course of business to support them during this unprecedented crisis. The number of loans and gross carrying value of loans subject to deferrals are presented in the following table. Payment Deferrals (millions of Canadian dollars) As at January 31, 2021 As at October 31, 2020
Number of loans
Gross carrying value of loans
Number of loans
Gross carrying value of loans
Residential mortgage 1,441 309 2,865 695 Personal − − − − Credit card − − − − Business and government 89 349 780 1,182
1,530 658 3,645 1,877

Global Economy After spiking in late 2020 and in early 2021, the number of new coronavirus infections now appears to be on the decline in various regions around the globe. If this trend continues, many countries should be able to relax certain social distancing measures within the coming weeks. However, people should not expect a return to normal life in the near future. It is important to remember that a number of countries are now dealing with more contagious variants of the virus. Public health authorities must take a cautious approach to avoid yet another wave. While mass vaccination could change everything, the worldwide vaccination campaign is lagging behind. After a bumpy first six months, the global economy is expected to strengthen in the latter half of the year, provided that vaccines can be rolled out without too many setbacks. The monetary and fiscal stimulus measures being provided to support household spending in advanced economies were beneficial to emerging-market economies, which produce most of the goods manufactured around the world. In fact, industrial production in these countries entered a phase of economic expansion while advanced economies are still recovering and have yet to return to pre-pandemic production levels. Global GDP is expected to rebound by 5.4%(1) this year, after contracting by a record 3.4% in 2020. Despite the recent drop in the number of COVID-19 cases in the United States, the country continues to be in the grips of a serious health crisis. However, U.S. tolerance for high infection levels is limiting negative economic fallout from the pandemic. Despite a spike in the number of infections in the final quarter of 2020, U.S. GDP recorded a 4.0% growth in annualized terms. In the wake of this increase, production stood at 2.5% below pre-pandemic levels, which compares favourably with the variances seen in other advanced economies. One key factor that explains the good performance of the U.S. economy is Washington’s response to the crisis. Only a few weeks after President Trump signed the $900 billion recovery plan, the new Biden administration is already promising a new $1,900 billion package. This would bring Washington’s total fiscal stimulus spending to more than $5,000 billion since the start of the crisis, which is much higher than the approximately $750 billion in stimulus spending in 2008-2009. As we await the details of the new stimulus package, growth is expected to rebound by a solid 5.2%(1) in 2021 after contracting by 3.5% last year. Canadian Economy The most recent public health measures have paid off in Canada, since the number of COVID-19 cases overwhelming the health care system is on the decline. Ontario and Quebec ordered the closure of non-essential businesses to achieve this objective. In other words, governments encountered obstacles as they tried to get the pandemic under control and the economy may contract in the first quarter as a result. The labour market lost no fewer than 266,000 jobs in December and January, eliminating the progress made since August. However, if the sectors directly impacted by the lockdown measures are excluded, employment numbers continued to increase in January. Another positive development in the report is the fact that full-time employment continues to show resilience, recording a new increase during the month, for a ninth month of consecutive gains. We are therefore not overly concerned by this temporary dry spell caused by the public health measures, which do not seem to be having repercussions beyond the sectors that are directly impacted. The decrease in the number of new cases in the country suggests a loosening of public health measures in the near future. While this positive development could be delayed by a slower rollout of vaccines, the light at the end of the tunnel is boosting business confidence, suggesting that employment numbers and economic performance will rebound solidly once the pandemic is under control. The growth outlook for the rest of year also seems more encouraging since Canada is expected to benefit indirectly from the generosity of the U.S. government, which will be felt for exports, and since Canada’s raw materials price index is at its highest level since 2014. This should allow for economic growth to rebound by 4.2%(1) in 2021 after contracting by 5.4% last year. Quebec Economy To limit the growing spread of COVID-19, Quebec ordered the closure of bars, restaurant dining rooms, public venues and gyms in a number of affected regions last October. In December 2020, the government introduced additional measures, ordering the closure of non-essential businesses. Between September and January, Quebec’s labour market lost 120,000 jobs, a decline of 3%. This is not much compared to the severe 19% decline last spring. This time, however, the sector-based closures are much more focused, thereby limiting the economic consequences. Most of the job losses are related to part-time positions in sectors with below-average salaries. Given the generous income support programs currently being provided by the federal government, household income is not expected to be severely impacted by the devastating job market situation. The resilience of full-time employment explains the vibrant real estate market, which has not slowed down in recent months. Housing prices in the greater Montreal area are up nearly 16% since last year, an increase not seen in 30 years. The sea change in preferences attributable to the pandemic has generated significant real estate activity and lower borrowing costs have provided buyers with more spending power. The economy is expected to resume its growth trajectory in February 2021 since a significant drop in the number of hospitalizations has made it possible to reopen non-essential businesses. We remain optimistic about the next stages of the recovery given the budget maneuvering room enjoyed by the Quebec government as well as the fact that Quebec households are in a better financial position than elsewhere in Canada. After contracting by 5.2% in 2020, the Quebec economy is expected to rebound by 3.9%(1) in 2021.
(1) GDP growth forecasts, Economy and Strategy group, National Bank Financial
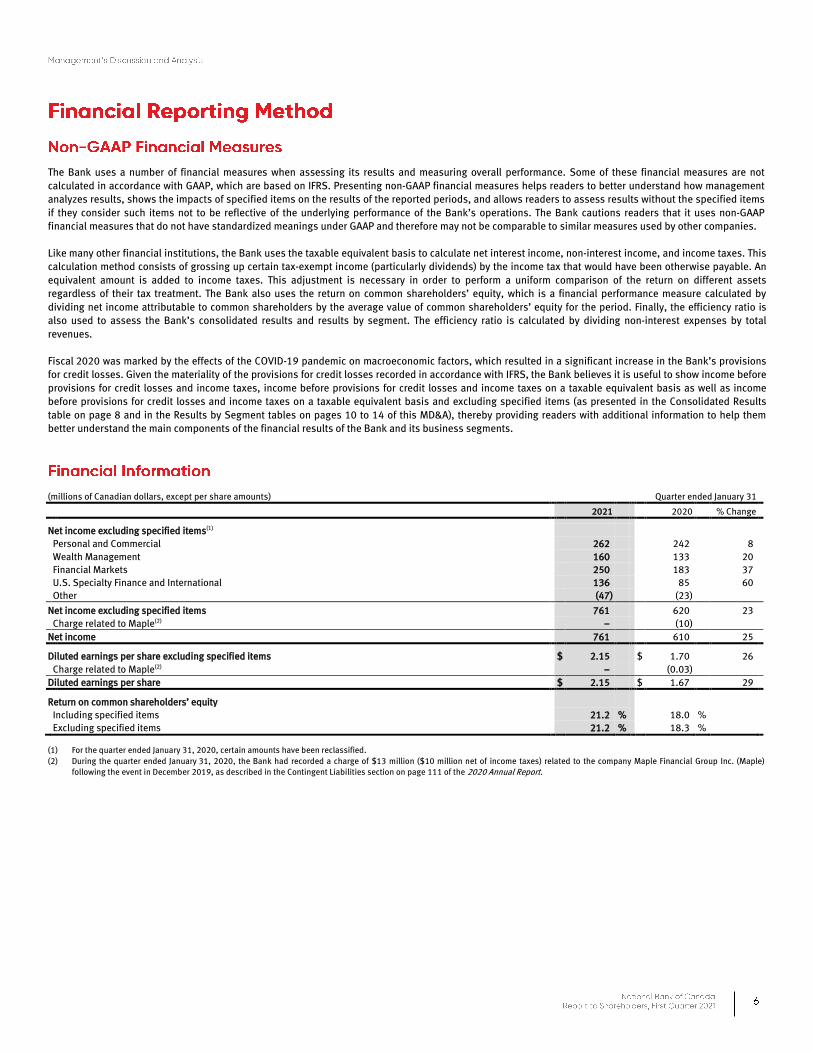
The Bank uses a number of financial measures when assessing its results and measuring overall performance. Some of these financial measures are not calculated in accordance with GAAP, which are based on IFRS. Presenting non-GAAP financial measures helps readers to better understand how management analyzes results, shows the impacts of specified items on the results of the reported periods, and allows readers to assess results without the specified items if they consider such items not to be reflective of the underlying performance of the Bank’s operations. The Bank cautions readers that it uses non-GAAP financial measures that do not have standardized meanings under GAAP and therefore may not be comparable to similar measures used by other companies. Like many other financial institutions, the Bank uses the taxable equivalent basis to calculate net interest income, non-interest income, and income taxes. This calculation method consists of grossing up certain tax-exempt income (particularly dividends) by the income tax that would have been otherwise payable. An equivalent amount is added to income taxes. This adjustment is necessary in order to perform a uniform comparison of the return on different assets regardless of their tax treatment. The Bank also uses the return on common shareholders’ equity, which is a financial performance measure calculated by dividing net income attributable to common shareholders by the average value of common shareholders’ equity for the period. Finally, the efficiency ratio is also used to assess the Bank’s consolidated results and results by segment. The efficiency ratio is calculated by dividing non-interest expenses by total revenues. Fiscal 2020 was marked by the effects of the COVID-19 pandemic on macroeconomic factors, which resulted in a significant increase in the Bank’s provisions for credit losses. Given the materiality of the provisions for credit losses recorded in accordance with IFRS, the Bank believes it is useful to show income before provisions for credit losses and income taxes, income before provisions for credit losses and income taxes on a taxable equivalent basis as well as income before provisions for credit losses and income taxes on a taxable equivalent basis and excluding specified items (as presented in the Consolidated Results table on page 8 and in the Results by Segment tables on pages 10 to 14 of this MD&A), thereby providing readers with additional information to help them better understand the main components of the financial results of the Bank and its business segments.
(millions of Canadian dollars, except per share amounts) Quarter ended January 31
2021 2020 % Change
Net income excluding specified items(1) Personal and Commercial 262 242 8 Wealth Management 160 133 20 Financial Markets 250 183 37 U.S. Specialty Finance and International 136 85 60 Other (47) (23) 761 Net income excluding specified items 761 620 23 Charge related to Maple(2) − (10) Net income 761 610 25
Diluted earnings per share excluding specified items $ 2.15 $ 1.70 26 Charge related to Maple(2) − (0.03) Diluted earnings per share $ 2.15 $ 1.67 29
Return on common shareholders’ equity Including specified items 21.2 % 18.0 % Excluding specified items 21.2 % 18.3 %
(1) For the quarter ended January 31, 2020, certain amounts have been reclassified. (2) During the quarter ended January 31, 2020, the Bank had recorded a charge of $13 million ($10 million net of income taxes) related to the company Maple Financial Group Inc. (Maple)
following the event in December 2019, as described in the Contingent Liabilities section on page 111 of the 2020 Annual Report.

(millions of Canadian dollars, except per share amounts) Quarter ended January 31 2021 2020 % Change
Operating results Total revenues 2,224 1,923 16 Income before provisions for credit losses and income taxes(1) 1,044 832 25 Net income 761 610 25 Net income attributable to the Bank’s shareholders and holders of other equity instruments 761 594 28 Return on common shareholders’ equity(1) 21.2 % 18.0 % Earnings per share Basic $ 2.16 $ 1.69 28 Diluted 2.15 1.67 29 Operating results on a taxable equivalent basis and excluding specified items(1)
Total revenues on a taxable equivalent basis 2,281 2,010 13 Income before provisions for credit losses and income taxes on a taxable equivalent basis and excluding specified items 1,101 932 18 Net income excluding specified items 761 620 23 Return on common shareholders’ equity excluding specified items 21.2 % 18.3 % Efficiency ratio on a taxable equivalent basis and excluding specified items 51.7 % 53.6 % Earnings per share excluding specified items(1) Basic $ 2.16 $ 1.72 26 Diluted 2.15 1.70 26 Common share information Dividends declared $ 0.71 $ 0.71 − Book value 41.48 37.58 Share price High 73.81 74.22 Low 65.54 68.25 Close 71.87 73.43 Number of common shares (thousands) 336,770 335,818 Market capitalization 24,204 24,659
(millions of Canadian dollars)
As at January 31,
2021
As at October 31,
2020 % Change
Balance sheet and off-balance-sheet Total assets 343,637 331,625 4 Loans and acceptances, net of allowances 167,690 164,740 2 Deposits 227,677 215,878 5 Equity attributable to common shareholders 13,970 13,430 4 Assets under administration and under management 656,263 596,656 10 Regulatory ratios under Basel III(2) Capital ratios Common Equity Tier 1 (CET1) 11.9 % 11.8 % Tier 1 14.9 % 14.9 % Total 16.0 % 16.0 %
Leverage ratio 4.3 % 4.4 %
Liquidity coverage ratio (LCR) 154 % 161 %
Net stable funding ratio (NSFR) 124 %
Regulatory ratios under Basel III (adjusted)(3) Capital ratios CET1 11.7 % 11.5 % Tier 1 14.8 % 14.6 % Total 16.0 % 16.0 %
Leverage ratio 4.3 % 4.3 %
Other information Number of employees – Worldwide 26,231 26,517 (1) Number of branches in Canada 402 403 − Number of banking machines in Canada 935 940 (1)
(1) See the Financial Reporting Method section on page 6 for additional information on non-GAAP financial measures. (2) The ratios include the transitional measures granted by the Office of the Superintendent of Financial Institutions (Canada) (OSFI). For additional information, see the section entitled
COVID-19 Pandemic – Key Measures Introduced by the Regulatory Authorities on pages 20 and 21 of the 2020 Annual Report. (3) The adjusted ratios do not include the transitional measure applicable to expected credit loss provisioning. For additional information, see the section entitled COVID-19 Pandemic – Key
Measures Introduced by the Regulatory Authorities on pages 20 and 21 of the 2020 Annual Report.

(millions of Canadian dollars) Quarter ended January 31
2021 2020 % Change
Operating results Net interest income 1,207 930 30 Non-interest income 1,017 993 2 Total revenues 2,224 1,923 16 Non-interest expenses 1,180 1,091 8 Income before provisions for credit losses and income taxes(1) 1,044 832 25 Provisions for credit losses 81 89 (9) Income before income taxes 963 743 30 Income taxes 202 133 52 Net income 761 610 25 Diluted earnings per share (dollars) 2.15 1.67 29
Taxable equivalent basis(1) Net interest income 54 57 Non-interest income 3 30 Income taxes 57 87 Impact of taxable equivalent basis on net income − −
Specified items(1) Charge related to Maple − (13) Specified items before income taxes − (13) Income taxes on specified items − (3) Specified items after income taxes − (10)
Operating results on a taxable equivalent basis and excluding specified items(1) Net interest income on a taxable equivalent basis 1,261 987 28
Non-interest income on a taxable equivalent basis 1,020 1,023 − Total revenues on a taxable equivalent basis 2,281 2,010 13 Non-interest expenses excluding specified items 1,180 1,078 9 Income before provisions for credit losses and income taxes on a taxable equivalent basis and excluding specified items 1,101 932 18 Provisions for credit losses 81 89 (9) Income before income taxes on a taxable equivalent basis and excluding specified items 1,020 843 21 Income taxes on a taxable equivalent basis and excluding specified items 259 223 16 Net income excluding specified items 761 620 23 Diluted earnings per share excluding specified items (dollars) 2.15 1.70 26
Average assets 358,113 301,511 19 Average loans and acceptances 165,588 154,558 7 Average deposits 227,641 198,974 14 Efficiency ratio on a taxable equivalent basis and excluding specified items(1) 51.7 % 53.6 %
(1) See the Financial Reporting Method section on page 6 for additional information on non-GAAP financial measures.
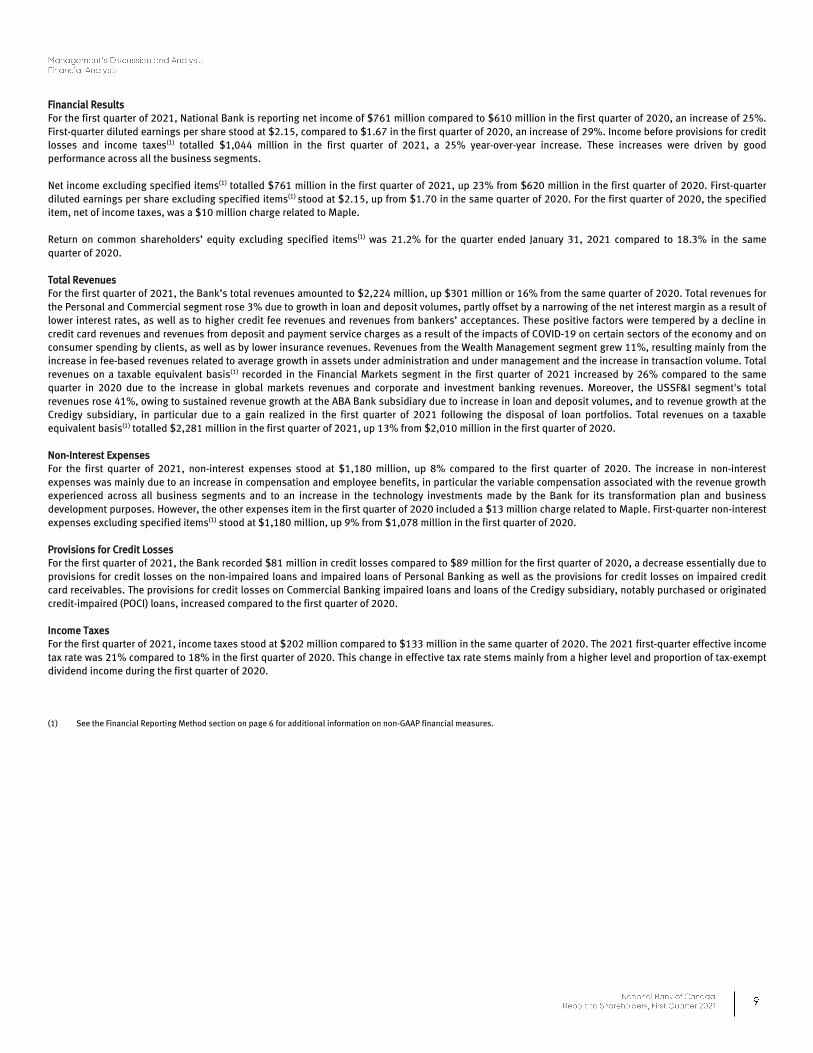
Financial Results For the first quarter of 2021, National Bank is reporting net income of $761 million compared to $610 million in the first quarter of 2020, an increase of 25%. First-quarter diluted earnings per share stood at $2.15, compared to $1.67 in the first quarter of 2020, an increase of 29%. Income before provisions for credit losses and income taxes(1) totalled $1,044 million in the first quarter of 2021, a 25% year-over-year increase. These increases were driven by good performance across all the business segments. Net income excluding specified items(1) totalled $761 million in the first quarter of 2021, up 23% from $620 million in the first quarter of 2020. First-quarter diluted earnings per share excluding specified items(1) stood at $2.15, up from $1.70 in the same quarter of 2020. For the first quarter of 2020, the specified item, net of income taxes, was a $10 million charge related to Maple. Return on common shareholders’ equity excluding specified items(1) was 21.2% for the quarter ended January 31, 2021 compared to 18.3% in the same quarter of 2020. Total Revenues For the first quarter of 2021, the Bank’s total revenues amounted to $2,224 million, up $301 million or 16% from the same quarter of 2020. Total revenues for the Personal and Commercial segment rose 3% due to growth in loan and deposit volumes, partly offset by a narrowing of the net interest margin as a result of lower interest rates, as well as to higher credit fee revenues and revenues from bankers’ acceptances. These positive factors were tempered by a decline in credit card revenues and revenues from deposit and payment service charges as a result of the impacts of COVID-19 on certain sectors of the economy and on consumer spending by clients, as well as by lower insurance revenues. Revenues from the Wealth Management segment grew 11%, resulting mainly from the increase in fee-based revenues related to average growth in assets under administration and under management and the increase in transaction volume. Total revenues on a taxable equivalent basis(1) recorded in the Financial Markets segment in the first quarter of 2021 increased by 26% compared to the same quarter in 2020 due to the increase in global markets revenues and corporate and investment banking revenues. Moreover, the USSF&I segment's total revenues rose 41%, owing to sustained revenue growth at the ABA Bank subsidiary due to increase in loan and deposit volumes, and to revenue growth at the Credigy subsidiary, in particular due to a gain realized in the first quarter of 2021 following the disposal of loan portfolios. Total revenues on a taxable equivalent basis(1) totalled $2,281 million in the first quarter of 2021, up 13% from $2,010 million in the first quarter of 2020. Non-Interest Expenses For the first quarter of 2021, non-interest expenses stood at $1,180 million, up 8% compared to the first quarter of 2020. The increase in non-interest expenses was mainly due to an increase in compensation and employee benefits, in particular the variable compensation associated with the revenue growth experienced across all business segments and to an increase in the technology investments made by the Bank for its transformation plan and business development purposes. However, the other expenses item in the first quarter of 2020 included a $13 million charge related to Maple. First-quarter non-interest expenses excluding specified items(1) stood at $1,180 million, up 9% from $1,078 million in the first quarter of 2020. Provisions for Credit Losses For the first quarter of 2021, the Bank recorded $81 million in credit losses compared to $89 million for the first quarter of 2020, a decrease essentially due to provisions for credit losses on the non-impaired loans and impaired loans of Personal Banking as well as the provisions for credit losses on impaired credit card receivables. The provisions for credit losses on Commercial Banking impaired loans and loans of the Credigy subsidiary, notably purchased or originated credit-impaired (POCI) loans, increased compared to the first quarter of 2020. Income Taxes For the first quarter of 2021, income taxes stood at $202 million compared to $133 million in the same quarter of 2020. The 2021 first-quarter effective income tax rate was 21% compared to 18% in the first quarter of 2020. This change in effective tax rate stems mainly from a higher level and proportion of tax-exempt dividend income during the first quarter of 2020. (1) See the Financial Reporting Method section on page 6 for additional information on non-GAAP financial measures.
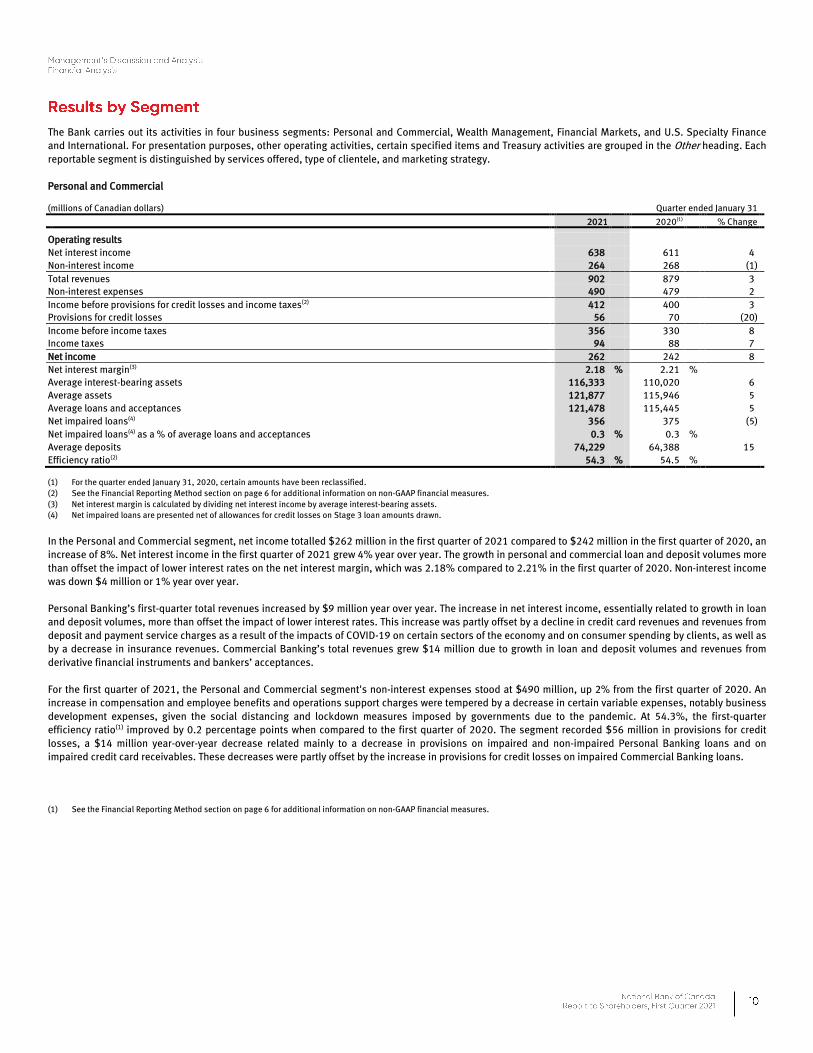
The Bank carries out its activities in four business segments: Personal and Commercial, Wealth Management, Financial Markets, and U.S. Specialty Finance and International. For presentation purposes, other operating activities, certain specified items and Treasury activities are grouped in the Other heading. Each reportable segment is distinguished by services offered, type of clientele, and marketing strategy. Personal and Commercial
(millions of Canadian dollars) Quarter ended January 31
2021 2020(1) % Change Operating results Net interest income 638 611 4 Non-interest income 264 268 (1) Total revenues 902 879 3 Non-interest expenses 490 479 2 Income before provisions for credit losses and income taxes(2) 412 400 3 Provisions for credit losses 56 70 (20) Income before income taxes 356 330 8 Income taxes 94 88 7 Net income 262 242 8 Net interest margin(3) 2.18 % 2.21 % Average interest-bearing assets 116,333 110,020 6 Average assets 121,877 115,946 5 Average loans and acceptances 121,478 115,445 5 Net impaired loans(4) 356 375 (5) Net impaired loans(4) as a % of average loans and acceptances 0.3 % 0.3 % Average deposits 74,229 64,388 15 Efficiency ratio(2) 54.3 % 54.5 %
(1) For the quarter ended January 31, 2020, certain amounts have been reclassified. (2) See the Financial Reporting Method section on page 6 for additional information on non-GAAP financial measures. (3) Net interest margin is calculated by dividing net interest income by average interest-bearing assets. (4) Net impaired loans are presented net of allowances for credit losses on Stage 3 loan amounts drawn.
In the Personal and Commercial segment, net income totalled $262 million in the first quarter of 2021 compared to $242 million in the first quarter of 2020, an increase of 8%. Net interest income in the first quarter of 2021 grew 4% year over year. The growth in personal and commercial loan and deposit volumes more than offset the impact of lower interest rates on the net interest margin, which was 2.18% compared to 2.21% in the first quarter of 2020. Non-interest income was down $4 million or 1% year over year. Personal Banking’s first-quarter total revenues increased by $9 million year over year. The increase in net interest income, essentially related to growth in loan and deposit volumes, more than offset the impact of lower interest rates. This increase was partly offset by a decline in credit card revenues and revenues from deposit and payment service charges as a result of the impacts of COVID-19 on certain sectors of the economy and on consumer spending by clients, as well as by a decrease in insurance revenues. Commercial Banking’s total revenues grew $14 million due to growth in loan and deposit volumes and revenues from derivative financial instruments and bankers’ acceptances. For the first quarter of 2021, the Personal and Commercial segment's non-interest expenses stood at $490 million, up 2% from the first quarter of 2020. An increase in compensation and employee benefits and operations support charges were tempered by a decrease in certain variable expenses, notably business development expenses, given the social distancing and lockdown measures imposed by governments due to the pandemic. At 54.3%, the first-quarter efficiency ratio(1) improved by 0.2 percentage points when compared to the first quarter of 2020. The segment recorded $56 million in provisions for credit losses, a $14 million year-over-year decrease related mainly to a decrease in provisions on impaired and non-impaired Personal Banking loans and on impaired credit card receivables. These decreases were partly offset by the increase in provisions for credit losses on impaired Commercial Banking loans. (1) See the Financial Reporting Method section on page 6 for additional information on non-GAAP financial measures.
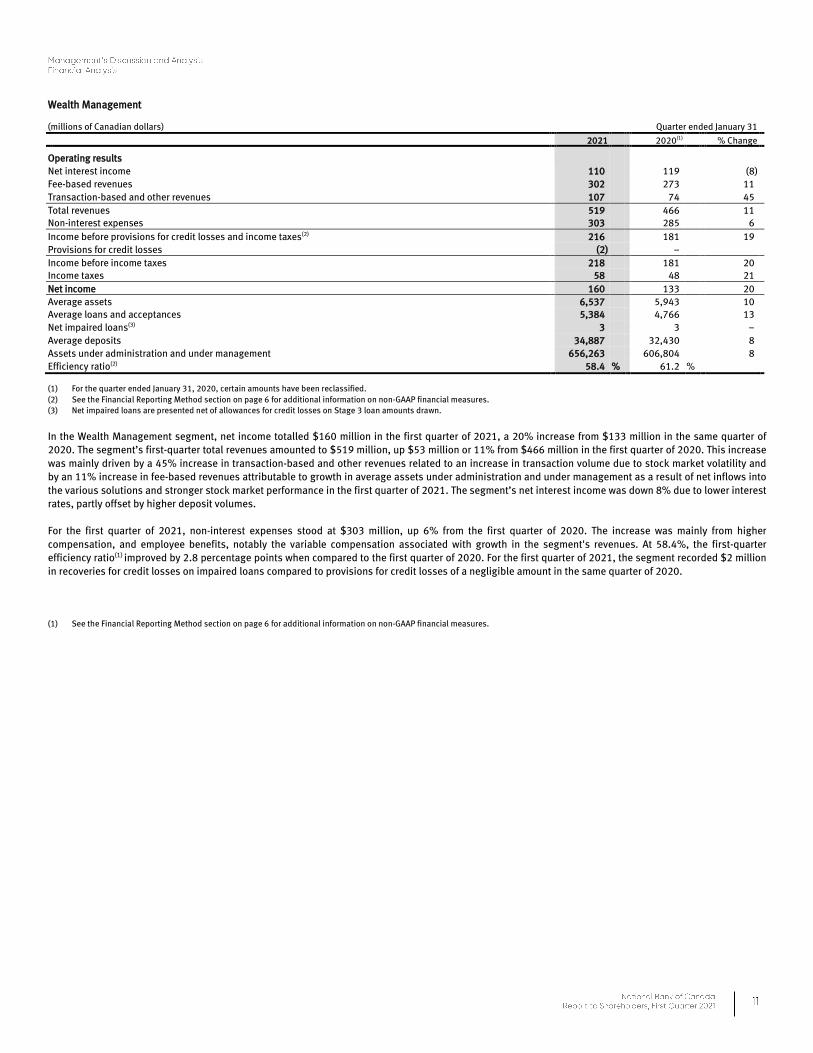
Wealth Management
(millions of Canadian dollars) Quarter ended January 31
2021 2020(1) % Change Operating results Net interest income 110 119 (8) Fee-based revenues 302 273 11 Transaction-based and other revenues 107 74 45 Total revenues 519 466 11 Non-interest expenses 303 285 6
Income before provisions for credit losses and income taxes(2) 216 181 19 Provisions for credit losses (2) − Income before income taxes 218 181 20 Income taxes 58 48 21 Net income 160 133 20 Average assets 6,537 5,943 10 Average loans and acceptances 5,384 4,766 13 Net impaired loans(3) 3 3 − Average deposits 34,887 32,430 8 Assets under administration and under management 656,263 606,804 8 Efficiency ratio(2) 58.4 % 61.2 %
(1) For the quarter ended January 31, 2020, certain amounts have been reclassified. (2) See the Financial Reporting Method section on page 6 for additional information on non-GAAP financial measures. (3) Net impaired loans are presented net of allowances for credit losses on Stage 3 loan amounts drawn.
In the Wealth Management segment, net income totalled $160 million in the first quarter of 2021, a 20% increase from $133 million in the same quarter of 2020. The segment’s first-quarter total revenues amounted to $519 million, up $53 million or 11% from $466 million in the first quarter of 2020. This increase was mainly driven by a 45% increase in transaction-based and other revenues related to an increase in transaction volume due to stock market volatility and by an 11% increase in fee-based revenues attributable to growth in average assets under administration and under management as a result of net inflows into the various solutions and stronger stock market performance in the first quarter of 2021. The segment’s net interest income was down 8% due to lower interest rates, partly offset by higher deposit volumes. For the first quarter of 2021, non-interest expenses stood at $303 million, up 6% from the first quarter of 2020. The increase was mainly from higher compensation, and employee benefits, notably the variable compensation associated with growth in the segment's revenues. At 58.4%, the first-quarter efficiency ratio(1) improved by 2.8 percentage points when compared to the first quarter of 2020. For the first quarter of 2021, the segment recorded $2 million in recoveries for credit losses on impaired loans compared to provisions for credit losses of a negligible amount in the same quarter of 2020. (1) See the Financial Reporting Method section on page 6 for additional information on non-GAAP financial measures.

Financial Markets
(taxable equivalent basis)(1) (millions of Canadian dollars) Quarter ended January 31
2021 2020(2) % Change Operating results Global markets Equities 201 174 16 Fixed-income 116 85 36 Commodities and foreign exchange 38 30 27 355 289 23 Corporate and investment banking 222 169 31 Total revenues on a taxable equivalent basis 577 458 26 Non-interest expenses 228 200 14 Income before provisions for credit losses and income taxes on a taxable equivalent basis(1) 349 258 35 Provisions for credit losses 9 9 − Income before income taxes on a taxable equivalent basis 340 249 37 Income taxes on a taxable equivalent basis 90 66 36 Net income 250 183 37 Average assets 151,197 121,612 24 Average loans and acceptances (Corporate Banking only) 18,522 17,025 9 Net impaired loans(3) 11 40 (73) Average deposits 39,477 34,166 16 Efficiency ratio on a taxable equivalent basis(1) 39.5 % 43.7 %
(1) See the Financial Reporting Method section on page 6 for additional information on non-GAAP financial measures. (2) For the quarter ended January 31, 2020, certain amounts have been reclassified. (3) Net impaired loans are presented net of allowances for credit losses on Stage 3 loan amounts drawn.
In the Financial Markets segment, net income totalled $250 million in the first quarter of 2021, up 37% from $183 million in the first quarter of 2020. Total revenues on a taxable equivalent basis(1) amounted to $577 million, up 26% compared to the first quarter of 2020. First-quarter global markets revenues increased by $66 million, driven by growth in all revenue categories. As for corporate and investment banking revenues, they increased $53 million from the first quarter of 2020 due to higher revenues generated by capital markets activities and revenues from banking services. First-quarter non-interest expenses stood at $228 million, up 14% from the first quarter of 2020. This increase was essentially due to the increase in variable compensation resulting from revenue growth in the first quarter of 2021 and to higher operations support charges. At 39.5%, the first-quarter efficiency ratio on a taxable equivalent basis(1) improved by 4.2 percentage points compared to 43.7% in the first quarter of 2020. The segment's first-quarter provisions for credit losses stood at $9 million, stable compared to the same quarter of 2020. (1) See the Financial Reporting Method section on page 6 for additional information on non-GAAP financial measures.

U.S. Specialty Finance and International (USSF&I)
(millions of Canadian dollars) Quarter ended January 31
2021 2020 % Change Total revenues
Credigy 155 98 58
ABA Bank 119 95 25
International − 2 274 195 41 Non-interest expenses
Credigy 39 36 8 ABA Bank 44 41 7 International − 1 83 78 6 Income before provisions for credit losses and income taxes(1) 191 117 63 Provisions for credit losses
Credigy 16 7 129
ABA Bank 2 3 (33)
18 10 80 Income before income taxes 173 107 62 Income taxes
Credigy 21 12 75
ABA Bank 16 10 60
37 22 68 Net income
Credigy 79 43 84
ABA Bank 57 41 39
International − 1
136 85 60 Non-controlling interests − 9
Net income attributable to the Bank’s shareholders and holders of other equity instruments 136 76 79 Average assets 15,545 12,494 24 Average loans and receivables 11,945 9,880 21 Net impaired loans – Stage 3(2) 30 18 67 Purchased or originated credit-impaired (POCI) loans 722 1,024 (29) Average deposits 6,175 4,373 41 Efficiency ratio(1) 30.3 % 40.0 %
(1) See the Financial Reporting Method section on page 6 for additional information on non-GAAP financial measures. (2) Net impaired loans – Stage 3 exclude POCI loans and are presented net of allowances for credit losses on Stage 3 loan amounts drawn.
In the USSF&I segment, net income totalled $136 million in the first quarter of 2021, a 60% increase from $85 million in first quarter 2020. For the first quarter of 2021, the segment’s total revenues amounted to $274 million, a $79 million or 41% increase from $195 million in first quarter 2020. The revenue growth came mainly from a $57 million increase in the revenues from the Credigy subsidiary and a $24 million increase in the revenues from the ABA Bank subsidiary. Credigy The Credigy subsidiary’s net income totalled $79 million for the first quarter of 2021, up $36 million or 84% year over year. Credigy's first-quarter total revenues amounted to $155 million, up from $98 million in the first quarter of 2020, mainly due to growth in loan volumes and to a gain of $26 million realized in the first quarter of 2021 following a disposal of loan portfolios. Credigy's first-quarter non-interest expenses increased 8%, in particular the variable compensation associated with the revenue growth during the first quarter of 2021. The 2021 first-quarter provisions for credit losses were $16 million compared to $7 million in the same quarter of 2020, a year-over-year increase essentially due to provisions for credit losses on POCI loans. During the first quarter ended January 31, 2021, the Bank acquired the entire remaining non-controlling interest in the Credigy subsidiary. For additional information, see Note 18 to these consolidated financial statements. ABA Bank For the first quarter of 2021, the ABA Bank subsidiary's net income totalled $57 million, up $16 million or 39% from the first quarter of 2020. A 25% increase in ABA Bank's first-quarter revenues was driven by sustained growth in loan and deposit volumes, partly offset by lower interest rates. The subsidiary's first-quarter non-interest expenses stood at $44 million compared to $41 million in the first quarter of 2020. Provisions for credit losses for the first quarter of 2021 totalled $2 million compared to $3 million in the same quarter of 2020.

Other
(taxable equivalent basis)(1) (millions of Canadian dollars) Quarter ended January 31
2021 2020(2) Operating results Net interest income on a taxable equivalent basis (33) (44) Non-interest income on a taxable equivalent basis 42 56 Total revenues on a taxable equivalent basis 9 12 Non-interest expenses 76 49 Income before provisions for credit losses and income taxes on a taxable equivalent basis(1) (67) (37) Provisions for credit losses − − Income before income taxes on a taxable equivalent basis (67) (37) Income taxes (recovery) on a taxable equivalent basis (20) (4) Net loss (47) (33) Non-controlling interests − 7 Net loss attributable to the Bank’s shareholders and holders of other equity instruments (47) (40)
Specified items after income taxes(1) − (10) Net loss excluding specified items(1) (47) (23) Average assets 62,957 45,516
(1) See the Financial Reporting Method section on page 6 for additional information on non-GAAP financial measures. (2) For the quarter ended January 31, 2020, certain amounts have been reclassified.
For the Other heading of segment results, there was a net loss of $47 million in the first quarter of 2021 compared to a net loss of $33 million in the same quarter of 2020. The change in total revenues on a taxable basis(1) was partly due to a lower contribution made by treasury activities compared to the first quarter of 2020. The growth in non-interest expenses was due to increased technology investments, the increase in variable compensation associated with revenue growth, and expenses incurred by the Bank to implement pandemic-related health and safety measures for employees and clients. The specified item recorded in the first quarter of fiscal 2020, net of income taxes, was a $10 million charge related to Maple. The net loss excluding specified items(1) was $47 million for the quarter ended January 31, 2021 compared to a $23 million net loss in the same quarter of 2020. (1) See the Financial Reporting Method section on page 6 for additional information on non-GAAP financial measures.

Consolidated Balance Sheet Summary
(millions of Canadian dollars) As at January 31, 2021 As at October 31, 2020 % Change
Assets Cash and deposits with financial institutions 33,726 29,142 16 Securities 110,640 102,131 8 Securities purchased under reverse repurchase agreements and securities borrowed 10,419 14,512 (28) Loans and acceptances, net of allowances 167,690 164,740 2 Other 21,162 21,100 −
343,637 331,625 4
Liabilities and equity Deposits 227,677 215,878 5 Other 98,267 98,589 − Subordinated debt 773 775 − Equity attributable to the Bank’s shareholders and holders of other equity instruments
16,920 16,380 3 Non-controlling interests − 3
343,637 331,625 4
Assets As at January 31, 2021, the Bank had total assets of $343.6 billion, a $12.0 billion or 4% increase from $331.6 billion as at October 31, 2020. Cash and deposits with financial institutions, totalling $33.7 billion as at January 31, 2021, increased by $4.6 billion, mainly due to deposits with the U.S. Federal Reserve. Since October 31, 2020, securities rose $8.5 billion due to a $10.0 billion or 13% increase in securities at fair value through profit or loss, particularly equity securities, offset by a decrease of $1.5 billion in securities other than those measured at fair value through profit or loss. Securities purchased under reverse repurchase agreements and securities borrowed decreased by $4.1 billion, mainly related to activities of the Financial Markets segment and of Treasury. Totalling $167.7 billion as at January 31, 2021, loans and acceptances, net of allowances, rose $3.0 billion or 2% compared to October 31, 2020. The following table provides a breakdown of the main loan and acceptance portfolios. (millions of Canadian dollars) As at January 31, 2021 As at October 31, 2020 As at January 31, 2020
Loans and acceptances Residential mortgage and home equity lines of credit 91,345 89,097 81,635 Personal 13,220 13,475 13,707 Credit card 1,846 2,038 2,255 Business and government 62,428 61,288 59,247 168,839 165,898 156,844 Allowances for credit losses (1,149) (1,158) (693) 167,690 164,740 156,151
Residential mortgages (including home equity lines of credit) were up $2.2 billion or 2% compared to October 31, 2020 due to sustained demand for mortgage credit. Personal loans decreased since October 31, 2020, in particular due to the disposal of loan portfolios of the Credigy subsidiary. Credit card receivables were down $0.2 billion compared to October 31, 2020, consequence of the effects of COVID-19 on consumer spending habits. Loans and acceptances to business and government were up $1.1 billion or 2% since October 31, 2020 owing to growth in Commercial Banking activities and to growth at the Credigy subsidiary. When compared to January 31, 2020, loans and acceptances grew $11.5 billion or 7%, while residential mortgages (including home equity lines of credit) were up $9.7 billion or 12% due to sustained demand for mortgage credit, the acquisition of mortgage portfolios and business growth at the ABA Bank subsidiary. Compared to a year ago, personal loans were down 4%, a decrease related essentially to the Credigy subsidiary. Credit card receivables were down $0.4 billion compared to January 31, 2020, consequence of the effects of COVID-19 on consumer spending habits. Loans and acceptances to business and government grew $3.2 billion or 5% from a year ago, driven by the activities in Commercial Banking, the Financial Markets segment and the Credigy subsidiary.

Impaired loans include loans classified in Stage 3 of the expected credit loss model and the purchased or originated credit-impaired (POCI) loans of the Credigy subsidiary. As at January 31, 2021, gross impaired loans excluding POCI loans stood at $757 million compared to $817 million as at October 31, 2020. Net impaired loans excluding POCI loans stood at $400 million as at January 31, 2021 compared to $465 million as at October 31, 2020, a $65 million decrease related mainly to decreases in the net impaired loans in the Personal Banking and Commercial Banking portfolios as well as the portfolios of the Financial Markets segment. Gross POCI loans stood at $722 million as at January 31, 2021, whereas they had stood at $855 million as at October 31, 2020 as a result of repayments and maturities of certain loan portfolios. Other assets totalling $21.2 billion as at January 31, 2021 increased $0.1 billion since October 31, 2020. Liabilities As at January 31, 2021, the Bank had total liabilities of $326.7 billion compared to $315.2 billion as at October 31, 2020. The Bank’s total deposit liability stood at $227.7 billion as at January 31, 2021 compared to $215.9 billion as at October 31, 2020, rising $11.8 billion or 5% as at October 31, 2020. As at January 31, 2021, personal deposits stood at $68.6 billion, rising $1.1 billion since October 31, 2020. This increase stems from Personal Banking activities and business growth at the ABA Bank subsidiary. Business and government deposits totalled $153.9 billion as at January 31, 2021, rising $10.1 billion from October 31, 2020. This increase came from the funding activities of the Financial Markets segment and of Treasury, including $1.3 billion in deposits subject to bank recapitalization (bail-in) conversion regulations, from the Wealth Management segment's activities, as well as from Commercial Banking activities. At $5.2 billion as at January 31, 2021, deposits from deposit-taking institutions rose $0.6 billion since October 31, 2020. Other liabilities totalling $98.3 billion as at January 31, 2021 decreased $0.3 billion compared to October 31, 2020. The increase of $1.9 billion in obligations related to securities sold short was more than offset by the $2.6 billion decrease in obligations related to securities sold under repurchase agreements and securities loaned. Equity As at January 31, 2021, equity attributable to the Bank’s shareholders and holders of other equity instruments was $16.9 billion, rising $0.5 billion since October 31, 2020. This increase came from net income net of dividends and from remeasurements of pension plans and other post-employment benefit plans. These increases were partly offset by accumulated other comprehensive income, in particular unrealized foreign exchange losses on investments in foreign operations. Lastly, non-controlling interests were down $3 million, essentially due to the purchase of the remaining non-controlling interest in the Credigy subsidiary.
On December 15, 2020, the Bank acquired the entire remaining non-controlling interest in the Credigy Ltd. subsidiary following the decision of the non-controlling shareholders to exercise their put options for an amount of $300 million according to an agreement reached in 2013. Following this transaction, Credigy Ltd. became a wholly owned subsidiary of the Bank.

The recommendations made by the Financial Stability Board’s Enhanced Disclosure Task Force (EDTF) seek to enhance the transparency and measurement of certain exposures, in particular structured entities, subprime and Alt-A exposures, collateralized debt obligations, residential and commercial mortgage-backed securities, and leveraged financing structures. The Bank does not market any specific mortgage financing program to subprime or Alt-A clients. The Bank does not have any significant direct position in residential and commercial mortgage-backed securities that are not insured by the CMHC. Credit derivative positions are presented in the Supplementary Regulatory Capital and Pillar 3 Disclosure report, which is available on the Bank’s website at nbc.ca. Leveraged finance is commonly employed to achieve a specific objective, for example, to make an acquisition, complete a buy-out or repurchase shares. Leveraged finance risk exposure takes the form of both funded and unfunded commitments. As at January 31, 2021, total commitments for this type of loan stood at $4,042 million ($3,681 million as at October 31, 2020). Details about other exposures are provided in the table on structured entities in Note 27 to the audited annual consolidated financial statements for the year ended October 31, 2020.
The Bank’s policies and procedures regarding related party transactions have not significantly changed since October 31, 2020. For additional information, see Note 28 to the audited annual consolidated financial statements for the year ended October 31, 2020.
In the normal course of business, the Bank is party to various financial arrangements that, under IFRS, are not required to be recorded on the Consolidated Balance Sheet or are recorded under amounts other than their notional or contractual values. These arrangements include, among others, transactions with structured entities, derivative financial instruments, the issuances of guarantees, credit instruments, and financial assets received as collateral. A complete analysis of these types of arrangements, including their nature, business purpose and importance, is provided on pages 57 and 58 of the 2020 Annual Report. For additional information on guarantees, commitments and structured entities, see Notes 26 and 27 to the audited annual consolidated financial statements for the year ended October 31, 2020. For additional information about financial assets transferred but not derecognized, see Note 8 to these consolidated financial statements.

Capital management has a dual role of ensuring a competitive return to the Bank’s shareholders while maintaining a solid capital foundation that covers risks inherent to the Bank’s business, supports its business segments and protects its clients. The Bank’s capital management policy defines guiding principles as well as the roles and responsibilities of its internal capital adequacy assessment process. This process aims to determine the capital that the Bank needs to pursue its business activities and accommodate unexpected losses arising from extremely adverse economic and operational conditions. For additional information on the capital management framework, see the Capital Management section on pages 59 to 67 of the Bank’s 2020 Annual Report. Basel Accord The Bank and all other major Canadian banks have to maintain minimum capital ratios established by OSFI: a CET1 capital ratio of at least 9.0%, a Tier 1 capital ratio of at least 10.5%, and a Total capital ratio of at least 12.5%. All of these ratios are to include a capital conservation buffer of 2.5% established by the Basel Committee on Banking Supervision (BCBS) and OSFI as well as a 1.0% surcharge applicable solely to Domestic Systemically Important Banks (D-SIBs) and a 1.0% domestic stability buffer established by OSFI. The domestic stability buffer, which can vary from 0% to 2.5% of risk-weighted assets, consists exclusively of CET1 capital. A D-SIB that fails to meet this buffer requirement will not be subject to automatic constraints to reduce capital distributions but will have to provide a remediation plan to OSFI. The banks also have to meet the capital floor that sets the regulatory capital level according to the Basel II standardized approach. If the capital requirement under Basel III is less than 70% of the capital requirement as calculated under Basel II, the difference is added to risk-weighted assets. OSFI requires Canadian banks to meet a Basel III leverage ratio of at least 3.0%. The leverage ratio is a measure independent of risk that is calculated by dividing the amount of Tier 1 capital by total exposure. Total exposure is defined as the sum of on-balance-sheet assets (including derivative exposures and securities financing transaction exposures) and off-balance-sheet items. The assets deducted from Tier 1 capital are also deducted from total exposure. In addition to those measures, OSFI is requiring that regulatory capital instruments other than common equity have a non-viability contingent capital (NVCC) clause to ensure that investors bear losses before taxpayers should the government determine that it is in the public interest to rescue a non-viable financial institution. Instruments issued before January 1, 2013 that would be Basel III compliant if not for the absence of the NVCC clause are grandfathered and will be phased out over a period of ten years. As at January 31, 2021, the Bank has one remaining non-NVCC Tier 2 subordinated debt capital instrument which it expects to phase out without resorting to any regulatory event redemption clause. OSFI’s Total Loss Absorbing Capacity (TLAC) guideline, which applies to all D-SIBs under the federal government’s bail-in regulations, came into effect on September 23, 2018. The purpose of the TLAC guideline is to ensure that a D-SIB has sufficient loss-absorbing capacity to support its recapitalization in the unlikely event it becomes non-viable. OSFI is requiring D-SIBs to maintain a minimum risk-based TLAC ratio of 22.50% (including the domestic stability buffer) of risk-weighted assets and a minimum TLAC leverage ratio of 6.75% by November 1, 2021. During the year ended October 31, 2019, the Bank started to issue qualifying bail-in debt and expects its TLAC ratios to improve through the normal refinancing of its maturing unsecured term debt. The Bank does not anticipate any challenges in meeting these TLAC requirements. Requirements – Regulatory Ratios Under Basel III
As at January 31, 2021
Minimum
Capital conservation
buffer
Minimum
set by BCBS
D-SIB surcharge
Minimum
set by OSFI(1)
Domestic stability buffer(2)
Minimum set by OSFI(1), including
the buffer
Capital ratios CET1 4.5 % 2.5 % 7.0 % 1.0 % 8.0 % 1.0 % 9.0 % Tier 1 6.0 % 2.5 % 8.5 % 1.0 % 9.5 % 1.0 % 10.5 % Total 8.0 % 2.5 % 10.5 % 1.0 % 11.5 % 1.0 % 12.5 %
Leverage ratio 3.0 % n.a. n.a. n.a. 3.0 % n.a. 3.0 %
n.a. Not applicable (1) The capital ratios include the capital conservation buffer and the D-SIB surcharge. (2) On December 8, 2020, OSFI confirmed that the buffer is maintained at 1.0%.
The Bank ensures that its capital levels are always above the minimum regulatory requirements. By maintaining a strong capital structure, the Bank can cover the risks inherent to its business activities, support its business segments, and protect its clients. Other disclosure requirements pursuant to Pillar 3 of the Basel Accord and a set of recommendations defined by the EDTF are presented in the Supplementary Regulatory Capital and Pillar 3 Disclosure report published quarterly and available on the Bank’s website at nbc.ca. Also available on the Bank’s website is a complete list of capital instruments and their main features.

Regulatory Developments The Bank closely monitors regulatory developments and participates actively in various consultative processes. During the second quarter of 2020, in response to the impact of the COVID-19 pandemic, OSFI announced a series of regulatory adjustments to support the financial and operational resilience of banks. For additional information, see the section entitled COVID-19 Pandemic – Key Measures Introduced by the Regulatory Authorities on pages 20 and 21 of the 2020 Annual Report. For additional information on the regulatory context on October 31, 2020, see pages 62 and 63 of the Capital Management section in the 2020 Annual Report. Since November 1, 2020, there are no significant new regulatory developments to be considered. Management Activities On March 13, 2020, OSFI indicated that it was expecting all banks to cease any dividend increases or share buybacks. During the quarter ended January 31, 2021, the Bank did not issue or repurchase any equity instruments. Shares, Other Equity Instruments and Stock Options
As at January 31, 2021
Number of shares or
LRCN $ million
First preferred shares Series 30 14,000,000 350 Series 32 12,000,000 300 Series 34 16,000,000 400 Series 36 16,000,000 400 Series 38 16,000,000 400 Series 40 12,000,000 300 Series 42 12,000,000 300
98,000,000 2,450
Other equity instruments Limited Recourse Capital Notes (LRCN), Series 1 500,000 500 Common shares 336,770,311 3,094 Stock options 12,623,271
As at February 19, 2021, there were 336,784,884 common shares and 12,566,315 stock options outstanding. NVCC provisions require the conversion of capital instruments into a variable number of common shares should OSFI deem a bank to be non-viable or should the government publicly announce that a bank has accepted or agreed to accept an injection of capital. If an NVCC trigger event were to occur, all of the Bank’s preferred shares, the Bank’s LRCN and medium-term notes maturing on February 1, 2028, which are NVCC capital instruments, would be converted into common shares of the Bank according to an automatic conversion formula at a conversion price corresponding to the greater of the following amounts: (i) a $5.00 contractual floor price; or (ii) the market price of the Bank’s common shares on the date of the trigger event (10-day weighted average price). Based on a $5.00 floor price and including an estimate for accrued dividends and interest, these NVCC capital instruments would be converted into a maximum of 825 million Bank common shares, which would have a 71.0% dilutive effect based on the number of Bank common shares outstanding as at January 31, 2021. Dividends On February 23, 2021, the Board of Directors declared regular dividends on the various series of first preferred shares and a dividend of 71 cents per common share, payable on May 1, 2021 to shareholders of record on March 29, 2021.

Movement in Regulatory Capital
(millions of Canadian dollars) Quarter ended
January 31, 2021
Common Equity Tier 1 (CET1) capital Balance at beginning 11,167 Issuance of common shares (including Stock Option Plan) 34 Impact of shares purchased or sold for trading (2) Repurchase of common shares − Other contributed surplus 3 Dividends on preferred and common shares and distributions on other equity instruments (273) Net income attributable to the Bank’s shareholders and holders of other equity instruments 761 Removal of own credit spread (net of income taxes) 81 Other 66 Movements in accumulated other comprehensive income Translation adjustments (109) Debt securities at fair value through other comprehensive income 26
Change in goodwill and intangible assets (net of related tax liability) (2) Other, including regulatory adjustments and transitional arrangements Change in defined benefit pension plan asset (net of related tax liability) (117) Change in amount exceeding 15% threshold Deferred tax assets − Significant investment in common shares of financial institutions − Deferred tax assets, unless they result from temporary differences (net of related tax liability) − Other deductions or regulatory adjustments to CET1 implemented by OSFI(1) (72) Change in other regulatory adjustments(2) − Balance at end 11,563 Additional Tier 1 capital Balance at beginning 2,945 New Tier 1 eligible capital issuances − Redeemed capital − Change in non-qualifying Additional Tier 1 subject to phase-out − Other, including regulatory adjustments and transitional arrangements 4 Balance at end 2,949 Total Tier 1 capital 14,512 Tier 2 capital Balance at beginning 1,055 New Tier 2 eligible capital issuances − Redeemed capital − Change in non-qualifying Tier 2 subject to phase-out − Tier 2 instruments issued by subsidiaries and held by third parties − Change in certain allowances for credit losses 85 Other, including regulatory adjustments and transitional arrangements (63) Balance at end 1,077 Total regulatory capital 15,589
(1) This item includes the transitional measure applicable to expected credit loss provisioning implemented during the second quarter of 2020. For additional information, see the section entitled COVID-19 Pandemic – Key Measures Introduced by the Regulatory Authorities on pages 20 and 21 of the 2020 Annual Report.
(2) This item includes the change in investments in the Bank’s CET1 capital.
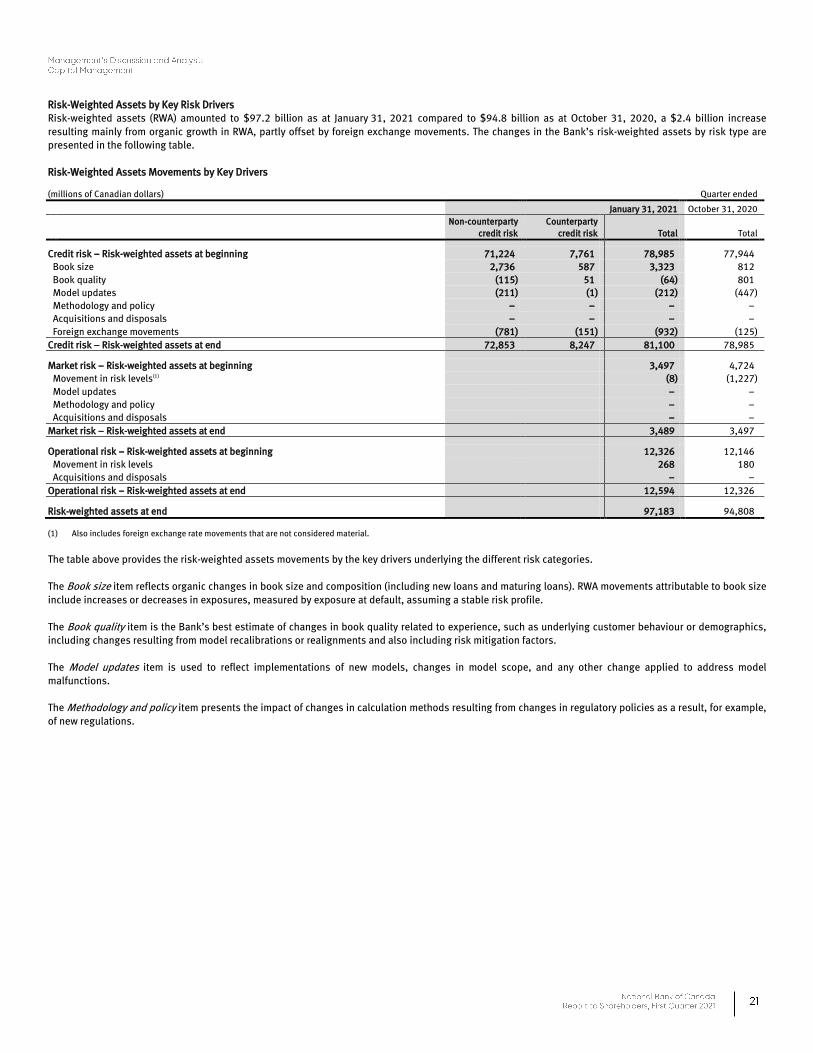
Risk-Weighted Assets by Key Risk Drivers Risk-weighted assets (RWA) amounted to $97.2 billion as at January 31, 2021 compared to $94.8 billion as at October 31, 2020, a $2.4 billion increase resulting mainly from organic growth in RWA, partly offset by foreign exchange movements. The changes in the Bank’s risk-weighted assets by risk type are presented in the following table. Risk-Weighted Assets Movements by Key Drivers
(millions of Canadian dollars) Quarter ended
January 31, 2021 October 31, 2020
Non-counterparty
credit risk Counterparty
credit risk Total Total
Credit risk – Risk-weighted assets at beginning 71,224 7,761 78,985 77,944 Book size 2,736 587 3,323 812 Book quality (115) 51 (64) 801 Model updates (211) (1) (212) (447) Methodology and policy − − − − Acquisitions and disposals − − − − Foreign exchange movements (781) (151) (932) (125) Credit risk – Risk-weighted assets at end 72,853 8,247 81,100 78,985 Market risk – Risk-weighted assets at beginning 3,497 4,724 Movement in risk levels(1) (8) (1,227) Model updates − − Methodology and policy − − Acquisitions and disposals − − Market risk – Risk-weighted assets at end 3,489 3,497 Operational risk – Risk-weighted assets at beginning 12,326 12,146 Movement in risk levels 268 180 Acquisitions and disposals − − Operational risk – Risk-weighted assets at end 12,594 12,326 Risk-weighted assets at end 97,183 94,808
(1) Also includes foreign exchange rate movements that are not considered material.
The table above provides the risk-weighted assets movements by the key drivers underlying the different risk categories. The Book size item reflects organic changes in book size and composition (including new loans and maturing loans). RWA movements attributable to book size include increases or decreases in exposures, measured by exposure at default, assuming a stable risk profile. The Book quality item is the Bank’s best estimate of changes in book quality related to experience, such as underlying customer behaviour or demographics, including changes resulting from model recalibrations or realignments and also including risk mitigation factors. The Model updates item is used to reflect implementations of new models, changes in model scope, and any other change applied to address model malfunctions. The Methodology and policy item presents the impact of changes in calculation methods resulting from changes in regulatory policies as a result, for example, of new regulations.
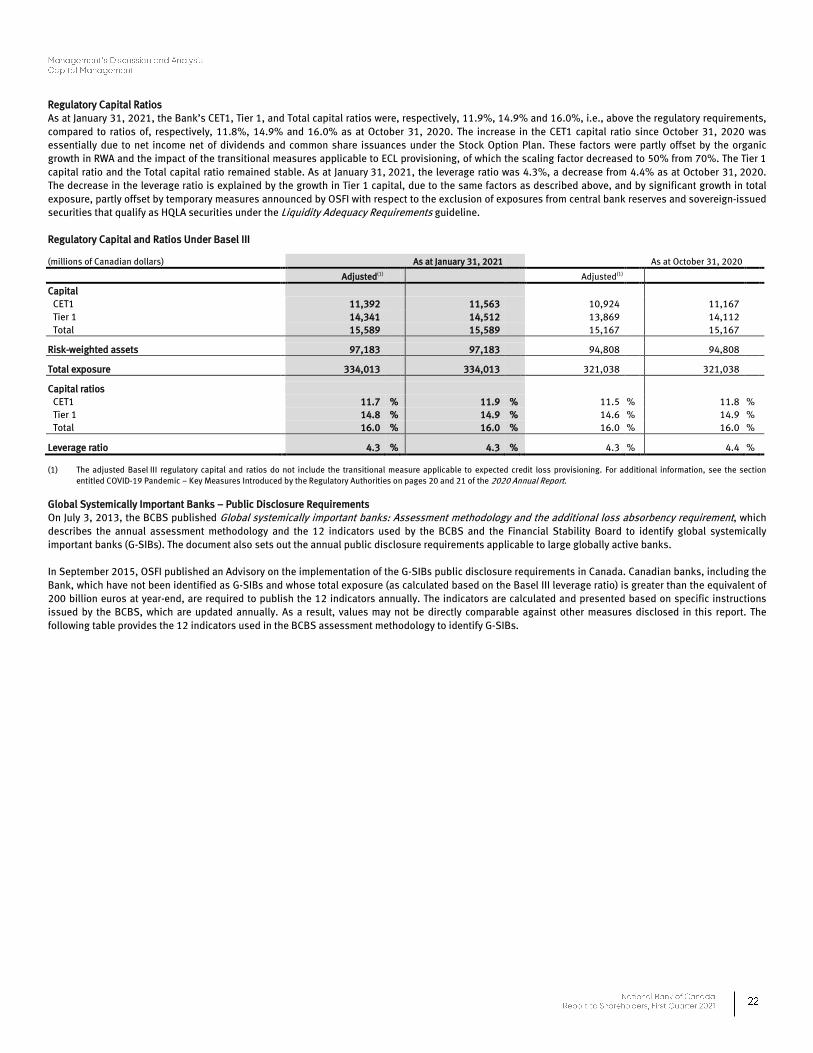
Regulatory Capital Ratios As at January 31, 2021, the Bank’s CET1, Tier 1, and Total capital ratios were, respectively, 11.9%, 14.9% and 16.0%, i.e., above the regulatory requirements, compared to ratios of, respectively, 11.8%, 14.9% and 16.0% as at October 31, 2020. The increase in the CET1 capital ratio since October 31, 2020 was essentially due to net income net of dividends and common share issuances under the Stock Option Plan. These factors were partly offset by the organic growth in RWA and the impact of the transitional measures applicable to ECL provisioning, of which the scaling factor decreased to 50% from 70%. The Tier 1 capital ratio and the Total capital ratio remained stable. As at January 31, 2021, the leverage ratio was 4.3%, a decrease from 4.4% as at October 31, 2020. The decrease in the leverage ratio is explained by the growth in Tier 1 capital, due to the same factors as described above, and by significant growth in total exposure, partly offset by temporary measures announced by OSFI with respect to the exclusion of exposures from central bank reserves and sovereign-issued securities that qualify as HQLA securities under the Liquidity Adequacy Requirements guideline. Regulatory Capital and Ratios Under Basel III
(millions of Canadian dollars) As at January 31, 2021 As at October 31, 2020
Adjusted(1) Adjusted(1)
Capital CET1 11,392 11,563 10,924 11,167 Tier 1 14,341 14,512 13,869 14,112 Total 15,589 15,589 15,167 15,167
Risk-weighted assets 97,183 97,183 94,808 94,808
Total exposure 334,013 334,013 321,038 321,038
Capital ratios CET1 11.7 % 11.9 % 11.5 % 11.8 % Tier 1 14.8 % 14.9 % 14.6 % 14.9 % Total 16.0 % 16.0 % 16.0 % 16.0 %
Leverage ratio 4.3 % 4.3 % 4.3 % 4.4 %
(1) The adjusted Basel III regulatory capital and ratios do not include the transitional measure applicable to expected credit loss provisioning. For additional information, see the section entitled COVID-19 Pandemic – Key Measures Introduced by the Regulatory Authorities on pages 20 and 21 of the 2020 Annual Report.
Global Systemically Important Banks – Public Disclosure Requirements On July 3, 2013, the BCBS published Global systemically important banks: Assessment methodology and the additional loss absorbency requirement, which describes the annual assessment methodology and the 12 indicators used by the BCBS and the Financial Stability Board to identify global systemically important banks (G-SIBs). The document also sets out the annual public disclosure requirements applicable to large globally active banks. In September 2015, OSFI published an Advisory on the implementation of the G-SIBs public disclosure requirements in Canada. Canadian banks, including the Bank, which have not been identified as G-SIBs and whose total exposure (as calculated based on the Basel III leverage ratio) is greater than the equivalent of 200 billion euros at year-end, are required to publish the 12 indicators annually. The indicators are calculated and presented based on specific instructions issued by the BCBS, which are updated annually. As a result, values may not be directly comparable against other measures disclosed in this report. The following table provides the 12 indicators used in the BCBS assessment methodology to identify G-SIBs.

Indicators – Global Systemically Important Banks (G-SIBs)(1)
(millions of Canadian dollars) As at October 31, 2020
Category Indicators
Cross-jurisdictional activity(2) Cross-jurisdictional claims 82,516 Cross-jurisdictional liabilities 72,765 Size(3) Total exposures as defined for use in the Basel III leverage ratio 359,980 Interconnectedness(4) Intra-financial system assets 41,445 Intra-financial system liabilities 28,938 Securities outstanding 82,474 Substitutability/financial institutions infrastructure(5) Payment activity(6) 14,045,497 Assets under custody 596,656 Underwritten transactions in debt and equity markets 35,095 Complexity(7) Notional amount of over-the-counter derivative financial instruments 1,177,539 Trading and investments securities 29,438 Level 3 financial assets 1,232
(1) The G-SIBs indicators are prepared based on the methodology prescribed in the BCBS guidelines published in July 2013 and instructions provided by BCBS in January 2021. The indicators are based on the scope of regulatory consolidation.
(2) Represents the Bank’s level of interaction outside Canada. (3) Represents the total on-and-off balance sheet exposures of the Bank determined as per OSFI’s Basel III leverage ratio rules before regulatory adjustments. (4) Represents transactions with other financial institutions. (5) Represents the extent to which the Bank’s services could be substituted by other institutions. (6) For the year ended October 31, 2020. (7) Includes the level of complexity and volume of the Bank’s trading activities represented through derivatives financial instruments, trading securities, investments securities and level 3
financial assets.
Risk-taking is intrinsic to a financial institution’s business. The Bank views risk as an integral part of its development and the diversification of its activities. It advocates a risk management approach consistent with its business strategy. The Bank voluntarily exposes itself to certain risk categories, particularly credit and market risk, in order to generate revenue. It assumes certain risks that are inherent to its activities—to which it does not choose to expose itself—and that do not generate revenue, i.e., mainly operational risks. The COVID-19 pandemic has affected general economic conditions as well as capital market conditions in Canada, the United States, and other countries where the Bank conducts business. COVID-19 has also put certain top and emerging risks into perspective. Despite the exceptional situation, risks are being rigorously managed. Consequently, decision-making is supported by risk assessments and management processes that are consistent with the Bank’s risk appetite and by prudent levels of capital and liquidity. The purpose of sound and effective risk management is to provide reasonable assurance that incurred risks do not exceed acceptable thresholds, to control the volatility in the Bank's results, and to ensure that risk-taking contributes to the creation of shareholder value. The Bank’s governance structure for risk management has remained largely unchanged from that described in the 2020 Annual Report. Despite the exercise of stringent risk management and the mitigation measures in place, risk cannot be suppressed entirely, and residual risks may occasionally cause significant losses. Certain risks are discussed hereafter. For additional information, refer to the section entitled COVID-19 Pandemic – Impact of the COVID-19 risk factor on pages 16 and 17 of the 2020 Annual Report and to the Risk Management section on pages 68 to 106 of the 2020 Annual Report. Risk management information is also provided in Note 7 to these consolidated financial statements, which covers loans.

Credit risk is the risk of incurring a financial loss if an obligor does not fully honour its contractual commitments to the Bank. Obligors may be debtors, issuers, counterparties or guarantors. Credit risk is the most significant risk facing the Bank in the normal course of business. Obligors have been affected by the difficult economic environment resulting from COVID-19 and its impact on the global and local economies. This exceptional situation has led to significant changes in the overall market environment, including business closures and temporary layoffs. However, certain government measures have been implemented to assist retail and business clients affected by COVID-19. The amounts shown in the following table represent the Bank’s maximum exposure to credit risk as at the financial reporting date without taking into account any collateral held or any other credit enhancements. These amounts do not take into account allowances for credit losses nor amounts pledged as collateral. The table also excludes equity securities. Maximum Credit Risk Exposure Under the Basel Asset Categories
(millions of Canadian dollars)
As at January 31, 2021
As at October 31, 2020
Drawn Undrawn
commitments Repo-style
transactions(1)
Derivative financial
instruments
Other off-balance-
sheet items(2) Total Total
Retail Residential mortgages 57,919 10,009 − − − 67,928 66,813 Qualifying revolving retail 2,248 5,936 − − − 8,184 8,774 Other retail 14,123 2,352 − − 30 16,505 16,740 74,290 18,297 − − 30 92,617 92,327 Non-retail Corporate 64,834 25,700 23,037 − 4,769 118,340 115,402 Sovereign 61,144 5,608 63,714 165 105 130,736 119,167 Financial institutions 3,876 399 73,905 2,781 487 81,448 72,917 129,854 31,707 160,656 2,946 5,361 330,524 307,486 Trading portfolio − − − 14,873 − 14,873 14,011 Securitization 2,152 − − − 3,718 5,870 6,054 Total – Gross credit risk 206,296 50,004 160,656 17,819 9,109 443,884 419,878
Standardized Approach 21,273 229 20,346 2,805 265 44,918 37,939 AIRB Approach 185,023 49,775 140,310 15,014 8,844 398,966 381,939 Total – Gross credit risk 206,296 50,004 160,656 17,819 9,109 443,884 419,878
(1) Securities purchased under reverse repurchase agreements and sold under repurchase agreements as well as securities loaned and borrowed. (2) Letters of guarantee, documentary letters of credit and securitized assets that represent the Bank’s commitment to make payments in the event that a client cannot meet its financial
obligations to third parties.
To meet OSFI’s mortgage loan disclosure requirements, additional information has been provided in Supplementary Financial Information – First Quarter 2021 and in Supplementary Regulatory Capital and Pillar 3 Disclosure – First Quarter 2021, which are available on the Bank’s website at nbc.ca.

Market risk is the risk of losses arising from movements in market prices. The Bank is exposed to market risk through its participation in trading, investment and asset/liability management activities. Because of COVID-19 and its impact on global and local economies, the Bank faces a volatile and challenging environment. This exceptional situation has led to significant changes in the overall market environment, including low interest rates. The following tables provide a breakdown of the Bank’s Consolidated Balance Sheet into assets and liabilities by those that carry market risk and those that do not carry market risk, distinguishing between trading positions whose main risk measures are Value-at-Risk (VaR) and stressed VaR (SVaR) and non-trading positions that use other risk measures. Reconciliation of Market Risk With Consolidated Balance Sheet Items
(millions of Canadian dollars) As at January 31, 2021
Market risk measures
Balance
sheet Trading(1) Non-trading(2) Not subject to
market risk Non-traded risk
primary risk sensitivity
Assets Cash and deposits with financial institutions 33,726 714 16,722 16,290 Interest rate(3) Securities At fair value through profit or loss 88,328 85,304 3,024 − Interest rate(3) and equity At fair value through other comprehensive income 11,156 − 11,156 − Interest rate(3) and equity(4) At amortized cost 11,156 − 11,156 − Interest rate(3) Securities purchased under reverse repurchase agreements and securities borrowed 10,419 − 10,419 − Interest rate(3)(5) Loans and acceptances, net of allowances 167,690 7,629 160,061 − Interest rate(3) Derivative financial instruments 12,877 12,735 142 − Interest rate and exchange rate Defined benefit asset 287 − 287 − Other Other 7,998 − − 7,998 343,637 106,382 212,967 24,288 Liabilities Deposits 227,677 12,218 215,459 − Interest rate(3) Acceptances 6,878 − 6,878 − Interest rate(3) Obligations related to securities sold short 18,273 18,273 − − Obligations related to securities sold under repurchase agreements and securities loaned 31,282 − 31,282 − Interest rate(3)(5) Derivative financial instruments 14,010 13,543 467 − Interest rate and exchange rate Liabilities related to transferred receivables 22,664 6,189 16,475 − Interest rate(3) Defined benefit liability 156 − 156 − Other Other 5,004 − 64 4,940 Interest rate(3) Subordinated debt 773 − 773 − Interest rate(3) 326,717 50,223 271,554 4,940
(1) Trading positions whose risk measures are VaR and SVaR. For additional information, see the tables that show the VaR and SVaR distributions of the trading portfolios by risk category as well as their correlation effect, which are presented on the following pages and in the Market Risk section of the 2020 Annual Report.
(2) Non-trading positions that use other risk measures. (3) For additional information, see the tables that show the VaR and SVaR distributions of the trading portfolios by risk category and their correlation effect as well as the interest rate sensitivity
tables, which are presented on the following pages and in the Market Risk section of the 2020 Annual Report. (4) The fair value of equity securities designated at fair value through other comprehensive income is presented in Notes 4 and 6 to the consolidated financial statements. (5) These instruments are recorded at amortized cost and are subject to credit risk for capital management purposes. For trading-related transactions with maturities of more than one day,
interest rate risk is included in the VaR and SVaR measures.

(millions of Canadian dollars) As at October 31, 2020
Market risk measures
Balance
sheet Trading(1) Non-trading(2) Not subject to
market risk Non-traded risk primary
risk sensitivity
Assets Cash and deposits with financial institutions 29,142 617 12,799 15,726 Interest rate(3) Securities At fair value through profit or loss 78,326 75,279 3,047 − Interest rate(3) and equity(4) At fair value through other comprehensive income 12,726 − 12,726 − Interest rate(3) and equity(5) Amortized cost 11,079 − 11,079 − Interest rate(3) Securities purchased under reverse repurchase agreements and securities borrowed 14,512 − 14,512 − Interest rate(3)(6) Loans and acceptances, net of allowances 164,740 7,545 157,195 − Interest rate(3) Derivative financial instruments 13,422 13,207 215 − Interest rate(7) and exchange rate(7) Defined benefit asset 126 − 126 − Other(8) Other 7,552 − − 7,552 331,625 96,648 211,699 23,278 Liabilities Deposits 215,878 9,998 205,880 − Interest rate(3) Acceptances 6,866 − 6,866 − Interest rate(3) Obligations related to securities sold short 16,368 16,368 − − Obligations related to securities sold under repurchase agreements and securities loaned 33,859 − 33,859 − Interest rate(3)(6) Derivative financial instruments 12,923 12,300 623 − Interest rate(7) and exchange rate(7) Liabilities related to transferred receivables 22,855 6,135 16,720 − Interest rate(3) Defined benefit liability 201 − 201 − Other(8) Other 5,517 − 64 5,453 Interest rate(3) Subordinated debt 775 − 775 − Interest rate(3) 315,242 44,801 264,988 5,453
(1) Trading positions whose risk measures are VaR and SVaR. For additional information, see the tables that show the VaR and SVaR distributions of the trading portfolios by risk category as well as their correlation effect, which are presented on the following pages and in the Market Risk section of the 2020 Annual Report.
(2) Non-trading positions that use other risk measures. (3) For additional information, see the tables that show the VaR and SVaR distributions of the trading portfolios by risk category and their correlation effect as well as the interest rate sensitivity
tables, which are presented below and on the following page as well as in the Market Risk section of the 2020 Annual Report. (4) For additional information, see Note 6 to the audited annual consolidated financial statements for the fiscal year ended October 31, 2020. (5) The fair value of equity securities designated at fair value through other comprehensive income is presented in Notes 4 and 6 to these consolidated financial statements. (6) These instruments are recorded at amortized cost and are subject to credit risk for capital management purposes. For trading-related transactions with maturities of more than one day,
interest rate risk is included in the VaR and SVaR measures. (7) For additional information, see Notes 16 and 17 to the audited annual consolidated financial statements for the year ended October 31, 2020. (8) For additional information, see Note 23 to the audited annual consolidated financial statements for the year ended October 31, 2020.
Trading Activities The first table below shows the VaR distribution of trading portfolios by risk category as well as their correlation effect. The second table on the next page shows the SVaR distribution, i.e., the VaR of the Bank’s current portfolios obtained following the calibration of risk factors over a 12-month stress period. VaR of Trading Portfolios by Risk Category(1)
(millions of Canadian dollars) Quarter ended
January 31, 2021 October 31, 2020 January 31, 2020 Low High Average Period end Average Period end Average Period end
Interest rate (4.5) (9.7) (7.3) (7.9) (7.0) (8.0) (4.9) (4.5) Exchange rate (0.4) (2.3) (0.9) (1.1) (0.8) (1.5) (0.8) (0.7) Equity (4.4) (10.2) (6.2) (9.4) (8.6) (8.0) (3.4) (4.0) Commodity (0.6) (1.1) (0.8) (0.7) (1.0) (0.8) (1.1) (0.8) Correlation effect(2) n.m. n.m. 7.6 9.7 8.6 9.1 4.6 5.1 Total trading VaR (6.2) (10.9) (7.6) (9.4) (8.8) (9.2) (5.6) (4.9)
n.m. Computation of a correlation effect for the high and low is not meaningful, as highs and lows may occur on different days and be attributable to different types of risk. (1) Amounts are presented on a pre-tax basis and represent one-day VaR using a 99% confidence level. (2) The total trading VaR is less than the sum of the individual risk factor VaR results due to the correlation effect.

SVaR of Trading Portfolios by Risk Category(1)
(millions of Canadian dollars) Quarter ended
January 31, 2021 October 31, 2020 January 31, 2020 Low High Average Period end Average Period end Average Period end
Interest rate (12.6) (22.2) (16.6) (17.3) (10.0) (15.1) (14.7) (11.2) Exchange rate (0.3) (4.1) (1.4) (1.2) (0.8) (1.6) (1.4) (0.7) Equity (4.8) (20.6) (9.5) (18.6) (10.5) (8.4) (8.7) (7.7) Commodity (0.5) (3.1) (1.6) (1.7) (0.7) (0.6) (2.1) (2.3) Correlation effect(2) n.m. n.m. 13.4 17.5 7.7 7.8 10.5 10.4 Total trading SVaR (8.2) (23.1) (15.7) (21.3) (14.3) (17.9) (16.4) (11.5)
n.m. Computation of a correlation effect for the high and low is not meaningful, as highs and lows may occur on different days and be attributable to different types of risk. (1) Amounts are presented on a pre-tax basis and represent one-day SVaR using a 99% confidence level. (2) The total trading SVaR is less than the sum of the individual risk factor SVaR results due to the correlation effect.
The average total trading VaR decreased from $8.8 million to $7.6 million between the fourth quarter of 2020 and the first quarter of 2021, mainly due to a decrease in equity risk. The average total trading SVaR increased from $14.3 million to $15.7 million, mainly caused by an increase in interest rate risk. During the first quarter of 2021, the Bank changed the SVaR simulation period from the 2020 COVID-19 period back to the 2008 global financial crisis (GFC) period. Daily Trading and Underwriting Revenues The following table shows daily trading and underwriting revenues as well as VaR. During the quarter ended January 31, 2021, daily trading and underwriting revenues were positive 98% of the days. One trading day was marked by daily trading and underwriting net loss of more than $1 million and did not exceed the VaR. Quarter Ended January 31, 2021 (millions of Canadian dollars)
(22)(20)(18)(16)(14)(12)(10)
(8)(6)(4)(2)02468
10121416182022242628
November 2020
December 2020
January 2021
Trading and underwriting revenues
VaR (CAN)

Interest Rate Sensitivity – Non-Trading Activities (Before Tax) The following tables present the potential before-tax impact of an immediate and sustained 100-basis-point increase or of an immediate and sustained 25-basis-point decrease in interest rates on the economic value of equity and on the net interest income of the Bank’s non-trading portfolios for the next 12 months, assuming no further hedging is undertaken. In the current environment of very low interest rates, the Bank believes that a sensitivity analysis reflecting an immediate and sustained 25-basis-point decrease in interest rates provides more relevant information. (millions of Canadian dollars) As at January 31, 2021 As at October 31, 2020
Canadian
dollar Other
currencies Total Canadian
dollar Other
currencies Total
Impact on equity 100-basis-point increase in the interest rate (267) 58 (209) (239) 15 (224) 25-basis-point decrease in the interest rate 59 (8) 51 49 (4) 45 Impact on net interest income 100-basis-point increase in the interest rate (35) 45 10 (31) 21 (10) 25-basis-point decrease in the interest rate 8 (7) 1 5 (5) −
Liquidity and funding risk are the risks that the Bank will be unable to honour daily cash and financial obligations without resorting to costly and untimely measures. Liquidity and funding risk arises when sources of funds become insufficient to meet scheduled payments under the Bank’s commitments. Liquidity risk stems from mismatched cash flows related to assets and liabilities as well as from the characteristics of certain products such as credit commitments and non-fixed-term deposits. Funding risk is defined as the risk to the Bank’s ongoing ability to raise sufficient funds to finance actual or proposed business activities on an unsecured or secured basis at an acceptable price. The funding management priority is to achieve an optimal balance between deposits, securitization, secured funding and unsecured funding. This brings optimal stability to the funding and reduces vulnerability to unpredictable events. COVID-19 has affected overall economic and market conditions. The Bank is facing a challenging and volatile environment, but its sound liquidity and funding management is helping it to maintain an optimal balance between its sources of cash and anticipated payments. Regulatory Developments The Bank continues to closely monitor regulatory developments and participates actively in various consultative processes. In response to the impact of COVID-19, OSFI took exceptional action in the second quarter of 2020 to address operational issues stemming from COVID-19. For additional information, see the section entitled COVID-19 Pandemic – Key Measures Introduced by the Regulatory Authorities on pages 20 and 21 of the 2020 Annual Report. For additional information on the regulatory context as at October 31, 2020, see page 93 of the Risk Management section in the 2020 Annual Report. In addition, since November 1, 2020, there are no significant new regulatory developments to be considered. Liquidity Management Liquid Assets To protect depositors and creditors from unexpected crisis situations, the Bank holds a portfolio of unencumbered liquid assets that can be readily liquidated to meet financial obligations. The majority of unencumbered liquid assets are held in Canadian or U.S. dollars. Moreover, all assets that can be quickly monetized are considered liquid assets. The Bank’s liquidity reserves do not factor in the availability of the central emergency liquidity facilities. The following tables provide information on the Bank’s encumbered and unencumbered assets.
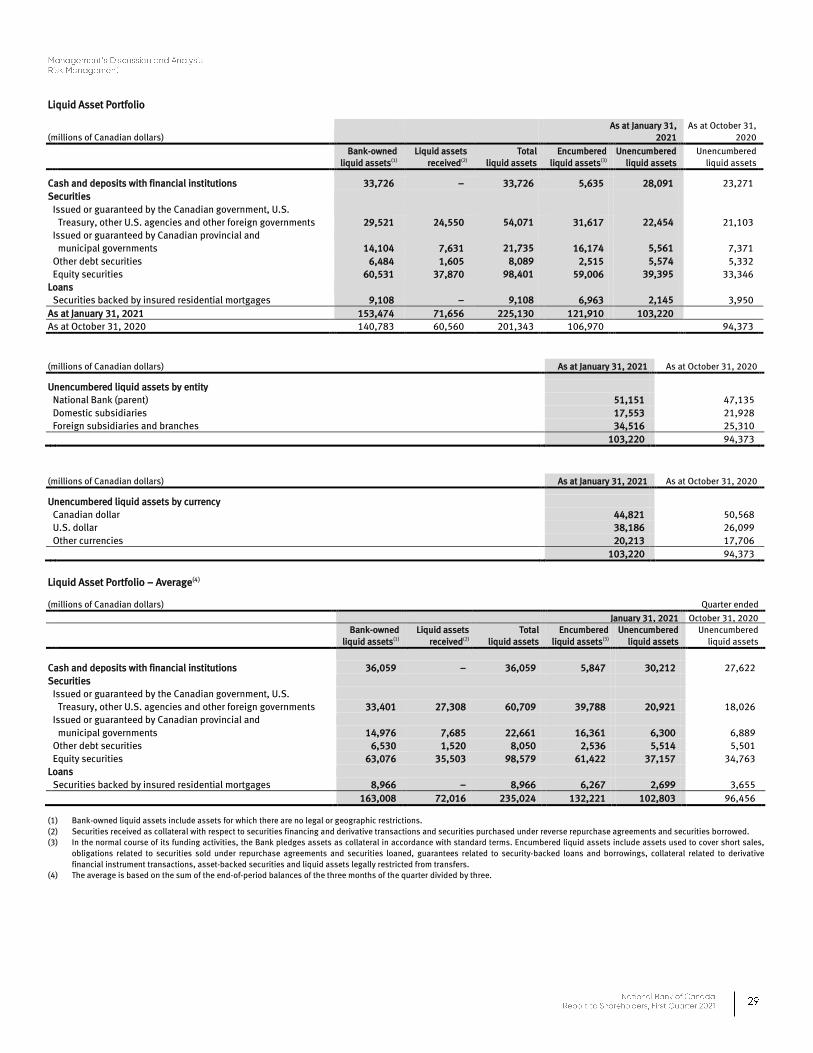
Liquid Asset Portfolio
(millions of Canadian dollars) As at January 31,
2021 As at October 31,
2020
Bank-owned
liquid assets(1) Liquid assets
received(2) Total
liquid assets Encumbered
liquid assets(3) Unencumbered
liquid assets Unencumbered
liquid assets
Cash and deposits with financial institutions 33,726 − 33,726 5,635 28,091 23,271 Securities Issued or guaranteed by the Canadian government, U.S. Treasury, other U.S. agencies and other foreign governments 29,521 24,550 54,071 31,617 22,454 21,103 Issued or guaranteed by Canadian provincial and municipal governments 14,104 7,631 21,735 16,174 5,561 7,371 Other debt securities 6,484 1,605 8,089 2,515 5,574 5,332 Equity securities 60,531 37,870 98,401 59,006 39,395 33,346 Loans Securities backed by insured residential mortgages 9,108 − 9,108 6,963 2,145 3,950 As at January 31, 2021 153,474 71,656 225,130 121,910 103,220 As at October 31, 2020 140,783 60,560 201,343 106,970 94,373
(millions of Canadian dollars) As at January 31, 2021 As at October 31, 2020
Unencumbered liquid assets by entity
National Bank (parent) 51,151 47,135
Domestic subsidiaries 17,553 21,928
Foreign subsidiaries and branches 34,516 25,310 103,220 94,373
(millions of Canadian dollars) As at January 31, 2021 As at October 31, 2020
Unencumbered liquid assets by currency Canadian dollar 44,821 50,568 U.S. dollar 38,186 26,099 Other currencies 20,213 17,706 103,220 94,373
Liquid Asset Portfolio – Average(4)
(millions of Canadian dollars) Quarter ended
January 31, 2021 October 31, 2020
Bank-owned
liquid assets(1) Liquid assets
received(2) Total
liquid assets Encumbered
liquid assets(3) Unencumbered
liquid assets
Unencumbered liquid assets
Cash and deposits with financial institutions 36,059 − 36,059 5,847 30,212 27,622 Securities Issued or guaranteed by the Canadian government, U.S. Treasury, other U.S. agencies and other foreign governments 33,401 27,308 60,709 39,788 20,921 18,026 Issued or guaranteed by Canadian provincial and municipal governments 14,976 7,685 22,661 16,361 6,300 6,889 Other debt securities 6,530 1,520 8,050 2,536 5,514 5,501 Equity securities 63,076 35,503 98,579 61,422 37,157 34,763 Loans Securities backed by insured residential mortgages 8,966 − 8,966 6,267 2,699 3,655
163,008 72,016 235,024 132,221 102,803 96,456
(1) Bank-owned liquid assets include assets for which there are no legal or geographic restrictions. (2) Securities received as collateral with respect to securities financing and derivative transactions and securities purchased under reverse repurchase agreements and securities borrowed. (3) In the normal course of its funding activities, the Bank pledges assets as collateral in accordance with standard terms. Encumbered liquid assets include assets used to cover short sales,
obligations related to securities sold under repurchase agreements and securities loaned, guarantees related to security-backed loans and borrowings, collateral related to derivative financial instrument transactions, asset-backed securities and liquid assets legally restricted from transfers.
(4) The average is based on the sum of the end-of-period balances of the three months of the quarter divided by three.

Summary of Encumbered and Unencumbered Assets
(millions of Canadian dollars) As at January 31, 2021
Encumbered
assets(1) Unencumbered
assets Total
Encumbered assets as a % of total assets
Pledged as
collateral Other(2) Available as
collateral Other(3)
Cash and deposits with financial institutions 362 5,273 28,091 − 33,726 1.6 Securities 37,656 − 72,984 − 110,640 11.0 Securities purchased under reverse repurchase agreements and securities borrowed − 10,419 − − 10,419 3.0 Loans and acceptances, net of allowances 36,290 − 2,145 129,255 167,690 10.6 Derivative financial instruments − − − 12,877 12,877 − Investments in associates and joint ventures − − − 404 404 − Premises and equipment − − − 1,143 1,143 − Goodwill − − − 1,408 1,408 − Intangible assets − − − 1,446 1,446 − Other assets − − − 3,884 3,884 − 74,308 15,692 103,220 150,417 343,637 26.2
(millions of Canadian dollars) As at October 31, 2020
Encumbered
assets(1) Unencumbered
assets Total
Encumbered assets as a % of total assets
Pledged as
collateral Other(2) Available as
collateral Other(3)
Cash and deposits with financial institutions 344 5,527 23,271 − 29,142 1.8 Securities 34,979 − 67,152 − 102,131 10.5 Securities purchased under reverse repurchase agreements and securities borrowed − 14,512 − − 14,512 4.4 Loans and acceptances, net of allowances 37,556 − 3,950 123,234 164,740 11.3 Derivative financial instruments − − − 13,422 13,422 − Investments in associates and joint ventures − − − 409 409 − Premises and equipment − − − 1,155 1,155 − Goodwill − − − 1,414 1,414 − Intangible assets − − − 1,434 1,434 − Other assets − − − 3,266 3,266 − 72,879 20,039 94,373 144,334 331,625 28.0
(1) In the normal course of its funding activities, the Bank pledges assets as collateral in accordance with standard terms. Encumbered assets include assets used to cover short sales, obligations related to securities sold under repurchase agreements and securities loaned, guarantees related to security-backed loans and borrowings, collateral related to derivative financial instrument transactions, asset-backed securities, residential mortgage loans securitized and transferred under the Canada Mortgage Bond program, assets held in consolidated trusts supporting the Bank’s funding activities and mortgage loans transferred under the covered bond program.
(2) Other encumbered assets include assets for which there are restrictions and that cannot therefore be used for collateral or funding purposes as well as assets used to cover short sales. (3) Other unencumbered assets are assets that cannot be used for collateral or funding purposes in their current form. This category includes assets that are potentially eligible as funding
program collateral (e.g., mortgages insured by the Canada Mortgage and Housing Corporation that can be securitized into mortgage-backed securities under the National Housing Act (Canada)).

Liquidity Coverage Ratio The Liquidity Coverage Ratio (LCR) was introduced primarily to ensure that banks could withstand periods of severe short-term stress. OSFI has been requiring Canadian banks to maintain a minimum LCR of 100%. An LCR above 100% ensures that banks are holding sufficient high-quality liquid assets (HQLA) to cover net cash outflows given a severe, 30-day liquidity crisis. The assumptions underlying the LCR scenario were established by the BCBS and OSFI. The following table provides average LCR data calculated using the daily figures in the quarter. For the quarter ended January 31, 2021, the Bank’s average LCR was 154%, well above the 100% regulatory requirement and demonstrating the Bank’s solid liquidity in a short term position. LCR Disclosure Requirements(1)
(millions of Canadian dollars) For the quarter ended
January 31, 2021 October 31, 2020
Total unweighted value(2) (average)
Total weighted value(3) (average)
Total weighted value(3) (average)
High-quality liquid assets (HQLA) 1 Total HQLA n.a. 67,366 68,118
Cash outflows 2 Retail deposits and deposits from small business customers, of which: 57,277 4,767 4,455 3 Stable deposits 26,692 801 797 4 Less stable deposits 30,585 3,966 3,658 5 Unsecured wholesale funding, of which: 94,775 52,499 51,234 6 Operational deposits (all counterparties) 19,025 4,229 4,205 7 Non-operational deposits (all counterparties) 68,015 40,535 38,806 8 Unsecured debt 7,735 7,735 8,223 9 Secured wholesale funding n.a. 23,989 16,058 10 Additional requirements, of which: 44,567 12,428 12,056 11 Outflows related to derivative exposures and other collateral requirements 12,903 6,324 6,154 12 Outflows related to loss of funding on secured debt securities 1,624 1,624 1,464 13 Backstop liquidity and credit enhancement facilities and commitments to extend credit 30,040 4,480 4,438 14 Other contractual commitments to extend credit 2,613 986 1,497 15 Other contingent commitments to extend credit 100,073 1,617 1,579 16 Total cash outflows n.a. 96,286 86,879
Cash inflows 17 Secured lending (e.g., reverse repos) 105,451 19,494 16,953 18 Inflows from fully performing exposures 10,409 7,003 7,922 19 Other cash inflows 25,711 25,711 19,505 20 Total cash inflows 141,571 52,208 44,380
Total adjusted
value(4) Total adjusted
value(4)
21 Total HQLA n.a. 67,366 68,118 22 Total net cash outflows n.a. 44,078 42,499 23 Liquidity coverage ratio (%)(5) n.a. 154 % 161 %
n.a. Not applicable (1) OSFI prescribed a table format in order to standardize disclosure throughout the banking industry. (2) Unweighted values are calculated as outstanding balances maturing or callable within 30 days (for inflows and outflows). (3) Weighted values are calculated after the application of respective haircuts (for HQLA) or inflow and outflow rates. (4) Total adjusted values are calculated after the application of both haircuts and inflow and outflow rates and any applicable caps. (5) The data in this table is calculated using averages of the daily figures in the quarter. As at January 31, 2021, Level 1 liquid assets represented 85% of the Bank’s HQLA, which includes cash, central bank deposits, and bonds issued or guaranteed by the Canadian government and Canadian provincial governments. Cash outflows arise from the application of OSFI-prescribed assumptions on deposits, debt, secured funding, commitments and additional collateral requirements. The cash outflows are partly offset by cash inflows, which come mainly from secured loans and performing loans. The Bank expects some quarter-over-quarter variation between reported LCRs, and such variation may not be indicative of a trend. The variation between the quarter ended January 31, 2021 and the preceding quarter was a result of normal business activities. The Bank’s liquid asset buffer is well in excess of its total net cash outflows. The LCR assumptions differ from the assumptions used for the liquidity disclosures provided in the tables on the preceding pages or those used for internal liquidity management rules. While the liquidity disclosure framework is prescribed by the EDTF, the Bank’s internal liquidity metrics use assumptions that are calibrated according to its business model and experience.

Net Stable Funding Ratio The BCBS has developed the Net Stable Funding Ratio (NSFR) to promote a more resilient banking sector. The NSFR requires institutions to maintain a stable funding profile in relation to the composition of their assets and off-balance-sheet activities. A sustainable funding structure is intended to reduce the likelihood that disruptions to an institution’s regular sources of funding will erode its liquidity position in a way that would increase the risk of its failure and potentially lead to broader systemic stress. OSFI has been requiring Canadian banks to maintain a minimum NSFR of 100%. The following table provides the available stable funding and the required stable funding. For the quarter ended January 31, 2021, the Bank’s NSFR was 124%, well above the 100% regulatory requirement and demonstrating the Bank’s solid liquidity in a long term position. NSFR Disclosure Requirements (1) (millions of Canadian dollars) As at January 31, 2021
Unweighted value by residual maturity
Weighted value
No
maturity 6 months
or less
Over 6 months to 1 year
Over 1 year
a b c d e
Available Stable Funding (ASF) Items 1 Capital: 16,920 − − 773 17,693 2 Regulatory capital 16,920 − − 773 17,693 3 Other capital instruments − − − − − 4 Retail deposits and deposits from small business customers: 53,669 8,929 6,210 15,831 78,422 5 Stable deposits 25,207 3,632 2,857 5,974 36,085 6 Less stable deposits 28,462 5,297 3,353 9,857 42,337 7 Wholesale funding: 62,992 73,048 6,206 31,850 78,157 8 Operational deposits 20,532 − − − 10,266 9 Other wholesale funding 42,460 73,048 6,206 31,850 67,891
10 Liabilities with matching interdependent assets(2) − 2,198 1,428 19,036 − 11 Other liabilities: 20,647 9,709 206 1,233 1,048 12 NSFR derivative liabilities(3) n.a. 8,188 n.a. 13 All other liabilities and equity not included in the above categories 20,647 1,521 206 1,233 1,048 14 Total ASF n.a. n.a. n.a. n.a 175,320
Required Stable Funding (RSF) Items 15 Total NSFR high-quality liquid assets (HQLA) n.a. n.a. n.a. n.a. 6,332 16 Deposits held at other financial institutions for operational purposes − − − − − 17 Performing loans and securities: 39,888 66,390 17,165 80,297 116,497 18 Performing loans to financial institutions secured by Level 1 HQLA 386 1,016 − − 70 19
Performing loans to financial institutions secured by non-Level 1 HQLA and unsecured performing loans to financial institutions 4,268 38,733 667 863 5,573
20
Performing loans to non-financial corporate clients, loans to retail and small business customers, and loans to sovereigns, central banks and PSEs, of which: 14,411 21,666 11,126 30,284 54,399
21
With a risk weight of less than or equal to 35% under the Basel II Standardised Approach for credit risk 188 2,675 515 88 1,774
22 Performing residential mortgages, of which: 9,247 4,774 4,708 45,283 42,896 23
With a risk weight of less than or equal to 35% under the Basel II Standardised Approach for credit risk 9,247 4,774 4,708 45,283 42,896
24
Securities that are not in default and do not qualify as HQLA, including exchange-traded equities 11,576 201 664 3,867 13,559
25 Assets with matching interdependent liabilities(2) − 2,198 1,428 19,036 − 26 Other assets(3): 4,538 34,872 15,692 27 Physical traded commodities, including gold 362 n.a. n.a. n.a. 362 28
Assets posted as initial margin for derivative contracts and contributions to default funds of CCPs(3) n.a. 6,647 5,650
29 NSFR derivative assets(3) n.a. 9,773 1,585 30 NSFR derivative liabilities before deduction of the variation margin posted(3) n.a. 14,131 707 31 All other assets not included in the above categories 4,176 3,335 283 703 7,388 32 Off-balance-sheet items 41,466 15,831 13,917 17,122 3,360 33 Total RSF n.a. n.a. n.a. n.a. 141,881 34 Net Stable Funding Ratio (%) n.a. n.a. n.a. n.a. 124%
n.a. Not applicable (1) OSFI prescribed a table format in order to standardize disclosure throughout the banking industry. (2) As per OSFI’s specifications, liabilities arising from transactions involving the Canada Mortgage Bond program and their corresponding encumbered mortgages are given RSF and ASF of 0%,
respectively. (3) As per OSFI’s specifications, there is no need to differentiate by maturities.

The NSFR represents the amount of ASF relative to the amount of RSF. ASF is defined as the portion of capital and liabilities expected to be reliable over the time horizon considered by the NSFR, which extends to one year. The amount of RSF of a specific institution is a function of the liquidity characteristics and residual maturities of the various assets held by that institution as well as those of its off-balance-sheet exposures. The amounts of available and required stable funding are calibrated to reflect the degree of stability of liabilities and liquidity of assets. The Bank expects some quarter-over-quarter variation between reported NSFRs, and such variation may not be indicative of a trend. The NSFR assumptions differ from the assumptions used for the liquidity disclosures provided in the tables on the preceding pages or those used for internal liquidity management rules. While the liquidity disclosure framework is prescribed by the EDTF, the Bank’s internal liquidity metrics use assumptions that are calibrated according to its business model and experience. Funding The Bank continuously monitors and analyzes the possibilities for accessing less expensive and more flexible funding. The deposit strategy remains a priority for the Bank, which continues to prefer deposits to institutional funding. The table below presents the residual contractual maturities of the Bank’s wholesale funding. The information has been presented in accordance with the categories recommended by the EDTF for comparison purposes with other banks. Residual Contractual Maturities of Wholesale Funding(1)
(millions of Canadian dollars) As at January 31, 2021
1 month or
less
Over 1 month to 3 months
Over 3 months to 6 months
Over 6 months to
12 months
Subtotal 1 year or less
Over 1 year to 2 years
Over 2 years Total
Deposits from banks(2) 937 32 − 8 977 − − 977 Certificates of deposit and commercial paper(3) 3,235 5,432 3,086 1,145 12,898 − − 12,898 Senior unsecured medium-term notes(4)(5) − 688 771 881 2,340 2,872 6,681 11,893 Senior unsecured structured notes − − − 398 398 133 2,835 3,366 Covered bonds and asset-backed securities Mortgage securitization − 335 2,064 1,402 3,801 4,266 14,597 22,664 Covered bonds − 1,557 − 2,246 3,803 1,276 4,643 9,722 Securitization of credit card receivables − − − 36 36 − 28 64 Subordinated liabilities(6) − − − − − − 773 773 4,172 8,044 5,921 6,116 24,253 8,547 29,557 62,357 Secured funding − 1,892 2,064 3,684 7,640 5,542 19,268 32,450 Unsecured funding 4,172 6,152 3,857 2,432 16,613 3,005 10,289 29,907 4,172 8,044 5,921 6,116 24,253 8,547 29,557 62,357 As at October 31, 2020 2,192 5,359 8,080 5,770 21,401 9,312 28,389 59,102
(1) Bankers’ acceptances are not included in this table. (2) Deposits from banks include all non-negotiable term deposits from banks. (3) Includes bearer deposit notes. (4) Certificates of deposit denominated in euros are included in senior unsecured medium-term notes. (5) Includes deposits subject to bank recapitalization (Bail-in) conversion regulations. (6) Subordinated debt is presented in this table but the Bank does not consider it as part of its wholesale funding.
As part of a comprehensive liquidity management framework, the Bank regularly reviews its contracts that stipulate that additional collateral could be required in the event of a downgrade of the Bank’s credit rating. The Bank’s liquidity position management approach already incorporates additional collateral requirements in the event of a one-notch to three-notch downgrade. The table below presents the additional collateral requirements in the event of a one-notch or three-notch credit rating downgrade. (millions of Canadian dollars) As at January 31, 2021
One-notch
downgrade Three-notch downgrade
Derivatives(1) 25 35
(1) Contractual requirements related to agreements known as Credit Support Annexes.

Residual Contractual Maturities of Balance Sheet Items and Off-Balance-Sheet Commitments The following tables present balance sheet items and off-balance-sheet commitments by residual contractual maturity as at January 31, 2021 with comparative figures as at October 31, 2020. The information gathered from this maturity analysis is a component of liquidity and funding management. However, this maturity profile does not represent how the Bank manages its interest rate risk or its liquidity risk and funding needs. The Bank considers factors other than contractual maturity in the assessment of liquid assets or in determining expected future cash flows. In the normal course of business, the Bank enters into various off-balance-sheet commitments. The credit instruments used to meet the financing needs of its clients represent the maximum amount of additional credit the Bank could be obligated to extend if the commitments were fully drawn. The Bank also has future minimum commitments under leases as well as for other contracts, mainly commitments to purchase loans and contracts for outsourced information technology services. Most of the lease commitments are related to operating leases. (millions of Canadian dollars) As at January 31, 2021
1 month
or less
Over 1 month to 3 months
Over 3 months to 6 months
Over 6 months to 9 months
Over 9 months to
12 months
Over 1 year to 2 years
Over 2 years to 5 years
Over 5 years
No specified maturity Total
Assets
Cash and deposits with financial institutions 9,055 304 449 495 331 − − − 23,092 33,726 Securities At fair value through profit or loss 2,086 4,788 935 1,208 1,454 2,698 6,255 9,024 59,880 88,328 At fair value through other comprehensive income − 104 998 384 21 974 4,872 3,152 651 11,156 At amortized cost 33 146 286 320 840 1,715 6,995 821 − 11,156 2,119 5,038 2,219 1,912 2,315 5,387 18,122 12,997 60,531 110,640 Securities purchased under reverse repurchase agreements and securities borrowed 3,202 844 1,005 − − 640 − − 4,728 10,419 Loans(1) Residential mortgage 901 1,005 3,015 2,944 2,348 8,782 41,858 5,363 611 66,827 Personal 181 352 747 865 831 3,088 14,124 3,463 14,087 37,738 Credit card 1,846 1,846 Business and government 9,916 2,928 5,416 3,052 3,078 5,904 13,212 3,499 8,545 55,550 Customers’ liability under acceptances 5,424 1,393 61 − − − − − − 6,878 Allowances for credit losses (1,149) (1,149) 16,422 5,678 9,239 6,861 6,257 17,774 69,194 12,325 23,940 167,690 Other Derivative financial instruments 1,568 2,479 1,163 448 714 1,021 2,103 3,381 − 12,877 Investments in associates and joint ventures 404 404 Premises and equipment 1,143 1,143 Goodwill 1,408 1,408 Intangible assets 1,446 1,446 Other assets(1) 1,291 153 162 137 265 356 82 77 1,361 3,884 2,859 2,632 1,325 585 979 1,377 2,185 3,458 5,762 21,162 33,657 14,496 14,237 9,853 9,882 25,178 89,501 28,780 118,053 343,637
(1) Amounts collectible on demand are considered to have no specified maturity.

(millions of Canadian dollars) As at January 31, 2021
1 month
or less
Over 1 month to 3 months
Over 3 months to 6 months
Over 6 months to 9 months
Over 9 months to
12 months
Over 1 year to 2 years
Over 2 years to 5 years
Over 5 years
No specified maturity Total
Liabilities and equity
Deposits(1)(2) Personal 1,850 2,961 1,790 1,960 4,314 5,479 6,969 3,700 39,536 68,559 Business and government 28,406 11,451 5,000 3,334 2,994 5,113 11,049 4,109 82,489 153,945 Deposit-taking institutions 1,868 505 80 27 23 − 1 39 2,630 5,173 32,124 14,917 6,870 5,321 7,331 10,592 18,019 7,848 124,655 227,677 Other Acceptances 5,424 1,393 61 − − − − − − 6,878 Obligations related to securities sold short(3) 623 378 305 94 155 1,977 2,683 4,905 7,153 18,273 Obligations related to securities sold under repurchase agreements and securities loaned 14,740 7,898 2,239 163 − 1,482 − − 4,760 31,282 Derivative financial instruments 2,081 2,389 995 467 507 874 4,953 1,744 − 14,010 Liabilities related to transferred receivables(4) − 335 2,064 398 1,004 4,266 11,233 3,364 − 22,664 Securitization – Credit card(5) − − − − 36 − 28 − − 64 Lease liabilities(5) 8 16 22 23 23 90 232 194 − 608 Other liabilities – Other items(1)(5) 775 227 127 56 134 49 41 49 3,030 4,488 23,651 12,636 5,813 1,201 1,859 8,738 19,170 10,256 14,943 98,267 Subordinated debt − − − − − − − 773 − 773 Equity 16,920 16,920 55,775 27,553 12,683 6,522 9,190 19,330 37,189 18,877 156,518 343,637
Off-balance-sheet commitments Letters of guarantee and documentary letters of credit 248 536 993 1,203 1,940 81 143 − − 5,144 Credit card receivables(6) 8,262 8,262 Backstop liquidity and credit enhancement facilities(7) − − 15 − 15 4,502 − − 3,001 7,533 Commitments to extend credit(8) 2,680 3,494 7,009 6,028 5,265 6,610 9,648 606 31,267 72,607 Obligations related to: Lease commitments(9) 1 1 2 1 1 4 3 5 − 18 Other contracts(10) 14 27 41 39 38 143 85 − 98 485
(1) Amounts payable upon demand or notice are considered to have no specified maturity. (2) The Deposits item is presented in greater detail than it is on the Consolidated Balance Sheet. (3) Amounts are disclosed according to the remaining contractual maturity of the underlying security. (4) These amounts mainly include liabilities related to the securitization of mortgage loans. (5) The Other liabilities item is presented in greater detail than it is on the Consolidated Balance Sheet. (6) These amounts are unconditionally revocable at the Bank’s discretion at any time. (7) In the event of payment on one of the backstop liquidity facilities, the Bank will receive as collateral government bonds in an amount up to $4.5 billion. (8) These amounts include $40.9 billion that is unconditionally revocable at the Bank’s discretion at any time. (9) These amounts include leases for which the underlying asset is of low value and leases other than for real estate of less than one year. (10) These amounts include $0.3 billion in contractual commitments related to the head office building under construction.

(millions of Canadian dollars) As at October 31, 2020
1 month
or less
Over 1 month to 3 months
Over 3 months to 6 months
Over 6 months to 9 months
Over 9 months to
12 months
Over 1 year to 2 years
Over 2 years to 5 years
Over 5 years
No specified maturity Total
Assets
Cash and deposits with financial institutions 6,126 345 372 264 488 − − − 21,547 29,142 Securities At fair value through profit or loss 4,084 2,352 2,778 603 1,832 2,383 6,080 9,413 48,801 78,326 At fair value through other comprehensive income 1 − 858 1,060 400 984 5,322 3,482 619 12,726 At amortized cost 20 256 306 367 1,678 2,218 5,450 784 − 11,079 4,105 2,608 3,942 2,030 3,910 5,585 16,852 13,679 49,420 102,131 Securities purchased under reverse repurchase agreements and securities borrowed 7,984 1,658 133 − − 666 − − 4,071 14,512 Loans(1) Residential mortgage 1,352 1,230 2,043 3,170 3,152 9,320 38,719 5,343 630 64,959 Personal 278 447 660 796 890 3,221 13,435 3,475 14,411 37,613 Credit card 2,038 2,038 Business and government 8,815 2,548 3,608 3,971 4,208 5,679 13,563 3,622 8,408 54,422 Customers’ liability under acceptances 6,049 765 52 − − − − − − 6,866 Allowances for credit losses (1,158) (1,158) 16,494 4,990 6,363 7,937 8,250 18,220 65,717 12,440 24,329 164,740 Other Derivative financial instruments 1,816 2,586 1,139 706 318 968 2,298 3,591 − 13,422 Investments in associates and joint ventures 409 409 Premises and equipment 1,155 1,155 Goodwill 1,414 1,414 Intangible assets 1,434 1,434 Other assets(1) 1,193 351 147 149 134 344 64 12 872 3,266 3,009 2,937 1,286 855 452 1,312 2,362 3,603 5,284 21,100 37,718 12,538 12,096 11,086 13,100 25,783 84,931 29,722 104,651 331,625
(1) Amounts collectible on demand are considered to have no specified maturity.

(millions of Canadian dollars) As at October 31, 2020
1 month
or less
Over 1 month to 3 months
Over 3 months to 6 months
Over 6 months to 9 months
Over 9 months to
12 months
Over 1 year to 2 years
Over 2 years to 5 years
Over 5 years
No specified maturity Total
Liabilities and equity
Deposits(1)(2) Personal 1,845 2,728 3,462 1,647 2,084 6,909 6,958 2,962 38,904 67,499 Business and government 21,801 7,168 9,916 2,185 2,462 6,860 10,341 3,602 79,452 143,787 Deposit-taking institutions 1,435 111 14 80 17 5 1 42 2,887 4,592 25,081 10,007 13,392 3,912 4,563 13,774 17,300 6,606 121,243 215,878 Other Acceptances 6,049 765 52 − − − − − − 6,866 Obligations related to securities sold short(3) 618 620 952 69 92 1,516 2,361 4,321 5,819 16,368 Obligations related to securities sold under repurchase agreements and securities loaned 14,084 3,335 8,803 136 − 1,487 − − 6,014 33,859 Derivative financial instruments 1,738 2,070 877 603 266 875 3,116 3,378 − 12,923 Liabilities related to transferred receivables(4) − 2,138 311 1,850 397 3,430 11,059 3,670 − 22,855 Securitization – Credit card(5) − − − − − 36 28 − − 64 Lease liabilities(5) 8 14 21 22 21 85 224 233 − 628 Other liabilities – Other items(1)(5) 1,087 192 200 87 76 85 37 281 2,981 5,026 23,584 9,134 11,216 2,767 852 7,514 16,825 11,883 14,814 98,589 Subordinated debt − − − − − − − 775 − 775 Equity 16,383 16,383 48,665 19,141 24,608 6,679 5,415 21,288 34,125 19,264 152,440 331,625
Off-balance-sheet commitments Letters of guarantee and documentary letters of credit 200 1,579 603 948 1,187 1,322 134 − − 5,973 Credit card receivables(6) 7,999 7,999 Backstop liquidity and credit enhancement facilities(7) − 15 4,502 15 − − − − 3,126 7,658 Commitments to extend credit(8) 2,846 4,143 4,504 6,429 5,688 5,651 10,690 1,165 29,213 70,329 Obligations related to: Lease commitments(9) 1 1 2 2 1 4 2 1 − 14 Other contracts(10) 15 28 41 41 39 145 114 − 278 701
(1) Amounts payable upon demand or notice are considered to have no specified maturity. (2) The Deposits item is presented in greater detail than it is on the Consolidated Balance Sheet. (3) Amounts are disclosed according to the remaining contractual maturity of the underlying security. (4) These amounts mainly include liabilities related to the securitization of mortgage loans. (5) The Other liabilities item is presented in greater detail than it is on the Consolidated Balance Sheet. (6) These amounts are unconditionally revocable at the Bank’s discretion at any time. (7) In the event of payment on one of the backstop liquidity facilities, the Bank will receive as collateral government bonds in an amount up to $4.5 billion. (8) These amounts include $39.4 billion that is unconditionally revocable at the Bank’s discretion at any time. (9) These amounts include leases for which the underlying asset is of low value and leases other than for real estate of less than one year. (10) These amounts include $0.3 billion in contractual commitments related to the head office building under construction.
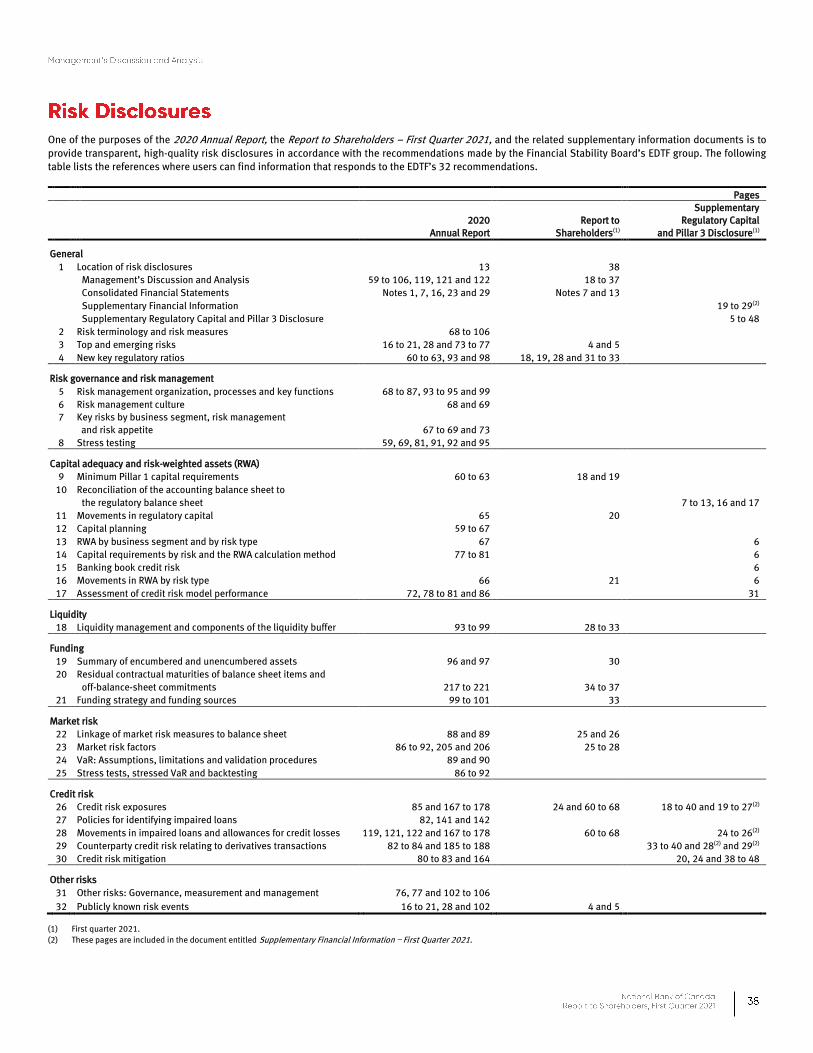
One of the purposes of the 2020 Annual Report, the Report to Shareholders – First Quarter 2021, and the related supplementary information documents is to provide transparent, high-quality risk disclosures in accordance with the recommendations made by the Financial Stability Board’s EDTF group. The following table lists the references where users can find information that responds to the EDTF’s 32 recommendations. Pages
2020
Annual Report Report to
Shareholders(1)
Supplementary Regulatory Capital
and Pillar 3 Disclosure(1)
General 1 Location of risk disclosures 13 38 Management’s Discussion and Analysis 59 to 106, 119, 121 and 122 18 to 37 Consolidated Financial Statements Notes 1, 7, 16, 23 and 29 Notes 7 and 13 Supplementary Financial Information 19 to 29(2) Supplementary Regulatory Capital and Pillar 3 Disclosure 5 to 48 2 Risk terminology and risk measures 68 to 106 3 Top and emerging risks 16 to 21, 28 and 73 to 77 4 and 5 4 New key regulatory ratios 60 to 63, 93 and 98 18, 19, 28 and 31 to 33 Risk governance and risk management 5 Risk management organization, processes and key functions 68 to 87, 93 to 95 and 99 6 Risk management culture 68 and 69
7
Key risks by business segment, risk management and risk appetite 67 to 69 and 73
8 Stress testing 59, 69, 81, 91, 92 and 95 Capital adequacy and risk-weighted assets (RWA) 9 Minimum Pillar 1 capital requirements 60 to 63 18 and 19 10 Reconciliation of the accounting balance sheet to the regulatory balance sheet 7 to 13, 16 and 17 11 Movements in regulatory capital 65 20 12 Capital planning 59 to 67 13 RWA by business segment and by risk type 67 6 14 Capital requirements by risk and the RWA calculation method 77 to 81 6 15 Banking book credit risk 6 16 Movements in RWA by risk type 66 21 6 17 Assessment of credit risk model performance 72, 78 to 81 and 86 31 Liquidity 18 Liquidity management and components of the liquidity buffer 93 to 99 28 to 33 Funding 19 Summary of encumbered and unencumbered assets 96 and 97 30 20 Residual contractual maturities of balance sheet items and off-balance-sheet commitments 217 to 221 34 to 37 21 Funding strategy and funding sources 99 to 101 33 Market risk 22 Linkage of market risk measures to balance sheet 88 and 89 25 and 26 23 Market risk factors 86 to 92, 205 and 206 25 to 28 24 VaR: Assumptions, limitations and validation procedures 89 and 90 25 Stress tests, stressed VaR and backtesting 86 to 92 Credit risk 26 Credit risk exposures 85 and 167 to 178 24 and 60 to 68 18 to 40 and 19 to 27(2) 27 Policies for identifying impaired loans 82, 141 and 142 28 Movements in impaired loans and allowances for credit losses 119, 121, 122 and 167 to 178 60 to 68 24 to 26(2) 29 Counterparty credit risk relating to derivatives transactions 82 to 84 and 185 to 188 33 to 40 and 28(2) and 29(2) 30 Credit risk mitigation 80 to 83 and 164 20, 24 and 38 to 48 Other risks 31 Other risks: Governance, measurement and management 76, 77 and 102 to 106
32 Publicly known risk events 16 to 21, 28 and 102 4 and 5
(1) First quarter 2021. (2) These pages are included in the document entitled Supplementary Financial Information — First Quarter 2021.

The Bank’s consolidated financial statements are prepared in accordance with International Financial Reporting Standards (IFRS), as issued by the International Accounting Standards Board (IASB). The financial statements also comply with section 308(4) of the Bank Act (Canada), which states that, except as otherwise specified by the Office of the Superintendent of Financial Institutions (Canada) (OSFI), the consolidated financial statements are to be prepared in accordance with IFRS. IFRS represent Canadian generally accepted accounting principles (GAAP). None of the OSFI accounting requirements are exceptions to IFRS. The unaudited interim condensed consolidated financial statements for the quarter ended January 31, 2021 were prepared in accordance with IAS 34 – Interim Financial Reporting and using the same accounting policies described in Note 1 to the audited annual consolidated financial statements for the year ended October 31, 2020, except for the changes described in Note 2 to the unaudited interim condensed consolidated financial statements, which have been applied since November 1, 2020. In preparing consolidated financial statements in accordance with IFRS, management must exercise judgment and make estimates and assumptions that affect the reporting date carrying amounts of assets and liabilities, net income and related information. Some accounting policies are considered critical given their importance to the presentation of the Bank’s financial position and operating results and require difficult, subjective and complex judgments and estimates on matters that are inherently uncertain. Any change in these judgments and estimates could have a significant impact on the Bank’s consolidated financial statements. The critical accounting estimates are the same as those described on pages 107 to 112 of the 2020 Annual Report. COVID-19 Pandemic Considerations The COVID-19 pandemic continues to evolve and as a result of the heightened uncertainty associated with the unprecedented nature of the COVID-19 pandemic, developing reliable estimates and applying judgment has become even more challenging. Some of the Bank’s accounting policies such as measurement of expected credit losses require particularly complex judgments and estimates. See Note 1 to the audited annual consolidated financial statements for the year ended October 31, 2020 for a summary of the most significant estimation processes used to prepare the consolidated financial statements in accordance with IFRS and for the measurement techniques used to determine carrying values and fair values of assets and liabilities. The uncertainty regarding certain key inputs used in measuring ECLs is described in Note 7 to these unaudited interim condensed consolidated financial statements.
The Bank adopted the following new standard and framework on November 1, 2020. Interest Rate Benchmark Reform In August 2020, the IASB finalized its response to the ongoing reform of interbank offered rates (IBOR) and other interest rate benchmarks by issuing amendments to its new and former financial instrument standards, IFRS 9 – Financial Instruments (IFRS 9), IAS 39 as well as the related disclosure standard IFRS 7, IFRS 4 – Insurance Contracts (IFRS 4) and IFRS 16 – Leases (IFRS 16). The amendments complement those issued in 2019 and focus on the effects on financial statements once existing benchmark rates are replaced with alternative benchmark rates. The amendments in this final phase relate to changes to contractual cash flows, hedge accounting, and disclosures. On November 1, 2020, the Bank early adopted amendments to IFRS 9, IAS 39, IFRS 7, IFRS 4 and IFRS 16. The amendments introduce a practical expedient to account for a change in the basis for determining the contractual cash flows for non-derivative financial instruments by revising prospectively the effective interest rate to reflect the change in the interest rate benchmark if the change is a direct consequence of the interest rate benchmark reform and the new basis for determining the contractual cash flows is economically equivalent to the previous basis. If additional changes are made and are not directly related to the reform, the applicable requirements of IFRS 9 are applied.

A temporary relief is also provided to hedge accounting requirements such that existing relationships that do not qualify under IAS 39 will be permitted if the change is affected by the interest benchmark reform. The Bank will update the hedge documentation without discontinuing the hedging relationship. For cash flow hedges, if the hedged item is modified due to the interest rate benchmark reform, the cumulative gain or loss in the cash flow hedge reserve for designated IBOR cash flow hedges is deemed to be based on the alternative benchmark rate. For the fair value hedges of a non-contractually specified benchmark component of interest rate risk, if that risk rate is not separately identifiable upon transition to the alternative benchmark rate, at the date of designation, it will be deemed to have met the separately identifiable requirement at that date. If the Bank reasonably expects the term specific interest rate component to be separately identifiable within a period of 24 months from the date the alternative benchmark rate is first designated, regardless of the term for which the risk is designated in that hedge, the 24-month period will apply on a rate by rate basis. The reform of benchmark interest rates is a global initiative that is being coordinated and led by central banks and governments around the world, including Canada. The objective is to improve benchmarks by ensuring that they meet robust international standards. The initiative introduces other benchmarks as recommended rates (risk-free rates, such as Secured Overnight Financing Rate (SOFR), Canadian Overnight Repo Rate Average (CORRA) and Euro Short-Term Rate (ESTR)) to replace the Interbank Offered Rate (IBOR), which are the benchmark rates used by the world's major banks for short-term lending in the interbank market. These rates, in particular LIBOR (London Interbank Offered Rates), are widely used around the world as benchmarks for derivative financial instruments, bonds and other variable-rate instruments. To ensure an orderly transition to the risk-free rates for derivatives, the industry has proposed a solution through ISDA (International Swaps and Derivatives Association) via a protocol (2020 IBOR Fallbacks Protocol), as well as a supplement to the 2006 definitions, which came into force on January 25, 2021. The Bank adhered to the 2020 IBOR Fallbacks Protocol on October 16, 2020 and is monitoring the adherence by its derivatives counterparties to plan the transition of its legacy derivatives contracts accordingly. For certain other types of contracts, contractual amendments are expected by the end of 2021, at which time certain LIBOR rates are expected to be withdrawn. On November 30, 2020, the administrator of the LIBOR rates, ICE Benchmark Administration, announced the launching of a consultation on discontinuing USD LIBOR main settings as of June 30, 2023, an announcement which was immediately relayed with supportive statements by the public sector, the UK Financial Conduct Authority (FCA), the Federal Reserve Board and U.S. agencies, reiterating the regulatory expectation that market participants stop new use of USD LIBOR at the end of 2021. To prepare for the interest rate benchmark reform, the Bank developed an enterprise-wide project, put together a dedicated team and established a formal governance structure. Several committees were created to ensure the success of the project and to prepare for the benchmark interest rate reform. The project team is made up of qualified resources from different fields of expertise to ensure an in-depth analysis of all aspects of the changes as well as the financial, legal, operational and technological impacts. Many of these experts, who have in-depth knowledge of accounting standards and reform-related activities, are involved in the Canadian Bankers Association’s working group where representatives of the major Canadian banks discuss the issues and interpretations of the reform. The Bank also participates in meetings with OSFI to discuss these same issues and interpretations. Furthermore, workshops are held to analyze the impact of the reform’s implementation, ensuring that information is disseminated to stakeholders affected by this reform; information-sharing meetings are held with all stakeholders affected by the reform, and participants in various industry committees share the latest developments. The project team regularly reports on the project’s progress to the project steering committee and the Financial Markets Risk Committee, committees made up of members of management and experts from all departments involved. As at January 31, 2021, the project is progressing according to schedule. Finally, a training plan for staff, management and board members has been created. The Bank is exposed to several risks, including interest rate risk and operational risk, which arise from non-derivative financial assets, non-derivative financial liabilities and derivative financial instruments. The project team ensures that risks are mitigated while ensuring a positive experience for its clients. The Bank is taking all necessary steps to identify, measure and control all risks to ensure a smooth transition to the interest rate benchmark reform.

The following table discloses the non-derivative financial assets, non-derivative financial liabilities and derivative financial instruments subject to the interest rate benchmark reform as at November 1, 2020 that have yet to transition to alternative benchmark rates and will mature after December 31, 2021. (millions of Canadian dollars) As at November 1, 2020
USD LIBOR EUR LIBOR GBP LIBOR JPY LIBOR CHF LIBOR
Non-derivative financial assets(1) 9,308 330 168 − − Non-derivative financial liabilities(2) 1,983 418 − − − Derivative financial instruments(3) 176,577 39,209 1,649 534 38
(1) Non-derivative financial assets include the carrying value of securities and securities purchased under reverse repurchase agreements or securities borrowed as well as the outstanding balances on loans.
(2) Non-derivative financial liabilities include the notional amounts of deposits and subordinated debt as well as the carrying value of obligations related to securities sold short and obligations related to securities sold under repurchase agreements or securities loaned.
(3) Derivative financial instruments include the notional amounts of interest rate contracts and foreign exchange contracts.
For additional information on Interest Rate Benchmark Reform – Phase 1, see Notes 1 and 17 to the audited annual consolidated financial statements for the year ended October 31, 2020. Conceptual Framework for Financial Reporting The Revised Conceptual Framework stipulates that financial information must be relevant and achieve fair presentation to be useful. The framework provides revised definitions and recognition criteria for assets and liabilities and confirms that different measurement bases are useful and permitted. The adoption of the Revised Conceptual Framework did not have a significant impact on the Bank.
The Bank closely monitors both new accounting standards and amendments to existing accounting standards issued by the IASB. The following standard has been issued but is not yet effective. The Bank is currently assessing the impact of the application of this standard on the consolidated financial statements. Effective Date – November 1, 2023 IFRS 17 – Insurance Contracts In May 2017, the IASB issued IFRS 17 – Insurance Contracts (IFRS 17), a new standard that replaces IFRS 4, the current insurance contract accounting standard. IFRS 17 introduces a new accounting framework that will improve the comparability and quality of financial information. IFRS 17 provides guidance on the recognition, measurement, presentation and disclosure of insurance contracts. In June 2020, issued amendments to IFRS 17 included a two-year deferral of the effective date along with other changes aimed at addressing concerns and implementation challenges identified after IFRS 17 was published in 2017. IFRS 17, as amended, is effective retrospectively for annual periods beginning on or after January 1, 2023, with earlier application permitted. If full retrospective application to a group of insurance contracts is impractical, the modified retrospective approach or the fair value approach may be used.
During the first quarter of 2021, no changes were made to the policies, procedures and other processes that comprise the Bank’s internal control over financial reporting that had or could reasonably have a significant impact on the internal control over financial reporting.

(millions of Canadian dollars, except per share amounts) 2021 2020 2019 2020 2019 Q1 Q4 Q3 Q2 Q1 Q4 Q3 Q2 Total Total
Total revenues 2,224 2,000 1,968 2,036 1,923 1,915 1,948 1,770 7,927 7,432 Net income 761 492 602 379 610 604 608 558 2,083 2,322 Earnings per share ($) Basic 2.16 1.37 1.67 1.01 1.69 1.68 1.68 1.52 5.73 6.39 Diluted 2.15 1.36 1.66 1.01 1.67 1.67 1.66 1.51 5.70 6.34 Dividends per common share ($) 0.71 0.71 0.71 0.71 0.71 0.68 0.68 0.65 2.84 2.66 Return on common shareholders’ equity (%) 21.2 13.7 17.0 10.7 18.0 18.2 18.7 17.8 14.9 18.0 Total assets 343,637 331,625 322,453 316,950 289,191 281,458 276,312 269,106
Net impaired loans(1) 400 465 453 479 436 450 420 379 Per common share ($) Book value 41.48 39.97 38.91 38.74 37.58 36.89 36.12 35.49 Share price High 73.81 72.85 65.54 74.79 74.22 68.02 64.16 63.82 Low 65.54 62.99 51.38 38.73 68.25 60.38 60.71 60.31
(1) All loans classified in Stage 3 of the expected credit loss model are impaired loans; the net impaired loans presented in this table exclude POCI loans.

Consolidated Balance Sheets 44 Consolidated Statements of Income 45 Consolidated Statements of Comprehensive Income 46 Consolidated Statements of Changes in Equity 48 Consolidated Statements of Cash Flows 49 Notes to the Interim Condensed Consolidated Financial Statements 50

As at January 31, 2021 As at October 31, 2020
Assets Cash and deposits with financial institutions 33,726 29,142 Securities (Notes 4, 5 and 6) At fair value through profit or loss 88,328 78,326 At fair value through other comprehensive income 11,156 12,726 At amortized cost 11,156 11,079 110,640 102,131 Securities purchased under reverse repurchase agreements and securities borrowed 10,419 14,512 Loans (Note 7) Residential mortgage 66,827 64,959 Personal 37,738 37,613 Credit card 1,846 2,038 Business and government 55,550 54,422 161,961 159,032 Customers' liability under acceptances 6,878 6,866 Allowances for credit losses (1,149) (1,158) 167,690 164,740 Other Derivative financial instruments 12,877 13,422 Investments in associates and joint ventures 404 409 Premises and equipment 1,143 1,155 Goodwill 1,408 1,414 Intangible assets 1,446 1,434 Other assets (Note 9) 3,884 3,266 21,162 21,100 343,637 331,625
Liabilities and equity Deposits (Notes 5 and 10) 227,677 215,878 Other Acceptances 6,878 6,866 Obligations related to securities sold short 18,273 16,368 Obligations related to securities sold under repurchase agreements and securities loaned(1) (Note 8) 31,282 33,859 Derivative financial instruments 14,010 12,923 Liabilities related to transferred receivables (Notes 5 and 8) 22,664 22,855 Other liabilities (Note 11) 5,160 5,718 98,267 98,589 Subordinated debt 773 775 Equity Equity attributable to the Bank’s shareholders and holders of other equity instruments (Notes 12 and 14) Preferred shares and other equity instruments 2,950 2,950 Common shares 3,094 3,057 Contributed surplus 45 47 Retained earnings 10,998 10,444 Accumulated other comprehensive income (167) (118) 16,920 16,380 Non-controlling interests (Note 18) − 3 16,920 16,383 343,637 331,625
The accompanying notes are an integral part of these unaudited interim condensed consolidated financial statements.
(1) As at January 31, 2021, Obligations related to securities sold under repurchase agreements and securities loaned include term repurchase transactions with the Bank of Canada, for which the underlying asset is a Bank issued security such as bearer deposit notes and covered bonds.

Quarter ended January 31
2021 2020 Interest income Loans 1,376 1,648 Securities at fair value through profit or loss 297 280
Securities at fair value through other comprehensive income 42 55 Securities at amortized cost 45 59 Deposits with financial institutions 18 32 1,778 2,074 Interest expense Deposits 426 890 Liabilities related to transferred receivables 86 106 Subordinated debt 4 6 Other 55 142 571 1,144 Net interest income(1) 1,207 930 Non-interest income Underwriting and advisory fees 107 86 Securities brokerage commissions 59 48 Mutual fund revenues 132 120 Trust service revenues 187 166 Credit fees 131 110 Card revenues 33 39 Deposit and payment service charges 65 68 Trading revenues (losses) 126 225 Gains (losses) on non-trading securities, net 36 30 Insurance revenues, net 28 36 Foreign exchange revenues, other than trading 34 24 Share in the net income of associates and joint ventures 6 10 Other 73 31 1,017 993 Total revenues 2,224 1,923 Non-interest expenses Compensation and employee benefits 731 660 Occupancy 79 66 Technology 200 169 Communications 13 16 Professional fees 56 59 Other 101 121 1,180 1,091 Income before provisions for credit losses and income taxes 1,044 832 Provisions for credit losses (Note 7) 81 89 Income before income taxes 963 743 Income taxes 202 133 Net income 761 610
Net income attributable to Preferred shareholders and holders of other equity instruments 33 29 Common shareholders 728 565 Bank shareholders and holders of other equity instruments 761 594 Non-controlling interests − 16 761 610 Earnings per share (dollars) (Note 16)
Basic 2.16 1.69 Diluted 2.15 1.67 Dividends per common share (dollars) (Note 12) 0.71 0.71 The accompanying notes are an integral part of these unaudited interim condensed consolidated financial statements.
(1) Net interest income includes dividend income. For additional information, see Note 1 to the audited annual consolidated financial statements for the year ended October 31, 2020.

Quarter ended January 31
2021 2020
Net income 761 610
Other comprehensive income, net of income taxes Items that may be subsequently reclassified to net income Net foreign currency translation adjustments Net unrealized foreign currency translation gains (losses) on investments in foreign operations (176) 13 Impact of hedging net foreign currency translation gains (losses) 54 (6) (122) 7
Net change in debt securities at fair value through other comprehensive income Net unrealized gains (losses) on debt securities at fair value through other comprehensive income 37 23 Net (gains) losses on debt securities at fair value through other comprehensive income reclassified to net income (10) (11) Change in allowances for credit losses on debt securities at fair value through other comprehensive income reclassified to net income (1) − 26 12
Net change in cash flow hedges Net gains (losses) on derivative financial instruments designated as cash flow hedges 32 (38) Net (gains) losses on designated derivative financial instruments reclassified to net income 2 (3) 34 (41) Share in the other comprehensive income of associates and joint ventures − −
Items that will not be subsequently reclassified to net income Remeasurements of pension plans and other post-employment benefit plans 132 (63) Net gains (losses) on equity securities designated at fair value through other comprehensive income 27 11 Net fair value change attributable to the credit risk on financial liabilities designated at fair value through profit or loss (84) (31) 75 (83)
Total other comprehensive income, net of income taxes 13 (105)
Comprehensive income 774 505
Comprehensive income attributable to Bank shareholders and holders of other equity instruments 787 488 Non-controlling interests (13) 17
774 505 The accompanying notes are an integral part of these unaudited interim condensed consolidated financial statements.

The following table presents the income tax expense or recovery for each component of other comprehensive income.
Quarter ended January 31
2021 2020
Items that may be subsequently reclassified to net income Net foreign currency translation adjustments Net unrealized foreign currency translation gains (losses) on investments in foreign operations 4 − Impact of hedging net foreign currency translation gains (losses) 15 (2) 19 (2)
Net change in debt securities at fair value through other comprehensive income Net unrealized gains (losses) on debt securities at fair value through other comprehensive income 13 8 Net (gains) losses on debt securities at fair value through other comprehensive income reclassified to net income (4) (4) Change in allowances for credit losses on debt securities at fair value through other comprehensive income reclassified to net income − − 9 4
Net change in cash flow hedges Net gains (losses) on derivative financial instruments designated as cash flow hedges 11 (14) Net (gains) losses on designated derivative financial instruments reclassified to net income 1 (1) 12 (15)
Share in the other comprehensive income of associates and joint ventures − − Items that will not be subsequently reclassified to net income Remeasurements of pension plans and other post-employment benefit plans 47 (22) Net gains (losses) on equity securities designated at fair value through other comprehensive income 10 5 Net fair value change attributable to the credit risk on financial liabilities designated at fair value through profit or loss (30) (12) 27 (29) 67 (42) The accompanying notes are an integral part of these unaudited interim condensed consolidated financial statements.

Quarter ended January 31
2021 2020
Preferred shares and other equity instruments at beginning and at end (Note 12) 2,950 2,450
Common shares at beginning (Note 12) 3,057 2,949 Issuances of common shares pursuant to the Stock Option Plan 39 79 Impact of shares purchased or sold for trading (2) − Common shares at end 3,094 3,028
Contributed surplus at beginning 47 51 Stock option expense (Note 14) 3 2 Stock options exercised (5) (9) Contributed surplus at end 45 44
Retained earnings at beginning 10,444 9,312 Net income attributable to the Bank's shareholders and holders of other equity instruments 761 594 Dividends on preferred shares and distributions on other equity instruments (Note 12) (34) (29) Dividends on common shares (Note 12) (239) (238) Remeasurements of pension plans and other post-employment benefit plans 132 (63) Net gains (losses) on equity securities designated at fair value through other comprehensive income 27 11 Net fair value change attributable to the credit risk on financial liabilities designated at fair value through profit or loss (84) (31) Other (9) − Retained earnings at end 10,998 9,556
Accumulated other comprehensive income at beginning (118) 16 Net foreign currency translation adjustments (109) 6 Net change in unrealized gains (losses) on debt securities at fair value through other comprehensive income 26 12 Net change in gains (losses) on cash flow hedges 34 (41) Share in the other comprehensive income of associates and joint ventures − − Accumulated other comprehensive income at end
(167) (7) Equity attributable to the Bank's shareholders and holders of other equity instruments 16,920 15,071
Non-controlling interests at beginning 3 358 Purchase of the non-controlling interest of the Credigy Ltd. subsidiary (Note 18) 10 − Net income attributable to non-controlling interests − 16 Other comprehensive income attributable to non-controlling interests (13) 1 Distributions to non-controlling interests − (25) Non-controlling interests at end − 350
Equity 16,920 15,421
As at January 31,
2021 As at January 31,
2020
Accumulated other comprehensive income Net foreign currency translation adjustments (48) 14 Net unrealized gains (losses) on debt securities at fair value through other comprehensive income 127 26 Net gains (losses) on instruments designated as cash flow hedges (249) (47) Share in the other comprehensive income of associates and joint ventures 3 − (167) ( 7) The accompanying notes are an integral part of these unaudited interim condensed consolidated financial statements.

Quarter ended January 31
2021 2020
Cash flows from operating activities Net income 761 610 Adjustments for Provisions for credit losses 81 89 Amortization of premises and equipment including right-of-use assets 54 48 Amortization of intangible assets 73 61 Deferred taxes 47 24 Losses (gains) on sales of non-trading securities, net (36) (30) Share in the net income of associates and joint ventures (6) (10) Stock option expense 3 2 Change in operating assets and liabilities Securities at fair value through profit or loss (10,002) (11,328) Securities purchased under reverse repurchase agreements and securities borrowed 4,093 6,034 Loans and acceptances, net of securitization (3,206) (3,503) Deposits 11,799 7,938 Obligations related to securities sold short 1,905 (586) Obligations related to securities sold under repurchase agreements and securities loaned (2,577) 154 Derivative financial instruments, net 1,632 (706) Interest and dividends receivable and interest payable (105) 20 Current tax assets and liabilities 52 (117) Other items (226) (780)
4,342 (2,080)
Cash flows from financing activities Issuances of common shares (including the impact of shares purchased for trading) 32 70 Purchase of the non-controlling interest of the Credigy Ltd. subsidiary (Note 18) (300) − Repayments of lease liabilities (24) (21) Dividends paid on shares and distributions on other equity instruments (273) (495) Distributions to non-controlling interests − (25) (565) (471)
Cash flows from investing activities Net change in investments in associates and joint ventures 5 − Purchases of non-trading securities (1,575) (1,545) Maturities of non-trading securities 675 445 Sales of non-trading securities 2,226 2,436 Net change in premises and equipment, excluding right-of-use assets (40) (53) Net change in intangible assets (85) (75) 1,206 1,208 Impact of currency rate movements on cash and cash equivalents (399) 99
Increase (decrease) in cash and cash equivalents 4,584 (1,244) Cash and cash equivalents at beginning 29,142 13,698 Cash and cash equivalents at end(1) 33,726 12,454
Supplementary information about cash flows from operating activities Interest paid 641 1,171 Interest and dividends received 1,743 2,121 Income taxes paid 209 185 The accompanying notes are an integral part of these unaudited interim condensed consolidated financial statements.
(1) This item is the equivalent of Consolidated Balance Sheet item Cash and deposits with financial institutions. It includes an amount of $5.6 billion as at January 31, 2021 ($5.9 billion as at October 31, 2020) for which there are restrictions.

Note 1 Basis of Presentation 50 Note 10 Deposits 70 Note 2 Accounting Policy Changes 50 Note 11 Other Liabilities 70 Note 3 Future Accounting Policy Changes 52 Note 12 Share Capital and Other Equity Instruments 71 Note 4 Fair Value of Financial Instruments 53 Note 13 Capital Disclosure 72 Note 5 Financial Instruments Designated at Fair Value Through Note 14 Share-Based Payments 73 Profit or Loss 58 Note 15 Employee Benefits – Pension Plans and Other
Note 6 Securities 59 Post-Employment Benefits 73 Note 7 Loans and Allowances for Credit Losses 60 Note 16 Earnings Per Share 74 Note 8 Financial Assets Transferred But Not Derecognized 69 Note 17 Segment Disclosures 75 Note 9 Other Assets 70 Note 18 Acquisition 75
On February 23, 2021, the Board of Directors authorized the publication of the Bank’s unaudited interim condensed consolidated financial statements (the consolidated financial statements) for the quarter ended January 31, 2021. The Bank’s consolidated financial statements are prepared in accordance with International Financial Reporting Standards (IFRS), as issued by the International Accounting Standards Board (IASB). The financial statements also comply with section 308(4) of the Bank Act (Canada), which states that, except as otherwise specified by the Office of the Superintendent of Financial Institutions (Canada) (OSFI), the consolidated financial statements are to be prepared in accordance with IFRS. IFRS represent Canadian generally accepted accounting principles (GAAP). None of the OSFI accounting requirements are exceptions to IFRS. These consolidated financial statements were prepared in accordance with IAS 34 – Interim Financial Reporting and using the same accounting policies as those described in Note 1 to the audited annual consolidated financial statements for the year ended October 31, 2020, except for the changes described in Note 2 to these consolidated financial statements, which have been applied since November 1, 2020. Unless otherwise indicated, all amounts are expressed in Canadian dollars, which is the Bank’s functional and presentation currency. COVID-19 Pandemic Considerations The COVID-19 pandemic continues to evolve and as a result of the heightened uncertainty associated with the unprecedented nature of the COVID-19 pandemic, developing reliable estimates and applying judgment has become even more challenging. Some of the Bank’s accounting policies such as measurement of expected credit losses require particularly complex judgments and estimates. See Note 1 to the audited annual consolidated financial statements for the year ended October 31, 2020 for a summary of the most significant estimation processes used to prepare the consolidated financial statements in accordance with IFRS and for the measurement techniques used to determine carrying values and fair values of assets and liabilities. The uncertainty regarding certain key inputs used in measuring ECLs is described in Note 7 to these consolidated financial statements.
The Bank adopted the following new standard and framework on November 1, 2020. Interest Rate Benchmark Reform In August 2020, the IASB finalized its response to the ongoing reform of interbank offered rates (IBOR) and other interest rate benchmarks by issuing amendments to its new and former financial instrument standards, IFRS 9 – Financial Instruments (IFRS 9), IAS 39 as well as the related disclosure standard IFRS 7, IFRS 4 – Insurance Contracts (IFRS 4) and IFRS 16 – Leases (IFRS 16). The amendments complement those issued in 2019 and focus on the effects on financial statements once existing benchmark rates are replaced with alternative benchmark rates. The amendments in this final phase relate to changes to contractual cash flows, hedge accounting, and disclosures. On November 1, 2020, the Bank early adopted amendments to IFRS 9, IAS 39, IFRS 7, IFRS 4 and IFRS 16. The amendments introduce a practical expedient to account for a change in the basis for determining the contractual cash flows for non-derivative financial instruments by revising prospectively the effective interest rate to reflect the change in the interest rate benchmark if the change is a direct consequence of the interest rate benchmark reform and the new basis for determining the contractual cash flows is economically equivalent to the previous basis. If additional changes are made and are not directly related to the reform, the applicable requirements of IFRS 9 are applied.

A temporary relief is also provided to hedge accounting requirements such that existing relationships that do not qualify under IAS 39 will be permitted if the change is affected by the interest benchmark reform. The Bank will update the hedge documentation without discontinuing the hedging relationship. For cash flow hedges, if the hedged item is modified due to the interest rate benchmark reform, the cumulative gain or loss in the cash flow hedge reserve for designated IBOR cash flow hedges is deemed to be based on the alternative benchmark rate. For the fair value hedges of a non-contractually specified benchmark component of interest rate risk, if that risk rate is not separately identifiable upon transition to the alternative benchmark rate, at the date of designation, it will be deemed to have met the separately identifiable requirement at that date. If the Bank reasonably expects the term specific interest rate component to be separately identifiable within a period of 24 months from the date the alternative benchmark rate is first designated, regardless of the term for which the risk is designated in that hedge, the 24-month period will apply on a rate by rate basis. The reform of benchmark interest rates is a global initiative that is being coordinated and led by central banks and governments around the world, including Canada. The objective is to improve benchmarks by ensuring that they meet robust international standards. The initiative introduces other benchmarks as recommended rates (risk-free rates, such as Secured Overnight Financing Rate (SOFR), Canadian Overnight Repo Rate Average (CORRA) and Euro Short-Term Rate (ESTR)) to replace the Interbank Offered Rate (IBOR), which are the benchmark rates used by the world's major banks for short-term lending in the interbank market. These rates, in particular LIBOR (London Interbank Offered Rates), are widely used around the world as benchmarks for derivative financial instruments, bonds and other variable-rate instruments. To ensure an orderly transition to the risk-free rates for derivatives, the industry has proposed a solution through ISDA (International Swaps and Derivatives Association) via a protocol (2020 IBOR Fallbacks Protocol), as well as a supplement to the 2006 definitions, which came into force on January 25, 2021. The Bank adhered to the 2020 IBOR Fallbacks Protocol on October 16, 2020 and is monitoring the adherence by its derivatives counterparties to plan the transition of its legacy derivatives contracts accordingly. For certain other types of contracts, contractual amendments are expected by the end of 2021, at which time certain LIBOR rates are expected to be withdrawn. On November 30, 2020, the administrator of the LIBOR rates, ICE Benchmark Administration, announced the launching of a consultation on discontinuing USD LIBOR main settings as of June 30, 2023, an announcement which was immediately relayed with supportive statements by the public sector, the UK Financial Conduct Authority (FCA), the Federal Reserve Board and U.S. agencies, reiterating the regulatory expectation that market participants stop new use of USD LIBOR at the end of 2021. To prepare for the interest rate benchmark reform, the Bank developed an enterprise-wide project, put together a dedicated team and established a formal governance structure. Several committees were created to ensure the success of the project and to prepare for the benchmark interest rate reform. The project team is made up of qualified resources from different fields of expertise to ensure an in-depth analysis of all aspects of the changes as well as the financial, legal, operational and technological impacts. Many of these experts, who have in-depth knowledge of accounting standards and reform-related activities, are involved in the Canadian Bankers Association’s working group where representatives of the major Canadian banks discuss the issues and interpretations of the reform. The Bank also participates in meetings with OSFI to discuss these same issues and interpretations. Furthermore, workshops are held to analyze the impact of the reform’s implementation, ensuring that information is disseminated to stakeholders affected by this reform; information-sharing meetings are held with all stakeholders affected by the reform, and participants in various industry committees share the latest developments. The project team regularly reports on the project’s progress to the project steering committee and the Financial Markets Risk Committee, committees made up of members of management and experts from all departments involved. As at January 31, 2021, the project is progressing according to schedule. Finally, a training plan for staff, management and board members has been created. The Bank is exposed to several risks, including interest rate risk and operational risk, which arise from non-derivative financial assets, non-derivative financial liabilities and derivative financial instruments. The project team ensures that risks are mitigated while ensuring a positive experience for its clients. The Bank is taking all necessary steps to identify, measure and control all risks to ensure a smooth transition to the interest rate benchmark reform.

The following table discloses the non-derivative financial assets, non-derivative financial liabilities and derivative financial instruments subject to the interest rate benchmark reform as at November 1, 2020 that have yet to transition to alternative benchmark rates and will mature after December 31, 2021. As at November 1, 2020
USD LIBOR EUR LIBOR GBP LIBOR JPY LIBOR CHF LIBOR
Non-derivative financial assets(1) 9,308 330 168 − − Non-derivative financial liabilities(2) 1,983 418 − − − Derivative financial instruments(3) 176,577 39,209 1,649 534 38
(1) Non-derivative financial assets include the carrying value of securities and securities purchased under reverse repurchase agreements or securities borrowed as well as the outstanding balances on loans.
(2) Non-derivative financial liabilities include the notional amounts of deposits and subordinated debt as well as the carrying value of obligations related to securities sold short and obligations related to securities sold under repurchase agreements or securities loaned.
(3) Derivative financial instruments include the notional amounts of interest rate contracts and foreign exchange contracts.
For additional information on Interest Rate Benchmark Reform – Phase 1, see Notes 1 and 17 to the audited annual consolidated financial statements for the year ended October 31, 2020. Conceptual Framework for Financial Reporting The Revised Conceptual Framework stipulates that financial information must be relevant and achieve fair presentation to be useful. The framework provides revised definitions and recognition criteria for assets and liabilities and confirms that different measurement bases are useful and permitted. The adoption of the Revised Conceptual Framework did not have a significant impact on the Bank.
The Bank closely monitors both new accounting standards and amendments to existing accounting standards issued by the IASB. The following standard has been issued but is not yet effective. The Bank is currently assessing the impact of the application of this standard on the consolidated financial statements. Effective Date – November 1, 2023 IFRS 17 – Insurance Contracts In May 2017, the IASB issued IFRS 17 – Insurance Contracts (IFRS 17), a new standard that replaces IFRS 4, the current insurance contract accounting standard. IFRS 17 introduces a new accounting framework that will improve the comparability and quality of financial information. IFRS 17 provides guidance on the recognition, measurement, presentation and disclosure of insurance contracts. In June 2020, issued amendments to IFRS 17 included a two-year deferral of the effective date along with other changes aimed at addressing concerns and implementation challenges identified after IFRS 17 was published in 2017. IFRS 17, as amended, is effective retrospectively for annual periods beginning on or after January 1, 2023, with earlier application permitted. If full retrospective application to a group of insurance contracts is impractical, the modified retrospective approach or the fair value approach may be used.

Financial assets and financial liabilities are recognized on the Consolidated Balance Sheet at fair value or at amortized cost in accordance with the categories set out in the accounting framework for financial instruments. As at January 31, 2021
Carrying value and fair value Carrying
value Fair
value
Total carrying
value
Total fair
value
Financial instruments
classified as at fair value
through profit or loss
Financial instruments
designated at fair value
through profit or loss
Debt securities classified as at
fair value through other
comprehensive income
Equity securities designated at
fair value through other
comprehensive income
Financial instruments at amortized
cost, net
Financial instruments at amortized
cost, net
Financial assets Cash and deposits with financial institutions − − − − 33,726 33,726 33,726 33,726 Securities 85,916 2,412 10,505 651 11,156 11,356 110,640 110,840 Securities purchased under reverse repurchase agreements and securities borrowed − − − − 10,419 10,419 10,419 10,419 Loans and acceptances, net of allowances 8,151 − − − 159,539 162,026 167,690 170,177 Other Derivative financial instruments 12,877 − − − − − 12,877 12,877 Other assets − − − − 1,610 1,610 1,610 1,610
− − − − − − − − Financial liabilities Deposits − 13,661 214,016 (1) 214,962 227,677 228,623 Other Acceptances − − 6,878 6,878 6,878 6,878 Obligations related to securities sold short 18,273 − − − 18,273 18,273 Obligations related to securities sold under repurchase agreements and securities loaned − − 31,282 31,282 31,282 31,282 Derivative financial instruments 14,010 − − − 14,010 14,010 Liabilities related to transferred receivables − 8,599 14,065 14,394 22,664 22,993 Other liabilities − − 1,484 1,486 1,484 1,486 Subordinated debt − − 773 791 773 791
(1) Includes embedded derivative financial instruments.

As at October 31, 2020
Carrying value and fair value Carrying
value Fair
value
Total carrying
value
Total fair
value
Financial instruments
classified as at fair value
through profit or loss
Financial instruments
designated at fair value
through profit or loss
Debt securities classified as at
fair value through other
comprehensive income
Equity securities designated at
fair value through other
comprehensive income
Financial instruments at amortized
cost, net
Financial instruments at amortized
cost, net
Financial assets Cash and deposits with financial institutions − − − − 29,142 29,142 29,142 29,142 Securities 75,647 2,679 12,107 619 11,079 11,290 102,131 102,342 Securities purchased under reverse repurchase agreements and securities borrowed − − − − 14,512 14,512 14,512 14,512 Loans and acceptances, net of allowances 8,109 − − − 156,631 159,473 164,740 167,582 − Other Derivative financial instruments 13,422 − − − − − 13,422 13,422 Other assets − − − − 1,153 1,153 1,153 1,153
Financial liabilities Deposits − 11,418 204,460 (1) 205,337 215,878 216,755 Other Acceptances − − 6,866 6,866 6,866 6,866 Obligations related to securities sold short 16,368 − − − 16,368 16,368 Obligations related to securities sold under repurchase agreements and securities loaned − − 33,859 33,859 33,859 33,859 Derivative financial instruments 12,923 − − − 12,923 12,923 Liabilities related to transferred receivables − 8,762 14,093 14,432 22,855 23,194 Other liabilities − − 1,892 1,894 1,892 1,894 Subordinated debt − − 775 787 775 787
(1) Includes embedded derivative financial instruments.
The fair value of a financial instrument is the price that would be received to sell a financial asset or paid to transfer a financial liability in an orderly transaction in the principal market at the measurement date under current market conditions (i.e., an exit price). Unadjusted quoted prices in active markets provide the best evidence of fair value. When there is no quoted price in an active market, the Bank applies other valuation techniques that maximize the use of relevant observable inputs and that minimize the use of unobservable inputs. Such valuation techniques include the following: using information available from recent market transactions, referring to the current fair value of a comparable financial instrument, applying discounted cash flow analysis, applying option pricing models, or relying on any other valuation technique that is commonly used by market participants and has proven to yield reliable estimates. Judgment is required when applying many of the valuation techniques. The Bank’s valuation was based on its assessment of the conditions prevailing as at January 31, 2021 and may change in the future. Furthermore, there may be valuation uncertainty resulting from the choice of valuation model used. Fair value is established in accordance with a rigorous control framework. The Bank has policies and procedures that govern the process for determining fair value. The Bank’s valuation governance structure has remained largely unchanged from that described in Note 3 to the audited annual consolidated financial statements for the year ended October 31, 2020. The valuation techniques used to determine the fair value of financial assets and financial liabilities are also described in this note, and no significant changes have been made to the valuation techniques.

Hierarchy of Fair Value Measurements
IFRS establishes a fair value measurement hierarchy that classifies the inputs used in financial instrument fair value measurement techniques according to three levels. This fair value hierarchy requires observable market inputs to be used whenever such inputs exist. According to the hierarchy, the highest level of inputs are unadjusted quoted prices in active markets for identical instruments and the lowest level of inputs are unobservable inputs. If inputs from different levels of the hierarchy are used, the financial instrument is classified in the same level as the lowest level input that is significant to the fair value measurement. For additional information, see Note 3 to the audited annual consolidated financial statements for the year ended October 31, 2020. Transfers of financial instruments between Levels 1 and 2 and transfers to (or from) Level 3 are deemed to have taken place at the beginning of the quarter in which the transfer occurred. Significant transfers can occur between the fair value hierarchy levels due to new information on inputs used to determine fair value and the observable nature of those inputs. During the quarter ended January 31, 2021, $6 million in securities classified as at fair value through profit or loss were transferred from Level 2 to Level 1 resulting from changing market conditions ($7 million in securities classified as at fair value through profit or loss during the quarter ended January 31, 2020). Also during the quarter ended January 31, 2021, $10 million in securities classified as at fair value through profit or loss were transferred from Level 1 to Level 2 resulting from changing market conditions ($2 million in securities classified as at fair value through profit or loss during the quarter ended January 31, 2020). During the quarters ended January 31, 2021 and 2020, financial instruments were transferred to (or from) Level 3 due to changes in the availability of observable market inputs resulting from changing market conditions. The following tables show financial instruments recorded at fair value on the Consolidated Balance Sheet according to the fair value hierarchy. As at January 31, 2021
Level 1 Level 2 Level 3
Total financial assets/liabilities
at fair value
Financial assets Securities At fair value through profit or loss Securities issued or guaranteed by Canadian government 1,826 7,398 − 9,224
Canadian provincial and municipal governments − 8,027 − 8,027
U.S. Treasury, other U.S. agencies and other foreign governments 6,788 1,973 − 8,761
Other debt securities − 2,396 40 2,436
Equity securities 58,715 581 584 59,880
67,329 20,375 624 88,328
At fair value through other comprehensive income Securities issued or guaranteed by Canadian government 60 3,309 − 3,369
Canadian provincial and municipal governments − 3,823 − 3,823
U.S. Treasury, other U.S. agencies and other foreign governments 2,089 254 − 2,343
Other debt securities − 970 − 970
Equity securities − 278 373 651
2,149 8,634 373 11,156
Loans − 7,815 336 8,151
Other Derivative financial instruments 392 12,473 12 12,877
69,870 49,297 1,345 120,512
Financial liabilities Deposits − 13,771 − 13,771
Other Obligations related to securities sold short 12,652 5,621 − 18,273
Derivative financial instruments 513 13,491 6 14,010
Liabilities related to transferred receivables − 8,599 − 8,599
13,165 41,482 6 54,653

As at October 31, 2020
Level 1 Level 2 Level 3
Total financial assets/liabilities
at fair value
Financial assets Securities At fair value through profit or loss Securities issued or guaranteed by Canadian government 1,852 7,632 − 9,484
Canadian provincial and municipal governments − 9,105 − 9,105
U.S. Treasury, other U.S. agencies and other foreign governments 7,852 996 − 8,848
Other debt securities − 2,048 40 2,088
Equity securities 47,941 443 417 48,801
57,645 20,224 457 78,326
At fair value through other comprehensive income Securities issued or guaranteed by Canadian government 877 3,535 − 4,412
Canadian provincial and municipal governments − 4,154 − 4,154
U.S. Treasury, other U.S. agencies and other foreign governments 2,165 284 − 2,449
Other debt securities − 1,092 − 1,092
Equity securities − 246 373 619
3,042 9,311 373 12,726
Loans − 7,737 372 8,109
Other Derivative financial instruments 343 13,049 30 13,422
61,030 50,321 1,232 112,583
Financial liabilities Deposits(1) − 11,575 (2) 11,573
Other Obligations related to securities sold short 11,575 4,793 − 16,368
Derivative financial instruments 242 12,680 1 12,923
Liabilities related to transferred receivables − 8,762 − 8,762
11,817 37,810 (1) 49,626
(1) The amount classified in Level 3 represents the fair value of embedded derivative financial instruments related to deposits.
The Bank classifies financial instruments in Level 3 when the valuation technique is based on at least one significant input that is not observable in the markets. The Bank maximizes the use of observable inputs to determine the fair value of financial instruments. For a description of the valuation techniques and significant unobservable inputs used in determining the fair value of financial instruments classified in Level 3, see Note 3 to the audited annual consolidated financial statements for the year ended October 31, 2020. For the quarter ended January 31, 2021, no significant change was made to the valuation techniques and significant unobservable inputs used in determining fair value. Sensitivity Analysis of Financial Instruments Classified in Level 3 The Bank performs sensitivity analyses for the fair value measurements of financial instruments classified in Level 3, substituting unobservable inputs with one or more reasonably possible alternative assumptions. For additional information on how a change in an unobservable input might affect the fair value measurements of Level 3 financial instruments, see Note 3 to the audited annual consolidated financial statements for the year ended October 31, 2020. For the quarter ended January 31, 2021, there were no significant changes in the sensitivity analyses of Level 3 financial instruments.

Change in the Fair Value of Financial Instruments Classified in Level 3
The Bank may hedge the fair value of financial instruments classified in the various levels through offsetting hedge positions. Gains and losses for financial instruments classified in Level 3 presented in the following tables do not reflect the inverse gains and losses on financial instruments used for economic hedging purposes that may have been classified in Levels 1 or 2 by the Bank. In addition, the Bank may hedge the fair value of financial instruments classified in Level 3 using other financial instruments classified in Level 3. The effect of these hedges is not included in the net amount presented in the following tables. The gains and losses presented hereafter may comprise changes in fair value based on observable and unobservable inputs. Quarter ended January 31, 2021
Securities at fair value
through profit or loss
Securities at fair value
through other comprehensive
income Loans
Derivative financial
instruments(1) Deposits(2)
Fair value as at October 31, 2020 457 373 372 29 2 Total realized and unrealized gains (losses) included in Net income(3) 165 − 15 (22) − Total realized and unrealized gains (losses) included in Other comprehensive income − − − − − Purchases 10 − − − − Sales (8) − − − − Issuances − − 3 − − Settlements and other − − (54) (1) − Financial instruments transferred into Level 3 − − − − − Financial instruments transferred out of Level 3 − − − − (2) Fair value as at January 31, 2021 624 373 336 6 − Change in unrealized gains and losses included in Net income with respect to financial assets and financial liabilities held as at January 31, 2021(4) 166 − 15 (22) −
Quarter ended January 31, 2020
Securities at fair value
through profit or loss
Securities at fair value
through other comprehensive
income Loans
Derivative financial
instruments(1) Deposits(2)
Fair value as at October 31, 2019 458 362 360 4 − Total realized and unrealized gains (losses) included in Net income (5) 40 − 3 2 − Total realized and unrealized gains (losses) included in Other comprehensive income − − − − − Purchases 10 − − − − Sales (5) − − − − Issuances − − 1 − − Settlements and other − − (3) 1 − Financial instruments transferred into Level 3 − − − − (4) Financial instruments transferred out of Level 3 − − − (2) − Fair value as at January 31, 2020 503 362 361 5 (4) Change in unrealized gains and losses included in Net income with respect to financial assets and financial liabilities held as at January 31, 2020(6) 39 − 3 2 −
(1) The derivative financial instruments include assets and liabilities presented on a net basis. (2) The amounts represent the fair value of embedded derivative financial instruments related to deposits. (3) Total gains (losses) included in Non-interest income was a gain of $158 million. (4) Total unrealized gains (losses) included in Non-interest income was an unrealized gain of $159 million. (5) Total gains (losses) included in Non-interest income was a gain of $45 million. (6) Total unrealized gains (losses) included in Non-interest income was an unrealized gain of $44 million.

The Bank chose to designate certain financial instruments at fair value through profit or loss according to the criteria presented in Note 1 to the audited annual consolidated financial statements for the year ended October 31, 2020. Consistent with its risk management strategy and in accordance with the fair value option, which permits the designation if it eliminates or significantly reduces a measurement or recognition inconsistency that would otherwise arise from measuring financial assets and financial liabilities or recognizing the gains and losses thereon on different bases, the Bank designated at fair value through profit or loss certain securities, certain securities purchased under reverse repurchase agreements, and certain liabilities related to transferred receivables. The fair value of liabilities related to transferred receivables does not include credit risk, as the holders of these liabilities are not exposed to the Bank’s credit risk. The Bank also designated certain deposits that include embedded derivative financial instruments at fair value through profit or loss. To determine a change in fair value arising from a change in the credit risk of deposits designated at fair value through profit or loss, the Bank calculates, at the beginning of the period, the present value of the instrument’s contractual cash flows using the following rates: first, using an observed discount rate for similar securities that reflects the Bank’s credit spread and, then, using a rate that excludes the Bank’s credit spread. The difference obtained between the two values is then compared to the difference obtained using the same rates at the end of the period. Information about the financial assets and financial liabilities designated at fair value through profit or loss is provided in the following tables.
Carrying value as at
January 31, 2021
Unrealized gains (losses) for
the quarter ended January 31, 2021
Unrealized gains (losses) since
the initial recognition of the instrument
Financial assets designated at fair value through profit or loss Securities 2,412 (6) 86
Financial liabilities designated at fair value through profit or loss Deposits(1)(2) 13,661 (691) (70) Liabilities related to transferred receivables 8,599 (1) (222) . 22,260 (692) (292)
Carrying value as at
January 31, 2020
Unrealized gains (losses) for
the quarter ended January 31, 2020
Unrealized gains (losses) since
the initial recognition of the instrument
Financial assets designated at fair value through profit or loss
Securities 3,223 13 39
Financial liabilities designated at fair value through profit or loss
Deposits(1)(2) 11,228 (165) (320)
Liabilities related to transferred receivables 7,755 (15) (90)
18,983 (180) (410)
(1) For the quarter ended January 31, 2021, the change in the fair value of deposits designated at fair value through profit or loss attributable to credit risk, and recorded in Other comprehensive income, resulted in a loss of $114 million ($43 million loss for the quarter ended January 31, 2020).
(2) The amount at maturity that the Bank will be contractually required to pay to the holders of these deposits varies and will differ from the reporting date fair value.

As at January 31, 2021 and as at October 31, 2020, securities at fair value through other comprehensive income and securities at amortized cost are classified in Stage 1, with their credit quality falling mostly in the “Excellent” category according to the Bank’s internal risk-rating categories. For additional information on the reconciliation of allowances for credit losses, see Note 7 to these consolidated financial statements.
As at January 31, 2021
Amortized
cost Gross unrealized
gains Gross unrealized
losses Carrying
value(1)
Securities issued or guaranteed by Canadian government 3,263 106 − 3,369 Canadian provincial and municipal governments 3,692 131 − 3,823 U.S. Treasury, other U.S. agencies and other foreign governments 2,326 18 (1) 2,343 Other debt securities 933 38 (1) 970 Equity securities 629 33 (11) 651
10,843 326 (13) 11,156
As at October 31, 2020
Amortized
cost Gross unrealized
gains Gross unrealized
losses Carrying
value(1)
Securities issued or guaranteed by Canadian government 4,302 110 − 4,412 Canadian provincial and municipal governments 4,013 142 (1) 4,154 U.S. Treasury, other U.S. agencies and other foreign governments 2,430 19 − 2,449 Other debt securities 1,051 42 (1) 1,092 Equity securities 633 13 (27) 619
12,429 326 (29) 12,726
(1) The allowances for credit losses on securities at fair value through other comprehensive income, representing an amount of $2 million as at January 31, 2021 ($3 million as at October 31, 2020), are reported in Other comprehensive income. For additional information, see Note 7 to these consolidated financial statements.
Equity Securities Designated at Fair Value Through Other Comprehensive Income The Bank designated certain equity securities, the business objective of which is to generate dividend income, at fair value through other comprehensive income without subsequent reclassification of gains and losses to net income. During the quarter ended January 31, 2021, an amount of $3 million in dividend income was recognized for these investments ($4 million for the quarter ended January 31, 2020), including negligible amounts in dividend income for investments that were sold during the quarters ended January 31, 2021 and 2020. Quarter ended January 31, 2021 Quarter ended January 31, 2020
Equity securities of private companies
Equity securities of public companies Total
Equity securities of private companies
Equity securities of public companies Total
Fair value at beginning 373 246 619 362 260 622 Change in fair value − 37 37 − 16 16 Designated at fair value through other comprehensive income − 7 7 − 31 31 Sales(1) − (12) (12) − (54) (54) Fair value at end 373 278 651 362 253 615
(1) The Bank disposed of public company equity securities for economic reasons.

As at January 31, 2021 As at October 31, 2020 Securities issued or guaranteed by Canadian government 5,823 6,163 Canadian provincial and municipal governments 2,254 2,353 U.S. Treasury, other U.S. agencies and other foreign governments 1 21 Other debt securities 3,079 2,543 Gross carrying value 11,157 11,080 Allowances for credit losses 1 1 Carrying value 11,156 11,079
During the quarter ended January 31, 2021, the Bank sold certain debt securities measured at amortized cost. The carrying value of these securities upon disposal was $143 million for quarter ended January 31, 2021 and the Bank had recognized negligible gains in Non-interest income – Gains (losses) on non-trading securities, net in the Consolidated Statement of Income. During the quarter ended January 31, 2020, the Bank did not dispose of any securities measured at amortized cost.
Determining Expected Credit Losses Expected credit losses are determined using a three-stage impairment approach that is based on the change in the credit quality of financial assets since initial recognition.
Stage 1 Financial assets that have experienced no significant increase in credit risk between initial recognition and the reporting date and for which 12-month expected credit losses are recorded at the reporting date are classified in Stage 1. Stage 2 Financial assets that have experienced a significant increase in credit risk between initial recognition and the reporting date, and for which lifetime expected credit losses are recorded at the reporting date, are classified in Stage 2. Stage 3 Financial assets for which there is objective evidence of impairment, for which one or more events have had a detrimental impact on the estimated future cash flows of these financial assets at the reporting date, and for which lifetime expected credit losses are recorded, are classified in Stage 3. POCI Financial assets that are credit-impaired when purchased or originated (POCI) are classified in the POCI category. For additional information, see Notes 1 and 7 to the audited annual consolidated financial statements for the year ended October 31, 2020.
The following tables present the gross carrying amounts of loans as at January 31, 2021 and as at October 31, 2020, according to credit quality and ECL impairment stage of each loan category at amortized cost, and according to credit quality for loans at fair value through profit or loss. For additional information on credit quality according to the Advanced Internal Rating-Based (AIRB) categories, see the Internal Default Risk Ratings table on page 80 in the Credit Risk section of the 2020 Annual Report.

As at January 31, 2021
Non-impaired loans(1) Impaired loans Loans at fair value through profit or
loss(2)
Total
Stage 1 Stage 2 Stage 3 POCI
Residential mortgage
Excellent 26,161 3 − − − 26,164
Good 15,660 41 − − − 15,701
Satisfactory 9,402 993 − − − 10,395
Special mention 535 301 − − − 836
Substandard 223 168 − − − 391
Default − − 114 − − 114 AIRB approach 51,981 1,506 114 − − 53,601 Standardized approach 5,068 27 44 467 7,620 13,226 Gross carrying amount 57,049 1,533 158 467 7,620 66,827 Allowances for credit losses(3) 60 28 31 (48) − 71 Carrying amount 56,989 1,505 127 515 7,620 66,756
Personal
Excellent 14,846 25 − − − 14,871
Good 10,473 811 − − − 11,284
Satisfactory 4,967 1,723 − − − 6,690
Special mention 321 623 − − − 944
Substandard 97 171 − − − 268
Default − − 120 − − 120 AIRB approach 30,704 3,353 120 − − 34,177 Standardized approach 3,243 45 18 255 − 3,561 Gross carrying amount 33,947 3,398 138 255 − 37,738 Allowances for credit losses(3) 78 135 69 (6) − 276 Carrying amount 33,869 3,263 69 261 − 37,462
Credit card
Excellent 294 − − − − 294
Good 259 − − − − 259
Satisfactory 636 19 − − − 655
Special mention 338 183 − − − 521
Substandard 26 66 − − − 92
Default − − − − − − AIRB approach 1,553 268 − − − 1,821 Standardized approach 25 − − − − 25 Gross carrying amount 1,578 268 − − − 1,846 Allowances for credit losses(3) 48 123 − − − 171 Carrying amount 1,530 145 − − − 1,675
Business and government(4)
Excellent 4,671 − − − 278 4,949
Good 20,422 17 − − 163 20,602
Satisfactory 21,492 7,751 − − 66 29,309
Special mention 203 1,817 − − − 2,020
Substandard 97 261 − − − 358
Default − − 388 − − 388 AIRB approach 46,885 9,846 388 − 507 57,626 Standardized approach 4,558 147 73 − 24 4,802 Gross carrying amount 51,443 9,993 461 − 531 62,428 Allowances for credit losses(3) 130 244 257 − − 631 Carrying amount 51,313 9,749 204 − 531 61,797
Total loans Gross carrying amount 144,017 15,192 757 722 8,151 168,839 Allowances for credit losses(3) 316 530 357 (54) − 1,149 Carrying amount 143,701 14,662 400 776 8,151 167,690
(1) In response to the COVID-19 pandemic, the Bank has approved certain payment deferrals for all types of loans. As at January 31, 2021, the gross carrying value of loans for which deferrals have been approved totalled $309 million for residential mortgages and $349 million for business and government loans. These loans are presented in the stage in which they were positioned immediately prior to application of the payment deferral.
(2) Not subject to expected credit losses. (3) The allowances for credit losses do not include the amounts related to undrawn commitments reported in the Other liabilities item of the Consolidated Balance Sheet. (4) Includes customers’ liability under acceptances.

As at October 31, 2020
Non-impaired loans(1) Impaired loans Loans at fair value through profit or
loss(2)
Total
Stage 1 Stage 2 Stage 3 POCI
Residential mortgage
Excellent 23,139 29 − − − 23,168
Good 15,753 108 − − − 15,861
Satisfactory 10,418 741 − − − 11,159
Special mention 730 299 − − − 1,029
Substandard 283 174 − − − 457
Default − − 149 − − 149 AIRB approach 50,323 1,351 149 − − 51,823 Standardized approach 4,993 31 44 531 7,537 13,136 Gross carrying amount 55,316 1,382 193 531 7,537 64,959 Allowances for credit losses(3) 63 23 35 (56) − 65 Carrying amount 55,253 1,359 158 587 7,537 64,894
Personal
Excellent 15,072 40 − − − 15,112
Good 9,680 1,039 − − − 10,719
Satisfactory 4,395 2,024 − − − 6,419
Special mention 300 696 − − − 996
Substandard 116 185 − − − 301
Default − − 140 − − 140 AIRB approach 29,563 3,984 140 − − 33,687 Standardized approach 3,532 48 22 324 − 3,926 Gross carrying amount 33,095 4,032 162 324 − 37,613 Allowances for credit losses(3) 87 145 76 (10) − 298 Carrying amount 33,008 3,887 86 334 − 37,315
Credit card
Excellent 385 − − − − 385
Good 307 − − − − 307
Satisfactory 660 28 − − − 688
Special mention 335 205 − − − 540
Substandard 29 64 − − − 93
Default − − − − − − AIRB approach 1,716 297 − − − 2,013 Standardized approach 25 − − − − 25 Gross carrying amount 1,741 297 − − − 2,038 Allowances for credit losses(3) 45 124 − − − 169 Carrying amount 1,696 173 − − − 1,869
Business and government(4)
Excellent 4,732 − − − 289 5,021
Good 21,380 10 − − 163 21,553
Satisfactory 19,421 7,037 − − 73 26,531
Special mention 218 1,915 − − − 2,133
Substandard 10 246 − − − 256
Default − − 361 − − 361 AIRB approach 45,761 9,208 361 − 525 55,855 Standardized approach 5,122 163 101 − 47 5,433 Gross carrying amount 50,883 9,371 462 − 572 61,288 Allowances for credit losses(3) 135 250 241 − − 626 Carrying amount 50,748 9,121 221 − 572 60,662
Total loans Gross carrying amount 141,035 15,082 817 855 8,109 165,898 Allowances for credit losses(3) 330 542 352 (66) − 1,158 Carrying amount 140,705 14,540 465 921 8,109 164,740
(1) In response to the COVID-19 pandemic, the Bank has approved certain payment deferrals for all types of loans. As at October 31, 2020, the gross carrying value of loans for which deferrals have been approved had totalled $695 million for residential mortgages and $1,182 million for business and government loans. These loans are presented in the stage in which they had been positioned immediately prior to application of the payment deferral.
(2) Not subject to expected credit losses. (3) The allowances for credit losses do not include the amounts related to undrawn commitments reported in the Other liabilities item of the Consolidated Balance Sheet. (4) Includes customers’ liability under acceptances.

The following table presents the credit risk exposures of off-balance-sheet commitments as at January 31, 2021 and as at October 31, 2020 according to credit quality and ECL impairment stage.
As at January 31, 2021 As at October 31, 2020
Stage 1 Stage 2 Stage 3 Total Stage 1 Stage 2 Stage 3 Total
Off-balance-sheet commitments(1) Retail Excellent 15,642 24 − 15,666 15,255 43 − 15,298 Good 4,181 254 − 4,435 3,967 309 − 4,276 Satisfactory 1,332 234 − 1,566 1,273 255 − 1,528 Special mention 89 65 − 154 84 69 − 153 Substandard 4 12 − 16 4 12 − 16 Default − − 3 3 − − 3 3
Non-retail Excellent 11,034 − − 11,034 10,616 − − 10,616 Good 17,191 299 − 17,490 17,442 343 − 17,785 Satisfactory 5,789 4,135 − 9,924 5,013 3,450 − 8,463 Special mention 22 363 − 385 28 324 − 352 Substandard 33 80 − 113 2 84 − 86 Default − − 9 9 − − 6 6 AIRB approach 55,317 5,466 12 60,795 53,684 4,889 9 58,582 Standardized approach 10,126 3 1 10,130 10,335 5 1 10,341 Total exposure 65,443 5,469 13 70,925 64,019 4,894 10 68,923 Allowances for credit losses 116 80 − 196 115 61 − 176 Total exposure, net of allowances 65,327 5,389 13 70,729 63,904 4,833 10 68,747
(1) Represent letters of guarantee and documentary letters of credit, undrawn commitments, and backstop liquidity and credit enhancement facilities.
As at January 31, 2021(2) As at October 31, 2020(2)
Residential mortgage Personal Credit card
Business and government(3)
Residential mortgage Personal Credit card
Business and government(3)
Past due but not impaired 31 to 60 days 49 57 18 47 58 74 20 22 61 to 90 days 18 25 10 12 24 27 9 10 Over 90 days(4) − − 25 − − − 24 − 67 82 53 59 82 101 53 32
(1) Loans less than 31 days past due are not presented as they are not considered past due from an administrative standpoint. (2) In response to the COVID-19 pandemic, the Bank has approved certain payment deferrals for all types of loans. These loans are presented in the loan category in which they were positioned
immediately prior to the application of the payment deferral. (3) Includes customers’ liability under acceptances. (4) All loans more than 90 days past due, except for credit card receivables, are considered impaired (Stage 3).
As at January 31, 2021 As at October 31, 2020
Gross Allowances for
credit losses Net Gross Allowances for
credit losses Net
Loans – Stage 3 Residential mortgage 158 31 127 193 35 158 Personal 138 69 69 162 76 86 Credit card(1) − − − − − − Business and government(2) 461 257 204 462 241 221 757 357 400 817 352 465 POCI loans 722 (54) 776 855 (66) 921
1,479 303 1,176 1,672 286 1,386
(1) Credit card receivables are considered impaired, at the latest, when payment is 180 days past due, and they are written off at that time. (2) Includes customers’ liability under acceptances.

The following tables present a reconciliation of the allowances for credit losses by Consolidated Balance Sheet item and by type of off-balance-sheet commitment.
Quarter ended January 31, 2021
Allowances for credit losses as at October 31, 2020
Provisions for credit losses Write-offs(1) Disposals
Recoveries and other
Allowances for credit losses as
at January 31, 2021
Balance sheet Cash and deposits with financial institutions(2)(3) 5 1 − − − 6
Securities(3) At fair value through other comprehensive income(4) 3 (1) − − − 2 At amortized cost(2) 1 − − − − 1
Securities purchased under reverse repurchase agreements and securities borrowed(2)(3) − − − − − −
Loans(5) Residential mortgage 65 8 (1) − (1) 71 Personal 298 7 (24) (7) 2 276 Credit card 169 12 (15) − 5 171 Business and government 533 38 (27) − (2) 542 Customers' liability under acceptances 93 (4) − − − 89
1,158 61 (67) (7) 4 1,149
Other assets(2)(3) − − − − − − Off-balance-sheet commitments(6) Letters of guarantee and documentary letters of credit 15 − − − − 15 Undrawn commitments 157 20 − − − 177 Backstop liquidity and credit enhancement facilities 4 − − − − 4 176 20 − − − 196 1,343 81 (67) (7) 4 1,354
Quarter ended January 31, 2020
Allowances for credit losses as at October 31, 2019
Provisions for credit losses Write-offs(1) Disposals
Recoveries and other
Allowances for credit losses as
at January 31, 2020
Balance sheet Cash and deposits with financial institutions(2)(3) 2 − − − − 2 Securities(3) At fair value through other comprehensive income(4) − − − − − − At amortized cost(2) 1 − − − − 1 Securities purchased under reverse repurchase agreements and securities borrowed(2)(3) − − − − − − Loans(5) Residential mortgage 21 7 (2) − − 26 Personal 232 26 (35) − 6 229 Credit card 128 26 (27) − 3 130 Business and government 268 27 (21) − 1 275 Customers' liability under acceptances 29 4 − − − 33
678 90 (85) − 10 693 Other assets(2)(3) − − − − − −
Off-balance-sheet commitments(6) Letters of guarantee and documentary letters of credit 6 − − − − 6 Undrawn commitments 66 (1) − − − 65 Backstop liquidity and credit enhancement facilities 2 − − − − 2 74 (1) − − − 73 755 89 (85) − 10 769
(1) The contractual amount outstanding on financial assets that were written off during the quarter ended January 31, 2021 and that are still subject to enforcement activity was $29 million ($43 million for the quarter ended January 31, 2020).
(2) These financial assets are presented net of the allowances for credit losses on the Consolidated Balance Sheet. (3) As at January 31, 2021 and 2020, these financial assets were mainly classified in Stage 1 and their credit quality fell mostly within the Excellent category. (4) The allowances for credit losses are reported in the Accumulated other comprehensive income item of the Consolidated Balance Sheet. (5) The allowances for credit losses are reported in the Allowances for credit losses item of the Consolidated Balance Sheet. (6) The allowances for credit losses are reported in the Other liabilities item of the Consolidated Balance Sheet.

The following tables present the reconciliation of allowances for credit losses for each loan category at amortized cost according to ECL impairment stage. Quarter ended January 31, 2021 Quarter ended January 31, 2020
Allowances for credit losses on
non-impaired loans
Allowances for credit losses on impaired loans
Total
Allowances for credit losses on
non-impaired loans
Allowances for credit losses on impaired loans
Total
Stage 1 Stage 2 Stage 3 POCI(1) Stage 1 Stage 2 Stage 3 POCI(1)
Residential mortgage Balance at beginning 63 23 35 (56) 65 37 12 25 (53) 21
Originations or purchases 2 − − − 2 2 − − − 2 Transfers(2): to Stage 1 8 (4) (4) − − 4 (3) (1) − − to Stage 2 (1) 1 − − − (1) 1 − − − to Stage 3 − − − − − − (1) 1 − − Net remeasurement of loss allowances(3) (10) 9 2 6 7 (2) 4 3 1 6 Derecognitions(4) − (1) − − (1) − (1) − − (1) Changes to models − − − − − − − − − − Provisions for credit losses (1) 5 (2) 6 8 3 − 3 1 7 Write-offs − − (1) − (1) − − (2) − (2) Disposals − − − − − − − − − − Recoveries − − 1 − 1 − − − − − Foreign exchange movements and other (2) − (2) 2 (2) 1 − (1) − − Balance at end 60 28 31 (48) 71 41 12 25 (52) 26 Includes: Amounts drawn 60 28 31 (48) 71 41 12 25 (52) 26 Undrawn commitments(5) − − − − − − − − − −
Personal Balance at beginning 89 148 76 (10) 303 65 104 69 (4) 234
Originations or purchases 8 − − − 8 11 − − − 11 Transfers(2): to Stage 1 26 (23) (3) − − 23 (21) (2) − − to Stage 2 (3) 4 (1) − − (5) 6 (1) − − to Stage 3 − (8) 8 − − (2) (17) 19 − − Net remeasurement of loss allowances(3) (30) 23 9 4 6 (30) 35 18 (2) 21 Derecognitions(4) (3) (4) − − (7) (2) (3) (1) − (6) Changes to models − − − − − − − − − − Provisions for credit losses (2) (8) 13 4 7 (5) − 33 (2) 26 Write-offs − − (24) − (24) − − (35) − (35) Disposals (6) (1) − − (7) − − − − − Recoveries − − 5 − 5 − − 7 − 7 Foreign exchange movements and other (1) (1) (1) − (3) − − (1) − (1) Balance at end 80 138 69 (6) 281 60 104 73 (6) 231 Includes: Amounts drawn 78 135 69 (6) 276 59 103 73 (6) 229 Undrawn commitments(5) 2 3 − − 5 1 1 − − 2
(1) No POCI loan was acquired during the quarters ended January 31, 2021 and 2020. (2) Represent stage transfers deemed to have taken place at the beginning of the quarter in which the transfer occurred. (3) Includes the net remeasurement of loss allowances (after transfers) attributable mainly to changes in volumes and in the credit quality of existing loans as well as to changes in risk
parameters. (4) Represent reversals to loss allowances arising from full loan repayments (excluding write-offs and disposals). (5) The allowances for credit losses on undrawn commitments are reported in the Other liabilities item of the Consolidated Balance Sheet.

Quarter ended January 31, 2021 Quarter ended January 31, 2020
Allowances for credit losses on
non-impaired loans
Allowances for credit losses on impaired loans
Total
Allowances for credit losses on
non-impaired loans
Allowances for credit losses on impaired loans
Total Stage 1 Stage 2 Stage 3 POCI(1) Stage 1 Stage 2 Stage 3 POCI(1)
Credit card Balance at beginning 68 137 − − 205 47 113 − − 160
Originations or purchases 2 − − − 2 2 − − − 2 Transfers(2): to Stage 1 29 (29) − − − 25 (25) − − − to Stage 2 (3) 3 − − − (4) 4 − − − to Stage 3 − (7) 7 − − − (10) 10 − − Net remeasurement of loss allowances(3) (23) 30 3 − 10 (23) 33 14 − 24 Derecognitions(4) (1) − − − (1) (1) − − − (1) Changes to models − − − − − − − − − − Provisions for credit losses 4 (3) 10 − 11 (1) 2 24 − 25 Write-offs − − (15) − (15) − − (27) − (27) Disposals − − − − − − − − − − Recoveries − − 5 − 5 − − 3 − 3 Foreign exchange movements and other − − − − − − − − − − Balance at end 72 134 − − 206 46 115 − − 161 Includes: Amounts drawn 48 123 − − 171 26 104 − − 130 Undrawn commitments(5) 24 11 − − 35 20 11 − − 31
Business and government(6) Balance at beginning 214 287 241 − 742 83 105 141 − 329
Originations or purchases 29 − − − 29 7 − − − 7 Transfers(2): to Stage 1 6 (5) (1) − − 4 (2) (2) − − to Stage 2 (24) 25 (1) − − (1) 3 (2) − − to Stage 3 − (5) 5 − − − (9) 9 − − Net remeasurement of loss allowances(3) (10) 6 44 − 40 (2) 14 20 − 32 Derecognitions(4) (6) (5) (3) − (14) (3) (2) (3) − (8) Changes to models − − − − − − − − − − Provisions for credit losses (5) 16 44 − 55 5 4 22 − 31 Write-offs − − (27) − (27) − − (21) − (21) Disposals − − − − − − − − − − Recoveries − − 1 − 1 − − 1 − 1 Foreign exchange movements and other − (1) (2) − (3) − − − − − Balance at end 209 302 257 − 768 88 109 143 − 340 Includes: Amounts drawn 130 244 257 − 631 62 103 143 − 308 Undrawn commitments(5) 79 58 − − 137 26 6 − − 32
Total allowances for credit losses at end(7) 421 602 357 (54) 1,326 235 340 241 (58) 758 Includes: Amounts drawn 316 530 357 (54) 1,149 188 322 241 (58) 693 Undrawn commitments(5) 105 72 − − 177 47 18 − − 65
(1) No POCI loan was acquired during the quarters ended January 31, 2021 and 2020. (2) Represent stage transfers deemed to have taken place at the beginning of the quarter in which the transfer occurred. (3) Includes the net remeasurement of loss allowances (after transfers) attributable mainly to changes in volumes and in the credit quality of existing loans as well as to changes in risk
parameters. (4) Represent reversals to loss allowances arising from full loan repayments (excluding write-offs and disposals). (5) The allowances for credit losses on undrawn commitments are reported in the Other liabilities item of the Consolidated Balance Sheet. (6) Includes customers’ liability under acceptances. (7) Excludes allowances for credit losses on other financial assets at amortized cost and on off-balance-sheet commitments other than undrawn commitments.

The following tables show the main macroeconomic factors used to estimate the allowances for credit losses on loans. For each scenario, namely, the base scenario, upside scenario and downside scenario, the average values of the factors over the next 12 months (used for Stage 1 credit loss calculations) and over the remaining forecast period (used for Stage 2 credit loss calculations) are presented. As at January 31, 2021
Base scenario Upside scenario Downside scenario
Next
12 months Remaining
forecast period Next
12 months Remaining
forecast period Next
12 months Remaining
forecast period
Macroeconomic factors(1) GDP growth(2) 3.9 % 2.5 % 4.4 % 2.8 % (5.2) % 3.9 % Unemployment rate 8.3 % 7.1 % 8.0 % 6.6 % 10.9 % 9.1 % Housing price index growth(2) 4.0 % 2.3 % 6.0 % 3.9 % (11.5) % 1.2 % BBB spread(3) 1.8 % 1.8 % 1.7 % 1.7 % 3.1 % 2.1 % S&P/TSX growth(2)(4) 10.8 % 3.0 % 13.1 % 4.1 % (17.0) % 5.5 % WTI oil price(5) (US$ per barrel) 47 54 51 64 27 34
As at October 31, 2020
Base scenario Upside scenario Downside scenario
Next
12 months Remaining
forecast period Next
12 months Remaining
forecast period Next
12 months Remaining
forecast period
Macroeconomic factors(1) GDP growth(2) 3.0 % 2.6 % 3.7 % 2.8 % 0.4 % 2.7 % Unemployment rate 8.9 % 8.0 % 8.4 % 7.3 % 10.4 % 9.8 % Housing price index growth(2) (5.2) % 2.4 % (1.5) % 2.9 % (9.9) % (0.1) % BBB spread(3) 2.0 % 1.9 % 1.8 % 1.8 % 2.9 % 2.4 % S&P/TSX growth(2)(4) (1.1) % 3.3 % 6.9 % 3.2 % (15.6) % 5.1 % WTI oil price(5) (US$ per barrel) 41 54 51 64 26 32
(1) All macroeconomic factors are based on the Canadian economy unless otherwise indicated. (2) Growth rate is annualized. (3) Yield on corporate BBB bonds less yield on Canadian federal government bonds with 10-year maturity. (4) Main stock index in Canada. (5) The West Texas Intermediate (WTI) index is commonly used as a benchmark for the price of oil.
The main macroeconomic factors used for the personal credit portfolio are unemployment rate and growth in the housing price index, based on the economy of Canada or Quebec. The main macroeconomic factors used for the business and government credit portfolio are unemployment rate, BBB spread, S&P/TSX growth, and WTI oil price. An increase in unemployment rate or spread on corporate BBB bonds will generally correlate with higher allowances for credit losses, whereas an increase in the other macroeconomic factors (GDP, S&P/TSX, housing price index and WTI oil price) will generally correlate with lower allowances for credit losses.

Macroeconomic factors changed during the quarter ended January 31, 2021. In the base scenario, the Canadian economy will continue to recover as the introduction of several COVID-19 vaccines on the market make it possible to gradually relax the public health measures. Nonetheless, the unemployment rate will be 7.9% at the end of 2021, which is still significantly above the pre-recession level (5.7%). Housing prices will rise more slowly at an annual rate of 4%. The S&P/TSX will end 2021 at 18,500 points and the price of oil at US$50. In the upside scenario, the economy will rebound more strongly due to quick and effective vaccination campaigns. Very accommodative fiscal and monetary stimulus measures will make it possible to limit the damage arising from destroyed production capacity. The unemployment rate of 7.4% at year-end 2021 will be more favourable than in the base scenario. Housing prices will increase by 6%, the S&P/TSX will end 2021 at 18,900 points and the price of oil at US$55. According to the downside scenario, a rise in the number of COVID-19 cases and delays in the rollout of vaccines will cause increased stress in the financial markets. This will cause the economy to falter and to slip into recession again. Unemployment will trend upward again, reaching 11.7% at the end of 2021. Housing prices will decrease considerably. The S&P/TSX will end 2021 at 13,900 points and the price of oil at US$24. Given uncertainty surrounding these key inputs used to measure credit losses, the Bank has applied expert credit judgment to adjust the modelled ECL results.
Scenarios The following table shows a comparison of the Bank's allowances for credit losses on non-impaired loans (Stages 1 and 2) as at January 31, 2021 based on the probability weightings of three scenarios with allowances for credit losses resulting from simulations of each scenario weighted at 100%.
Allowances for credit losses
on non-impaired loans
Balance as at January 31, 2021 1,023 Simulations 100% upside scenario 897 100% base scenario 927 100% downside scenario 1,223

In the normal course of its business, the Bank enters into transactions in which it transfers financial assets such as securities or loans directly to third parties, in particular structured entities. According to the terms of some of those transactions, the Bank retains substantially all of the risks and rewards related to those financial assets. The risks include credit risk, interest rate risk, foreign exchange risk, prepayment risk and other price risks, whereas the rewards include income streams associated with the financial assets. As such, those financial assets are not derecognized and the transactions are treated as collateralized or secured borrowings. For additional information on the nature of those transactions, see Note 8 to the audited annual consolidated financial statements for the year ended October 31, 2020. The following table provides additional information about the nature of the transferred financial assets that do not qualify for derecognition and the associated liabilities. As at January 31, 2021 As at October 31, 2020
Carrying value of financial assets transferred but not derecognized Securities(1) 71,764 61,599
Residential mortgages 20,818 20,731
92,582 82,330
Carrying value of associated liabilities(2) 47,617 45,781
Fair value of financial assets transferred but not derecognized Securities(1) 71,764 61,599 Residential mortgages 21,261 21,252
93,025 82,851 Fair value of associated liabilities(2) 47,947 46,120
(1) The amount related to the securities loaned is the maximum amount of Bank securities that can be lent. For the obligations related to securities sold under repurchase agreements, the amount includes the Bank’s own financial assets as well as those of third parties and excludes bearer deposit notes issued by the Bank and covered bonds issued by the Bank.
(2) Associated liabilities include liabilities related to transferred receivables and obligations related to securities sold under repurchase agreements before the offsetting impact of $4,153 million as at January 31, 2021 ($959 million as at October 31, 2020) excluding repurchase agreements guaranteed by bearer deposit notes issued by the Bank and covered bonds issued by the Bank. Liabilities related to securities loaned are not included, as the Bank can lend its own financial assets and those of third parties. The carrying value and fair value of liabilities related to securities loaned were $4,923 million as at January 31, 2021 ($6,327 million as at October 31, 2020).
The following table specifies the nature of the transactions related to financial assets transferred but not derecognized. As at January 31, 2021 As at October 31, 2020
Carrying value of financial assets transferred but not derecognized Securities backed by insured residential mortgage loans and other securities sold to Canada Housing Trust 22,093 21,211 Securities sold under repurchase agreements 26,755 25,442
Securities loaned 43,734 35,677
92,582 82,330

As at January 31, 2021 As at October 31, 2020
Receivables, prepaid expenses and other items 1,040 946 Interest and dividends receivable 602 567 Due from clients, dealers and brokers 1,008 586 Defined benefit asset 287 126 Deferred tax assets 588 643 Current tax assets 318 360 Reinsurance assets 30 30 Insurance assets 11 8 3,884 3,266
As at January 31, 2021 As at October 31, 2020
On demand(1) After notice(2) Fixed term(3) Total Total
Personal 5,868 33,668 29,023 68,559 67,499 Business and government 54,184 28,305 71,456 153,945 143,787 Deposit-taking institutions 1,939 691 2,543 5,173 4,592 61,991 62,664 103,022 227,677 215,878
(1) Demand deposits are deposits for which the Bank does not have the right to require notice of withdrawal and consist essentially of deposits in chequing accounts. (2) Notice deposits are deposits for which the Bank may legally require notice of withdrawal and consist mainly of deposits in savings accounts. (3) Fixed-term deposits are deposits that can be withdrawn by the holder on a specified date and include term deposits, guaranteed investment certificates, savings accounts and plans,
covered bonds and similar instruments.
The Deposits – Business and government item includes, among other items, covered bonds, the balance of which was $9.7 billion as at January 31, 2021 ($10.1 billion as at October 31, 2020). During the quarter ended January 31, 2021, an amount of US$270 million of covered bonds came to maturity (no transaction during the quarter ended January 31, 2020). For additional information on covered bonds, see Note 27 to the audited annual consolidated financial statements for the year ended October 31, 2020. In addition, as at January 31, 2021, the Deposits – Business and government item also includes deposits of $9.7 billion ($8.4 billion as at October 31, 2020) that are subject to the bank bail-in conversion regulations issued by the Government of Canada. These regulations provide certain powers to the Canada Deposit Insurance Corporation (CDIC), notably the power to convert certain eligible Bank shares and liabilities into common shares should the Bank become non-viable.
As at January 31, 2021 As at October 31, 2020
Accounts payable and accrued expenses 1,640 1,993 Subsidiaries’ debts to third parties 468 386 Interest and dividends payable 551 621 Lease liabilities 608 628 Due to clients, dealers and brokers 626 652 Defined benefit liability 156 201 Allowances for credit losses – off-balance-sheet commitments (Note 7) 196 176 Deferred tax liabilities 19 − Current tax liabilities 131 121 Insurance liabilities 6 − Other items(1)(2)(3) 759 940 5,160 5,718
(1) As at January 31, 2021, Other items included an $8 million litigation provision ($7 million as at October 31, 2020). (2) As at January 31, 2021, Other items included $33 million provisions for onerous contracts ($33 million as at October 31, 2020). (3) As at October 31, 2020, Other items included the financial liability resulting from put options written to non-controlling interests of Credigy Ltd. who exercised their options on
December 15, 2020. For more information, see Note 18 to these consolidated financial statements.

As at January 31, 2021 As at October 31, 2020
Number of shares or LRCN
Shares or LRCN $
Number of shares or LRCN
Shares or LRCN $
First Preferred Shares
Series 30 14,000,000 350 14,000,000 350 Series 32 12,000,000 300 12,000,000 300 Series 34 16,000,000 400 16,000,000 400 Series 36 16,000,000 400 16,000,000 400 Series 38 16,000,000 400 16,000,000 400 Series 40 12,000,000 300 12,000,000 300 Series 42 12,000,000 300 12,000,000 300 98,000,000 2,450 98,000,000 2,450 Other equity instruments
Limited Recourse Capital Notes (LRCN) – Series 1 500,000 500 500,000 500 Preferred shares and other equity instruments 98,500,000 2,950 98,500,000 2,950
Common shares at beginning of fiscal year 335,997,660 3,057 334,172,411 2,949 Issued pursuant to the Stock Option Plan 802,093 39 2,318,926 111 Repurchases of common shares for cancellation − − (525,000) (5) Impact of shares purchased or sold for trading(1) (29,442) (2) 31,323 2 Common shares at end of period 336,770,311 3,094 335,997,660 3,057
(1) As at January 31, 2021, a total of 1,965 shares were held for trading, representing a negligible amount (27,477 shares were sold short for trading representing $2 million as at October 31, 2020).
Quarter ended January 31
2021 2020
Dividends or interest $
Dividends per share
Dividends $
Dividends per share
First Preferred Shares Series 30 3 0.2516 3 0.2516 Series 32 3 0.2399 3 0.2438 Series 34 6 0.3500 6 0.3500 Series 36 5 0.3375 5 0.3375 Series 38 5 0.2781 5 0.2781 Series 40 3 0.2875 3 0.2875 Series 42 4 0.3094 4 0.3094 29 29
Other equity instruments LRCN – Series 1(1) 5 34 29
Common shares 239 0.7100 238 0.7100 273 267 (1) The LRCN – Series 1 bear interest at a fixed rate of 4.3% per annum.
Reserved Common Shares As at January 31, 2021, there were 15,507,568 common shares reserved under the Dividend Reinvestment and Share Purchase Plan (15,507,568 as at October 31, 2020). As at January 31, 2021, there were 16,563,612 common shares (17,365,705 as at October 31, 2020) reserved under the Stock Option Plan. Common Shares Held in Escrow
As part of the acquisition of Wellington West Holdings Inc. in 2011, the Bank had issued common shares held in escrow. As at January 31, 2021, the number of common shares held in escrow was 21,510 (21,510 as at October 31, 2020). The Bank expects that the remaining shares in escrow will be settled by the end of calendar year 2021.

The Bank and all other major Canadian banks have to maintain minimum capital ratios established by OSFI: a CET1 capital ratio of at least 9.0%, a Tier 1 capital ratio of at least 10.5%, and a Total capital ratio of at least 12.5%. All of these ratios are to include a capital conservation buffer of 2.5% established by the Basel Committee on Banking Supervision and OSFI as well as a 1.0% surcharge applicable solely to Domestic Systemically Important Banks (D-SIBs), and a 1.0% domestic stability buffer. The domestic stability buffer, which can vary from 0% to 2.5% of risk-weighted assets, consists exclusively of CET1 capital. A D-SIB that fails to meet this buffer requirement will not be subject to automatic constraints to reduce capital distributions but will have to provide a remediation plan to OSFI. On December 8, 2020, OSFI confirmed that the buffer is maintained at 1.0%. The banks also have to meet the capital floor that sets the regulatory capital level according to the Basel II standardized approach. If the capital requirement under Basel III is less than 70% of the capital requirements as calculated under Basel II, the difference is added to risk-weighted assets. OSFI requires Canadian banks to meet a Basel III leverage ratio of at least 3.0%.
During the quarter ended January 31, 2021, the Bank was in compliance with all of OSFI’s regulatory capital requirements.
As at January 31, 2021 As at October 31, 2020
Adjusted(1) Adjusted(1)
Capital CET1 11,392 11,563 10,924 11,167 Tier 1 14,341 14,512 13,869 14,112 Total 15,589 15,589 15,167 15,167
Risk-weighted assets 97,183 97,183 94,808 94,808
Total exposure 334,013 334,013 321,038 321,038
Capital ratios CET1 11.7 % 11.9 % 11.5 % 11.8 % Tier 1 14.8 % 14.9 % 14.6 % 14.9 % Total 16.0 % 16.0 % 16.0 % 16.0 %
Leverage ratio 4.3 % 4.3 % 4.3 % 4.4 %
(1) The adjusted Basel III regulatory capital and ratios do not include the transitional measure applicable to expected credit loss provisioning. For additional information, see the section entitled COVID-19 Pandemic – Key Measures Introduced by the Regulatory Authorities on pages 20 and 21 of the 2020 Annual Report.

Stock Option Plan During the quarter ended January 31, 2021, the Bank awarded 2,043,196 stock options (1,789,280 stock options during the quarter ended January 31, 2020) with an average fair value of $8.24 per option ($5.11 in 2020). As at January 31, 2021, there were 12,623,271 stock options outstanding (11,425,403 stock options as at October 31, 2020). The average fair value of the options awarded was estimated on the award date using the Black-Scholes model as well as the following assumptions. Quarter ended January 31
2021 2020 Risk-free interest rate 1.02% 1.94% Expected life of options 7 years 7 years Expected volatility 22.59% 14.97% Expected dividend yield 4.24% 4.29%
During the quarter ended January 31, 2021, a $3 million compensation expense was recorded for this plan ($2 million for the quarter ended January 31, 2020).
The Bank offers defined benefit pension plans and other post-employment benefit plans to eligible employees. The cost associated with these plans, including the remeasurements recognized in Other comprehensive income, is presented in the following table.
Quarter ended January 31
Pension plans Other post-employment benefit plans 2021 2020 2021 2020
Current service cost 36 32 − − Interest expense (income), net − 2 1 1 Administrative expenses 1 1 Expense recognized in Net income 37 35 1 1 Remeasurements(1) Actuarial (gains) losses on defined benefit obligation (40) 290 (1) 8 Return on plan assets(2) (138) (213) Remeasurements recognized in Other comprehensive income (178) 77 (1) 8
(141) 112 − 9
(1) Changes related to the discount rate and to the return on plan assets are reviewed and updated on a quarterly basis. All other assumptions are updated annually. (2) Excludes interest income.

Diluted earnings per share is calculated by dividing net income attributable to common shareholders by the weighted average number of common shares outstanding after taking into account the dilution effect of stock options using the treasury stock method and any gain (loss) on the redemption of preferred shares. Quarter ended January 31
2021 2020
Basic earnings per share Net income attributable to the Bank’s shareholders and holders of other equity instruments 761 594 Dividends on preferred shares and distributions on LRCNs 33 29 Net income attributable to common shareholders 728 565 Weighted average basic number of common shares outstanding (thousands) 336,408 335,020 Basic earnings per share (dollars) 2.16 1.69 Diluted earnings per share Net income attributable to common shareholders 728 565 Weighted average basic number of common shares outstanding (thousands) 336,408 335,020 Adjustment to average number of common shares (thousands) Stock options(1) 2,209 3,091 Weighted average diluted number of common shares outstanding (thousands) 338,617 338,111 Diluted earnings per share (dollars) 2.15 1.67
(1) For the quarter ended January 31, 2021, the calculation of diluted earnings per share excluded an average number of 1,752,270 options outstanding with a weighted average exercise price of $71.86 (1,050,230 options outstanding with a weighted average exercise price of $71.86 for the quarter ended January 31, 2020), as the exercise price of these options was greater than the average price of the Bank’s common shares.

The Bank carries out its activities in four business segments, which are defined below. For presentation purposes, other activities are grouped in the Other heading. Each reportable segment is distinguished by services offered, type of clientele, and marketing strategy. Personal and Commercial The Personal and Commercial segment encompasses the banking, financing and investing services offered to individuals, advisors and businesses as well as insurance operations. Wealth Management The Wealth Management segment comprises investment solutions, trust services, banking services, lending services and other wealth management solutions offered through internal and third-party distribution networks. Financial Markets The Financial Markets segment encompasses corporate banking and investment banking and financial solutions for large and mid-size corporations, public sector organizations, and institutional investors. U.S. Specialty Finance and International (USSF&I) The USSF&I segment encompasses the specialty finance expertise provided by the Credigy subsidiary; the activities of the ABA Bank subsidiary, which offers financial products and services to individuals and businesses in Cambodia; and the activities of targeted investments in certain emerging markets. Other This heading encompasses treasury activities, liquidity management, Bank funding, asset/liability management activities, certain specified items and the unallocated portion of corporate units. Quarter ended January 31(1)
Personal and Commercial
Wealth Management
Financial Markets USSF&I Other Total
2021 2020 2021 2020 2021 2020 2021 2020 2021 2020 2021 2020 Net interest income(2) 638 611 110 119 327 120 219 181 (87) (101) 1,207 930 Non-interest income(2) 264 268 409 347 250 338 55 14 39 26 1,017 993 Total revenues 902 879 519 466 577 458 274 195 (48) (75) 2,224 1,923 Non-interest expenses(3) 490 479 303 285 228 200 83 78 76 49 1,180 1,091 Income before provisions for credit losses and income taxes 412 400 216 181 349 258 191 117 (124) (124) 1,044 832 Provisions for credit losses 56 70 (2) − 9 9 18 10 − − 81 89
Income before income taxes (recovery) 356 330 218 181 340 249 173 107 (124) (124) 963 743 Income taxes (recovery)(2) 94 88 58 48 90 66 37 22 (77) (91) 202 133
Net income 262 242 160 133 250 183 136 85 (47) (33) 761 610 Non-controlling interests − − − − − − − 9 − 7 − 16 Net income attributable
to the Bank’s shareholders and holders of other equity instruments 262 242 160 133 250 183 136 76 (47) (40) 761 594
Average assets 121,877 115,946 6,537 5,943 151,197 121,612 15,545 12,494 62,957 45,516 358,113 301,511
(1) For the quarter ended January 31, 2020, certain amounts have been reclassified. (2) The Net interest income, Non-interest income and Income taxes (recovery) items of the business segments are presented on a taxable equivalent basis. Taxable equivalent basis is a
calculation method that consists of grossing up certain tax-exempt income by the amount of income tax that would have been otherwise payable. For the business segments as a whole, Net interest income was grossed up by $54 million ($57 million in 2020), Non-interest income was grossed up by $3 million ($30 million in 2020), and an equivalent amount was recognized in Income taxes (recovery). The effect of these adjustments is reversed under the Other heading.
(3) For the quarter ended January 31, 2020, the Non-interest expenses presented in the Other heading of segment results included a $13 million charge related to the company Maple Financial Group Inc. (Maple) following the event in December 2019, as described in the Contingent Liabilities section on page 111 of the Bank’s 2020 Annual Report.
On December 15, 2020, the Bank acquired the entire remaining non-controlling interest in the Credigy Ltd. subsidiary following the decision of the non-controlling shareholders to exercise their put options for an amount of $300 million according to an agreement reached in 2013. Following this transaction, Credigy Ltd. became a wholly owned subsidiary of the Bank.

Investor Relations Financial analysts and investors who want to obtain financial information on the Bank may contact the Investor Relations Department.
600 De La Gauchetière Street West, 7th Floor Montreal, Quebec H3B 4L2 Toll-free: 1-866-517-5455 Email: [email protected] Website: nbc.ca/investorrelations Communications and Corporate Social Responsibility 600 De La Gauchetière Street West, 18th Floor Montreal, Quebec H3B 4L2 Telephone: 514-394-8644 Email: [email protected] Quarterly Report Publication Dates for Fiscal 2021 (subject to approval by the Board of Directors of the Bank)
First quarter February 24 Second quarter May 28 Third quarter August 25 Fourth quarter December 1
Conference Call — A conference call for analysts and institutional investors will be held
on Wednesday, February 24, 2021 at 1:00 p.m. EST. — Access by telephone in listen-only mode: 1-800-898-3989 or
416-406-0743. The access code is 1995846#. — A recording of the conference call can be heard until March 24, 2021
by dialing 1-800-408-3053 or 905-694-9451. The access code is 1381684#.
Webcast — The conference call will be webcast live at nbc.ca/investorrelations. — A recording of the webcast will also be available on National Bank’s
website after the call. Financial Documents — The Report to Shareholders (which includes the quarterly consolidated
financial statements) is available at all times on National Bank’s website at nbc.ca/investorrelations.
— The Report to Shareholders, the Supplementary Financial Information, the Supplementary Regulatory Capital and Pillar 3 Disclosure, and a slide presentation will be available on the Investor Relations page of National Bank’s website on the morning of the day of the conference call.
Transfer Agent and Registrar For information about stock transfers, address changes, dividends, lost certificates, tax forms, and estate transfers, shareholders of record may contact the transfer agent, Computershare Trust Company of Canada, at the address or telephone number below. Computershare Trust Company of Canada Share Ownership Management 100 University Avenue, 8th Floor Toronto, Ontario M5J 2Y1 Telephone: 1-888-838-1407 Fax: 1-888-453-0330 Email: [email protected] Website: computershare.com Shareholders whose shares are held by a market intermediary are asked to contact the market intermediary concerned. Direct Deposit Service for Dividends Shareholders may elect to have their dividend payments deposited directly via electronic funds transfer to their bank account at any financial institution that is a member of the Canadian Payments Association. To do so, they must send a written request to the transfer agent, Computershare Trust Company of Canada. Dividend Reinvestment and Share Purchase Plan National Bank has a Dividend Reinvestment and Share Purchase Plan for Canadian holders of its common and preferred shares under which they can acquire common shares of the Bank without paying commissions or administration fees. Canadian participants acquire common shares through the reinvestment of cash dividends paid on the shares they hold or through optional cash payments of at least $1 per payment, up to a maximum of $5,000 per quarter.
For additional information, shareholders may contact National Bank’s registrar and transfer agent, Computershare Trust Company of Canada, at 1-888-838-1407. To participate in the plan, National Bank’s beneficial or non-registered common shareholders must contact their financial institution or broker. Dividends Dividends paid are “eligible dividends” in accordance with the Income Tax Act (Canada).