Embed Size (px)
Citation preview
1
Banks, Public Finances and
the Financial Crisis
Robert Kollmann, ECARES, ULB & CEPR
Werner Roeger, DG-ECFIN, EU Commission
Marco Ratto, JRC, EU Commission
Jan in’t Veld, DG-ECFIN, EU Commission
2
Analysis of endogenous risk
due to interaction between
health of banks & health of public finances
Estimated DSGE model of Euro Area
3
Recent financial crisis:
highlights close links between health of
banking system and health of public finances
Crisis originated in loan losses on US sub-
prime mortgages;
spread rapidly to Euro Area (EA) and other
parts of world:
worst global recession since 1930s
4
Countered by:
● massive government support for banks
● fiscal stimulus
Provided relief to banks & real economy
But: sharp rise in public debt (+20 ppt in EA)
undermines sustainability of public finances
Sovereign default: would destabilize real
economy & banks
Pyrrhic victory ?

5
Contribution of this paper:
quantitative analysis of interaction between
banking system and public finances
● Effect of banking shocks on real economy
and public finances
● Effect of government support for banks on
real economy
● Effect of sovereign default on banks and
real economy
6
Based on estimated New Keynesian model of
Euro Area with
● banks: take deposits, make loans
face bank capital requirement;
Losses (default) on loans & sovereign debt
● Rich fiscal set-up:
government spending,
distorting taxes, sovereign debt
● Estimation uses detailed macro, banking
and fiscal data for EA (1995-2011)

7
THE KEY MECHANISM
BANK CAPITAL: KEY STATE VARIABLE
FOR INTEREST RATES AND REAL ACTIVITY
BANK CAPITAL CHANNEL:
LOAN LOSS BK CAP
LENDING RATE SPREAD
LENDING Investment , GDP
8
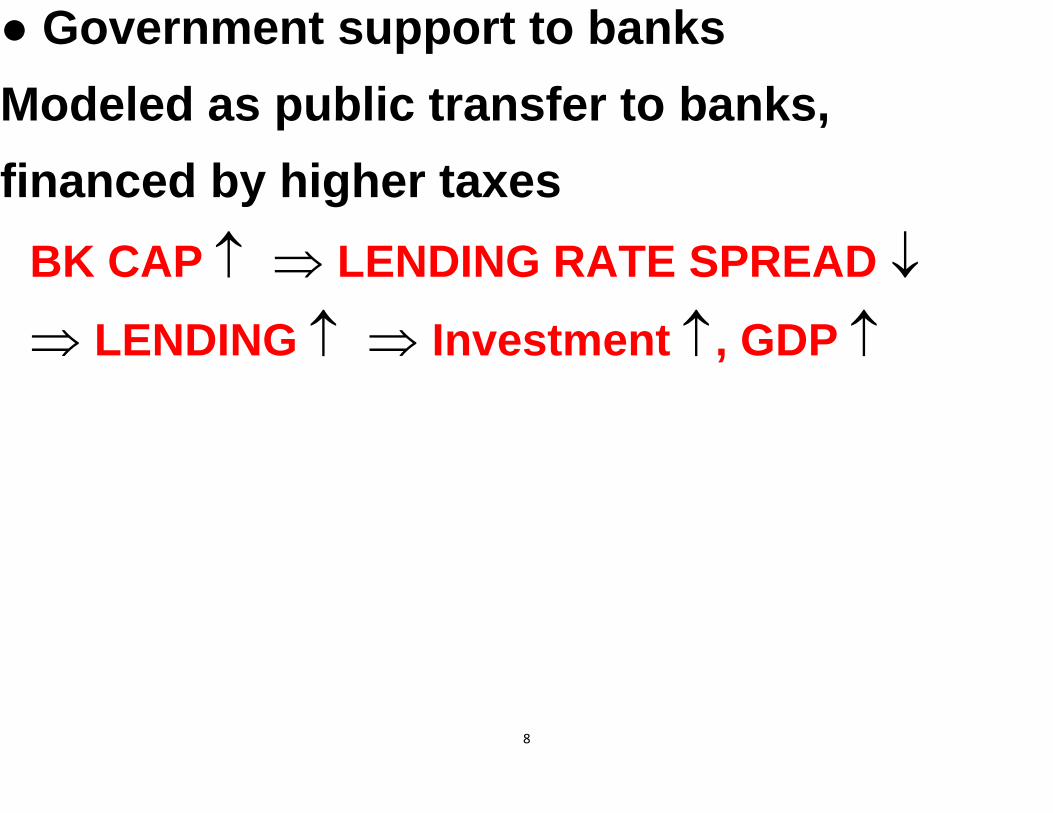
● Government support to banks
Modeled as public transfer to banks,
financed by higher taxes
BK CAP LENDING RATE SPREAD
LENDING Investment , GDP
9
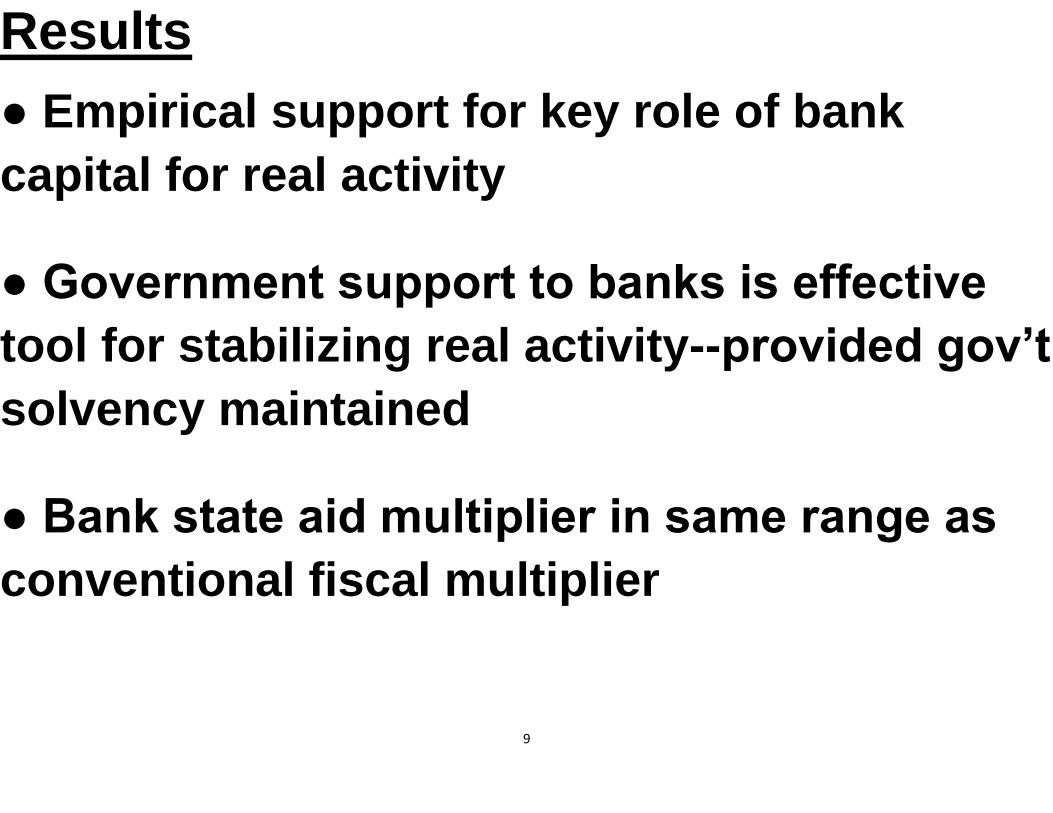
Results
● Empirical support for key role of bank
capital for real activity
● Government support to banks is effective
tool for stabilizing real activity--provided gov’t
solvency maintained
● Bank state aid multiplier in same range as
conventional fiscal multiplier
10
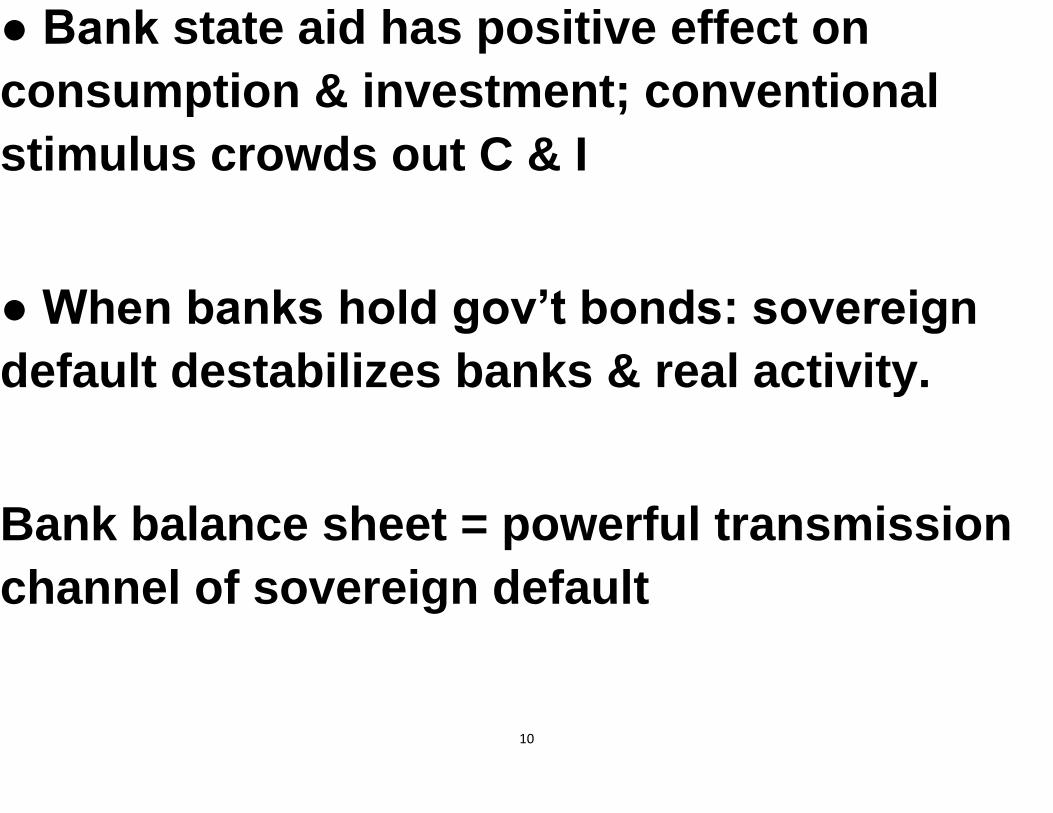
● Bank state aid has positive effect on
consumption & investment; conventional
stimulus crowds out C & I
● When banks hold gov’t bonds: sovereign
default destabilizes banks & real activity.
Bank balance sheet = powerful transmission
channel of sovereign default

11
EMPIRICAL ANALYSIS OF CRISIS in EA
● Bank asset losses: explain
1/4 of fall in EA GDP & C
3/4 of fall in EA investment, in 2007-9
● Bank state aid off-set effect of loan losses
on GDP in 2009
● Bank state aid & fiscal stimulus explain 1/2
of rise in public debt/GDP
12
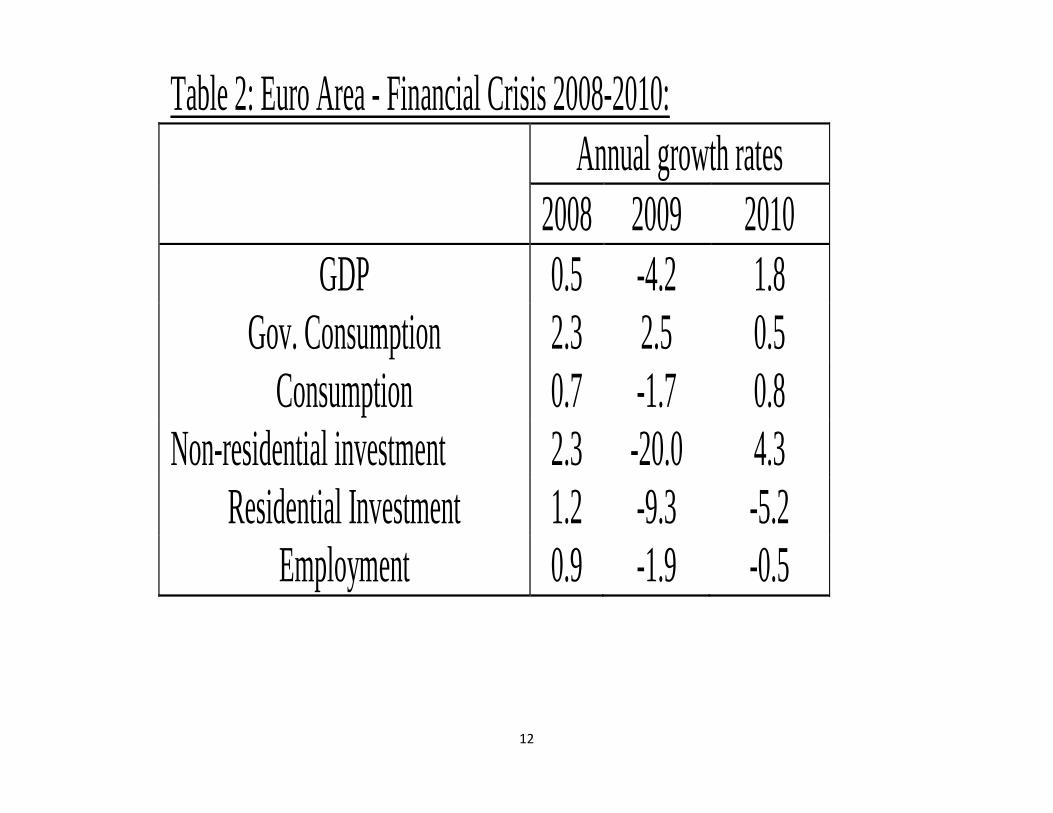
Table 2: Euro Area - Financial Crisis 2008-2010:
Annual growth rates
2008 2009 2010
GDP 0.5 -4.2 1.8
Gov. Consumption 2.3 2.5 0.5
Consumption 0.7 -1.7 0.8
Non-residential investment 2.3 -20.0 4.3
Residential Investment 1.2 -9.3 -5.2
Employment 0.9 -1.9 -0.5
13
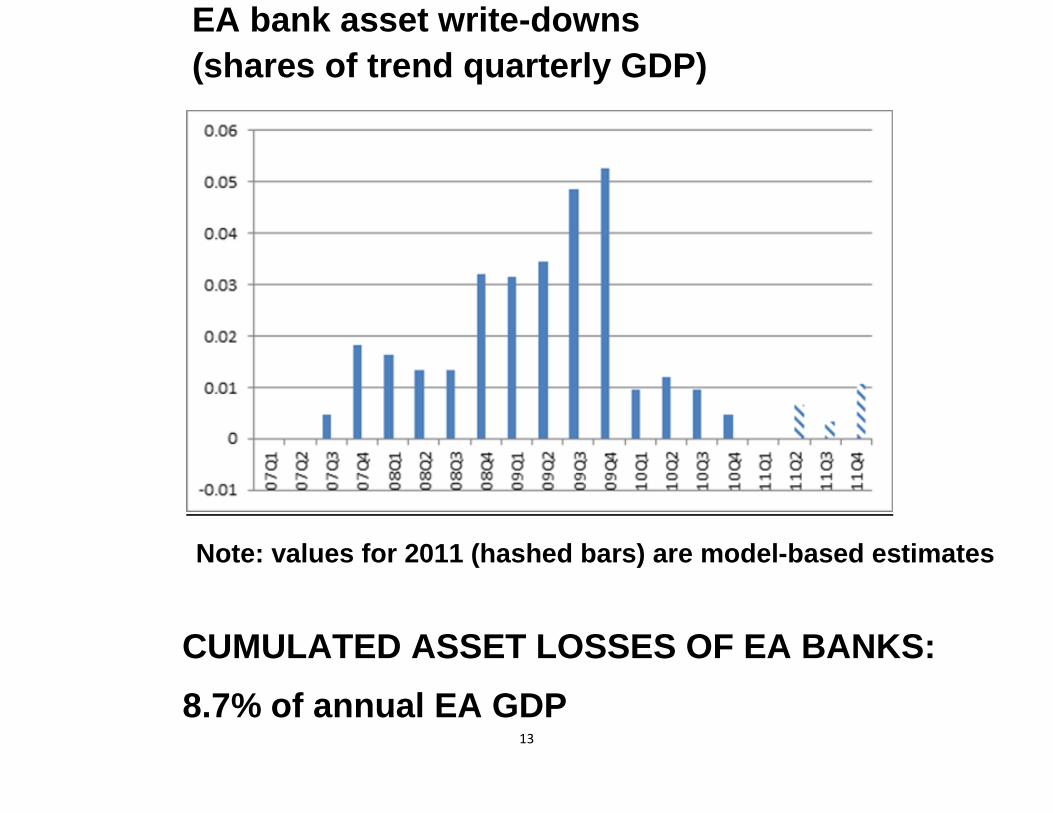
EA bank asset write-downs
(shares of trend quarterly GDP)
Note: values for 2011 (hashed bars) are model-based estimates
CUMULATED ASSET LOSSES OF EA BANKS:
8.7% of annual EA GDP
14
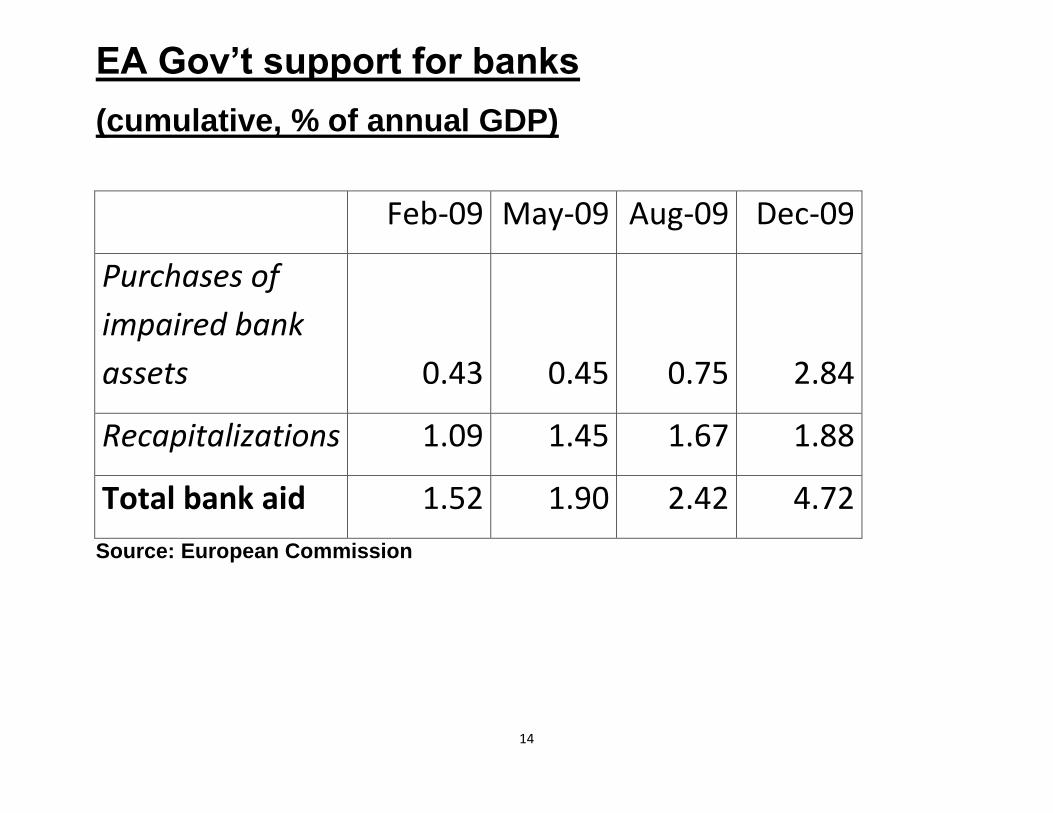
EA Gov’t support for banks
(cumulative, % of annual GDP)
Feb-09 May-09 Aug-09 Dec-09
Purchases of
impaired bank
assets 0.43 0.45 0.75 2.84
Recapitalizations 1.09 1.45 1.67 1.88
Total bank aid 1.52 1.90 2.42 4.72
Source: European Commission
15
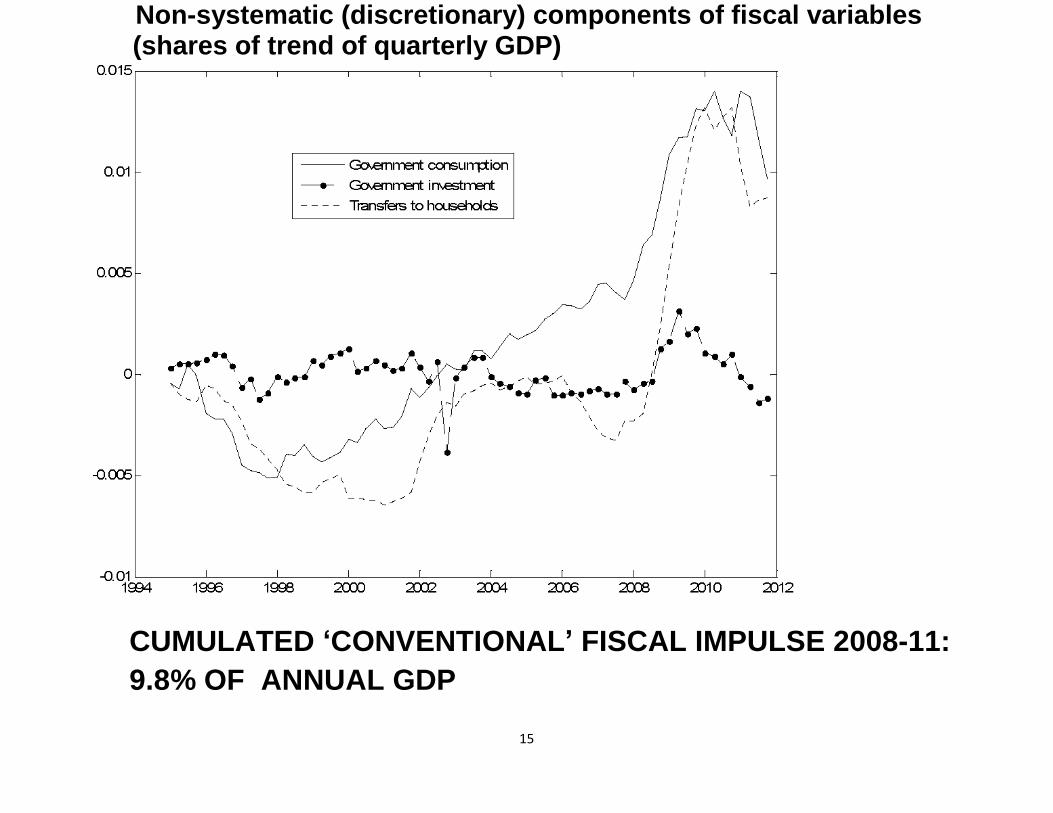
Non-systematic (discretionary) components of fiscal variables (shares of trend of quarterly GDP)
CUMULATED ‘CONVENTIONAL’ FISCAL IMPULSE 2008-11:
9.8% OF ANNUAL GDP

16
Debt to GDP ratio (demeaned)

17
RELATED LITERATURE
Before crisis: standard quantitative macro
models abstracted from financial
intermediaries
► Since crisis: much works that builds banks
into DSGE models Gerali, Neri, Sessa & Signoretti (2010); de Walque, Pierrard & Rouabah (2010);
Curdia & Woodford (2010); Meh & Moran (2010); Brunnermeier & Sannikov (2010),
Kollmann, Enders & Mueller (2011), Ratto, Roeger & in’t Veld (2011); Dewachter & Wouters (2012) etc.
Mostly abstract from government; no analysis
of gov’t support for banks; sovereign default
18
This paper also offers novel specification of
banking sector:
● previous models assume that banks only
accumulate capital through retained earnings;
focus on lending to firms.
● our model: banks can issue equity, make
mortgage loans to HOUSEHOLDS
We show that loan losses have persistent
negative effect on real activity, even when
banks can issue equity & lend to households
19
► Paper also related to:
assessments of fiscal stimulus during crisis E.g. Coenen et al. (AEJ-Macro, 2012)
That literature abstracts from banks
► Model here is estimated
Related banking/fiscal macro literatures
mainly rely on calibrated models

20
The Model
Open economy with two workers (patient
and impatient), entrepreneur & government
● Workers provide labor services, own house
►Patient worker holds: bank deposits and
government debt
►Impatient worker borrows from the bank,
using her housing capital as collateral.

21
● Entrepreneur owns corporate sector:
►Bank
►Goods producing & distribution firms
● Bank: intermediary between patient &
impatient worker
holds government bonds and foreign bonds
Bank capital constraint—a fraction of her
assets has to be financed using bank capital
22
Consider open economy to capture external
asset losses: ≈50% of EA bank losses in
crisis were external
Related literature: models with patient savers
& impatient borrowers,
BUT direct lending (no bank)
Iacoviello (2005), Iacoviello & Neri (2010)
23
Goods production & distribution
(standard New Keynesian specification)
►Differentiated intermediate goods produced
from K & L; monopolistic competition, price
stickiness
►Final good = aggregate of differentiated
intermediates, used for private and public
consumption and investment, exports
24
● Government
Spends:
goods & services
transfers to household
bank support
Distorting taxes (on consumption, labor
income, profits)
Issues debt
25
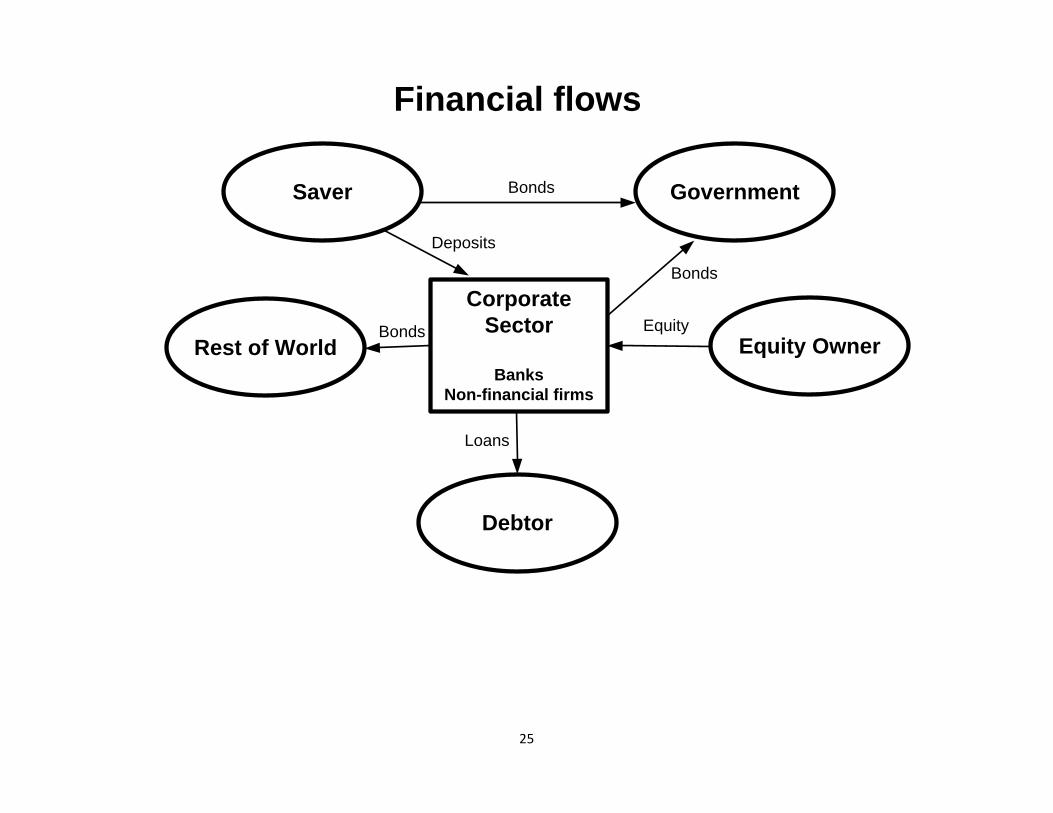
Financial flows
Saver
Debtor
Corporate
Sector
Banks
Non-financial firms
Equity Owner
Bonds
Deposits
Loans
Equity
Government
Rest of World
Bonds
Bonds
26
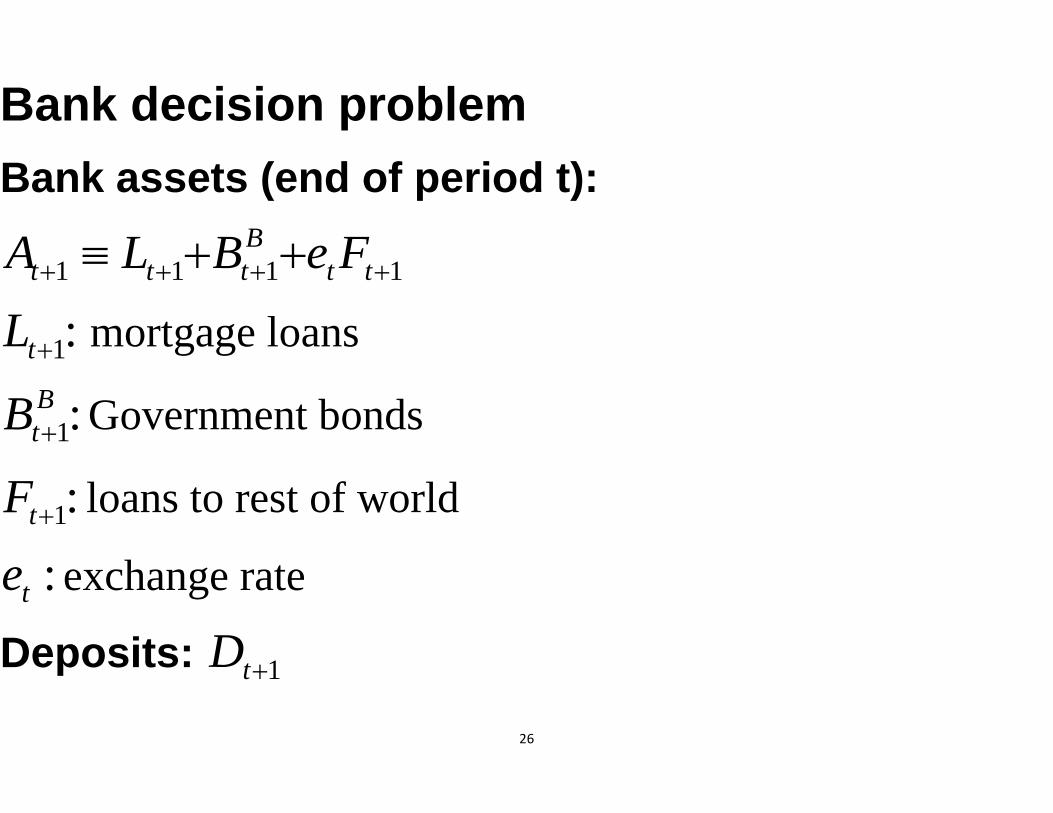
Bank decision problem
Bank assets (end of period t):
1 1 1 1
B
t t t t tA L B e F
1:tL mortgage loans
1:B
tB Government bonds
1:tF loans to rest of world
:te exchange rate
Deposits: 1tD
27
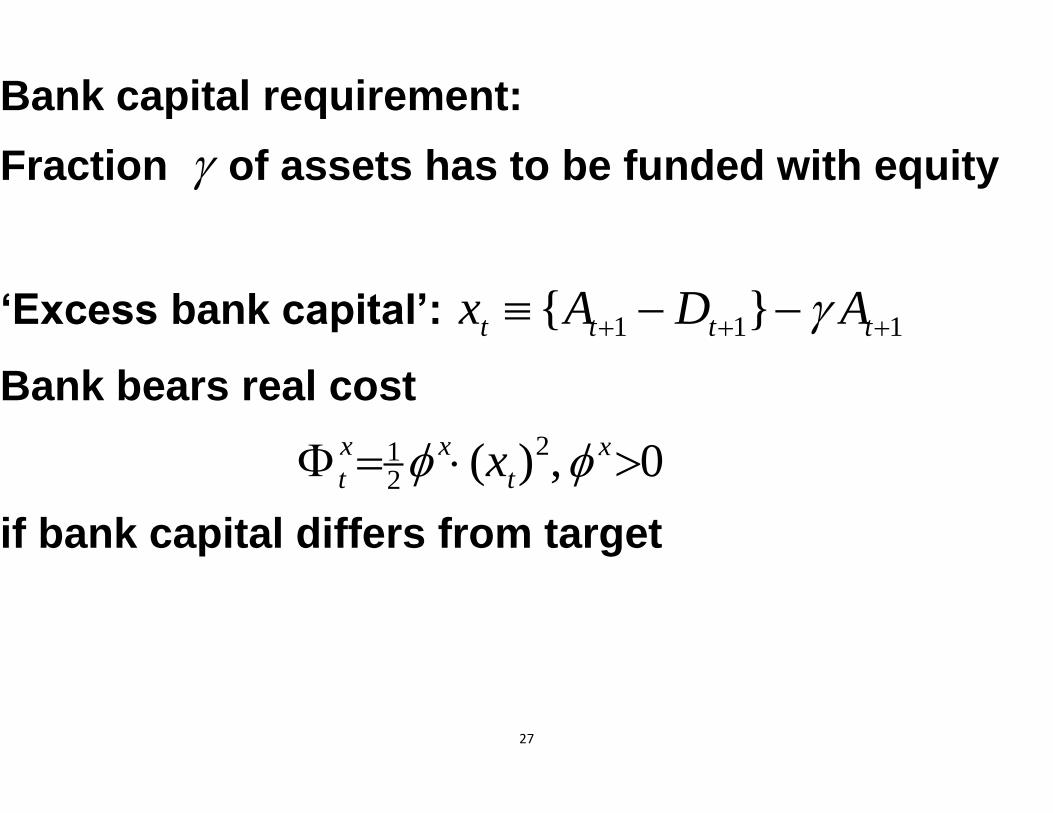
Bank capital requirement:
Fraction of assets has to be funded with equity
‘Excess bank capital’: 1 1 1{ }t t t tx A D A
Bank bears real cost
212
( ) ,x x
t tx 0x
if bank capital differs from target

28
Period t bank budget constraint:
1 1 1
B x B
t t t t t t t tD R L B e F d
,
1 ,L L B G B F F B
t t t t t t t t t t t tD L R B R e F R S
L
t : default on mortgage loan
,G B
t : default on bank-held sovereign bonds
F
t : default on external bonds
B
tS : government support to the bank (subsidy)
B
td : bank dividend
, ,D L F
t t tR R R : gross rates of return (deposits, mortgage loans,
foreign loans)
29
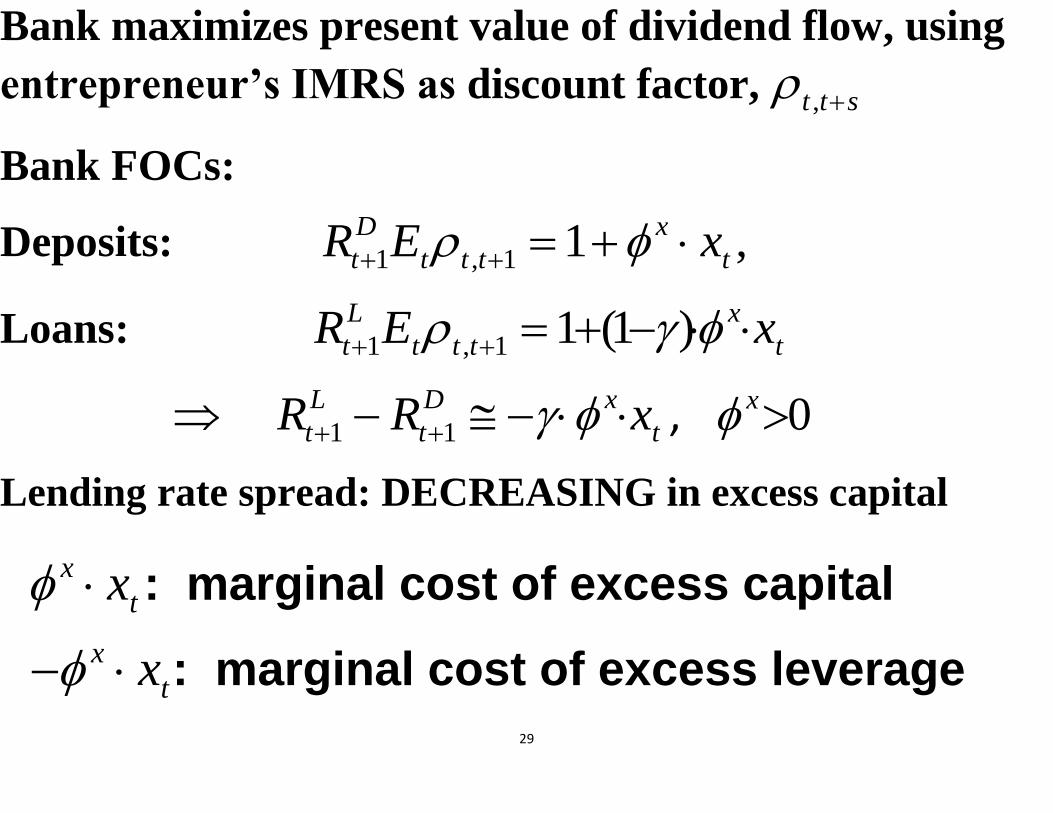
Bank maximizes present value of dividend flow, using
entrepreneur’s IMRS as discount factor, ,t t s
Bank FOCs:
Deposits: 1 , 1 1 ,D x
t t t t tR E x
Loans: 1 , 1 1 (1 )L x
t t t t tR E x
1 1
L D x
t t tR R x , 0x
Lending rate spread: DECREASING in excess capital
x
tx : marginal cost of excess capital
x
tx : marginal cost of excess leverage
30
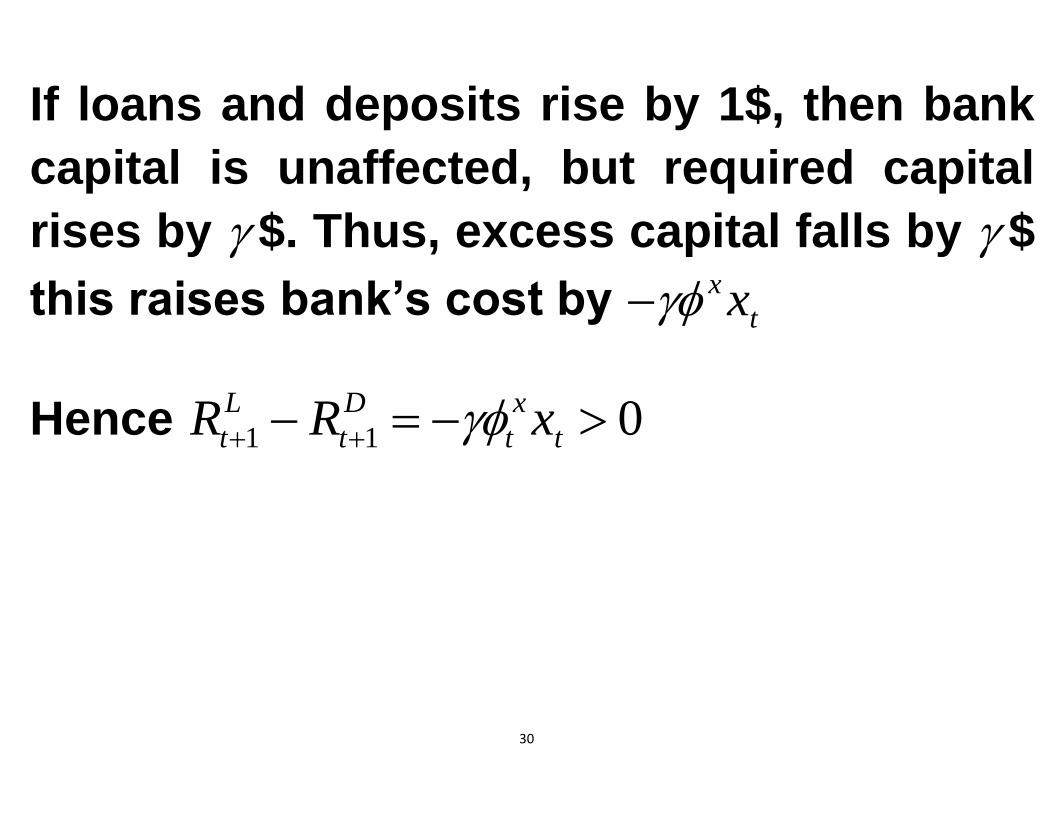
If loans and deposits rise by 1$, then bank
capital is unaffected, but required capital
rises by $. Thus, excess capital falls by $
this raises bank’s cost by x
tx
Hence 1 1 0L D x
t t t tR R x
31
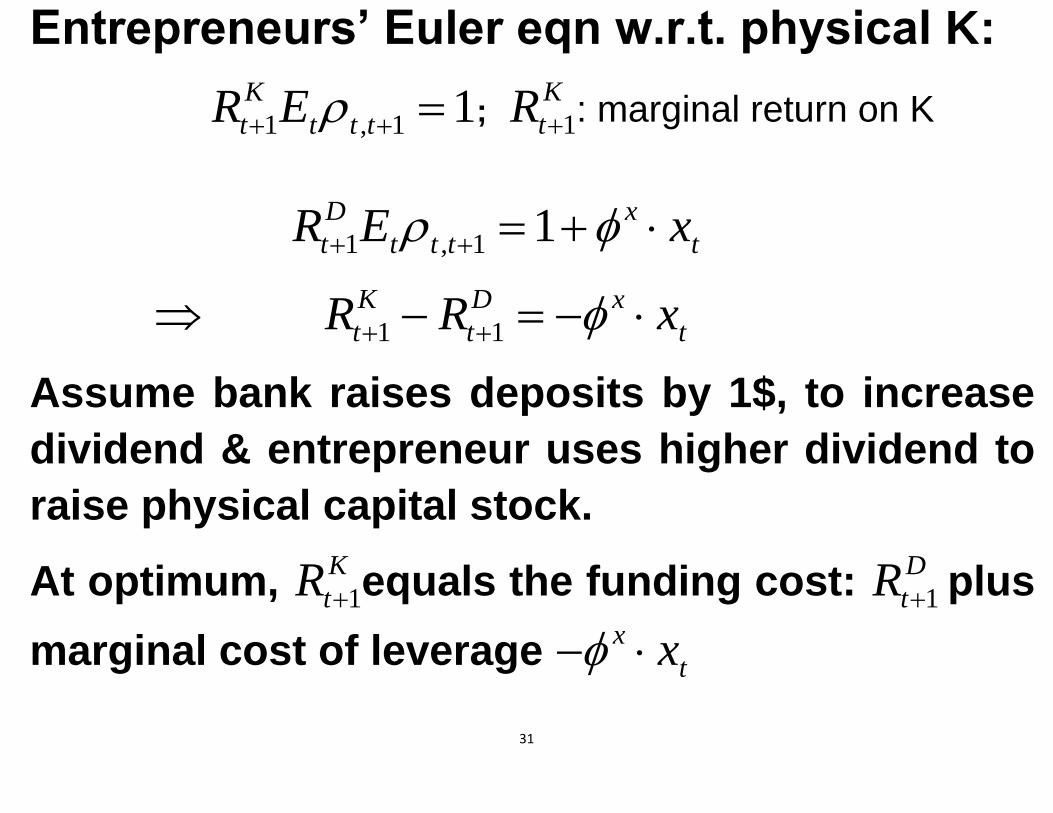
Entrepreneurs’ Euler eqn w.r.t. physical K:
1 , 1 1K
t t t tR E ; 1
K
tR : marginal return on K
1 , 1 1D x
t t t t tR E x
1 1
K D x
t t tR R x
Assume bank raises deposits by 1$, to increase
dividend & entrepreneur uses higher dividend to
raise physical capital stock.
At optimum, 1
K
tR equals the funding cost: 1
D
tR plus
marginal cost of leverage x
tx
32
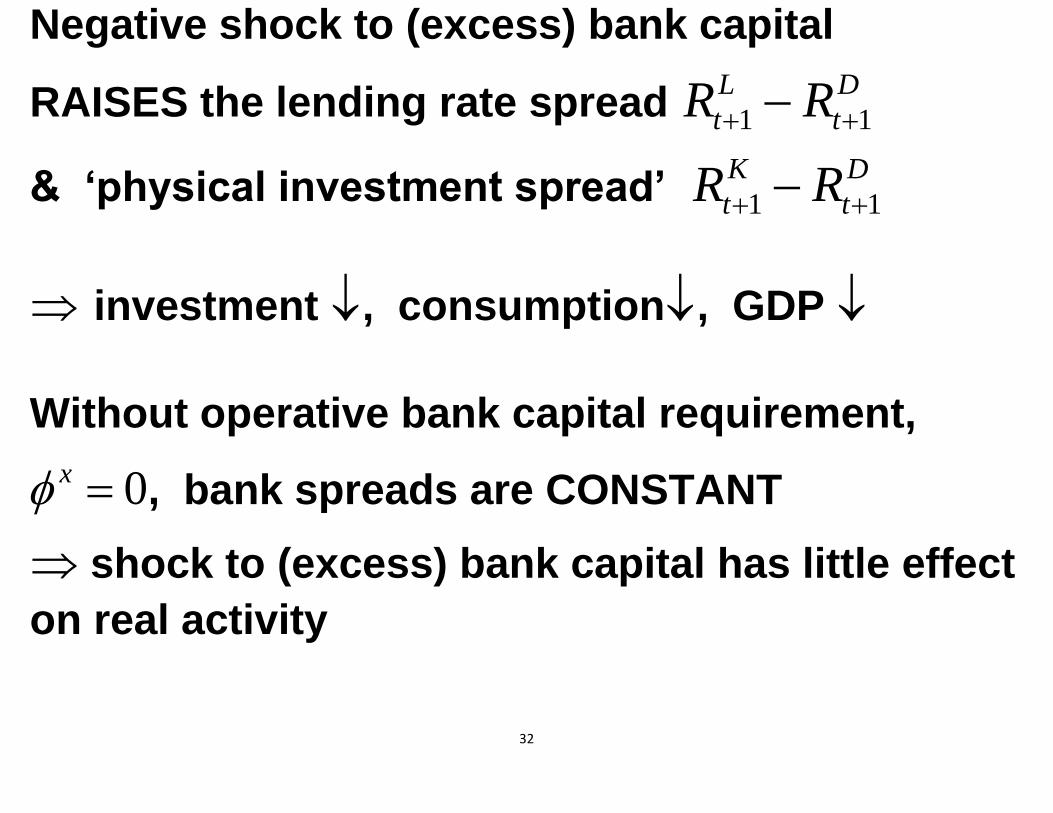
Negative shock to (excess) bank capital
RAISES the lending rate spread 1 1
L D
t tR R
& ‘physical investment spread’ 1 1
K D
t tR R
investment , consumption, GDP
Without operative bank capital requirement,
0x , bank spreads are CONSTANT
shock to (excess) bank capital has little effect
on real activity

33
Fiscal policy
Gov’t consumption ( tG ), investment (G
tI ) and transfers to
workers (W
tS ) given by policy rules:
1 1 1 1(1 ) - ( / ) ( / )CG CG G G B B G
t t B t t t t tG G G B GDP B def GDP
1 1 1 1(1 ) - ( / ) ( / )G IG G IG G IG IG B B IG
t t B t t t t tI i I B GDP B def GDP
1 1 1 1(1 ) - ( / ) ( / )W S S W S S B B S
t t B t t t t tS S S B GDP B def GDP
, ,
1 1 ( )D G p G b G B
t t t t t t t t tT B R B G I S
tT : tax revenues (net of subsidy to workers)
, ,,G p G B
t t : default (towards patient worker & bank)
B
tS : support to bank (i.i.d. process)
34
Monetary policy: Taylor rule
35
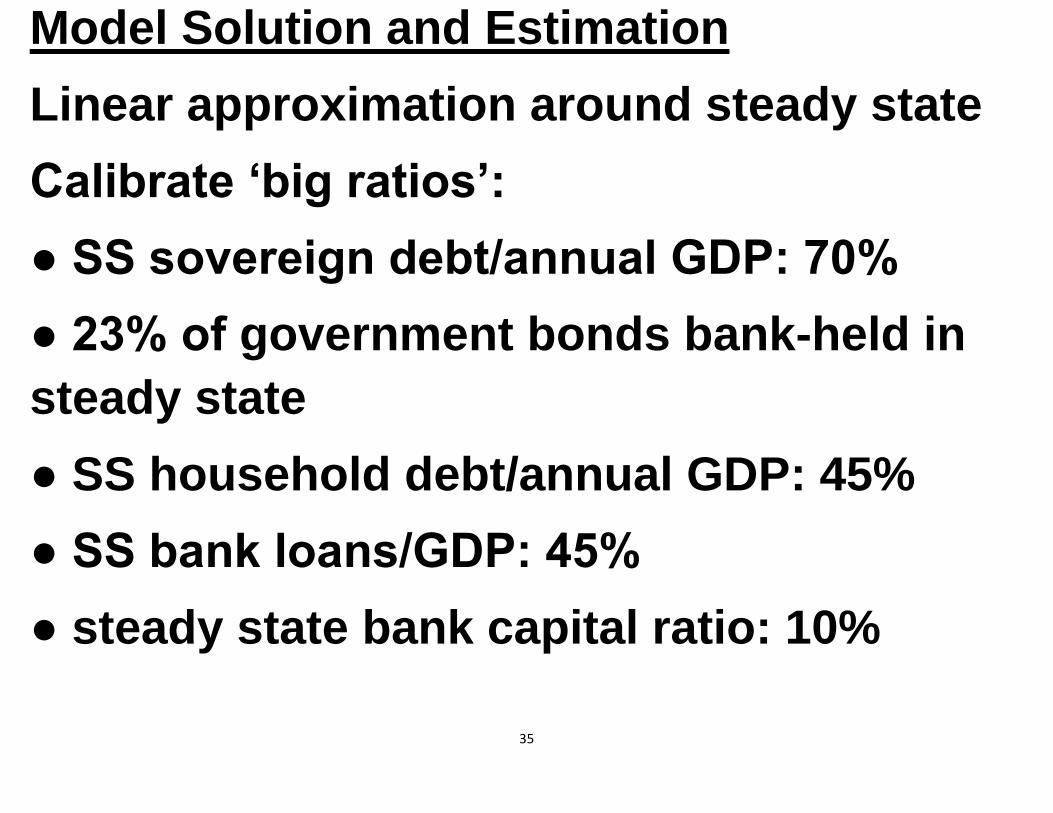
Model Solution and Estimation
Linear approximation around steady state
Calibrate ‘big ratios’:
● SS sovereign debt/annual GDP: 70%
● 23% of government bonds bank-held in
steady state
● SS household debt/annual GDP: 45%
● SS bank loans/GDP: 45%
● steady state bank capital ratio: 10%
36
Estimate remaining parameters:
Bayesian approach, quarterly EA data,
1995q1-2011q4
Observables: macro aggregates, deflators,
banking variables, fiscal variables,
gov’t bank support, loan losses

37
Posterior parameter estimates are in standard
range (see Table 1)
Curvature parameter of bank’s cost to
deviating from target capital ratio:
0.65x
1 percentage point rise in bank capital ratio
LOWERS
loan rate spread by 40 basis points p.a.
38
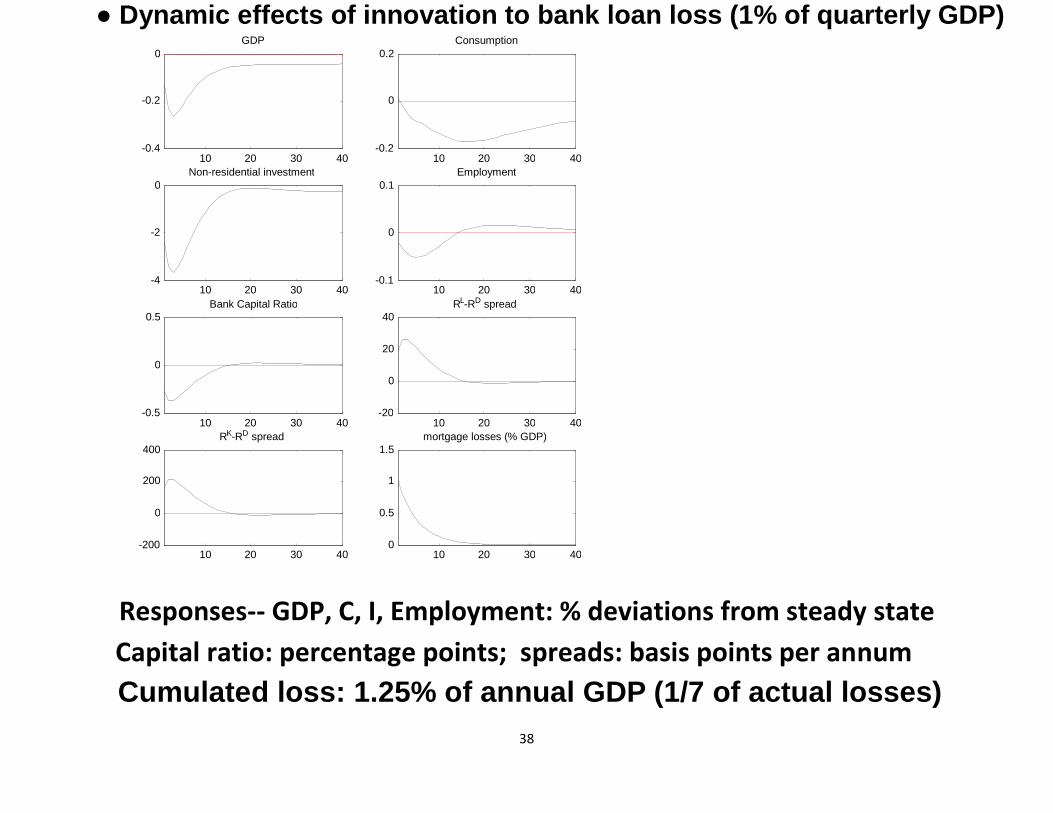
● Dynamic effects of innovation to bank loan loss (1% of quarterly GDP)
Responses-- GDP, C, I, Employment: % deviations from steady state
Capital ratio: percentage points; spreads: basis points per annum
Cumulated loss: 1.25% of annual GDP (1/7 of actual losses)
10 20 30 40 -0.4
-0.2
0 GDP
10 20 30 40 -0.2
0
0.2 Consumption
10 20 30 40 -4
-2
0 Non-residential investment
10 20 30 40 -0.1
0
0.1 Employment
10 20 30 40 -0.5
0
0.5 Bank Capital Ratio
10 20 30 40 -20
0
20
40 R L -R D spread
10 20 30 40 -200
0
200
400 R K -R D spread
10 20 30 40 0
0.5
1
1.5 mortgage losses (% GDP)
39
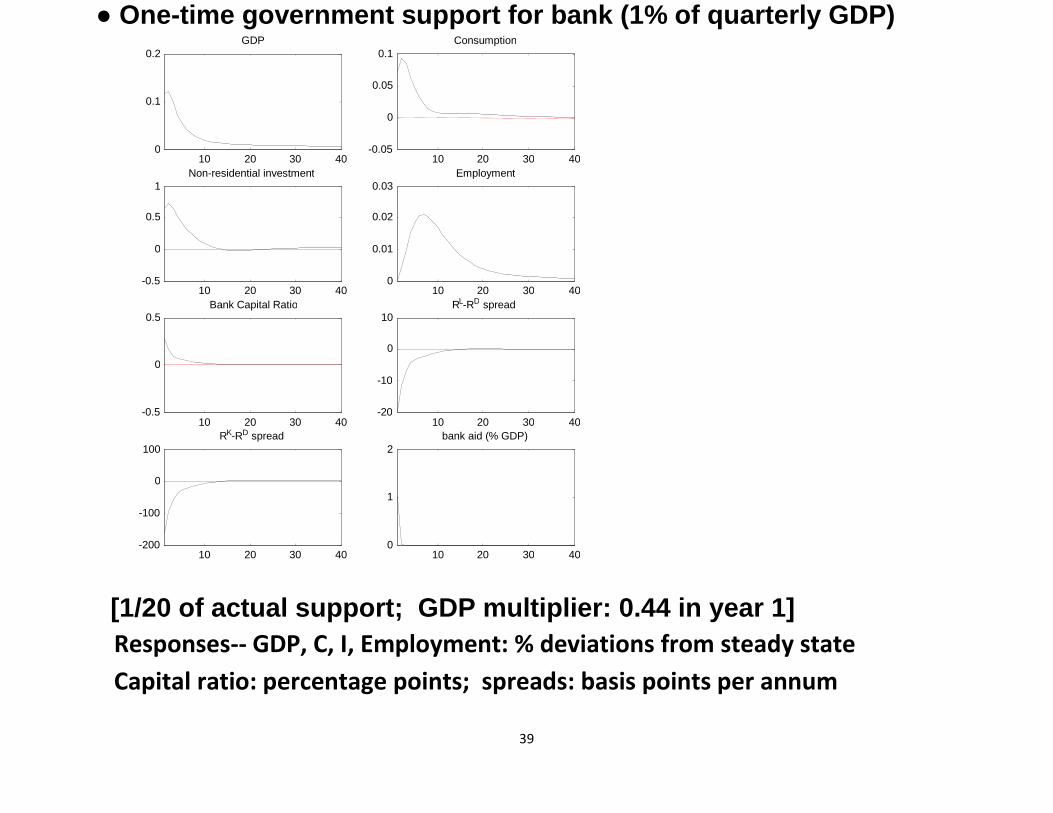
● One-time government support for bank (1% of quarterly GDP)
[1/20 of actual support; GDP multiplier: 0.44 in year 1]
Responses-- GDP, C, I, Employment: % deviations from steady state
Capital ratio: percentage points; spreads: basis points per annum
10 20 30 40 0
0.1
0.2 GDP
10 20 30 40 -0.05
0
0.05
0.1 Consumption
10 20 30 40 -0.5
0
0.5
1 Non-residential investment
10 20 30 40 0
0.01
0.02
0.03 Employment
10 20 30 40 -0.5
0
0.5 Bank Capital Ratio
10 20 30 40 -20
-10
0
10 R L -R D spread
10 20 30 40 -200
-100
0
100 R K -R D spread
10 20 30 40 0
1
2 bank aid (% GDP)
40
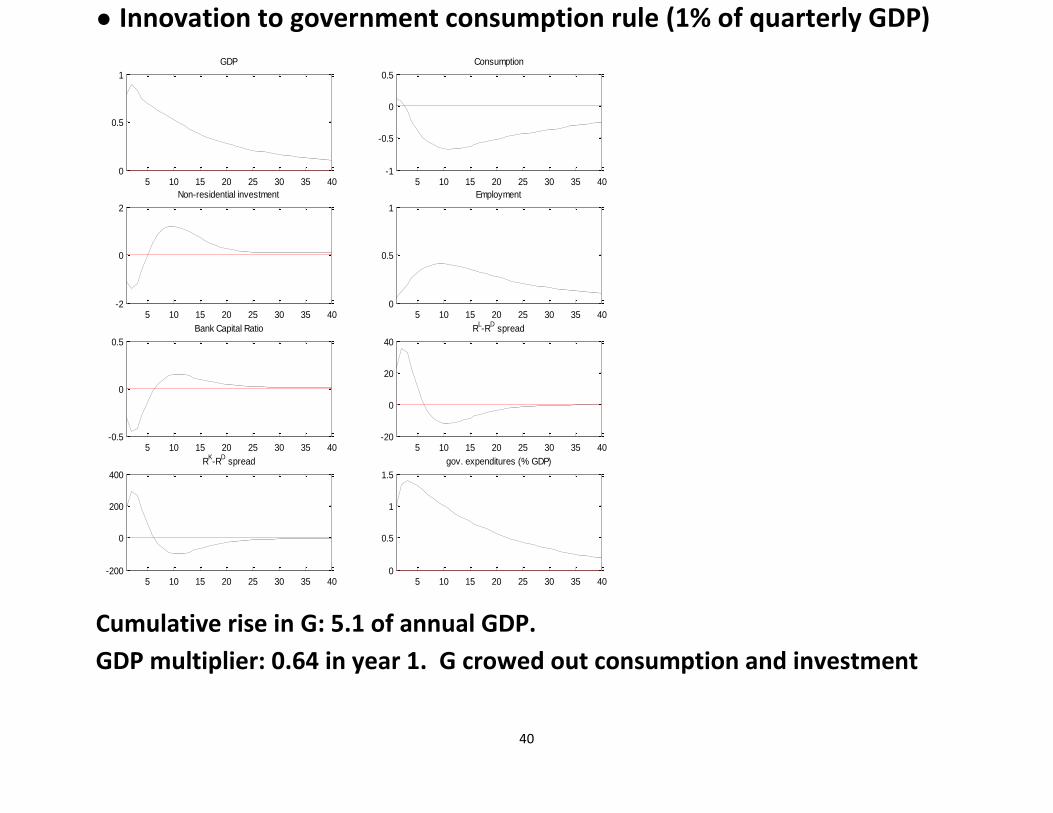
● Innovation to government consumption rule (1% of quarterly GDP)
Cumulative rise in G: 5.1 of annual GDP.
GDP multiplier: 0.64 in year 1. G crowed out consumption and investment
5 10 15 20 25 30 35 400
0.5
1
GDP
5 10 15 20 25 30 35 40-1
-0.5
0
0.5
Consumption
5 10 15 20 25 30 35 40-2
0
2
Non-residential investment
5 10 15 20 25 30 35 400
0.5
1
Employment
5 10 15 20 25 30 35 40-0.5
0
0.5
Bank Capital Ratio
5 10 15 20 25 30 35 40-20
0
20
40
RL-R
D spread
5 10 15 20 25 30 35 40-200
0
200
400
RK-R
D spread
5 10 15 20 25 30 35 400
0.5
1
1.5
gov. expenditures (% GDP)
41
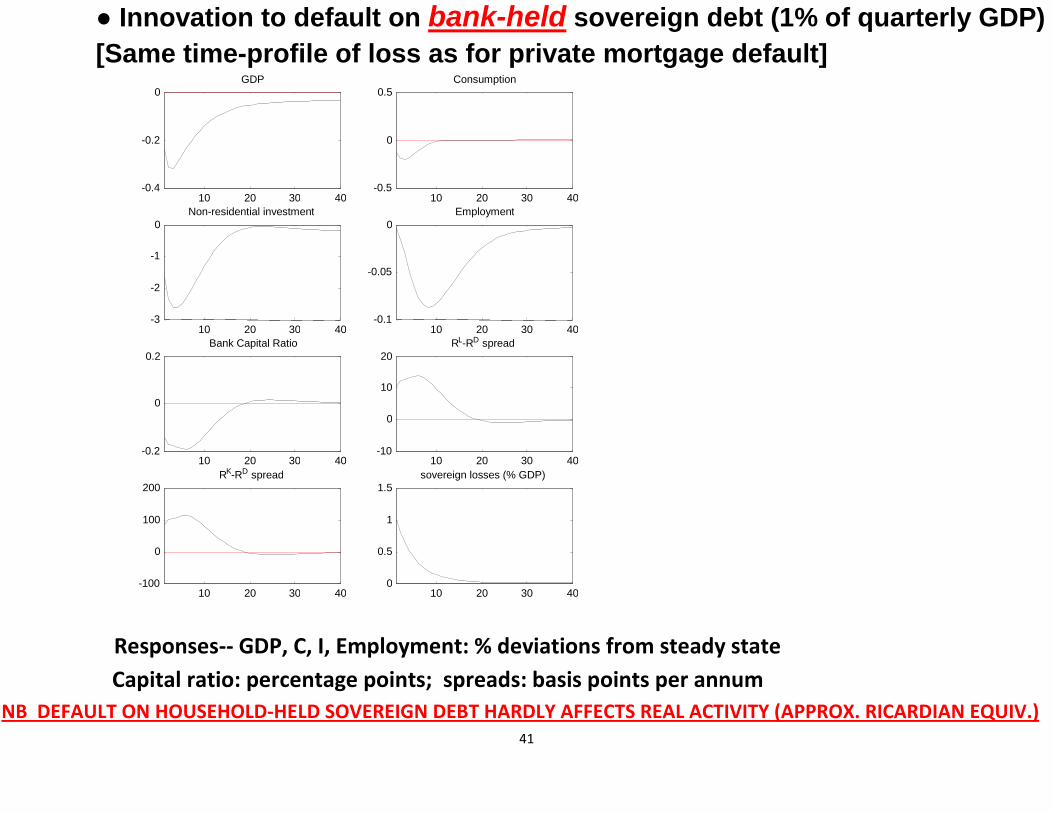
● Innovation to default on bank-held sovereign debt (1% of quarterly GDP)
[Same time-profile of loss as for private mortgage default]
Responses-- GDP, C, I, Employment: % deviations from steady state
Capital ratio: percentage points; spreads: basis points per annum
NB DEFAULT ON HOUSEHOLD-HELD SOVEREIGN DEBT HARDLY AFFECTS REAL ACTIVITY (APPROX. RICARDIAN EQUIV.)
10 20 30 40 -0.4
-0.2
0 GDP
10 20 30 40 -0.5
0
0.5 Consumption
10 20 30 40 -3
-2
-1
0 Non-residential investment
10 20 30 40 -0.1
-0.05
0 Employment
10 20 30 40 -0.2
0
0.2 Bank Capital Ratio
10 20 30 40 -10
0
10
20 R L -R D spread
10 20 30 40 -100
0
100
200 R K -R D spread
10 20 30 40 0
0.5
1
1.5 sovereign losses (% GDP)
42
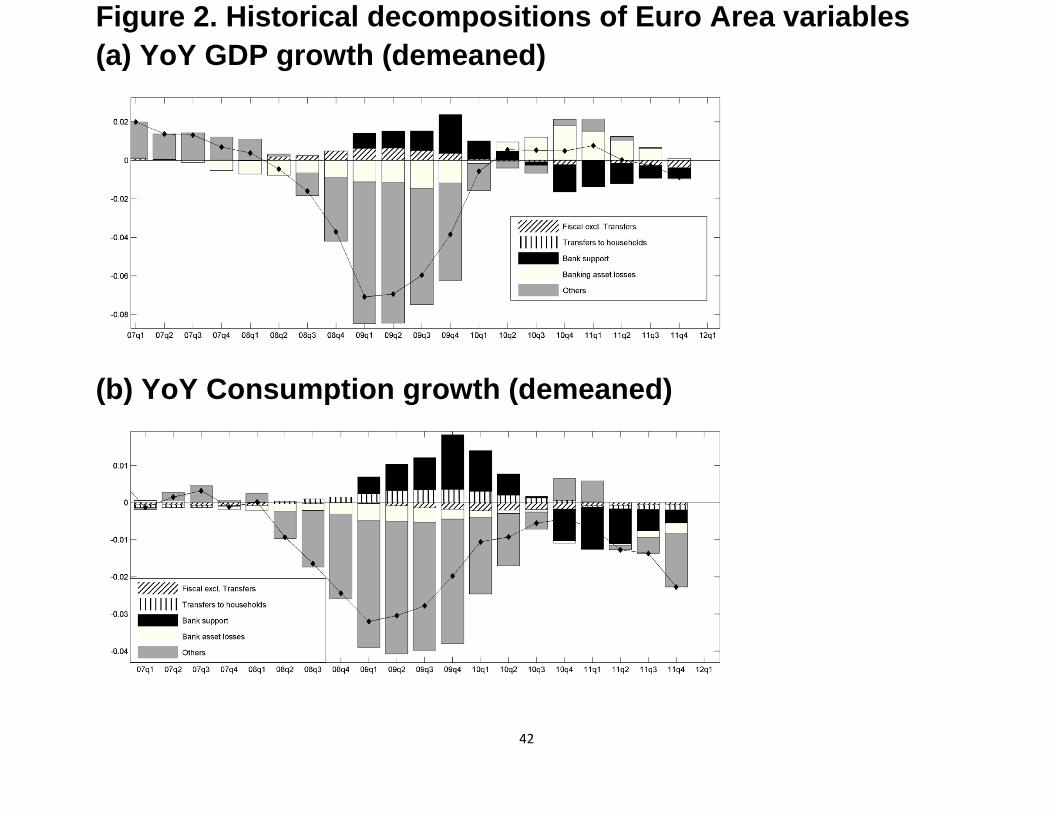
Figure 2. Historical decompositions of Euro Area variables
(a) YoY GDP growth (demeaned)
(b) YoY Consumption growth (demeaned)
43
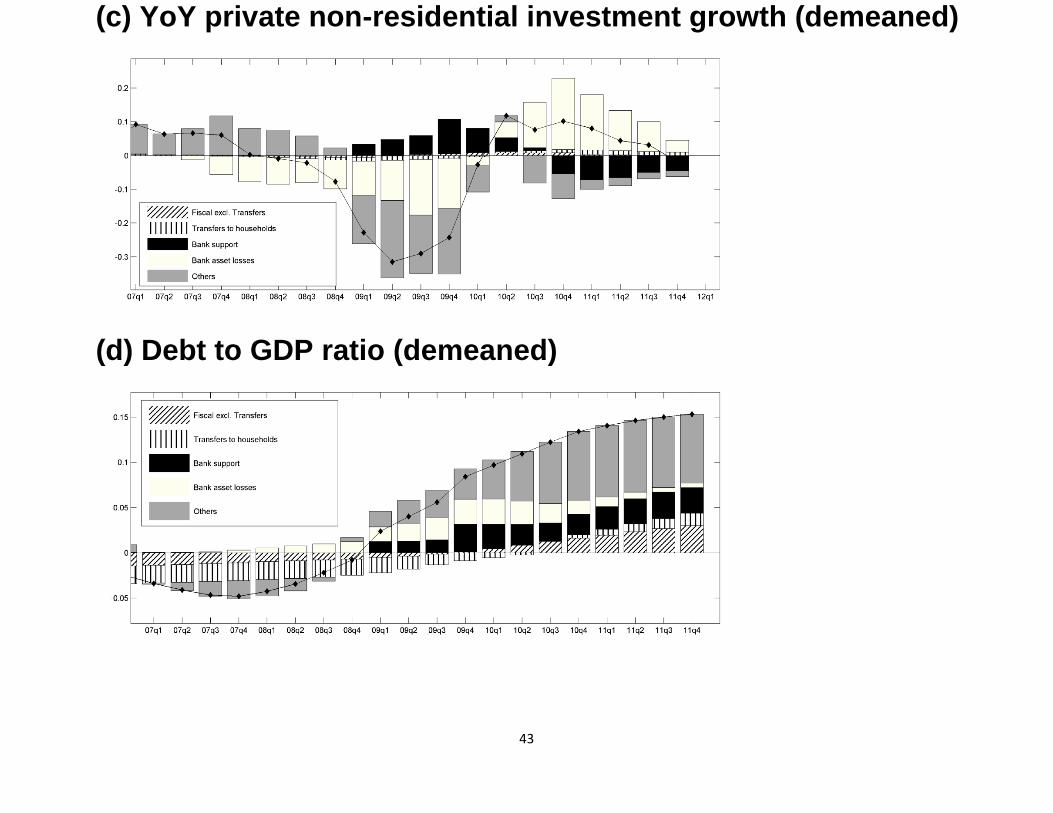
(c) YoY private non-residential investment growth (demeaned)
(d) Debt to GDP ratio (demeaned)
44
CONCLUSION
● Analyzed impact of EA bank losses,
government support for banks &
conventional fiscal stimulus measures
during crisis
● Developed and estimated a tractable macro
model with banking & fiscal sector
● Transmission channel of shocks to EA real
economy is consistent with key features of
crisis, especially strong investment decline
45
● Bank losses explain 1/4 of fall in EA GDP &
consumption in 2007-09 and
more than 3/4 of fall in investment
● Private loan losses and losses on bank-
held sovereign debt have similar
transmission mechanisms into the real
economy and strongly affect non residential
investment.
● Government support for banks was
effective tool for stabilizing output,
consumption & investment