Embed Size (px)
Citation preview
Bannockburn Transport Strategy Traffic Modelling Report
9 September 2019 Cardno i
Bannockburn Transport Strategy
Traffic Modelling Report
V171834
Prepared for
Golden Plains Shire
Adopted September 2019
© Cardno. Copyright in the whole and every part of this document belongs to Cardno and may not be used, sold, transferred, copied or reproduced in whole or in part in any manner or form or in or on any media to any person other than by agreement with Cardno.
This document is produced by Cardno solely for the benefit and use by the client in accordance with the terms of the engagement. Cardno does not and shall not assume any responsibility or liability whatsoever to any third party arising out of any use or reliance by any third party on the content of this document.
V171834 | 9 September 2019 | Commercial in Confidence ii
Contact Information Document Information
Cardno Victoria Pty Ltd
ABN 47 106 610 913
Level 4
501 Swanston Street
Melbourne 3000
Australia
www.cardno.com
Phone +61 3 8415 7777
Fax +61 3 8415 7788
Prepared for Golden Plains Shire
Project Name Traffic Modelling Report
File Reference V171834
Job Reference V171834
Date 9 September 2019
Version Number D05
Author(s):
Luke Smith
Senior Traffic Engineer
Effective Date 9/09/2019
Approved By:
Matt Mudge
Transport Planner
Date Approved 9/09/2019
Document History
Version Effective Date Description of Revision Prepared by Reviewed by
D01 22/10/2018 Draft for Information Luke Smith Matt Mudge
D02 08/11/2018 Draft Version 2 Luke Smith Matt Mudge
D03 13/11/2018 Draft Version 3 Luke Smith Matt Mudge
D04 18/02/2019 Draft Version 4 Luke Smith Matt Mudge
D05 21/03/2019 Draft Version 5 Luke Smith Matt Mudge
F01 02/09/2019 Final Version 1 Luke Smith Matt Mudge
F02 09/09/2019 Final Version 1 Luke Smith Matt Mudge
V171834 | 9 September 2019 | Commercial in Confidence iii
Table of Contents
1 Traffic Modelling Overview 1
Introduction 1
Modelling Methodology 1
Assessment of Existing Traffic Volumes 2
Modelling Assumptions 2
2 Land Use Inputs 3
Commercial Land Use 3
Residential Land Use 4
3 Assessment of the Bannockburn Growth Area Traffic Generation Rates 6
Overview 6
Adopted Traffic Generation Rates 6
4 Traffic Generation and Distribution 9
Ultimate Case Traffic Generation 9
Ultimate Case Traffic Distribution 13
Internal Residential Traffic Distribution 17
5 Future Traffic Growth 18
6 Intersection Analysis 19
Future Link Flows 19
Intersection Analysis 20
Appendices
Appendix A Intersection Analysis Details
Tables
Table 2-1 Future commercial and retail land use GFA’s 4
Table 2-2 Summary of population growth and areas 5
Table 3-1 Assessed low density residential developments taken from RMS “Guide to Traffic Generating Developments” 6
Table 3-2 Assessed regional office developments taken from RMS “Guide to Traffic Generating Developments” 7
Table 3-3 Regional office developments taken from RMS “Guide to Traffic Generating Developments” average traffic generation rates 7
Table 3-4 RMS “Guide to Traffic Generating Developments shopping centre traffic generation rates 8
Table 3-5 Ultimate case adopted retail traffic generation rates /100sqm GFA 8
Table 4-1 Ultimate case commercial land use split per block 9
Table 4-2 Ultimate case commercial GFA’s 10
Table 4-3 Ultimate weekday AM peak hour traffic generation 11
V171834 | 9 September 2019 | Commercial in Confidence iv
Table 4-4 Ultimate weekday PM peak hour traffic generation 12
Table 4-5 Ultimate Saturday peak hour traffic generation 13
Table 4-6 Peak hour traffic distribution splits 13
Table 4-7 Weekday AM peak hour traffic distribution 14
Table 4-8 Weekday PM peak hour traffic distribution 15
Table 4-9 Saturday peak hour traffic distributions 16
Table 4-10 Residential areas 1-7 traffic generation splits 17
Table 5-1 Percent Traffic Growth Per Annum 18
Table 5-2 Increase in traffic growth 2018 - 2036 18
Existing and Future Bannockburn Traffic Flows 19
Table 1-1 Rating of Degrees of Saturation 20
Table 6-2 Intersection Analysis Summary 21
Figures
Modelling Methodology 1
Ultimate commercial and retail block locations 3
Bannockburn future population and growth locations 4
V171834 | 9 September 2019 | Commercial in Confidence 1
1 Traffic Modelling Overview
Introduction
Cardno has been commissioned to develop Transport Strategies for Traffic Management, Car Parking, and Sustainable Transport within Bannockburn Growth Area.
A key element in determining potential future road network issues and requirements due to future residential and commercial development in Bannockburn is gaining an understanding of future traffic flows and intersection performance resulting from this development.
Cardno has developed a first principles spreadsheet model to estimate these future year traffic flows and intersection turning movements for analysis using the SIDRA intersection modelling software. This intersection modelling has allowed us to determine which intersections will require future improvements and assist in determining the nature of these improvements.
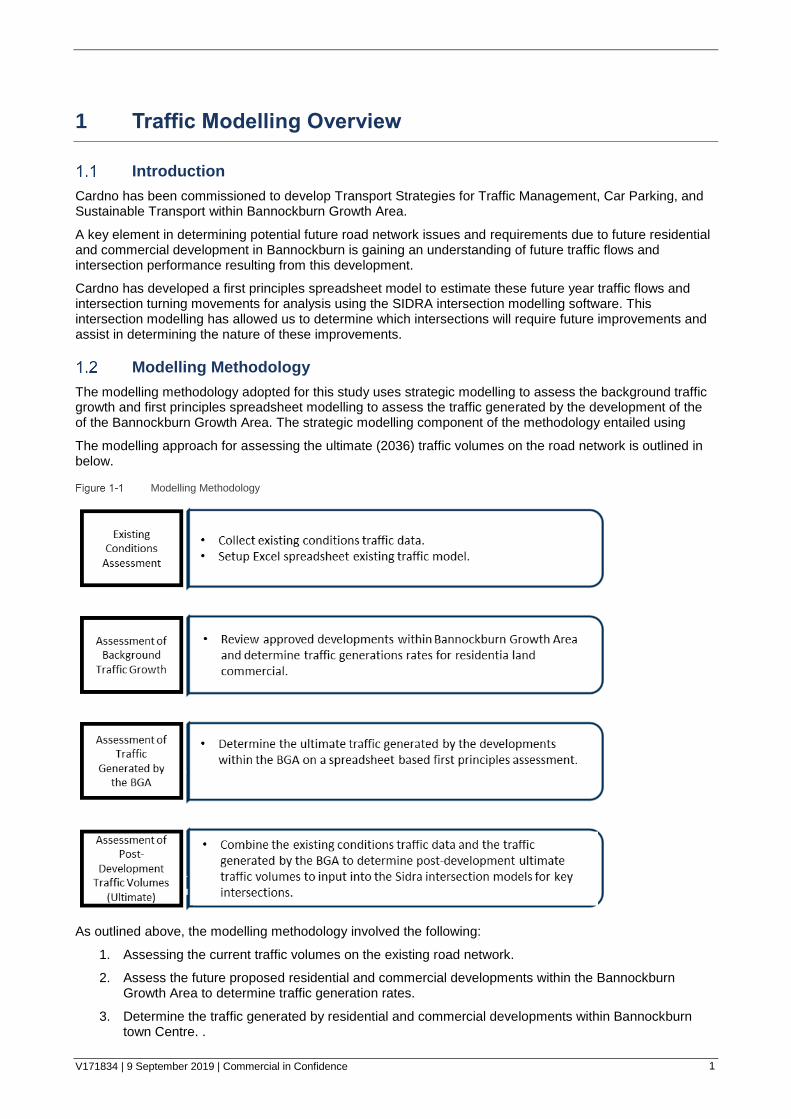
Modelling Methodology
The modelling methodology adopted for this study uses strategic modelling to assess the background traffic growth and first principles spreadsheet modelling to assess the traffic generated by the development of the of the Bannockburn Growth Area. The strategic modelling component of the methodology entailed using
The modelling approach for assessing the ultimate (2036) traffic volumes on the road network is outlined in below.
Modelling Methodology
As outlined above, the modelling methodology involved the following:
1. Assessing the current traffic volumes on the existing road network.
2. Assess the future proposed residential and commercial developments within the Bannockburn Growth Area to determine traffic generation rates.
3. Determine the traffic generated by residential and commercial developments within Bannockburn town Centre. .
V171834 | 9 September 2019 | Commercial in Confidence 2
4. Combine the existing traffic volumes and the traffic generated by the Bannockburn growth Area to obtain “post-development” traffic volumes for the ultimate (2036) traffic scenario.
Assessment of Existing Traffic Volumes
Existing conditions traffic data was sourced from various sources to inform the excel traffic model for the Bannockburn Growth Area and subsequent Bannockburn Transport Strategy. These sources included Cardno collected turning movement counts and speed / volume surveys traffic survey data.
Modelling Assumptions
The following assumptions were used in regard to the ultimate (2036) development scenario:
1. 100% of the Bannockburn Growth Area has been fully developed.
2. No changes to the existing road network has occurred between the time the existing conditions were surveyed and the 2036 modelling year.
3. The traffic generation rates taken from the RMS Guide to Traffic Generating Developments do not change between 2013 and 2036.
4. Whilst this Bannockburn Transport Strategy will recommend further investigations on additional strategic road network access proposals, this traffic modelling exercise assumes that proposals of this nature have not been implemented. These include but may not be limited to:
Alternative access across the railway line to Midland Highway;
Improvements to Burnside Road south of the Bannockburn Urban Design Investigation Area; or
Heavy vehicle bypass options.
V171834 | 9 September 2019 | Commercial in Confidence 3
2 Land Use Inputs
Precinct demographic data for the Bannockburn Growth Area was sourced from the Bannockburn Town Centre Investment Strategy and Bannockburn Urban Design Framework in relation to the ultimate development scenario.
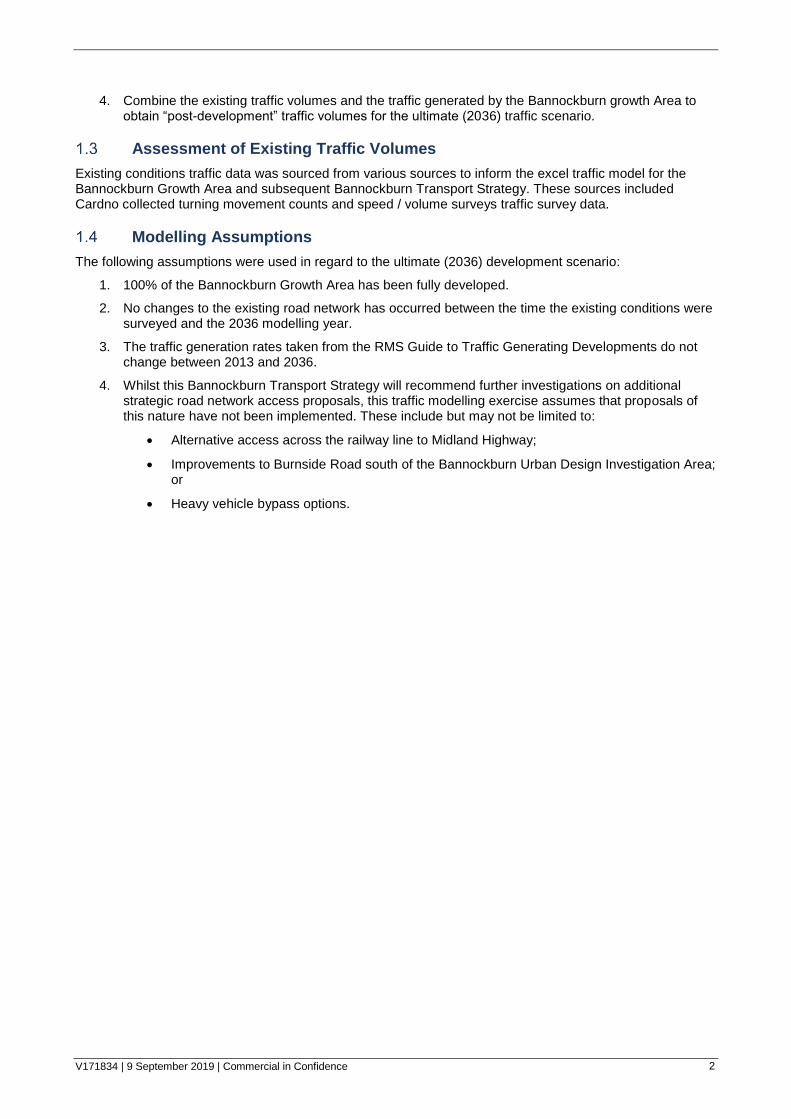
Commercial Land Use
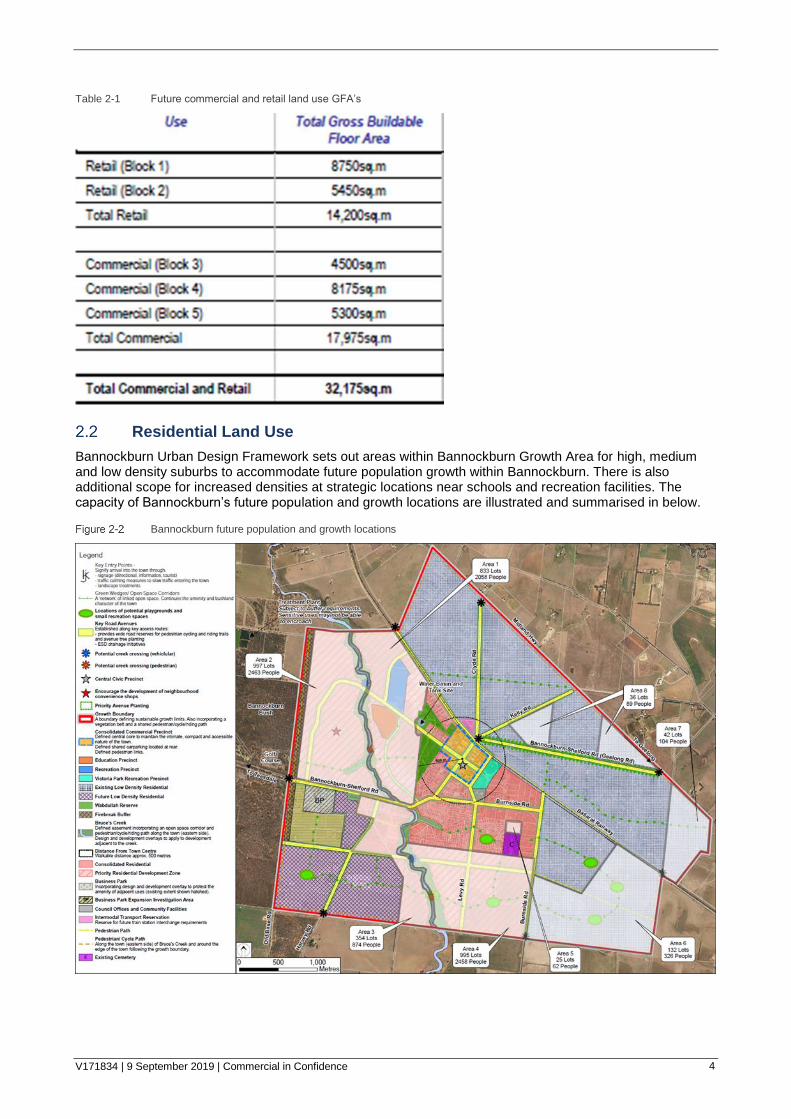
Bannockburn Town Centre Investment Strategy sets out future commercial and retail land use sizes and allocates Gross Floor Area (GFA) to blocks within the Bannockburn Town Centre. The below figures illustrate the proposed locations and sizes of the commercial and retails blocks. Furthermore, the below figure highlights the nominal ultimate commercial and retail land use GFA’s
Ultimate commercial and retail block locations
V171834 | 9 September 2019 | Commercial in Confidence 4
Table 2-1 Future commercial and retail land use GFA’s
Residential Land Use
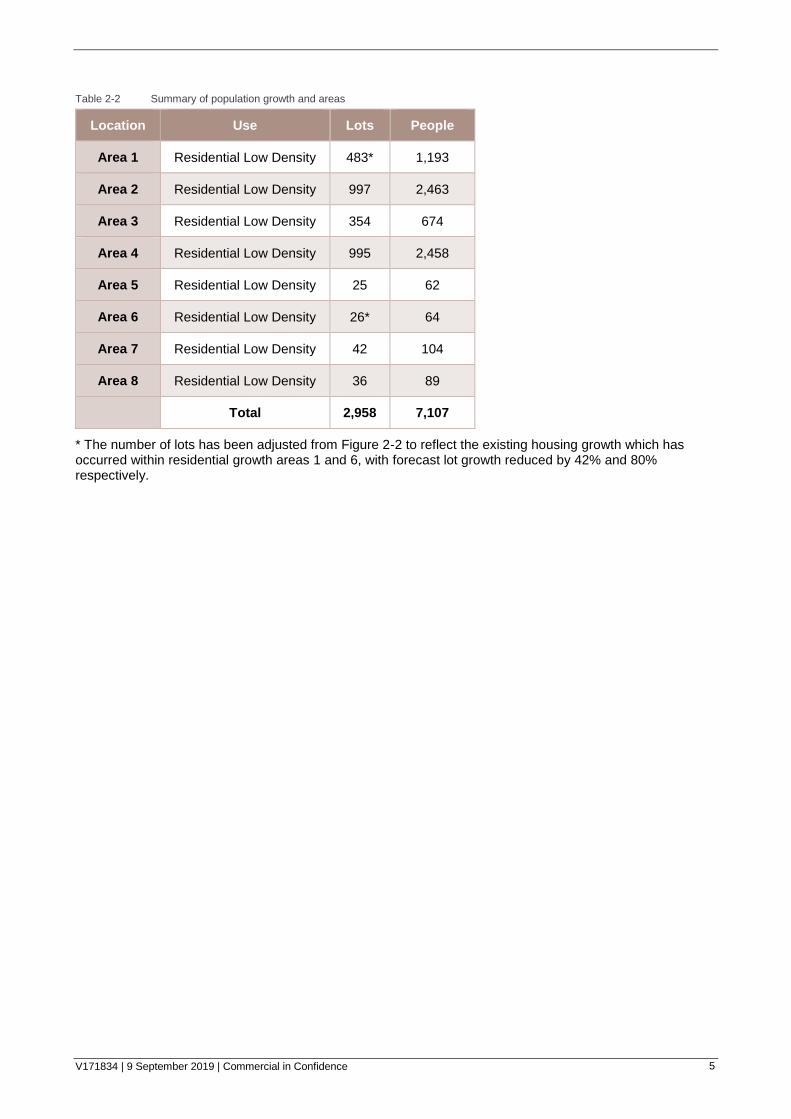
Bannockburn Urban Design Framework sets out areas within Bannockburn Growth Area for high, medium and low density suburbs to accommodate future population growth within Bannockburn. There is also additional scope for increased densities at strategic locations near schools and recreation facilities. The capacity of Bannockburn’s future population and growth locations are illustrated and summarised in below.
Bannockburn future population and growth locations
V171834 | 9 September 2019 | Commercial in Confidence 5
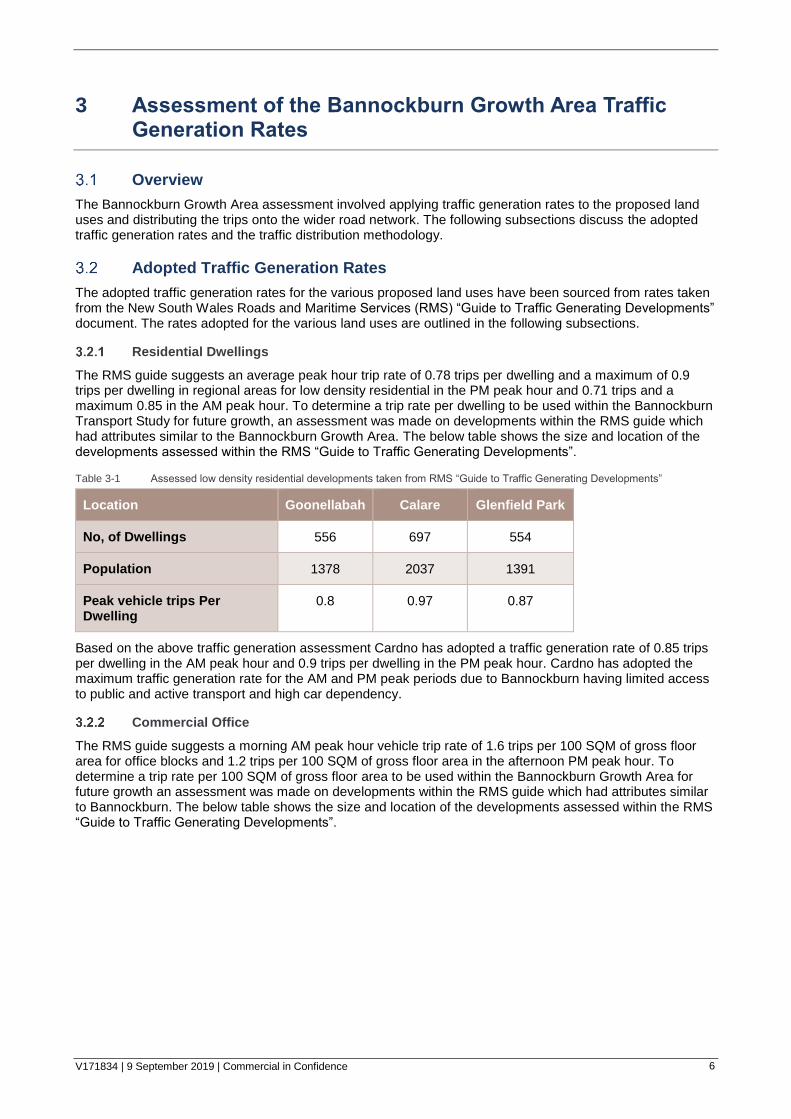
Table 2-2 Summary of population growth and areas
Location Use Lots People
Area 1 Residential Low Density 483* 1,193
Area 2 Residential Low Density 997 2,463
Area 3 Residential Low Density 354 674
Area 4 Residential Low Density 995 2,458
Area 5 Residential Low Density 25 62
Area 6 Residential Low Density 26* 64
Area 7 Residential Low Density 42 104
Area 8 Residential Low Density 36 89
Total 2,958 7,107
* The number of lots has been adjusted from Figure 2-2 to reflect the existing housing growth which has occurred within residential growth areas 1 and 6, with forecast lot growth reduced by 42% and 80% respectively.
V171834 | 9 September 2019 | Commercial in Confidence 6
3 Assessment of the Bannockburn Growth Area Traffic Generation Rates
Overview
The Bannockburn Growth Area assessment involved applying traffic generation rates to the proposed land uses and distributing the trips onto the wider road network. The following subsections discuss the adopted traffic generation rates and the traffic distribution methodology.
Adopted Traffic Generation Rates
The adopted traffic generation rates for the various proposed land uses have been sourced from rates taken from the New South Wales Roads and Maritime Services (RMS) “Guide to Traffic Generating Developments” document. The rates adopted for the various land uses are outlined in the following subsections.
Residential Dwellings
The RMS guide suggests an average peak hour trip rate of 0.78 trips per dwelling and a maximum of 0.9 trips per dwelling in regional areas for low density residential in the PM peak hour and 0.71 trips and a maximum 0.85 in the AM peak hour. To determine a trip rate per dwelling to be used within the Bannockburn Transport Study for future growth, an assessment was made on developments within the RMS guide which had attributes similar to the Bannockburn Growth Area. The below table shows the size and location of the developments assessed within the RMS “Guide to Traffic Generating Developments”.
Table 3-1 Assessed low density residential developments taken from RMS “Guide to Traffic Generating Developments”
Location Goonellabah Calare Glenfield Park
No, of Dwellings 556 697 554
Population 1378 2037 1391
Peak vehicle trips Per Dwelling
0.8 0.97 0.87
Based on the above traffic generation assessment Cardno has adopted a traffic generation rate of 0.85 trips per dwelling in the AM peak hour and 0.9 trips per dwelling in the PM peak hour. Cardno has adopted the maximum traffic generation rate for the AM and PM peak periods due to Bannockburn having limited access to public and active transport and high car dependency.
Commercial Office
The RMS guide suggests a morning AM peak hour vehicle trip rate of 1.6 trips per 100 SQM of gross floor area for office blocks and 1.2 trips per 100 SQM of gross floor area in the afternoon PM peak hour. To determine a trip rate per 100 SQM of gross floor area to be used within the Bannockburn Growth Area for future growth an assessment was made on developments within the RMS guide which had attributes similar to Bannockburn. The below table shows the size and location of the developments assessed within the RMS “Guide to Traffic Generating Developments”.
V171834 | 9 September 2019 | Commercial in Confidence 7
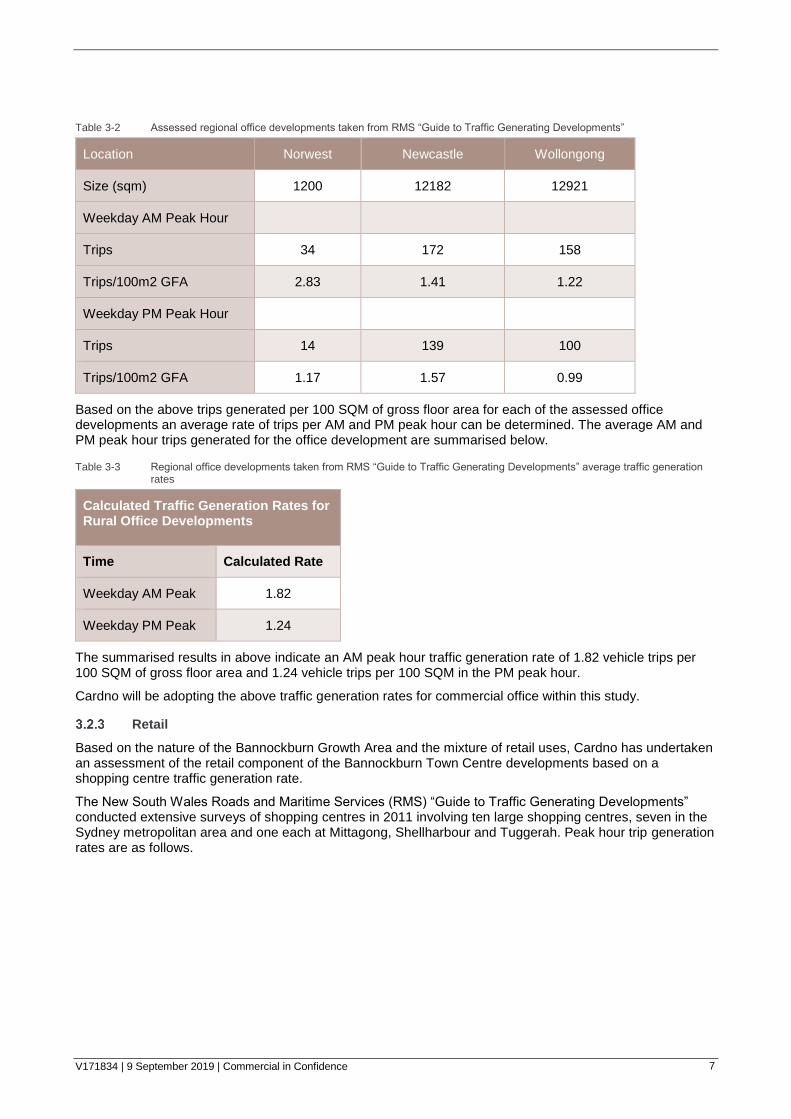
Table 3-2 Assessed regional office developments taken from RMS “Guide to Traffic Generating Developments”
Location Norwest Newcastle Wollongong
Size (sqm) 1200 12182 12921
Weekday AM Peak Hour
Trips 34 172 158
Trips/100m2 GFA 2.83 1.41 1.22
Weekday PM Peak Hour
Trips 14 139 100
Trips/100m2 GFA 1.17 1.57 0.99
Based on the above trips generated per 100 SQM of gross floor area for each of the assessed office developments an average rate of trips per AM and PM peak hour can be determined. The average AM and PM peak hour trips generated for the office development are summarised below.
Table 3-3 Regional office developments taken from RMS “Guide to Traffic Generating Developments” average traffic generation rates
Calculated Traffic Generation Rates for Rural Office Developments
Time Calculated Rate
Weekday AM Peak 1.82
Weekday PM Peak 1.24
The summarised results in above indicate an AM peak hour traffic generation rate of 1.82 vehicle trips per 100 SQM of gross floor area and 1.24 vehicle trips per 100 SQM in the PM peak hour.
Cardno will be adopting the above traffic generation rates for commercial office within this study.
Retail
Based on the nature of the Bannockburn Growth Area and the mixture of retail uses, Cardno has undertaken an assessment of the retail component of the Bannockburn Town Centre developments based on a shopping centre traffic generation rate.
The New South Wales Roads and Maritime Services (RMS) “Guide to Traffic Generating Developments” conducted extensive surveys of shopping centres in 2011 involving ten large shopping centres, seven in the Sydney metropolitan area and one each at Mittagong, Shellharbour and Tuggerah. Peak hour trip generation rates are as follows.
V171834 | 9 September 2019 | Commercial in Confidence 8
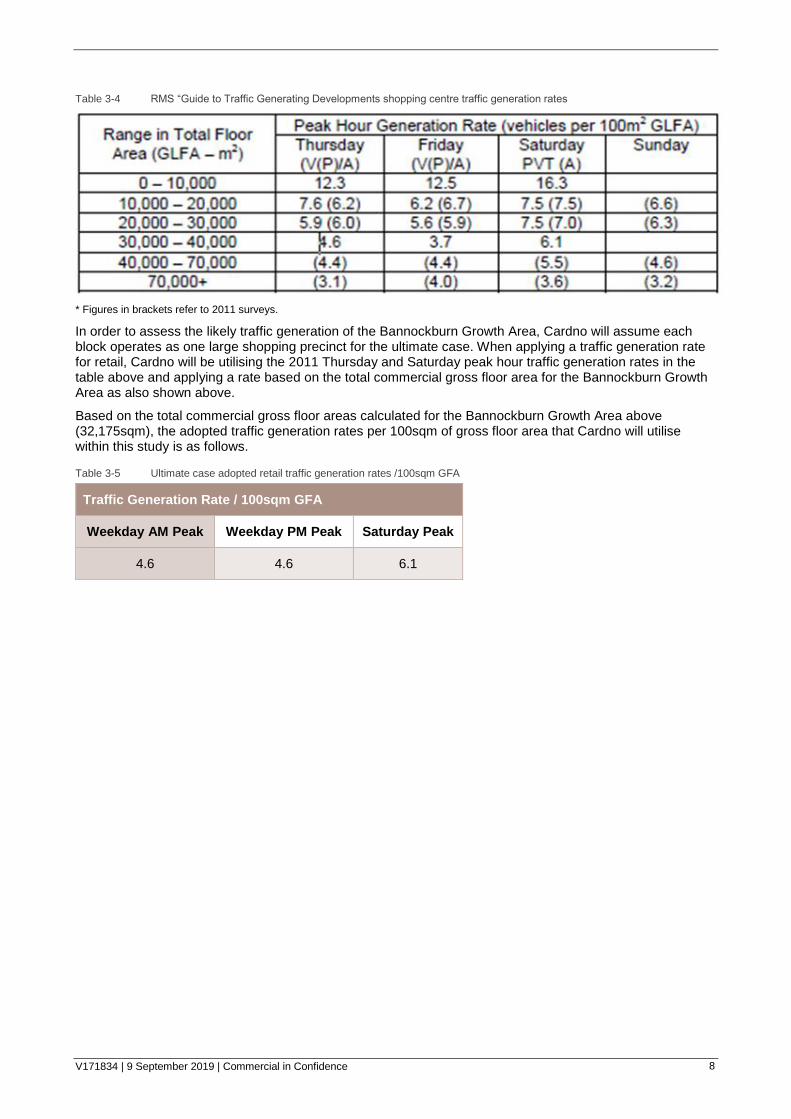
Table 3-4 RMS “Guide to Traffic Generating Developments shopping centre traffic generation rates
* Figures in brackets refer to 2011 surveys.
In order to assess the likely traffic generation of the Bannockburn Growth Area, Cardno will assume each block operates as one large shopping precinct for the ultimate case. When applying a traffic generation rate for retail, Cardno will be utilising the 2011 Thursday and Saturday peak hour traffic generation rates in the table above and applying a rate based on the total commercial gross floor area for the Bannockburn Growth Area as also shown above.
Based on the total commercial gross floor areas calculated for the Bannockburn Growth Area above (32,175sqm), the adopted traffic generation rates per 100sqm of gross floor area that Cardno will utilise within this study is as follows.
Table 3-5 Ultimate case adopted retail traffic generation rates /100sqm GFA
Traffic Generation Rate / 100sqm GFA
Weekday AM Peak Weekday PM Peak Saturday Peak
4.6 4.6 6.1
V171834 | 9 September 2019 | Commercial in Confidence 9
4 Traffic Generation and Distribution
Ultimate Case Traffic Generation
Cardno sourced the ultimate case developments proposed for the Bannockburn Growth Area including residential and commercial from the Bannockburn Urban Design Framework and the Town Centre Investment Strategy.
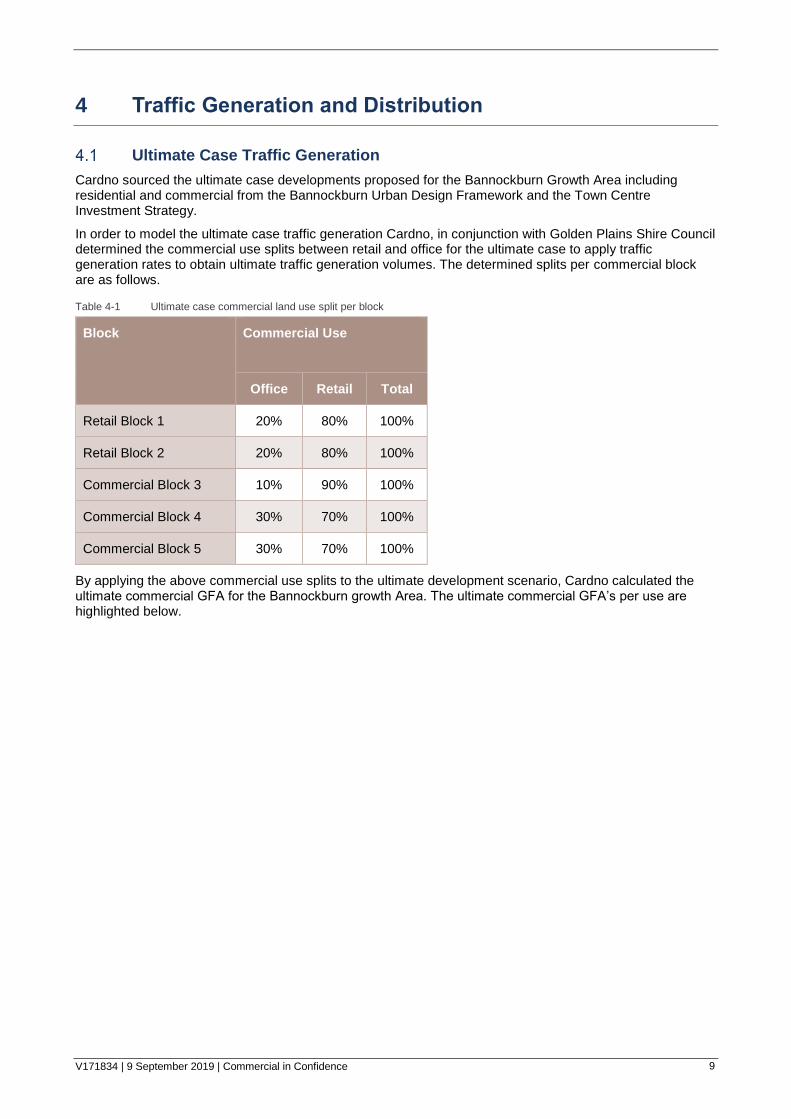
In order to model the ultimate case traffic generation Cardno, in conjunction with Golden Plains Shire Council determined the commercial use splits between retail and office for the ultimate case to apply traffic generation rates to obtain ultimate traffic generation volumes. The determined splits per commercial block are as follows.
Table 4-1 Ultimate case commercial land use split per block
Block Commercial Use
Office Retail Total
Retail Block 1 20% 80% 100%
Retail Block 2 20% 80% 100%
Commercial Block 3 10% 90% 100%
Commercial Block 4 30% 70% 100%
Commercial Block 5 30% 70% 100%
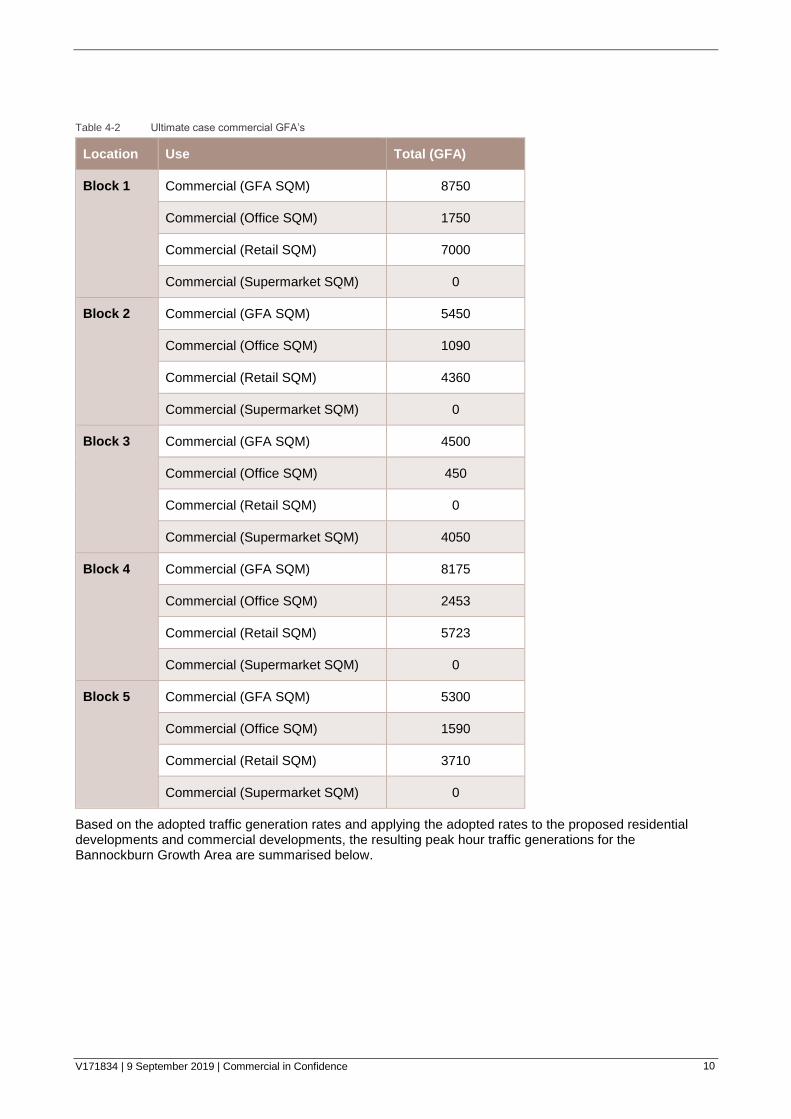
By applying the above commercial use splits to the ultimate development scenario, Cardno calculated the ultimate commercial GFA for the Bannockburn growth Area. The ultimate commercial GFA’s per use are highlighted below.
V171834 | 9 September 2019 | Commercial in Confidence 10
Table 4-2 Ultimate case commercial GFA’s
Location Use Total (GFA)
Block 1 Commercial (GFA SQM) 8750
Commercial (Office SQM) 1750
Commercial (Retail SQM) 7000
Commercial (Supermarket SQM) 0
Block 2 Commercial (GFA SQM) 5450
Commercial (Office SQM) 1090
Commercial (Retail SQM) 4360
Commercial (Supermarket SQM) 0
Block 3 Commercial (GFA SQM) 4500
Commercial (Office SQM) 450
Commercial (Retail SQM) 0
Commercial (Supermarket SQM) 4050
Block 4 Commercial (GFA SQM) 8175
Commercial (Office SQM) 2453
Commercial (Retail SQM) 5723
Commercial (Supermarket SQM) 0
Block 5 Commercial (GFA SQM) 5300
Commercial (Office SQM) 1590
Commercial (Retail SQM) 3710
Commercial (Supermarket SQM) 0
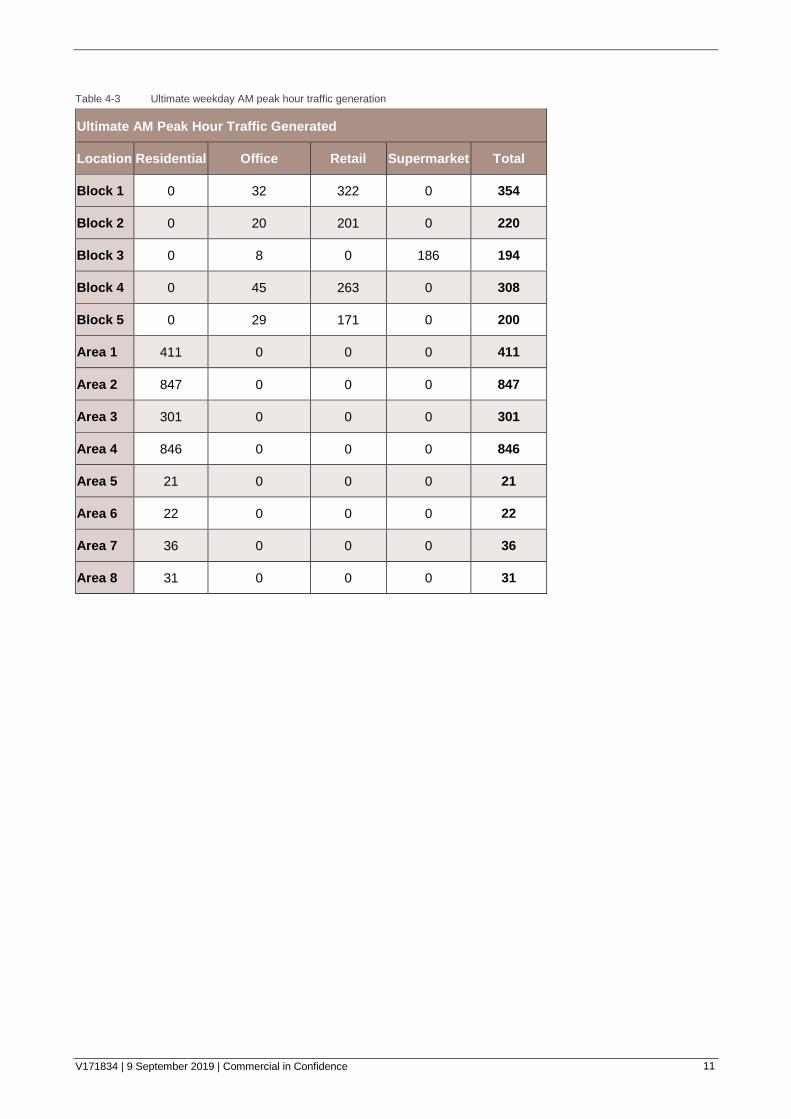
Based on the adopted traffic generation rates and applying the adopted rates to the proposed residential developments and commercial developments, the resulting peak hour traffic generations for the Bannockburn Growth Area are summarised below.
V171834 | 9 September 2019 | Commercial in Confidence 11
Table 4-3 Ultimate weekday AM peak hour traffic generation
Ultimate AM Peak Hour Traffic Generated
Location Residential Office Retail Supermarket Total
Block 1 0 32 322 0 354
Block 2 0 20 201 0 220
Block 3 0 8 0 186 194
Block 4 0 45 263 0 308
Block 5 0 29 171 0 200
Area 1 411 0 0 0 411
Area 2 847 0 0 0 847
Area 3 301 0 0 0 301
Area 4 846 0 0 0 846
Area 5 21 0 0 0 21
Area 6 22 0 0 0 22
Area 7 36 0 0 0 36
Area 8 31 0 0 0 31
V171834 | 9 September 2019 | Commercial in Confidence 12
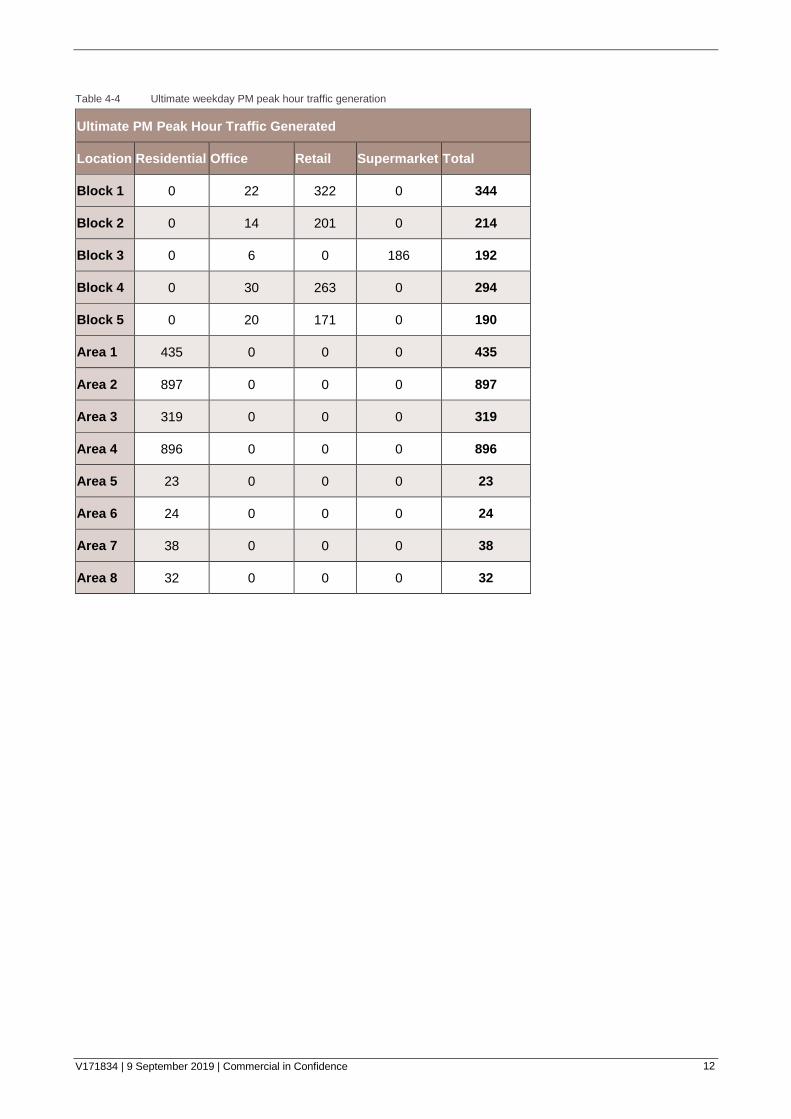
Table 4-4 Ultimate weekday PM peak hour traffic generation
Ultimate PM Peak Hour Traffic Generated
Location Residential Office Retail Supermarket Total
Block 1 0 22 322 0 344
Block 2 0 14 201 0 214
Block 3 0 6 0 186 192
Block 4 0 30 263 0 294
Block 5 0 20 171 0 190
Area 1 435 0 0 0 435
Area 2 897 0 0 0 897
Area 3 319 0 0 0 319
Area 4 896 0 0 0 896
Area 5 23 0 0 0 23
Area 6 24 0 0 0 24
Area 7 38 0 0 0 38
Area 8 32 0 0 0 32
V171834 | 9 September 2019 | Commercial in Confidence 13
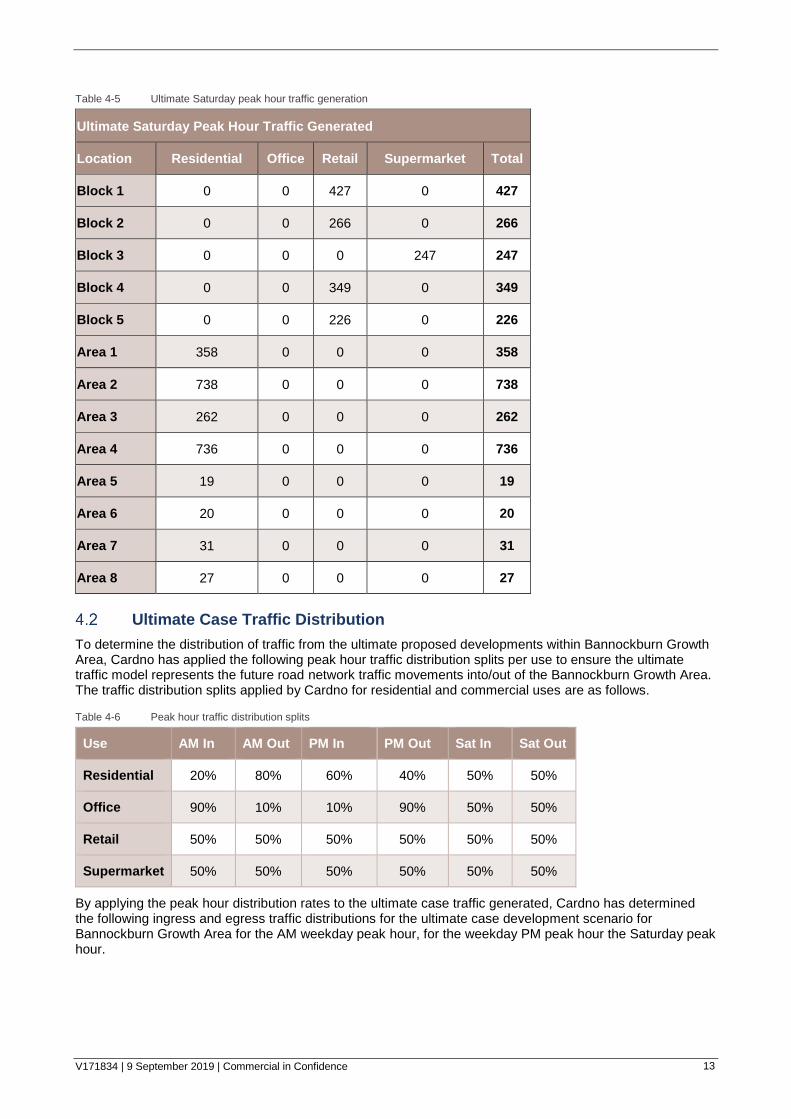
Table 4-5 Ultimate Saturday peak hour traffic generation
Ultimate Saturday Peak Hour Traffic Generated
Location Residential Office Retail Supermarket Total
Block 1 0 0 427 0 427
Block 2 0 0 266 0 266
Block 3 0 0 0 247 247
Block 4 0 0 349 0 349
Block 5 0 0 226 0 226
Area 1 358 0 0 0 358
Area 2 738 0 0 0 738
Area 3 262 0 0 0 262
Area 4 736 0 0 0 736
Area 5 19 0 0 0 19
Area 6 20 0 0 0 20
Area 7 31 0 0 0 31
Area 8 27 0 0 0 27
Ultimate Case Traffic Distribution
To determine the distribution of traffic from the ultimate proposed developments within Bannockburn Growth Area, Cardno has applied the following peak hour traffic distribution splits per use to ensure the ultimate traffic model represents the future road network traffic movements into/out of the Bannockburn Growth Area. The traffic distribution splits applied by Cardno for residential and commercial uses are as follows.
Table 4-6 Peak hour traffic distribution splits
Use AM In AM Out PM In PM Out Sat In Sat Out
Residential 20% 80% 60% 40% 50% 50%
Office 90% 10% 10% 90% 50% 50%
Retail 50% 50% 50% 50% 50% 50%
Supermarket 50% 50% 50% 50% 50% 50%
By applying the peak hour distribution rates to the ultimate case traffic generated, Cardno has determined the following ingress and egress traffic distributions for the ultimate case development scenario for Bannockburn Growth Area for the AM weekday peak hour, for the weekday PM peak hour the Saturday peak hour.
V171834 | 9 September 2019 | Commercial in Confidence 14
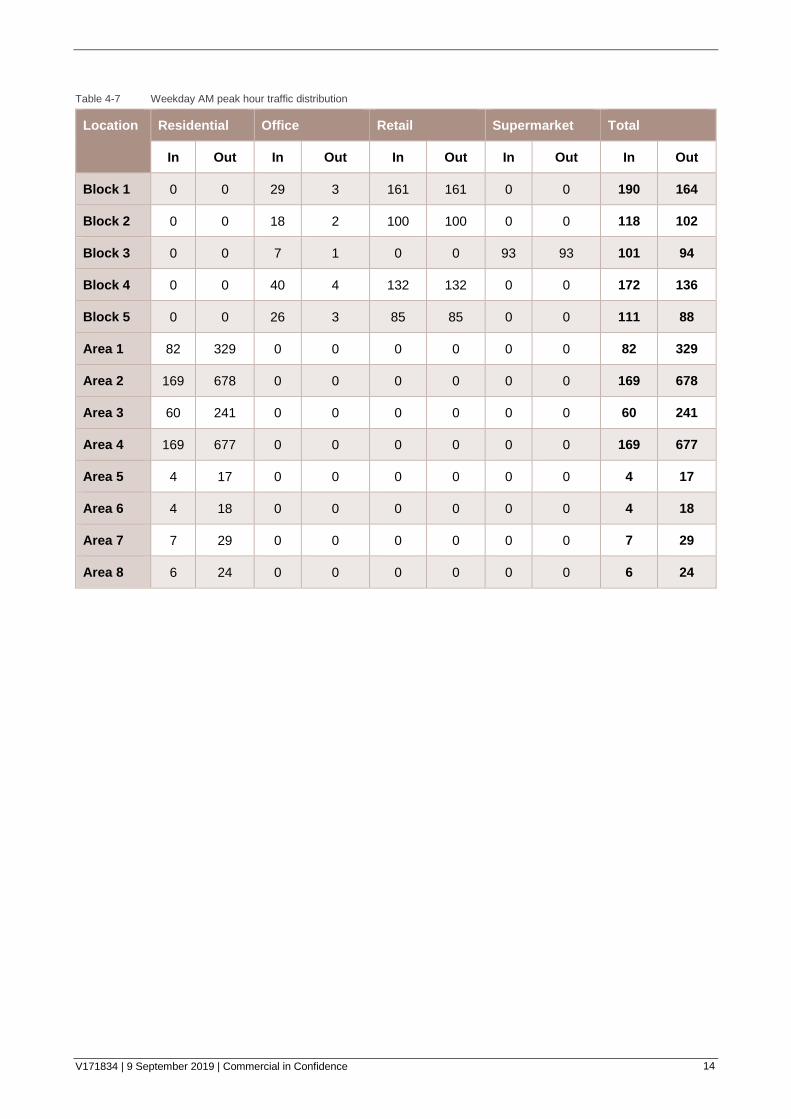
Table 4-7 Weekday AM peak hour traffic distribution
Location Residential Office Retail Supermarket Total
In Out In Out In Out In Out In Out
Block 1 0 0 29 3 161 161 0 0 190 164
Block 2 0 0 18 2 100 100 0 0 118 102
Block 3 0 0 7 1 0 0 93 93 101 94
Block 4 0 0 40 4 132 132 0 0 172 136
Block 5 0 0 26 3 85 85 0 0 111 88
Area 1 82 329 0 0 0 0 0 0 82 329
Area 2 169 678 0 0 0 0 0 0 169 678
Area 3 60 241 0 0 0 0 0 0 60 241
Area 4 169 677 0 0 0 0 0 0 169 677
Area 5 4 17 0 0 0 0 0 0 4 17
Area 6 4 18 0 0 0 0 0 0 4 18
Area 7 7 29 0 0 0 0 0 0 7 29
Area 8 6 24 0 0 0 0 0 0 6 24
V171834 | 9 September 2019 | Commercial in Confidence 15
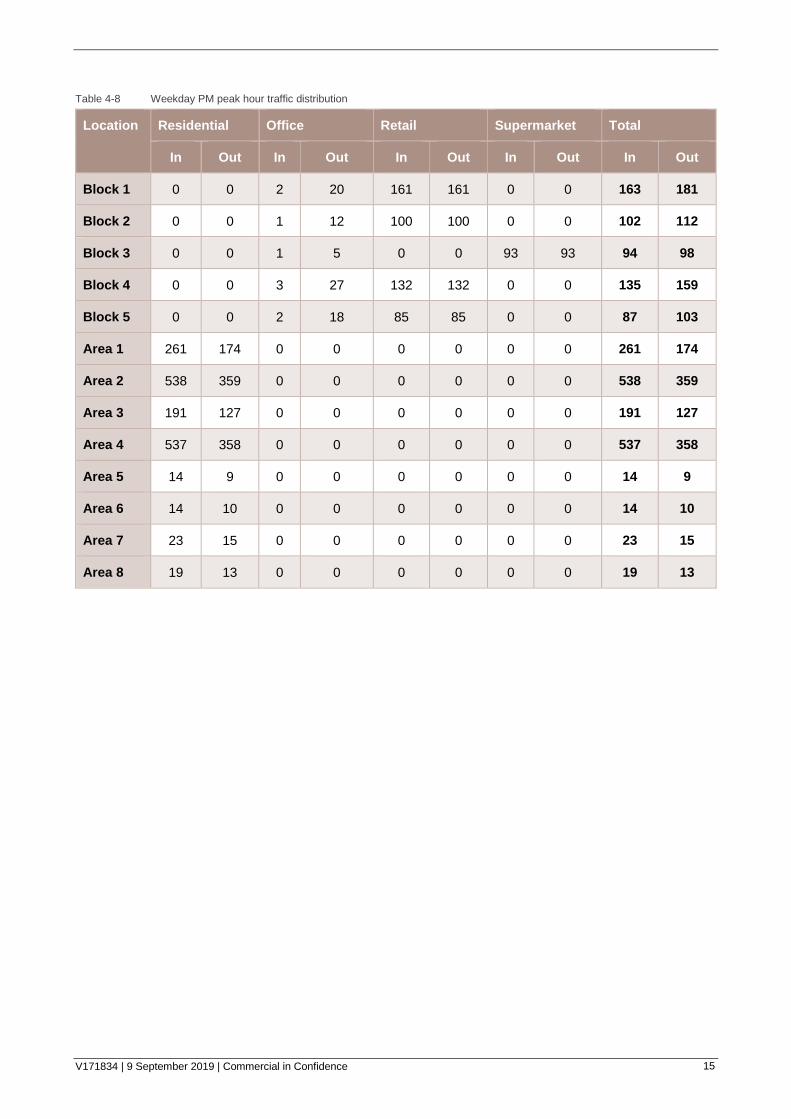
Table 4-8 Weekday PM peak hour traffic distribution
Location Residential Office Retail Supermarket Total
In Out In Out In Out In Out In Out
Block 1 0 0 2 20 161 161 0 0 163 181
Block 2 0 0 1 12 100 100 0 0 102 112
Block 3 0 0 1 5 0 0 93 93 94 98
Block 4 0 0 3 27 132 132 0 0 135 159
Block 5 0 0 2 18 85 85 0 0 87 103
Area 1 261 174 0 0 0 0 0 0 261 174
Area 2 538 359 0 0 0 0 0 0 538 359
Area 3 191 127 0 0 0 0 0 0 191 127
Area 4 537 358 0 0 0 0 0 0 537 358
Area 5 14 9 0 0 0 0 0 0 14 9
Area 6 14 10 0 0 0 0 0 0 14 10
Area 7 23 15 0 0 0 0 0 0 23 15
Area 8 19 13 0 0 0 0 0 0 19 13

V171834 | 9 September 2019 | Commercial in Confidence 16
Table 4-9 Saturday peak hour traffic distributions
Location Residential Office Retail Supermarket Total
In Out In Out In Out In Out In Out
Block 1 0 0 0 0 214 214 0 0 214 214
Block 2 0 0 0 0 133 133 0 0 133 133
Block 3 0 0 0 0 0 0 124 124 124 124
Block 4 0 0 0 0 175 175 0 0 175 175
Block 5 0 0 0 0 113 113 0 0 113 113
Area 1 179 179 0 0 0 0 0 0 179 179
Area 2 369 369 0 0 0 0 0 0 369 369
Area 3 131 131 0 0 0 0 0 0 131 131
Area 4 368 368 0 0 0 0 0 0 368 368
Area 5 9 9 0 0 0 0 0 0 9 9
Area 6 10 10 0 0 0 0 0 0 10 10
Area 7 16 16 0 0 0 0 0 0 16 16
Area 8 13 13 0 0 0 0 0 0 13 13
V171834 | 9 September 2019 | Commercial in Confidence 17
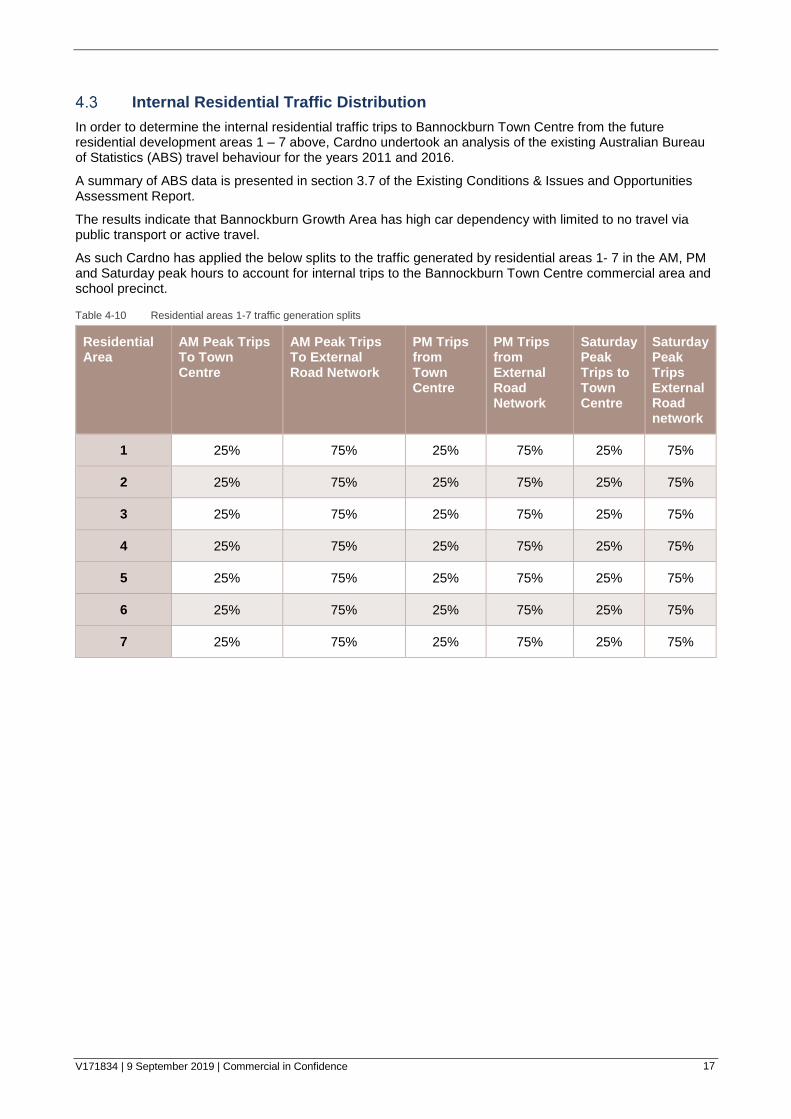
Internal Residential Traffic Distribution
In order to determine the internal residential traffic trips to Bannockburn Town Centre from the future residential development areas 1 – 7 above, Cardno undertook an analysis of the existing Australian Bureau of Statistics (ABS) travel behaviour for the years 2011 and 2016.
A summary of ABS data is presented in section 3.7 of the Existing Conditions & Issues and Opportunities Assessment Report.
The results indicate that Bannockburn Growth Area has high car dependency with limited to no travel via public transport or active travel.
As such Cardno has applied the below splits to the traffic generated by residential areas 1- 7 in the AM, PM and Saturday peak hours to account for internal trips to the Bannockburn Town Centre commercial area and school precinct.
Table 4-10 Residential areas 1-7 traffic generation splits
Residential Area
AM Peak Trips To Town Centre
AM Peak Trips To External Road Network
PM Trips from Town Centre
PM Trips from External Road Network
Saturday Peak Trips to Town Centre
Saturday Peak Trips External Road network
1 25% 75% 25% 75% 25% 75%
2 25% 75% 25% 75% 25% 75%
3 25% 75% 25% 75% 25% 75%
4 25% 75% 25% 75% 25% 75%
5 25% 75% 25% 75% 25% 75%
6 25% 75% 25% 75% 25% 75%
7 25% 75% 25% 75% 25% 75%
V171834 | 9 September 2019 | Commercial in Confidence 18
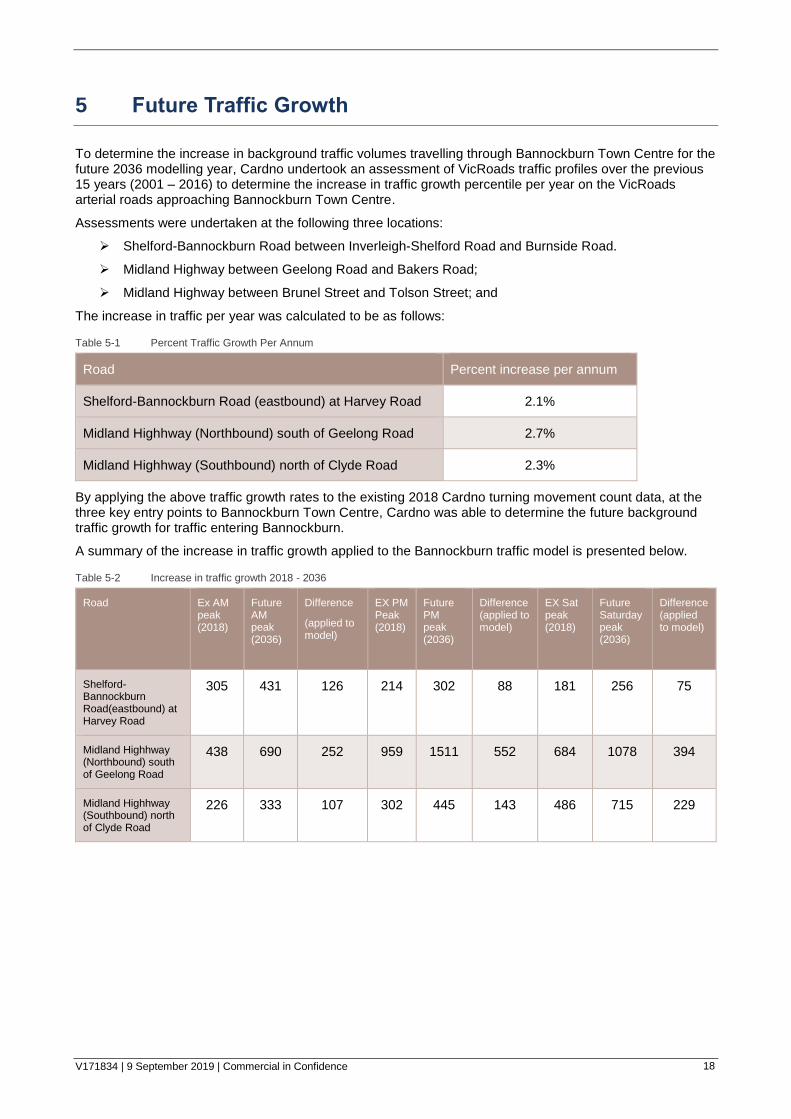
5 Future Traffic Growth
To determine the increase in background traffic volumes travelling through Bannockburn Town Centre for the future 2036 modelling year, Cardno undertook an assessment of VicRoads traffic profiles over the previous 15 years (2001 – 2016) to determine the increase in traffic growth percentile per year on the VicRoads arterial roads approaching Bannockburn Town Centre.
Assessments were undertaken at the following three locations:
Shelford-Bannockburn Road between Inverleigh-Shelford Road and Burnside Road.
Midland Highway between Geelong Road and Bakers Road;
Midland Highway between Brunel Street and Tolson Street; and
The increase in traffic per year was calculated to be as follows:
Table 5-1 Percent Traffic Growth Per Annum
Road Percent increase per annum
Shelford-Bannockburn Road (eastbound) at Harvey Road 2.1%
Midland Highhway (Northbound) south of Geelong Road 2.7%
Midland Highhway (Southbound) north of Clyde Road 2.3%
By applying the above traffic growth rates to the existing 2018 Cardno turning movement count data, at the three key entry points to Bannockburn Town Centre, Cardno was able to determine the future background traffic growth for traffic entering Bannockburn.
A summary of the increase in traffic growth applied to the Bannockburn traffic model is presented below.
Table 5-2 Increase in traffic growth 2018 - 2036
Road Ex AM peak (2018)
Future AM peak (2036)
Difference
(applied to model)
EX PM Peak (2018)
Future PM peak (2036)
Difference (applied to model)
EX Sat peak (2018)
Future Saturday peak (2036)
Difference (applied to model)
Shelford-Bannockburn Road(eastbound) at Harvey Road
305 431 126 214 302 88 181 256 75
Midland Highhway (Northbound) south of Geelong Road
438 690 252 959 1511 552 684 1078 394
Midland Highhway (Southbound) north of Clyde Road
226 333 107 302 445 143 486 715 229
V171834 | 9 September 2019 | Commercial in Confidence 19
6 Intersection Analysis
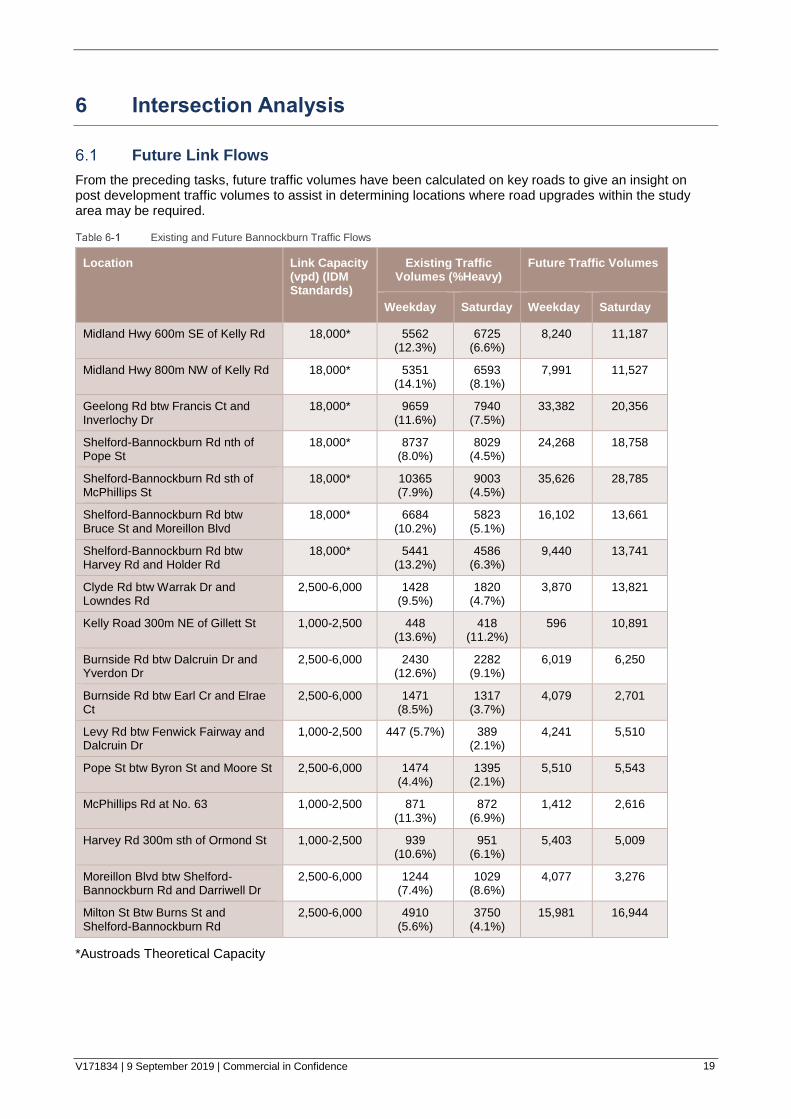
Future Link Flows
From the preceding tasks, future traffic volumes have been calculated on key roads to give an insight on post development traffic volumes to assist in determining locations where road upgrades within the study area may be required.
Existing and Future Bannockburn Traffic Flows
Location Link Capacity (vpd) (IDM Standards)
Existing Traffic Volumes (%Heavy)
Future Traffic Volumes
Weekday Saturday Weekday Saturday
Midland Hwy 600m SE of Kelly Rd 18,000* 5562 (12.3%)
6725 (6.6%)
8,240 11,187
Midland Hwy 800m NW of Kelly Rd 18,000* 5351 (14.1%)
6593 (8.1%)
7,991 11,527
Geelong Rd btw Francis Ct and Inverlochy Dr
18,000* 9659 (11.6%)
7940 (7.5%)
33,382 20,356
Shelford-Bannockburn Rd nth of Pope St
18,000* 8737 (8.0%)
8029 (4.5%)
24,268 18,758
Shelford-Bannockburn Rd sth of McPhillips St
18,000* 10365 (7.9%)
9003 (4.5%)
35,626 28,785
Shelford-Bannockburn Rd btw Bruce St and Moreillon Blvd
18,000* 6684 (10.2%)
5823 (5.1%)
16,102 13,661
Shelford-Bannockburn Rd btw Harvey Rd and Holder Rd
18,000* 5441 (13.2%)
4586 (6.3%)
9,440 13,741
Clyde Rd btw Warrak Dr and Lowndes Rd
2,500-6,000 1428 (9.5%)
1820 (4.7%)
3,870 13,821
Kelly Road 300m NE of Gillett St 1,000-2,500 448 (13.6%)
418 (11.2%)
596 10,891
Burnside Rd btw Dalcruin Dr and Yverdon Dr
2,500-6,000 2430 (12.6%)
2282 (9.1%)
6,019 6,250
Burnside Rd btw Earl Cr and Elrae Ct
2,500-6,000 1471 (8.5%)
1317 (3.7%)
4,079 2,701
Levy Rd btw Fenwick Fairway and Dalcruin Dr
1,000-2,500 447 (5.7%) 389 (2.1%)
4,241 5,510
Pope St btw Byron St and Moore St 2,500-6,000 1474 (4.4%)
1395 (2.1%)
5,510 5,543
McPhillips Rd at No. 63 1,000-2,500 871 (11.3%)
872 (6.9%)
1,412 2,616
Harvey Rd 300m sth of Ormond St 1,000-2,500 939 (10.6%)
951 (6.1%)
5,403 5,009
Moreillon Blvd btw Shelford-Bannockburn Rd and Darriwell Dr
2,500-6,000 1244 (7.4%)
1029 (8.6%)
4,077 3,276
Milton St Btw Burns St and Shelford-Bannockburn Rd
2,500-6,000 4910 (5.6%)
3750 (4.1%)
15,981 16,944
*Austroads Theoretical Capacity
V171834 | 9 September 2019 | Commercial in Confidence 20
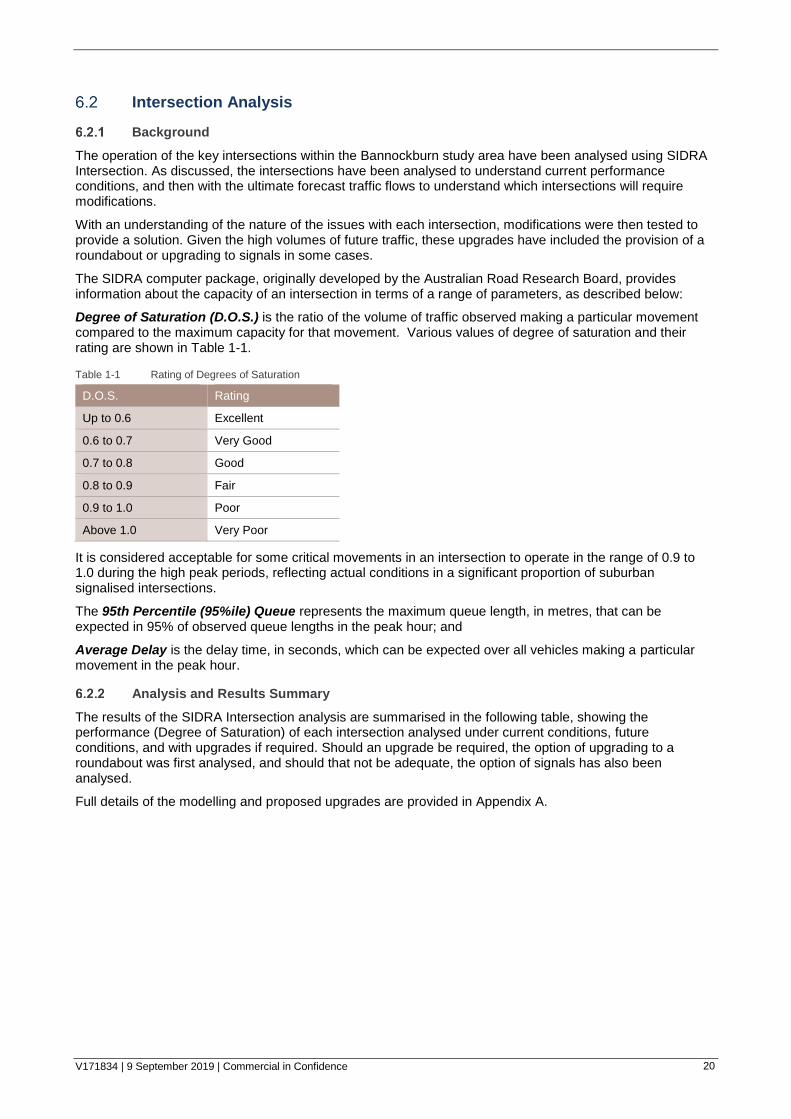
Intersection Analysis
Background
The operation of the key intersections within the Bannockburn study area have been analysed using SIDRA Intersection. As discussed, the intersections have been analysed to understand current performance conditions, and then with the ultimate forecast traffic flows to understand which intersections will require modifications.
With an understanding of the nature of the issues with each intersection, modifications were then tested to provide a solution. Given the high volumes of future traffic, these upgrades have included the provision of a roundabout or upgrading to signals in some cases.
The SIDRA computer package, originally developed by the Australian Road Research Board, provides information about the capacity of an intersection in terms of a range of parameters, as described below:
Degree of Saturation (D.O.S.) is the ratio of the volume of traffic observed making a particular movement compared to the maximum capacity for that movement. Various values of degree of saturation and their rating are shown in Table 1-1.
Table 1-1 Rating of Degrees of Saturation
D.O.S. Rating
Up to 0.6 Excellent
0.6 to 0.7 Very Good
0.7 to 0.8 Good
0.8 to 0.9 Fair
0.9 to 1.0 Poor
Above 1.0 Very Poor
It is considered acceptable for some critical movements in an intersection to operate in the range of 0.9 to 1.0 during the high peak periods, reflecting actual conditions in a significant proportion of suburban signalised intersections.
The 95th Percentile (95%ile) Queue represents the maximum queue length, in metres, that can be expected in 95% of observed queue lengths in the peak hour; and
Average Delay is the delay time, in seconds, which can be expected over all vehicles making a particular movement in the peak hour.
Analysis and Results Summary
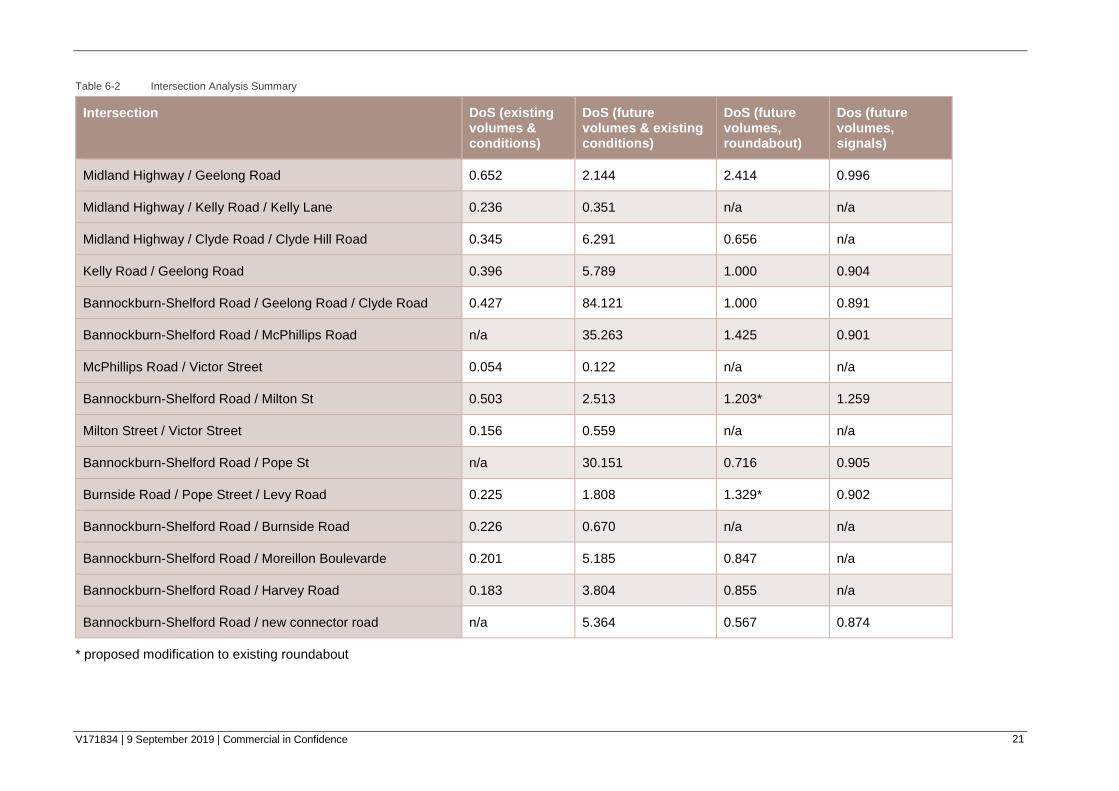
The results of the SIDRA Intersection analysis are summarised in the following table, showing the performance (Degree of Saturation) of each intersection analysed under current conditions, future conditions, and with upgrades if required. Should an upgrade be required, the option of upgrading to a roundabout was first analysed, and should that not be adequate, the option of signals has also been analysed.
Full details of the modelling and proposed upgrades are provided in Appendix A.
V171834 | 9 September 2019 | Commercial in Confidence 21
Table 6-2 Intersection Analysis Summary
Intersection DoS (existing volumes & conditions)
DoS (future volumes & existing conditions)
DoS (future volumes, roundabout)
Dos (future volumes, signals)
Midland Highway / Geelong Road 0.652 2.144 2.414 0.996
Midland Highway / Kelly Road / Kelly Lane 0.236 0.351 n/a n/a
Midland Highway / Clyde Road / Clyde Hill Road 0.345 6.291 0.656 n/a
Kelly Road / Geelong Road 0.396 5.789 1.000 0.904
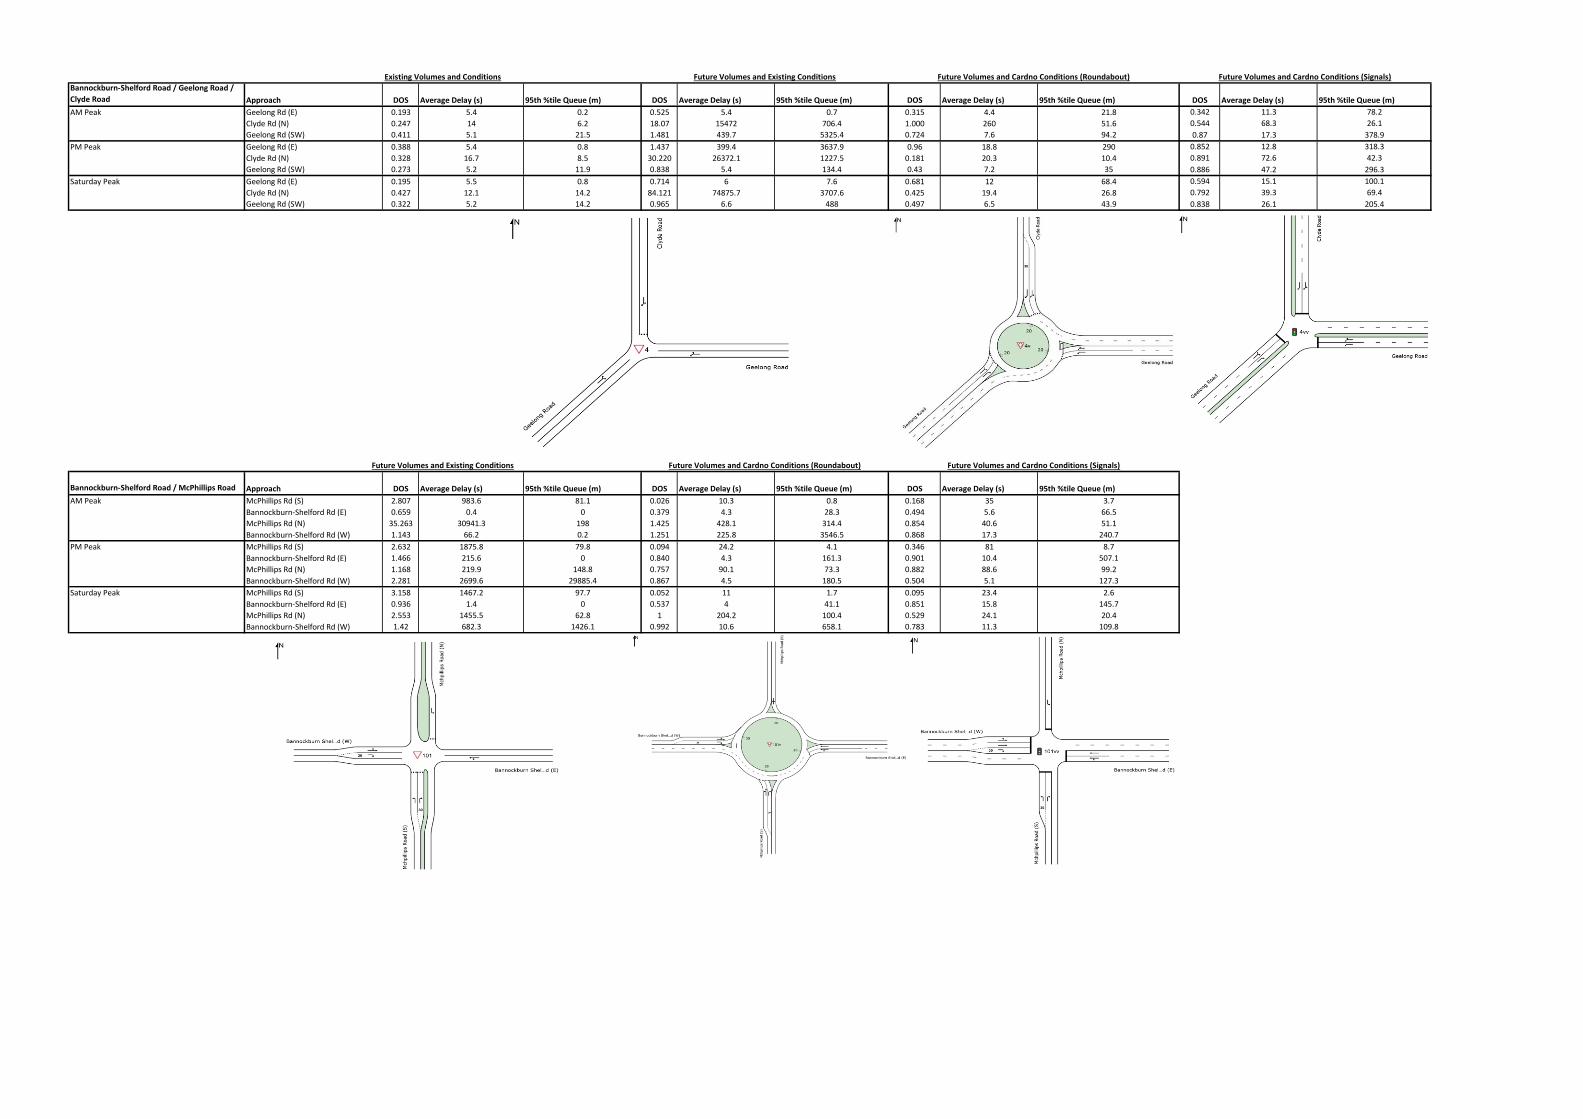
Bannockburn-Shelford Road / Geelong Road / Clyde Road 0.427 84.121 1.000 0.891
Bannockburn-Shelford Road / McPhillips Road n/a 35.263 1.425 0.901
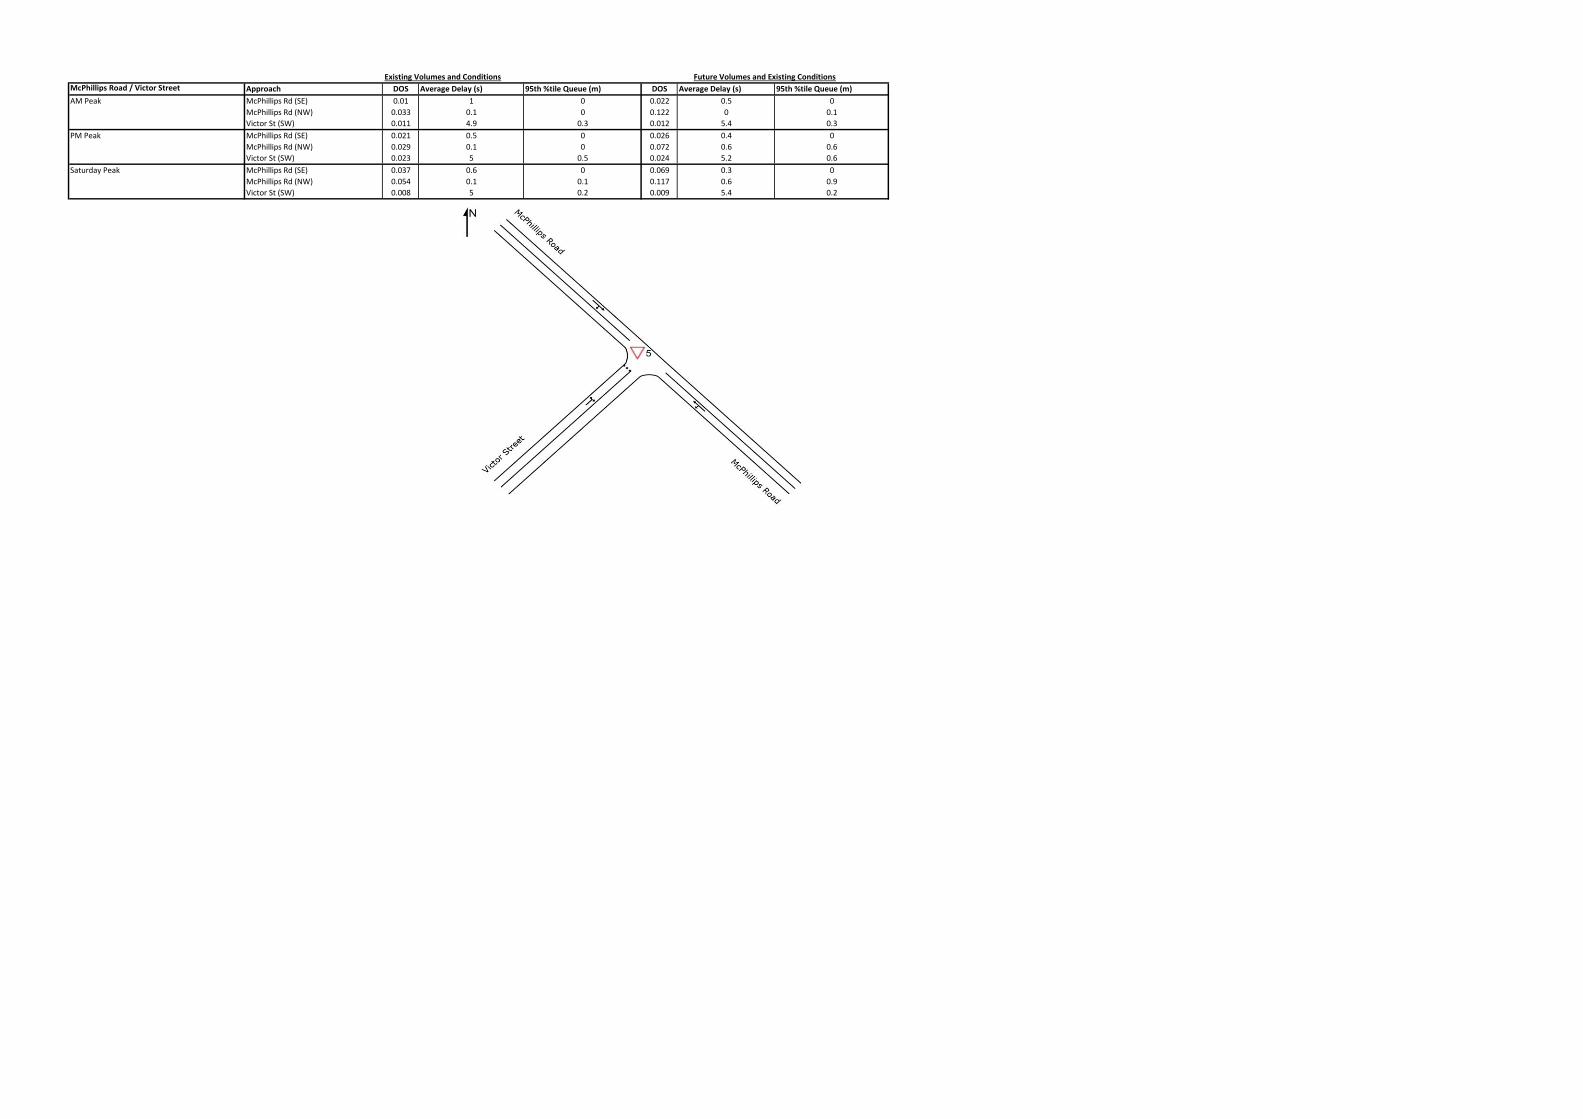
McPhillips Road / Victor Street 0.054 0.122 n/a n/a
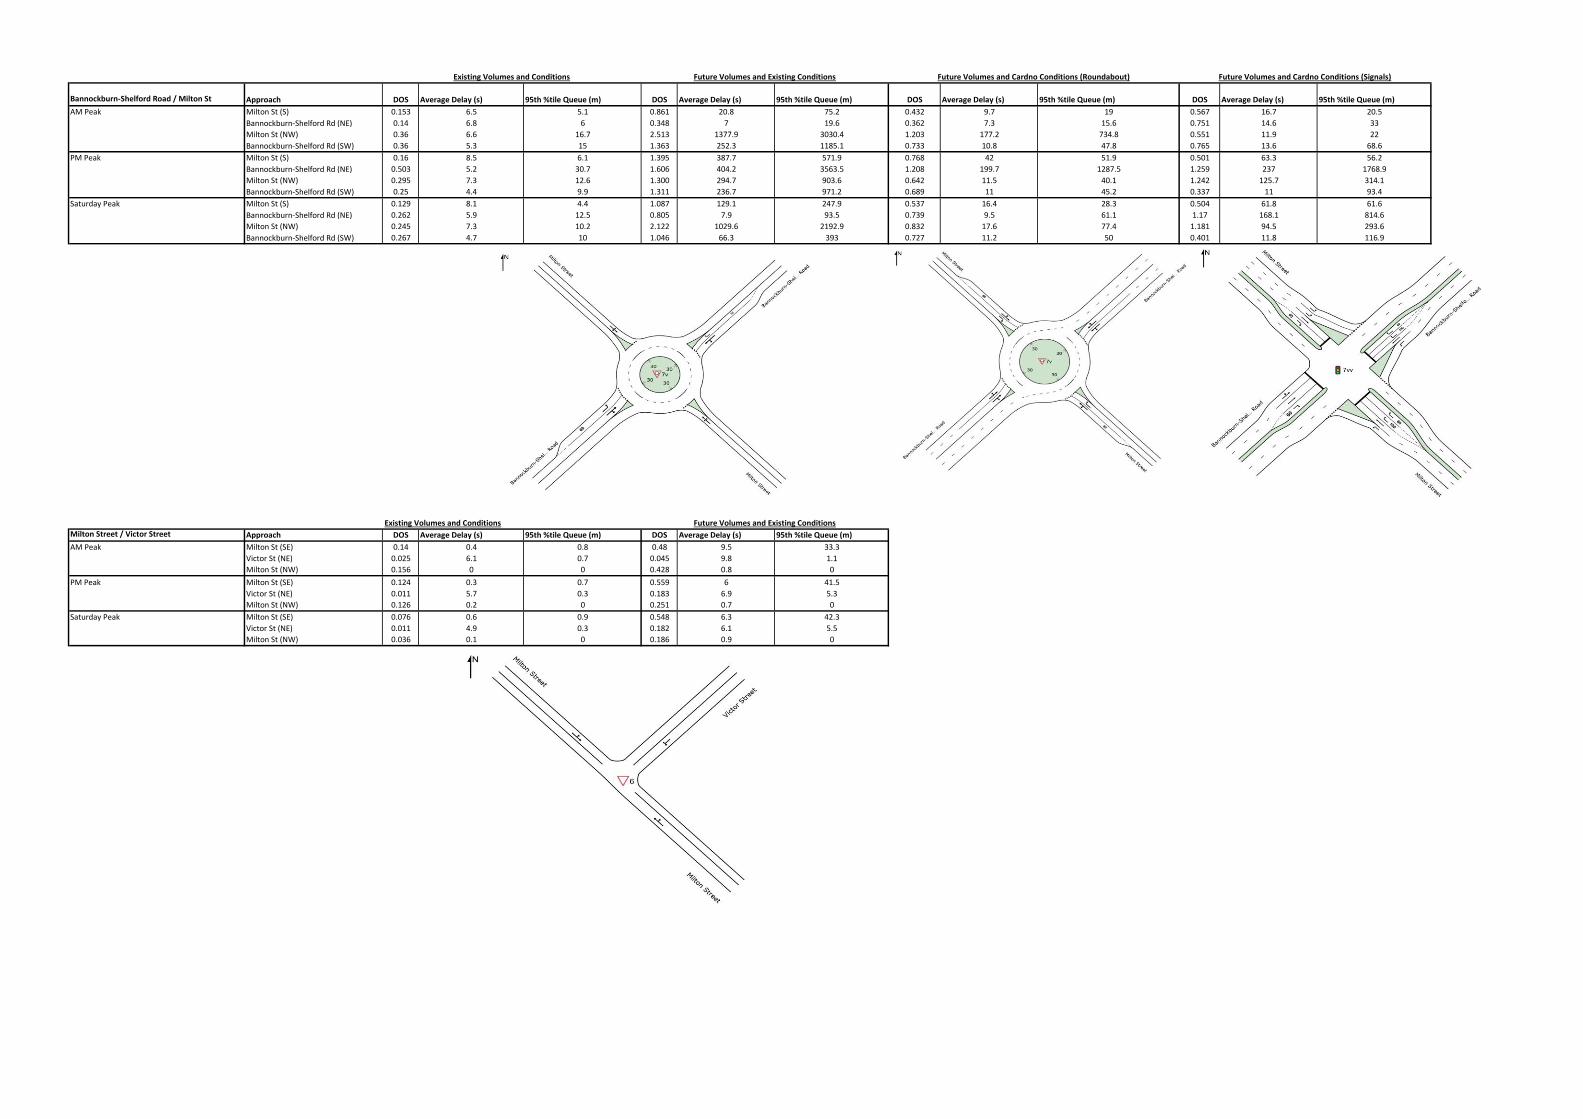
Bannockburn-Shelford Road / Milton St 0.503 2.513 1.203* 1.259
Milton Street / Victor Street 0.156 0.559 n/a n/a
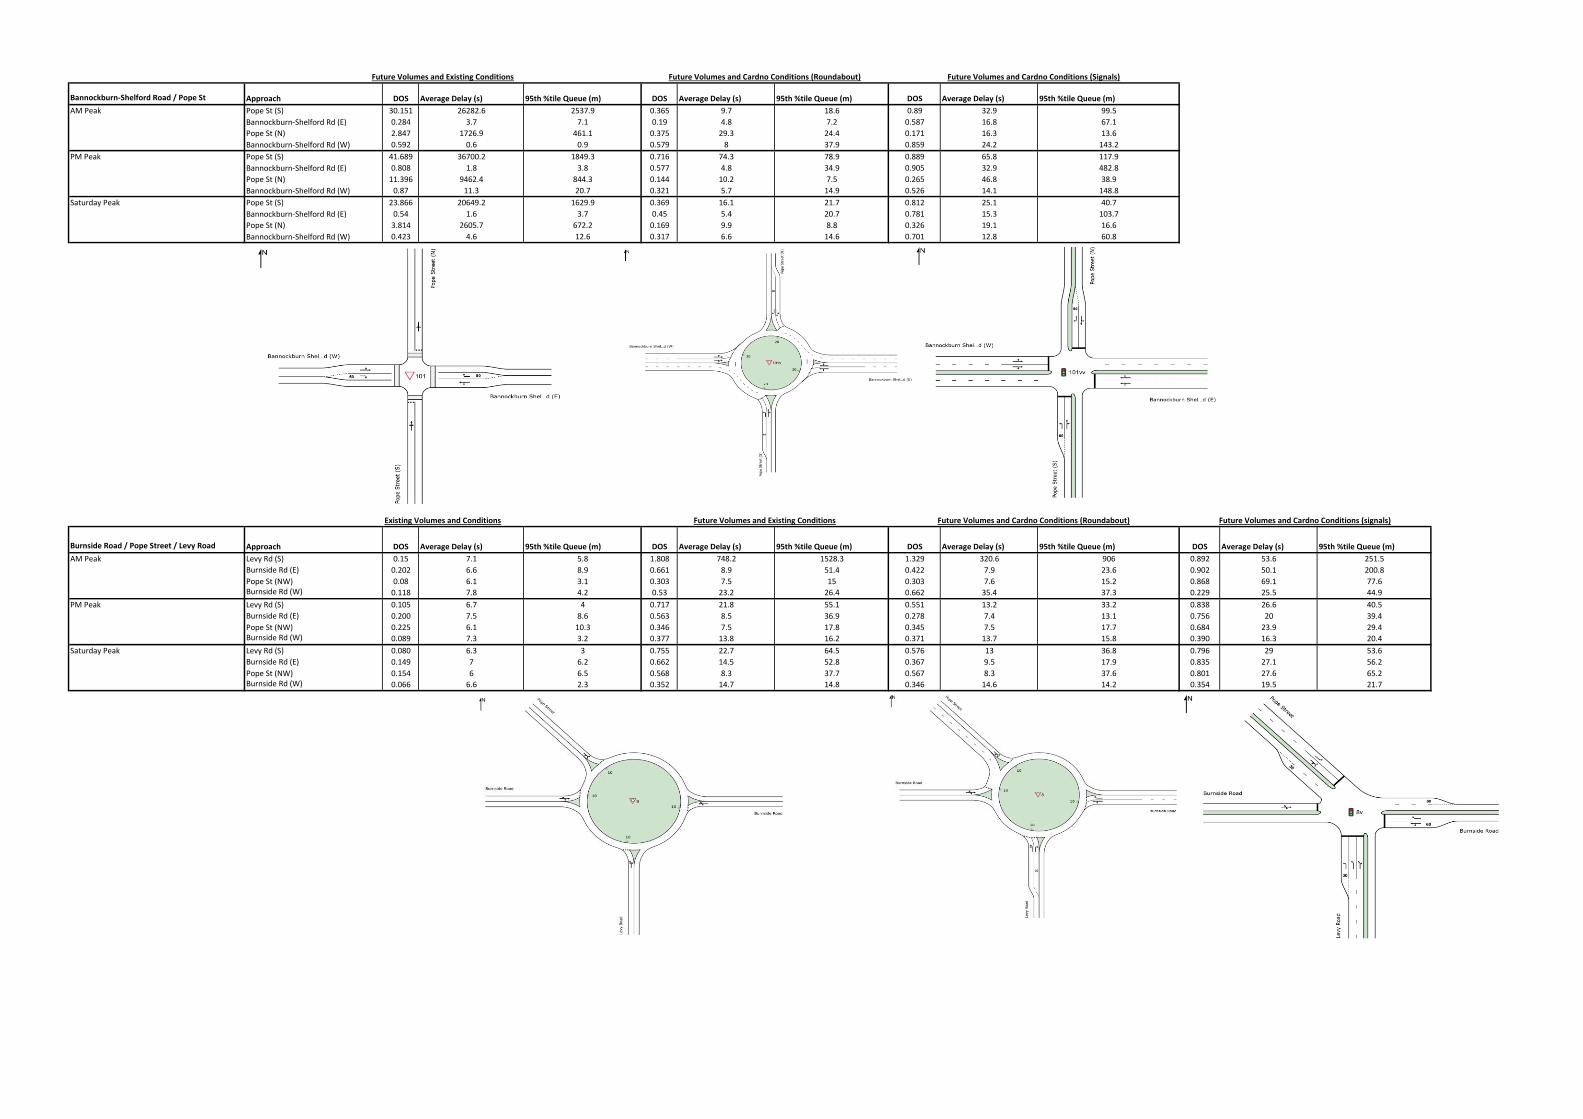
Bannockburn-Shelford Road / Pope St n/a 30.151 0.716 0.905
Burnside Road / Pope Street / Levy Road 0.225 1.808 1.329* 0.902
Bannockburn-Shelford Road / Burnside Road 0.226 0.670 n/a n/a
Bannockburn-Shelford Road / Moreillon Boulevarde 0.201 5.185 0.847 n/a
Bannockburn-Shelford Road / Harvey Road 0.183 3.804 0.855 n/a
Bannockburn-Shelford Road / new connector road n/a 5.364 0.567 0.874
* proposed modification to existing roundabout
V171834 | 9 September 2019 | Commercial in Confidence 2
Traffic Modelling Report
APPENDIX
INTERSECTION ANALYSIS DETAILS
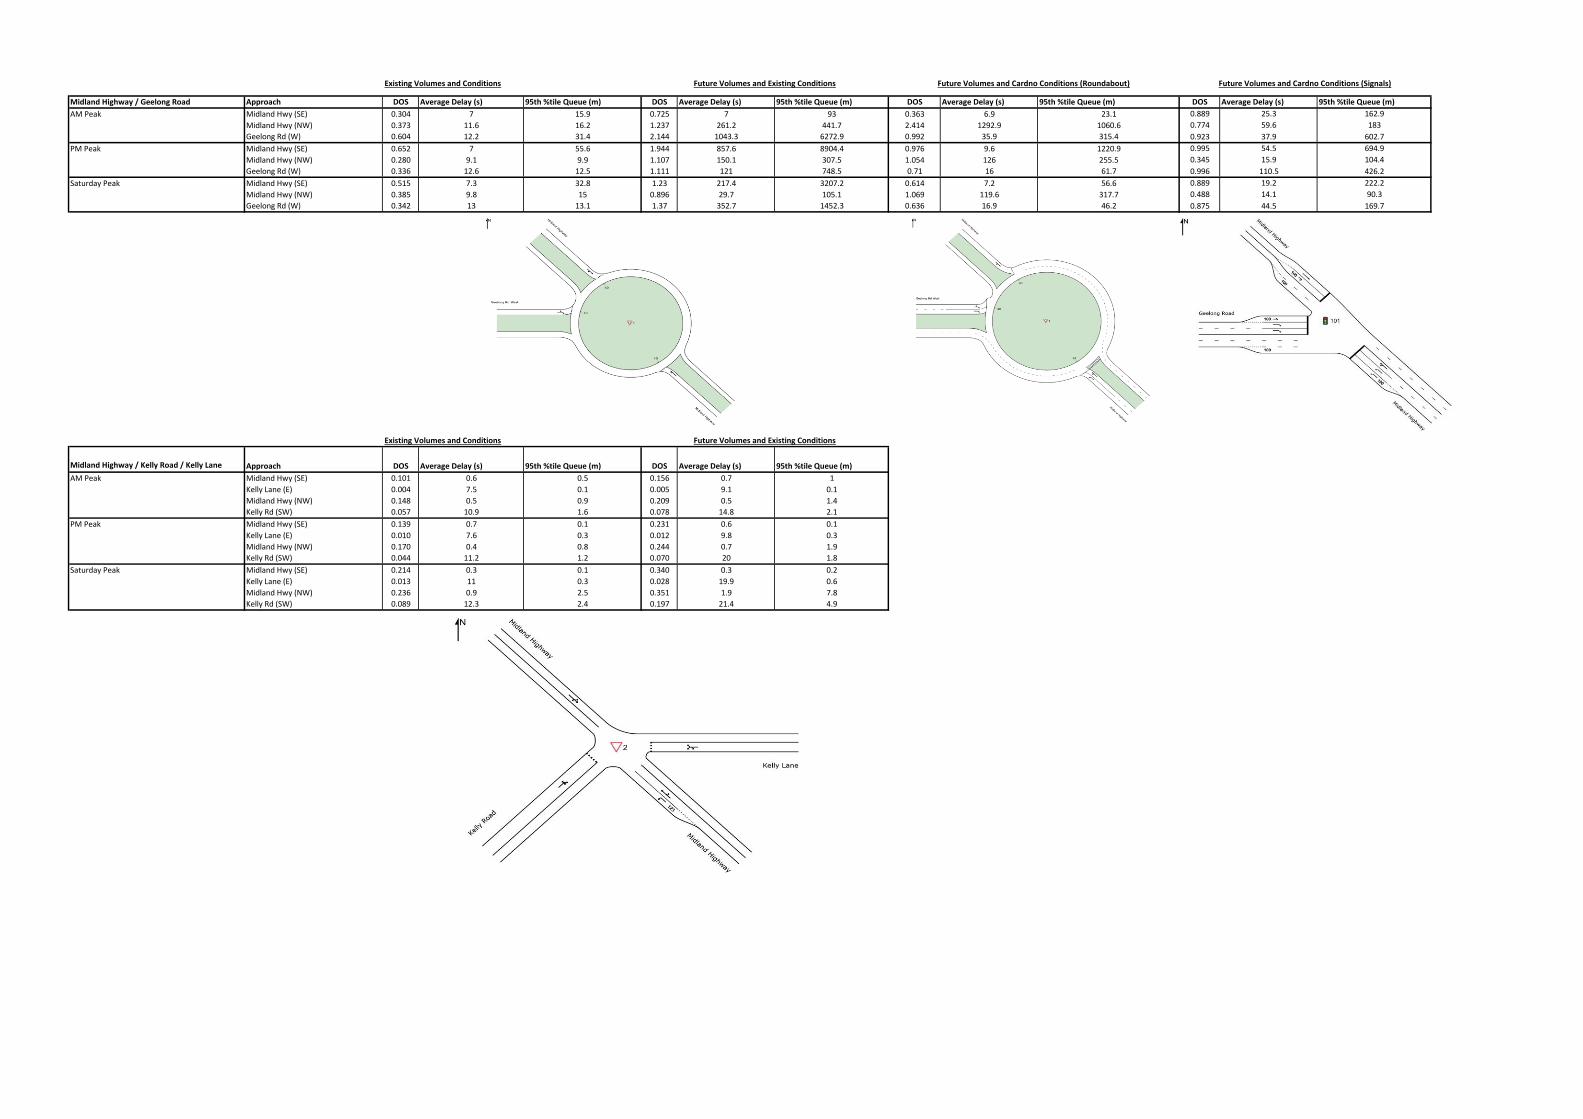
Midland Highway / Geelong Road Approach DOS Average Delay (s) 95th %tile Queue (m) DOS Average Delay (s) 95th %tile Queue (m) DOS Average Delay (s) 95th %tile Queue (m) DOS Average Delay (s) 95th %tile Queue (m)
AM Peak Midland Hwy (SE) 0.304 7 15.9 0.725 7 93 0.363 6.9 23.1 0.889 25.3 162.9
Midland Hwy (NW) 0.373 11.6 16.2 1.237 261.2 441.7 2.414 1292.9 1060.6 0.774 59.6 183
Geelong Rd (W) 0.604 12.2 31.4 2.144 1043.3 6272.9 0.992 35.9 315.4 0.923 37.9 602.7
PM Peak Midland Hwy (SE) 0.652 7 55.6 1.944 857.6 8904.4 0.976 9.6 1220.9 0.995 54.5 694.9
Midland Hwy (NW) 0.280 9.1 9.9 1.107 150.1 307.5 1.054 126 255.5 0.345 15.9 104.4
Geelong Rd (W) 0.336 12.6 12.5 1.111 121 748.5 0.71 16 61.7 0.996 110.5 426.2
Saturday Peak Midland Hwy (SE) 0.515 7.3 32.8 1.23 217.4 3207.2 0.614 7.2 56.6 0.889 19.2 222.2
Midland Hwy (NW) 0.385 9.8 15 0.896 29.7 105.1 1.069 119.6 317.7 0.488 14.1 90.3
Geelong Rd (W) 0.342 13 13.1 1.37 352.7 1452.3 0.636 16.9 46.2 0.875 44.5 169.7
Midland Highway / Kelly Road / Kelly Lane Approach DOS Average Delay (s) 95th %tile Queue (m) DOS Average Delay (s) 95th %tile Queue (m)
AM Peak Midland Hwy (SE) 0.101 0.6 0.5 0.156 0.7 1
Kelly Lane (E) 0.004 7.5 0.1 0.005 9.1 0.1
Midland Hwy (NW) 0.148 0.5 0.9 0.209 0.5 1.4
Kelly Rd (SW) 0.057 10.9 1.6 0.078 14.8 2.1
PM Peak Midland Hwy (SE) 0.139 0.7 0.1 0.231 0.6 0.1
Kelly Lane (E) 0.010 7.6 0.3 0.012 9.8 0.3
Midland Hwy (NW) 0.170 0.4 0.8 0.244 0.7 1.9
Kelly Rd (SW) 0.044 11.2 1.2 0.070 20 1.8
Saturday Peak Midland Hwy (SE) 0.214 0.3 0.1 0.340 0.3 0.2
Kelly Lane (E) 0.013 11 0.3 0.028 19.9 0.6
Midland Hwy (NW) 0.236 0.9 2.5 0.351 1.9 7.8
Kelly Rd (SW) 0.089 12.3 2.4 0.197 21.4 4.9
Existing Volumes and Conditions Future Volumes and Existing Conditions
Future Volumes and Existing Conditions Future Volumes and Cardno Conditions (Roundabout)Existing Volumes and Conditions Future Volumes and Cardno Conditions (Signals)
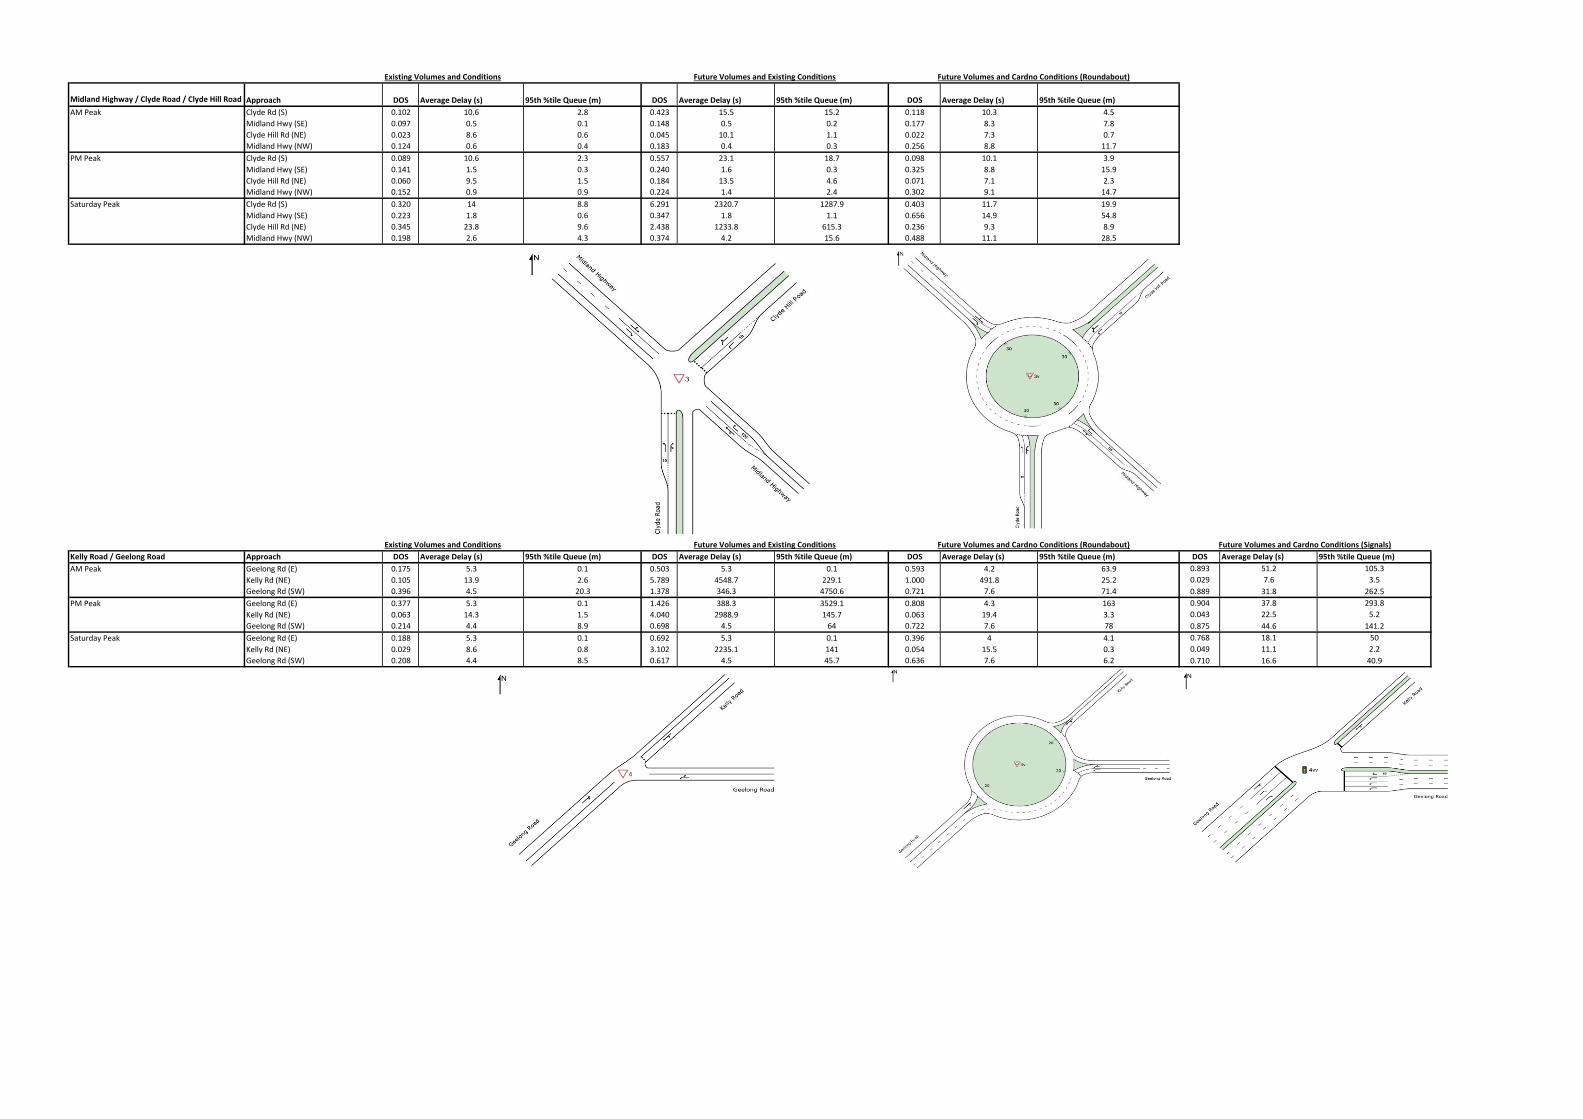
Midland Highway / Clyde Road / Clyde Hill Road Approach DOS Average Delay (s) 95th %tile Queue (m) DOS Average Delay (s) 95th %tile Queue (m) DOS Average Delay (s) 95th %tile Queue (m)
AM Peak Clyde Rd (S) 0.102 10.6 2.8 0.423 15.5 15.2 0.118 10.3 4.5
Midland Hwy (SE) 0.097 0.5 0.1 0.148 0.5 0.2 0.177 8.3 7.8
Clyde Hill Rd (NE) 0.023 8.6 0.6 0.045 10.1 1.1 0.022 7.3 0.7
Midland Hwy (NW) 0.124 0.6 0.4 0.183 0.4 0.3 0.256 8.8 11.7
PM Peak Clyde Rd (S) 0.089 10.6 2.3 0.557 23.1 18.7 0.098 10.1 3.9
Midland Hwy (SE) 0.141 1.5 0.3 0.240 1.6 0.3 0.325 8.8 15.9
Clyde Hill Rd (NE) 0.060 9.5 1.5 0.184 13.5 4.6 0.071 7.1 2.3
Midland Hwy (NW) 0.152 0.9 0.9 0.224 1.4 2.4 0.302 9.1 14.7
Saturday Peak Clyde Rd (S) 0.320 14 8.8 6.291 2320.7 1287.9 0.403 11.7 19.9
Midland Hwy (SE) 0.223 1.8 0.6 0.347 1.8 1.1 0.656 14.9 54.8
Clyde Hill Rd (NE) 0.345 23.8 9.6 2.438 1233.8 615.3 0.236 9.3 8.9
Midland Hwy (NW) 0.198 2.6 4.3 0.374 4.2 15.6 0.488 11.1 28.5
Kelly Road / Geelong Road Approach DOS Average Delay (s) 95th %tile Queue (m) DOS Average Delay (s) 95th %tile Queue (m) DOS Average Delay (s) 95th %tile Queue (m) DOS Average Delay (s) 95th %tile Queue (m)
AM Peak Geelong Rd (E) 0.175 5.3 0.1 0.503 5.3 0.1 0.593 4.2 63.9 0.893 51.2 105.3
Kelly Rd (NE) 0.105 13.9 2.6 5.789 4548.7 229.1 1.000 491.8 25.2 0.029 7.6 3.5
Geelong Rd (SW) 0.396 4.5 20.3 1.378 346.3 4750.6 0.721 7.6 71.4 0.889 31.8 262.5
PM Peak Geelong Rd (E) 0.377 5.3 0.1 1.426 388.3 3529.1 0.808 4.3 163 0.904 37.8 293.8
Kelly Rd (NE) 0.063 14.3 1.5 4.040 2988.9 145.7 0.063 19.4 3.3 0.043 22.5 5.2
Geelong Rd (SW) 0.214 4.4 8.9 0.698 4.5 64 0.722 7.6 78 0.875 44.6 141.2
Saturday Peak Geelong Rd (E) 0.188 5.3 0.1 0.692 5.3 0.1 0.396 4 4.1 0.768 18.1 50
Kelly Rd (NE) 0.029 8.6 0.8 3.102 2235.1 141 0.054 15.5 0.3 0.049 11.1 2.2
Geelong Rd (SW) 0.208 4.4 8.5 0.617 4.5 45.7 0.636 7.6 6.2 0.710 16.6 40.9
Existing Volumes and Conditions Future Volumes and Existing Conditions Future Volumes and Cardno Conditions (Roundabout) Future Volumes and Cardno Conditions (Signals)
Existing Volumes and Conditions Future Volumes and Existing Conditions Future Volumes and Cardno Conditions (Roundabout)
Bannockburn-Shelford Road / Geelong Road /
Clyde Road Approach DOS Average Delay (s) 95th %tile Queue (m) DOS Average Delay (s) 95th %tile Queue (m) DOS Average Delay (s) 95th %tile Queue (m) DOS Average Delay (s) 95th %tile Queue (m)
AM Peak Geelong Rd (E) 0.193 5.4 0.2 0.525 5.4 0.7 0.315 4.4 21.8 0.342 11.3 78.2
Clyde Rd (N) 0.247 14 6.2 18.07 15472 706.4 1.000 260 51.6 0.544 68.3 26.1
Geelong Rd (SW) 0.411 5.1 21.5 1.481 439.7 5325.4 0.724 7.6 94.2 0.87 17.3 378.9
PM Peak Geelong Rd (E) 0.388 5.4 0.8 1.437 399.4 3637.9 0.96 18.8 290 0.852 12.8 318.3
Clyde Rd (N) 0.328 16.7 8.5 30.220 26372.1 1227.5 0.181 20.3 10.4 0.891 72.6 42.3
Geelong Rd (SW) 0.273 5.2 11.9 0.838 5.4 134.4 0.43 7.2 35 0.886 47.2 296.3
Saturday Peak Geelong Rd (E) 0.195 5.5 0.8 0.714 6 7.6 0.681 12 68.4 0.594 15.1 100.1
Clyde Rd (N) 0.427 12.1 14.2 84.121 74875.7 3707.6 0.425 19.4 26.8 0.792 39.3 69.4
Geelong Rd (SW) 0.322 5.2 14.2 0.965 6.6 488 0.497 6.5 43.9 0.838 26.1 205.4
Bannockburn-Shelford Road / McPhillips Road Approach DOS Average Delay (s) 95th %tile Queue (m) DOS Average Delay (s) 95th %tile Queue (m) DOS Average Delay (s) 95th %tile Queue (m)
AM Peak McPhillips Rd (S) 2.807 983.6 81.1 0.026 10.3 0.8 0.168 35 3.7
Bannockburn-Shelford Rd (E) 0.659 0.4 0 0.379 4.3 28.3 0.494 5.6 66.5
McPhillips Rd (N) 35.263 30941.3 198 1.425 428.1 314.4 0.854 40.6 51.1
Bannockburn-Shelford Rd (W) 1.143 66.2 0.2 1.251 225.8 3546.5 0.868 17.3 240.7
PM Peak McPhillips Rd (S) 2.632 1875.8 79.8 0.094 24.2 4.1 0.346 81 8.7
Bannockburn-Shelford Rd (E) 1.466 215.6 0 0.840 4.3 161.3 0.901 10.4 507.1
McPhillips Rd (N) 1.168 219.9 148.8 0.757 90.1 73.3 0.882 88.6 99.2
Bannockburn-Shelford Rd (W) 2.281 2699.6 29885.4 0.867 4.5 180.5 0.504 5.1 127.3
Saturday Peak McPhillips Rd (S) 3.158 1467.2 97.7 0.052 11 1.7 0.095 23.4 2.6
Bannockburn-Shelford Rd (E) 0.936 1.4 0 0.537 4 41.1 0.851 15.8 145.7
McPhillips Rd (N) 2.553 1455.5 62.8 1 204.2 100.4 0.529 24.1 20.4
Bannockburn-Shelford Rd (W) 1.42 682.3 1426.1 0.992 10.6 658.1 0.783 11.3 109.8
Existing Volumes and Conditions Future Volumes and Existing Conditions Future Volumes and Cardno Conditions (Roundabout) Future Volumes and Cardno Conditions (Signals)
Future Volumes and Existing Conditions Future Volumes and Cardno Conditions (Roundabout) Future Volumes and Cardno Conditions (Signals)
McPhillips Road / Victor Street Approach DOS Average Delay (s) 95th %tile Queue (m) DOS Average Delay (s) 95th %tile Queue (m)
AM Peak McPhillips Rd (SE) 0.01 1 0 0.022 0.5 0
McPhillips Rd (NW) 0.033 0.1 0 0.122 0 0.1
Victor St (SW) 0.011 4.9 0.3 0.012 5.4 0.3
PM Peak McPhillips Rd (SE) 0.021 0.5 0 0.026 0.4 0
McPhillips Rd (NW) 0.029 0.1 0 0.072 0.6 0.6
Victor St (SW) 0.023 5 0.5 0.024 5.2 0.6
Saturday Peak McPhillips Rd (SE) 0.037 0.6 0 0.069 0.3 0
McPhillips Rd (NW) 0.054 0.1 0.1 0.117 0.6 0.9
Victor St (SW) 0.008 5 0.2 0.009 5.4 0.2
Existing Volumes and Conditions Future Volumes and Existing Conditions
Bannockburn-Shelford Road / Milton St Approach DOS Average Delay (s) 95th %tile Queue (m) DOS Average Delay (s) 95th %tile Queue (m) DOS Average Delay (s) 95th %tile Queue (m) DOS Average Delay (s) 95th %tile Queue (m)
AM Peak Milton St (S) 0.153 6.5 5.1 0.861 20.8 75.2 0.432 9.7 19 0.567 16.7 20.5
Bannockburn-Shelford Rd (NE) 0.14 6.8 6 0.348 7 19.6 0.362 7.3 15.6 0.751 14.6 33
Milton St (NW) 0.36 6.6 16.7 2.513 1377.9 3030.4 1.203 177.2 734.8 0.551 11.9 22
Bannockburn-Shelford Rd (SW) 0.36 5.3 15 1.363 252.3 1185.1 0.733 10.8 47.8 0.765 13.6 68.6
PM Peak Milton St (S) 0.16 8.5 6.1 1.395 387.7 571.9 0.768 42 51.9 0.501 63.3 56.2
Bannockburn-Shelford Rd (NE) 0.503 5.2 30.7 1.606 404.2 3563.5 1.208 199.7 1287.5 1.259 237 1768.9
Milton St (NW) 0.295 7.3 12.6 1.300 294.7 903.6 0.642 11.5 40.1 1.242 125.7 314.1
Bannockburn-Shelford Rd (SW) 0.25 4.4 9.9 1.311 236.7 971.2 0.689 11 45.2 0.337 11 93.4
Saturday Peak Milton St (S) 0.129 8.1 4.4 1.087 129.1 247.9 0.537 16.4 28.3 0.504 61.8 61.6
Bannockburn-Shelford Rd (NE) 0.262 5.9 12.5 0.805 7.9 93.5 0.739 9.5 61.1 1.17 168.1 814.6
Milton St (NW) 0.245 7.3 10.2 2.122 1029.6 2192.9 0.832 17.6 77.4 1.181 94.5 293.6
Bannockburn-Shelford Rd (SW) 0.267 4.7 10 1.046 66.3 393 0.727 11.2 50 0.401 11.8 116.9
Milton Street / Victor Street Approach DOS Average Delay (s) 95th %tile Queue (m) DOS Average Delay (s) 95th %tile Queue (m)
AM Peak Milton St (SE) 0.14 0.4 0.8 0.48 9.5 33.3
Victor St (NE) 0.025 6.1 0.7 0.045 9.8 1.1
Milton St (NW) 0.156 0 0 0.428 0.8 0
PM Peak Milton St (SE) 0.124 0.3 0.7 0.559 6 41.5
Victor St (NE) 0.011 5.7 0.3 0.183 6.9 5.3
Milton St (NW) 0.126 0.2 0 0.251 0.7 0
Saturday Peak Milton St (SE) 0.076 0.6 0.9 0.548 6.3 42.3
Victor St (NE) 0.011 4.9 0.3 0.182 6.1 5.5
Milton St (NW) 0.036 0.1 0 0.186 0.9 0
Existing Volumes and Conditions Future Volumes and Existing Conditions
Existing Volumes and Conditions Future Volumes and Existing Conditions Future Volumes and Cardno Conditions (Roundabout) Future Volumes and Cardno Conditions (Signals)
Bannockburn-Shelford Road / Pope St Approach DOS Average Delay (s) 95th %tile Queue (m) DOS Average Delay (s) 95th %tile Queue (m) DOS Average Delay (s) 95th %tile Queue (m)
AM Peak Pope St (S) 30.151 26282.6 2537.9 0.365 9.7 18.6 0.89 32.9 99.5
Bannockburn-Shelford Rd (E) 0.284 3.7 7.1 0.19 4.8 7.2 0.587 16.8 67.1
Pope St (N) 2.847 1726.9 461.1 0.375 29.3 24.4 0.171 16.3 13.6
Bannockburn-Shelford Rd (W) 0.592 0.6 0.9 0.579 8 37.9 0.859 24.2 143.2
PM Peak Pope St (S) 41.689 36700.2 1849.3 0.716 74.3 78.9 0.889 65.8 117.9
Bannockburn-Shelford Rd (E) 0.808 1.8 3.8 0.577 4.8 34.9 0.905 32.9 482.8
Pope St (N) 11.396 9462.4 844.3 0.144 10.2 7.5 0.265 46.8 38.9
Bannockburn-Shelford Rd (W) 0.87 11.3 20.7 0.321 5.7 14.9 0.526 14.1 148.8
Saturday Peak Pope St (S) 23.866 20649.2 1629.9 0.369 16.1 21.7 0.812 25.1 40.7
Bannockburn-Shelford Rd (E) 0.54 1.6 3.7 0.45 5.4 20.7 0.781 15.3 103.7
Pope St (N) 3.814 2605.7 672.2 0.169 9.9 8.8 0.326 19.1 16.6
Bannockburn-Shelford Rd (W) 0.423 4.6 12.6 0.317 6.6 14.6 0.701 12.8 60.8
Burnside Road / Pope Street / Levy Road Approach DOS Average Delay (s) 95th %tile Queue (m) DOS Average Delay (s) 95th %tile Queue (m) DOS Average Delay (s) 95th %tile Queue (m) DOS Average Delay (s) 95th %tile Queue (m)
AM Peak Levy Rd (S) 0.15 7.1 5.8 1.808 748.2 1528.3 1.329 320.6 906 0.892 53.6 251.5
Burnside Rd (E) 0.202 6.6 8.9 0.661 8.9 51.4 0.422 7.9 23.6 0.902 50.1 200.8
Pope St (NW) 0.08 6.1 3.1 0.303 7.5 15 0.303 7.6 15.2 0.868 69.1 77.6Burnside Rd (W) 0.118 7.8 4.2 0.53 23.2 26.4 0.662 35.4 37.3 0.229 25.5 44.9
PM Peak Levy Rd (S) 0.105 6.7 4 0.717 21.8 55.1 0.551 13.2 33.2 0.838 26.6 40.5
Burnside Rd (E) 0.200 7.5 8.6 0.563 8.5 36.9 0.278 7.4 13.1 0.756 20 39.4
Pope St (NW) 0.225 6.1 10.3 0.346 7.5 17.8 0.345 7.5 17.7 0.684 23.9 29.4Burnside Rd (W) 0.089 7.3 3.2 0.377 13.8 16.2 0.371 13.7 15.8 0.390 16.3 20.4
Saturday Peak Levy Rd (S) 0.080 6.3 3 0.755 22.7 64.5 0.576 13 36.8 0.796 29 53.6
Burnside Rd (E) 0.149 7 6.2 0.662 14.5 52.8 0.367 9.5 17.9 0.835 27.1 56.2
Pope St (NW) 0.154 6 6.5 0.568 8.3 37.7 0.567 8.3 37.6 0.801 27.6 65.2Burnside Rd (W) 0.066 6.6 2.3 0.352 14.7 14.8 0.346 14.6 14.2 0.354 19.5 21.7
Future Volumes and Cardno Conditions (signals)
Future Volumes and Existing Conditions Future Volumes and Cardno Conditions (Roundabout) Future Volumes and Cardno Conditions (Signals)
Existing Volumes and Conditions Future Volumes and Existing Conditions Future Volumes and Cardno Conditions (Roundabout)
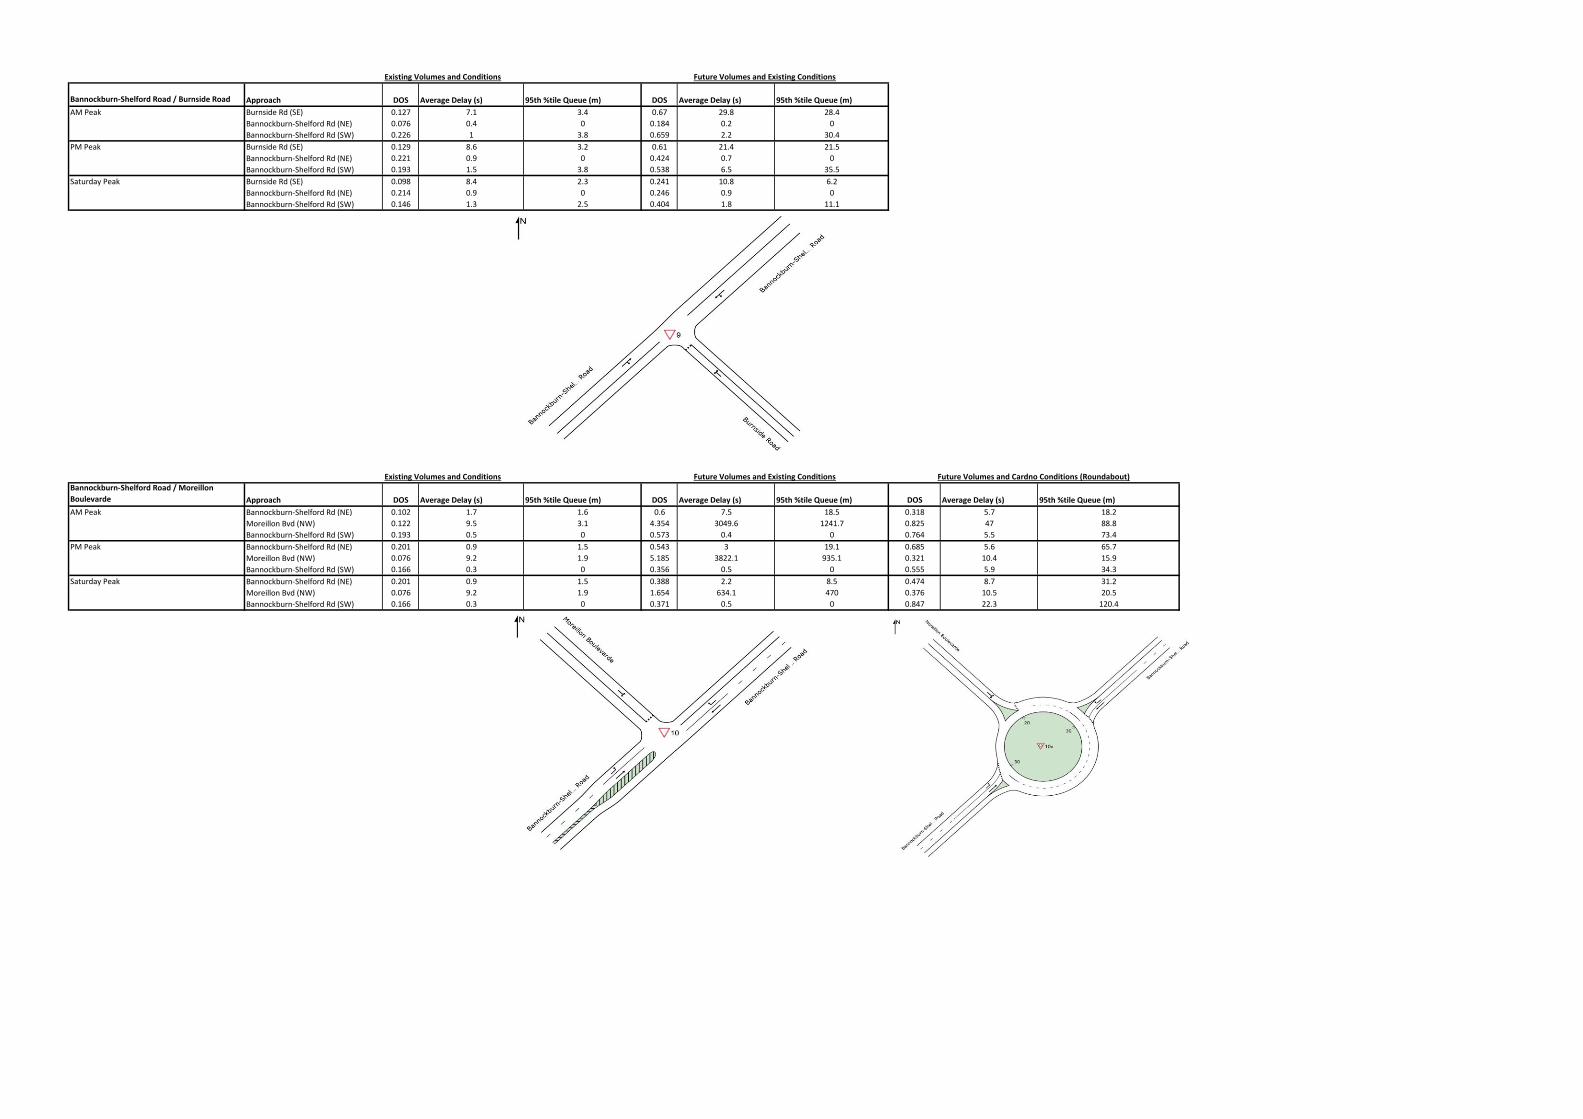
Bannockburn-Shelford Road / Burnside Road Approach DOS Average Delay (s) 95th %tile Queue (m) DOS Average Delay (s) 95th %tile Queue (m)
AM Peak Burnside Rd (SE) 0.127 7.1 3.4 0.67 29.8 28.4
Bannockburn-Shelford Rd (NE) 0.076 0.4 0 0.184 0.2 0
Bannockburn-Shelford Rd (SW) 0.226 1 3.8 0.659 2.2 30.4
PM Peak Burnside Rd (SE) 0.129 8.6 3.2 0.61 21.4 21.5
Bannockburn-Shelford Rd (NE) 0.221 0.9 0 0.424 0.7 0
Bannockburn-Shelford Rd (SW) 0.193 1.5 3.8 0.538 6.5 35.5
Saturday Peak Burnside Rd (SE) 0.098 8.4 2.3 0.241 10.8 6.2
Bannockburn-Shelford Rd (NE) 0.214 0.9 0 0.246 0.9 0
Bannockburn-Shelford Rd (SW) 0.146 1.3 2.5 0.404 1.8 11.1
Bannockburn-Shelford Road / Moreillon
Boulevarde Approach DOS Average Delay (s) 95th %tile Queue (m) DOS Average Delay (s) 95th %tile Queue (m) DOS Average Delay (s) 95th %tile Queue (m)
AM Peak Bannockburn-Shelford Rd (NE) 0.102 1.7 1.6 0.6 7.5 18.5 0.318 5.7 18.2
Moreillon Bvd (NW) 0.122 9.5 3.1 4.354 3049.6 1241.7 0.825 47 88.8
Bannockburn-Shelford Rd (SW) 0.193 0.5 0 0.573 0.4 0 0.764 5.5 73.4
PM Peak Bannockburn-Shelford Rd (NE) 0.201 0.9 1.5 0.543 3 19.1 0.685 5.6 65.7
Moreillon Bvd (NW) 0.076 9.2 1.9 5.185 3822.1 935.1 0.321 10.4 15.9
Bannockburn-Shelford Rd (SW) 0.166 0.3 0 0.356 0.5 0 0.555 5.9 34.3
Saturday Peak Bannockburn-Shelford Rd (NE) 0.201 0.9 1.5 0.388 2.2 8.5 0.474 8.7 31.2
Moreillon Bvd (NW) 0.076 9.2 1.9 1.654 634.1 470 0.376 10.5 20.5
Bannockburn-Shelford Rd (SW) 0.166 0.3 0 0.371 0.5 0 0.847 22.3 120.4
Existing Volumes and Conditions Future Volumes and Existing Conditions
Existing Volumes and Conditions Future Volumes and Existing Conditions Future Volumes and Cardno Conditions (Roundabout)
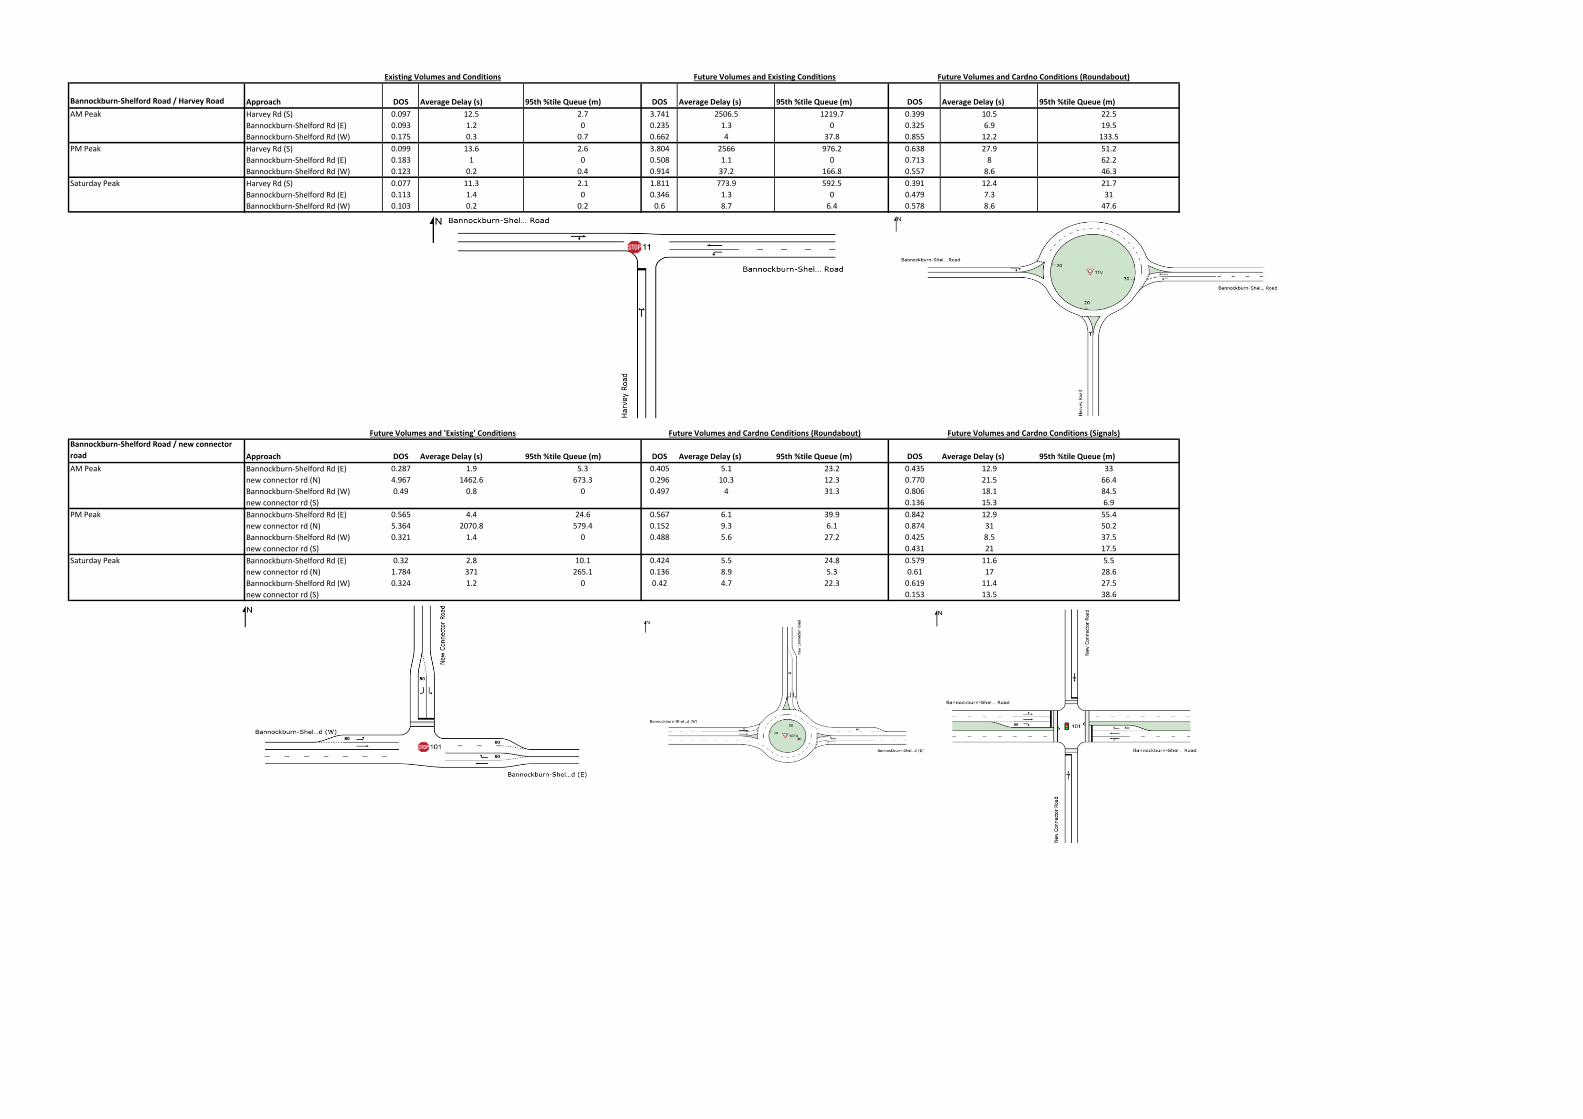
Bannockburn-Shelford Road / Harvey Road Approach DOS Average Delay (s) 95th %tile Queue (m) DOS Average Delay (s) 95th %tile Queue (m) DOS Average Delay (s) 95th %tile Queue (m)
AM Peak Harvey Rd (S) 0.097 12.5 2.7 3.741 2506.5 1219.7 0.399 10.5 22.5
Bannockburn-Shelford Rd (E) 0.093 1.2 0 0.235 1.3 0 0.325 6.9 19.5
Bannockburn-Shelford Rd (W) 0.175 0.3 0.7 0.662 4 37.8 0.855 12.2 133.5
PM Peak Harvey Rd (S) 0.099 13.6 2.6 3.804 2566 976.2 0.638 27.9 51.2
Bannockburn-Shelford Rd (E) 0.183 1 0 0.508 1.1 0 0.713 8 62.2
Bannockburn-Shelford Rd (W) 0.123 0.2 0.4 0.914 37.2 166.8 0.557 8.6 46.3
Saturday Peak Harvey Rd (S) 0.077 11.3 2.1 1.811 773.9 592.5 0.391 12.4 21.7
Bannockburn-Shelford Rd (E) 0.113 1.4 0 0.346 1.3 0 0.479 7.3 31
Bannockburn-Shelford Rd (W) 0.103 0.2 0.2 0.6 8.7 6.4 0.578 8.6 47.6
Bannockburn-Shelford Road / new connector
road Approach DOS Average Delay (s) 95th %tile Queue (m) DOS Average Delay (s) 95th %tile Queue (m) DOS Average Delay (s) 95th %tile Queue (m)
AM Peak Bannockburn-Shelford Rd (E) 0.287 1.9 5.3 0.405 5.1 23.2 0.435 12.9 33
new connector rd (N) 4.967 1462.6 673.3 0.296 10.3 12.3 0.770 21.5 66.4
Bannockburn-Shelford Rd (W) 0.49 0.8 0 0.497 4 31.3 0.806 18.1 84.5
new connector rd (S) 0.136 15.3 6.9
PM Peak Bannockburn-Shelford Rd (E) 0.565 4.4 24.6 0.567 6.1 39.9 0.842 12.9 55.4
new connector rd (N) 5.364 2070.8 579.4 0.152 9.3 6.1 0.874 31 50.2
Bannockburn-Shelford Rd (W) 0.321 1.4 0 0.488 5.6 27.2 0.425 8.5 37.5
new connector rd (S) 0.431 21 17.5
Saturday Peak Bannockburn-Shelford Rd (E) 0.32 2.8 10.1 0.424 5.5 24.8 0.579 11.6 5.5
new connector rd (N) 1.784 371 265.1 0.136 8.9 5.3 0.61 17 28.6
Bannockburn-Shelford Rd (W) 0.324 1.2 0 0.42 4.7 22.3 0.619 11.4 27.5
new connector rd (S) 0.153 13.5 38.6
Future Volumes and 'Existing' Conditions Future Volumes and Cardno Conditions (Roundabout) Future Volumes and Cardno Conditions (Signals)
Existing Volumes and Conditions Future Volumes and Existing Conditions Future Volumes and Cardno Conditions (Roundabout)