Embed Size (px)
Citation preview
Bank of Canada Review
—Sum
mer 20
09
Revue de la Banque du Canada —
Été 200
9
Bank of Canada ReviewSummer 2009
Revue de la Banque du CanadaÉté 2009

MeMbers of the editorial board
Jack Selody
C h a ir
Agathe Côté Tim Lane
Allan Crawford David Longworth
Pierre Duguay Frank Milne
Paul Fenton John Murray
Gerry Gaetz Sheila Niven
Donna Howard George Pickering
Brigid Janssen Lawrence Schembri
Paul Jenkins Mark Zelmer
Maura Brown
E d i to r
The Bank of Canada Review is published four times a year under the direction of an Editorial Board, which is responsible for the editorial content. The contents of the Review may be reproduced or quoted provided that the Bank of Canada Review, with its date, is specifically quoted as the source.
Back issues of the Review and other publications are available on the Bank’s website at ht tp: // w w w.ba nkofc a nada .c a.
Subscriptions for print are available, as follows:
Delivery in Canada: Can$25 Delivery to the United States: Can$25 Delivery to all other countries, regular mail: Can$50
Canadian government and public libraries and libraries of Canadian and foreign educational institutions may subscribe at one-half the regular price. Single copies are $7.50.
Remittances in Canadian dollars should be made payable to the Bank of Canada. Canadian orders must include 5 per cent GST, as well as PST, where applicable.
Copies of Bank of Canada documents may be obtained from:
Publications Distribution Communications Department Bank of Canada Ottawa, ON Canada K1A 0G9 Telephone: 613 782-8248 Toll free in North America: 1 877 782-8248 Email address: [email protected]
Inquiries related to interest rates or exchange rates should be directed to 613 782-7506.
ISSN 0045-1460 (Print) ISSN 1483-8303 (Online) Printed in Canada on recycled paper
© Bank of Canada 2009
MeMbres du CoMité de rédaCtion
Jack Selody
Président
Agathe Côté Tim Lane
Allan Crawford David Longworth
Pierre Duguay Frank Milne
Paul Fenton John Murray
Gerry Gaetz Sheila Niven
Donna Howard George Pickering
Brigid Janssen Lawrence Schembri
Paul Jenkins Mark Zelmer
Maura Brown
Rédactrice
La Revue de la Banque du Canada est publiée trimestriellement sous la direction du Comité de rédaction, auquel incombe la responsabilité du contenu. Les articles de la Revue peuvent être reproduits ou cités dans la mesure où le nom de la publication ainsi que la livraison d’où sont tirés les renseignements sont mentionnés expressément.
On peut consulter les livraisons déjà parues de la Revue ainsi que d’autres publications dans le site Web de la Banque, à l’adresse http://www.banqueducanada.ca.
Il est possible de s’abonner à la Revue aux tarifs suivants :
Livraison au Canada 25 $ CAN Livraison aux États-Unis 25 $ CAN Livraison dans les autres pays, par courrier surface 50 $ CAN
Pour les bibliothèques publiques canadiennes, ainsi que les bibliothèques des ministères fédéraux et des établissements d’enseignement canadiens et étrangers, le tarif d’abonnement est réduit de moitié. On peut aussi se procurer la Revue au prix de 7,50 $ l’exemplaire.
Les paiements doivent être faits en dollars canadiens à l’ordre de la Banque du Canada. Le montant des abonnements et commandes en provenance du Canada doit être majoré de 5 % pour la TPS et, s’il y a lieu, de la taxe de vente provinciale.
Pour commander des exemplaires de publications, veuillez vous adresser à la Diffusion des publications, département des Communications, Banque du Canada, Ottawa (Ontario), Canada K1A 0G9, composer le 613 782-8248 ou le 1 877 782-8248 (sans frais en Amérique du Nord), ou envoyer un message électronique à [email protected].
Pour obtenir des renseignements sur les taux d’intérêt ou les taux de change, veuillez composer le 613 782-7506.
ISSN 0045-1460 (version papier) ISSN 1483-8311 (Internet) Imprimé au Canada sur papier recyclé
© Banque du Canada 2009
Contents
Articles
3 Collateral Management in the LVTS by Canadian Financial Institutions
15 The Complexities of Financial Risk Management and Systemic Risks
31 The Changing Pace of Labour Reallocation in Canada: Causes and
Consequences
43 BoC-GEM: Modelling the World Economy
55 Bank of Canada Publications
Cover
Coin Designs of Emanuel HahnDavid Bergeron, Curator, Currency Museum
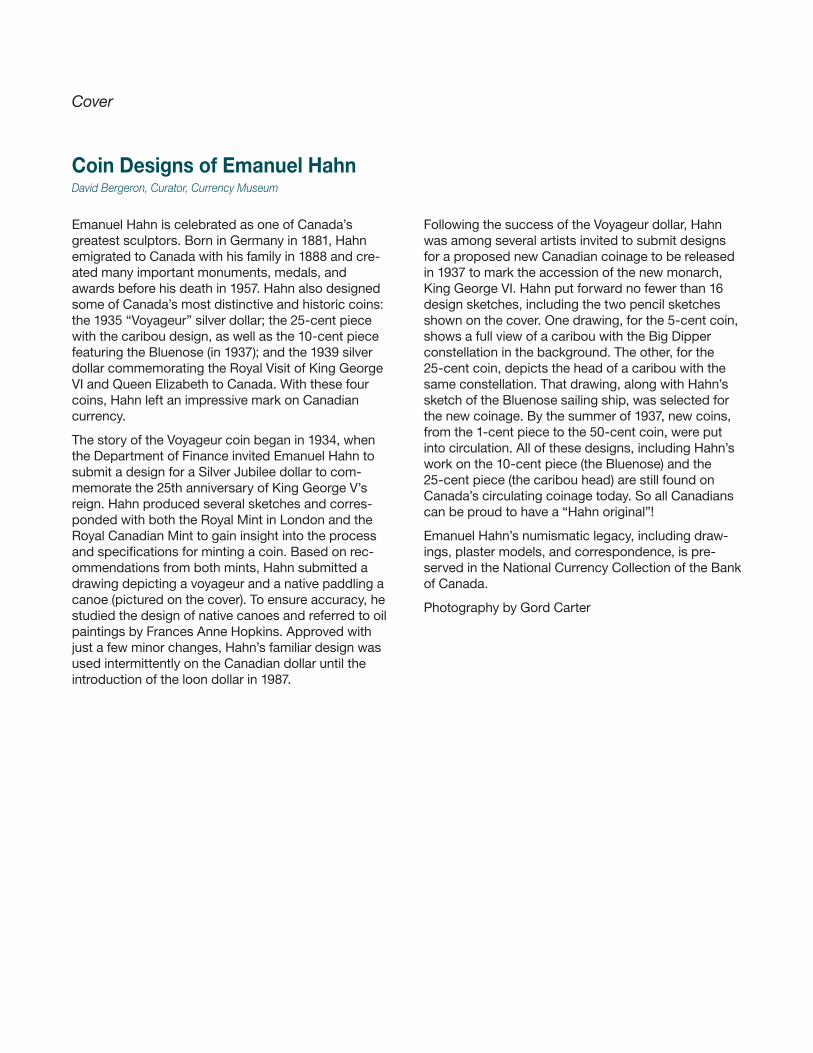
Emanuel Hahn is celebrated as one of Canada’s greatest sculptors. Born in Germany in 1881, Hahn emigrated to Canada with his family in 1888 and cre-ated many important monuments, medals, and awards before his death in 1957. Hahn also designed some of Canada’s most distinctive and historic coins: the 1935 “Voyageur” silver dollar; the 25-cent piece with the caribou design, as well as the 10-cent piece featuring the Bluenose (in 1937); and the 1939 silver dollar commemorating the Royal Visit of King George VI and Queen Elizabeth to Canada. With these four coins, Hahn left an impressive mark on Canadian currency.
The story of the Voyageur coin began in 1934, when the Department of Finance invited Emanuel Hahn to submit a design for a Silver Jubilee dollar to com-memorate the 25th anniversary of King George V’s reign. Hahn produced several sketches and corres-ponded with both the Royal Mint in London and the Royal Canadian Mint to gain insight into the process and specifi cations for minting a coin. Based on rec-ommendations from both mints, Hahn submitted a drawing depicting a voyageur and a native paddling a canoe (pictured on the cover). To ensure accuracy, he studied the design of native canoes and referred to oil paintings by Frances Anne Hopkins. Approved with just a few minor changes, Hahn’s familiar design was used intermittently on the Canadian dollar until the introduction of the loon dollar in 1987.
Following the success of the Voyageur dollar, Hahn was among several artists invited to submit designs for a proposed new Canadian coinage to be released in 1937 to mark the accession of the new monarch, King George VI. Hahn put forward no fewer than 16 design sketches, including the two pencil sketches shown on the cover. One drawing, for the 5-cent coin, shows a full view of a caribou with the Big Dipper constellation in the background. The other, for the 25-cent coin, depicts the head of a caribou with the same constellation. That drawing, along with Hahn’s sketch of the Bluenose sailing ship, was selected for the new coinage. By the summer of 1937, new coins, from the 1-cent piece to the 50-cent coin, were put into circulation. All of these designs, including Hahn’s work on the 10-cent piece (the Bluenose) and the 25-cent piece (the caribou head) are still found on Canada’s circulating coinage today. So all Canadians can be proud to have a “Hahn original”!
Emanuel Hahn’s numismatic legacy, including draw-ings, plaster models, and correspondence, is pre-served in the National Currency Collection of the Bank of Canada.
Photography by Gord Carter
Collateral Management in the LVTS by Canadian Financial InstitutionsChris D’Souza, Financial Markets Department
The demand for collateral in wholesale fi nancial • markets has increased along with fi nancial activity worldwide.
Collateral is used to mitigate credit risk between • the counterparties involved in a fi nancial trans-action by providing insurance that the lender will be repaid.
Secondary-market liquidity has an important • effect on the choices of collateral. Relatively less liquid securities that have fewer alternative uses are more likely to be pledged, while assets in which an institution plays a larger market-making role are also typically pledged.
To mitigate credit risk, collateral is required of fi nancial institutions (FIs) operating in securities trading and derivatives markets, as well as in
central bank operations and large-value payment and settlement systems. Assets eligible as collateral are usually liquid, with negligible levels of credit risk, such as government or government-guaranteed securities. As the demand for collateral has increased, the list of securities deemed eligible as collateral has grown to include private sector securities that meet certain credit-rating requirements. Still, there is a concern that new demands will outstrip the growth in the supply of these preferred assets and that the costs to acquire and hold these assets will increase over time (Com-mittee on the Global Financial System 2001).1
This article examines the incentives for banks to hold various assets on their balance sheets for use as collateral when the opportunity costs of doing so are high. It focuses on the fi ve-year period between mid-2002 and mid-2007 that preceded the worldwide fi nancial crisis in order to determine a baseline for collateral-management practices, and in particular, the factors affecting the choice of security during relatively normal times. Specifi cally, the article exam-ines the choices made by FIs among the assets that serve as collateral in Canada’s Large Value Transfer System (LVTS). By the end of March 2007, FIs had pledged collateral with a market value of $32 billion. Given the large value of the assets tied up as collat-eral, it is important that FIs establish robust controls, determine sources of additional collateral, and ensure that the assets are managed effectively with respect to both liquidity and their balance sheets. The adequacy of liquidity management by FIs is also of concern to policy-makers,2 as illustrated by the fact
1 New demand has come about mostly via increased growth in derivatives markets and in payment and settlement system activity.
2 The risks of a bank becoming insolvent as a result of problems associated with funding illiquidity are explored in Goodhart (2008). See also Armstrong and Caldwell (2008) and Banque de France (2008).
3 COLLATERAL MANAGEMENT IN THE LVTS BY CANADIAN FINANCIAL INSTITUTIONS
BANK OF CANADA REVIEW SUMMER 2009
Collateral Management and
the LVTS
Collateral is used to mitigate credit risk between the counterparties in a fi nancial transaction. In particular, the credit risk of the borrower is offset by the insur-ance provided by the value of the asset pledged as collateral. Collateralization is a widespread technique which ensures that disparities between market participants, at least in terms of credit risk, effectively cease to exist.5 From the borrower’s perspective, the risk-reducing effect implies more favourable fi nancing conditions and broader or deeper access to markets.
FIs hold liquid assets both to meet their expected business needs for collateral and to mitigate the risk that they may not be able to meet unexpected cash fl ows without affecting their daily operations. These securities may be easily redeployed across business lines when the need arises. Recent volatility in the wholesale funding markets has highlighted the importance of sound liquidity risk-management practices, since FIs can experience liquidity problems even during good economic times.6
While liquid assets are an important resource for banks operating in wholesale fi nancial markets, they have a relatively high opportunity cost, diverting funds from lending operations that generate higher returns. Depending on the nature of the incentives, collateral managers may therefore hold pools of excess collat-eral against the possibility that collateral will become expensive when it is needed. Overall, to manage liquidity risk effi ciently, fi rms must minimize funding costs, diversify funding, and monitor the operational risks associated with moving funds and collateral.
The LVTS is a real-time, electronic wire transfer system that processes large-value, time-critical payments quickly and continuously throughout the day. Participants in the LVTS use claims on the Bank of Canada to settle net payment obligations. To secure the payments that are sent through the LVTS, collateral is required.7 While a large buffer of collateral can be held for precautionary reasons, this strategy increases the opportunity cost to FIs that would rather
5 In extreme situations, however, when bankruptcy is perceived to be imminent, there have been examples of institutions not being able to borrow on even a collateralized basis.
6 Decker (2000); Diamond and Rajan (2001); and Strahan, Gatev, and Schuermann (2004) discuss liquidity-risk management, and how banks have evolved new techniques to mitigate credit risk. Brunnermeier and Pedersen (2009) recognize that the balance-sheet liquidity of traders is limited because of such constraints as collateral and margin requirements imposed by counterparties.
7 See Arjani and McVanel (2006) for a complete description of the LVTS.
that the fi nancial crisis that began in 2007 has prompted central banks around the world to expand the lists of assets they would accept as collateral to support the effi cient functioning of fi nancial markets.3
In addition to improving our understanding of collat-eral and liquidity-risk management practices within and across FIs, this article seeks to contribute to the market-microstructure literature in fi xed-income markets. It examines how secondary-market liquidity and the market-making capacity of FIs affect the types of assets pledged as collateral in the LVTS. Many FIs that employ collateral in their wholesale operations are also dealers in fi xed-income markets and have a comparative advantage in managing inventories of these assets. These dealers provide liquidity to their customers and other dealers by buying and selling securities at their posted quotes.4 When collateral is required in a timely manner, market-making institutions can look to their inventories of eligible assets for use as collateral. While there is a signifi cant literature on the market microstructure of securities that are typically used as collateral, few studies have empirically examined the actual cost, or pricing, of fi nancial collateral.
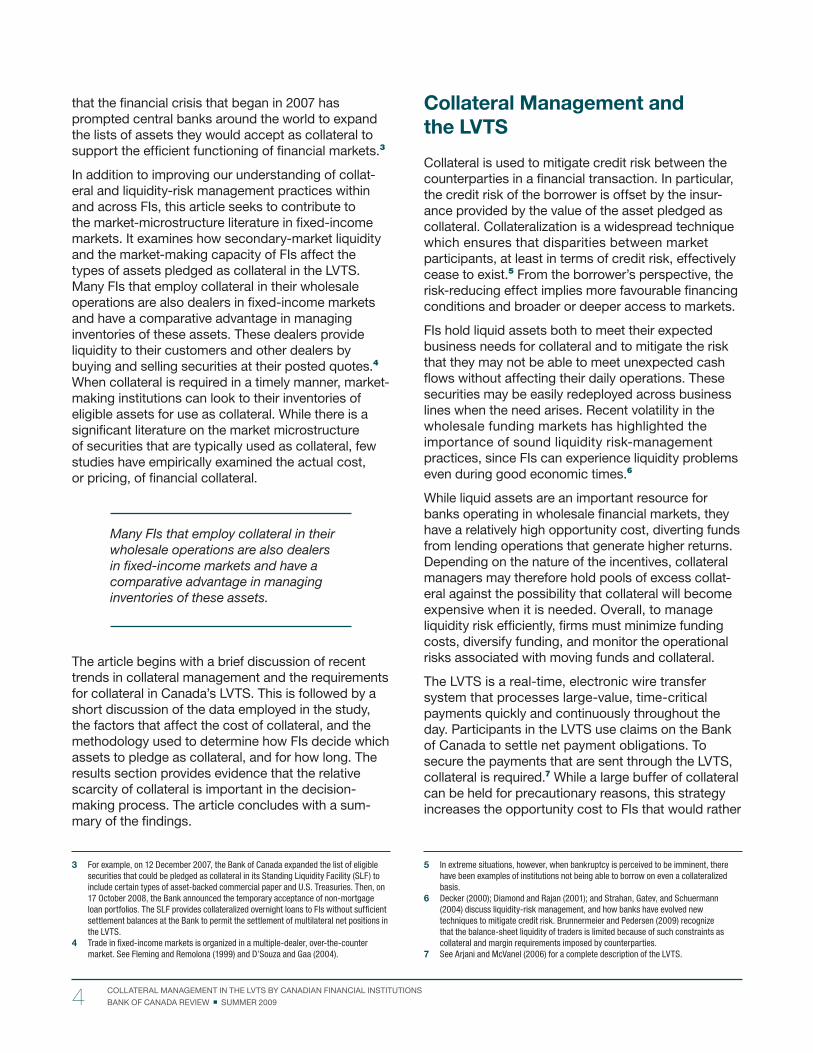
Many FIs that employ collateral in their wholesale operations are also dealers in fi xed-income markets and have a comparative advantage in managing inventories of these assets.
The article begins with a brief discussion of recent trends in collateral management and the requirements for collateral in Canada’s LVTS. This is followed by a short discussion of the data employed in the study, the factors that affect the cost of collateral, and the methodology used to determine how FIs decide which assets to pledge as collateral, and for how long. The results section provides evidence that the relative scarcity of collateral is important in the decision-making process. The article concludes with a sum-mary of the fi ndings.
3 For example, on 12 December 2007, the Bank of Canada expanded the list of eligible securities that could be pledged as collateral in its Standing Liquidity Facility (SLF) to include certain types of asset-backed commercial paper and U.S. Treasuries. Then, on 17 October 2008, the Bank announced the temporary acceptance of non-mortgage loan portfolios. The SLF provides collateralized overnight loans to FIs without suffi cient settlement balances at the Bank to permit the settlement of multilateral net positions in the LVTS.
4 Trade in fi xed-income markets is organized in a multiple-dealer, over-the-counter market. See Fleming and Remolona (1999) and D’Souza and Gaa (2004).
4 COLLATERAL MANAGEMENT IN THE LVTS BY CANADIAN FINANCIAL INSTITUTIONS
BANK OF CANADA REVIEW SUMMER 2009
Collateral in the LVTS
Information about the movement of assets into and out of LVTS collateral pools is derived from daily snapshots. The following information was collected for each security pledged as collateral on each day over the sample period (28 March 2002 to 30 March 2007):10 the LVTS participant, security identifi er, issuer name, par value, discounted value, coupon, and maturity date.11 In total, 14 FIs act as participants in the LVTS and pledge collateral for the purpose of making payments. For this study, securities are grouped in fi ve general categories: longer-term GoC bonds, short-term GoC treasury bills, GoC guaranteed securities, provincial and municipal securities, and private sector securities (such as bankers’ accept-ances, promissory notes, commercial paper, and corporate bonds).
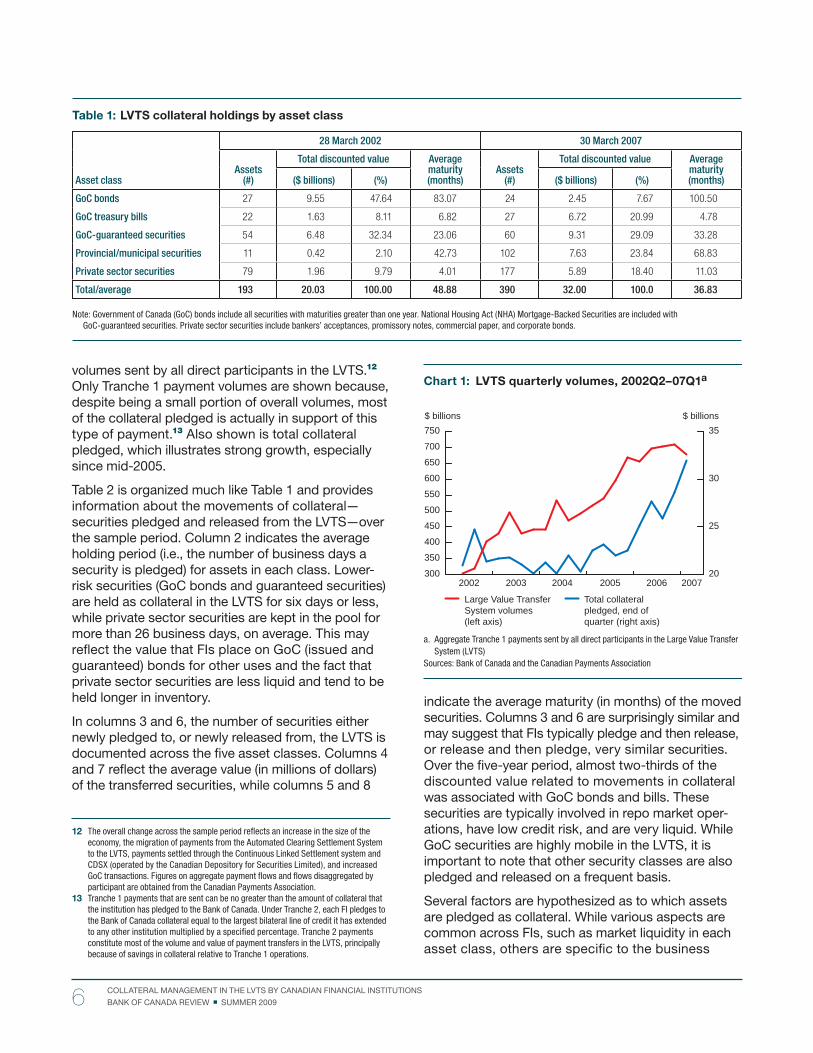
Table 1 provides statistics on the pool of securities pledged in the LVTS at the beginning and end of the sample period. The number of securities and the value of collateral across all FIs in each asset class are presented in columns 2 and 6, and columns 3 and 7, respectively. The total discounted value of collateral increased from about $20 billion to $32 billion between 2002 and 2007. This is consistent with the overall increase in payment fl ows over the same period. It also illustrates the need for FIs to manage their collateral more effectively.
Columns 4 and 8 in Table 1 indicate the percentage of collateral associated with each asset class. While the total discounted value (columns 3 and 7) of GoC bonds and treasury bills is similar at the beginning and end of the sample period, the share of treasury bills within that total has increased substantially. Note that FIs are pledging more and more securities from assets that were made eligible in November 2001 (such as provincial/municipal and private sector secur-ities). Lastly, average maturities (in months), shown in columns 5 and 9, have increased signifi cantly for GoC- guaranteed, provincial, municipal, and private sector securities, while the overall average has declined, largely because of the increasing reliance on treasury bills.
As noted above, there has been an overall increase in payment fl ows during the sample period. Chart 1 illustrates the large increase in quarterly payment
10 These dates were chosen to control for seasonal factors and to provide enough time for FIs to adjust to changes in collateral policies introduced in November 2001.
11 There were more than 100 different issuers of securities over the sample period.
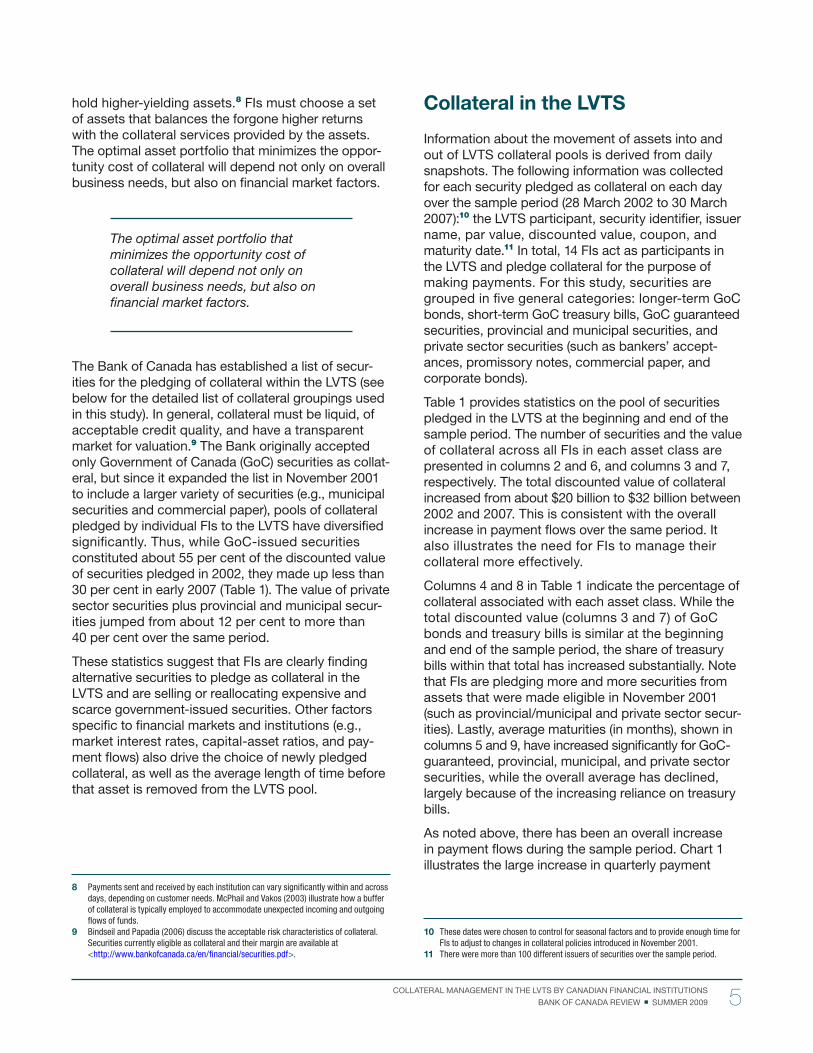
hold higher-yielding assets.8 FIs must choose a set of assets that balances the forgone higher returns with the collateral services provided by the assets. The optimal asset portfolio that minimizes the oppor-tunity cost of collateral will depend not only on overall business needs, but also on fi nancial market factors.
The optimal asset portfolio that minimizes the opportunity cost of collateral will depend not only on overall business needs, but also on fi nancial market factors.
The Bank of Canada has established a list of secur-ities for the pledging of collateral within the LVTS (see below for the detailed list of collateral groupings used in this study). In general, collateral must be liquid, of acceptable credit quality, and have a transparent market for valuation.9 The Bank originally accepted only Government of Canada (GoC) securities as collat-eral, but since it expanded the list in November 2001 to include a larger variety of securities (e.g., municipal securities and commercial paper), pools of collateral pledged by individual FIs to the LVTS have diversifi ed signifi cantly. Thus, while GoC-issued securities constituted about 55 per cent of the discounted value of securities pledged in 2002, they made up less than 30 per cent in early 2007 (Table 1). The value of private sector securities plus provincial and municipal secur-ities jumped from about 12 per cent to more than 40 per cent over the same period.
These statistics suggest that FIs are clearly fi nding alternative securities to pledge as collateral in the LVTS and are selling or reallocating expensive and scarce government-issued securities. Other factors specifi c to fi nancial markets and institutions (e.g., market interest rates, capital-asset ratios, and pay-ment fl ows) also drive the choice of newly pledged collateral, as well as the average length of time before that asset is removed from the LVTS pool.
8 Payments sent and received by each institution can vary signifi cantly within and across days, depending on customer needs. McPhail and Vakos (2003) illustrate how a buffer of collateral is typically employed to accommodate unexpected incoming and outgoing fl ows of funds.
9 Bindseil and Papadia (2006) discuss the acceptable risk characteristics of collateral. Securities currently eligible as collateral and their margin are available at<http://www.bankofcanada.ca/en/fi nancial/securities.pdf>.
5 COLLATERAL MANAGEMENT IN THE LVTS BY CANADIAN FINANCIAL INSTITUTIONS
BANK OF CANADA REVIEW SUMMER 2009
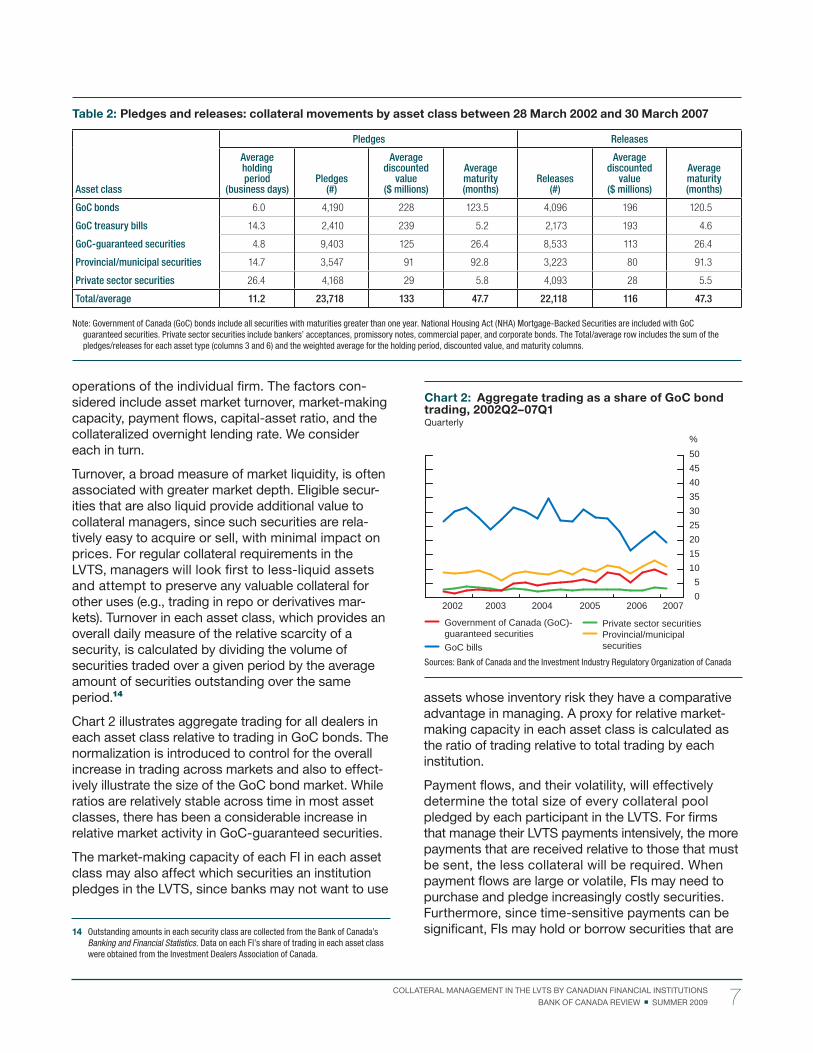
indicate the average maturity (in months) of the moved securities. Columns 3 and 6 are surprisingly similar and may suggest that FIs typically pledge and then release, or release and then pledge, very similar securities. Over the fi ve-year period, almost two-thirds of the discounted value related to movements in collateral was associated with GoC bonds and bills. These securities are typically involved in repo market oper-ations, have low credit risk, and are very liquid. While GoC securities are highly mobile in the LVTS, it is important to note that other security classes are also pledged and released on a frequent basis.
Several factors are hypothesized as to which assets are pledged as collateral. While various aspects are common across FIs, such as market liquidity in each asset class, others are specifi c to the business
volumes sent by all direct participants in the LVTS.12 Only Tranche 1 payment volumes are shown because, despite being a small portion of overall volumes, most of the collateral pledged is actually in support of this type of payment.13 Also shown is total collateral pledged, which illustrates strong growth, especially since mid-2005.
Table 2 is organized much like Table 1 and provides information about the movements of collateral—securities pledged and released from the LVTS—over the sample period. Column 2 indicates the average holding period (i.e., the number of business days a security is pledged) for assets in each class. Lower-risk securities (GoC bonds and guaranteed securities) are held as collateral in the LVTS for six days or less, while private sector securities are kept in the pool for more than 26 business days, on average. This may refl ect the value that FIs place on GoC (issued and guaranteed) bonds for other uses and the fact that private sector securities are less liquid and tend to be held longer in inventory.
In columns 3 and 6, the number of securities either newly pledged to, or newly released from, the LVTS is documented across the fi ve asset classes. Columns 4 and 7 refl ect the average value (in millions of dollars) of the transferred securities, while columns 5 and 8
12 The overall change across the sample period refl ects an increase in the size of the economy, the migration of payments from the Automated Clearing Settlement System to the LVTS, payments settled through the Continuous Linked Settlement system and CDSX (operated by the Canadian Depository for Securities Limited), and increased GoC transactions. Figures on aggregate payment fl ows and fl ows disaggregated by participant are obtained from the Canadian Payments Association.
13 Tranche 1 payments that are sent can be no greater than the amount of collateral that the institution has pledged to the Bank of Canada. Under Tranche 2, each FI pledges to the Bank of Canada collateral equal to the largest bilateral line of credit it has extended to any other institution multiplied by a specifi ed percentage. Tranche 2 payments constitute most of the volume and value of payment transfers in the LVTS, principally because of savings in collateral relative to Tranche 1 operations.
Chart 1: LVTS quarterly volumes, 2002Q2–07Q1a
Aggregate Tranche 1 payments sent by all direct participants in the Large Value Transfer a. System (LVTS)
Sources: Bank of Canada and the Canadian Payments Association
20
25
30
35
200720062005200420032002300
350
400
450
500
550
600
650
700
750$ billions$ billions
Large Value Transfer System volumes (left axis)
Total collateral pledged, end of quarter (right axis)
Table 1: LVTS collateral holdings by asset class
28 March 2002 30 March 2007
Assets(#)
Total discounted value Average maturity(months)
Assets(#)
Total discounted value Average maturity(months)Asset class ($ billions) (%) ($ billions) (%)
GoC bonds 27 9.55 47.64 83.07 24 2.45 7.67 100.50
GoC treasury bills 22 1.63 8.11 6.82 27 6.72 20.99 4.78
GoC-guaranteed securities 54 6.48 32.34 23.06 60 9.31 29.09 33.28
Provincial/municipal securities 11 0.42 2.10 42.73 102 7.63 23.84 68.83
Private sector securities 79 1.96 9.79 4.01 177 5.89 18.40 11.03
Total/average 193 20.03 100.00 48.88 390 32.00 100.0 36.83
Note: Government of Canada (GoC) bonds include all securities with maturities greater than one year. National Housing Act (NHA) Mortgage-Backed Securities are included with GoC-guaranteed securities. Private sector securities include bankers’ acceptances, promissory notes, commercial paper, and corporate bonds.
6 COLLATERAL MANAGEMENT IN THE LVTS BY CANADIAN FINANCIAL INSTITUTIONS
BANK OF CANADA REVIEW SUMMER 2009
assets whose inventory risk they have a comparative advantage in managing. A proxy for relative market-making capacity in each asset class is calculated as the ratio of trading relative to total trading by each institution.
Payment fl ows, and their volatility, will effectively determine the total size of every collateral pool pledged by each participant in the LVTS. For fi rms that manage their LVTS payments intensively, the more payments that are received relative to those that must be sent, the less collateral will be required. When payment fl ows are large or volatile, FIs may need to purchase and pledge increasingly costly securities. Furthermore, since time-sensitive payments can be signifi cant, FIs may hold or borrow securities that are
operations of the individual fi rm. The factors con-sidered include asset market turnover, market-making capacity, payment fl ows, capital-asset ratio, and the collateralized overnight lending rate. We consider each in turn.
Turnover, a broad measure of market liquidity, is often associated with greater market depth. Eligible secur-ities that are also liquid provide additional value to collateral managers, since such securities are rela-tively easy to acquire or sell, with minimal impact on prices. For regular collateral requirements in the LVTS, managers will look fi rst to less-liquid assets and attempt to preserve any valuable collateral for other uses (e.g., trading in repo or derivatives mar-kets). Turnover in each asset class, which provides an overall daily measure of the relative scarcity of a security, is calculated by dividing the volume of securities traded over a given period by the average amount of securities outstanding over the same period.14
Chart 2 illustrates aggregate trading for all dealers in each asset class relative to trading in GoC bonds. The normalization is introduced to control for the overall increase in trading across markets and also to effect-ively illustrate the size of the GoC bond market. While ratios are relatively stable across time in most asset classes, there has been a considerable increase in relative market activity in GoC-guaranteed securities.
The market-making capacity of each FI in each asset class may also affect which securities an institution pledges in the LVTS, since banks may not want to use
14 Outstanding amounts in each security class are collected from the Bank of Canada’s Banking and Financial Statistics. Data on each FI’s share of trading in each asset class were obtained from the Investment Dealers Association of Canada.
Chart 2: Aggregate trading as a share of GoC bond trading, 2002Q2–07Q1Quarterly
Sources: Bank of Canada and the Investment Industry Regulatory Organization of Canada
05
101520253035404550
200720062005200420032002
%
Government of Canada (GoC)-guaranteed securities
Private sector securities
GoC billsProvincial/municipal securities
Table 2: Pledges and releases: collateral movements by asset class between 28 March 2002 and 30 March 2007
Pledges Releases
Asset class
Averageholding period
(business days)Pledges
(#)
Averagediscounted
value($ millions)
Averagematurity(months)
Releases(#)
Averagediscounted
value($ millions)
Averagematurity(months)
GoC bonds 6.0 4,190 228 123.5 4,096 196 120.5
GoC treasury bills 14.3 2,410 239 5.2 2,173 193 4.6
GoC-guaranteed securities 4.8 9,403 125 26.4 8,533 113 26.4
Provincial/municipal securities 14.7 3,547 91 92.8 3,223 80 91.3
Private sector securities 26.4 4,168 29 5.8 4,093 28 5.5
Total/average 11.2 23,718 133 47.7 22,118 116 47.3
Note: Government of Canada (GoC) bonds include all securities with maturities greater than one year. National Housing Act (NHA) Mortgage-Backed Securities are included with GoC guaranteed securities. Private sector securities include bankers’ acceptances, promissory notes, commercial paper, and corporate bonds. The Total/average row includes the sum of the pledges/releases for each asset type (columns 3 and 6) and the weighted average for the holding period, discounted value, and maturity columns.
7 COLLATERAL MANAGEMENT IN THE LVTS BY CANADIAN FINANCIAL INSTITUTIONS
BANK OF CANADA REVIEW SUMMER 2009
the moment a decision must be made. Each of these elements may affect the opportunity cost of every security that is eligible as collateral in the LVTS. An unordered conditional logit model is appropriate under these circumstances.17
The data set collected and analyzed for this study is atypical, since it includes mixtures of both individual and choice-specifi c attributes. These data are used to estimate a model of how FIs choose which security to pledge as collateral in the LVTS. The outcome is an estimate of the probability of pledging a particular type of asset given a set of control variables for individual fi rm characteristics as well as market-wide factors. The dependent variable in the model assumes a value of one when that asset is pledged, and zero other-wise. Each observation is actually a set of data consisting of explanatory variables for the securities that were chosen as well as for those that were not chosen. To observe how individual fi rm characteristics (i.e., size, composition of assets, funding choices, regional diversifi cation, etc.) infl uence the choice of security, a dummy variable for each type of security is multiplied by each of the fi rm-level control variables: daily payments sent by the fi rm; the realized volatility of the FI’s payments over the past month; the liquid-asset-to-total-asset ratio and the capital-to-asset ratio in the most recent quarter; and the overnight rate. Because a dummy is not included for GoC bonds, the resulting coeffi cients are interpreted as the effect of the control variable on the probability of pledging the particular asset relative to GoC bonds. Variables are also included to control for general market liquidity and the market-making efforts of individual fi rms.
We also perform an analysis of pledging duration by estimating an accelerated failure-time model (estimat-ing the probability that a certain security will be removed from the pool of pledged collateral) to determine whether the factors that drive choice also affect the length of time that an asset is pledged. Consider the following model of an accelerated “release” time:
(1)
where the release time of collateral is , and is an error term. The values of the explanatory variables, , are chosen at the time the collateral is fi rst pledged to the LVTS.
17 Estimation of a conditional logit model (clogit) is discussed in the box on page 14. See McFadden (1974) or, for a brief introduction, Greene (2008). A model specifi cation similar to that of Hensher (1986) is used in this article.
available in large amounts, such as government securities.
Liquid assets have a lower credit risk and are readily redeployable across business lines if the need arises. Banks that hold large pools of eligible and liquid assets on their balance sheets may pledge these assets to the LVTS. The percentage of liquid assets relative to total assets is a proxy for the relative size of an FI’s portfolio of liquid assets, as well as the scarcity of available liquid assets on its balance sheet. The capital-to-asset ratio of each FI, which measures the overall risk of a bank’s asset portfolio, may also affect which assets are pledged to the LVTS. A bank with a lower capital-asset ratio, for example, may have higher insolvency risks and fi nd it diffi cult to borrow from other banks on an uncollateralized basis.15 Such an FI will preserve its most liquid assets in case of a funding shock.
Lastly, the overnight collateralized lending rate will also affect which assets are pledged in the LVTS. When collateral is scarce, the Canadian Overnight Repo Rate Average (CORRA) may fall relative to the Bank of Canada’s target for the overnight rate.16 The CORRA is limited to repo transactions that involve general collateral and provides a transparent daily measure of the level of the overnight rate. Since the repo market is a very liquid market for the purchase and resale of GoC securities, FIs may tap this market for short-term collateral demands. When scarcity is an issue, however, FIs will economize on their collateral demands.
Methodology
Standard regression models are not appropriate when examining the choice of collateral made by banks. This choice is discrete, taking on only one of a number of values. Binary dependent models (such as logit and probit models), where the choice variable takes on only one of two values, are also not appropriate when fi rms are given many different choices. In the case of collateral choice, no natural ordering of assets exists across time and institutions. Instead, the ordering of securities will depend on each FI’s needs for payment services, its market-making capacity, conditions in the marketplace, and the state of the FI’s balance sheet at
15 Liquid assets relative to total assets and the capital relative to risk-weighted asset ratios are obtained from quarterly balance sheet data from the Offi ce of the Superintendent of Financial Institutions. Liquid assets include bank notes, deposits with the Bank of Canada, securities issued or guaranteed by the Government of Canada, and securities issued or guaranteed by provinces or municipalities.
16 See Reid (2007). The Bank of Canada publishes the CORRA, which consists of a weighted average of rates on repo transactions conducted onscreen between 06:00 and 16:00 hours and subsequently reported by interdealer brokers.
8 COLLATERAL MANAGEMENT IN THE LVTS BY CANADIAN FINANCIAL INSTITUTIONS
BANK OF CANADA REVIEW SUMMER 2009
Findings
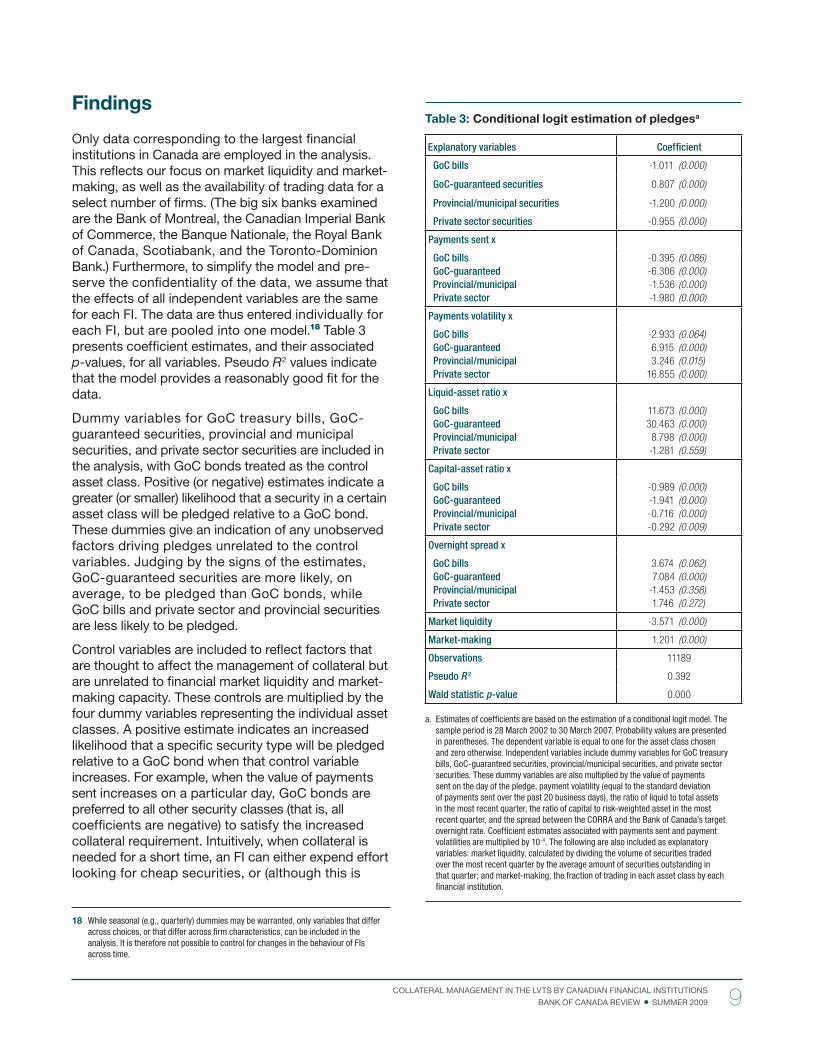
Only data corresponding to the largest fi nancial institutions in Canada are employed in the analysis. This refl ects our focus on market liquidity and market-making, as well as the availability of trading data for a select number of fi rms. (The big six banks examined are the Bank of Montreal, the Canadian Imperial Bank of Commerce, the Banque Nationale, the Royal Bank of Canada, Scotiabank, and the Toronto-Dominion Bank.) Furthermore, to simplify the model and pre-serve the confi dentiality of the data, we assume that the effects of all independent variables are the same for each FI. The data are thus entered individually for each FI, but are pooled into one model.18 Table 3 presents coeffi cient estimates, and their associated p-values, for all variables. Pseudo R 2 values indicate that the model provides a reasonably good fi t for the data.
Dummy variables for GoC treasury bills, GoC-guaranteed securities, provincial and municipal securities, and private sector securities are included in the analysis, with GoC bonds treated as the control asset class. Positive (or negative) estimates indicate a greater (or smaller) likelihood that a security in a certain asset class will be pledged relative to a GoC bond. These dummies give an indication of any unobserved factors driving pledges unrelated to the control variables. Judging by the signs of the estimates, GoC-guaranteed securities are more likely, on average, to be pledged than GoC bonds, while GoC bills and private sector and provincial securities are less likely to be pledged.
Control variables are included to refl ect factors that are thought to affect the management of collateral but are unrelated to fi nancial market liquidity and market-making capacity. These controls are multiplied by the four dummy variables representing the individual asset classes. A positive estimate indicates an increased likelihood that a specifi c security type will be pledged relative to a GoC bond when that control variable increases. For example, when the value of payments sent increases on a particular day, GoC bonds are preferred to all other security classes (that is, all coeffi cients are negative) to satisfy the increased collateral requirement. Intuitively, when collateral is needed for a short time, an FI can either expend effort looking for cheap securities, or (although this is
18 While seasonal (e.g., quarterly) dummies may be warranted, only variables that differ across choices, or that differ across fi rm characteristics, can be included in the analysis. It is therefore not possible to control for changes in the behaviour of FIs across time.
Table 3: Conditional logit estimation of pledgesa
Explanatory variables Coeffi cient
GoC bills -1.011 (0.000)
GoC-guaranteed securities 0.807 (0.000)
Provincial/municipal securities -1.200 (0.000)
Private sector securities -0.955 (0.000)
Payments sent x
GoC billsGoC-guaranteedProvincial/municipalPrivate sector
-0.395 (0.086)
-6.306 (0.000)
-1.536 (0.000)
-1.980 (0.000)
Payments volatility x
GoC billsGoC-guaranteedProvincial/municipalPrivate sector
-2.933 (0.064)
6.915 (0.000)
3.246 (0.015)
16.855 (0.000)
Liquid-asset ratio x
GoC bills GoC-guaranteedProvincial/municipalPrivate sector
11.673 (0.000)
30.463 (0.000)
8.798 (0.000)
-1.281 (0.559)
Capital-asset ratio x
GoC bills GoC-guaranteedProvincial/municipalPrivate sector
-0.989 (0.000)
-1.941 (0.000)
-0.716 (0.000)
-0.292 (0.009)
Overnight spread x
GoC bills GoC-guaranteedProvincial/municipalPrivate sector
3.674 (0.062)
7.084 (0.000)
-1.453 (0.358)
1.746 (0.272)
Market liquidity -3.571 (0.000)
Market-making 1.201 (0.000)
Observations 11189
Pseudo R 2 0.392
Wald statistic p-value 0.000
Estimates of coeffi cients are based on the estimation of a conditional logit model. The a. sample period is 28 March 2002 to 30 March 2007. Probability values are presented in parentheses. The dependent variable is equal to one for the asset class chosen and zero otherwise. Independent variables include dummy variables for GoC treasury bills, GoC-guaranteed securities, provincial/municipal securities, and private sector securities. These dummy variables are also multiplied by the value of payments sent on the day of the pledge, payment volatility (equal to the standard deviation of payments sent over the past 20 business days), the ratio of liquid to total assets in the most recent quarter, the ratio of capital to risk-weighted asset in the most recent quarter, and the spread between the CORRA and the Bank of Canada’s target overnight rate. Coeffi cient estimates associated with payments sent and payment volatilities are multiplied by 10-4. The following are also included as explanatory variables: market liquidity, calculated by dividing the volume of securities traded over the most recent quarter by the average amount of securities outstanding in that quarter; and market-making, the fraction of trading in each asset class by each fi nancial institution.
9 COLLATERAL MANAGEMENT IN THE LVTS BY CANADIAN FINANCIAL INSTITUTIONS
BANK OF CANADA REVIEW SUMMER 2009
collateral and the “price” of collateral are determined endogenously.
Our main interest is the effect of market liquidity and a bank’s market-making capacity on the choice of assets pledged as collateral. Results presented in Table 3 are statistically signifi cant for both variables. Increased market liquidity in an asset class (which is measured by turnover) reduces the likelihood that a security from that sector of the fi xed-income market will be pledged. Intuitively, highly liquid securities are too valuable to serve as collateral from the perspec-tive of a bank’s trading desk. While liquid assets could be released from the LVTS if the need arose, the operational costs of doing so may not be justifi ed.
Alternatively, FIs are more likely to choose assets in which they have a greater market-making capacity (represented by relative trading activity). Banks that deal actively in a certain segment of the fi xed-income market have more expertise in managing inventories in that market. While institutions may be reluctant to pledge as collateral securities from their market-making portfolio of assets, they may be able to do this more effi ciently in a market in which they are better aware of the trading activity over time.
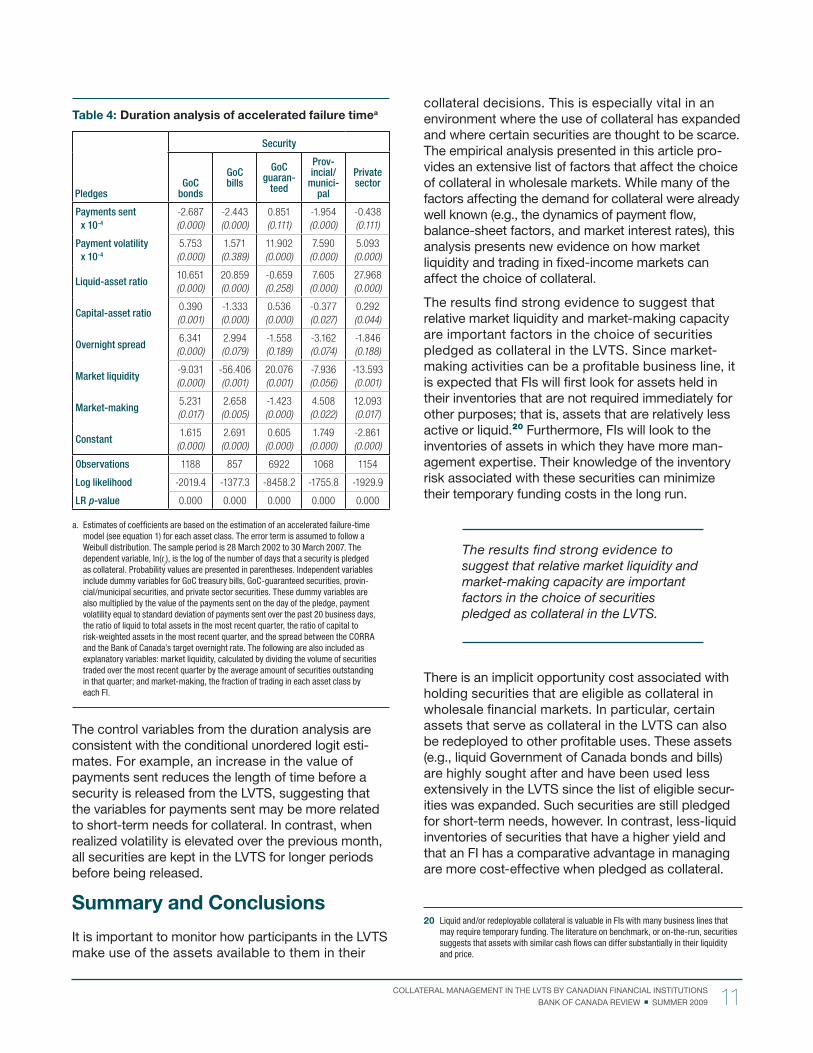
The results of the duration analysis (where the model looks at the amount of time a security remains pledged) performed with the same set of data are consistent with the results of the unordered conditional logit model. Models are estimated separately for each asset class.19 Instead of examining the choice of security made by an FI pledging collateral to the LVTS, coeffi cient estimates in Table 4 show whether the length of time a security stays in the LVTS collat-eral pool increases or decreases when the independent variables increase in magnitude.
Results in Table 4 suggest that, across most asset classes, market liquidity reduces the time before a security is released from the LVTS, while market-making capacity increases the length of time a security stays in the LVTS collateral pool. The only exception is GoC-guaranteed securities, where the results are reversed. Market liquidity increases the length of time that the security is pledged to the LVTS, while market-making intensity reduces the duration of the security’s stay in the LVTS. An interesting line of future research will be to investigate what aspect of GoC-guaranteed securities drives this result.
19 The random variable ( ) in equation 1 is assumed to follow a Weibull distribution, although results are robust to alternative probability distributions.
generally more costly) it can pledge an easily found GoC bond, recognizing that the bond will also be easier to sell once the collateral is no longer needed.
In contrast, when the recent volatility of payments increases, all asset classes except GoC bills are more likely to be pledged relative to GoC bonds. This is especially true for private sector securities. This increased likelihood may refl ect the precautionary motive for holding collateral and the conservative nature of collateral managers. When volatility is high and persistent, they increase the buffer of cheap collateral pledged in the LVTS.
Comparing liquid assets with total assets gives some indication of the relative scarcity of liquid assets in each institution. Results suggest that a larger liquid-asset ratio increases the probability that, relative to GoC bonds, an FI will pledge treasury bills, GoC-guaranteed securities, or provincial and municipal bonds. The use of other liquid assets may be relatively high because FIs are employing GoC bonds elsewhere.
A larger liquid-asset ratio increases the probability that, relative to GoC bonds, an FI will pledge treasury bills, GoC-guaranteed securities, or provincial and municipal bonds.
The estimates also indicate that when the total capital-to-asset ratio decreases, banks are less likely to pledge GoC bonds relative to all other asset classes (similar results were found using the Basel Tier 1 capital-to-asset ratio). A reduction in the capital-asset ratio may indicate an increased risk of insolvency. FIs in this position will conserve their most-liquid assets (e.g., GoC bonds), which are acceptable as collateral by a wider range of parties in the marketplace if additional funding is required.
A decrease in the overnight rate relative to the Bank of Canada’s overnight target might suggest that high-quality collateral has become scarcer (e.g., securities in high demand will trade at a lower rate in the repo market. Participants who own such securities can lend them in the repo market in return for cash, at a lower interest rate.) Statistically signifi cant results in Table 3 suggest that, in this event, banks prefer to pledge GoC bonds relative to GoC-guaranteed securities. This result is less intuitive and could be biased, since the quantity of high-quality pledged
10 COLLATERAL MANAGEMENT IN THE LVTS BY CANADIAN FINANCIAL INSTITUTIONS
BANK OF CANADA REVIEW SUMMER 2009
collateral decisions. This is especially vital in an environment where the use of collateral has expanded and where certain securities are thought to be scarce. The empirical analysis presented in this article pro-vides an extensive list of factors that affect the choice of collateral in wholesale markets. While many of the factors affecting the demand for collateral were already well known (e.g., the dynamics of payment fl ow, balance-sheet factors, and market interest rates), this analysis presents new evidence on how market liquidity and trading in fi xed-income markets can affect the choice of collateral.
The results fi nd strong evidence to suggest that relative market liquidity and market-making capacity are important factors in the choice of securities pledged as collateral in the LVTS. Since market-making activities can be a profi table business line, it is expected that FIs will fi rst look for assets held in their inventories that are not required immediately for other purposes; that is, assets that are relatively less active or liquid.20 Furthermore, FIs will look to the inventories of assets in which they have more man-agement expertise. Their knowledge of the inventory risk associated with these securities can minimize their temporary funding costs in the long run.
The results fi nd strong evidence to suggest that relative market liquidity and market-making capacity are important factors in the choice of securities pledged as collateral in the LVTS.
There is an implicit opportunity cost associated with holding securities that are eligible as collateral in wholesale fi nancial markets. In particular, certain assets that serve as collateral in the LVTS can also be redeployed to other profi table uses. These assets (e.g., liquid Government of Canada bonds and bills) are highly sought after and have been used less extensively in the LVTS since the list of eligible secur-ities was expanded. Such securities are still pledged for short-term needs, however. In contrast, less-liquid inventories of securities that have a higher yield and that an FI has a comparative advantage in managing are more cost-effective when pledged as collateral.
20 Liquid and/or redeployable collateral is valuable in FIs with many business lines that may require temporary funding. The literature on benchmark, or on-the-run, securities suggests that assets with similar cash fl ows can differ substantially in their liquidity and price.
The control variables from the duration analysis are consistent with the conditional unordered logit esti-mates. For example, an increase in the value of payments sent reduces the length of time before a security is released from the LVTS, suggesting that the variables for payments sent may be more related to short-term needs for collateral. In contrast, when realized volatility is elevated over the previous month, all securities are kept in the LVTS for longer periods before being released.
Summary and Conclusions
It is important to monitor how participants in the LVTS make use of the assets available to them in their
Table 4: Duration analysis of accelerated failure timea
Pledges
Security
GoC bonds
GoC bills
GoC guaran-
teed
Prov-incial/
munici-pal
Private sector
Payments sent x 10-4
-2.687
(0.000)
-2.443
(0.000)
0.851
(0.111)
-1.954
(0.000)
-0.438
(0.111)
Payment volatility x 10-4
5.753
(0.000)
1.571
(0.389)
11.902
(0.000)
7.590
(0.000)
5.093
(0.000)
Liquid-asset ratio10.651
(0.000)
20.859
(0.000)
-0.659
(0.258)
7.605
(0.000)
27.968
(0.000)
Capital-asset ratio 0.390
(0.001)
-1.333
(0.000)
0.536
(0.000)
-0.377
(0.027)
0.292
(0.044)
Overnight spread 6.341
(0.000)
2.994
(0.079)
-1.558
(0.189)
-3.162
(0.074)
-1.846
(0.188)
Market liquidity -9.031
(0.000)
-56.406
(0.001)
20.076
(0.001)
-7.936
(0.056)
-13.593
(0.001)
Market-making5.231
(0.017)
2.658
(0.005)
-1.423
(0.000)
4.508
(0.022)
12.093
(0.017)
Constant1.615
(0.000)
2.691
(0.000)
0.605
(0.000)
1.749
(0.000)
-2.861
(0.000)
Observations 1188 857 6922 1068 1154
Log likelihood -2019.4 -1377.3 -8458.2 -1755.8 -1929.9
LR p-value 0.000 0.000 0.000 0.000 0.000
a. Estimates of coeffi cients are based on the estimation of an accelerated failure-time model (see equation 1) for each asset class. The error term is assumed to follow a Weibull distribution. The sample period is 28 March 2002 to 30 March 2007. The dependent variable, In(tj), is the log of the number of days that a security is pledged as collateral. Probability values are presented in parentheses. Independent variables include dummy variables for GoC treasury bills, GoC-guaranteed securities, provin-cial/municipal securities, and private sector securities. These dummy variables are also multiplied by the value of the payments sent on the day of the pledge, payment volatility equal to standard deviation of payments sent over the past 20 business days, the ratio of liquid to total assets in the most recent quarter, the ratio of capital to risk-weighted assets in the most recent quarter, and the spread between the CORRA and the Bank of Canada’s target overnight rate. The following are also included as explanatory variables: market liquidity, calculated by dividing the volume of securities traded over the most recent quarter by the average amount of securities outstanding in that quarter; and market-making, the fraction of trading in each asset class by each FI.
11 COLLATERAL MANAGEMENT IN THE LVTS BY CANADIAN FINANCIAL INSTITUTIONS
BANK OF CANADA REVIEW SUMMER 2009
Literature Cited
On the whole, there is signifi cant evidence that collat-eral is cautiously managed. FIs must balance risk and return by minimizing funding costs, diversifying funding, and monitoring the operational costs of pledging and releasing collateral.
The results of this study are important for policy-makers such as the Bank of Canada, which is con-cerned both about the effi cient functioning of fi xed-income markets and about the credit risk it ultimately bears in insuring LVTS settlement. Given these new insights into the behaviour of FIs, future changes in collateral policies, in particular those regarding the
Arjani, N. and D. McVanel. 2006. “A Primer on Canada’s Large Value Transfer System.” Available at <http://www.bankofcanada.ca/en/fi nancial/lvts_neville.pdf>.
Armstrong, J. and G. Caldwell. 2008. “Liquidity Risk at Banks: Trends and Lessons Learned from the Recent Turmoil.” Financial System Review (December): 47–52.
Banque de France. 2008. Special Issue on Liquidity. Financial Stability Review (February). Available at <http://www.banque-france.fr/gb/publications/rsf/rsf_022008.htm>.
Bindseil, U. and F. Papadia. 2006. “Credit Risk Mitigation in Central Bank Operations and Its Effects on Financial Markets: The Case of the Eurosystem.” ECB Occasional Paper No. 49.
Brunnermeier, M. K. and L. H. Pedersen. 2009. “Market Liquidity and Funding Liquidity.” Review of Financial Studies 22 (6): 2201–38.
Committee on the Global Financial System (CGFS). 2001. “Collateral in Wholesale Financial Markets: Recent Trends, Risk Management and Market Dynamics.” CGFS Publication No 17. Report prepared by the CGFS Working Group on Collateral. Basel: Bank for International Settle-ments, March. Available at <http://www.bis.org/publ/cgfs17.pdf?noframes=1>.
Decker, P. A. 2000. “The Changing Character of Liquidity and Liquidity Risk Management: A Regulator’s Perspective.” Emerging Issues Series. Federal Reserve Bank of Chicago, Supervision and Regulation Department. S&R-2000-5.
Diamond, D. W. and R. G. Rajan. 2001. “Liquidity Risk, Liquidity Creation, and Financial Fragility: A Theory of Banking.” Journal of Political Economy 109 (2): 287–327.
D’Souza, C. and C. Gaa. 2004. “How Liquid Are Canadas?” Canadian Investment Review (Winter): 23–28.
Fleming, M. J. and E. M. Remolona. 1999. “Price Formation and Liquidity in the U.S. Treasury Market: The Response to Public Information.” Journal of Finance, American Finance Association 54 (5): 1901–915.
Goodhart, C. 2008. “Liquidity Risk Management.” Special Issue on Liquidity. Financial Stability Review, Banque de France. February. Available at <http://www.banque-france.fr/gb/publications/rsf/rsf_022008.htm>.
Greene, W. H. 2008. Econometric Analysis, 6th ed. (New Jersey: Prentice Hall).
eligibility of assets as collateral, can be designed more effectively.
Ongoing monitoring of and research into collateral-management practices is required to keep abreast of the changing behaviours at fi nancial institutions and within an evolving fi nancial environment. Future research will examine collateral management in more detail, with a particular focus on changes resulting from the recent fi nancial crisis and the ensuing increase in Government of Canada debt issuance.
12 COLLATERAL MANAGEMENT IN THE LVTS BY CANADIAN FINANCIAL INSTITUTIONS
BANK OF CANADA REVIEW SUMMER 2009
Literature Cited (cont’d)
Hensher, D. A. 1986. “Sequential and Full Information Maximum Likelihood Estimation of a Nested Logit Model.” Review of Economics and Statistics 68: 657–67.
McFadden, D. 1974. “Conditional Logit Analysis of Qualitative Choice Behavior,” in P. Zarembka (ed.), Frontiers in Econometrics, 105–42, Academic Press: New York, 1974.
McPhail, K. and A. Vakos. 2003. “Excess Collateral in the LVTS: How Much Is Too Much?” Bank of Canada Working Paper No. 2003-36.
Reid, C. 2007. “The Canadian Overnight Market: Recent Evolution and Structural Changes.” Bank of Canada Review (Spring): 15–29.
Strahan, P. E., E. Gatev, and T. Schuermann. 2004. “How Do Banks Manage Liquidity Risk? Evidence from Equity and Deposit Markets in the Fall of 1998.” NBER Working Paper No. 10982.
13 COLLATERAL MANAGEMENT IN THE LVTS BY CANADIAN FINANCIAL INSTITUTIONS
BANK OF CANADA REVIEW SUMMER 2009
14 COLLATERAL MANAGEMENT IN THE LVTS BY CANADIAN FINANCIAL INSTITUTIONS
BANK OF CANADA REVIEW SUMMER 2009
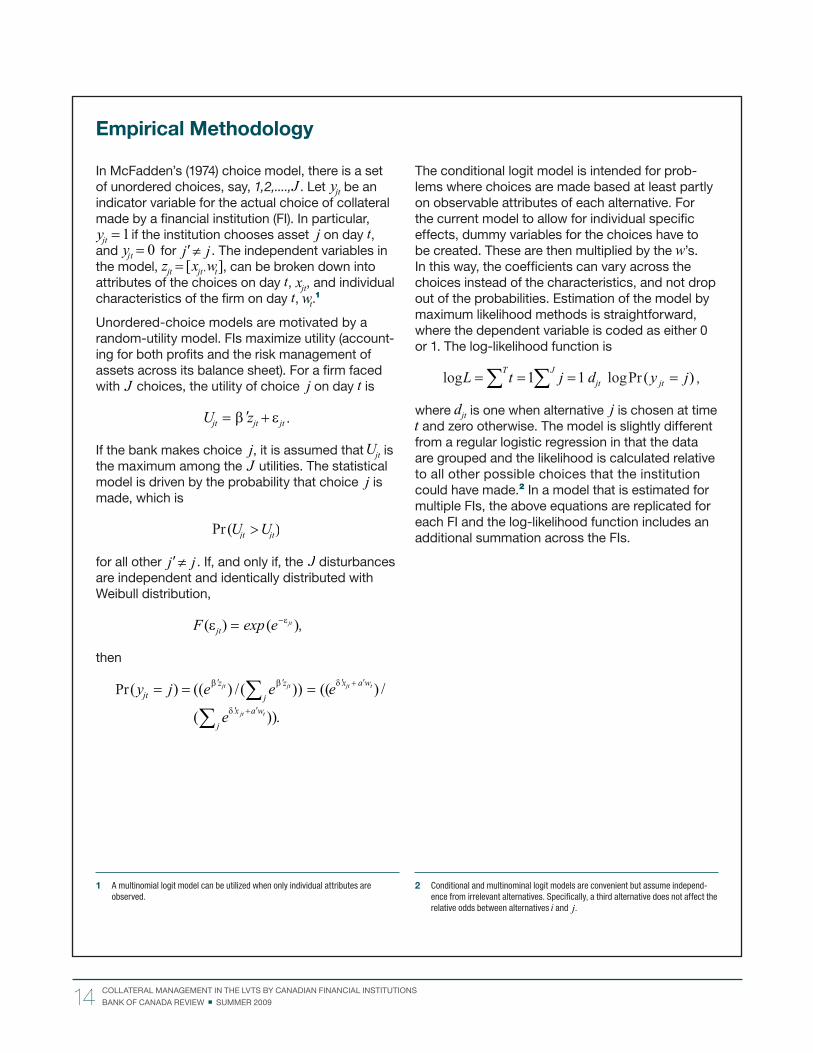
Empirical Methodology
In McFadden’s (1974) choice model, there is a set of unordered choices, say, 1,2,...., . Let be an indicator variable for the actual choice of collateral made by a fi nancial institution (FI). In particular,
if the institution chooses asset on day , and for . The independent variables in the model, , can be broken down into attributes of the choices on day , , and individual characteristics of the fi rm on day , .1
Unordered-choice models are motivated by a random-utility model. FIs maximize utility (account-ing for both profi ts and the risk management of assets across its balance sheet). For a fi rm faced with choices, the utility of choice on day is
.
If the bank makes choice , it is assumed that is the maximum among the utilities. The statistical model is driven by the probability that choice is made, which is
for all other . If, and only if, the disturbances are independent and identically distributed with Weibull distribution,
,
then
1 A multinomial logit model can be utilized when only individual attributes are observed.
The conditional logit model is intended for prob-lems where choices are made based at least partly on observable attributes of each alternative. For the current model to allow for individual specifi c effects, dummy variables for the choices have to be created. These are then multiplied by the ’s. In this way, the coeffi cients can vary across the choices instead of the characteristics, and not drop out of the probabilities. Estimation of the model by maximum likelihood methods is straightforward, where the dependent variable is coded as either 0 or 1. The log-likelihood function is
,
where is one when alternative is chosen at time and zero otherwise. The model is slightly different
from a regular logistic regression in that the data are grouped and the likelihood is calculated relative to all other possible choices that the institution could have made.2 In a model that is estimated for multiple FIs, the above equations are replicated for each FI and the log-likelihood function includes an additional summation across the FIs.
2 Conditional and multinominal logit models are convenient but assume independ-ence from irrelevant alternatives. Specifi cally, a third alternative does not affect the relative odds between alternatives and .
The current international fi nancial crisis has resulted in calls for improvements in risk-management systems in fi nancial institutions
(FIs), and an increased role for regulators dealing with these systems.1 These recommendations make a distinction between macroprudential and micropru-dential regulation. Microprudential regulation deals with the detailed regulation of a bank, including its risks and capital adequacy. Macroprudential regula-tion focuses on system-wide risks, which result from risks that occur in the trading that takes place between banks and the rest of the fi nancial system. This article will not deal with the various recommen-dations that have been made with regard to macro-prudential regulation, but will focus instead on the important interface between microprudential and macroprudential regulation. This interface is critical in bank and FI risk management, as well as in attempts by microprudential regulatory systems to deal with the impact of systemic macroprudential effects on individual banks or FIs.
What is not widely appreciated are the complexities in managing risk-management systems. Designing and operating these systems is a diffi cult task, requiring a careful blend of modern fi nance and banking theory; quantitative methods; and judgment based on long experience in credit analysis, legal and accounting rules, and other key areas. Yet too often it is assumed that improvements can be made by better use of data, increased microprudential regulation, reducing perverse incentives, and so on. These are all worthy
* This article has drawn material from a longer and more technical working paper (Milne 2008b).
† Special Adviser at the Bank of Canada, 2008–09.1 There are several international reports. For example, see the de Larosière report (2009)
to the European Central Bank. For the United Kingdom, see the Turner Review (Financial Services Authority 2009a) and the response of the Financial Services Authority (2009b). For the United States, see Acharya and Richardson (2009), which provides a detailed analysis of the crisis and of various regulatory failures and reforms.
Risk-management systems in fi nancial institutions • have come under increasing scrutiny in light of the current fi nancial crisis, resulting in calls for improvements to these systems and an increased role for regulators dealing with them.
The basic theory and practice of modern risk • management is complex. Given the serious failures manifest in the current crisis, some possible strategies that can improve the per-formance of risk management and regulatory practice should be considered.
Prudential regulation should focus on failures • within the fi nancial fi rm and in the market inter-actions between fi rms.
Market failures resulting from liquidity and systemic • risks call for new techniques that will require the input and co-operation of fi nancial institutions and regulators.
The Complexities of Financial Risk Management and Systemic Risks*Frank Milne†
15 THE COMPLEXITIES OF FINANCIAL RISK MANAGEMENT AND SYSTEMIC RISKS
BANK OF CANADA REVIEW SUMMER 2009

objectives, but they miss the intricacy at the heart of the risk-management process. I will argue that the complex issues involved require careful analysis of the theory and application of modern risk-management systems, and, in particular, that the basic theories underpinning many asset-trading and risk-management systems in FIs have assumed away systemic effects. Thus, they mislead some FIs into taking on unmeas-ured systemic risks. Although experienced risk managers use the quantitative systems as a guide, they adapt decisions to take into account qualitative information and effects that are unmodelled, or were diffi cult to model, in the current systems. In spite of this complexity, however, and the serious failures manifest in the current crisis, there are ways to make the necessary changes. In this article, I propose to review some possible strategies that can improve the performance of risk management and microprudential regulatory practice.
Using this microanalysis, or “bottom-up” approach, permits light to be thrown on possible causes of systemic risks in the fi nancial system. Links can also be drawn between the microprudential regulation of risk-management systems and the missing elements in these systems that imply systemic risks. To under-stand this argument, the basic FI risk-management problem needs to be explored, considering its strengths and weaknesses. FI risk-management systems should then be embedded in markets with interacting FIs, thus providing the links between FIs and fi nancial markets. This latter technique is sometimes called a “network” approach,2 but economists will recognize it as a general-equilibrium analysis for a competitive economy, or as a strategic approach in the industrial organization literature on oligopolies. An additional benefi t of this type of analysis is that it provides a consistent framework for discussing both micropru-dential risk-management analysis and problems with systemic risk. The framework is not complete—there are serious gaps in our knowledge—but this can be a fruitful way of thinking about fi nancial crises and prudential regulation.
Risk-Management Systems:
The Issues
Risk-management systems have evolved over many decades. FIs that issue credit have long used credit-ranking systems to manage their credit books. As well, they use other methods to manage credit risk,
2 For an early analysis of this problem, see Allen and Gale (2000). See also their survey of the more recent literature in Allen and Gale (2007, Chapter 10).
such as adjusting rates, collateral, and individual exposures, and procedures for workouts in default. Because much of the lending book was largely illiquid, banks had limited ability to hedge their risks. Over time, these systems have become increasingly mech-anized through credit-scoring systems and other means. But big changes have occurred more recently when securitization allowed FIs increasingly to hedge and trade credit risks. This required different methods for pricing, hedging, and managing credit exposures that had to be integrated into more traditional systems. Fundamental problems occurred in that integration, problems that became obvious during the recent crisis.
The problems for private sector risk-management systems can be grouped in two broad categories: (i) the underlying theoretical formulation of risk-management systems, and (ii) statistical calibration. The existing models are a synthesis of traditional credit systems and the effi cient-markets (Arrow-Debreu) model of trading, hedging, and pricing assets. This model, if taken seriously, implies that there is a dynamic factor structure that can be used to price assets. These factors (after diversifi cation) can be traded in frictionless, competitive markets and used to price assets by arbitrage methods. In essence, the model is a general-equilibrium economy plus a dynamic linear system for hedging and pricing assets and their derivatives. Unfortunately, this model implies that the fi nancial system and trading of fi nancial derivatives do not add economic value; it is welfare irrelevant. Modern banking theory takes this theor-etical defi ciency seriously and introduces various frictions to make sense of banking, fi nancial inter-mediation, and sophisticated fi nancial systems. The internal credit and trading operations of FIs are not seen as substitutes for markets, but as comple-mentary institutions, solving complicated agency and informational problems that the frictionless market cannot solve.3
Banking theory has made very limited inroads into the theory and practice of risk management, where modelling has been dominated by the frictionless, effi cient-market model masquerading under the title of fi nancial engineering. Literature on the latter topic has recently been attempting to cope with the theor-etical complexities introduced by frictions (e.g., transactions costs and illiquidity) through reduced-form methods; however, the more general strategic problems of concern in the banking literature have been ignored. The theoretical risk-management
3 For an excellent, readable discussion of this point plus insightful comments relating to risk management and regulatory failures in the crisis, see Hellwig (2008).
16THE COMPLEXITIES OF FINANCIAL RISK MANAGEMENT AND SYSTEMIC RISKS
BANK OF CANADA REVIEW SUMMER 2009
literature and some approaches for introducing liquidity into the models are surveyed in this article. A further problem is that most banking-theory models are relatively simple and of low dimension. They are exploratory, examining logical possibilities that could be consistent with stylized facts, but are far from being operational in any risk-management system. This is one of the serious gaps in our knowledge.
Serious practitioners of risk management understand this complexity only too well and are aware of the dangers of fi xations on spurious model and statistical precision.
The second defi ciency in risk-management systems concerns calibration of the frictionless risk-manage-ment model. Calibration of risk-management models relies heavily on historical time-series and cross-section fi nancial data, which exhibit well-known non-stationarities that are diffi cult to predict. Far from being a statistical analysis of a fi xed mechanical system (the prototype for fi nancial-engineering methods), sophisticated use of the models involves exploiting a degree of judgment to allow for non-quantitative observations, experience, fi nancial market innovation, legal changes, and a myriad of other risks. Serious practitioners of risk management understand this complexity only too well and are aware of the dangers of fi xations on spurious model and statistical precision (“polishing the hubcaps on a rustbucket”). Some progress is possible in this area, but the results may not be all that signifi cant. Clearly, longer and more detailed data series will help, but the fundamental causes of the non-stationarity reduce the benefi ts of adding older data.
At the regulatory level, a further layer of complexity is added in dealing with systemic risks. Whereas the risk-management systems in FIs take the environment as given—assuming a partial, competitive, frictionless approach—systemic risks require a model of the fi nancial system to track interactions between FIs and possible interactions with the real economy. An added requirement, if regulatory intervention is to be justifi ed, is to explore plausible market failure(s).4
4 This approach has been stressed by Allen and Gale (2007). The argument has been taken up by Milne (2008a, 2008b) and Acharya et al. (2009).
One such friction could be illiquid asset markets.5 There are prototype models that introduce various types of illiquidity into asset-portfolio models and arbitrage-pricing methods. In the following sections, some basic model approaches will be sketched, along with indications as to how they may be introduced into risk-management systems. Modelling illiquid markets can provide a consistent framework to explore a modifi ed risk-management system for each FI and justify plausible regulatory intervention that is impos-sible in the frictionless model. In short, illiquid markets can yield a form of pecuniary externality where a trade in an asset by one FI can alter prices and spill over via price and/or wealth effects into other FIs.
Risk-Management Theory
The simplest model of a risk-management system is the conventional two-date portfolio model, where the FI has assets and liabilities today and the distribution of net returns can be estimated tomorrow.6 The objective of risk management is to obtain accurate estimates of the return distribution and, in particular, the tail loss (i.e., low-probability losses). This estima-tion problem is not straightforward.
The FI’s asset exposures are divided into various asset classes; e.g., stocks, mortgages and commer-cial loans, and derivatives products in the trading books. Each asset class has its own unique return characteristics and estimation problems. To begin, consider the basic portfolio model taught in every undergraduate or MBA investment course, which can be made more operational by assuming that asset returns can be explained by a linear function of some basic risks or “factors.” The easiest example of this type of argument is the so-called “market model,” in which stock returns are assumed to be a linear function of the short-term interest rate, the market return index, and a random-error term. Each random risk factor is multiplied by a “factor loading” that measures the relative importance of the risk factor in explaining the impact of that factor on the stock return being modelled. The model can be extended by adding other random factors; e.g., long-term bond yields. The assumption that returns are generated by random factors has a long history in applied fi nance and underlies all risk-management systems.
5 I am not implying that this is the only type of externality possible. Counterparty risks would be another example.
6 Standard risk-management references discuss this type of model. See Crouhy, Galai, and Mark (2001) and Jorion (2007).
17 THE COMPLEXITIES OF FINANCIAL RISK MANAGEMENT AND SYSTEMIC RISKS
BANK OF CANADA REVIEW SUMMER 2009
It became apparent in the 1970s that if an FI held a large, diversifi ed equity portfolio—so that the port-folio-weighted random-error terms could be summed to approximately zero by the Law of Large Numbers—then the diversifi ed portfolio return could be approxi-mated by a linear combination of the factor returns. Furthermore, in diversifi ed portfolios, the prices of the assets would be restricted by possible arbitrage trades. To illustrate, ignore the random errors (diversi-fi able terms) and assume that the number of factors is small—say, two. A current price for each factor can then be deduced using elementary linear algebra. Employing these factor prices, every current stock price can be written as a linear combination of the underlying factor prices employing the coeffi cients as weights. If this linear pricing rule was not true, then any investor could take a diversifi ed portfolio of stocks and make unlimited profi ts. This factor-pricing theory has various names, depending on the application: the arbitrage-pricing theory; a 1-period version of fi nan-cial derivative pricing; or the generalized Modigliani-Miller theorem (see Milne 2003, Chapters 4 and 7). Hedge funds use sophisticated variants of this basic methodology.
Financial economists observed that this 1-period method (or more sophisticated multi-period versions) for pricing assets was simple and relatively easy to implement with standard econometric techniques. But it had several limitations: The theory assumed a number of random factors, but did not explain how the factors were chosen, or whether the factors that were selected varied over time. In trying to identify the factors, regression or factor analysis (Principle Components) could be used to estimate the number and types of factors and the coeffi cients in the linear equation. The question was: Were these coeffi cients stable over time, or would they be conditional on observable market variables? These issues have never been fully resolved, although, after strenuous empirical testing, there are some candidates for common factors. (In standard investment MBA textbooks, the stock market index, the short interest rate, or industry factors derived from industry equity indexes are often quoted as candidates.)
A multi-period version of the model can be modifi ed to allow for a multi-factor return structure, so that we can derive a conditional-factor structure for returns at each situation in the future. The factor structure of returns can therefore be reinterpreted as a conditional-factor model, where the coeffi cients should be interpreted as conditional, and the number of factors could (in principle) vary over time or events.
Were these coeffi cients stable over time, or would they be conditional on observable market variables?
This multi-period factor model (for a derivation, see Milne 2003, Chapters 8–10) can be used to price default-free bonds of different maturities. The trick is to observe that zero-coupon bond prices can be written as a factor-structure model (simple substitu-tions can be used to make the same argument for bond yields or forward rates). This implies that the common factors will affect bond prices, depending on the coeffi cients. Because bond prices converge to their face value at maturity, the coeffi cients cannot be stationary. Other restrictions rule out dynamic arbi-trage strategies.
These factor models have a further use. They provide a building block for derivative pricing that approxi-mates the celebrated continuous-time Black-Scholes-Merton option-pricing model (Black and Scholes 1973; Merton 1973). The idea is very simple: Assume that the stock price evolves according to a one-stochastic-factor model plus a constant. Assume that the random factor is a binomial random variable. Then, using the stock and the short-term government bond, a port-folio can be created to replicate any derivative on the stock, one period ahead. Thus, the option price must equal the price of the replicating portfolio (otherwise arbitrage profi ts exist). Using this argument iteratively over time—assuming that the volatility parameter on the random factor and the risk-free rate are constant over time—a dynamic portfolio strategy can be built to replicate any European option payoff on the stock at time of maturity. (The payoff to a European stock option is , where is the stock price at a fi xed exercise date T , and X is the fi xed exercise price.) Given a dynamic portfolio strategy that repli-cates the option return at T , the initial value of the portfolio strategy and the initial option price must be equal to avoid an arbitrage opportunity.
This model is merely a simple prototype for more complex models that use more factors, or have more complex conditional-volatility structures. Assuming a factor structure for bond prices, it is an easy step to create a bond-option model where default-free bond prices follow a simple factor structure. By 1990, the several bond-option models then in existence were implemented in short order by major FIs on Wall Street.
18THE COMPLEXITIES OF FINANCIAL RISK MANAGEMENT AND SYSTEMIC RISKS
BANK OF CANADA REVIEW SUMMER 2009

The next step made the bold assumption that the same factor idea could be applied to corporate bonds that might default. An early model by Merton (1973) had demonstrated the basic idea. Using a compari-son between a European stock option and a levered stock, he was able to price the levered stock with the Black-Scholes-Merton model. In turn, he was able, by assuming the Modigliani-Miller theorem, to deduce the value of the defaulting bond as a residual differ-ence between the value of the fi rm and its equity value. This insight has spawned a whole battery of so-called “structural models” that extend this theory to price risky corporate debt. Various proprietary models have used structural models to price corpor-ate debt.7
A second group of models—the “reduced-form” models (introduced by Jarrow and Turnbull 1995, and other theorists)—avoids describing the details of any fi rm’s fi nancial structure but models default and recovery as other factors in the evolution of the bond price. This type of model permits the extension of the default-free theory to allow for default as an additional random factor. Although simple in outline, the model can be extended in several ways; e.g., by allowing for additional information in bond ratings to add realism to the bond-pricing model. Given this structure, it is easy to use the replicating-portfolio idea to create a perfect hedge for any credit derivative that can be dreamed up. Once the replicating portfolio is created, the price of the derivative must, by the familiar arbi-trage-free argument, be the portfolio price. Other variations of these models have been developed recently to deal with complex derivatives on credit risks, and counterparty risks.8
Both types of models, and their generalized versions, have been used extensively in the credit industry to model, price, and hedge credit instruments. In turn, the models have been modifi ed to analyze collateral-ized debt obligations, mortgage-backed securities, and many variations that had allowed previously illiquid loans to be securitized and sold as part of larger packages or tranches via conduits or special-purpose vehicles. The underlying factor models used in this theory assume particular probability distribu-tions over factors that explain default risk. Having created risk factors, specifi ed joint-probability distri-butions, and made assumptions on the covariances between defaults of individual loans, a theoretical portfolio of loans can be created that reduces risks
7 See Crouhy, Galai, and Mark (2001); and Caouette et al. (2008) for extensive discussions.
8 See Lando (2004) and Meissner (2005) for surveys of this literature.
via standard diversifi cation arguments. This loan portfolio can then be sliced into tranches with increasing degrees of default risk. The safest tranche is modelled to be almost risk free; the second tranche (or mezzanine) has higher risk; and so on. The tranches can then be sold in packages of risk that mimic corporate bonds with different default risks or credit ratings.
In addition to an FI’s trading, credit, and derivative risks, other risks can be incorporated into its risk-management system. In recent years, for example, there have been attempts to model operational risks. The idea is that some FI losses have been the result of errors in pricing, hedging, or processing information; employee fraud; computer system failures; acts of terrorism; and so forth. The evidence suggests that high-frequency small losses can be characterized with some degree of accuracy (e.g., small errors in entering data), but low-frequency, large losses (e.g., large-scale fraud or IT failure) are far harder to esti-mate; the FI must therefore rely on internal audits, backup systems, and other methods to reduce risks. The operational-risk models should be used with standard auditing and security practices to minimize the risks, given the costs of implementation. Other examples of risks that are hard to quantify are legal risks and reputational risks that can arise in trading complex securities.
Risk-Management Practice
Although the general theory outlined above appears straightforward, competent implementation requires judgment, experience, and knowledge of the pitfalls in using the models.9
To begin at the simplest level, consider the problem of the portfolio with equity one period ahead. Assuming a Gaussian or normal distribution factor model, the fi rst step is to estimate the means and covariance matrix for the stocks. It is well known that the mean returns are measured with considerable error. The estimation of the covariance matrix will be sensitive to the choice of factors. Some methods use pre-specifi ed variables; e.g., interest rates, industry returns, and stock indexes; others use principal-component analysis to derive implicit factors; and still others use copula methods.
A major drawback of these methods is that the estimation is based on time series and cross-sections
9 See Crouhy, Galai, and Mark (2001) and Jorion (2007) for discussions. See also Hellwig (2008) and Milne (2008a, b) for more detailed critical observations on risk-management theory and practice in the context of the credit crisis.
19 THE COMPLEXITIES OF FINANCIAL RISK MANAGEMENT AND SYSTEMIC RISKS
BANK OF CANADA REVIEW SUMMER 2009
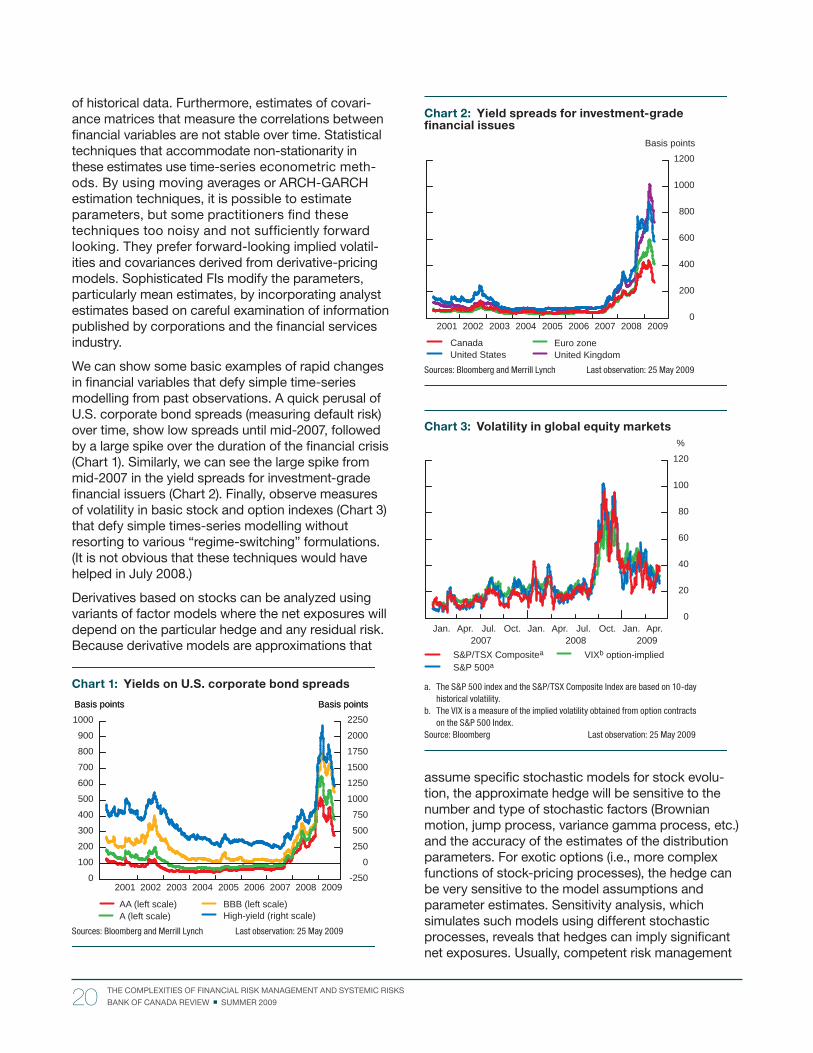
of historical data. Furthermore, estimates of covari-ance matrices that measure the correlations between fi nancial variables are not stable over time. Statistical techniques that accommodate non-stationarity in these estimates use time-series econometric meth-ods. By using moving averages or ARCH-GARCH estimation techniques, it is possible to estimate parameters, but some practitioners fi nd these techniques too noisy and not suffi ciently forward looking. They prefer forward-looking implied volatil-ities and covariances derived from derivative-pricing models. Sophisticated FIs modify the parameters, particularly mean estimates, by incorporating analyst estimates based on careful examination of information published by corporations and the fi nancial services industry.
We can show some basic examples of rapid changes in fi nancial variables that defy simple time-series modelling from past observations. A quick perusal of U.S. corporate bond spreads (measuring default risk) over time, show low spreads until mid-2007, followed by a large spike over the duration of the fi nancial crisis (Chart 1). Similarly, we can see the large spike from mid-2007 in the yield spreads for investment-grade fi nancial issuers (Chart 2). Finally, observe measures of volatility in basic stock and option indexes (Chart 3) that defy simple times-series modelling without resorting to various “regime-switching” formulations. (It is not obvious that these techniques would have helped in July 2008.)
Derivatives based on stocks can be analyzed using variants of factor models where the net exposures will depend on the particular hedge and any residual risk. Because derivative models are approximations that
assume specifi c stochastic models for stock evolu-tion, the approximate hedge will be sensitive to the number and type of stochastic factors (Brownian motion, jump process, variance gamma process, etc.) and the accuracy of the estimates of the distribution parameters. For exotic options (i.e., more complex functions of stock-pricing processes), the hedge can be very sensitive to the model assumptions and parameter estimates. Sensitivity analysis, which simulates such models using different stochastic processes, reveals that hedges can imply signifi cant net exposures. Usually, competent risk management
Chart 1: Yields on U.S. corporate bond spreads
Sources: Bloomberg and Merrill Lynch Last observation: 25 May 2009
Basis pointsBasis points
0
100
200
300
400
500
600
700
800
900
1000Basis pointsBasis points
-250
0
250
500
750
1000
1250
1500
1750
2000
2250
20092007200620052004200320022001 2008
AA (left scale)High-yield (right scale)BBB (left scale)
A (left scale)
Chart 2: Yield spreads for investment-grade fi nancial issues
Sources: Bloomberg and Merrill Lynch Last observation: 25 May 2009
0
200
400
600
800
1000
1200
200920082007200620052004200320022001
Basis points
United StatesCanada
United KingdomEuro zone
Chart 3: Volatility in global equity markets
The S&P 500 index and the S&P/TSX Composite Index are based on 10-day a. historical volatility.The VIX is a measure of the implied volatility obtained from option contracts b. on the S&P 500 Index.
Source: Bloomberg Last observation: 25 May 2009
0
20
40
60
80
100
120
Apr.Jan.Oct.Jul.Apr.Jan.Oct.Jul.Apr.Jan.2007 2008 2009
%
S&P 500aS&P/TSX Compositea VIXb option-implied
20THE COMPLEXITIES OF FINANCIAL RISK MANAGEMENT AND SYSTEMIC RISKS
BANK OF CANADA REVIEW SUMMER 2009
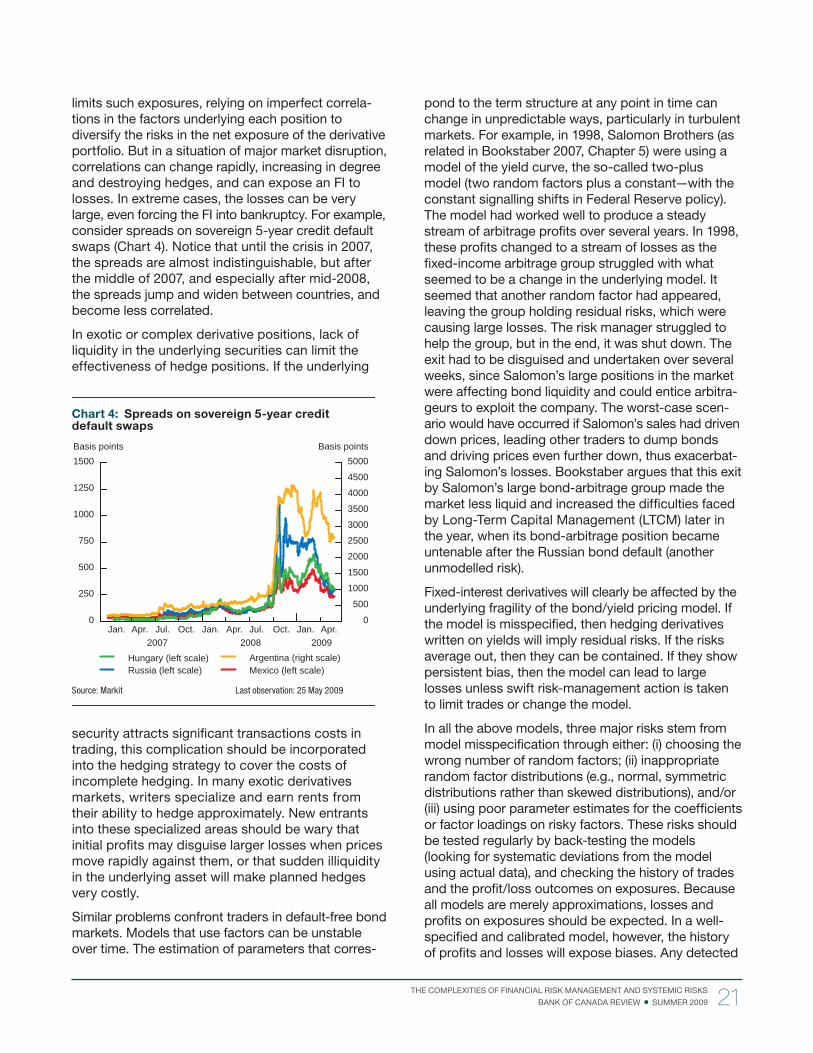
limits such exposures, relying on imperfect correla-tions in the factors underlying each position to diversify the risks in the net exposure of the derivative portfolio. But in a situation of major market disruption, correlations can change rapidly, increasing in degree and destroying hedges, and can expose an FI to losses. In extreme cases, the losses can be very large, even forcing the FI into bankruptcy. For example, consider spreads on sovereign 5-year credit default swaps (Chart 4). Notice that until the crisis in 2007, the spreads are almost indistinguishable, but after the middle of 2007, and especially after mid-2008, the spreads jump and widen between countries, and become less correlated.
In exotic or complex derivative positions, lack of liquidity in the underlying securities can limit the effectiveness of hedge positions. If the underlying
security attracts signifi cant transactions costs in trading, this complication should be incorporated into the hedging strategy to cover the costs of incomplete hedging. In many exotic derivatives markets, writers specialize and earn rents from their ability to hedge approximately. New entrants into these specialized areas should be wary that initial profi ts may disguise larger losses when prices move rapidly against them, or that sudden illiquidity in the underlying asset will make planned hedges very costly.
Similar problems confront traders in default-free bond markets. Models that use factors can be unstable over time. The estimation of parameters that corres-
pond to the term structure at any point in time can change in unpredictable ways, particularly in turbulent markets. For example, in 1998, Salomon Brothers (as related in Bookstaber 2007, Chapter 5) were using a model of the yield curve, the so-called two-plus model (two random factors plus a constant—with the constant signalling shifts in Federal Reserve policy). The model had worked well to produce a steady stream of arbitrage profi ts over several years. In 1998, these profi ts changed to a stream of losses as the fi xed-income arbitrage group struggled with what seemed to be a change in the underlying model. It seemed that another random factor had appeared, leaving the group holding residual risks, which were causing large losses. The risk manager struggled to help the group, but in the end, it was shut down. The exit had to be disguised and undertaken over several weeks, since Salomon’s large positions in the market were affecting bond liquidity and could entice arbitra-geurs to exploit the company. The worst-case scen-ario would have occurred if Salomon’s sales had driven down prices, leading other traders to dump bonds and driving prices even further down, thus exacerbat-ing Salomon’s losses. Bookstaber argues that this exit by Salomon’s large bond-arbitrage group made the market less liquid and increased the diffi culties faced by Long-Term Capital Management (LTCM) later in the year, when its bond-arbitrage position became untenable after the Russian bond default (another unmodelled risk).
Fixed-interest derivatives will clearly be affected by the underlying fragility of the bond/yield pricing model. If the model is misspecifi ed, then hedging derivatives written on yields will imply residual risks. If the risks average out, then they can be contained. If they show persistent bias, then the model can lead to large losses unless swift risk-management action is taken to limit trades or change the model.
In all the above models, three major risks stem from model misspecifi cation through either: (i) choosing the wrong number of random factors; (ii) inappropriate random factor distributions (e.g., normal, symmetric distributions rather than skewed distributions), and/or (iii) using poor parameter estimates for the coeffi cients or factor loadings on risky factors. These risks should be tested regularly by back-testing the models (looking for systematic deviations from the model using actual data), and checking the history of trades and the profi t/loss outcomes on exposures. Because all models are merely approximations, losses and profi ts on exposures should be expected. In a well-specifi ed and calibrated model, however, the history of profi ts and losses will expose biases. Any detected
Chart 4: Spreads on sovereign 5-year credit default swaps
Source: Markit Last observation: 25 May 2009
0
250
500
750
1000
1250
1500
Apr.Jan.Oct.Jul.Apr.Jan.Oct.Jul.Apr.Jan.0
500
1000
1500
2000
2500
3000
3500
4000
4500
5000Basis pointsBasis points
Hungary (left scale)Russia (left scale)
Argentina (right scale)Mexico (left scale)
2007 20092008
21 THE COMPLEXITIES OF FINANCIAL RISK MANAGEMENT AND SYSTEMIC RISKS
BANK OF CANADA REVIEW SUMMER 2009
biases should be examined, and appropriate action taken. Although this is easy to state as a general principle, in reality, the management and estimation of risks is far from perfect, especially in periods of high volatility, where correlations can change rapidly. New asset markets are particularly dangerous, in that they lack a long history of price data. A new fi nancial instrument introduced in a bull market is especially risky, since statistical estimates may not include data from bear markets or volatile trading periods. This can lead to under-estimation of risks and to complacency in the risk-management system.
New asset markets are particularly dangerous, in that they lack a long history of price data.
Finally, we consider one of the most diffi cult markets to model effectively: the market for credit risks. We can model the short-term returns on risky bonds as a factor model. But, taking a longer-term view, bonds that have default risk can be modelled as a stochastic process where the bond prices depend on possible future default and the stochastic recovery rates. Because default can occur before the bond or loan expires, default becomes a strategic decision by the lender and the borrower. By using extra credit lines, a borrower can avert problems in paying the coupon or principal. Clearly, the astute lender will be aware of the borrower’s net situation, collateral, other credit liabilities, etc. Furthermore, other lenders will be aware of any diffi culties and will move to protect their loans. As is well known, borrowers with multiple creditors will initiate a strategic game where each player will act to protect their interests. Traditionally, banks, in lending to households or businesses, safeguard their interests by imposing collateral requirements and, in the case of large loans, through pre-emptive interven-tion and sophisticated workouts. Because default may be precipitated by bad luck or bad management, a single lender in a carefully managed workout can act to increase the value of its loan by taking actions within the confi nes of the bankruptcy code.
Credit derivative payoffs, hedging, and pricing will be sensitive to the specifi cation of default and any strategic decisions by the defaulting fi rm or lenders. This effect has been observed recently in the United States, where strategic decisions on default and reinterpretations of the bankruptcy code are affecting the payoffs of credit derivatives.
With several lenders with different loan conditions, the workout is more complicated, since the interests of the lenders may diverge. For example, lenders with different seniority, collateral agreements, exposures through derivatives written on the borrower’s debt, and so on can have very different responses to liquidation or other courses of action. A smoothly functioning workout requires legal and credit sophisti-cation. The smaller the group involved, the easier it is, in general, to manage the workout. The more diverse and larger the group, the harder it will be to work together without generating mistrust and misunder-standings. Another factor is lenders who have been involved in previous workouts together. Lenders know that, in a recurring situation, taking a tough line in a current workout can rebound in retaliatory actions by other lenders in later workouts. The possibilities for gaming in repeated workouts, gaining reputations for toughness, etc. can lead to sophisticated play on the part of FIs. In turn, this can reduce the benefi ts to inexperienced lenders who are entrants in large loan markets.
Given these caveats concerning loan defaults, FIs run their loan books by using different models and procedures, depending on the type and scale of loan. Large loans are managed by using careful legal and credit analysis, with continual monitoring for signs of distress. Banks use in-house and proprietary models to analyze large loan or private bond exposures. These models may use detailed structural models as inputs to evaluate the fi rm’s bond or, in the case of smaller loans, a reduced-form model may be used because it is not profi table to analyze the details of the fi rm. In reality, elements of both models are used, depending on the detail required. If the corporate bond is traded in a liquid market, the FI can use the market value to check its own valuation methods. But many corporate bond issues are illiquid, and constant marking-to-market is not an option, so that the FI must rely on its own valuations and outside credit-rating agencies.
Credit agencies specialize in evaluating corporate bonds and other credit instruments. Their evaluations use various models and data sources to give a bond a letter rating (AAA, AA, etc.) that refl ects default risk and expected recovery rate. The agencies alter ratings infrequently, arguing that ratings should be “through the cycle.” In other words, they do not use the most current data; the rating can lag until a major event triggers a changed rating. This lag has led to embarrassing situations in the past where large companies (e.g., Enron) have been in serious fi nancial trouble and yet their bonds have been showing high
22THE COMPLEXITIES OF FINANCIAL RISK MANAGEMENT AND SYSTEMIC RISKS
BANK OF CANADA REVIEW SUMMER 2009
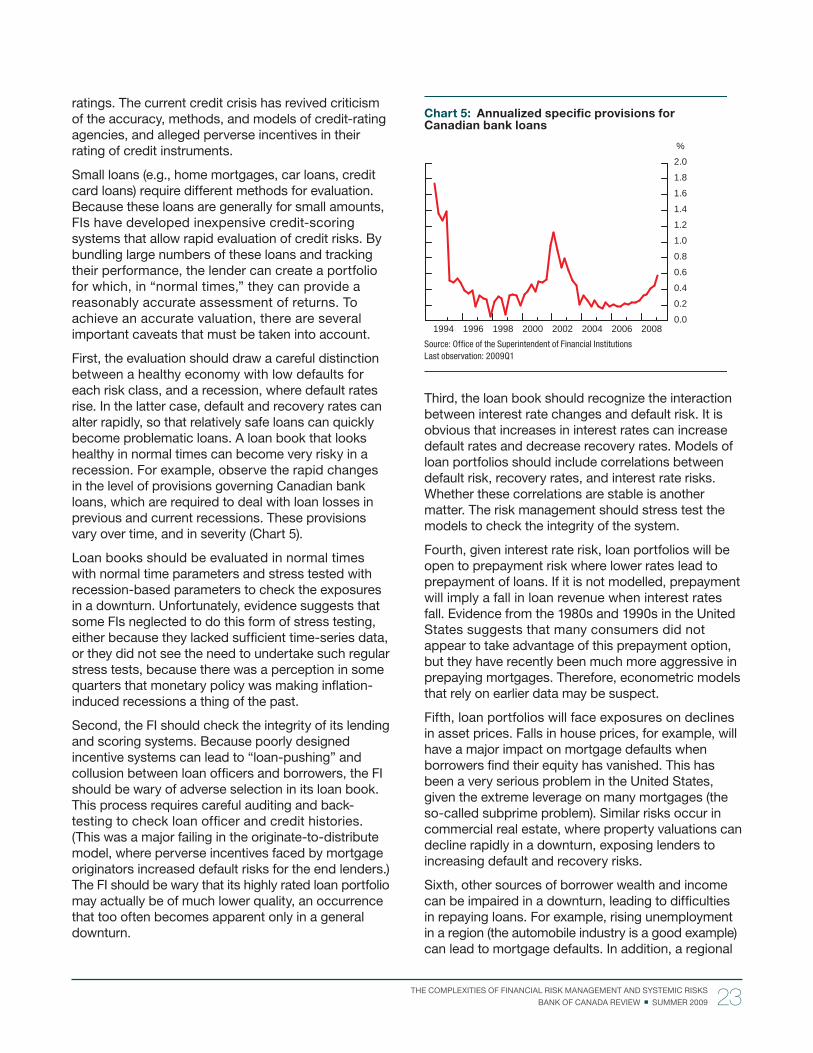
ratings. The current credit crisis has revived criticism of the accuracy, methods, and models of credit-rating agencies, and alleged perverse incentives in their rating of credit instruments.
Small loans (e.g., home mortgages, car loans, credit card loans) require different methods for evaluation. Because these loans are generally for small amounts, FIs have developed inexpensive credit-scoring systems that allow rapid evaluation of credit risks. By bundling large numbers of these loans and tracking their performance, the lender can create a portfolio for which, in “normal times,” they can provide a reasonably accurate assessment of returns. To achieve an accurate valuation, there are several important caveats that must be taken into account.
First, the evaluation should draw a careful distinction between a healthy economy with low defaults for each risk class, and a recession, where default rates rise. In the latter case, default and recovery rates can alter rapidly, so that relatively safe loans can quickly become problematic loans. A loan book that looks healthy in normal times can become very risky in a recession. For example, observe the rapid changes in the level of provisions governing Canadian bank loans, which are required to deal with loan losses in previous and current recessions. These provisions vary over time, and in severity (Chart 5).
Loan books should be evaluated in normal times with normal time parameters and stress tested with recession-based parameters to check the exposures in a downturn. Unfortunately, evidence suggests that some FIs neglected to do this form of stress testing, either because they lacked suffi cient time-series data, or they did not see the need to undertake such regular stress tests, because there was a perception in some quarters that monetary policy was making infl ation-induced recessions a thing of the past.
Second, the FI should check the integrity of its lending and scoring systems. Because poorly designed incentive systems can lead to “loan-pushing” and collusion between loan offi cers and borrowers, the FI should be wary of adverse selection in its loan book. This process requires careful auditing and back-testing to check loan offi cer and credit histories. (This was a major failing in the originate-to-distribute model, where perverse incentives faced by mortgage originators increased default risks for the end lenders.) The FI should be wary that its highly rated loan portfolio may actually be of much lower quality, an occurrence that too often becomes apparent only in a general downturn.
Third, the loan book should recognize the interaction between interest rate changes and default risk. It is obvious that increases in interest rates can increase default rates and decrease recovery rates. Models of loan portfolios should include correlations between default risk, recovery rates, and interest rate risks. Whether these correlations are stable is another matter. The risk management should stress test the models to check the integrity of the system.
Fourth, given interest rate risk, loan portfolios will be open to prepayment risk where lower rates lead to prepayment of loans. If it is not modelled, prepayment will imply a fall in loan revenue when interest rates fall. Evidence from the 1980s and 1990s in the United States suggests that many consumers did not appear to take advantage of this prepayment option, but they have recently been much more aggressive in prepaying mortgages. Therefore, econometric models that rely on earlier data may be suspect.
Fifth, loan portfolios will face exposures on declines in asset prices. Falls in house prices, for example, will have a major impact on mortgage defaults when borrowers fi nd their equity has vanished. This has been a very serious problem in the United States, given the extreme leverage on many mortgages (the so-called subprime problem). Similar risks occur in commercial real estate, where property valuations can decline rapidly in a downturn, exposing lenders to increasing default and recovery risks.
Sixth, other sources of borrower wealth and income can be impaired in a downturn, leading to diffi culties in repaying loans. For example, rising unemployment in a region (the automobile industry is a good example) can lead to mortgage defaults. In addition, a regional
Chart 5: Annualized specifi c provisions for Canadian bank loans
Source: Offi ce of the Superintendent of Financial InstitutionsLast observation: 2009Q1
0.0
0.2
0.4
0.6
0.8
1.0
1.2
1.4
1.6
1.8
2.0
20082006200420022000199819961994
%
23 THE COMPLEXITIES OF FINANCIAL RISK MANAGEMENT AND SYSTEMIC RISKS
BANK OF CANADA REVIEW SUMMER 2009
pricing models assumes frictionless markets. Although risk-management practice tries to grapple with market liquidity in an ad hoc fashion, the basic risk-management theory is founded on symmetric information and competitive market models. This familiar effi cient-markets model, if taken literally, implies that markets are complete and Pareto optimal and that any fi nancial structure or derivative security can be priced by arbitrage-pricing rules. What is more, any fi nancial structure has a zero net present value. In this model, if asset markets are complete, the allocations are effi cient, leaving no role for govern-ment intervention to repair any market ineffi ciency. The model can be modifi ed to be more realistic (i.e., so that asset markets are incomplete), but then the allocation is generally no longer effi cient. Furthermore, it is well known that the introduction of new asset markets acts as a second-best modifi cation that can have perverse welfare results.10
Traditional banking theory assumes, however, that fi nancial markets, and the market for loans especially, are far from perfect. Loan markets (and markets with counterparty risks) are plagued by various degrees of asymmetric information and the possibility of strategic behaviour by lenders, borrowers, competing FIs, and regulators. The lender tries to sort borrowers accord-ing to risk and to avoid adverse selection in acquiring bad loans. Lenders try to avoid moral hazard, where borrowers will be tempted into taking riskier invest-ments, paying higher dividends, and so on after the loan contract has been signed. Well-funded FIs can predate distressed competitors. Regulators and FIs are locked in a strategic game where their current actions, or perceived strategies, can have signifi cant effects on the current or future behaviour of FIs and regulators.
Modern banking theory has tried to explain the structure and performance of banks by appealing to their historic role in collecting deposits and lending those funds to fi rms, households, and branches of government. Recall that demand deposits are callable
10 This result appears counterintuitive. One would expect that increasing the number and type of traded assets would improve welfare. In a partial-equilibrium analysis where all other asset prices are fi xed, this might appear correct. But in a general-equilibrium analysis with incomplete asset markets with multiple periods and commodities, and multiple agents, where all the effects are traced through agent responses and market prices adjust, etc., there are examples where (i) all agents are better off; (ii) cases where some agents can be made worse off, some better off; and (iii) in some extreme cases, all agents can be made worse off. If an agent in the economy controlled the introduction of the new asset market, then they would choose to introduce the asset only if it benefi ted themselves, but not necessarily other agents—they would be a monopolist. (For early discussions of these second-best results, based on asset-exchange economies, see Hart 1976, and Milne and Shefrin 1986. For a textbook discussion, see Magill and Quinzii 1996.) At a practical level, there have been allegations in the United States that the introduction of certain derivative products by some FIs have had a deleterious impact on traders in related markets.
decline in an industry can have a negative impact on commercial loans so that commercial loan and mortgage defaults and recovery rates will be correl-ated.
Aggregation of Exposures
The FI can generate its consolidated return distribution by aggregating the loan, equity, trading, and derivative books, taking into account any correlations among the different books. In particular, model specifi cation and parameter estimation are critical, but the model estimation should not be viewed in isolation from the rest of the risk-management system. This is especially true with credit risks, where default risk is sensitive to the incentives and actions of borrowers and other lenders.
The resulting estimated distribution of returns, espe-cially the probability of losses of various degrees of severity, is examined, and the value at risk (VaR) calculated. Risk-management managers are well aware that the VaR measure is only as accurate as the estimated return distribution that has been gener-ated. Furthermore, the VaR measure (which was originally motivated by assuming a normal distribution of returns on securities over a short horizon) can provide a biased measure of the risks faced by the FI if the distribution is not normal. Indeed, given the non-normal returns on defaulting bonds and wide-spread use of derivatives and other instruments, it should not be surprising that the loss tail of the aggregate distribution is not normal, but will be fat-tailed, or may even have large bumps owing to derivative exposures. In the case of banks and other regulated FIs, the reported distribution and VaR will be examined to see if they violate Basel II require-ments (empirical rules of thumb as to the amount of capital that should be held by the FI to safeguard against default). Given the serious caveats discussed above concerning the generation of the return distri-bution, and the resulting VaR, we should be wary of the results and of any policy or regulatory actions based on the precision of such constructions.
Limitations in Banking and
Risk-Management Theory and
Practice
In the previous sections, the basic theory and practice of risk management were outlined, emphasizing hedging and the use of market valuations and deriva-tives. The theory that underlies these hedging and
24THE COMPLEXITIES OF FINANCIAL RISK MANAGEMENT AND SYSTEMIC RISKS
BANK OF CANADA REVIEW SUMMER 2009
subsidies will merely reinforce future moral hazard problems in regulating FIs.
Given the potential moral hazard inherent in insuring deposits (or other risky FI activities), government schemes require careful monitoring to contain the incentives of bank management to invest in risky loans that will increase default risk for depositors and, in turn, be passed on to the deposit insurance scheme. A private scheme would face the same problem. In principle, this is no different from the classic moral hazard problem facing bondholders or lenders in a levered fi rm. One reason given for having formal risk-management systems monitored by regulators in banks is to provide deposit insurance regulators with data to enforce capital requirements and to monitor and contain risks that would adversely affect their deposit insurance risks. These risks can be serious and amount to large sums: The Savings and Loans debacle in the United States is an historical example of the costs of loose regulation, perverse incentives for banks and regulators, and subsequent government bailouts.13
The Savings and Loans debacle in the United States is an historical example of the costs of loose regulation, perverse incentives for banks and regulators, and subsequent government bailouts.
Classical banking theory needs to be extended to deal with investment banking and other FI activity that does not rely on depositors. In this type of FI, the role of depositors is taken by short-term lenders operating through conduits and other structures. Although the model has some differences in detail, the basic story is very similar in that the FI is investing long and borrowing short. By creating off-balance-sheet entities, the FIs tried to reduce their exposures. But as recent events have demonstrated, the model failed spectacularly.
There is a fundamental problem with the theory of risk management. It is motivated by the effi cient markets theory that is calibrated using sophisticated statistical methods. Alternatively, recent banking theory is motivated by small-dimension models (similar to the techniques used in modern industrial organization theory) where the complexity of the modern FI is
13 See Kane (1989); Stern and Feldman (2004); and Barth, Caprio, and Levine (2006).
by the depositor. If the deposits are invested in liquid markets and the bank has suffi cient equity to remain solvent, there is no problem with withdrawals on demand. But if the deposits are in higher-yielding and illiquid assets, then the bank must have suffi cient lower-yielding liquid assets to satisfy withdrawals. In a classic paper, Diamond and Dybvig (1983) showed that it is possible to have a bank run where depositors panic trying to liquidate ahead of other depositors. In addition, they showed that a stylized model of govern-ment deposit insurance can eliminate the run equilib-rium. This basic model has been extended in many directions to provide a rich set of theories exploring the sensitivity of the result to real shocks and other modifi cations.11 Indeed, the role of deposits is not crucial, and they can be replaced by liquid short-term loans. This variation of the model is far more appro-priate to investment banks and to non-bank asset-backed commercial paper conduits that do not issue deposits but fi nance illiquid long-term investments with short- and medium-term borrowing. These models provide a series of related frameworks to analyze the discussion in Bagehot (1873) and a subsequent large and informal literature discussing banking instability and regulation. This informal (and later, the formal) theory has been used to justify bank regulation, central bank intervention, and public deposit insurance schemes. But as Allen and Gale (2007) argue, regula-tions should be targeted to solve particular market failures: Unless particular failures can be identifi ed, regulations and interventions aimed at vaguely speci-fi ed “banking instability” may do more harm than good.12
A recent example of such an intervention has been the various support mechanisms to large U.S. banks introduced by the U.S. Treasury and Federal Reserve. These subsidies to FIs have been deemed necessary for the stability of the fi nancial system, supporting FIs that are “too big, or too interconnected, to fail.” Some commentators argue that these FIs had a faulty business model that underestimated the risks inherent in credit markets. Because that business model failed, the FIs should have been forced to make an orderly exit from the market, and not had their businesses subsidized. The subsidies and precedents for future
11 See Freixas and Rochet (2008) and Allen and Gale (2007) for recent surveys.12 Allen and Gale observe that some liquidity crises can be misnamed. These liquidity
“crises” may be optimal, depending on the source of the demand for liquidity and the structure of the fi nancial market. If asset markets are competitive and complete, then liquidity demands by depositors can be effi ciently accommodated by the private market and agents. But if asset markets are incomplete and/or uncompetitive and ineffi cient, then liquidity demands may imply ineffi ciency, and possible regulatory or central bank interventions may be justifi ed. This is the ground for rationalizing liquidity intervention by central banks as a lender of last resort.
25 THE COMPLEXITIES OF FINANCIAL RISK MANAGEMENT AND SYSTEMIC RISKS
BANK OF CANADA REVIEW SUMMER 2009
It has become apparent during the current crisis that fi nancial risk-management systems have been inadequate in dealing with liquidity and other systemic risks.
A second notion of liquidity involves market depth, where the size of a trade can infl uence an asset price. Economists know that this phenomenon demonstrates market power on the part of the trader. Several recent papers have explored the consequences of market depth, theoretically and empirically. As a fi rst step, consider a simple situation where an FI faces a liquid, riskless asset and an illiquid asset, where there is an underlying stochastic price process that will be affected by the FI’s trades. Simple examples show that this problem is non-trivial to analyze, and can induce selling parcels of the asset over time, so as to avoid dumping the asset in a one-time fi re sale. More complicated situations can be constructed when there are several illiquid assets, forcing the FI to choose which asset to liquidate, how much per period, and in which order. This problem involves a tricky analysis of dynamic portfolio rebalancing, owing to correlated risks and illiquidity.
A related but even more complex problem occurs when the FI is aware of other traders who can infl u-ence asset prices. To begin, consider two FIs that have simple portfolios of a riskless liquid asset and one risky illiquid asset. Assume that the risky asset has a residual demand coming from a large fringe of small traders. Economists recognize this model as a dynamic Cournot oligopoly model.15 Although the verbal description of the model seems simple enough, its analysis is far from straightforward. It is possible, for example, to construct situations where a distressed FI16 desiring to sell down the illiquid asset, will be front-run by their competitor (i.e. the competitor will sell the asset earlier than the distressed trader), thus driving down the price even further, before the com-petitor, exploiting the competitive fringe, buys back at a low fi re-sale price. There are numerous variations on this story, some of which allow for strategic behaviour by an interventionist central bank. These strategic models are still in an elementary stage and require
15 The following discussion is a brief, informal exposition of the paper by Brunnermeier and Pedersen (2005). Recent research on strategic liquidity problems draws on the insights of this and more recent, related papers.
16 The distress can come from a variety of causes; e.g., mass withdrawals, major portfolio losses, binding VaR constraints, or margin calls that require portfolio rebalancing.
characterized by a series of related, but not wholly consistent, models. Although this modern banking theory is highly instructive in exploring the subtleties of banking structures, it is not operational in the way that risk-management systems have been used by FIs. There is a clear gap between theory and practice in trying to have an operational theory that incorpor-ates signifi cant elements of the frictions we see in banking and other FIs and yet can be implemented using existing or obtainable data.
Risk-Management Systems:
Problems in Modelling Liquidity
and Other Systemic Risks
It has become apparent during the current crisis that fi nancial risk-management systems have been inad-equate in dealing with liquidity and other systemic risks.14 This is not just a matter of laxness on the part of banks or other FIs, but a serious defi ciency in the basic theoretical models used in risk-management systems. Although there are attempts to add “liquid-ity” risks at the end of the risk-management analysis, these are an afterthought. Although we do have some simple theoretical models of asset markets, portfolio strategies, and asset pricing with various notions of illiquidity, these models would require much more work to integrate them into workable risk-management systems.
Illiquidity can be modelled in several ways. In the simplest formulation, it can be modelled by assuming a fi xed bid-ask spread for the price of an asset. In other words, this approach assumes a more realistic situation, where traded assets have quoted (and different) bid and ask prices. This type of model introduces fundamental changes in asset-portfolio strategies where the bid-ask spread is modelled as part of the portfolio problem. Simple examples show that it will imply a more cautious use of illiquid assets and a greater holding of liquid assets in the face of more volatile liabilities. Other examples show that dynamic hedging of derivatives will imply approximate bands for derivative prices, rather than unique deriva-tive prices obtained from conventional frictionless models. If bid-ask spreads can vary randomly and, in extreme cases, widen to such an extent that it is optimal not to trade in these situations, then ex ante optimal trading strategies will imply much more conservative behaviour.
14 This section draws on far more detailed and technical sections in Milne (2008b), which provides a bibliography of recent research in this area.
26THE COMPLEXITIES OF FINANCIAL RISK MANAGEMENT AND SYSTEMIC RISKS
BANK OF CANADA REVIEW SUMMER 2009
analyzing possible market failures and, hopefully, allow the use of conventional microeconomic tools to analyze the effectiveness of appropriate policy instruments. For example, FIs will require knowledge of the aggregate behaviour of other FIs in the markets, if they are to model systemic risks in their risk-man-agement systems. Regulators can play an important intermediary role in iterated stress-testing procedures to indicate possible feedbacks in asset prices from herd-like selling in certain asset markets. These types of regulatory intervention are at an early stage of development and require much more research and analysis.
Conclusion
In this article, I have outlined the complexity inherent in any modern risk-management system, which arises because there are shortcuts in the theoretical models. The professional risk manager must be aware of these simplifi cations and of the real dangers that fl ow from a mechanical application of the models. The problems are compounded by the diffi culties in sensible calibra-tion of model parameters. These are non-trivial prob-lems that cannot be regulated away in any simple fashion. Furthermore, as has been indicated, sys-temic risks can be introduced by embedding the basic risk-management model of an FI within a market system or fi nancial network. Far from being a novel problem, some (perhaps all) systemic-risk problems can be considered in the abstract as traditional market failures amenable to the tools of microeconomic analysis.
careful analysis to explore their many implications and defi ciencies.
The oligopoly model of illiquidity can provide a con-venient framework for exploring one source of sys-temic risk, where trades of one (or more) large FIs will affect asset prices and the wealth of other FIs. This pecuniary externality can affect a non-trading FI by reducing the value of its assets. If the asset price falls far enough, the non-trading FI may face VaR and/or margin constraints that will induce it to trade so as to rebalance its portfolio. As recent events have illus-trated, if this phenomenon affects a number of FIs, it can induce a cascade of selling and further decreases in asset prices in a downward spiral.
Using this basic approach, it is not hard to see, in principle, how some types of systemic risks might be analyzed. The pecuniary externalities induced from trading in illiquid markets can spill over into the port-folio decisions of other FIs. Arguments that central bank intervention can be rationalized by attempts to reduce these price effects can be constructed.17 But such arguments should be explored carefully because FI behaviour will be infl uenced by potential regulatory intervention in illiquid markets, implying that FI strat-egies will economize on liquid balances, relying on expectations of substantial central bank intervention.
These are sketches of some simple ideas for model-ling illiquid asset markets and the possibility of embed-ding them in a risk-management model. A bonus in this approach is that it will provide a framework for
17 See Acharya, Gromb, and Yorulmazer (2008) for a recent example.
27 THE COMPLEXITIES OF FINANCIAL RISK MANAGEMENT AND SYSTEMIC RISKS
BANK OF CANADA REVIEW SUMMER 2009
Acharya, V. V., D. Gromb, and T. Yorulmazer. 2008. “Imperfect Competition in the Inter-bank Market for Liquidity as a Rationale for Central Banking.” CEPR Discussion Paper No. DP6984.
Acharya, V. V., L. Pedersen, T. Philippon, and M. Richardson. 2009. “Regulating Systemic Risk.” In Restoring Financial Stability: How to Repair a Failed System, edited by V. V. Acharya and M. Richardson, Chapter 13. Hoboken. NJ: Wiley.
Acharya, V. V. and M. Richardson, eds. 2009. Restoring Financial Stability: How to Repair a Failed System. Hoboken, NJ: Wiley.
Allen, F. and D. Gale. 2000. “Financial Contagion.” Journal of Political Economy 108 (1): 1–33.
———. 2007. Understanding Financial Crises. Oxford: Oxford University Press.
Literature Cited
Literature Cited (cont’d)
Bagehot, W. 1873. Lombard Street: A Description of the Money Market. New York: Scribner. Reprinted with foreword by P. L. Bernstein. New York: Wiley, 1999.
Barth, J. R., G. Caprio, and R. Levine. 2006. Rethink-ing Bank Regulation: Till Angels Govern. New York: Cambridge University Press.
Black, F. and R. M. Scholes. 1973. “The Pricing of Options and Corporate Liabilities.” Journal of Political Economy 81 (3): 637–54.
Bookstaber, R. M. 2007. A Demon of Our Own Design: Markets, Hedge Funds, and the Perils of Financial Innovation. Hoboken, NJ: Wiley.
Brunnermeier, M. K. and L. H. Pedersen. 2005. “Predatory Trading.” The Journal of Finance 60 (4): 1825–63.
Caouette, J. B., E. I. Altman, P. Narayanan, and R. W. J. Nimmo. 2008. Managing Credit Risk: The Great Challenge for Global Financial Markets. Hoboken, NJ: Wiley.
Crouhy, M., D. Galai, and R. Mark. 2001. Risk Man-agement. New York: McGraw-Hill.
de Larosière, J. 2009. Report to the European Com-mission by the High-Level Group on Financial Supervision in the EU. Brussels: The High-Level Group, February, <http://www.ecb.europa.eu/home/html/search.en.html>.
Diamond, D. W. and P. H. Dybvig. 1983. “Bank Runs, Deposit Insurance, and Liquidity.” Journal of Political Economy 91 (3): 401–19.
Financial Services Authority. 2009a. The Turner Review: A Regulatory Response to the Global Banking Crisis. London: FSA.
———. 2009b. “A Regulatory Response to the Global Banking Crisis.” FSA Discussion Paper 09/2. Available at <http://www.fsa.gov.uk/pubs/discussion/dp09_02.pdf>.
Freixas, X. and J.-C. Rochet. 2008. Microeconomics of Banking. 2nd ed. Cambridge, MA: MIT Press.
Hart, O. D. 1976. “On the Optimality of Equilibrium When the Market Structure Is Incomplete.” Journal of Economic Theory 11 (3): 418–43.
Hellwig, M. 2008. “Systemic Risk in the Financial Sector: An Analysis of the Subprime-Mortgage Financial Crisis.” Preprint of the Max Planck Institute for Research on Collective Goods, 2008/43. Available at <http://www.coll.mpg.de/pdf_dat/2008_43online.pdf>.
Jarrow, R. A. and S. M. Turnbull. 1995. “Pricing Derivatives on Financial Securities Subject to Credit Risk.” The Journal of Finance 50 (1): 53–85.
Jorion, P. 2007. Value at Risk: The New Benchmark for Managing Financial Risk, 3rd ed. New York: McGraw-Hill.
Kane, E. J. 1989. The S & L Insurance Mess: How Did It Happen? Washington, DC: Urban Institute Press.
Lando, D. 2004. Credit Risk Modeling: Theory and Application. Princeton, NJ: Princeton University Press.
Magill, M. and M. Quinzii. 1996. Theory of Incomplete Markets. Cambridge, MA: Cambridge University Press.
Meissner, G. 2005. Credit Derivatives: Application, Pricing, and Risk Management. Malden, MA: Blackwell.
Merton, R. C. 1973. “Theory of Rational Option Pricing.” Bell Journal of Economics 4 (1): 141–83.
Milne, F. 2003. Finance Theory and Asset Pricing, 2nd ed. Oxford: Oxford University Press.
———. 2008a. “Anatomy of the Credit Crisis: The Role of Faulty Risk Management Systems.” C. D. Howe Institute Commentary No. 269.
———. 2008b. “Credit Crises, Risk Management Systems and Liquidity Modelling.” Queen’s University, John Deutsch Institute for the Study of Economic Policy, Working Papers on Economic Policy No. 1.
28THE COMPLEXITIES OF FINANCIAL RISK MANAGEMENT AND SYSTEMIC RISKS
BANK OF CANADA REVIEW SUMMER 2009

Literature Cited (cont’d)
Milne, F. and H. M. Shefrin. 1986. “Information and Securities: A Note on Pareto Dominance and the Second Best.” Journal of Economic Theory 43 (2): 314–28.
Stern, G. H. and R. J. Feldman. 2004. Too Big to Fail: The Hazards of Bank Bailouts. Washington, DC: Brookings Institution Press.
29 THE COMPLEXITIES OF FINANCIAL RISK MANAGEMENT AND SYSTEMIC RISKS
BANK OF CANADA REVIEW SUMMER 2009
Reallocation of resources is a widespread, constant phenomenon in a competitive econ-omy characterized by substantial fi rm hetero-
geneity and buffeted by shocks at the fi rm, sector, and economy levels. To mention only two examples, soaring commodity prices and the sharp appreciation of the Canadian dollar caused labour to be reallocated during the 2002–08 period from most manufacturing industries to the extractive sector and to sectors producing non-tradables (Dupuis and Marcil 2008). The deregulation of the U.S. telecommunications sector triggered a marked increase in resource reallocation, with many new plants and fi rms entering this sector, ineffi cient ones exiting it, and market shares changing considerably (Bartelsman and Doms 2000).
Reallocation affects output and market shares as well as the various inputs in the production process—labour, capital, and materials. A key question for research has been whether, how, and to what extent labour reallo-cation has infl uenced the productivity performance of sectors and economies—in addition to the more direct impacts of capital deepening, innovation, and human capital development. With respect to output, Baldwin and Gu (2006) fi nd that shifts in market shares across fi rms have contributed to about 70 per cent of the overall productivity growth in Canadian manufacturing over the 1979–99 period. With respect to capital, Cao (2008) estimates that an increased fl ow of productive capital across fi rms through changes in ownership could have signifi cantly boosted aggregate U.S. labour productivity in the mid-1980s. With respect to materials, Bosworth and Triplett (2007) calculate that intermediate input reallocations across sectors (industries) would have raised aggregate productivity growth in the United States in the 2000–05 period after having depressed it considerably in the 1995–2000 period.
The number of job gains and losses across fi rms • in Canada each year is roughly one-fi fth of the total number of jobs. The vast majority of this reallocation occurs within sectors (industries) rather than across sectors.
The appreciation of the Canadian dollar and • rising commodity prices led to above-average reallocation of labour across sectors over the 2005–08 period. The impact of this reallocation on productivity has been minor, however.
Labour reallocation within sectors has been • strongly related to productivity growth in Canada. Defi ning the key drivers of this type of reallocation remains an open question, one made more pertinent by the higher rates of reallocation and productivity growth in the United States than in Canada.
The Changing Pace of Labour Reallocation in Canada: Causes and ConsequencesDanny Leung and Shutao Cao, Canadian Economic Analysis*
* Danny Leung’s contribution to this article was made before his departure to Statistics Canada. The authors would like to thank Richard Dion and Bob Fay for their comments on earlier versions of this article.
31 THE CHANGING PACE OF LABOUR REALLOCATION IN CANADA: CAUSES AND CONSEQUENCES
BANK OF CANADA REVIEW SUMMER 2009
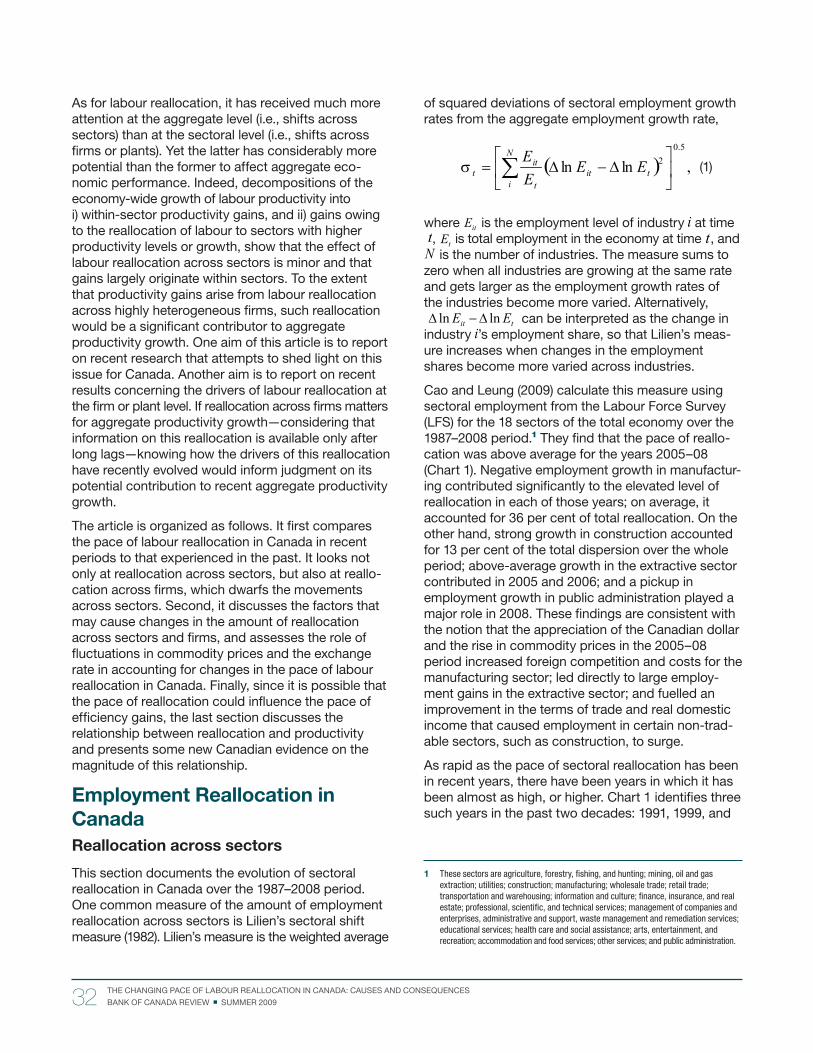
of squared deviations of sectoral employment growth rates from the aggregate employment growth rate,
(1)
where is the employment level of industry at time , is total employment in the economy at time , and
is the number of industries. The measure sums to zero when all industries are growing at the same rate and gets larger as the employment growth rates of the industries become more varied. Alternatively,
can be interpreted as the change in industry ’s employment share, so that Lilien’s meas-ure increases when changes in the employment shares become more varied across industries.
Cao and Leung (2009) calculate this measure using sectoral employment from the Labour Force Survey (LFS) for the 18 sectors of the total economy over the 1987–2008 period.1 They fi nd that the pace of reallo-cation was above average for the years 2005–08 (Chart 1). Negative employment growth in manufactur-ing contributed signifi cantly to the elevated level of reallocation in each of those years; on average, it accounted for 36 per cent of total reallocation. On the other hand, strong growth in construction accounted for 13 per cent of the total dispersion over the whole period; above-average growth in the extractive sector contributed in 2005 and 2006; and a pickup in employment growth in public administration played a major role in 2008. These fi ndings are consistent with the notion that the appreciation of the Canadian dollar and the rise in commodity prices in the 2005–08 period increased foreign competition and costs for the manufacturing sector; led directly to large employ-ment gains in the extractive sector; and fuelled an improvement in the terms of trade and real domestic income that caused employment in certain non-trad-able sectors, such as construction, to surge.
As rapid as the pace of sectoral reallocation has been in recent years, there have been years in which it has been almost as high, or higher. Chart 1 identifi es three such years in the past two decades: 1991, 1999, and
1 These sectors are agriculture, forestry, fi shing, and hunting; mining, oil and gas extraction; utilities; construction; manufacturing; wholesale trade; retail trade; transportation and warehousing; information and culture; fi nance, insurance, and real estate; professional, scientifi c, and technical services; management of companies and enterprises, administrative and support, waste management and remediation services; educational services; health care and social assistance; arts, entertainment, and recreation; accommodation and food services; other services; and public administration.
As for labour reallocation, it has received much more attention at the aggregate level (i.e., shifts across sectors) than at the sectoral level (i.e., shifts across fi rms or plants). Yet the latter has considerably more potential than the former to affect aggregate eco-nomic performance. Indeed, decompositions of the economy-wide growth of labour productivity into i) within-sector productivity gains, and ii) gains owing to the reallocation of labour to sectors with higher productivity levels or growth, show that the effect of labour reallocation across sectors is minor and that gains largely originate within sectors. To the extent that productivity gains arise from labour reallocation across highly heterogeneous fi rms, such reallocation would be a signifi cant contributor to aggregate productivity growth. One aim of this article is to report on recent research that attempts to shed light on this issue for Canada. Another aim is to report on recent results concerning the drivers of labour reallocation at the fi rm or plant level. If reallocation across fi rms matters for aggregate productivity growth—considering that information on this reallocation is available only after long lags—knowing how the drivers of this reallocation have recently evolved would inform judgment on its potential contribution to recent aggregate productivity growth.
The article is organized as follows. It fi rst compares the pace of labour reallocation in Canada in recent periods to that experienced in the past. It looks not only at reallocation across sectors, but also at reallo-cation across fi rms, which dwarfs the movements across sectors. Second, it discusses the factors that may cause changes in the amount of reallocation across sectors and fi rms, and assesses the role of fl uctuations in commodity prices and the exchange rate in accounting for changes in the pace of labour reallocation in Canada. Finally, since it is possible that the pace of reallocation could infl uence the pace of effi ciency gains, the last section discusses the relationship between reallocation and productivity and presents some new Canadian evidence on the magnitude of this relationship.
Employment Reallocation in
Canada
Reallocation across sectors
This section documents the evolution of sectoral reallocation in Canada over the 1987–2008 period. One common measure of the amount of employment reallocation across sectors is Lilien’s sectoral shift measure (1982). Lilien’s measure is the weighted average
32 THE CHANGING PACE OF LABOUR REALLOCATION IN CANADA: CAUSES AND CONSEQUENCES
BANK OF CANADA REVIEW SUMMER 2009
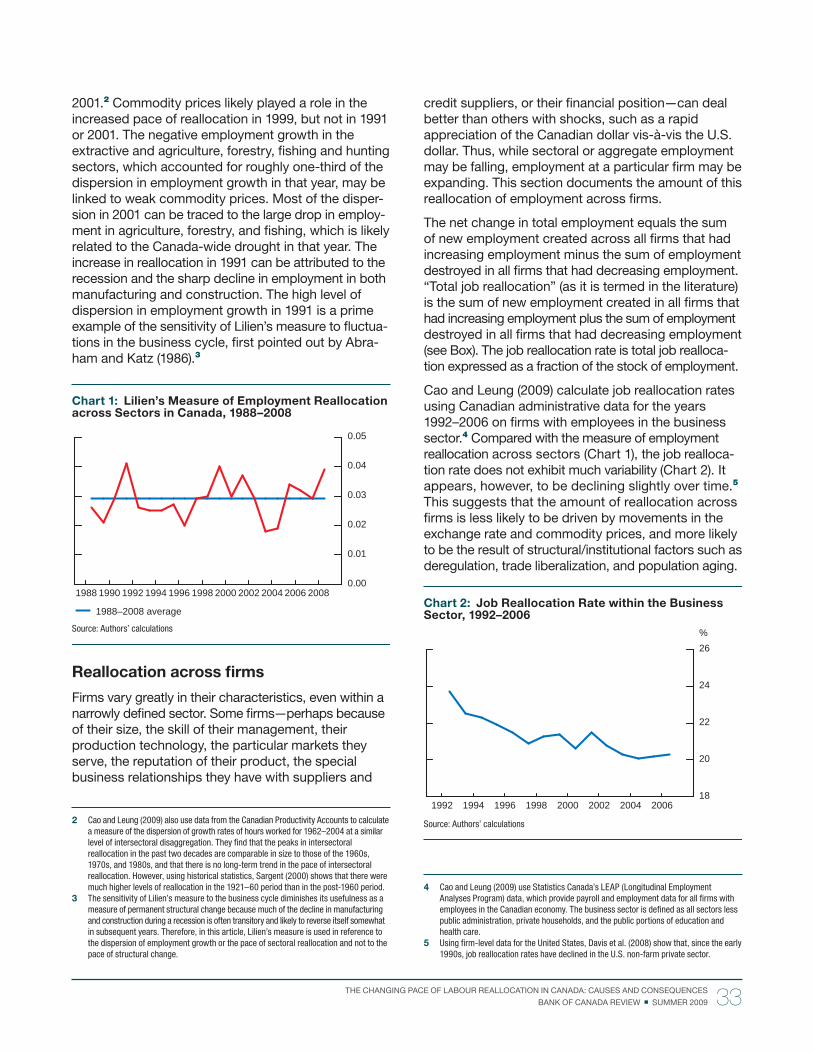
credit suppliers, or their fi nancial position—can deal better than others with shocks, such as a rapid appreciation of the Canadian dollar vis-à-vis the U.S. dollar. Thus, while sectoral or aggregate employment may be falling, employment at a particular fi rm may be expanding. This section documents the amount of this reallocation of employment across fi rms.
The net change in total employment equals the sum of new employment created across all fi rms that had increasing employment minus the sum of employment destroyed in all fi rms that had decreasing employment. “Total job reallocation” (as it is termed in the literature) is the sum of new employment created in all fi rms that had increasing employment plus the sum of employment destroyed in all fi rms that had decreasing employment (see Box). The job reallocation rate is total job realloca-tion expressed as a fraction of the stock of employment.
Cao and Leung (2009) calculate job reallocation rates using Canadian administrative data for the years 1992–2006 on fi rms with employees in the business sector.4 Compared with the measure of employment reallocation across sectors (Chart 1), the job realloca-tion rate does not exhibit much variability (Chart 2). It appears, however, to be declining slightly over time.5 This suggests that the amount of reallocation across fi rms is less likely to be driven by movements in the exchange rate and commodity prices, and more likely to be the result of structural/institutional factors such as deregulation, trade liberalization, and population aging.
Chart 2: Job Reallocation Rate within the Business Sector, 1992–2006
Source: Authors’ calculations
%
18
20
22
24
26
20062004200220001998199619941992
4 Cao and Leung (2009) use Statistics Canada’s LEAP (Longitudinal Employment Analyses Program) data, which provide payroll and employment data for all fi rms with employees in the Canadian economy. The business sector is defi ned as all sectors less public administration, private households, and the public portions of education and health care.
5 Using fi rm-level data for the United States, Davis et al. (2008) show that, since the early 1990s, job reallocation rates have declined in the U.S. non-farm private sector.
2001.2 Commodity prices likely played a role in the increased pace of reallocation in 1999, but not in 1991 or 2001. The negative employment growth in the extractive and agriculture, forestry, fi shing and hunting sectors, which accounted for roughly one-third of the dispersion in employment growth in that year, may be linked to weak commodity prices. Most of the disper-sion in 2001 can be traced to the large drop in employ-ment in agriculture, forestry, and fi shing, which is likely related to the Canada-wide drought in that year. The increase in reallocation in 1991 can be attributed to the recession and the sharp decline in employment in both manufacturing and construction. The high level of dispersion in employment growth in 1991 is a prime example of the sensitivity of Lilien’s measure to fl uctua-tions in the business cycle, fi rst pointed out by Abra-ham and Katz (1986).3
Chart 1: Lilien’s Measure of Employment Reallocation across Sectors in Canada, 1988–2008
Source: Authors’ calculations
1988–2008 average
0.00
0.01
0.02
0.03
0.04
20082006200420022000199819961994199219901988
0.05
Reallocation across fi rms
Firms vary greatly in their characteristics, even within a narrowly defi ned sector. Some fi rms—perhaps because of their size, the skill of their management, their production technology, the particular markets they serve, the reputation of their product, the special business relationships they have with suppliers and
2 Cao and Leung (2009) also use data from the Canadian Productivity Accounts to calculate a measure of the dispersion of growth rates of hours worked for 1962–2004 at a similar level of intersectoral disaggregation. They fi nd that the peaks in intersectoral reallocation in the past two decades are comparable in size to those of the 1960s, 1970s, and 1980s, and that there is no long-term trend in the pace of intersectoral reallocation. However, using historical statistics, Sargent (2000) shows that there were much higher levels of reallocation in the 1921–60 period than in the post-1960 period.
3 The sensitivity of Lilien’s measure to the business cycle diminishes its usefulness as a measure of permanent structural change because much of the decline in manufacturing and construction during a recession is often transitory and likely to reverse itself somewhat in subsequent years. Therefore, in this article, Lilien’s measure is used in reference to the dispersion of employment growth or the pace of sectoral reallocation and not to the pace of structural change.
33 THE CHANGING PACE OF LABOUR REALLOCATION IN CANADA: CAUSES AND CONSEQUENCES
BANK OF CANADA REVIEW SUMMER 2009
three jobs is created or destroyed each year. At the other end of the spectrum is health care, where less than one job in ten is turned over each year.
The job reallocation rate for the business sector is 21 per cent—indicating that approximately one in fi ve jobs in the economy is either created or destroyed each year.
While there is not much variability in the job realloca-tion rates across time, there is substantial variability across sectors (industries) (Chart 3). Each bar inChart 3 identifi es the average job reallocation rate over the 1992–2006 period for the business sector and the 17 subsectors (based on the LEAP data). On aver-age, the job reallocation rate for the business sector is 21 per cent—indicating that approximately one in fi ve jobs in the economy is either created or destroyed each year. The rates for construction, agriculture (including forestry, fi shing, and hunting), and profes-sional services are much higher than the rate for the entire business sector. In these sectors, nearly one in
Job Reallocation across Firms: Concepts and Defi nitions
The concept of job reallocation presented in this article is the same one used by the pioneers of the research in this area—Davis, Haltiwanger, and Schuh (1996). Let be the number of workers in fi rm at time and let be the two-year average of total employment. The rate of job creation is the sum of employment increases in all fi rms that had increasing employment divided by total employment:
(1)
where is the set of fi rms that had increasing employment. The rate of job destruction is the sum of employment decreases in fi rms that had decreased employment divided by total employment:
(2)
where is the set of fi rms that had decreasing employment. Whereas the employment growth rate is , the job reallocation rate, , is .
The job reallocation rate for a particular sector, , is calculated in the same way, except that the sum includes only the fi rms in that sector. Furthermore, the weighted average of the sectoral job realloca-tion rates equals the aggregate job reallocation rate:
(3)
where is the 2-year average of industry ’s employment.
The difference between the job reallocation rate and the employment growth rate is called the excess job reallocation rate, which is the amount of reallocation over and above the amount necessary to generate the net change in employment. For example, to have a net change of 1 in employment, all that is necessary is to have one fi rm creating one job, but that same net change in employment may have been the result of one fi rm creating 100 jobs and another fi rm destroying 99.
34 THE CHANGING PACE OF LABOUR REALLOCATION IN CANADA: CAUSES AND CONSEQUENCES
BANK OF CANADA REVIEW SUMMER 2009
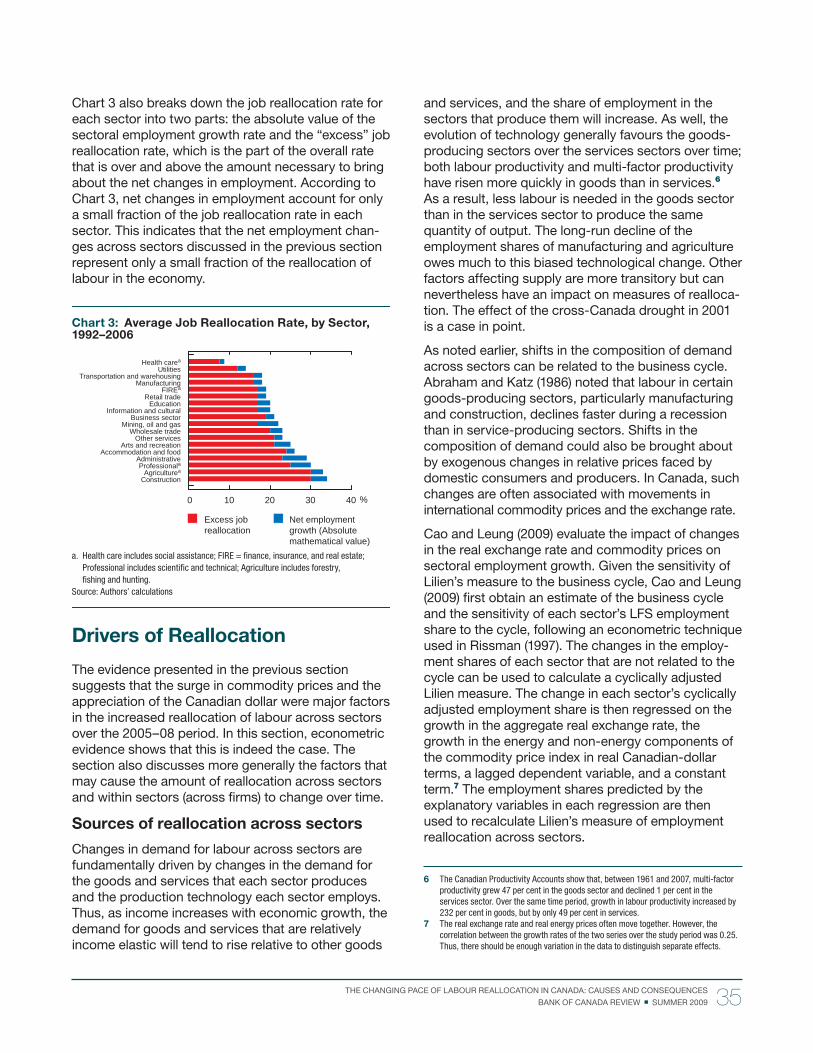
and services, and the share of employment in the sectors that produce them will increase. As well, the evolution of technology generally favours the goods-producing sectors over the services sectors over time; both labour productivity and multi-factor productivity have risen more quickly in goods than in services.6 As a result, less labour is needed in the goods sector than in the services sector to produce the same quantity of output. The long-run decline of the employment shares of manufacturing and agriculture owes much to this biased technological change. Other factors affecting supply are more transitory but can nevertheless have an impact on measures of realloca-tion. The effect of the cross-Canada drought in 2001 is a case in point.
As noted earlier, shifts in the composition of demand across sectors can be related to the business cycle. Abraham and Katz (1986) noted that labour in certain goods-producing sectors, particularly manufacturing and construction, declines faster during a recession than in service-producing sectors. Shifts in the composition of demand could also be brought about by exogenous changes in relative prices faced by domestic consumers and producers. In Canada, such changes are often associated with movements in international commodity prices and the exchange rate.
Cao and Leung (2009) evaluate the impact of changes in the real exchange rate and commodity prices on sectoral employment growth. Given the sensitivity of Lilien’s measure to the business cycle, Cao and Leung (2009) fi rst obtain an estimate of the business cycle and the sensitivity of each sector’s LFS employment share to the cycle, following an econometric technique used in Rissman (1997). The changes in the employ-ment shares of each sector that are not related to the cycle can be used to calculate a cyclically adjusted Lilien measure. The change in each sector’s cyclically adjusted employment share is then regressed on the growth in the aggregate real exchange rate, the growth in the energy and non-energy components of the commodity price index in real Canadian-dollar terms, a lagged dependent variable, and a constant term.7 The employment shares predicted by the explanatory variables in each regression are then used to recalculate Lilien’s measure of employment reallocation across sectors.
6 The Canadian Productivity Accounts show that, between 1961 and 2007, multi-factor productivity grew 47 per cent in the goods sector and declined 1 per cent in the services sector. Over the same time period, growth in labour productivity increased by 232 per cent in goods, but by only 49 per cent in services.
7 The real exchange rate and real energy prices often move together. However, the correlation between the growth rates of the two series over the study period was 0.25. Thus, there should be enough variation in the data to distinguish separate effects.
Chart 3 also breaks down the job reallocation rate for each sector into two parts: the absolute value of the sectoral employment growth rate and the “excess” job reallocation rate, which is the part of the overall rate that is over and above the amount necessary to bring about the net changes in employment. According to Chart 3, net changes in employment account for only a small fraction of the job reallocation rate in each sector. This indicates that the net employment chan-ges across sectors discussed in the previous section represent only a small fraction of the reallocation of labour in the economy.
Drivers of Reallocation
The evidence presented in the previous section suggests that the surge in commodity prices and the appreciation of the Canadian dollar were major factors in the increased reallocation of labour across sectors over the 2005–08 period. In this section, econometric evidence shows that this is indeed the case. The section also discusses more generally the factors that may cause the amount of reallocation across sectors and within sectors (across fi rms) to change over time.
Sources of reallocation across sectors
Changes in demand for labour across sectors are fundamentally driven by changes in the demand for the goods and services that each sector produces and the production technology each sector employs. Thus, as income increases with economic growth, the demand for goods and services that are relatively income elastic will tend to rise relative to other goods
Chart 3: Average Job Reallocation Rate, by Sector, 1992–2006
Health care includes social assistance; FIRE = fi nance, insurance, and real estate; a. Professional includes scientifi c and technical; Agriculture includes forestry, fi shing and hunting.
Source: Authors’ calculations
%
Net employmentgrowth (Absolutemathematical value)
Excess jobreallocation
0 10 20 30 40
Health carea
UtilitiesTransportation and warehousing
ManufacturingFIREa
Retail tradeEducation
Information and culturalBusiness sector
Mining, oil and gasWholesale trade
Other servicesArts and recreation
Accommodation and foodAdministrativeProfessionala
Agriculturea
Construction
35 THE CHANGING PACE OF LABOUR REALLOCATION IN CANADA: CAUSES AND CONSEQUENCES
BANK OF CANADA REVIEW SUMMER 2009
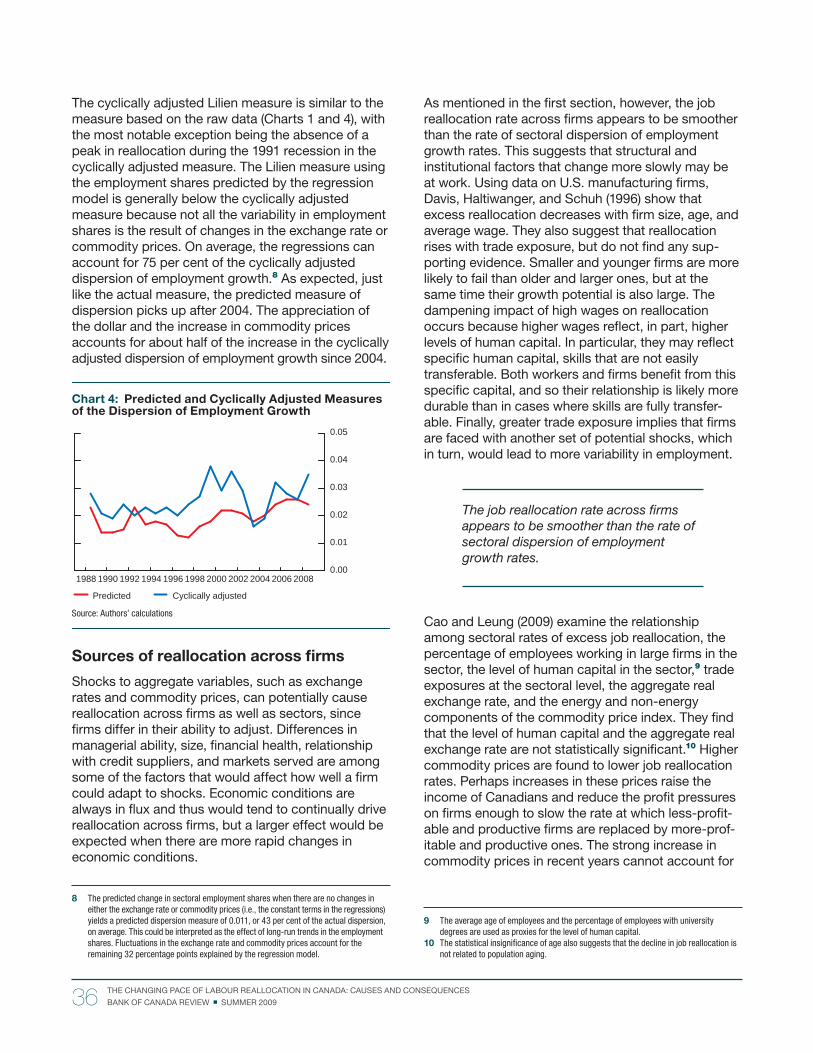
As mentioned in the fi rst section, however, the job reallocation rate across fi rms appears to be smoother than the rate of sectoral dispersion of employment growth rates. This suggests that structural and institutional factors that change more slowly may be at work. Using data on U.S. manufacturing fi rms, Davis, Haltiwanger, and Schuh (1996) show that excess reallocation decreases with fi rm size, age, and average wage. They also suggest that reallocation rises with trade exposure, but do not fi nd any sup-porting evidence. Smaller and younger fi rms are more likely to fail than older and larger ones, but at the same time their growth potential is also large. The dampening impact of high wages on reallocation occurs because higher wages refl ect, in part, higher levels of human capital. In particular, they may refl ect specifi c human capital, skills that are not easily transferable. Both workers and fi rms benefi t from this specifi c capital, and so their relationship is likely more durable than in cases where skills are fully transfer-able. Finally, greater trade exposure implies that fi rms are faced with another set of potential shocks, which in turn, would lead to more variability in employment.
The job reallocation rate across fi rms appears to be smoother than the rate of sectoral dispersion of employment growth rates.
Cao and Leung (2009) examine the relationship among sectoral rates of excess job reallocation, the percentage of employees working in large fi rms in the sector, the level of human capital in the sector,9 trade exposures at the sectoral level, the aggregate real exchange rate, and the energy and non-energy components of the commodity price index. They fi nd that the level of human capital and the aggregate real exchange rate are not statistically signifi cant.10 Higher commodity prices are found to lower job reallocation rates. Perhaps increases in these prices raise the income of Canadians and reduce the profi t pressures on fi rms enough to slow the rate at which less-profi t-able and productive fi rms are replaced by more-prof-itable and productive ones. The strong increase in commodity prices in recent years cannot account for
9 The average age of employees and the percentage of employees with university degrees are used as proxies for the level of human capital.
10 The statistical insignifi cance of age also suggests that the decline in job reallocation is not related to population aging.
The cyclically adjusted Lilien measure is similar to the measure based on the raw data (Charts 1 and 4), with the most notable exception being the absence of a peak in reallocation during the 1991 recession in the cyclically adjusted measure. The Lilien measure using the employment shares predicted by the regression model is generally below the cyclically adjusted measure because not all the variability in employment shares is the result of changes in the exchange rate or commodity prices. On average, the regressions can account for 75 per cent of the cyclically adjusted dispersion of employment growth.8 As expected, just like the actual measure, the predicted measure of dispersion picks up after 2004. The appreciation of the dollar and the increase in commodity prices accounts for about half of the increase in the cyclically adjusted dispersion of employment growth since 2004.
Chart 4: Predicted and Cyclically Adjusted Measures of the Dispersion of Employment Growth
Source: Authors’ calculations
Predicted Cyclically adjusted
0.00
0.01
0.02
0.03
0.04
0.05
20082006200420022000199819961994199219901988
Sources of reallocation across fi rms
Shocks to aggregate variables, such as exchange rates and commodity prices, can potentially cause reallocation across fi rms as well as sectors, since fi rms differ in their ability to adjust. Differences in managerial ability, size, fi nancial health, relationship with credit suppliers, and markets served are among some of the factors that would affect how well a fi rm could adapt to shocks. Economic conditions are always in fl ux and thus would tend to continually drive reallocation across fi rms, but a larger effect would be expected when there are more rapid changes in economic conditions.
8 The predicted change in sectoral employment shares when there are no changes in either the exchange rate or commodity prices (i.e., the constant terms in the regressions) yields a predicted dispersion measure of 0.011, or 43 per cent of the actual dispersion, on average. This could be interpreted as the effect of long-run trends in the employment shares. Fluctuations in the exchange rate and commodity prices account for the remaining 32 percentage points explained by the regression model.
36 THE CHANGING PACE OF LABOUR REALLOCATION IN CANADA: CAUSES AND CONSEQUENCES
BANK OF CANADA REVIEW SUMMER 2009
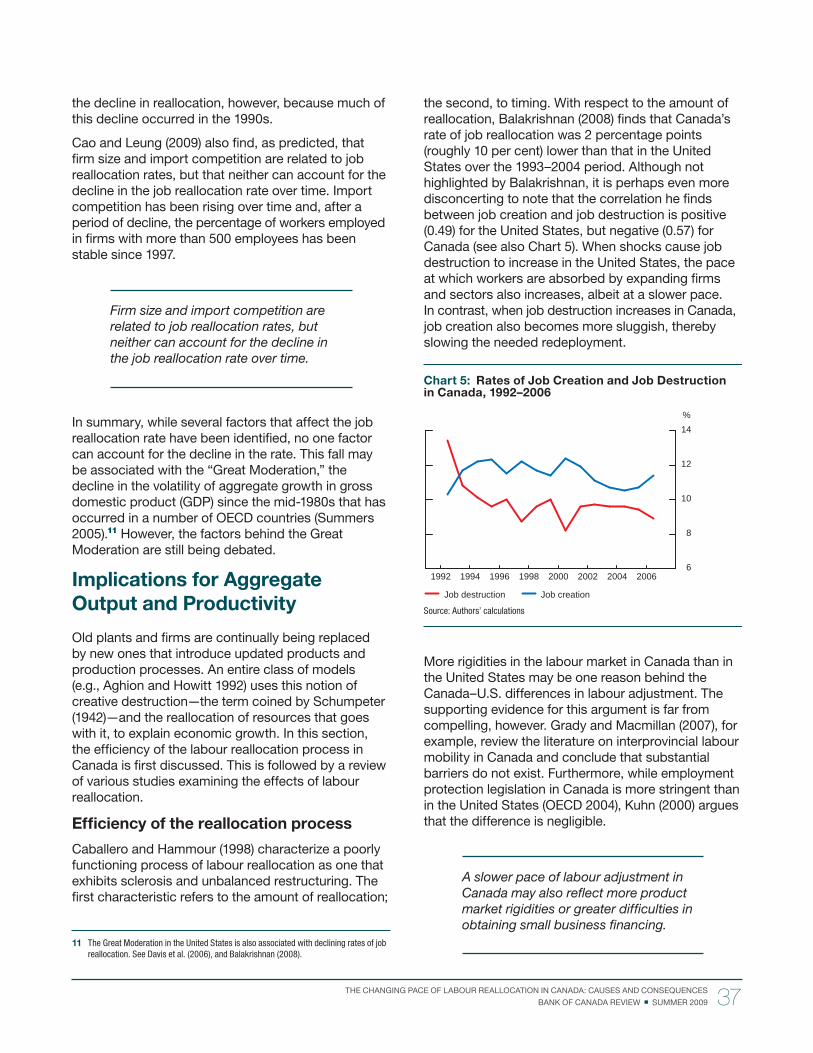
the second, to timing. With respect to the amount of reallocation, Balakrishnan (2008) fi nds that Canada’s rate of job reallocation was 2 percentage points (roughly 10 per cent) lower than that in the United States over the 1993–2004 period. Although not highlighted by Balakrishnan, it is perhaps even more disconcerting to note that the correlation he fi nds between job creation and job destruction is positive (0.49) for the United States, but negative (0.57) for Canada (see also Chart 5). When shocks cause job destruction to increase in the United States, the pace at which workers are absorbed by expanding fi rms and sectors also increases, albeit at a slower pace. In contrast, when job destruction increases in Canada, job creation also becomes more sluggish, thereby slowing the needed redeployment.
Chart 5: Rates of Job Creation and Job Destruction in Canada, 1992–2006
Source: Authors’ calculations
%
Job destruction Job creation
6
8
10
12
14
20062004200220001998199619941992
More rigidities in the labour market in Canada than in the United States may be one reason behind the Canada–U.S. differences in labour adjustment. The supporting evidence for this argument is far from compelling, however. Grady and Macmillan (2007), for example, review the literature on interprovincial labour mobility in Canada and conclude that substantial barriers do not exist. Furthermore, while employment protection legislation in Canada is more stringent than in the United States (OECD 2004), Kuhn (2000) argues that the difference is negligible.
A slower pace of labour adjustment in Canada may also refl ect more product market rigidities or greater diffi culties in obtaining small business fi nancing.
the decline in reallocation, however, because much of this decline occurred in the 1990s.
Cao and Leung (2009) also fi nd, as predicted, that fi rm size and import competition are related to job reallocation rates, but that neither can account for the decline in the job reallocation rate over time. Import competition has been rising over time and, after a period of decline, the percentage of workers employed in fi rms with more than 500 employees has been stable since 1997.
Firm size and import competition are related to job reallocation rates, but neither can account for the decline in the job reallocation rate over time.
In summary, while several factors that affect the job reallocation rate have been identifi ed, no one factor can account for the decline in the rate. This fall may be associated with the “Great Moderation,” the decline in the volatility of aggregate growth in gross domestic product (GDP) since the mid-1980s that has occurred in a number of OECD countries (Summers 2005).11 However, the factors behind the Great Moderation are still being debated.
Implications for Aggregate
Output and Productivity
Old plants and fi rms are continually being replaced by new ones that introduce updated products and production processes. An entire class of models (e.g., Aghion and Howitt 1992) uses this notion of creative destruction—the term coined by Schumpeter (1942)—and the reallocation of resources that goes with it, to explain economic growth. In this section, the effi ciency of the labour reallocation process in Canada is fi rst discussed. This is followed by a review of various studies examining the effects of labour reallocation.
Effi ciency of the reallocation process
Caballero and Hammour (1998) characterize a poorly functioning process of labour reallocation as one that exhibits sclerosis and unbalanced restructuring. The fi rst characteristic refers to the amount of reallocation;
11 The Great Moderation in the United States is also associated with declining rates of job reallocation. See Davis et al. (2006), and Balakrishnan (2008).
37 THE CHANGING PACE OF LABOUR REALLOCATION IN CANADA: CAUSES AND CONSEQUENCES
BANK OF CANADA REVIEW SUMMER 2009
decreasing their labour inputs. This suggests that the impact of labour reallocation on output and productivity is an empirical question in the sense that it is condi-tioned by measures taken by fi rms.
Many studies use accounting approaches to deter-mine the impact of labour reallocation on aggregate labour productivity. In these accounting decompos-itions, shifts in labour increase aggregate productivity if labour is reallocated to fi rms or sectors with higher-than-average levels of productivity or growth. The effects of adjustment costs are not explicitly considered. To the extent that adjustment costs affect the growth of labour productivity in the short run, accounting exercises that decompose a change in aggregate productivity over a short period would be more likely to show that the effect of reallocation is negative. This is because the rates of labour productivity growth of sectors with rapidly expanding employment are likely being adversely affected by adjustment costs. Decom-positions over a longer period are more likely to abstract from adjustment costs.
Using an accounting approach, Dupuis and Marcil (2008) show that the purely accounting effect of the recent labour reallocation across sectors has been positive, but small, accounting for approximately 7 per cent of labour productivity growth in the business sector over the 2003–07 period.12 In contrast, Baldwin and Gu (2006) show that labour reallocation across fi rms accounted for roughly 35 per cent of labour productivity in manufacturing in Canada in the 1989–99 period.13
Analysis similar to that of Baldwin and Gu (2006) cannot be carried out for a larger segment of the Canadian economy because the necessary fi rm-level data are not readily available. To obtain an estimate of the impact of labour reallocation across fi rms on the aggregate economy, Cao and Leung (2009) regress sectoral labour productivity ( ) growth rates for the 17 sectors shown in Chart 3 on each sector’s excess job reallocation rates. In addition to the reallocation rate, each sector is allowed to have a different average growth rate and a different sensitivity to the economic
12 Sharpe, Arsenault, and Ershov (2007) use an accounting methodology to examine the impact of interprovincial migration on labour productivity growth and fi nd that it accounted for 4 per cent of trend growth in 2006.
13 Baldwin and Gu (2006) also show that the importance of reallocation is increased if output is considered, rather than labour reallocation. They argue that the rise and decline of fi rms that underlies the reallocation of labour across fi rms is associated with competition in the product market, not the labour market. So, to isolate the effect of the competitive process, it is more appropriate to focus on changing output shares than on labour shares.
A slower pace of labour adjustment in Canada may also refl ect more product market rigidities or greater diffi culties in obtaining small business fi nancing. Indeed, the fi nding that the difference in Canada–U.S. job reallocation rates is the result of fewer realloca-tions associated with the birth and death of fi rms in Canada leads Balakrishnan (2008) to suggest that differences in product market rigidities play an important role. In this regard, there is evidence that anti-competitive product market regulation is some-what more prevalent in Canada than in the United States (Conway et al. 2006). The slower rate of fi rm turnover and, by implication, labour adjustment could also be the result of greater diffi culties in obtaining small business fi nancing in Canada. Leung, Meh, and Terajima (2008) fi nd, for instance, that small and medium-sized fi rms in Canada rely less on loans from fi nancial institutions than their counterparts in the United States. However, this could indicate either less need for, or less availability of, credit in Canada. As a general conclusion, the sources of slower labour adjustment in Canada need to be investigated further.
Impact of the labour reallocation process
The models of creative destruction suggest that the effect of labour reallocation on output and productiv-ity must be positive, but this is not necessarily the case. In the short run, the adjustment costs of rede-ploying workers from declining sectors and fi rms to expanding sectors and fi rms could impede output and productivity growth. Since sector- or fi rm-specifi c skills might not be transferable, workers new to the fi rm or sector need training. To quantify the effect of adjustment costs on aggregate output, Tapp (2007) builds a multi-sector model where fi rms can incur training costs to increase the skill of their workers. This match-specifi c skill is lost, however, if the worker leaves the fi rm. Tapp (2007) fi nds that, when cali-brated to Canadian data, the cost of reallocating labour across sectors following a shock that mimics the one experienced by Canada in recent years is 3 per cent of aggregate output in the fi rst year following the shock. The full adjustment takes fi ve years.
As pointed out by Haltiwanger (2002), even over longer time periods, it is incorrect to assume that jobs are always reallocated from less-productive fi rms or sectors to more-productive ones. For example, in their analysis of the impact of trade liberalization on the manufacturing sector in Canada, Baldwin and Gu (2004) fi nd that fi rms that became exporters achieved higher rates of labour productivity growth by increasing their product specialization and exploiting the benefi ts of longer production runs, while at the same time
38 THE CHANGING PACE OF LABOUR REALLOCATION IN CANADA: CAUSES AND CONSEQUENCES
BANK OF CANADA REVIEW SUMMER 2009
Conclusion
The reallocation of labour across sectors has picked up in recent years. A large part of this pickup can be traced to the appreciation of the Canadian dollar and rising commodity prices. The impact of this intersectoral reallocation on labour productivity is minor, however. In contrast, the most recent data show a slowing or stabilization of labour reallocation across fi rms. This seems to be at variance with the sharp movement in relative prices since 2003, which would be expected to intensify the amount of reallo-cation, not decrease it. The gradual nature of the decline suggests that structural and/or institutional factors may be at work, but that these factors have not been identifi ed. With regard to the impact of labour reallocation across fi rms, it is found that it generates substantial labour productivity gains in manufacturing and the business sector as a whole.
Overall, the response of the Canadian labour market to the appreciation of the dollar and the sharp increase in commodity prices showed that Canada does have relatively fl exible labour and product markets. There is still room for improvement, however. Further research must be undertaken to understand the differences in the pace of job reallocation between Canada and the United States and the negative correlation between job creation and destruction in Canada. Developing a greater understanding of these areas is important because of the role that realloca-tion of resources across fi rms plays in the productivity performance of the country.
cycle, where the cycle is proxied by the change in the aggregate unemployment rate ( ):
(2)
They fi nd that the coeffi cient on excess job realloca-tion is 0.14 and statistically signifi cant. This implies that the difference of two percentage points between excess job reallocation rates in Canada and the United States accounts for 0.3 percentage points of the Canada–U.S. difference in labour productivity growth rates.14 This is signifi cant, considering that the growth of U.S. labour productivity was, on average, 0.7 percentage points higher than Canada’s over the 1993–2004 period studied by Balakrishnan (2008). In interpreting the relationship uncovered by the above regression, it is important to keep two points in mind. First, it can be argued that faster technological progress can lead to more reallocation within a sector because fi rms vary in their ability to adapt to changes in their environment. Thus, one reason why such a strong relationship is found is that causality is running in both directions. Second, the fi nding by no means implies that reallocation, in and of itself, is a source of productivity growth for fi rms. New and surviving fi rms must be taking actions to increase their productivity performance, such as adopting new technologies and increasing capital intensity, in order for their perform-ance to be better than that of the fi rms they are replacing. Reallocation across fi rms is a process that promotes productivity gains at the sectoral and aggregate levels, but not at the fi rm level.
14 As mentioned above, Balakrishnan (2008) fi nds that the U.S. job reallocation rate is 2 percentage points higher than the Canadian rate over the 1993–2004 period. A portion of this U.S.–Canada difference can be accounted for by Balakrishnan’s inclusion of data from the public administration sector in the Canadian data, although it is excluded from the U.S. data. Cao and Leung (2009) show that removing public administration cuts the U.S.–Canada difference in job reallocation rates by 0.25 to 1.5 percentage points. However, net employment growth was stronger in Canada than in the United States; the U.S.-Canada difference in net employment growth was roughly -0.5 percentage points. Since excess job reallocation is job reallocation minus net employment growth, the U.S.–Canada difference in excess job reallocation is approximately 2 percentage points.
39 THE CHANGING PACE OF LABOUR REALLOCATION IN CANADA: CAUSES AND CONSEQUENCES
BANK OF CANADA REVIEW SUMMER 2009
Literature Cited
Davis, S. J., R. J. Faberman, J. C. Haltiwanger, R. Jarmin, and J. Miranda. 2008. “Business Volatility, Job Destruction and Unemployment.” NBER Working Paper No. 14300.
Davis, S. J., J. Haltiwanger, R. Jarmin and J. Miranda. 2006. “Volatility and Dispersion in Business Growth Rates: Publicly Traded versus Privately Held Firms.” NBER Macroeconomics Annual 21.
Davis, S. J., J. C. Haltiwanger, and S. Schuh. 1996. Job Creation and Destruction. Cambridge, MA: MIT Press.
Dupuis, D. and P. Marcil. 2008. “The Effects of Recent Relative Price Movements on the Canadian Economy.” Bank of Canada Review (Autumn): 43–53.
Grady, P. and K. Macmillan. 2007. “Inter-Provincial Barriers to Labour Mobility in Canada: Policy, Knowledge Gaps and Research Issues.” Paper prepared for the Human Resources and Social Development Canada–Industry Canada Round-table Internal Trade: Opportunities and Challen-ges,” held in Ottawa, 30 March. Available at <http://www.ic.gc.ca/eic/site/eas-aes.nsf/eng/ra02044.html>.
Haltiwanger, J. C. 2002. “Understanding Aggregate Growth: The Need for Microeconomic Evidence.” Department of Economics, University of Mary-land.
Kuhn, P. 2000. “Canada and the OECD Hypothesis: Does Labour Market Infl exibility Explain Canada’s High Level of Unemployment?” In Adapting Public Policy to a Labour Market in Transition, 177–210, edited by W. C. Riddell and F. St-Hilaire. Montréal: Institute for Research on Public Policy.
Leung, D., C. Meh, and Y. Terajima. 2008. “Are There Canada–U.S. Differences in SME Financing?” Bank of Canada Working Paper No. 2008-41.
Lilien, D. M. 1982. “Sectoral Shifts and Cyclical Unemployment.” Journal of Political Economy 90 (4): 777–93.
Abraham, K. G. and L. F. Katz. 1986. “Cyclical Unemployment: Sectoral Shifts or Aggregate Disturbances?” Journal of Political Economy94 (3): 507–22.
Aghion, P. and P. Howitt. 1992. “A Model of Growth through Creative Destruction.” Econometrica 60 (2): 323–51.
Balakrishnan, R. 2008. “Canadian Firm and Job Dynamics.” IMF Working Paper WP/08/31.
Baldwin, J. R. and W. Gu. 2004. “Trade Liberalization: Export-Market Participation, Productivity Growth and Innovation.” Statistics Canada Economic Analysis (EA) Research Paper Series No. 027.
———. 2006. “Competition, Firm Turnover and Productivity Growth.” Statistics Canada Economic Analysis (EA) Research Paper Series No. 042.
Bartelsman, E. J. and M. Doms. 2000. “Understand-ing Productivity: Lessons from Longitudinal Microdata.” Journal of Economic Literature 38 (3): 569–94.
Bosworth, B. P. and J. E. Triplett. 2007. “The Early 21st Century U.S. Productivity Expansion Is Still in Services.” Brookings Institution International Productivity Monitor (14): 3–19.
Caballero, R. J. and H. L. Hammour. 1998. “The Macroeconomics of Specifi city.” Journal of Political Economy 106 (4): 724–67.
Cao, S. 2008. “A Model of Costly Capital Reallocation and Aggregate Productivity.” Bank of Canada Working Paper No. 2008-38.
Cao, S. and D. Leung. 2009. “Labour Reallocation, Relative Prices, and Productivity.” Bank of Canada Working Paper. Forthcoming.
Conway, P., D. de Rosa, G. Nicoletti and F. Steiner. 2006. “Regulation, Competition and Productivity Convergence.” OECD Economics Department Working Paper No. 509.
40 THE CHANGING PACE OF LABOUR REALLOCATION IN CANADA: CAUSES AND CONSEQUENCES
BANK OF CANADA REVIEW SUMMER 2009
Literature Cited (cont’d)
Organisation for Economic Co-operation and Development (OECD). 2004. “Employment Protection Regulation and Labour Market Per-formance.” In OECD Employment Outlook 2004, 61–125. Paris: OECD.
Rissman, E. R. 1997. “Measuring Labor Market Turbulence.” Federal Reserve Bank of Chicago Economic Perspectives 21 (3): 2–14.
Sargent, T. C. 2000. “Structural Unemployment and Technological Change in Canada, 1990–1999.” Canadian Public Policy 26 (Suppl 1): S109–S123.
Schumpeter, J. A. 1942. Capitalism, Socialism, and Democracy. New York: Harper and Brothers.
Sharpe, A., J.-F. Arsenault, and D. Ershov. 2007. “The Impact of Interprovincial Migration on Aggregate Output and Labour Productivity in Canada, 1987–2006.” International Productivity Monitor 15: 25–40.
Summers, P. 2005. “What Caused the Great Modera-tion? Some Cross-Country Evidence.” Economic Review Federal Reserve Bank of Kansas City, (Third Quarter): 5–32.
Tapp, S. 2007. “Lost in Transition: The Costs and Consequences of Sectoral Labour Adjustment.” Queen’s Economics Department Working Paper No. 1142.
41 THE CHANGING PACE OF LABOUR REALLOCATION IN CANADA: CAUSES AND CONSEQUENCES
BANK OF CANADA REVIEW SUMMER 2009
BoC-GEM: Modelling the World EconomyRené Lalonde, International Economic Analysis Department, and Dirk Muir, International Monetary Fund
Worldwide economic developments, including the • integration of large and rapidly growing economies, global current account imbalances, the recent signifi cant movements in commodity prices, and the global fi nancial crisis that began in 2007, need to be viewed from a consistent global perspective to determine their impact on the Canadian economy.
To meet this need and to complement its existing • tools, Bank of Canada staff developed BoC-GEM, an adaptation of the Global Economy Model, initially developed at the International Monetary Fund and the New York Federal Reserve.
BoC-GEM divides the world into six regions, • including Canada. The oil and non-energy com-modity sectors, which are important for the Canadian economy, are also explicitly modelled.
Bank staff use BoC-GEM for an array of applica-• tions that need to be tackled in a global and multi-sector framework. Among recent examples are the current fi nancial crisis and the effect of the announced fi scal stimulus packages in many economies.
Ongoing work focuses on introducing fi nancial • frictions and a banking sector to BoC-GEM.
The Bank of Canada has a rich history of model-ling, focusing mainly on the economies of Canada and the United States.1 With the
increasing global openness to trade in goods, services, and fi nancial assets; the integration of large and rapidly growing economies such as China and India; the emergence of global current account imbalances; the recent large movements in the price of oil and other commodities; and the current global recession, it is necessary to view the external environ-ment from a consistent global perspective.
To meet this need, Bank of Canada staff adopted the Global Economy Model (GEM) created at the Inter-national Monetary Fund (IMF) and the New York Federal Reserve. Like ToTEM, the Bank’s main policy-analysis and projection tool for the Canadian economy, GEM is a dynamic stochastic general-equilibrium model, and is a representative-agent model with a fully optimizing framework based on microfoundations and multiple sectors of production. All markets are modelled with explicit demand and supply curves, so that all prices are endogenous. As a multi-region model, GEM includes the entire world economy and explicitly models all bilateral trade fl ows and relative prices, including exchange rates. GEM is capable of analyzing both large-scale global issues and country-specifi c issues.
Bank staff have adapted GEM to the Bank of Canada’s needs by incorporating three major extensions:
Canada is included as a separate region, and the (i) country composition of the other regional blocs is different from the composition in the original GEM;
1 See Murchison and Rennison (2006) for a description of ToTEM, the Bank of Canada’s model of the Canadian economy, and Gosselin and Lalonde (2005) for a description of MUSE, the Bank of Canada’s model of the U.S. economy.
43 BOC-GEM: MODELLING THE WORLD ECONOMY
BANK OF CANADA REVIEW SUMMER 2009
late the effects of U.S. shocks on Canadian macro variables such as real gross domestic product (GDP) and that these variables were brought into a separate model of the Canadian fi nancial sector for stress testing. In doing so, and in light of the recent fi nancial crisis, it became evident that the fi nancial sector in BoC-GEM needed to be enhanced to improve the model’s ability to tackle fi nancial stability issues. To address this issue, Bank staff are currently developing a version of BoC-GEM that includes fi nancial frictions on fi rms and a banking sector for each of its regions. This version of the model will make it easier to simu-late shocks originating from fi nancial markets and will also take into account the role of fi nancial frictions in the propagation of any shock.
In this article, we describe the structure and func-tioning of BoC-GEM. The fi rst section describes the structure of the model. Following this, recent research and analysis based on BoC-GEM are outlined, along with key insights developed from this work. We conclude with a discussion of the lessons learned over the past four years and a look at future plans.
The Bank of Canada’s Global
Economy Model: BoC-GEM
BoC-GEM comprises six regional blocs: Canada, the United States, emerging Asia, Japan, a commodity-exporting bloc, and the remaining countries. Emerging Asia includes China, India, Hong Kong Special Administrative Region of China, the Republic of Korea, Malaysia, the Philippines, Singapore, and Thailand. The commodity-exporting bloc includes the largest exporters of oil and non-oil commodities—the Organ-ization of the Petroleum Exporting Countries (OPEC), Indonesia, Norway, Russia, South Africa, Australia, New Zealand, Argentina, Brazil, Chile, and Mexico. The remaining-countries bloc includes all the other countries in the world. This effectively means the members of the European Union, since Africa has a very small economic footprint.
The entire BoC-GEM can be thought of as a system of demand, supply, and pricing functions. Each of the six regions is modelled symmetrically and consists of the following:
fi rms that produce raw materials and intermediate • and fi nal goods and that demand labour from domestic consumers;
liquidity-constrained and forward-looking consum-• ers who consume fi nal goods (composed of
Oil and non-oil commodities sectors are included (ii) and, consequently, the prices of oil and non-oil commodities are endogenous; and
the calibration incorporates the views of Bank staff (iii) and the properties of the Bank’s models of the Canadian and U.S. economies (ToTEM and MUSE, respectively).
Because of its composition, BoC-GEM can be used to analyze issues specifi c to Canada or issues else-where in the world, and model how they will affect Canada either directly or indirectly through effects on another country, such as the United States.
With its fl exible and adaptable structure, BoC-GEM is a powerful platform for research. Recent topics include the causes and effects of the surge in oil prices between 2002 and 2006 (Elekdag et al. 2008); the consequences of a possible increase of protec-tionism (Maier 2008); the global impact of U.S. fi scal policy (Flood 2008); the impact of the recent stimula-tive fi scal policies in many economies (Lalonde, de Resende, and Snudden 2009); and the optimal choice of monetary policy regime in a multi-country frame-work (Coletti, Lalonde, and Muir 2008).
BoC-GEM can be used to analyze issues specifi c to Canada or issues elsewhere in the world, and model how they will affect Canada.
Bank staff also use BoC-GEM to generate risk scenarios around the base-case staff economic projection for questions that need a global and/or a multi-sectoral perspective, such as the recent fi nan-cial turbulence and a possible boom-bust scenario in emerging Asia (see Lalonde, Maier, and Muir 2009). Results from BoC-GEM can also be used to validate or test assumptions underlying the staff economic projection, including the equilibrium price of oil, the reasons for the increase in commodity prices between 2002 and 2007, the evolution of global imbalances, and the geographic distribution of the depreciation of the U.S. real effective exchange rate.
In addition, BoC-GEM is used to analyze global risks to fi nancial stability: Bank staff recently used BoC-GEM to build the macroeconomic scenario for stress testing the Canadian banking system as part of the IMF’s Financial Stability Assessment Program. It is important to note that BoC-GEM was used to calcu-
44 BOC-GEM: MODELLING THE WORLD ECONOMY
BANK OF CANADA REVIEW SUMMER 2009
minated in U.S. dollars. External imbalances are bounded by the assumption that regions are targeting a specifi c ratio of net foreign assets to GDP. The cost of holding an excess balance of assets puts upward pressure on the regions’ bilateral real exchange rate for the U.S. dollar (also determined by a standard condition of uncovered interest rate parity). This leads to a decrease in the current account in the short run, eliminating the external imbalances. There is also an explicit link between the level of government debt and the level of net foreign assets, meaning that the representative agent in this model is non-Ricardian. There are further non-Ricardian elements in BoC-GEM; i.e., some consumers are subject to liquidity constraints, and the government raises revenues through distortionary taxation on labour income, capital income, and (possibly) tariffs on imports.
Depending on the region, the monetary authority targets core infl ation (defi ned as the consumer price index excluding gasoline prices), headline CPI infl a-tion, or a fi xed nominal exchange rate in order to achieve an objective related to price stability (or price certainty) with a standard reaction function.
To match the persistence observed in the data, the model includes real adjustment costs and nominal rigidities that are allowed to differ across regions. We assume real adjustment costs in capital, investment, labour, and imports. The model also assumes the presence of large adjustment costs in the production of, and demand for, oil and commodities. Combined with a fi xed factor of production (oil reserves and land), these real adjustment costs ensure that the price elasticities of demand for oil and commodities are very low (demand and supply are very inelastic) over the short and medium terms (one to fi ve years). For instance, if the global demand for oil increases (e.g., through a permanent productivity shock in Asia), the demand for oil over the fi rst couple of years will move along a very steep supply curve. We will observe a substantial increase of the price of oil, but only a negligible increase in the global production of oil. In the long run, the supply of oil will gradually increase, and part of the initial rise in the price of oil will be reversed.
Since the model also assumes no product differentia-tion in the oil market, the global price of oil moves uniformly in response to all shocks. The model relies on similar assumptions for the commodities sector but allows for more product differentiation and lower real adjustment costs than in the oil sector.
Finally, nominal rigidities are introduced in setting wages and prices of tradable and non-tradable
domestic and imported components) and who supply labour inputs to fi rms;
a government consisting of a fi scal authority that • consumes non-tradable goods and services, fi nanced through taxation or borrowing; and
a monetary authority that manages short-term • interest rates to provide a nominal anchor for the economy.
Five sectors produce goods from capital and labour and other factors. The fi ve sectors are non-tradable goods (i.e., non-fi nancial services); tradable goods (fi nancial services and durable, semi-durable, and non-durable goods); oil and natural gas; non-oil commodities; and heating and automobile fuel. Special emphasis is placed on oil and natural gas and on other commodities because the Canadian econ-omy is dependent on the production and export of these goods, and their prices can be volatile, since they are determined largely by global demand and supply. The production of each sector is assumed to be monopolistically competitive; i.e., fi rms can still enter and exit the market because each fi rm’s goods are slightly different from those produced by its competitors. Each fi rm is therefore able to set a price above its marginal cost, permitting a markup.
Each region includes fi ve sectors: non-tradable goods, tradable goods, oil and natural gas, non-oil commodities, and heating and automobile fuel.
Each region has fi rms that produce oil by combining capital, labour, and crude oil reserves. Oil is also combined with labour and capital to produce gaso-line. Oil and other commodities can be traded across regions and are further combined with capital and labour to produce tradable and non-tradable goods. There are three intermediate goods: heating and automobile fuel, tradable goods, and non-tradable goods, all of which are combined to form a fi nal consumption good. Tradable and non-tradable goods are also combined to form a fi nal investment good.
In terms of international trade, all bilateral fl ows (across regions) of exports and imports of oil, com-modities, and tradable goods for consumption and investment are explicitly modelled as demands for imported goods from specifi c regions. Internationally traded net foreign assets are assumed to be deno-
45 BOC-GEM: MODELLING THE WORLD ECONOMY
BANK OF CANADA REVIEW SUMMER 2009
goods. For the oil and commodities sectors, we assume perfect fl exibility of prices. The strategy we followed to calibrate the model is described in Box 1.
Recent Applications
In this section, we outline some examples of recent research and analysis that employ BoC-GEM, along with the key insights of this work.2 We begin with an overview of applications to monetary policy and issues concerning the real economy and then exam-ine an application to questions of fi nancial stability.
Monetary policy and issues in
the real economy
The oil sector in a global economic
framework: The surge in oil prices
between 2002 and 2006
Using a version of GEM that includes Canada and a global oil market and is almost identical to BoC-GEM, Elekdag et al. (2008) analyze the causes and effects of
2 For a detailed description of the properties of the model in response to stylized shocks, see Lalonde and Muir (2007).
the increase in the price of oil observed between 2002 and 2006.3 Tight supply conditions, in combination with strong productivity growth and an increase in oil intensity both in production and consumption in emerging Asia (that are broadly consistent with the data) can account for a large share of the magnitude and persistence of the oil-price increase. Neverthe-less, by itself, higher demand from emerging Asia does not seem to explain all the recent increases in the price of oil observed during that period. Supply-side factors and speculation also seem to play a role.
In research by Lalonde and Muir (2007), BoC-GEM demonstrates that the impact of an oil-price increase on the different regions of the global economy depends on two key factors:
distinguishing between movements in the demand • for oil (i.e., strong economic growth in emerging Asia) and in the supply of oil (i.e., a supply restric-tion similar to the one experienced following the 1973 oil-price shock); and
whether the region is a net oil importer (e.g., the • United States) or a net oil exporter (e.g. Canada).
3 Their model is a precursor of BoC-GEM.
46 BOC-GEM: MODELLING THE WORLD ECONOMY
BANK OF CANADA REVIEW SUMMER 2009
Box 1
Calibrating BoC-GEM
Because of the large and complex nature of the model, a full estimation of its parameters is not yet feasible. The model must therefore be calibrated, using a strategy that relies on multiple sources of information. First, we calibrate the broad features of the six regions using data relating to such factors as the relative importance of bilateral trade fl ows of oil, commodities, and tradable goods; the relative importance of the components of aggregate demand; the geographical distribution of oil reserves; the relative importance of each sector in the economies; and so on.
Next, to calibrate the model’s parameters, we begin with the values of parameters used for previous work on GEM (e.g., Laxton and Pesenti 2003; Bayoumi, Laxton, and Pesenti 2004; Faruqee et al. 2007). We also rely on previously published work for particular economies. Some examples include:
Canada: Murchison and Rennison (2006) using • ToTEM, the Bank of Canada’s projection and policy analysis model for Canada; Perrier (2005)
Euro area: Coenen, McAdam, and Straub (2008) • using the NAWM (New Area-Wide Model), the European Central Bank’s DSGE model; de Walque, Smets, and Wouters (2006)
United States: Gosselin and Lalonde (2005) • using MUSE, the Bank of Canada’s model of the U.S. economy; Brayton et al. (1997) for FRB/US, the Board of Governors of the Federal Reserve System’s model of the United States; Erceg, Guerrieri, and Gust (2005a, 2005b) for the SIGMA DSGE model; Juillard et al. (2006)
Finally, Coletti, Lalonde, and Muir (2008) show that the two-country version of BoC-GEM is able to replicate fairly well the key features of Canadian and U.S. data.
Emerging Asia’s impact on food and
commodity prices: How should central
banks respond?
Lalonde, Maier, and Muir (2009) examine the sharp increase in the price of oil and food observed between 2007 and mid-2008 and argue that economic developments over this period suggest at least three sources of uncertainty. First, it is not clear whether the run-up in commodity prices during the period is driven by supply disruptions, by strong demand for commodities, or both. Second, to assess the medium-term outlook for commodity prices, assump-tions about the sources of the strong demand for commodities are required. Assuming that demand for commodities is driven, at least in part, by strong growth in emerging Asia, a possible explanation is that commodity prices have risen sharply in recent years in response to higher-than-expected potential growth in that region. This implies a permanently high demand for commodities, and that commodity prices can be expected to stay at elevated levels. An alterna-tive interpretation is that the strong demand for commodities is due, at least in part, to a temporary demand shock in emerging Asia (“overheating”). If this is correct, there should be a swifter moderation in commodity prices when the demand shock unwinds. A third source of uncertainty is the speed with which central banks worldwide react to the rising infl ationary pressures. At some point, rising infl ation should lead to tighter monetary policies, which could result in a slowing of the global economy. This could prompt a relatively sharp drop in prices for energy and non-energy commodities.
In this study, Lalonde, Maier, and Muir (2009) build two globally consistent scenarios in which stronger-than-expected oil and food prices are caused by supply factors and a shift of world economic activity, from a less oil-intensive economy (the United States) to a more oil-intensive economy (emerging Asia). In the base case, it is also assumed that the demand for commodities from emerging Asia is driven by large and persistent permanent productivity gains. The alternative scenario assumes that the demand for commodities is strong because of a temporary positive demand shock in emerging Asia and that oil and food prices exhibit higher volatility. In Canada, there are higher infl ationary pressures in the short term, even in core infl ation, and relatively higher volatility in infl ation, output growth, and the real exchange rate, refl ecting relatively more-volatile commodity prices. There are higher global infl ationary pressures, since the engine of emerging Asia’s
To illustrate these points, consider a permanent increase in productivity in emerging Asia, where fi rms can produce goods at lower cost, which will exert downward pressure worldwide on the price of trad-able goods. In turn, this will lead to positive wealth effects for all regions, which induces a global increase in consumption and output. On the other hand, in order to produce more goods and take advantage of their productivity gains, fi rms in emerging Asia increase their demands for inputs of production, including oil. Given that the oil supply is subject to strong real adjustment costs, there is a substantial, persistent rise in the global price of oil. For commodity importers like the United States, this creates a nega-tive wealth effect that, over the near term, roughly cancels out the positive wealth effect induced by the fall in the price of other imported tradable goods. Therefore, in the short run, U.S. output and consump-tion are barely affected. For a commodity exporter such as Canada, the increase in the price of oil induces a positive wealth effect, reinforcing the positive wealth effect linked to the fall in the prices of tradable goods. Canadian output and consumption therefore increase immediately.
Strong productivity growth and an increase in oil intensity in emerging Asia can explain a large share of the oil-price increase observed between 2002 and 2006.
If we consider instead an increase in the price of oil as a result of supply restrictions by the commodity-exporting regions, the positive wealth effect associ-ated with an increase in productivity in emerging Asia is absent. The main propagation mechanism in the world economy is the wealth effect associated with the increase in oil prices, which is negative for com-modity importers and positive for commodity export-ers. U.S. output therefore falls over the fi rst few years of simulation. In Canada, consumption is increasing, but Canada’s net exports are falling because of the U.S. slowdown; the fall of exports dominates the wealth effect. Canadian GDP therefore falls slightly, as opposed to increasing under an oil-price shock caused by higher productivity in emerging Asia.
47 BOC-GEM: MODELLING THE WORLD ECONOMY
BANK OF CANADA REVIEW SUMMER 2009
The same issue is explored from a different angle in Maier (2008), who investigates whether policy-makers actually have incentives to implement protectionist policies. Specifi cally, this study asks whether the United States could trigger a “wave of protectionism”—a series of actions whereby countries impose import tariffs on each other to retaliate for previous protec-tionist actions—if it introduces tariffs on imports from emerging Asia. The study evaluates the economic consequences of tariffs and explores the conditions under which policy-makers in each region have incentives to impose them. Maier (2008) distinguishes between “benevolent” and “myopic” policy-makers: While benevolent policy-makers focus on long-term economic growth, myopic policy-makers care about short-term considerations (e.g., an upcoming election).
Benevolent policy-makers are not likely to adopt protectionist policies, since the long-term gains for countries adopting tariffs are small, if not negative. Tariffs on imports trigger an appreciation of the real exchange rate, leading to a fall in the exports of the protectionist country. The key fi nding is that countries will likely hurt themselves in the long run by adopting protectionist policies. Given the short-term economic benefi ts, however, there is some scope for myopic policy-makers to exploit political gains. Thus, the possibility of a wave of protectionism cannot be completely excluded.
The global impact of U.S. fi scal policy
BoC-GEM can also be used to investigate the global implications not only of U.S. trade policy but of its fi scal policy as well. Flood (2008) examines the global macroeconomic implications of the expiration of tax relief from the Alternative Minimum Tax (AMT) at the end of the 2007 tax year and the expiration in 2011 of the Bush administration’s tax cuts. The author also examines the impact of the expected increase in expenditures under entitlement programs relating to population aging and escalating health care costs.
The expiration of previously enacted tax cuts in the United States imposes short-run costs on the econ-omy. The increase in tax revenues is assumed to allow the government to reduce its level of debt in the long run, however, thereby permitting the U.S. economy and the rest of the world to benefi t from the reduction in government borrowing as real interest rates decline, and stimulating global economic growth. The rest of the world also benefi ts from a redistribution of wealth linked to a partial reversal of global current account imbalances that is associated with the decline in U.S. government debt.
economic growth is excess demand, which leads to a global increase in the prices of tradables. This is in contrast to the large productivity gains in the base case, which result in falling global prices for tradables, thereby mitigating infl ationary pressures coming from higher demand and prices for energy and commod-ities.
A possible resurgence of protectionism
An increase in protectionism is possible in the current environment of global imbalances and fi xed exchange rate regimes pursued by a number of countries in emerging Asia. Lalonde and Muir (2007) explore two scenarios. The fi rst relies on the trade literature, which suggests that increases in tariffs by one region against another will benefi t the region that imposes the tariff but harm the targeted region—a “beggar-thy-neighbour policy.” Past experience (particularly with the Great Depression) has shown that this type of policy eventually escalates into a worldwide tariff war, and theory (and practice) demonstrate that everyone loses with such an outcome. BoC-GEM confi rms the damage that would be caused by a global tariff war, using a multilateral increase in tariffs of 10 per cent to illustrate the point.
In a second case, Lalonde and Muir (2007) assume that the North American Free Trade Agreement (NAFTA)—or at least the Canada–U.S. portion of it—survives unscathed and that Canada and the United States increase tariffs only against the other three regions (commodity-exporting countries, emerging Asia, and other countries). In this case, we see a difference for Canada and the United States, as GDP falls by less in both regions than under the generalized tariff war. This is particularly the case for Canada (a fall of 0.9 per cent of GDP versus a fall of 3.5 per cent without NAFTA). Consequently, main-taining NAFTA would be a good way for Canada to protect its economy from most of the negative effects of a global resurgence of protectionism. This result is linked mainly to the large proportion of Canadian exports to the United States and to some substitution towards Canadian goods in the American market, as tariffs are raised against the other regions.
According to BoC-GEM simulations, maintaining NAFTA would be a good way for Canada to protect its economy from most of the negative effects of a global resurgence of protectionism.
48 BOC-GEM: MODELLING THE WORLD ECONOMY
BANK OF CANADA REVIEW SUMMER 2009
In the United States, the peak effect is close to 3 per cent. The timing of these peak responses is highly uncertain.
All regions benefi t from a globally coordinated • fi scal stimulus relative to a purely domestic stimulus. The distribution of gains across regions depends on each region’s trade patterns.
Regions that have net import positions of invest-• ment and consumption goods will have higher leakages into imports from domestic stimulus, and negative terms-of-trade shocks from the synchron-ized fi scal stimulus packages. In addition, net exporters of crude oil and commodity goods experience positive terms-of-trade shocks under coordination, since oil and commodity prices rise by 40 per cent and 7 per cent, respectively.
All regions of the world benefi t from a globally coordinated fi scal stimulus relative to a purely domestic stimulus. The distribution of gains across regions depends on each region’s trade patterns.
For any given region, the potential gains from syn-chronized global fi scal stimulus depend negatively on the size of its economy and on the size of the domes-tic fi scal stimulus, and positively on the proportion of tax cuts in the overall stimulus and on its degree of openness to trade.
Choosing the optimal monetary policy
regime in a multi-country framework
The Bank of Canada has recently embarked on a research program to examine infl ation targeting versus price-level targeting. Coletti, Lalonde, and Muir (2008) use a Canada–United States, two-sector (tradable and non-tradable goods) version ofBoC-GEM to address some open economy questions regarding the optimal choice for Canada—infl ation targeting or price-level targeting. From the perspec-tive of Canadian monetary policy, the authors attempt to answer three questions:
In a multi-country framework, and with the object • of reducing the variance of infl ation and the output gap, which is the “optimal” Canadian monetary policy framework—infl ation targeting or price-level targeting?
Nonetheless, the U.S. economy is facing a challenging period ahead as its population ages and expenditures on entitlement programs and health care rise rapidly over the coming decades. Since the increase in federal revenues associated with the expiration of previously enacted tax cuts is not nearly large enough to fi nance the expected increase in entitlement-pro-gram spending, a rise in government debt will crowd out economic growth in the United States and abroad. This suggests that the economic damage associated with the expected spending increases might be avoided by adjusting policy through some combina-tion of a decrease in program spending and an increase in program revenues. The sooner these policy adjustments are completed, the smaller will be the negative economic impact of the expected debt-fi nanced increases in entitlement-program spending.
The global impact of the recent fi scal
stimulus
Most countries responded to the current global recession by implementing fi scal stimulus policies, with the United States, Japan, and China using particularly large stimulus packages. Lalonde, de Resende, and Snudden (2009) use BoC-GEM to examine the impact on the world economy of the fi scal stimulus policies announced by different countries. The authors also compare the effect of purely domestic fi scal stimulus with that of synchron-ized global fi scal stimulus. For each region, the authors consider two alternatives: (i) the fi scal shock occurs only in the domestic economy, with no fi scal stimulus in the remaining fi ve regions of the world; and (ii) fi scal shocks occur simultaneously in all regions. Each region-specifi c fi scal stimulus is decomposed into reductions in labour income tax and in the tax on corporate profi ts, increases in government purchases of investment and consumption goods, increases in government services, increases in personal transfers, and increases in general and targeted lump-sum transfers.
The fi scal shocks are calibrated to mimic the actual profi les of the announced stimulus packages in different regions, based on information from the Organisation for Economic Co-operation and Development. The impact of the stimuli is magnifi ed by accommodative monetary policy in response to the global recession and by the lower bound on interest rates. The main results are as follows:
Simultaneous fi scal stimulus has a peak effect on • the level of the world’s GDP of close to 2 per cent.
49 BOC-GEM: MODELLING THE WORLD ECONOMY
BANK OF CANADA REVIEW SUMMER 2009
Since BoC-GEM does not yet explicitly model the fi nancial sector or the effects of equity wealth and housing wealth on consumption, we have created a modifi ed version of the model that tries to replicate these effects. First, we introduced an exogenous spread between the corporate and the risk-free interest rate. Second, we relied on shocks to con-sumption to replicate the wealth effects of a decline in equity or housing prices. In the future, we will incorporate the fi nancial sector effects into BoC-GEM directly.
The fi rst example of the use of the modifi ed BoC-GEM for the purpose of assessing fi nancial stability took place in 2007, when Canada’s fi nancial system was the subject of a Financial Sector Assessment Program (FSAP) update. (The FSAP is a joint IMF–World Bank program aimed at helping countries to identify vulner-abilities in their fi nancial system and to determine needed reforms.) Among other things, Canada’s 2007 FSAP update included a stress-testing component.4
The modifi ed BoC-GEM was fi rst used to assess fi nancial stability in 2007, when Canada’s fi nancial system was the subject of a Financial Sector Assessment Program update.
The stress test was based on a macroeconomic scenario, generated by BoC-GEM, of a disorderly adjustment of global imbalances brought about by a downward revision to expectations of productivity growth in the United States. The scenario originated in the historically high rate of trend labour productivity growth experienced in the latter half of the 1990s and the early 2000s in the United States. As expectations of long-term labour productivity growth in the United States were gradually revised upward to 2 per cent and higher, perceived rates of return on U.S. invest-ments were boosted. This led to increased investment demand as well as increased capital infl ows and a stronger U.S. dollar. In addition, expectations of higher permanent incomes led to an increase in consumption and a drop in the savings rate. All of these factors led to a rise in imports and an expansion of the U.S. current account defi cit (Ferguson 2005).
4 See Coletti et al. (2008) for an outline of the complete methodology, including the macroeconomic scenario, and further modelling of the fi nancial sector.
When facing terms-of-trade shocks, is it optimal to • target infl ation or the price level?
Does the “optimal” regime in Canada depend on • the policy regime chosen by the U.S. Federal Reserve?
Using economic data in combination with the model, the authors identify 23 different historical Canadian and U.S. shocks and use a stochastic simulation methodology to identify a simple monetary rule that minimizes the combined variances of infl ation and the output gap under either infl ation targeting or price-level targeting. Given the historical distribution of shocks and the calibration of the model, targeting the price level gives a slightly better macroeconomic outcome than targeting infl ation. The authors also conclude that shocks that induce a negative correla-tion between infl ation and the output gap (price/wage markup and labour supply shocks) favour an infl ation-targeting regime; shocks that generate a positive correlation between infl ation and the output gap (productivity and demand shocks) favour price-level targeting. The variance of the Canadian terms of trade is dominated by the latter category of shocks. Price-level targeting therefore provides a better macro-economic outcome for shocks affecting the terms of trade. Finally, the U.S. choice of monetary policy framework does not affect the choice of the “optimal” monetary policy framework in Canada.
The U.S. choice of monetary policy framework does not affect the choice of the “optimal” monetary policy framework in Canada.
Financial stability questions
BoC-GEM has also been applied to fi nancial stability questions at the Bank. To date, these projects have taken the form of macro-fi nancial stress testing, the purpose of which is to assess the resilience of a segment of the fi nancial system in the face of “rare but plausible” events that have either resulted in vulnerabilities in the past or could do so in the future. The events considered are typically a collection of shocks (incorporated into a macroeconomic model such as BoC-GEM) to form a macroeconomic scen-ario, with the objective of assessing the impact of such a scenario on a set of fi nancial institutions. The impacts on the balance sheets of the fi nancial institu-tions are modelled using a secondary set of models.
50 BOC-GEM: MODELLING THE WORLD ECONOMY
BANK OF CANADA REVIEW SUMMER 2009

also rise as a result of the economic downturn and this further exacerbates the weakness in Canadian GDP growth.
Taken as a package, the shocks are extremely large by historical standards. In the United States, the recession embodied in the scenario is even more severe than that experienced in 1981–82. All of these factors, including the recession in the United States, an appreciated Canada–U.S. real exchange rate, falling world commodity prices, the downward revision of expectations for the growth of domestic trend labour productivity, losses in domestic consumer and business confi dence, and the rise in domestic fi nan-cial risk premiums, lead to a signifi cant recession in Canada. In terms of cumulative output loss, the domestic recession embodied in the scenario is about one-third larger than the recession of 1990–91.
Lessons from the Past and Future
Developments
BoC-GEM is a very useful tool to tackle a broad range of issues pertinent to the current economic context,
In this scenario, it is assumed that expectations of a permanent rise in the growth of labour productivity in the United States are overly optimistic. Economic agents revise their expectations for future productivity growth down to 1.1 per cent per year for the next 10 years. The resulting downward revision to perma-nent income growth and to expected rates of return on investment leads to a retrenchment in demand, which offsets the decline in the growth in the econ-omy’s productive capacity. Increased economic uncertainty also causes declines in consumer and business confi dence, leading to a retrenchment in consumption and investment expenditures. Height-ened uncertainty is also assumed to lead foreigners to sell off U.S.-dollar assets, causing a rapid deprecia-tion in the U.S. dollar. The resulting deterioration in the balance sheets of consumers and fi rms leads to a signifi cant rise in the risk spread, further magnifying the economic slowdown. The growth of Canadian trend labour productivity is also assumed to slow to about 0.8 per cent over the next 10 years. As in the United States, a similar but smaller fall in consumer and business confi dence is assumed to occur in Canada. Canadian commercial interest rate premiums
51 BOC-GEM: MODELLING THE WORLD ECONOMY
BANK OF CANADA REVIEW SUMMER 2009
Box 2
Introducing a Financial Sector into BoC-GEM
To introduce a fi nancial sector into BoC-GEM, we explicitly use the framework developed in Dib (2009), in which two types of heterogeneous banks offer different banking services and interact in an interbank market. Loans are generated using interbank borrowing and bank capital, which satisfi es the banks’ capital requirement. With their monopoly power and the capacity to set nominal deposit and loan prime rates, banks optimally choose their portfolio compositions and may endogenously default on interbank borrowing and bank capital.
This framework allows two types of fi nancial frictions to be modelled. First is the channel for corporate balance sheets (Bernanke, Gertler, and Gilchrist 1999)—commonly referred to as the BGG fi nancial accelerator channel—which represents the demand side of credit markets. For lending banks to learn the net worth of the fi rm requesting funds, they must incur auditing costs, which drive up the real return that fi rms pay on their loans. As the net
worth of the fi rm decreases, the amount of auditing required goes up, thereby increasing the risk premium demanded by bank shareholders. Second, the supply side of credit is modelled using bank balance-sheet channels. In this case, the banks’ behaviour directly affects the supply of credit through the following channels: (i) bank capital and price expectations for bank capital; (ii) monopoly power in setting nominal interest rates (subject to nominal rigidities) for deposit and lending, which imply moving spreads over business cycles; (iii) the optimal choice of the banks’ portfolio composition between interbank lending and holdings of risk-free assets; (iv) the optimal choice of the bank leverage ratio, subject to bank capital requirements; (v) the default-risk channel that arises from endogenous strategic or necessary defaults on interbank borrowing and/or bank capital; and (vi) the marginal cost of raising external bank capital. In addition, central banks can inject liquidity into lending banks using open market operations.
such as the recent movements in commodity prices and the adjustment of global imbalances. International linkages are well defi ned by bilateral trade and exchange rates, and a broad range of terms-of-trade and wealth effects are explicitly modelled, as are the prices of commodities and tradable goods. By using BoC-GEM, especially for issues in emerging Asia and the Financial Sector Assessment Program, Bank staff have been able to identify two main areas of the model that need improvement. The fi rst is the fi nancial sector, which can be enhanced by introducing fi nancial
frictions and a banking sector. The goal is to introduce a broader set of fi nancial shocks into the model, and to allow fi nancial accelerators to amplify the effect of all the shocks included in the model. Box 2 describes the new fi nancial sector in BoC-GEM in more detail.
The second improvement is the introduction of a semi-fi nished goods sector in the model. This will result in a more realistic emerging Asia bloc because a signifi cant share of the trade of many of these countries consists of importing parts and exporting assembled goods.
Bayoumi, T. A., D. Laxton, and P. A. Pesenti. 2004. “Benefi ts and Spillovers of Greater Competition in Europe: A Macroeconomic Assessment.” NBER Working Paper No. 10416.
Bernanke, B. S., M. Gertler, and S. Gilchrist. 1999. “The Financial Accelerator in a Quantitative Business Cycle Framework.” In Handbook of Macroeconomics, Vol. 1C, edited by J. B. Taylor and M. Woodford, 1341–93. Amsterdam: North-Holland.
Brayton, F., E. Mauskopf, D. Reifschneider, P. Tinsley, and J. Williams. 1997. “The Role of Expectations in the FRB/US Macroeconomic Model.” Federal Reserve Bulletin 83 (4): 227–45.
Coenen, G., P. McAdam, and R. Straub. 2008. “Tax Reform and Labour-Market Performance in the Euro Area: A Simulation-Based Analysis Using the New Area-Wide Model.” Journal of Economic Dynamics and Control 32 (8): 2543–83.
Coletti, D., R. Lalonde, M. Misina, D. Muir, P. St-Amant, and D. Tessier. 2008. “Bank of Canada Participa-tion in the 2007 FSAP Macro Stress-Testing Exercise.” Bank of Canada Financial System Review (June): 51-59.
Coletti, D., R. Lalonde, and D. Muir. 2008. “Infl ation Targeting and Price-Level-Path Targeting in the GEM: Some Open Economy Considerations.” IMF Staff Papers: 55 (2): 326–38.
De Walque, G., F. Smets, and R. Wouters. 2006. “An Estimated Two-Country DSGE Model for the Euro Area and the U.S. Economy.” Paper presented at the Bank of Canada Workshop on Commodity Price Issues, Ottawa, Canada, 10–11 July.
Dib, A. 2009. “Credit and Interbank Markets in a New Keynesian Model.” Bank of Canada Working Paper (forthcoming).
Elekdag, S., R. Lalonde, D. Laxton, D. Muir, and P. A. Pesenti. 2008. “Oil Price Movements and the Global Economy: A Model-Based Assessment.” IMF Staff Papers 55 (2): 297–311.
Erceg, C. J., L. Guerrieri, and C. Gust. 2005a. “Expan-sionary Fiscal Shocks and the Trade Defi cit.” Board of Governors of the Federal Reserve System International Finance Discussion Paper No. 825.
———. 2005b. “SIGMA: A New Open Economy Model for Policy Analysis.” Board of Governors of the Federal Reserve System International Finance Discussion Paper No. 835.
Faruqee, H., D. Laxton, D. Muir, and P. A. Pesenti. 2007. “Smooth Landing or Crash? Model-Based Scenarios of Global Current Account Rebal-ancing.” In G7 Current Account Imbalances: Sustainability and Adjustment, edited by R. H. Clarida, 377–451. NBER Conference Report. Chicago: University of Chicago Press.
Literature Cited
52 BOC-GEM: MODELLING THE WORLD ECONOMY
BANK OF CANADA REVIEW SUMMER 2009
Literature Cited (cont’d)
Lalonde, R., P. Maier, and D. Muir. 2009. “Emerging Asia’s Impact on Food and Oil Prices: A Model-Based Analysis.” Bank of Canada Discussion Paper 2009-3.
Lalonde, R. and D. Muir. 2007. The Bank of Canada’s Version of the Global Economy Model (BoC-GEM). Technical Report No. 98. Ottawa: Bank of Canada.
Laxton, D. and P. Pesenti. 2003. “Monetary Rules for Small, Open, Emerging Economies.” Journal of Monetary Economics 50 (5): 1109–46.
Maier, P. 2008. “A Wave of Protectionism? An Analysis of Economic and Political Considerations,” Bank of Canada Working Paper 2008-2.
Murchison, S. and A. Rennison. 2006. ToTEM: The Bank of Canada’s New Quarterly Projection Model. Technical Report No. 97. Ottawa: Bank of Canada.
Perrier, P. 2005. “La fonction de production et les données canadiennes.” Bank of Canada Working Paper 2005-20.
Ferguson, R. W. Jr. 2005. “U.S. Current Account Defi cit: Causes and Consequences.” Remarks to the Economics Club of the University of North Carolina at Chapel Hill, Chapel Hill, North Carolina, 20 April.
Flood, K. 2008. “The Global Effects of U.S. Fiscal Policy.” Bank of Canada Discussion Paper 2008-8.
Gosselin, M.-A. and R. Lalonde. 2005. MUSE: The Bank of Canada’s New Projection Model of the U.S. Economy. Technical Report No. 96. Ottawa: Bank of Canada.
Juillard, M., P. Karam, D. Laxton, and P. A. Pesenti. 2006. “Welfare-Based Monetary Policy Rules in an Estimated DSGE Model of the US Economy.” ECB Working Paper No. 613.
Lalonde, R., C. de Resende, and S. Snudden. 2009. “Globally Coordinated versus Domestic Fiscal Stimulus: Simulation Based on BoC-GEM,”Bank of Canada Working Paper (forthcoming).
53 BOC-GEM: MODELLING THE WORLD ECONOMY
BANK OF CANADA REVIEW SUMMER 2009
* Only available on the Bank’s website.** Each Can$25 plus shipping costs. Sample pages are available on the Bank’s website.
Monetary Policy Report (quarterly: January, April, July, and October)
Financial System Review (June/December)
Bank of Canada Review (quarterly; see inside cover for subscription information)
Business Outlook Survey (quarterly: January, April, July, and October)*
Senior Loan Offi cer Survey (quarterly: January, April, July, and October)*
Speeches and Statements by the Governor
Bank of Canada Banking and Financial Statistics (monthly)*
Weekly Financial Statistics (published each Friday)*
Renewal of the Infl ation-Control Target: Background Information
Annual Report
A History of the Canadian DollarJames Powell (available at Can$8 plus GST and PST, where applicable)* (2005)
Souvenir Books
Beads to Bytes: Canada’s National Currency Collection**This volume explores the role of money in society through the lens of the National Currency Collection, an extraordinary repository of coins, bank notes, and related paraphernalia from around the world. (2008)
More Than Money: Architecture and Art at the Bank of Canada**A tour of the head offi ce complex, highlighting the architecture, interior design, and decoration, as well as elements of restoration and preservation. It also features pieces from the Bank’s art collection. (2007)
The Art and Design of Canadian Bank Notes**A journey behind the scenes to explore the demanding world of bank note design. (2006)
The Bank of Canada: An Illustrated History**To celebrate the Bank’s 70th anniversary, this book depicts the history of the Bank from 1935. (2005)
The Transmission of Monetary Policy in Canada (1996, Can$20 plus GST and PST, where applicable)Available at <http://www.bankofcanada.ca/en/res/other/herm-98.html>.
The Thiessen Lectures (January 2001) Lectures delivered by Gordon G. Thiessen, Governor of the Bank of Canada 1994 to 2001
Bilingualism at the Bank of Canada (published annually)
Planning an Evolution: The Story of the Canadian Payments Association, 1980–2002James F. Dingle (June 2003)
Bank of Canada Publications Catalogue, 2008A collection of short abstracts of articles and research papers published in 2008. Includes a listing of work by Bank economists published in outside journals and proceedings.
Conference ProceedingsConference volumes published up to and including April 2005 are available on the Bank’s website. Print copies can be purchased for Can$15 plus GST and PST, where applicable. Papers and proceedings from Bank of Canada conferences, seminars, and workshops held after April 2005 are now published exclusively on the Bank’s website.
Technical Reports, Working Papers, and Discussion PapersTechnical Reports, Working Papers, and Discussion Papers are usually published in the original language only, with an abstract in both offi cial languages. Single copies may be obtained without charge. Technical Reports dating back to 1994 are available on the Bank’s website, as are Working Papers back to 1994. Discussion papers deal with fi nished work on technical issues related to the functions and policy-making of the Bank. They are of interest to specialists and other central bankers. Discussion papers for 2007–2009 are available on the Bank’s website.
For further information, including subscription prices, contact:
Publications DistributionCommunications DepartmentBank of CanadaOttawa, ONCanada K1A 0G9Telephone: 613 782-8248Toll free in North America: 1 877 782-8248Email address: [email protected]
Bank of Canada PublicationsUnless noted otherwise, all publications are available in print and on the Bank’s website: <http://www.bankofcanada.ca>.
55 BANK OF CANADA PUBLICATIONS
BANK OF CANADA REVIEW SUMMER 2009